Embed Size (px)
Citation preview
Continuing Education Credit Information
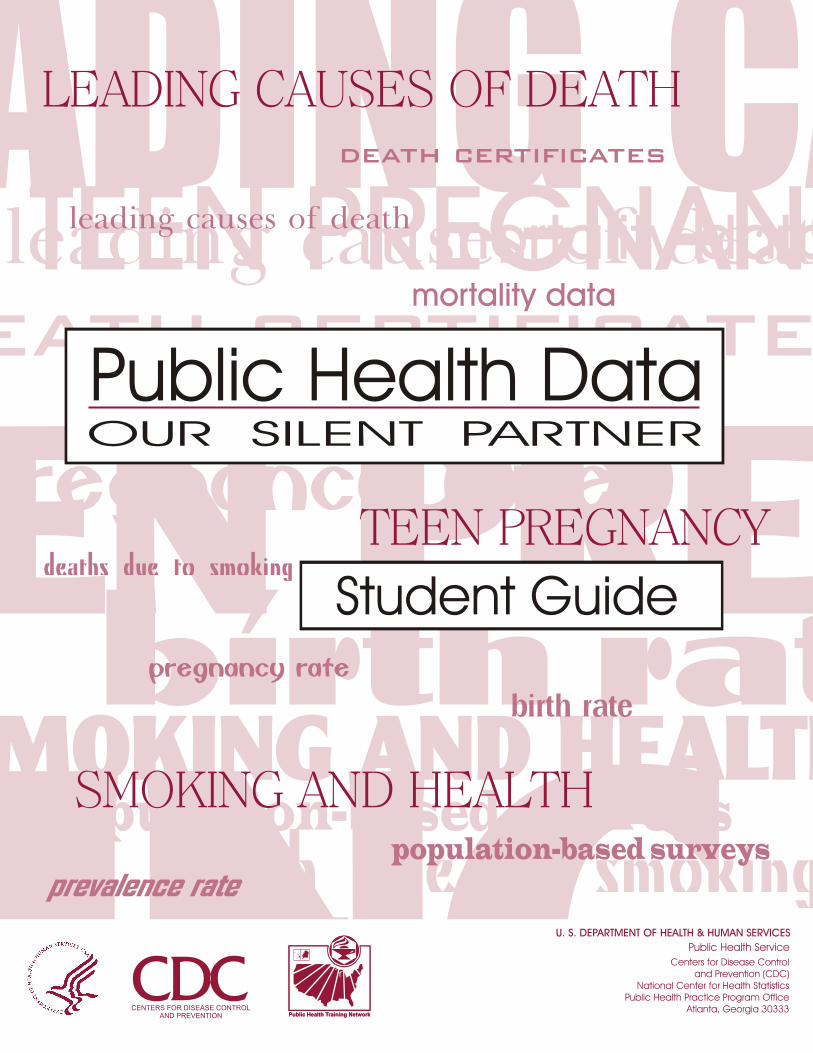
Public Health Data: Our Silent Partner, course number VC0024, is accredited as aself-study course.
Continuing Medical Education (CME)The Centers for Disease Control and Prevention (CDC) is accredited by the AccreditationCouncil for Continuing Medical Education (ACCME) to provide continuing medical educationfor physicians.
CDC designates this educational activity for a maximum of 7 hours in category 1 credit towardsthe AMA Physician’s Recognition Award. Each physician should claim only those hours ofcredit that he/she actually spent in the educational activity.
Continuing Nursing Education (CNE) A maximum of 8.4 contact hours is provided by CDC for this activity. CDC is accredited as aprovider of continuing education in nursing by the American Nurses Credentialing Center’sCommission on Accreditation.
Continuing Education Unit (CEU)CDC is approved as an Authorized Provider of continuing education and training programs bythe International Association for Continuing Education and Training and awards .7 ContinuingEducation Units (CEUs).
Table of Contents
How to Use This Course . . . . . . . . . . . . . . . . . . . . . . . . . . . . . . . . . . . . . . . . . 1
How to Obtain Continuing Education Credit . . . . . . . . . . . . . . . . . . . . . . . . 3
Course Evaluation and Exam . . . . . . . . . . . . . . . . . . . . . . . . . . . . . . . . . . . . . 5
Appendix A . . . . . . . . . . . . . . . . . . . . . . . . . . . . . . . . . . . . . . . . . . . . . . . . . . . i
Answer Key to Exercises in Module 1 . . . . . . . . . . . . . . . . . . . . . . . . . ii
Answer Key to Exercises in Module 2 . . . . . . . . . . . . . . . . . . . . . . . . ix
Answer Key to Exercises in Module 3 . . . . . . . . . . . . . . . . . . . . . . . . xiv
Appendix B: Answers to Exam Questions . . . . . . . . . . . . . . . . . . . . . . . . . xvii

How to Use This Course
October 1999
1
How to Use This Course
Welcome to Public Health Data: Our Silent Partner.This course is designed to help public health professionals use data in their jobs. This course canbe used as a facilitator-guided course or as a self-study course. Either way, make sure that youhave a complete set of course materials. Facilitators should have and review the materials in a, b,c, and d below. Self-study students need the materials in a, b, and c.
a. A copy of the videotape b. A copy of the workbook*, Public Health Data: Our Silent Partner which
includes the following sections: • Introduction• Module 1 – Leading Causes of Death• Module 2 – Teen Pregnancy • Module 3 – Smoking and Health
c. A copy of this Student Guide* which includes the following sections:• Continuing Education Credit Information• How to Use This Course• How to Obtain Continuing Education Credit• Course Evaluation and Exam • Answer Key to Exercises (Appendix A)• Answer to Exam Questions (Appendix B)
d. A copy of the Facilitator Guide* (Only facilitators need this document).
* The printed materials can be downloaded from the National Center for Health Statistics(NCHS) web site: http://www.cdc.gov/nchs/products/training/phd-osp.htm
Facilitator-guided:If you are taking this course in a classroom setting with a facilitator, please bring somepencils and a calculator to class. You may also want some scratch paper. Get a goodnight’s sleep before each session, eat a good breakfast and arrive on time.
Your instructor will provide you with the Workbook and guide you through the course. He or she will also provide you with a copy of the Student Guide.
The Answer Keys for the exercises in modules 1, 2 and 3 are included in Appendix A ofthe Student Guide for your reference. The Course Evaluation and Exam and theAnswers to the Exam Questions are also included in the Student Guide.
You may wish to apply for continuing education credits for this course. If you areinterested in receiving CME, CNE or CEU credits, review the instructions on page 3 ofthe Student Guide, How to Obtain Continuing Education Credit. Once youhave completed the course, follow the directions on those pages to apply for credit.
Student Guide
October 1999
2
Self-study:If you are taking this course on your own (self-study) without a facilitator, please followthe instructions below.
1. Make sure that you have a complete set of course materials (all three modules of theWorkbook, the Student Guide, and the videotape.
2. You will need a videocassette recorder (VCR), some pencils, a calculator, and somescratch paper.
3. Begin the course by placing the videotape in your VCR and watching the introductorysection. Then follow the narrator’s cues. Periodically the narrator will instruct you to goto the Workbook. Similarly, at the end of each section of the Workbook, you will beinstructed to return to the videotape.
4. As you read the Workbook, you may wish to underline sections or make notes in themargin.
5. As you complete each Workbook exercise, compare your answers with those in theAnswer Key (Appendix A). Circle any questions that you answered incorrectly or didnot understand completely. Take the time to review relevant sections of the Workbookto clarify anything that was confusing.
6. When you finish the course, complete the Course Evaluation and Exam.
7. Follow the instructions on how to obtain continuing education credit on the next page andsubmit your completed course exam and evaluation to CDC.
8. If you have any other questions or comments about the content of this course, please sendthem to the address/fax #/e-mail address below.State and Local Support BranchNational Center for Health Statistics6525 Belcrest Rd. Rm 770Hyattsville, MD 20782Fax: (301) 436-3572 E-mail: [email protected]
9. If you have questions on Continuing Education Credit, please contact CDC at: Email: [email protected]
Phone: 800-41-TRAIN
How to Obtain Continuing Education Credit
October 1999
3
How to Obtain Continuing Education Credit
In order to obtain continuing education credit, you will need to officially register for the courseand complete the Course Evaluation and Exam.
How to completeregistration andcourse evaluationand exam
Request a Registration and Evaluation packet for course numberVC0024. You can do this by:• Email: [email protected]. Be sure to provide your name, address,
daytime phone number, and the course number.• Fax: Place a toll-free call from a touch tone phone to 888-CDC-
FAXX (888-232-3299). When prompted, enter documentnumber 564007 and a request form will be sent to your 10-digitfax number. Complete the request form and return it by fax to404-639-0800.
• Phone: Call 800-41-TRAIN, follow the prompts, and state yourrequest for a continuing education packet.
You should receive your CE registration packet in 2 to 3 weeks.
CDC’s on-line registration will be available in the near future. Once theon-line system is active, we will announce its availability on PHTN website: http://www.cdc.gov/phtn. Then you can complete your registrationand evaluation for the course on-line.

Student Guide
October 1999
4
(Blank)
Course Evaluation and Exam
October 1999
5
Course Evaluation and ExamPublic Health Data: Our Silent Partner (VC0024)
Goals:The goal of this course is to improve the ability of public health professionals tounderstand and use data routinely in their jobs.
Objectives:
After completing Module 1, participants will be able to:
• Define public health data.• Explain data typically included on a death certificate, and discuss the value and limitations
of those data.• Explain ICD codes.• Describe the difference between numbers of deaths (counts) and death rates. • Identify and analyze leading causes of death.• Calculate general death rates and specific types of death rates, including age-specific,
cause-specific and sex-specific death rates.• Use rates to examine differences in causes of death by sex.• Analyze changes in rates over time (trends) and changes in underlying causes over time.• Determine effective ways to present data.
After completing Module 2, participants will be able to:
• Describe the respective roles of health departments and the media in providing informationto the public on health-related issues.
• State the definitions of teen pregnancy and live birth, and describe the difference.• Describe the difference between occurrence and residence data.• Identify sources of data on teen pregnancy, and discuss the strengths and limitations of
those data.• Calculate age-specific pregnancy and live birth rates. • Determine percentage changes in rates over time.• Use confidence limits and statistical significance to interpret variability.
After completing Module 3, participants will be able to:
• Describe the Behavioral Risk Factor Surveillance System (BRFSS), including its purposeand potential uses, its methodology, and its strengths and limitations.
• Explain prevalence rates and how they differ from incidence rates.• Compare aggregate smoking prevalence data across years in a region (multi-county) with
the state as a whole.• Define the concepts of relative and attributable risk.• Estimate the number of deaths attributable to smoking in a state and region.
Student Guide
October 1999
6
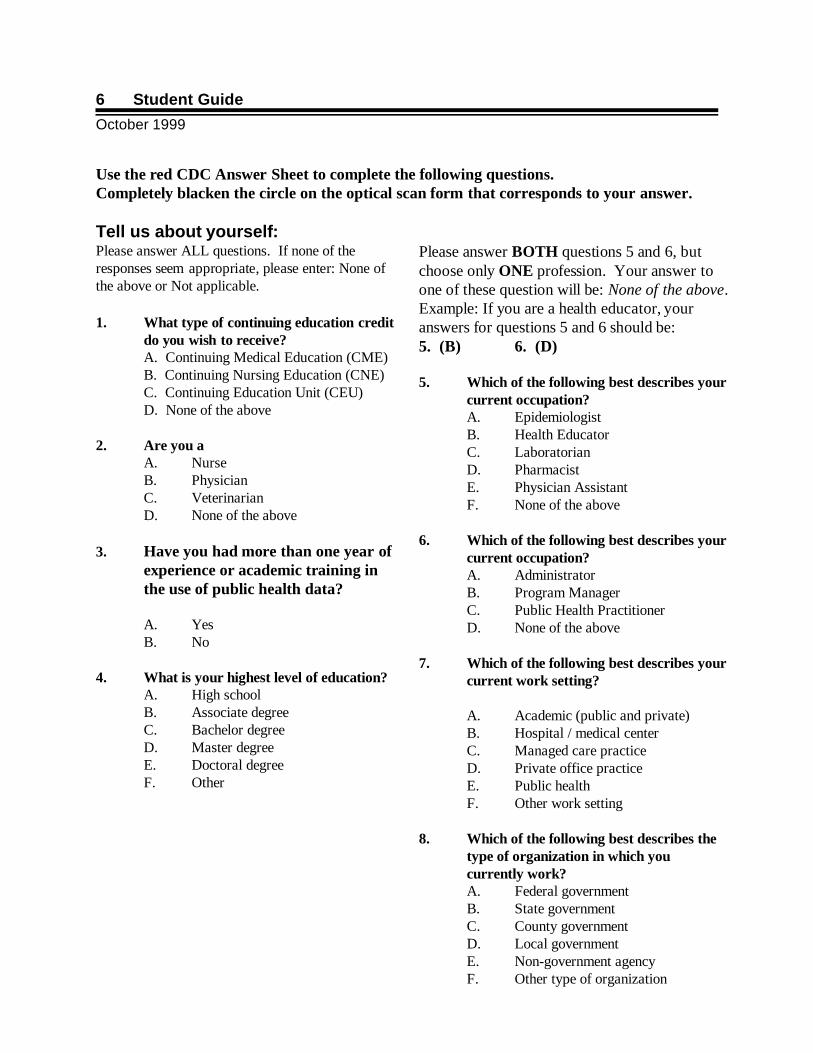
Use the red CDC Answer Sheet to complete the following questions.Completely blacken the circle on the optical scan form that corresponds to your answer.
Tell us about yourself:Please answer ALL questions. If none of theresponses seem appropriate, please enter: None ofthe above or Not applicable.
1. What type of continuing education creditdo you wish to receive?A. Continuing Medical Education (CME)B. Continuing Nursing Education (CNE)C. Continuing Education Unit (CEU)D. None of the above
2. Are you a A. NurseB. PhysicianC. VeterinarianD. None of the above
3. Have you had more than one year ofexperience or academic training inthe use of public health data?
A. YesB. No
4. What is your highest level of education?A. High schoolB. Associate degree C. Bachelor degreeD. Master degreeE. Doctoral degreeF. Other
Please answer BOTH questions 5 and 6, butchoose only ONE profession. Your answer toone of these question will be: None of the above.Example: If you are a health educator, youranswers for questions 5 and 6 should be: 5. (B) 6. (D)
5. Which of the following best describes yourcurrent occupation?A. EpidemiologistB. Health EducatorC. LaboratorianD. PharmacistE. Physician AssistantF. None of the above
6. Which of the following best describes yourcurrent occupation?A. AdministratorB. Program ManagerC. Public Health PractitionerD. None of the above
7. Which of the following best describes yourcurrent work setting?
A. Academic (public and private)B. Hospital / medical centerC. Managed care practiceD. Private office practiceE. Public healthF. Other work setting
8. Which of the following best describes thetype of organization in which youcurrently work?A. Federal governmentB. State governmentC. County governmentD. Local governmentE. Non-government agencyF. Other type of organization
Course Evaluation and Exam
October 1999
7
Tell us about the course:
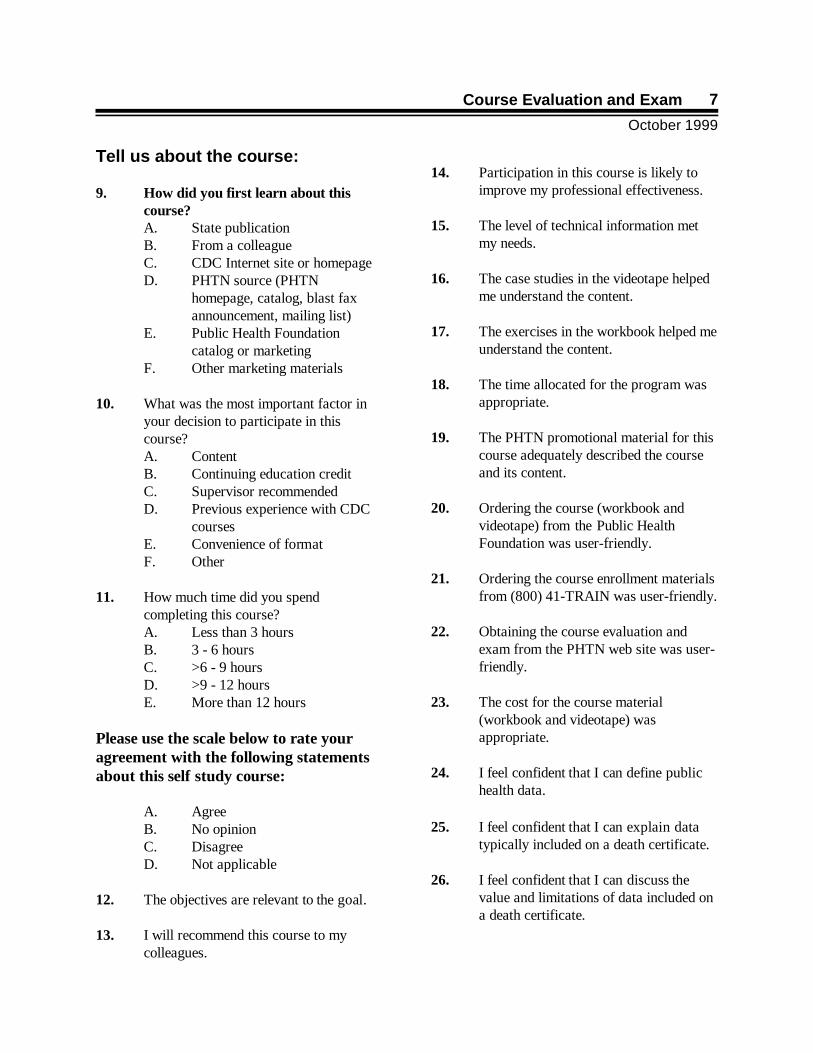
9. How did you first learn about thiscourse?A. State publicationB. From a colleagueC. CDC Internet site or homepageD. PHTN source (PHTN
homepage, catalog, blast faxannouncement, mailing list)
E. Public Health Foundationcatalog or marketing
F. Other marketing materials
10. What was the most important factor inyour decision to participate in thiscourse?A. ContentB. Continuing education creditC. Supervisor recommendedD. Previous experience with CDC
coursesE. Convenience of formatF. Other
11. How much time did you spendcompleting this course?A. Less than 3 hoursB. 3 - 6 hoursC. >6 - 9 hoursD. >9 - 12 hoursE. More than 12 hours
Please use the scale below to rate youragreement with the following statementsabout this self study course:
A. AgreeB. No opinionC. DisagreeD. Not applicable
12. The objectives are relevant to the goal.
13. I will recommend this course to mycolleagues.
14. Participation in this course is likely toimprove my professional effectiveness.
15. The level of technical information metmy needs.
16. The case studies in the videotape helpedme understand the content.
17. The exercises in the workbook helped meunderstand the content.
18. The time allocated for the program wasappropriate.
19. The PHTN promotional material for thiscourse adequately described the courseand its content.
20. Ordering the course (workbook andvideotape) from the Public HealthFoundation was user-friendly.
21. Ordering the course enrollment materialsfrom (800) 41-TRAIN was user-friendly.
22. Obtaining the course evaluation andexam from the PHTN web site was user-friendly.
23. The cost for the course material(workbook and videotape) wasappropriate.
24. I feel confident that I can define publichealth data.
25. I feel confident that I can explain datatypically included on a death certificate.
26. I feel confident that I can discuss thevalue and limitations of data included ona death certificate.
Student Guide
October 1999
8
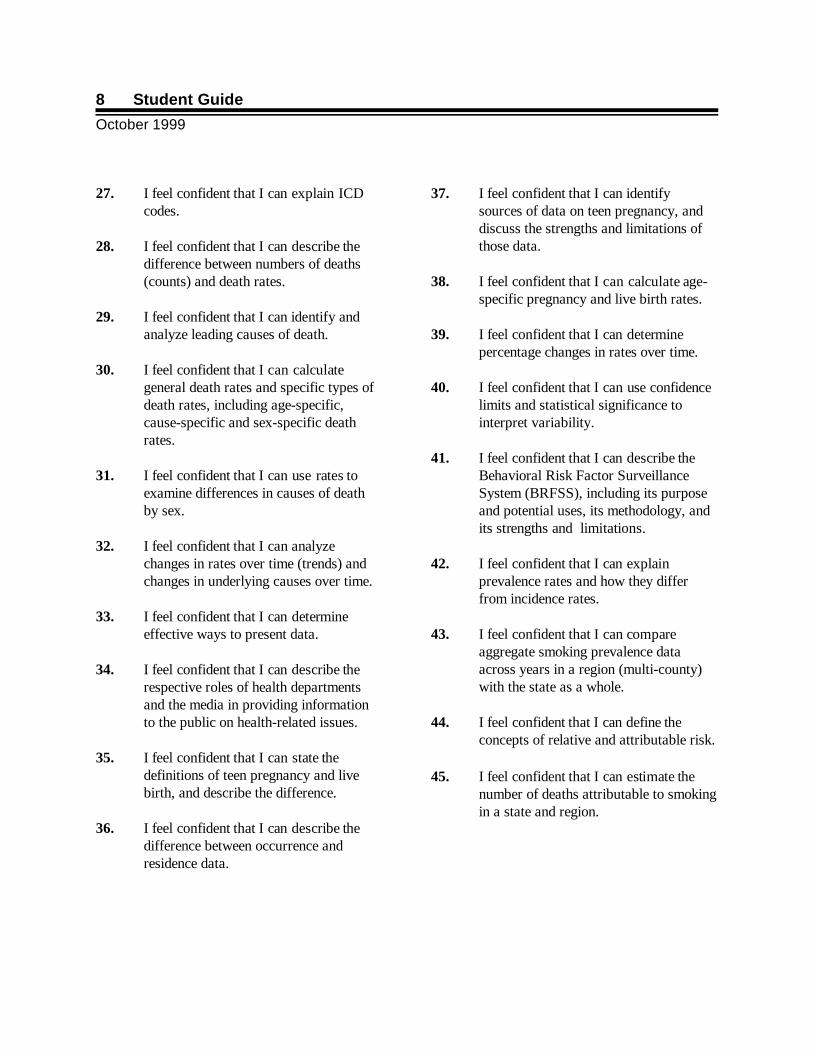
27. I feel confident that I can explain ICDcodes.
28. I feel confident that I can describe thedifference between numbers of deaths(counts) and death rates.
29. I feel confident that I can identify andanalyze leading causes of death.
30. I feel confident that I can calculategeneral death rates and specific types ofdeath rates, including age-specific,cause-specific and sex-specific deathrates.
31. I feel confident that I can use rates toexamine differences in causes of deathby sex.
32. I feel confident that I can analyzechanges in rates over time (trends) andchanges in underlying causes over time.
33. I feel confident that I can determineeffective ways to present data.
34. I feel confident that I can describe therespective roles of health departmentsand the media in providing informationto the public on health-related issues.
35. I feel confident that I can state thedefinitions of teen pregnancy and livebirth, and describe the difference.
36. I feel confident that I can describe thedifference between occurrence andresidence data.
37. I feel confident that I can identifysources of data on teen pregnancy, anddiscuss the strengths and limitations ofthose data.
38. I feel confident that I can calculate age-specific pregnancy and live birth rates.
39. I feel confident that I can determinepercentage changes in rates over time.
40. I feel confident that I can use confidencelimits and statistical significance tointerpret variability.
41. I feel confident that I can describe theBehavioral Risk Factor SurveillanceSystem (BRFSS), including its purposeand potential uses, its methodology, andits strengths and limitations.
42. I feel confident that I can explainprevalence rates and how they differfrom incidence rates.
43. I feel confident that I can compareaggregate smoking prevalence dataacross years in a region (multi-county)with the state as a whole.
44. I feel confident that I can define theconcepts of relative and attributable risk.
45. I feel confident that I can estimate thenumber of deaths attributable to smokingin a state and region.
Course Evaluation and Exam
October 1999
9
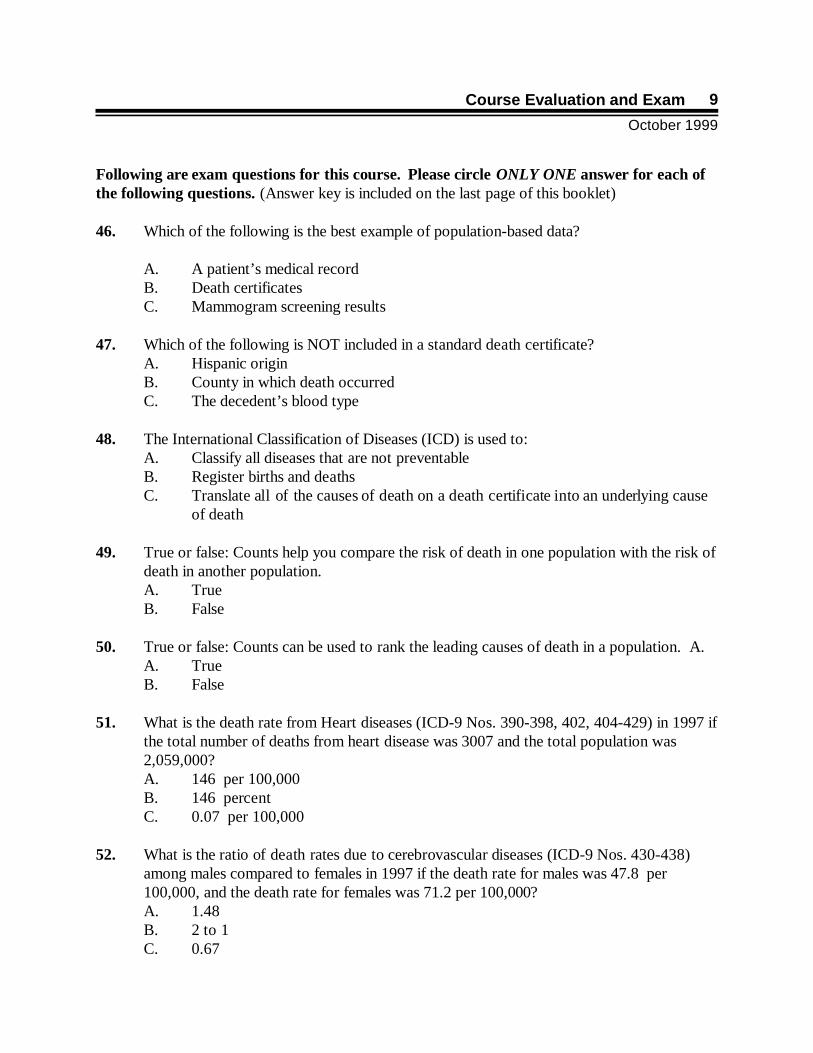
Following are exam questions for this course. Please circle ONLY ONE answer for each ofthe following questions. (Answer key is included on the last page of this booklet)
46. Which of the following is the best example of population-based data?
A. A patient’s medical recordB. Death certificatesC. Mammogram screening results
47. Which of the following is NOT included in a standard death certificate? A. Hispanic origin B. County in which death occurred C. The decedent’s blood type
48. The International Classification of Diseases (ICD) is used to:A. Classify all diseases that are not preventableB. Register births and deathsC. Translate all of the causes of death on a death certificate into an underlying cause
of death
49. True or false: Counts help you compare the risk of death in one population with the risk ofdeath in another population. A. TrueB. False
50. True or false: Counts can be used to rank the leading causes of death in a population. A.A. TrueB. False
51. What is the death rate from Heart diseases (ICD-9 Nos. 390-398, 402, 404-429) in 1997 ifthe total number of deaths from heart disease was 3007 and the total population was2,059,000? A. 146 per 100,000B. 146 percentC. 0.07 per 100,000
52. What is the ratio of death rates due to cerebrovascular diseases (ICD-9 Nos. 430-438)among males compared to females in 1997 if the death rate for males was 47.8 per100,000, and the death rate for females was 71.2 per 100,000?A. 1.48B. 2 to 1C. 0.67
Student Guide
October 1999
10
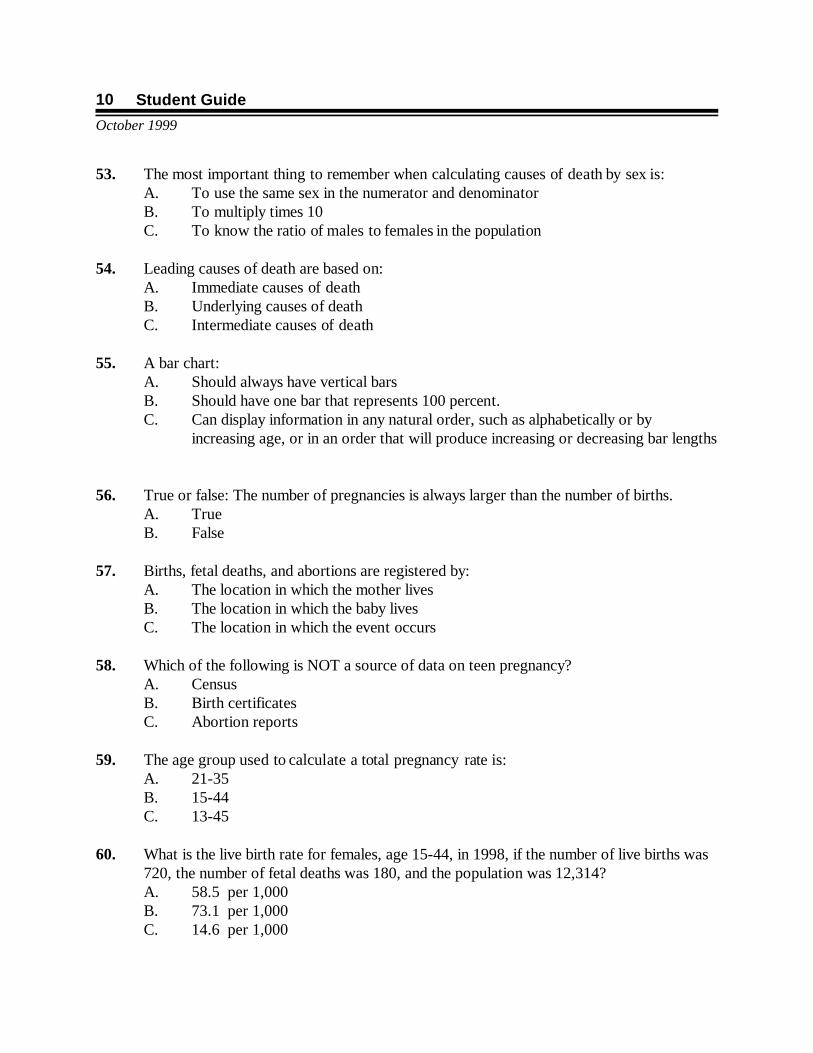
53. The most important thing to remember when calculating causes of death by sex is:A. To use the same sex in the numerator and denominatorB. To multiply times 10C. To know the ratio of males to females in the population
54. Leading causes of death are based on:A. Immediate causes of deathB. Underlying causes of deathC. Intermediate causes of death
55. A bar chart:A. Should always have vertical barsB. Should have one bar that represents 100 percent.C. Can display information in any natural order, such as alphabetically or by
increasing age, or in an order that will produce increasing or decreasing bar lengths
56. True or false: The number of pregnancies is always larger than the number of births. A. TrueB. False
57. Births, fetal deaths, and abortions are registered by:A. The location in which the mother livesB. The location in which the baby livesC. The location in which the event occurs
58. Which of the following is NOT a source of data on teen pregnancy? A. Census B. Birth certificatesC. Abortion reports
59. The age group used to calculate a total pregnancy rate is:A. 21-35B. 15-44C. 13-45
60. What is the live birth rate for females, age 15-44, in 1998, if the number of live births was720, the number of fetal deaths was 180, and the population was 12,314?A. 58.5 per 1,000B. 73.1 per 1,000C. 14.6 per 1,000
Course Evaluation and Exam
October 1999
11
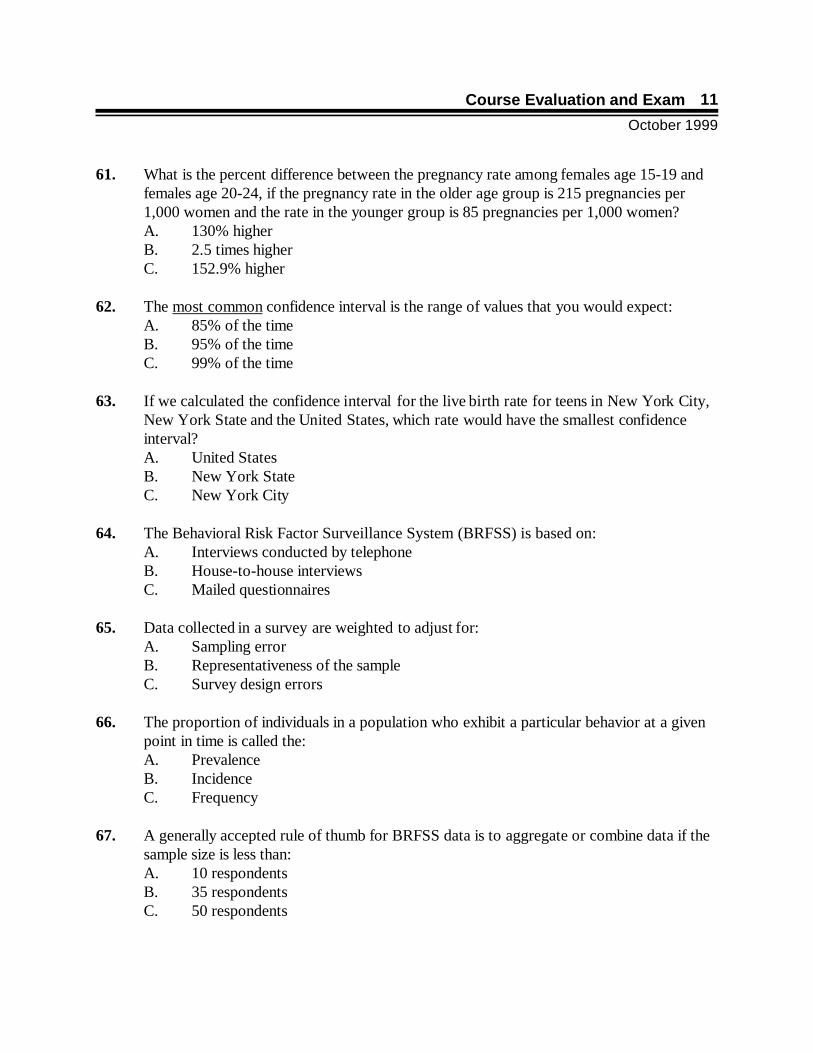
61. What is the percent difference between the pregnancy rate among females age 15-19 andfemales age 20-24, if the pregnancy rate in the older age group is 215 pregnancies per1,000 women and the rate in the younger group is 85 pregnancies per 1,000 women?A. 130% higher B. 2.5 times higher C. 152.9% higher
62. The most common confidence interval is the range of values that you would expect:A. 85% of the timeB. 95% of the timeC. 99% of the time
63. If we calculated the confidence interval for the live birth rate for teens in New York City,New York State and the United States, which rate would have the smallest confidenceinterval?A. United StatesB. New York StateC. New York City
64. The Behavioral Risk Factor Surveillance System (BRFSS) is based on: A. Interviews conducted by telephoneB. House-to-house interviewsC. Mailed questionnaires
65. Data collected in a survey are weighted to adjust for:A. Sampling errorB. Representativeness of the sampleC. Survey design errors
66. The proportion of individuals in a population who exhibit a particular behavior at a givenpoint in time is called the:A. PrevalenceB. IncidenceC. Frequency
67. A generally accepted rule of thumb for BRFSS data is to aggregate or combine data if thesample size is less than: A. 10 respondentsB. 35 respondentsC. 50 respondents
Student Guide
October 1999
12
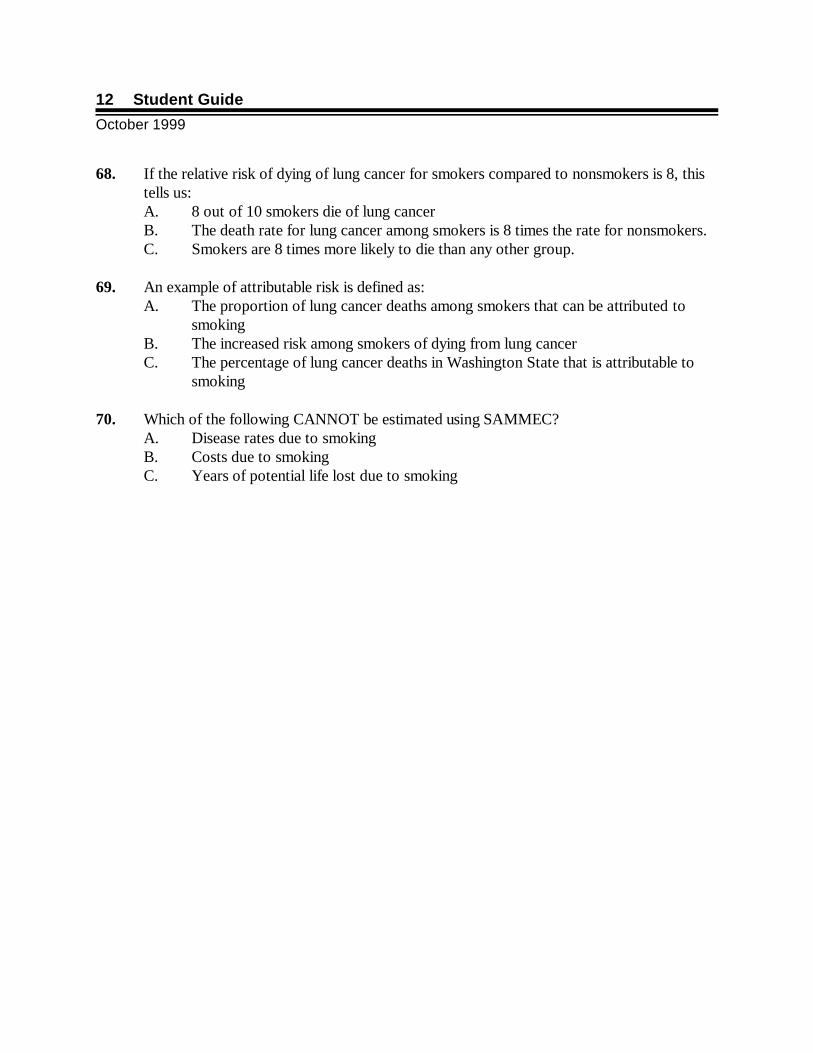
68. If the relative risk of dying of lung cancer for smokers compared to nonsmokers is 8, thistells us:A. 8 out of 10 smokers die of lung cancerB. The death rate for lung cancer among smokers is 8 times the rate for nonsmokers.C. Smokers are 8 times more likely to die than any other group.
69. An example of attributable risk is defined as:A. The proportion of lung cancer deaths among smokers that can be attributed to
smoking B. The increased risk among smokers of dying from lung cancer C. The percentage of lung cancer deaths in Washington State that is attributable to
smoking
70. Which of the following CANNOT be estimated using SAMMEC?A. Disease rates due to smoking B. Costs due to smoking C. Years of potential life lost due to smoking
i
Appendix A
Answer Key to Exercises in Module 1 . . . . . . . . . . . . . . . . . . . . . . . . ii
Answer Key to Exercises in Module 2 . . . . . . . . . . . . . . . . . . . . . . . . ix
Answer Key to Exercises in Module 3 . . . . . . . . . . . . . . . . . . . . . . . xiv
Student Guide
October 1999
ii
MODULE I. LEADING CAUSES OF DEATH
Exercise 1: Information from Death Certificates
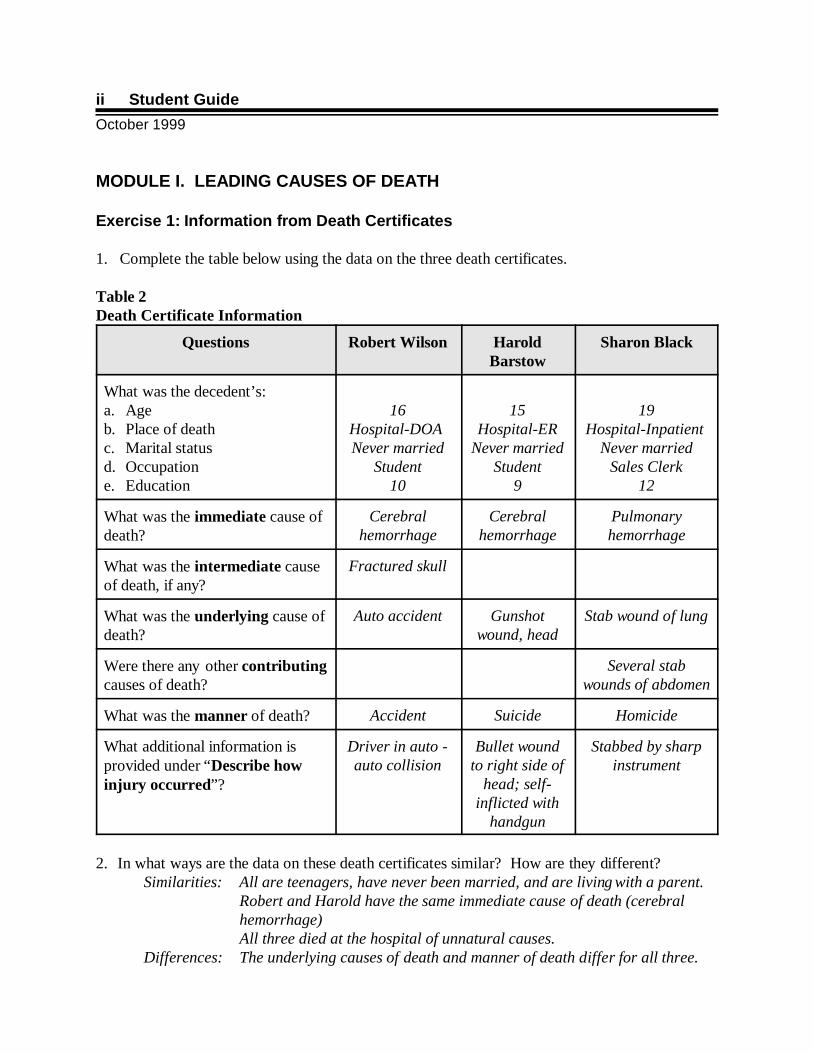
1. Complete the table below using the data on the three death certificates.
Table 2Death Certificate Information
Questions Robert Wilson HaroldBarstow
Sharon Black
What was the decedent’s:a. Age b. Place of deathc. Marital statusd. Occupatione. Education
16Hospital-DOA Never married
Student10
15Hospital-ER
Never marriedStudent
9
19Hospital-Inpatient
Never marriedSales Clerk
12
What was the immediate cause ofdeath?
Cerebralhemorrhage
Cerebralhemorrhage
Pulmonaryhemorrhage
What was the intermediate causeof death, if any?
Fractured skull
What was the underlying cause ofdeath?
Auto accident Gunshotwound, head
Stab wound of lung
Were there any other contributingcauses of death?
Several stabwounds of abdomen
What was the manner of death? Accident Suicide Homicide
What additional information isprovided under “Describe howinjury occurred”?
Driver in auto -auto collision
Bullet woundto right side of
head; self-inflicted with
handgun
Stabbed by sharpinstrument
2. In what ways are the data on these death certificates similar? How are they different? Similarities: All are teenagers, have never been married, and are living with a parent.
Robert and Harold have the same immediate cause of death (cerebralhemorrhage)All three died at the hospital of unnatural causes.
Differences: The underlying causes of death and manner of death differ for all three.
Answer Key to Exercises in Module 1
October 1999
iii
3. How does this death certificate form differ from the form used in your state or locality? The answer will vary, depending on course location.
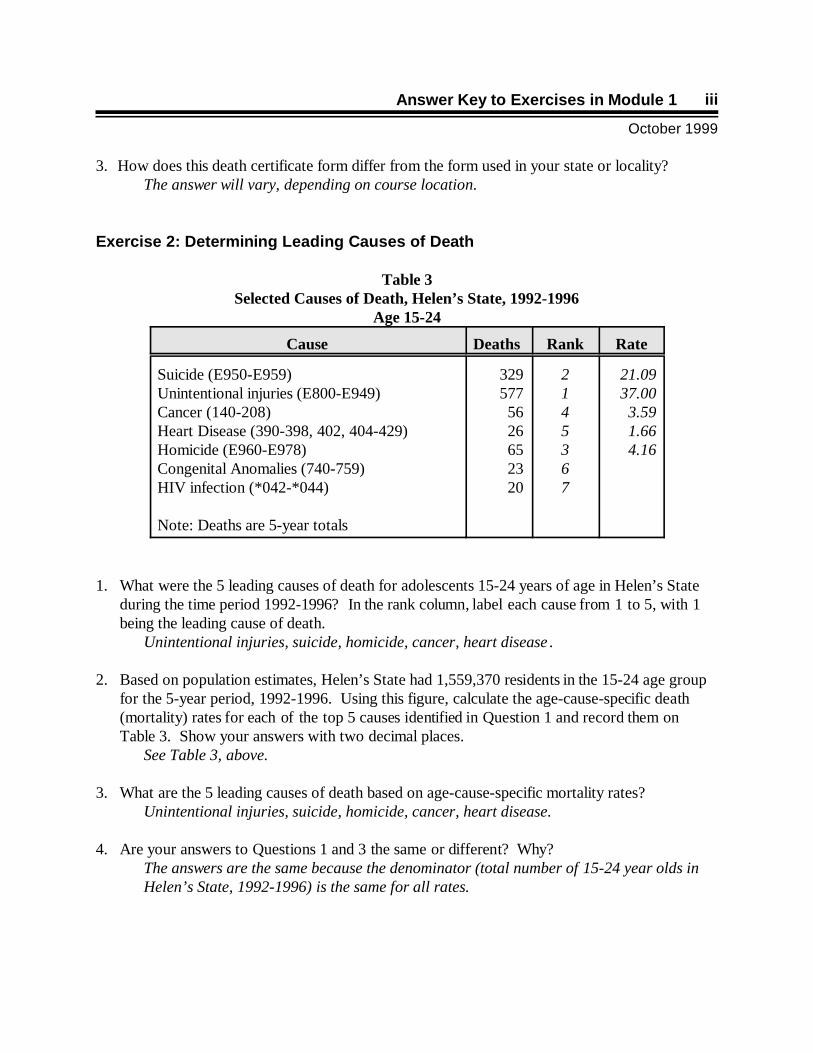
Exercise 2: Determining Leading Causes of Death
Table 3Selected Causes of Death, Helen’s State, 1992-1996
Age 15-24
Cause Deaths Rank Rate
Suicide (E950-E959)Unintentional injuries (E800-E949)Cancer (140-208)Heart Disease (390-398, 402, 404-429)Homicide (E960-E978)Congenital Anomalies (740-759)HIV infection (*042-*044)
Note: Deaths are 5-year totals
3295775626652320
2145367
21.0937.003.591.664.16
1. What were the 5 leading causes of death for adolescents 15-24 years of age in Helen’s Stateduring the time period 1992-1996? In the rank column, label each cause from 1 to 5, with 1being the leading cause of death.
Unintentional injuries, suicide, homicide, cancer, heart disease .
2. Based on population estimates, Helen’s State had 1,559,370 residents in the 15-24 age groupfor the 5-year period, 1992-1996. Using this figure, calculate the age-cause-specific death(mortality) rates for each of the top 5 causes identified in Question 1 and record them onTable 3. Show your answers with two decimal places.
See Table 3, above.
3. What are the 5 leading causes of death based on age-cause-specific mortality rates?Unintentional injuries, suicide, homicide, cancer, heart disease.
4. Are your answers to Questions 1 and 3 the same or different? Why?The answers are the same because the denominator (total number of 15-24 year olds inHelen’s State, 1992-1996) is the same for all rates.
Student Guide
October 1999
iv
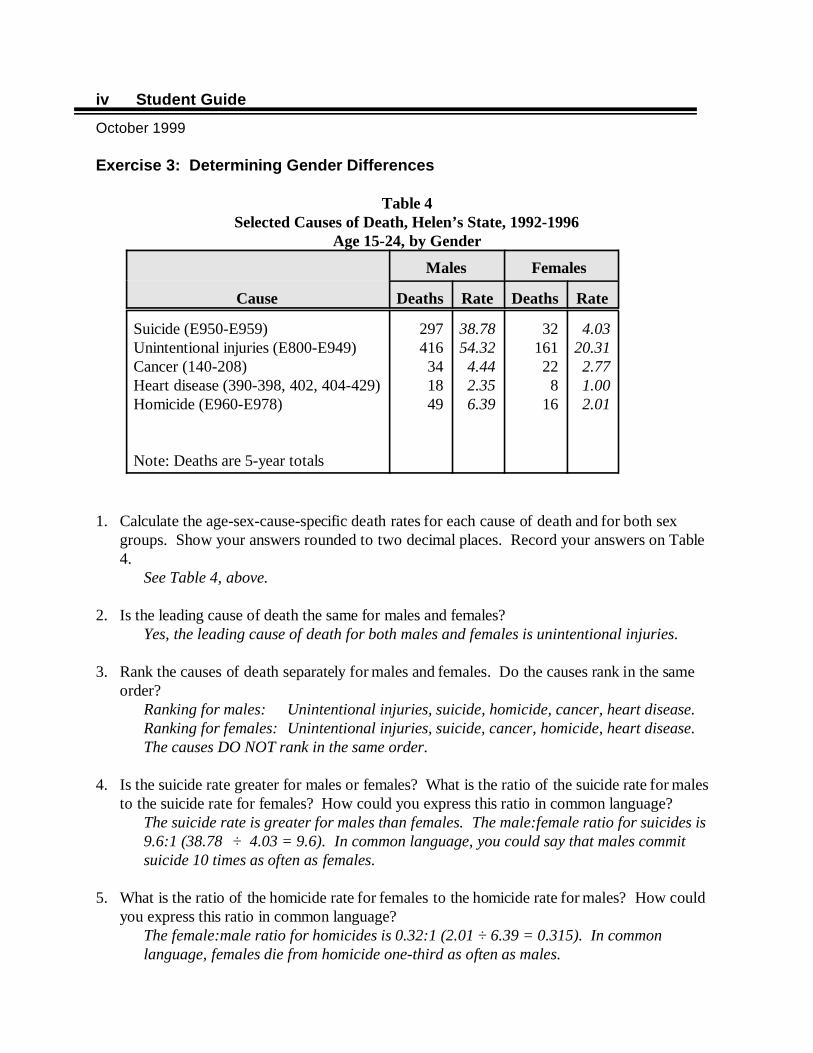
Exercise 3: Determining Gender Differences
Table 4Selected Causes of Death, Helen’s State, 1992-1996
Age 15-24, by Gender
Males Females
Cause Deaths Rate Deaths Rate
Suicide (E950-E959)Unintentional injuries (E800-E949) Cancer (140-208)Heart disease (390-398, 402, 404-429)Homicide (E960-E978)
Note: Deaths are 5-year totals
297416341849
38.7854.324.442.356.39
32161228
16
4.0320.312.771.002.01
1. Calculate the age-sex-cause-specific death rates for each cause of death and for both sexgroups. Show your answers rounded to two decimal places. Record your answers on Table4.
See Table 4, above.
2. Is the leading cause of death the same for males and females? Yes, the leading cause of death for both males and females is unintentional injuries.
3. Rank the causes of death separately for males and females. Do the causes rank in the sameorder?
Ranking for males: Unintentional injuries, suicide, homicide, cancer, heart disease.Ranking for females: Unintentional injuries, suicide, cancer, homicide, heart disease.The causes DO NOT rank in the same order.
4. Is the suicide rate greater for males or females? What is the ratio of the suicide rate for malesto the suicide rate for females? How could you express this ratio in common language?
The suicide rate is greater for males than females. The male:female ratio for suicides is9.6:1 (38.78 ÷ 4.03 = 9.6). In common language, you could say that males commitsuicide 10 times as often as females.
5. What is the ratio of the homicide rate for females to the homicide rate for males? How couldyou express this ratio in common language?
The female:male ratio for homicides is 0.32:1 (2.01 ÷ 6.39 = 0.315). In commonlanguage, females die from homicide one-third as often as males.
Answer Key to Exercises in Module 1
October 1999
v
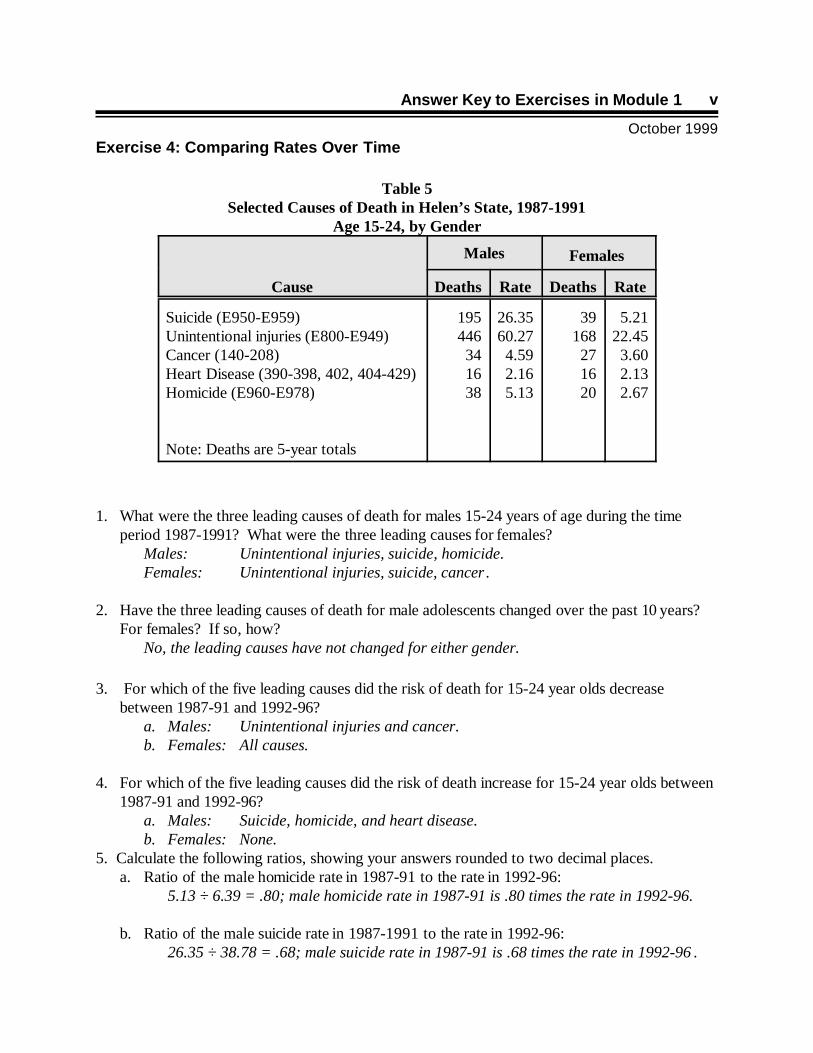
Exercise 4: Comparing Rates Over Time
Table 5Selected Causes of Death in Helen’s State, 1987-1991
Age 15-24, by Gender
Males Females
Cause Deaths Rate Deaths Rate
Suicide (E950-E959)Unintentional injuries (E800-E949)Cancer (140-208)Heart Disease (390-398, 402, 404-429)Homicide (E960-E978)
Note: Deaths are 5-year totals
195446341638
26.3560.274.592.165.13
39168271620
5.2122.453.602.132.67
1. What were the three leading causes of death for males 15-24 years of age during the timeperiod 1987-1991? What were the three leading causes for females?
Males: Unintentional injuries, suicide, homicide.Females: Unintentional injuries, suicide, cancer .
2. Have the three leading causes of death for male adolescents changed over the past 10 years? For females? If so, how?
No, the leading causes have not changed for either gender.
3. For which of the five leading causes did the risk of death for 15-24 year olds decreasebetween 1987-91 and 1992-96?
a. Males: Unintentional injuries and cancer.b. Females: All causes.
4. For which of the five leading causes did the risk of death increase for 15-24 year olds between1987-91 and 1992-96?
a. Males: Suicide, homicide, and heart disease.b. Females: None.
5. Calculate the following ratios, showing your answers rounded to two decimal places. a. Ratio of the male homicide rate in 1987-91 to the rate in 1992-96:
5.13 ÷ 6.39 = .80; male homicide rate in 1987-91 is .80 times the rate in 1992-96.
b. Ratio of the male suicide rate in 1987-1991 to the rate in 1992-96: 26.35 ÷ 38.78 = .68; male suicide rate in 1987-91 is .68 times the rate in 1992-96 .

Student Guide
October 1999
vi
c. Ratio of male to female homicide rates in 1992-96: 6.39 ÷ 2 = 3.20; in 1992-96, the male homicide rate is 3.18 times the rate forfemales.
d. Ratio of male to female suicide rates in 1992-96: 38.78 ÷ 4.03 = 9.62; in 1992-96, the male suicide rate is 9.62 times the rate for females (or almost 10 times greater).
Answer Key to Exercises in Module 1
October 1999
vii
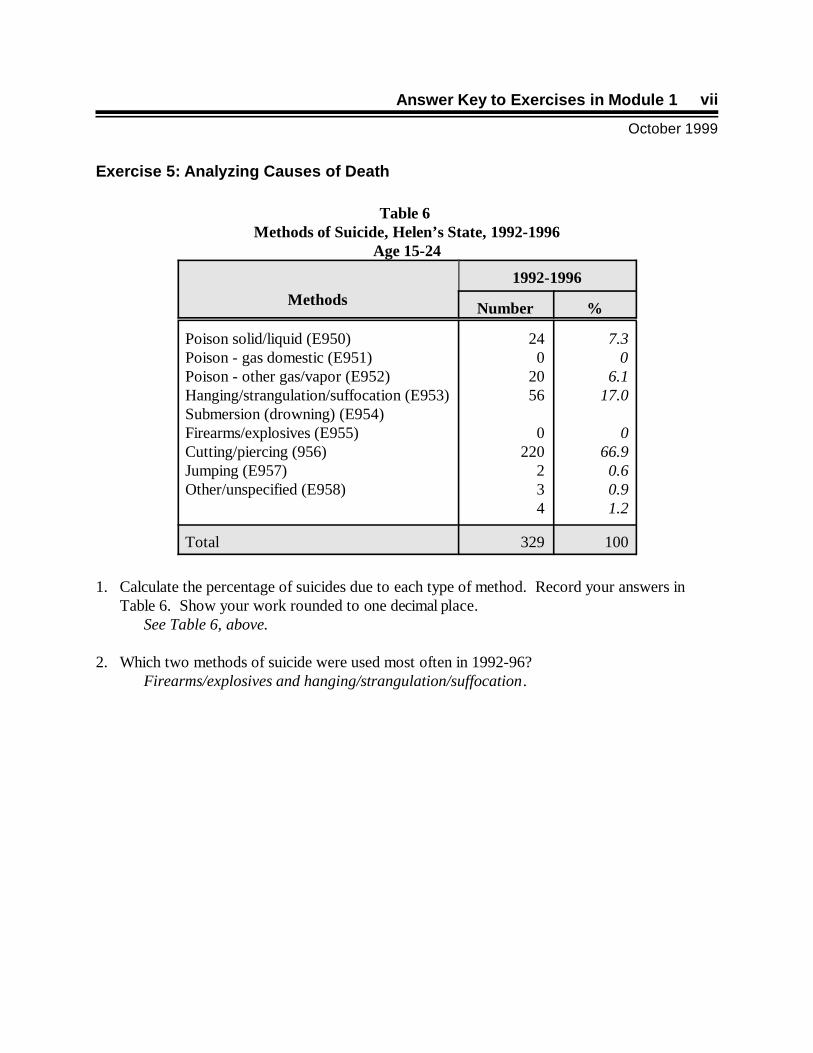
Exercise 5: Analyzing Causes of Death
Table 6 Methods of Suicide, Helen’s State, 1992-1996
Age 15-24
Methods1992-1996
Number %
Poison solid/liquid (E950) Poison - gas domestic (E951)Poison - other gas/vapor (E952) Hanging/strangulation/suffocation (E953)Submersion (drowning) (E954)Firearms/explosives (E955)Cutting/piercing (956)Jumping (E957)Other/unspecified (E958)
240
2056
0220
234
7.3 06.1
17.0 0
66.90.60.91.2
Total 329 100
1. Calculate the percentage of suicides due to each type of method. Record your answers inTable 6. Show your work rounded to one decimal place.
See Table 6, above.
2. Which two methods of suicide were used most often in 1992-96? Firearms/explosives and hanging/strangulation/suffocation.
Student Guide
October 1999
viii
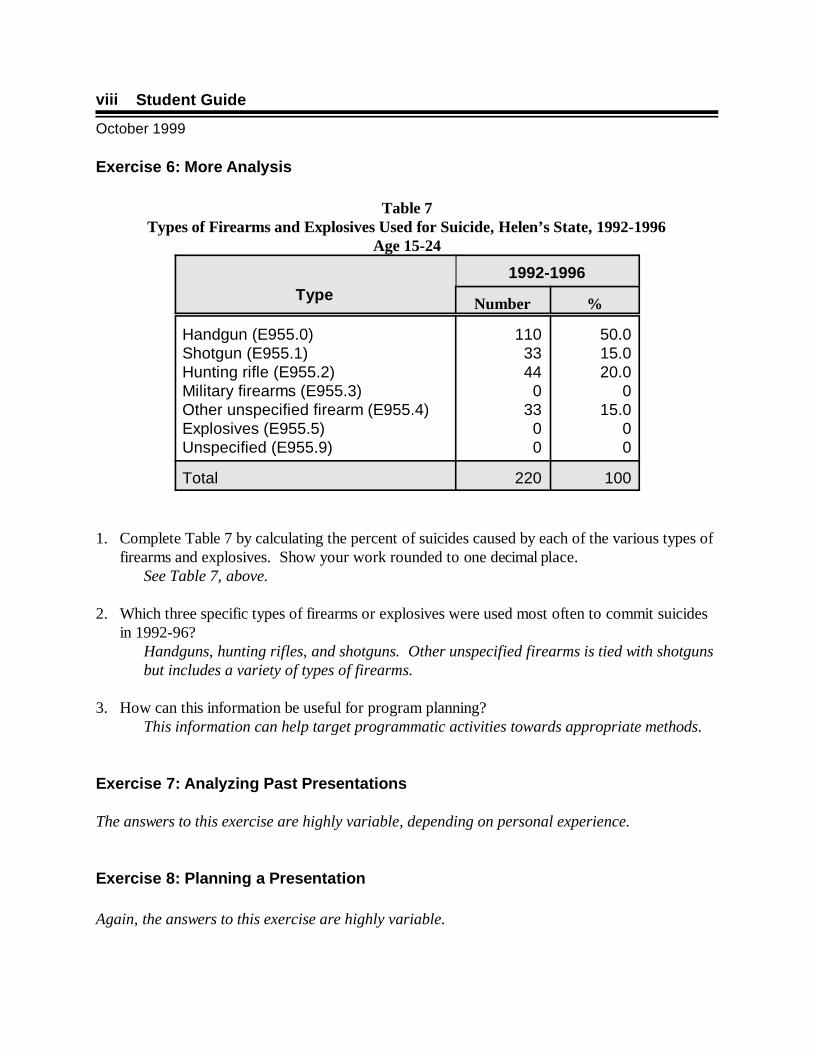
Exercise 6: More Analysis
Table 7Types of Firearms and Explosives Used for Suicide, Helen’s State, 1992-1996
Age 15-24
Type1992-1996
Number %
Handgun (E955.0)Shotgun (E955.1)Hunting rifle (E955.2)Military firearms (E955.3)Other unspecified firearm (E955.4)Explosives (E955.5)Unspecified (E955.9)
1103344
033
00
50.015.020.0
015.0
00
Total 220 100
1. Complete Table 7 by calculating the percent of suicides caused by each of the various types offirearms and explosives. Show your work rounded to one decimal place.
See Table 7, above.
2. Which three specific types of firearms or explosives were used most often to commit suicidesin 1992-96?
Handguns, hunting rifles, and shotguns. Other unspecified firearms is tied with shotgunsbut includes a variety of types of firearms.
3. How can this information be useful for program planning?This information can help target programmatic activities towards appropriate methods.
Exercise 7: Analyzing Past Presentations
The answers to this exercise are highly variable, depending on personal experience.
Exercise 8: Planning a Presentation
Again, the answers to this exercise are highly variable.
Answer Key to Exercises in Module 2
October 1999
ix
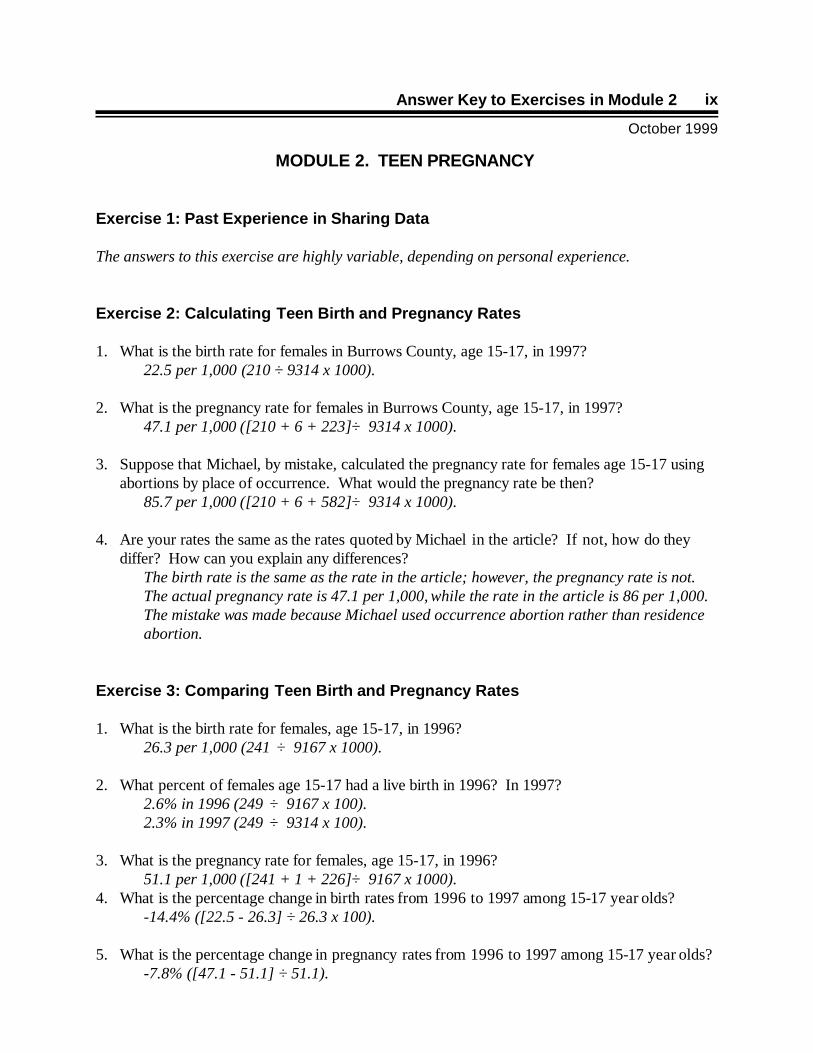
MODULE 2. TEEN PREGNANCY
Exercise 1: Past Experience in Sharing Data
The answers to this exercise are highly variable, depending on personal experience.
Exercise 2: Calculating Teen Birth and Pregnancy Rates
1. What is the birth rate for females in Burrows County, age 15-17, in 1997? 22.5 per 1,000 (210 ÷ 9314 x 1000).
2. What is the pregnancy rate for females in Burrows County, age 15-17, in 1997?47.1 per 1,000 ([210 + 6 + 223] ÷ 9314 x 1000).
3. Suppose that Michael, by mistake, calculated the pregnancy rate for females age 15-17 usingabortions by place of occurrence. What would the pregnancy rate be then?
85.7 per 1,000 ([210 + 6 + 582] ÷ 9314 x 1000).
4. Are your rates the same as the rates quoted by Michael in the article? If not, how do theydiffer? How can you explain any differences?
The birth rate is the same as the rate in the article; however, the pregnancy rate is not. The actual pregnancy rate is 47.1 per 1,000, while the rate in the article is 86 per 1,000. The mistake was made because Michael used occurrence abortion rather than residenceabortion.
Exercise 3: Comparing Teen Birth and Pregnancy Rates
1. What is the birth rate for females, age 15-17, in 1996?26.3 per 1,000 (241 ÷ 9167 x 1000).
2. What percent of females age 15-17 had a live birth in 1996? In 1997?2.6% in 1996 (249 ÷ 9167 x 100).2.3% in 1997 (249 ÷ 9314 x 100).
3. What is the pregnancy rate for females, age 15-17, in 1996?51.1 per 1,000 ([241 + 1 + 226] ÷ 9167 x 1000).
4. What is the percentage change in birth rates from 1996 to 1997 among 15-17 year olds?-14.4% ([22.5 - 26.3] ÷ 26.3 x 100).
5. What is the percentage change in pregnancy rates from 1996 to 1997 among 15-17 year olds?-7.8% ([47.1 - 51.1] ÷ 51.1).
Student Guide
October 1999
x
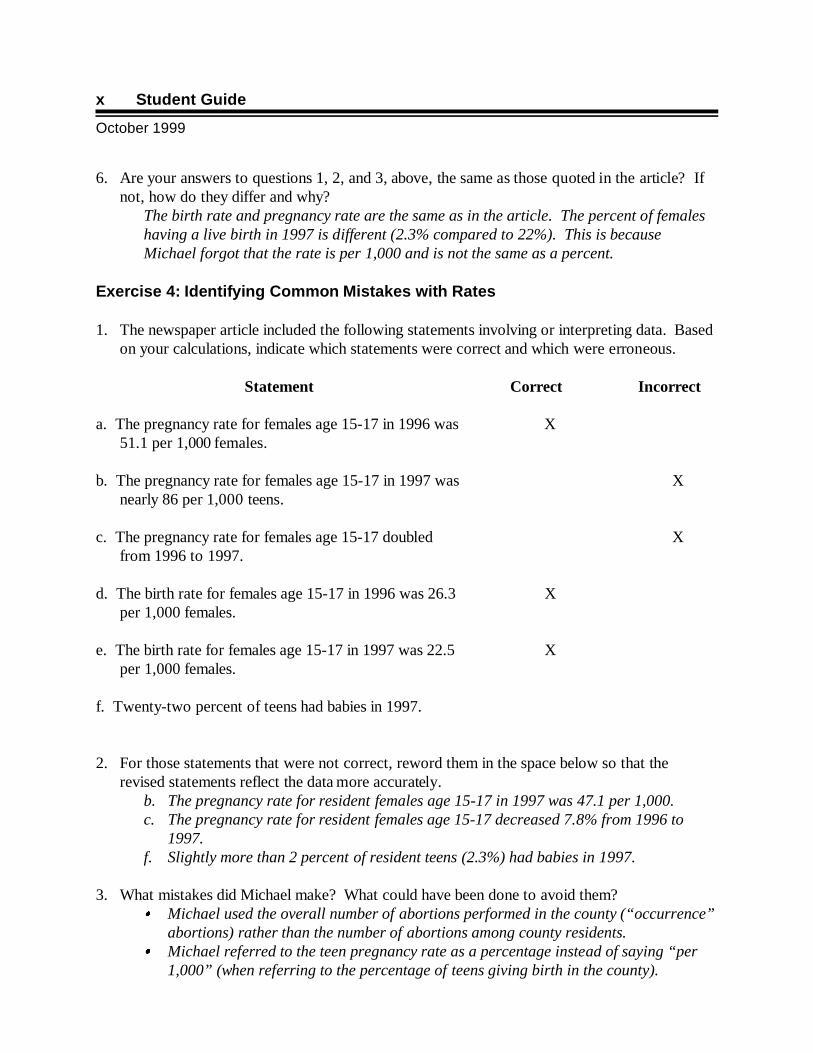
6. Are your answers to questions 1, 2, and 3, above, the same as those quoted in the article? Ifnot, how do they differ and why?
The birth rate and pregnancy rate are the same as in the article. The percent of femaleshaving a live birth in 1997 is different (2.3% compared to 22%). This is becauseMichael forgot that the rate is per 1,000 and is not the same as a percent.
Exercise 4: Identifying Common Mistakes with Rates
1. The newspaper article included the following statements involving or interpreting data. Basedon your calculations, indicate which statements were correct and which were erroneous.
Statement Correct Incorrect
a. The pregnancy rate for females age 15-17 in 1996 was51.1 per 1,000 females.
X
b. The pregnancy rate for females age 15-17 in 1997 wasnearly 86 per 1,000 teens.
X
c. The pregnancy rate for females age 15-17 doubledfrom 1996 to 1997.
X
d. The birth rate for females age 15-17 in 1996 was 26.3per 1,000 females.
X
e. The birth rate for females age 15-17 in 1997 was 22.5per 1,000 females.
X
f. Twenty-two percent of teens had babies in 1997.
2. For those statements that were not correct, reword them in the space below so that therevised statements reflect the data more accurately.
b. The pregnancy rate for resident females age 15-17 in 1997 was 47.1 per 1,000.c. The pregnancy rate for resident females age 15-17 decreased 7.8% from 1996 to
1997.f. Slightly more than 2 percent of resident teens (2.3%) had babies in 1997.
3. What mistakes did Michael make? What could have been done to avoid them? � Michael used the overall number of abortions performed in the county (“occurrence”
abortions) rather than the number of abortions among county residents.� Michael referred to the teen pregnancy rate as a percentage instead of saying “per
1,000” (when referring to the percentage of teens giving birth in the county).
Answer Key to Exercises in Module 2
October 1999
xi
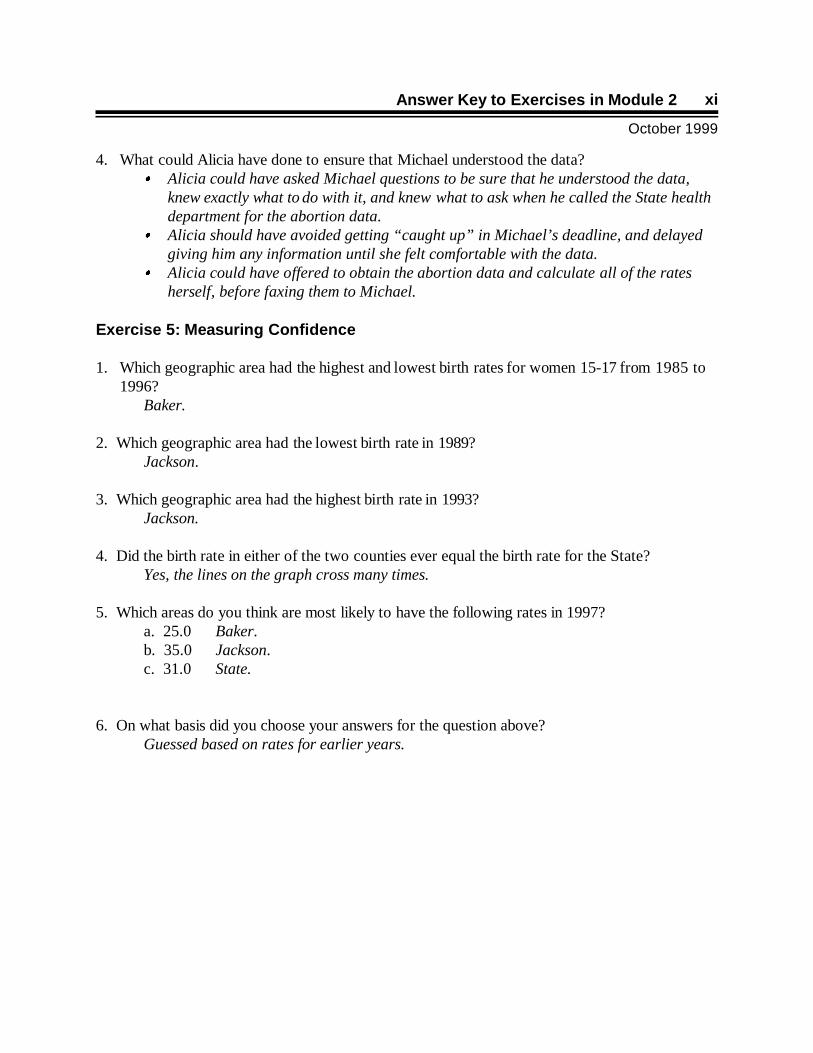
4. What could Alicia have done to ensure that Michael understood the data? � Alicia could have asked Michael questions to be sure that he understood the data,
knew exactly what to do with it, and knew what to ask when he called the State healthdepartment for the abortion data.
� Alicia should have avoided getting “caught up” in Michael’s deadline, and delayedgiving him any information until she felt comfortable with the data.
� Alicia could have offered to obtain the abortion data and calculate all of the ratesherself, before faxing them to Michael.
Exercise 5: Measuring Confidence
1. Which geographic area had the highest and lowest birth rates for women 15-17 from 1985 to1996?
Baker.
2. Which geographic area had the lowest birth rate in 1989?Jackson.
3. Which geographic area had the highest birth rate in 1993?Jackson.
4. Did the birth rate in either of the two counties ever equal the birth rate for the State?Yes, the lines on the graph cross many times.
5. Which areas do you think are most likely to have the following rates in 1997?a. 25.0 Baker.b. 35.0 Jackson.c. 31.0 State.
6. On what basis did you choose your answers for the question above?Guessed based on rates for earlier years.
Student Guide
October 1999
xii
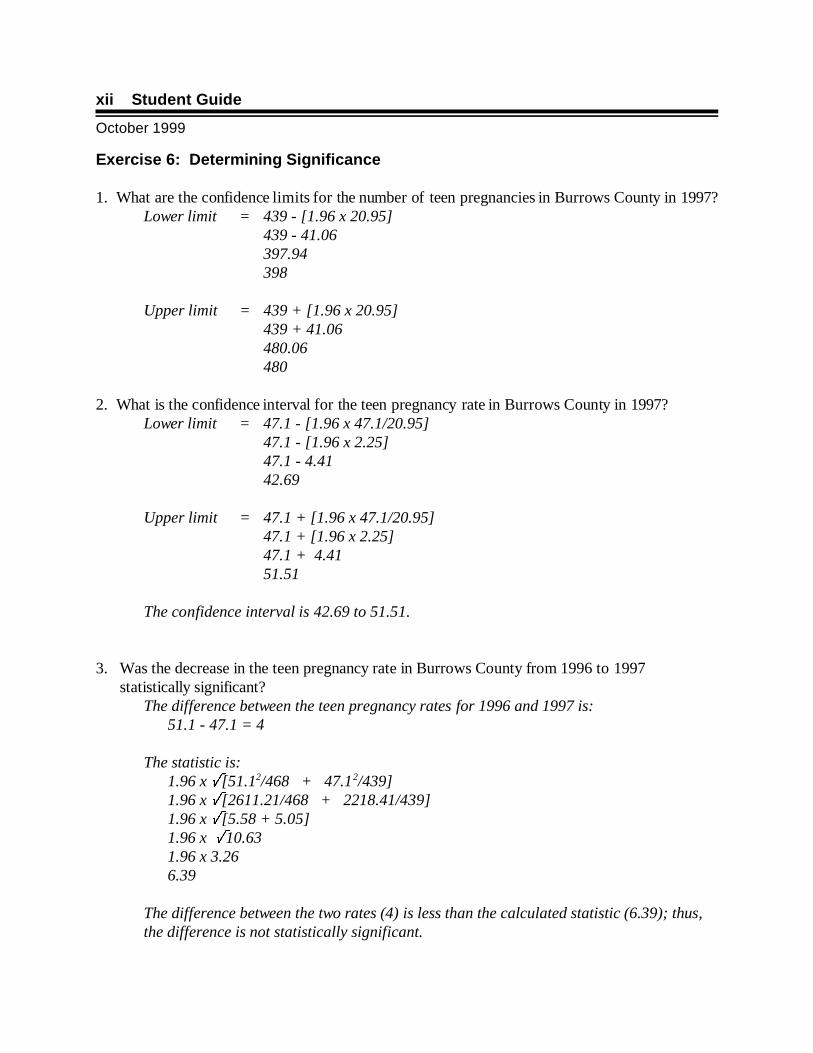
Exercise 6: Determining Significance
1. What are the confidence limits for the number of teen pregnancies in Burrows County in 1997?Lower limit = 439 - [1.96 x 20.95]
439 - 41.06397.94398
Upper limit = 439 + [1.96 x 20.95]439 + 41.06480.06480
2. What is the confidence interval for the teen pregnancy rate in Burrows County in 1997?Lower limit = 47.1 - [1.96 x 47.1/20.95]
47.1 - [1.96 x 2.25]47.1 - 4.4142.69
Upper limit = 47.1 + [1.96 x 47.1/20.95]47.1 + [1.96 x 2.25]47.1 + 4.4151.51
The confidence interval is 42.69 to 51.51.
3. Was the decrease in the teen pregnancy rate in Burrows County from 1996 to 1997statistically significant?
The difference between the teen pregnancy rates for 1996 and 1997 is:51.1 - 47.1 = 4
The statistic is:1.96 x �[51.12/468 + 47.12/439]1.96 x �[2611.21/468 + 2218.41/439]1.96 x �[5.58 + 5.05]1.96 x �10.63 1.96 x 3.266.39
The difference between the two rates (4) is less than the calculated statistic (6.39); thus,the difference is not statistically significant.
Answer Key to Exercises in Module 3
October 1999
xiii
MODULE 3. SMOKING AND HEALTH
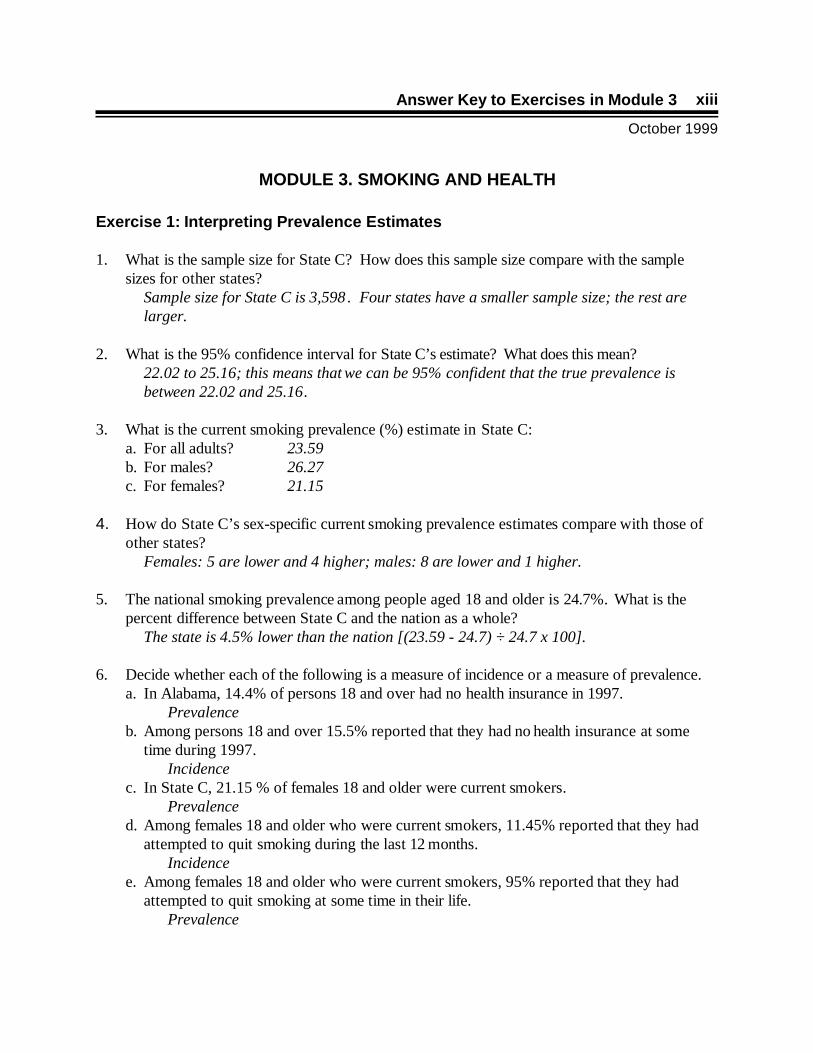
Exercise 1: Interpreting Prevalence Estimates
1. What is the sample size for State C? How does this sample size compare with the samplesizes for other states?
Sample size for State C is 3,598 . Four states have a smaller sample size; the rest arelarger.
2. What is the 95% confidence interval for State C’s estimate? What does this mean? 22.02 to 25.16; this means that we can be 95% confident that the true prevalence isbetween 22.02 and 25.16.
3. What is the current smoking prevalence (%) estimate in State C:a. For all adults? 23.59b. For males? 26.27c. For females? 21.15
4. How do State C’s sex-specific current smoking prevalence estimates compare with those ofother states?
Females: 5 are lower and 4 higher; males: 8 are lower and 1 higher.
5. The national smoking prevalence among people aged 18 and older is 24.7%. What is thepercent difference between State C and the nation as a whole?
The state is 4.5% lower than the nation [(23.59 - 24.7) ÷ 24.7 x 100].
6. Decide whether each of the following is a measure of incidence or a measure of prevalence.a. In Alabama, 14.4% of persons 18 and over had no health insurance in 1997.
Prevalenceb. Among persons 18 and over 15.5% reported that they had no health insurance at some
time during 1997. Incidence
c. In State C, 21.15 % of females 18 and older were current smokers.Prevalence
d. Among females 18 and older who were current smokers, 11.45% reported that they hadattempted to quit smoking during the last 12 months.
Incidencee. Among females 18 and older who were current smokers, 95% reported that they had
attempted to quit smoking at some time in their life.Prevalence
Student Guide
October 1999
xiv
Exercise 2: Comparing Regional and State Prevalence Estimates
1. What is the ratio of the smoking prevalence estimate in District 3 to the State as a whole? 27.77 ÷ 22.61 or 1.2:1. District 3 is 1.2 times higher than the State .
2. Which sex has the higher smoking prevalence in District 3? In the State?Males are higher in both the district and the state.
3. Do the confidence limits for all adults in District 3 and the State overlap? Is the difference insmoking prevalence in District 3 and the State statistically significant?
The confidence limits do not overlap. Their difference is statistically significant.
Exercise 3: Calculating the Burden of Risk
1. Compute the relative risk of dying from lung cancer for males and females who have eversmoked, ages 35-64 and age 65 and older. Record your answer in the Relative Risk columnon Table 6, below. Show your answers rounded to two decimal places.
2. Which group of smokers has the strongest association between lung cancer deaths andsmoking? Which group has the lowest association? Why do you think the risk might behigher for males?
Males over 65 years of age have the strongest association between lung cancer deathsand smoking; females age 35-64 have the lowest association.
3. Now, calculate the attributable risk of death from lung cancer due to smoking in each sex andage group. Record your answers in the Attributable Risk (Percent) column, showing them aspercents rounded to one decimal place.
Answer Key to Exercises in Module 3
October 1999
xv
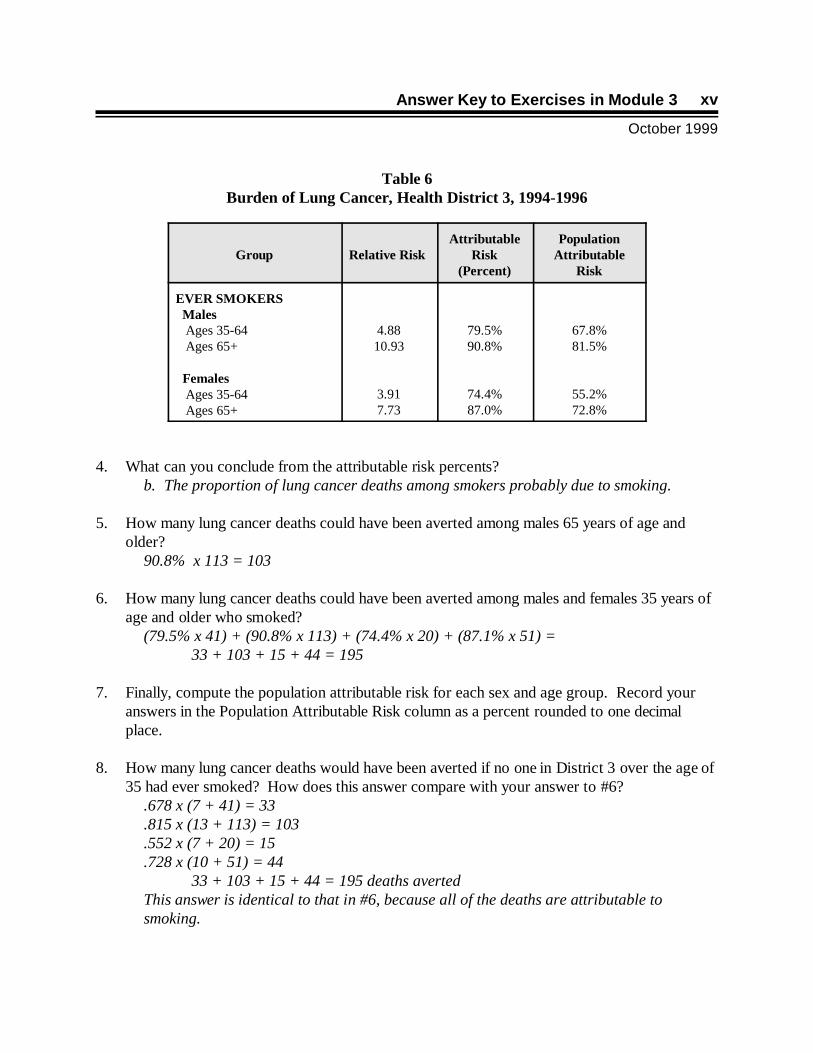
Table 6Burden of Lung Cancer, Health District 3, 1994-1996
Group Relative Risk Attributable
Risk(Percent)
PopulationAttributable
Risk
EVER SMOKERS Males Ages 35-64 Ages 65+
Females Ages 35-64 Ages 65+
4.8810.93
3.917.73
79.5%90.8%
74.4%87.0%
67.8%81.5%
55.2%72.8%
4. What can you conclude from the attributable risk percents? b. The proportion of lung cancer deaths among smokers probably due to smoking.
5. How many lung cancer deaths could have been averted among males 65 years of age andolder?
90.8% x 113 = 103
6. How many lung cancer deaths could have been averted among males and females 35 years ofage and older who smoked?
(79.5% x 41) + (90.8% x 113) + (74.4% x 20) + (87.1% x 51) = 33 + 103 + 15 + 44 = 195
7. Finally, compute the population attributable risk for each sex and age group. Record youranswers in the Population Attributable Risk column as a percent rounded to one decimalplace.
8. How many lung cancer deaths would have been averted if no one in District 3 over the age of35 had ever smoked? How does this answer compare with your answer to #6?
.678 x (7 + 41) = 33
.815 x (13 + 113) = 103
.552 x (7 + 20) = 15
.728 x (10 + 51) = 4433 + 103 + 15 + 44 = 195 deaths averted
This answer is identical to that in #6, because all of the deaths are attributable tosmoking.

Student Guide
October 1999
xvi
Exercise 4: Preparing a Fact Sheet
The answers to this exercise are highly variable.
xvii
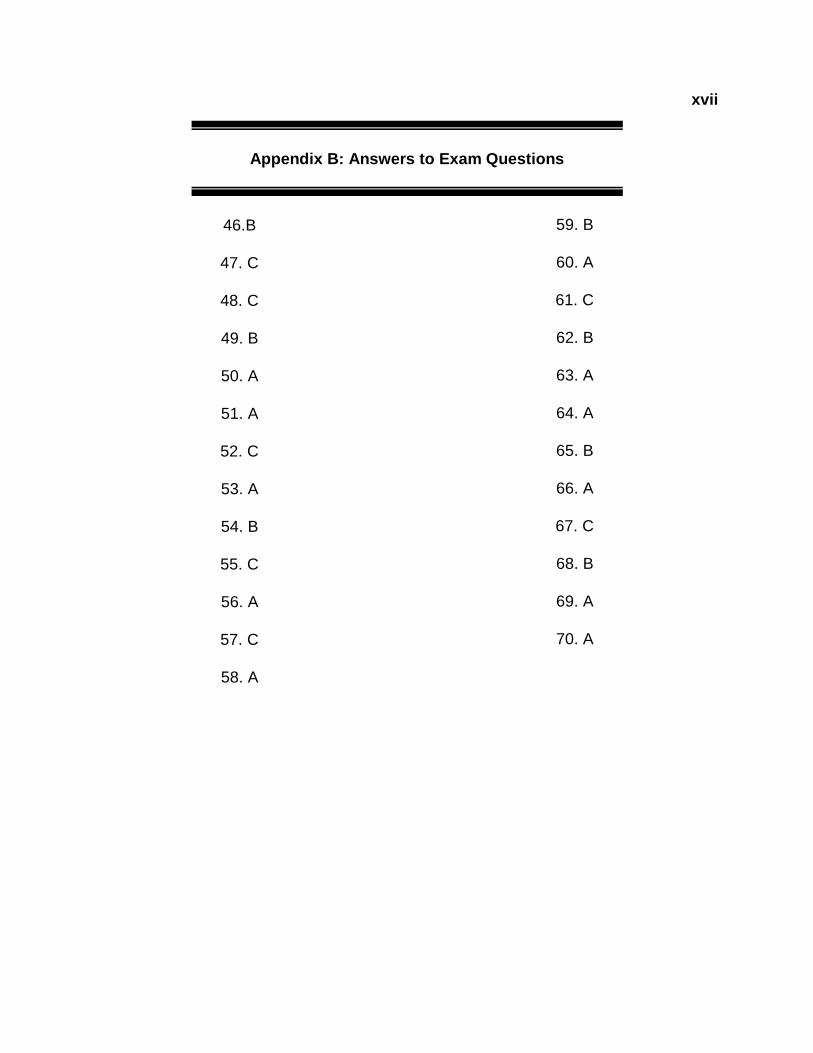
Appendix B: Answers to Exam Questions
46.B
47. C
48. C
49. B
50. A
51. A
52. C
53. A
54. B
55. C
56. A
57. C
58. A
59. B
60. A
61. C
62. B
63. A
64. A
65. B
66. A
67. C
68. B
69. A
70. A