Embed Size (px)
Citation preview
Control Engineering Laboratory
Department of Process and Environmental Engineering
University of Oulu
Continuous Assessment in Process Engineering Education
–
Two Case Studies
Eetu-Pekka Heikkinen & Juha Jaako
Report A No 48, November 2011
University of Oulu, Department of Process and Environmental Engineering,
Control Engineering Laboratory
Report A No 48, November 2011
Continuous Assessment in Process Engineering Education
–
Two Case Studies
Heikkinen, Eetu-Pekka & Jaako, Juha
BACKGROUND. Development of higher engineering education requires under-
standing on teaching, learning and assessment. The content being taught and
boundary conditions, such as available resources, must be taken into consideration.
In practice it is not possible to implement everything that is presented as desirable in
educational research and a compromise is needed, where such a teaching, learning
and assessment environment is created that is both theoretically sound and useful in
practice.
PURPOSE. The purpose of this report is twofold: Firstly, to present a teaching,
learning and assessment environment which can be used as a base for educational
practice and development. Secondly, we present two cases, in both of which the
implementation is based mainly on the ideas of constructive alignment and the key
element has been to find those assessment procedures that are most useful for the
attainment of learning outcomes.
SCOPE/METHOD. The report begins with a discussion on research about suitable
teaching, learning and assessment environment with special emphasis on constructive
alignment. Continuous assessment with its pros and cons and uses in our environ-
ment is also covered. Our report ends with our two educational cases and
discussion.
CONCLUSION. Based on quantitative (pass rate, grades) and qualitative data
(student feedback) obtained from our cases, we claim that the use of continuous
assessment, which can also be justified by learning and assessment research, is an
efficient approach in creating a well functioning course. Continuous assessment also
provides us with real-time information about student learning and this enables us to
make well founded changes even during a course.
KEYWORDS. engineering education, constructive alignment, continuous assessment
ISBN 978-951-42-9721-2
ISSN 1238-9390
University of Oulu
Control Engineering Laboratory
PL 4300
Oulu 2011 FIN-90014 Oulun yliopisto
Contents 1 Introduction .................................................................................................................. 3
2 Environment for teaching, learning and assessment ........................................... 5
3 Continuous assessment ............................................................................................. 8
4 Two cases ................................................................................................................... 10
5 Summary ...................................................................................................................... 17
References ...................................................................................................................... 18
ISBN 978-951-42-9721-2
3
1 Introduction
In the beginning of our teaching careers teaching and assessment was easy: we gave
lectures, produced an exam paper, students took the exam and we graded them. It
seemed so simple but, as it turned out, teaching methods and student learning were
far from optimal. Reading a book (e.g. Wankat and Oreovicz 1993) about teaching
in engineering or a book about assessment practices in higher education (e.g. Miller
et al. 1998) is one thing, but to actually implement successfully results of educational
research into your own courses or into the curricula of your department is some-
thing very different and requires that one has at least basic understanding of
educational sciences, teaching, learning and assessment.
Our report concentrates on the central role of assessment in higher engineering
education. Student assessment is usually done by taking a sample of what students
do, making inferences and estimating the worth of their actions (Brown et al. 1997).
There are also several purposes why assessment of students is done (Trotter 2006):
to provide feedback to students to improve their learning,
to give the teacher feedback on how effective and successful students are at
promoting learning,
to motivate students,
to enable students to correct errors and remedy deficiencies,
to consolidate student learning and
to convey to students what we want them to learn.
As Trotter (2006) points out, these purposes can be condensed into three main
topics: feedback, motivation and student learning. Feedback is most useful when it is
at its greatest before the end of a course. The timing of traditional end-of-course
exams is usually too late for effective use of feedback, so other assessment
approaches, such as continuous assessment (Miller et al. 1998, 87-93), are more
effective. Using assessment positively, i.e. to encourage and motivate students to
learn (Rowntree 1987) and to use deep approach (Marton and Säljö 1976a, b) in
learning, leads to assessing students’ learning process instead of the end product.
Using results from learning research has paved way to approaches which use the fact
that, since students learn in part to be assessed, their learning should be assessment
led, i.e. assessment can be used as an instrument of coercion (Trotter 2006).
Aspects of practicality and realism support such assessment approaches where
demands on student and teacher time and resources are not excessive (Lines and
Gammie 2004, 72).
Our work on assessment began as a teaching development project, but it soon
transformed into action research where one looks to foster change in social
practices in the social situations in which they take place (Cousin 2009, 150). The
aims and benefits of action research are strategic improvement of practice and
improvement occurs through the active engagement of the practitioners (Case and
Light 2011). Another approach used by us is case study, which can be described as
an in-depth study or examination of a distinct, single instance of a class of
phenomena. Case study as a methodology can be used as motivation for the validity
4
of findings emerging either from an analysis of a single case or across multiple cases
(Case and Light 2011). In this report we present two cases: case A, process
optimization course and case B, engineering thermodynamics course).
With this on our mind we come into our specific research questions (see Maxwell
1996):
Question 1: Is it possible, by using educational research results, to create an
assessment-centred teaching/learning environment in higher engineering
education?
Question 2: Is it possible to show, qualitatively and quantitatively, that the
assessment-centred learning environment thus created is advantageous in
educational terms?
When creating our teaching/learning/assessment environment we have taken
especially constructive alignment (Biggs 1996; Biggs and Tang 2007, 50-63),
continuous assessment (e.g. Miller et al. 1998, 87-90) and problem-based learning
(PBL) (e.g. Hmelo-Silver 2004) as suitable guidelines and frameworks, not as rigorous
methods to be adhered to precisely; this approach is called by Felder and Brent
(2005, 59) engineering approach. Our aim is to solve educational and assessment
problems in practice and theoretical considerations run parallel, not before, after or
instead of, the actual development and research work. Moreover, as Hmelo-Silver
(2004) points out, it would be naïve to believe that, e.g. the medical school model of
PBL could be imported into other settings without adapting it to the local contexts,
goals, and development level of learners.
5
2 Environment for teaching, learning and assessment
If we take assessment into centre in our teaching, then what kind of teaching/
learning/assessment environment we must create and which aspects we must stress
in order to create such an environment. Biggs and Tang (2007, 91-99) have listed
some general characteristics of good teaching/learning contexts found in literature
(see also Wankat and Oreovicz 1993, 4-5 and Trigwell 2003):
Appropriate motivational context. There are two incentives that make students
want to learn something: that something must be of value to the student and
there must be a distinct possibility of success when learning that something. This
means that if we are using a PBL-approach, the problems must be of value, i.e.
their solution must enhance students’ professional expertise, and the difficulty of
the problems must be such that students can solve them.
Constructing a base of interconnected knowledge. Students build on what they
already know and sound knowledge base is based on interconnections, not on
separate bullet points. Such a knowledge base must be, moreover, connected
both horizontally and vertically.
Relevant learner activity. Being active in, e.g. problem solving, while learning is
better than being passive, e.g. listening to a lecture. In addition, our experience
underlines that learner activity connected with peer teaching (see also
Goldschmid and Goldschmid 1976) and group work is beneficial.
Formative feedback. The most powerful enhancement to learning is feedback
during learning, i.e. formative assessment. Formative feedback is the information
communicated to the learner that is intended to modify his/her thinking or
behaviour for the purpose of improving learning (Shute 2008).
Reflective practice and self-monitoring. When self-monitoring, learners keep a
watch over their learning by posing questions as: How am I doing? Why am I
making mistakes here? What should I do in future? Where are the
gaps/strengths in my knowledge?
The literature on teaching, learning and assessment is extensive. Here we cover
some aspects of learning and assessment that are relevant in our context such as:
what are students’ approaches to learning, how they react when they are assessed,
what are the current assessment practices and uses, what is the contextuality of
assessment, how is the spectrum of skills to be assessed and what and how many
assessment tools to use:
Student approaches to learning. Research on student learning has demonstrated
links between students’ approaches to learning and their performance in
assessment tasks; the converse also applies, i.e. the format of assessment can
determine the way students set about their learning (Miller et al. 1998, 41). In
the 1970’s Marton and Säljö (1976a, b) identified two levels of approach to
learning tasks namely deep approach and surface approach. A deep approach is
characterised by a personal interest in learning and students using this approach
set out with an intention of understanding the material; surface approach is
characterised by a lack of personal engagement in the learning process and
6
students focus on rote-learning and are constrained by the specific task (Byrne
et al. 2010). Subsequent research drew attention to the influence of assessment
on student learning and identified an additional approach: strategic (Ramsden
1979). Strategically oriented students are focused in achieving and they adopt
those learning strategies, i.e. either deep or surface approach, they consider will
earn them the best marks (Byrne et al. 2010).
Student reactions to assessment. As teachers we tend to see the intended learning
outcomes as central in our educational system. But as Ramsden (1992, 187)
points out, our students see it differently, from their point of view assessment
always defines the actual curriculum. Elton (1987, 92) coined this phenomenon
backwash and it refers to the effects assessment has on student learning. Back-
wash can be negative, i.e. detrimental to intended learning outcomes, or positive
but it is always present. Negative backwash guides students to surface learning
so our aim is to create positive backwash, i.e. assessment should be aligned to
what students should be learning (see also Scouller and Prosser 1994, 268).
Models of assessment. In university environment two distinct ways of assessment
form the basis of assessment practice and thinking: the measurement model and
the standards model (Taylor 1994). In the measurement model results are
reported in terms of comparisons between students. When using this model
the negative effects of backwash are quite prominent (Biggs and Tang 2007, 170-
6). The standards model, on the other hand, is designed to assess changes in
performance as a result of learning, i.e. how well an individual meets the criteria
of learning that have been set (Biggs and Tang 2007, 177).
Formative and summative assessment. Two main types of student assessment are
(Biggs and Tang 2007, 97) formative and summative assessment. To this list one
can also add diagnostic assessment (Miller et al. 1998, 3), which provides
teachers with information about students’ knowledge before beginning a learning
activity. Formative assessment is provided during learning, telling students and
teachers how well students are doing and what might need improving.
Summative assessment takes place after learning, informing how well students
have learned what they were supposed to have learned. Usually these assess-
ments are conducted separately, i.e. there are separate diagnostic, formative and
summative tests, and usually diagnostic tests, if conducted at all, take place
before a course and summative test takes place in the form of a terminal exam.
However, based on our experience, there is no need to separate these tests,
because diagnostic, formative and summative tasks can be done simultaneously,
and if done simultaneously, the teacher is well-informed about students’
progress in studies, before, during and after learning activity. Using continuous
assessment this is easily accomplished as we will show later in this report.
Assessment context. One question is whether the assessment tasks should be
decontextualized, requiring students to perform out of context (in the abstract),
or contextualized. According to Biggs and Tang (2007, 182) decontextualized
assessments are suitable for assessing declarative or propositional knowledge
(knowing about things) and contextualized or performance assessments suitable
for assessing functioning knowledge (putting declarative knowledge to work by
solving problems) in its appropriate context. In higher engineering education
exams in mathematics, physics and chemistry are usually – regrettably – out of
context and everything else, i.e. in the engineering education proper, is or
7
should be in context (see Heikkinen and Jaako 2010). Our two educational
cases are concerned with teaching/learning activities that put knowledge into
work in a professional, i.e. engineering, context.
Complexity and difficulty. Besides aspects presented earlier we must also test in
our exams skills that cover a broad spectrum of complexity and difficulty. This
problem is usually approached with the help of the Taxonomy of Educational
Objectives or Bloom’s taxonomy for short (Bloom and Krathwohl 1984; Miller et
al. 1998, 47-53). Bloom’s taxonomy defines a hierarchy of six levels (Felder et al.
2000): (1) repeating memorized information; (2) paraphrasing text, explaining
concepts in jargon-free terms; (3) applying course material to solve straight-
forward problems; (4) solving complex problems, developing process models
and simulations, troubleshooting equipment and system problems; (5) designing
experiments, devices, processes, and products and (6) choosing from among
alternatives and justifying the choice, optimizing processes, making judgments
about the environmental impact of engineering decisions, resolving ethical
dilemmas. Levels 1-3 are commonly known as lower-level skills and levels 4-6
are higher-level skills. Because according to Felder et al. (2000) most under-
graduate engineering courses focus on level 3 skills, we must extend our tests,
and assessment, to include also levels 4, 5 and 6.
Assessment tools. Last but not least, we must consider which and how many
assessment tools to use. There is a plethora of tools available (Felder and Brent
2003a, 13; Miller et al. 1998, 85-202) but during a single course we must restrict
ourselves to the most useful ones from the point of view of learning outcomes.
As Besterfield-Sacre et al. (2000) point out, using triangulation, i.e. using multiple
methods (or tools) to obtain and verify a result, is an important feature of
effective assessment. The more tools used to assess a specific course learning
objective, the greater the likelihood that the assessment will be both valid and
reliable (Felder and Brent 2003a, 13).
To sum up, we aim at a teaching/learning/assessment environment which provides
students with a motivational context, constructs a base of interconnected knowl-
edge, has relevant learner activity, gives feedback in abundance, and gives students
possibility for reflective practice. Moreover, our environment must ‘force’ students
to use deep approach in their learning; we must limit the negative effects of back-
wash; we must assess students on how well they attain intended learning outcomes;
we must use a lot of formative assessment mixed with diagnostic and summative
assessment; in our cases we will assess functioning knowledge; we must test skills
that cover a broad spectrum of complexity and difficulty; and we must use different
assessment tools.
8
3 Continuous assessment
In educational practice we need a tool, something tangible to work with. Early in
our research work we noticed that in order to create the sought-after environment,
the use of final or terminal assessment is not possible for several reasons: when
using terminal assessment it is very difficult to accomplish a working feedback system
from the student to the teacher and vice versa; following student’s progress in
his/her learning during the course is difficult; and motivating students is also difficult,
because you, as a teacher, do not know what is motivating for the lack of
information. As Byrne et al. (2010, 379) point out, there is a need to reconsider the
over-reliance on terminal assessment within the assessment strategy. In continuous
assessment (CA) there is no final examination as such, and the mark or grade is
determined on the basis of scores in individual tests or assignments scattered
throughout a course of study (Miller et al. 1998, 88). Succinctly CA could be
phrased as assess as you go (Isaksson 2008). Also our experiences from other
courses and from prior research (e.g. Tang 1992) indicated that continuous assess-
ment is more likely to encourage deep approaches to learning than terminal
assessment.
One drawback in CA is that it usually, according to Miller et al. (1998, 88), leads to
confusion between the distinctive purposes of formative and summative assessment,
but this should not be seen as a problem but as an asset. We noticed that students
put serious effort only on that work of theirs that had effect on their grade; every-
thing else was more or less ignored (see also Price et al. 2007). It is not very useful
to make a formative test on students and expect reliable results by telling them,
especially to strategically oriented students, that ‘this test is a formative test and it
has no effect on your grade’. Consequently we created an environment where every
piece of work done by a student affects his/her final grade, and these tests are used,
at the same time, in formative and summative way. These small tests can also be
used in a diagnostic way, e.g. if a problem proves to be too difficult for students, you
can make the next one less difficult and vice versa, and in this way you can also
detect gaps in student knowledge base and act accordingly.
CA is not a panacea. According to Miller et al. (1998, 88-89) major difficulties when
CA operates include:
(1) students have too little time for in-depth studying because of the many tests,
(2) teachers have intolerable marking load,
(3) tests used encourage students to use surface approach,
(4) measuring student’s grasp of broader principles might be jeopardized,
(5) the general stress level of students increases,
(6) the variation of work load between students is excessive, and
(7) plagiarism in those tests that are not controlled by the teacher, e.g. homework
assignments.
In our cases we have noticed all these difficulties and items (6) and (7) are the most
problematic and items (1), (4) and (5) are the least problematic ones. It is perhaps
surprising to note that students report (Jaako 2011) on decrease of general stress
9
level; this can be attributed to the fact that student’s grade is not based on a single
test but on considerable amount of tests and failure in some tests has only minor
consequences. Marking load (2) is not excessive if sensible scheduling of tasks is
used, but it can be considerable when other duties are pressing. Plagiarism (7) is a
problem but this can be remedied partly by introducing constantly new, previously
unknown problems to students. We can say that the biggest difficulty, when using
CA with PBL, is that most of the teacher’s time is not used in marking, teaching or
tutoring but in finding, designing and implementing new, pedagogically relevant
problems for students to solve.
The good news is that CA provides us some impressive advantages (Miller et al.
1998, 89-90) which can be used effectively in feedback, from student to teacher and
vice versa, and in following student progress:
(1) results of tests can be returned to students soon after each test is completed,
which gives the teacher a powerful tool for two-way-feedback,
(2) both students and teacher are kept informed in real-time of student’s progress
in learning,
(3) each section of course can be tested in more detail than in terminal assessment,
and remedial work can be done during the course,
(4) if a student is sick or absent and alternative test can be administered , and
(5) student guiding and tutoring is easier because of (2).
We have noticed same advantages in our own research. According to students’ feed-
back (Jaako 2011, see also Isaksson 2008) they are most pleased with items (1) and
(2) and, additionally, in case B with item (4). From student feedback it can also be
deduced that some students move from mere learning to reflecting their own
learning; possibly there is a change in the level of thinking about learning (compare
with Bloom’s taxonomy’s levels 4-6 in chapter 2). The biggest advantages of CA for
the teacher are items (2), (3) and (5) which are connected with the effective two-
way feedback possible in CA. Our two cases have demonstrated to us that in
educational practice the advantages of CA are much bigger than the difficulties. Of
course terminal assessment has also advantages as well as disadvantages; for details
see Miller et al. (1998, 90-92).
When we connect CA with constructive alignment (Biggs 1996; Biggs and Tang 2007,
50-63), i.e. intended learning outcomes (ILOs), course content, learning environment
(including teaching formats), assessment and grading are aligned, we gain further
advantages which are not readily evident. Alignment can be made dynamic and ILOs,
environment and sometimes even assessment can be changed during course, because
of the real-time information about student learning. The effects of these changes,
.e.g. does a new teaching format work in practice, can be seen almost immediately.
10
4 Two cases
Case studies are an important research method in areas where innovations are
studied and they enable us to study contemporary and complex social phenomena in
their natural context (Yin 1987). The problem with case studies, however, is
whether observations and conclusions are relevant outside the contexts studied. To
make results gathered from case studies applicable in other contexts, we can use
approaches such as: we can compare several cases and draw our conclusions from
that; we can compare our results with the experiences of other teachers; and we
can compare our results, or parts of them, with research results of others.
This chapter presents two educational cases (case A, 4 ECTS, ‘Process Optimization’
and case B, 5 ECTS, ‘Thermodynamics’), in which we have used continuous assess-
ment (CA) as a central tool in creating a learning environment. Our cases are not
experiments, and the history of both courses goes beyond single application:
development in case A started in 1994 and in case B in 2006. In the 1990’s case A
consisted of strictly separated parts: lectures, exercises, and final exam. Student
learning was weak and students passed the terminal exam with difficulty or not at all.
The first phase in development was a portfolio-based approach until CA was
adopted and parts were constructively aligned. Case B was born in the year 2006
when separate courses in chemistry were integrated into a single process engineer-
ing thermodynamics course. Case B started with CA and constructive alignment
from the very beginning.
Starting points in cases A and B were different and the contents of the courses are
also different but implementations by the year 2011 proved to be surprisingly similar
(see Table 1). We started our work to remove the scattering of course content, to
better student learning and to improve student retention and throughput in our
course. We integrated different parts of a course in a new way and originally we
called this approach ‘internal integration of a course’. In the end, however, our
courses presented many characteristics of constructive alignment (Biggs 1996; Biggs
and Tang 2007, 50-63).
In Table 1 the application features of cases A and B are presented. N.B. In the tables
the word ‘exercises’ denotes a working format in which problems are given to
students to solve during the time frame of ‘lecture’. ‘Lecture’ means contact teaching
time (usually 2-4 hours) when teacher and student are present in the same room;
the word ‘lecture’ used here has no reference to teaching method ‘lecturing’.
‘Homework’ means problems given to students to solve at their own time, indivi-
dually or in groups.
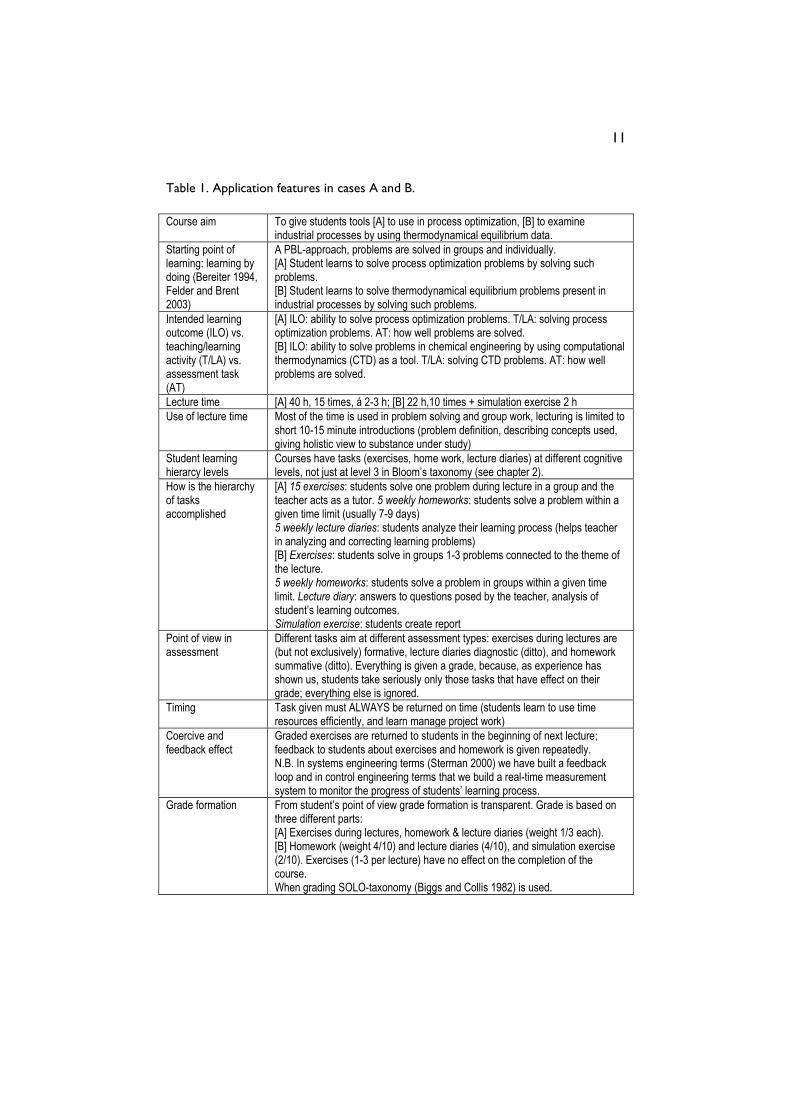
11
Table 1. Application features in cases A and B.
Course aim To give students tools [A] to use in process optimization, [B] to examine
industrial processes by using thermodynamical equilibrium data.
Starting point of learning: learning by doing (Bereiter 1994, Felder and Brent 2003)
A PBL-approach, problems are solved in groups and individually. [A] Student learns to solve process optimization problems by solving such problems. [B] Student learns to solve thermodynamical equilibrium problems present in industrial processes by solving such problems.
Intended learning outcome (ILO) vs. teaching/learning activity (T/LA) vs. assessment task (AT)
[A] ILO: ability to solve process optimization problems. T/LA: solving process optimization problems. AT: how well problems are solved. [B] ILO: ability to solve problems in chemical engineering by using computational thermodynamics (CTD) as a tool. T/LA: solving CTD problems. AT: how well problems are solved.
Lecture time [A] 40 h, 15 times, á 2-3 h; [B] 22 h,10 times + simulation exercise 2 h
Use of lecture time Most of the time is used in problem solving and group work, lecturing is limited to short 10-15 minute introductions (problem definition, describing concepts used, giving holistic view to substance under study)
Student learning hierarcy levels
Courses have tasks (exercises, home work, lecture diaries) at different cognitive levels, not just at level 3 in Bloom’s taxonomy (see chapter 2).
How is the hierarchy of tasks accomplished
[A] 15 exercises: students solve one problem during lecture in a group and the teacher acts as a tutor. 5 weekly homeworks: students solve a problem within a given time limit (usually 7-9 days) 5 weekly lecture diaries: students analyze their learning process (helps teacher in analyzing and correcting learning problems) [B] Exercises: students solve in groups 1-3 problems connected to the theme of the lecture. 5 weekly homeworks: students solve a problem in groups within a given time limit. Lecture diary: answers to questions posed by the teacher, analysis of student’s learning outcomes. Simulation exercise: students create report
Point of view in assessment
Different tasks aim at different assessment types: exercises during lectures are (but not exclusively) formative, lecture diaries diagnostic (ditto), and homework summative (ditto). Everything is given a grade, because, as experience has shown us, students take seriously only those tasks that have effect on their grade; everything else is ignored.
Timing Task given must ALWAYS be returned on time (students learn to use time resources efficiently, and learn manage project work)
Coercive and feedback effect
Graded exercises are returned to students in the beginning of next lecture; feedback to students about exercises and homework is given repeatedly. N.B. In systems engineering terms (Sterman 2000) we have built a feedback loop and in control engineering terms that we build a real-time measurement system to monitor the progress of students’ learning process.
Grade formation From student’s point of view grade formation is transparent. Grade is based on three different parts: [A] Exercises during lectures, homework & lecture diaries (weight 1/3 each). [B] Homework (weight 4/10) and lecture diaries (4/10), and simulation exercise (2/10). Exercises (1-3 per lecture) have no effect on the completion of the course. When grading SOLO-taxonomy (Biggs and Collis 1982) is used.
12
In both cases the environment described in table 1 possesses, according to student
feedback (Jaako 2011, Heikkinen 2010), those characteristics described in the
beginning of chapter 2 with special emphasis on relevant learner activity. The
environment also addresses, or at least tries to address, those aspects presented in
remaining part of chapter 2 with special emphasis on promoting students to use
deep approach to learning; on giving students a lot of feedback; on working in
engineering context; on providing students with problems of different levels of
complexity and difficulty; and on using different assessment tools.
The next task in our report is to analyze results from our cases in educational terms.
We can analyze these by using the following sources of information:
Research done by the scientific community which provides us with supporting
evidence (presented in chapters 2 and 3).
Researchers/teachers personal view of the development results. This view is
usually of highly subjective nature, but it can be amplified by quantitative data.
Our views are presented throughout this report.
Supporting quantitative data in the form of throughput (pass rate) (Figures 1, 2
and 3) and grades (Figure 4).
Students’ views of the course given as a written feedback. This comes in the
form of qualitative data.
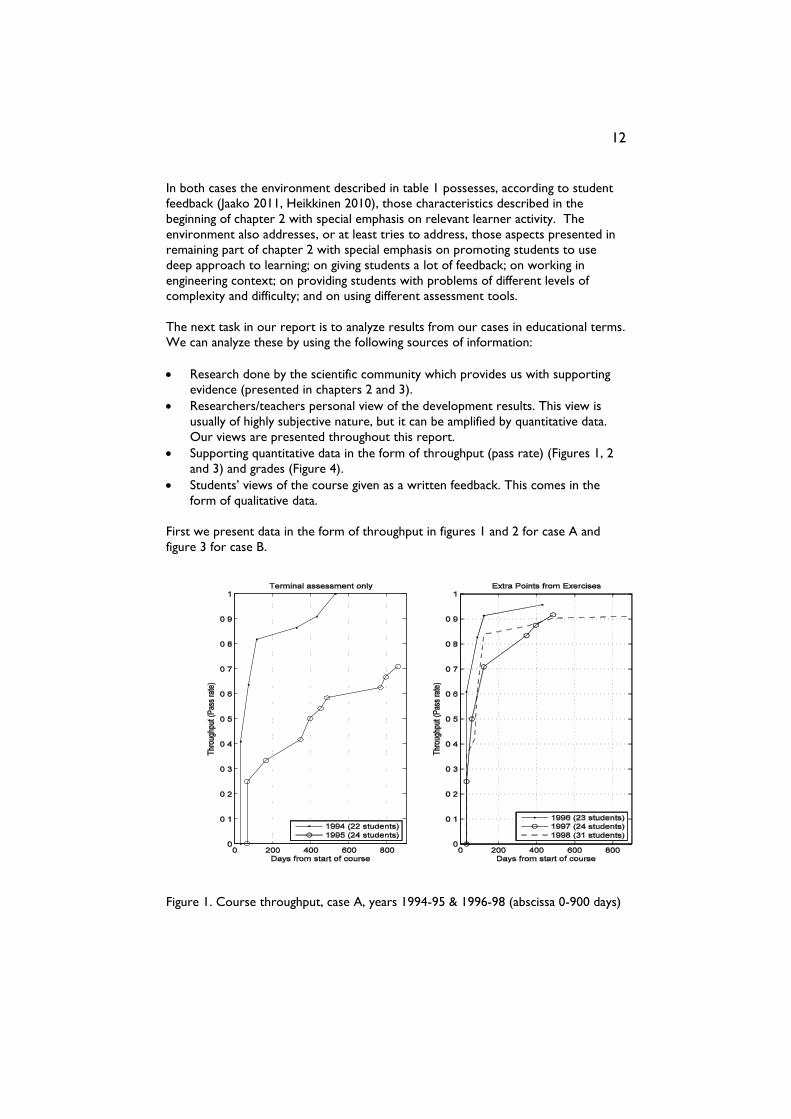
First we present data in the form of throughput in figures 1 and 2 for case A and
figure 3 for case B.
Figure 1. Course throughput, case A, years 1994-95 & 1996-98 (abscissa 0-900 days)
13
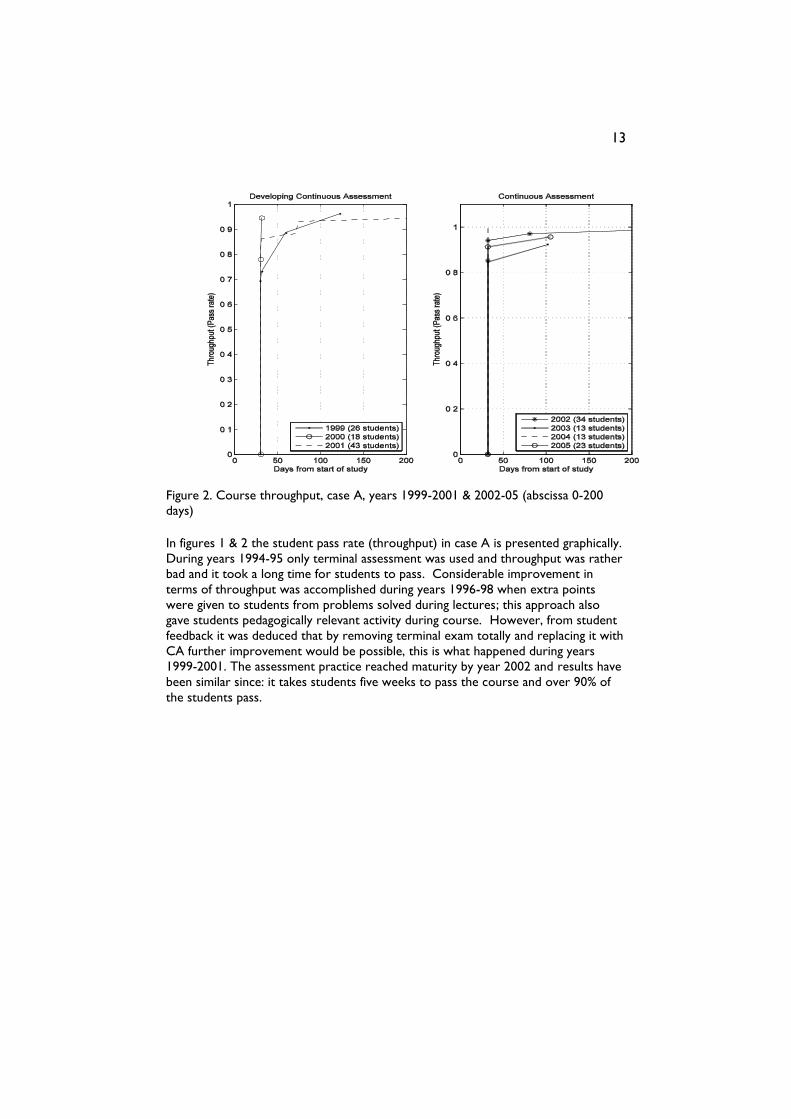
Figure 2. Course throughput, case A, years 1999-2001 & 2002-05 (abscissa 0-200
days)
In figures 1 & 2 the student pass rate (throughput) in case A is presented graphically.
During years 1994-95 only terminal assessment was used and throughput was rather bad and it took a long time for students to pass. Considerable improvement in
terms of throughput was accomplished during years 1996-98 when extra points
were given to students from problems solved during lectures; this approach also
gave students pedagogically relevant activity during course. However, from student
feedback it was deduced that by removing terminal exam totally and replacing it with
CA further improvement would be possible, this is what happened during years
1999-2001. The assessment practice reached maturity by year 2002 and results have
been similar since: it takes students five weeks to pass the course and over 90% of
the students pass.
14
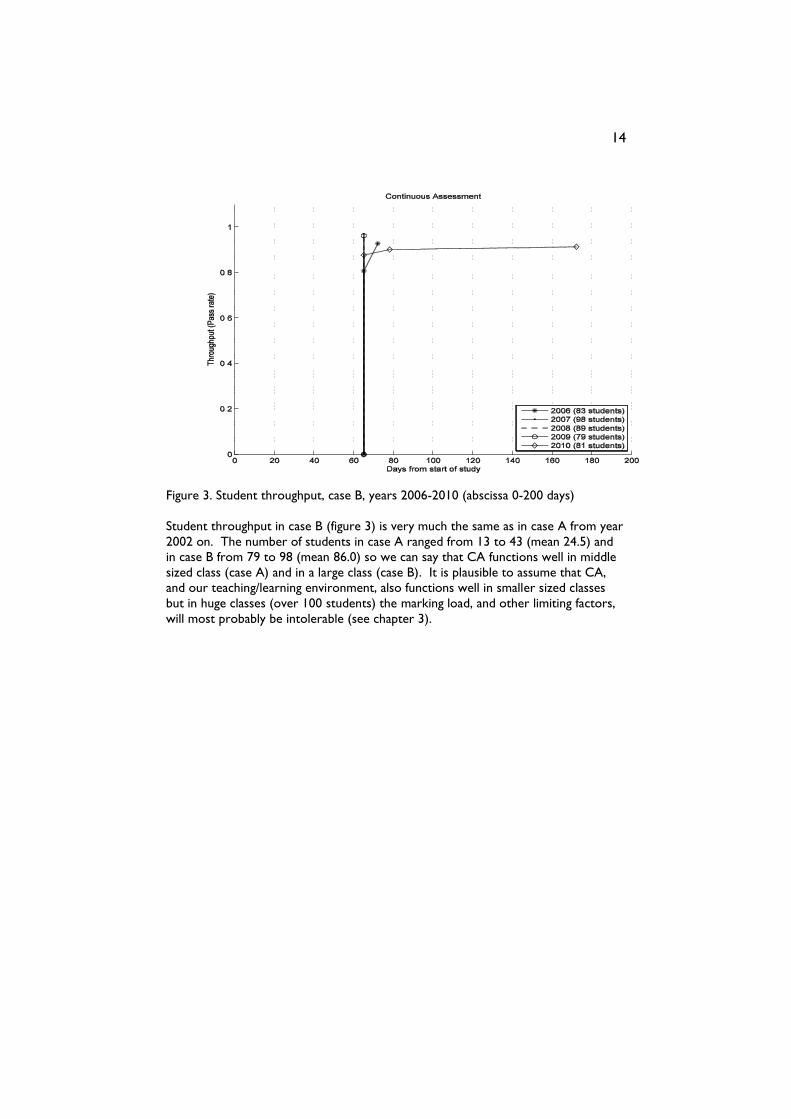
Figure 3. Student throughput, case B, years 2006-2010 (abscissa 0-200 days)
Student throughput in case B (figure 3) is very much the same as in case A from year
2002 on. The number of students in case A ranged from 13 to 43 (mean 24.5) and
in case B from 79 to 98 (mean 86.0) so we can say that CA functions well in middle
sized class (case A) and in a large class (case B). It is plausible to assume that CA,
and our teaching/learning environment, also functions well in smaller sized classes
but in huge classes (over 100 students) the marking load, and other limiting factors,
will most probably be intolerable (see chapter 3).
15
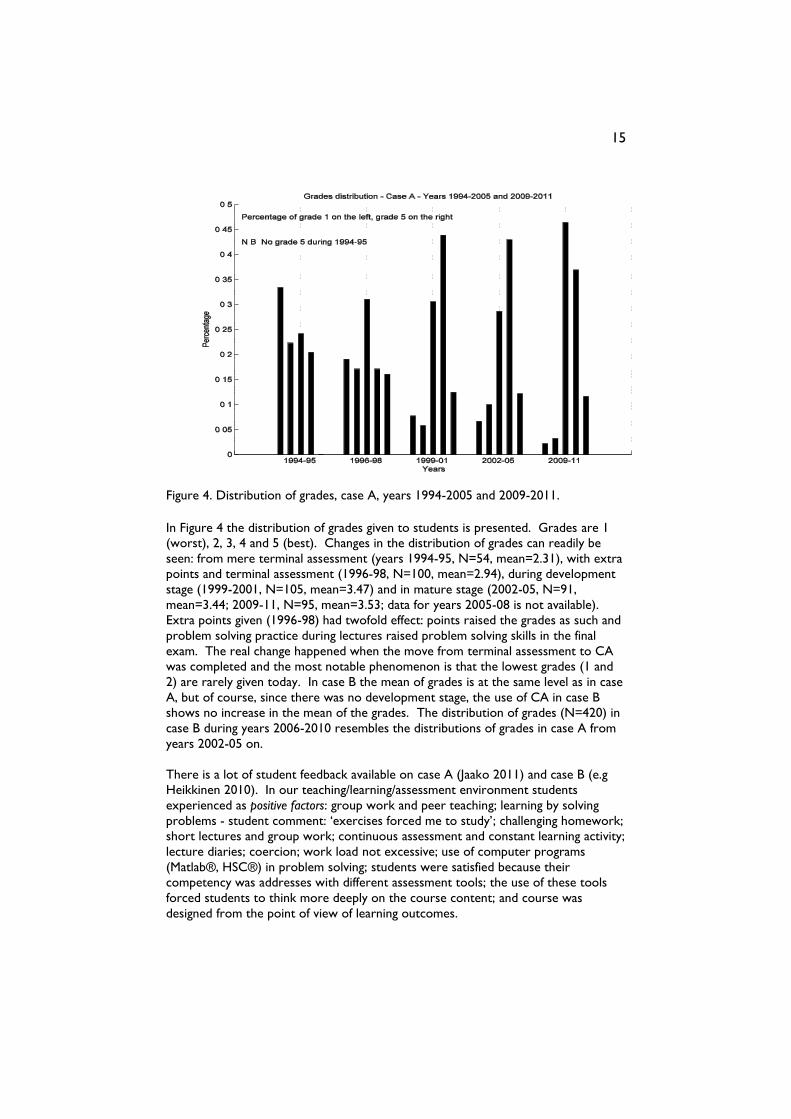
Figure 4. Distribution of grades, case A, years 1994-2005 and 2009-2011.
In Figure 4 the distribution of grades given to students is presented. Grades are 1
(worst), 2, 3, 4 and 5 (best). Changes in the distribution of grades can readily be
seen: from mere terminal assessment (years 1994-95, N=54, mean=2.31), with extra
points and terminal assessment (1996-98, N=100, mean=2.94), during development
stage (1999-2001, N=105, mean=3.47) and in mature stage (2002-05, N=91,
mean=3.44; 2009-11, N=95, mean=3.53; data for years 2005-08 is not available).
Extra points given (1996-98) had twofold effect: points raised the grades as such and
problem solving practice during lectures raised problem solving skills in the final
exam. The real change happened when the move from terminal assessment to CA
was completed and the most notable phenomenon is that the lowest grades (1 and
2) are rarely given today. In case B the mean of grades is at the same level as in case
A, but of course, since there was no development stage, the use of CA in case B
shows no increase in the mean of the grades. The distribution of grades (N=420) in
case B during years 2006-2010 resembles the distributions of grades in case A from
years 2002-05 on.
There is a lot of student feedback available on case A (Jaako 2011) and case B (e.g
Heikkinen 2010). In our teaching/learning/assessment environment students
experienced as positive factors: group work and peer teaching; learning by solving
problems - student comment: ‘exercises forced me to study’; challenging homework;
short lectures and group work; continuous assessment and constant learning activity;
lecture diaries; coercion; work load not excessive; use of computer programs
(Matlab®, HSC®) in problem solving; students were satisfied because their
competency was addresses with different assessment tools; the use of these tools
forced students to think more deeply on the course content; and course was
designed from the point of view of learning outcomes.
16
As negative factors students experienced the following: some students did not like the
lecture diaries; course materials were not always clear and comprehensive; in case A
students with problems in mathematics and Matlab® experienced problems; in case
B the simulation exercise with HSC® was deemed either as too difficult or too easy;
and problems given to students to solve were not closely tied to engineering
practice, i.e they were out of context. Perhaps surprisingly, no-one had negative
experiences on CA and many students commented, especially in case A, that the
course was their best learning experience so far. Also, perhaps more surprisingly,
the use of coercion (or teacher control with time limits) was deemed a positive
factor in learning. Negative comments are mostly due to the fact that students,
especially in case A, form a heterogeneous group. Creating pedagogically meaningful
problems for students to solve is somewhat difficult as mentioned previously and
students recognize it.
If we compare students’ comments on the list of Biggs and Tang (2007, 91-99) on
general characteristics of good teaching/learning contexts or environments, we can
say that, based on student feedback, we have succeeded in creating an appropriate
motivational context, relevant learner activities with problems to be solved, a
teaching/learning environment that gives students a lot of feedback, and a possibility
for reflective practice and self-monitoring in group work and by writing lecture
diaries. Whether we have succeeded in constructing a base of interconnected
knowledge cannot be deduced from our data, but from students feedback it is
evident that they think we have.
17
5 Summary
Research literature shows us that in learning there are certain characteristics that
are desirable in student behaviour and some that are not. We as teachers must find
a way to control, or coerce, all our students to use those approaches that show
them the way to intended learning outcomes. In order to accomplish this, the
teacher must master the substance of course, know the students and their learning
approaches, know how to teach, know how to use assessment tools, and finally,
know how to guide students’ learning processes.
In the beginning of our report we presented two research questions. First one was
‘Is it possible, by using educational research results, to create an assessment-centred
teaching/learning environment in higher engineering education?’. Based on the analysis of
our two cases, our answer is YES. Whether our findings are useful in other
disciplines requires further research. Our second question was ‘Is it possible to show,
qualitatively and quantitatively, that the assessment-centred learning environment thus
created is advantageous in educational terms?’. The problem with learning is that it can
be measured only indirectly during studies, e.g. from grades, from course
throughput, and from student feedback. Analysis of the data from these sources
gives us a possibility to answer YES to our second question. Whether some other
teaching/learning/assessment environment would be better in our two cases, cannot
be answered based on our current knowledge.
We have strived to use different tools, especially continuous assessment and
problem based learning, to create a learning environment, which possesses many of
the characteristics of constructive alignment (Biggs and Tang 2007). Continuous
assessment also provides us with real-time information about student learning and
this enables us to make well founded changes even during a course. The experience
gathered has enabled us – besides creating teaching that is more aligned than
previously – also to move from integrating teaching activities to integrating learning
activities and at the same time offering students real responsibility for their learning.
Acknowledgement
Authors like to thank our colleague, Dr. Juha Ahola, for useful discussions
concerning assessment in engineering education.
18
References
Bereiter, C., 1994. Implications of postmodernism for science, or, science as
progressive discourse. Educational Psychologist, 29(1), 3-12.
Besterfield-Sacre, M., Shuman, L., Wolfe, H. & McGourty, J. 2000. Triangulating
assessments. Proceedings, 2000 ASEE Annual Meeting. American Society for
Engineering Education.
Biggs, J. 1996. Enhancing teaching through constructive aligment. Higher Education,
(32)3, 347-364.
Biggs, J.B. & Collis, K.F., 1982. Evaluating the quality of learning – The SOLO taxonomy.
New York: Academic Press.
Biggs, J. & Tang, C., 2007. Teaching for Quality Learning at University. 3rd Edition.
Maidenhead, UK: Open University Press, McGraw-Hill Education.
Bloom, B.S. & Krathwohl, D.R. 1984. Taxonomy of Educational Objectives. Handbook 1:
Cognitive Domain. Addison-Wesley, New York.
Brown, G., Bull, J. & Pendlebury, M. 1997. Assessing student learning in higher education.
London: Routledge.
Byrne, M., Finlayson, O., Flood, B., Lyons, O. & Willis, P. 2010. A comparison of the
learning approaches of accounting and science students at an Irish university. Journal
of Further and Higher Education, 34:3, 369-383.
Case, J.M. & Light, G. 2011. Emerging methodologies in engineering education
research. Journal of Engineering Education, 100(1), 186-210.
Cousin, G. 2009. Researching learning in higher education: an introduction to
contemporary methods and approaches. New York, NY: Routledge.
Elton, L. 1987. Teaching in Higher Education: Appraisal and Training. London, UK:
Kogan Page.
Felder, R.M. & Brent, R. 2003a. Designing and teaching courses to satisfy the ABET
engineering criteria. Journal of Engineering Education, 92(1), 7-25.
Felder, R.M. & Brent, R. 2003b. Learning by doing. Chemical Engineering Education,
37(4), 282-283.
Felder, R.M. & Brent, R. 2005. Understanding student differences. Journal of
Engineering Education. 94(1), 57-72.
Felder, R.M., Woods, D.R., Stice, J.E. & Rugarcia, A. 2000. The future of engineering
education II. Teaching methods that work. Chemical Engineering Education, 34(1), 26–
39.
Goldschmid, B. & Goldschmid, M.L. 1976. Peer Teaching in Higher Education: a
Review. Higher Education, 5(1976) 9-33
19
Heikkinen, E.-P. & Jaako, J. 2010. Context-free education – mission: impossible.
Proceedings of the Symposium of Engineering Education, December 9-10, 2010. Dipoli-
Reports B 2010:1. Espoo, FIN: Aalto University, Lifelong Learning Institute Dipoli.
Available online at:
http://opetuki2.tkk.fi/p/reflektori2010/documents/reflektori2010.pdf (accessed 27
April 2011).
Heikkinen, E.-P. ed. 2010. Student feedback compilation on course ‘Thermodynamics’.
Available online at: http://www.oulu.fi/pomet/477401A/tdtp-palaute-2010.pdf
(accessed 20 June 2011). In Finnish.
Hmelo-Silver, C.E. 2004. Problem-Based learning: What and how do students learn?
Educational Psychology Review, 16(3), 235-266.
Isaksson, S. 2008. Assess as you go: the effect of continuous assessment on student
learning during a short course in archeology. Assessment & Evaluation in Higher
Education. 33:1, 1-7.
Jaako, J. ed. 2011. Student feedback on course ‘Process optimization’. Available online at:
http://ntsat.oulu.fi/index.php?108 (accessed 11 May 2011). In Finnish.
Lines, D. & Gammie, E. 2004. Assessment methods report, Education Committee of the
International Federation of Accountants. Available online at:
http://www.ifac.org/Education/downloads/Assessment_Methods_Report.pdf
(accessed 27 April 2011).
Marton, F. & Säljö, R. 1976a. On qualitative differences in learning. I. Outcome and
process. British Journal of Educational Psychology, vol. 46, pp. 4-11.
Marton, F. & Säljö, R. 1976b. On qualitative differences in learning. II. Outcome as a
function of the learner’s conception of the task. British Journal of Educational
Psychology, vol. 46, pp. 115-127.
Maxwell, J. 1996. Qualitative research design. Thousand Oaks, CA: Sage.
Miller, A.H., Imrie, B.W. & Cox, K. 1998. Student Assessment in Higher Education.
London, UK: Kogan Page.
Price, M., O'Donovan, B. & Rust, C. 2007. Putting a social-constructivist assessment
process model into practice: building the feedback loop into the assessment process
through peer review. Innovations in Education and Teaching International. 44:2, pp. 143-
152.
Ramsden, P. 1979. Student learning and perceptions of academic environment. Higher
Education 8:411-427.
Ramsden, P. 1992. Learning to Teach in Higher Education. London, UK: Routledge.
Rowntree, D. 1987. Assessing students: how shall we know them? London: Kogan Page.
Scouller, K.M. & Prosser, M. 1994. Students’ experiences in studying for multiple-
choice question examinations. Studies in Higher Education, vol. 19, pp. 267-79.
20
Shute, V.J. 2008. Focus on Formative Feedback. Review of Educational Research. vol.
78. No. 1, pp. 163-189.
Sterman, J. D., 2000. Business Dynamics – Systems thinking and Modeling for a Complex
World. Boston, MA: McGraw-Hill.
Tang, K.C.C. 1992. Perceptions of task demand, strategy attributions and student
learning. Research and Development in Higher Education. 15: 474-481.
Trigwell, K., 2003. Judging university teaching. International Journal for Academic
Development, 6:1, pp. 65-73
Trotter, E. 2006. Student perceptions of continuous summative assessment.
Assessment & Evaluation in Higher Education, 31: 5, 505-521.
Taylor, C. 1994. Assessment for measurement or standards: the peril and promise of
large-scale assessment reform. American Educational Research Journal, 31: 231-262.
Wankat, P.C. & Oreovicz, F.S. (1993) Teaching engineering. New York: McGraw-Hill.
Available online at:
https://engineering.purdue.edu/ChE/AboutUs/Publications/TeachingEng/index.html
(accessed 3 May 2011).
Yin, R.K. 1987. Case Study Research: Design and Methods. Beverly Hills, CA.: Sage
Publications.
ISBN 978-951-42-9721-2 ISSN 1238-9390
University of Oulu Control Engineering Laboratory – Series A
Series Editor: Juha Jaako, D.Sc.
29. Ruusunen M, Monitoring of small-scale biomass combustion processes. 28 p. March 2006. ISBN
951-42-8027-X. ISBN 951-42-8028-8 (pdf).
30. Gebus S, Fournier G, Vittoz C & Ruusunen M, Knowledge extraction for optimizing
monitorability and controllability on a production line. 36 p. March 2006. ISBN 951-42-9390-X
31. Sorsa A & Leiviskä K, State detection in the biological water treatment process. 53 p.
November 2006. ISBN 951-42-8273-6
32. Mäyrä O, Ahola T & Leiviskä K, Time delay estimation and variable grouping using genetic
algorithms. 22 p. November 2006. ISBN 951-42-8297-3
33. Paavola M, Wireless Technologies in Process Automation - A Review and an Application Example.
46 p. December 2007. ISBN 978-951-42-8705-3
34. Peltokangas R & Sorsa A, Real-coded genetic algorithms and nonlinear parameter identification.
28 p. April 2008. ISBN 978-951-42-8785-5. ISBN 978-951-42-8786-2 (pdf).
35. Rami-Yahyaoui O, Gebus S, Juuso E & Ruusunen M, Failure mode identification through
linguistic equations and genetic algorithms. August 2008. ISBN 978-951-42-8849-4, ISBN 978-
951-42-8850-0 (pdf).
36. Juuso E, Ahola T & Leiviskä K, Variable selection and grouping. August 2008. ISBN 978-951-
42-8851-7. ISBN 978-951-42-8852-4 (pdf).
37. Mäyrä O & Leiviskä K, Modelling in methanol synthesis. December 2008. ISBN 978-951-42-
9014-5
38. Ohenoja M, One- and two-dimensional control of paper machine: a literature review. October
2009. ISBN 978-951-42-9316-0
39. Paavola M & Leiviskä K, ESNA – European Sensor Network Architecture. Final Report. 12 p. December 2009. ISBN 978-951-42-6091-9
40. Virtanen V & Leiviskä K, Process Optimization for Hydrogen Production using Methane,
Methanol or Ethanol. December 2009. ISBN 978-951-42-6102-2
41. Keskitalo J & Leiviskä K, Mechanistic modelling of pulp and paper mill wastewater treatment
plants. January 2010. ISBN 978-951-42-6110-7
42. Kiuttu J, Ruuska J & Yliniemi L, Advanced and sustainable beneficiation of platinum group
metals (PGM) in sulphide poor platinum (PGE) deposits – BEGBE. Final Report. May 2010. ISBN
978-951-42-6234-0.
43. Ohenoja M, Isokangas A & Leiviskä K, Simulation studies of paper machine basis weight
control. August 2010. ISBN 978-951-42-6271-5.
44. Sorsa A, Koskenniemi A & Leiviskä K, Evolutionary algorithms in nonlinear model identification.
September 2010. ISBN 978-951-42-6332-3.
45. Ohenoja M, Application feasibility study of 2D control methods. September 2010. ISBN 978-
951-42-6334-7.
46. Ruusunen M, Uusitalo J, Ohenoja M & Leiviskä K, Model Predictive Control and Differential
Evolution optimisation of the fuel cell process. January 2011. ISBN 978-951-42-9376-4 (pdf).
47. Isokangas A & Leiviskä K, Analysis of formation and floc size on the basis of optical
transmittance. June 2011. ISBN 978-951-42-9583-6.