Embed Size (px)
Citation preview

Continuous Energy Improvement Pilot EvaluationVermont Public Service Department2014 – 2015
July 26, 2016
2
1. Pilot Overview2. Research Objectives3. Methods4. Key Findings5. Conclusions
Agenda

Pilot Overview
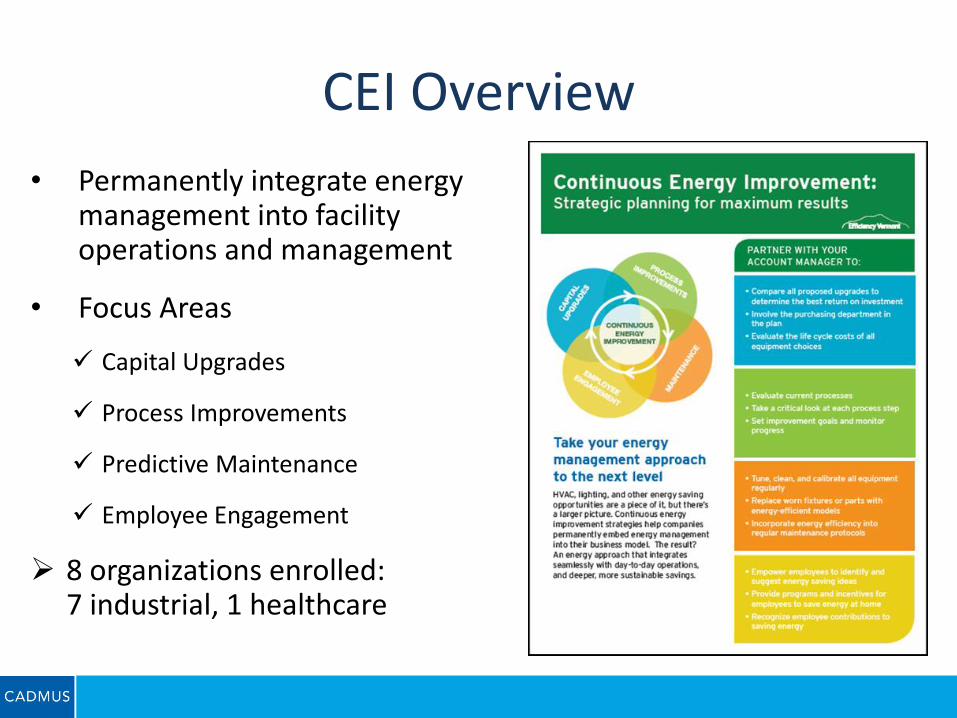
CEI Overview
• Permanently integrate energy management into facility operations and management
• Focus Areas
Capital Upgrades
Process Improvements
Predictive Maintenance
Employee Engagement
8 organizations enrolled: 7 industrial, 1 healthcare
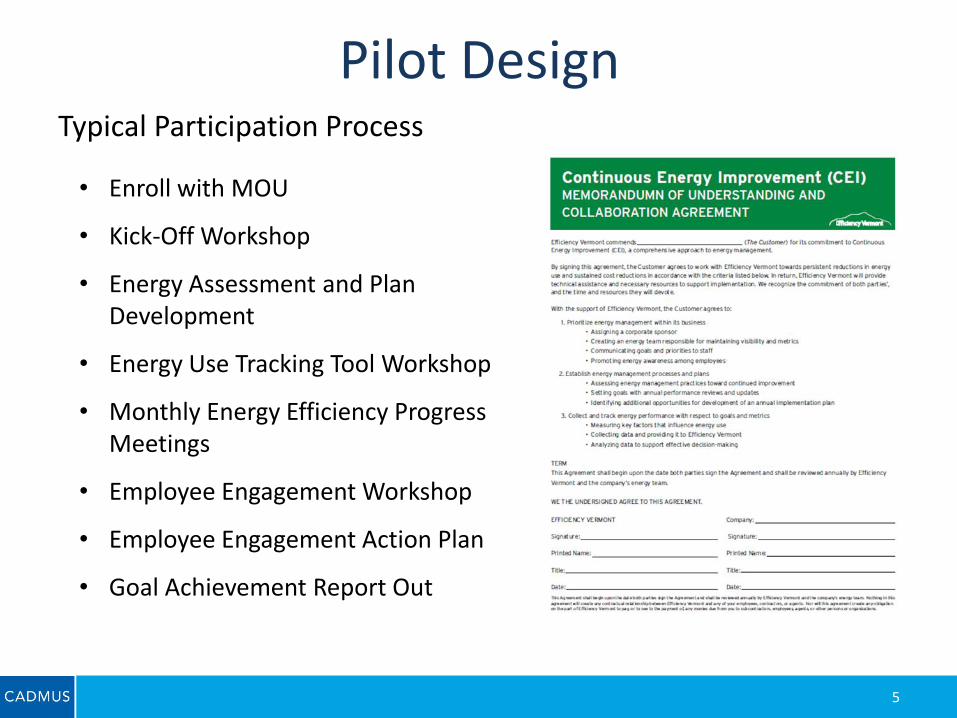
Pilot Design
5
Typical Participation Process
• Enroll with MOU
• Kick-Off Workshop
• Energy Assessment and Plan Development
• Energy Use Tracking Tool Workshop
• Monthly Energy Efficiency Progress Meetings
• Employee Engagement Workshop
• Employee Engagement Action Plan
• Goal Achievement Report Out
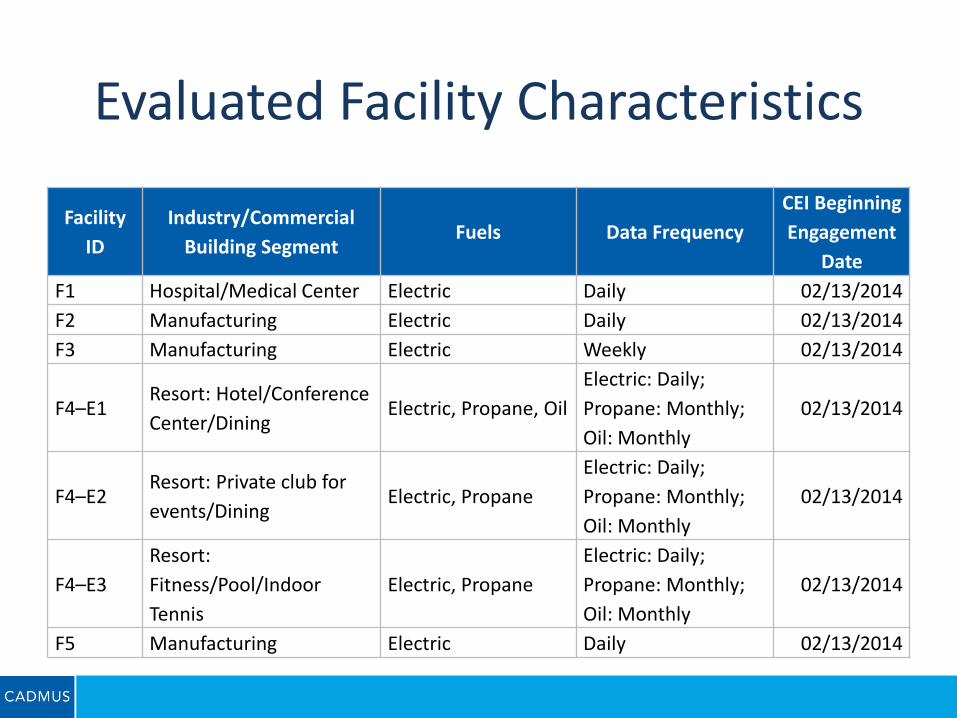
Evaluated Facility Characteristics
Facility
ID
Industry/Commercial
Building SegmentFuels Data Frequency
CEI Beginning
Engagement
Date
F1 Hospital/Medical Center Electric Daily 02/13/2014
F2 Manufacturing Electric Daily 02/13/2014
F3 Manufacturing Electric Weekly 02/13/2014
F4–E1Resort: Hotel/Conference
Center/DiningElectric, Propane, Oil
Electric: Daily;
Propane: Monthly;
Oil: Monthly
02/13/2014
F4–E2Resort: Private club for
events/DiningElectric, Propane
Electric: Daily;
Propane: Monthly;
Oil: Monthly
02/13/2014
F4–E3
Resort:
Fitness/Pool/Indoor
Tennis
Electric, Propane
Electric: Daily;
Propane: Monthly;
Oil: Monthly
02/13/2014
F5 Manufacturing Electric Daily 02/13/2014

Research Objectives
Research Objectives
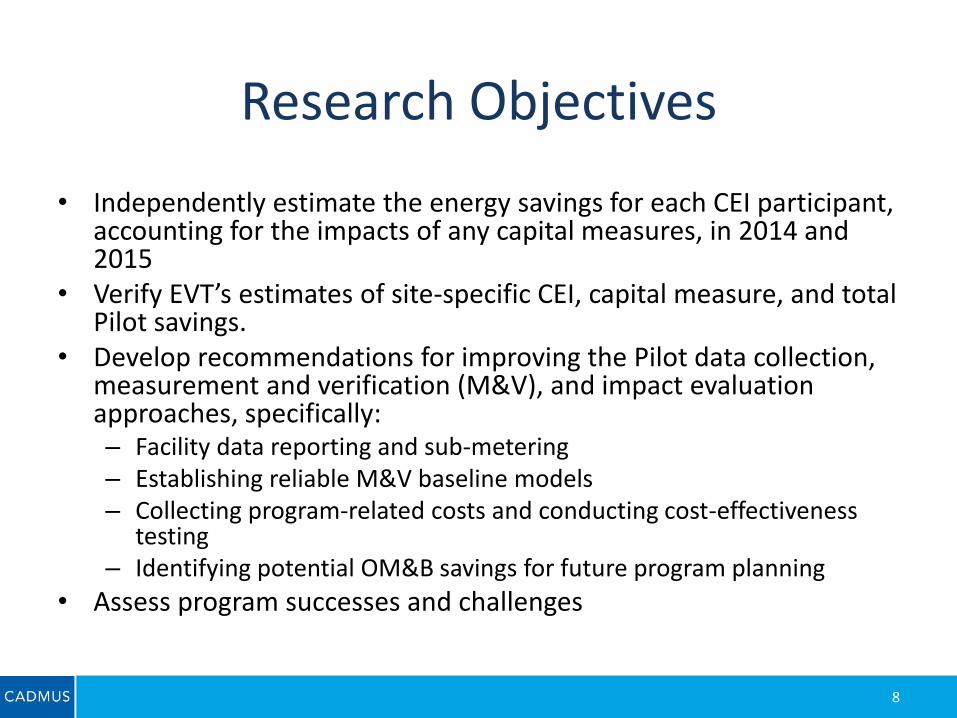
• Independently estimate the energy savings for each CEI participant, accounting for the impacts of any capital measures, in 2014 and 2015
• Verify EVT’s estimates of site-specific CEI, capital measure, and total Pilot savings.
• Develop recommendations for improving the Pilot data collection, measurement and verification (M&V), and impact evaluation approaches, specifically:– Facility data reporting and sub-metering– Establishing reliable M&V baseline models– Collecting program-related costs and conducting cost-effectiveness
testing– Identifying potential OM&B savings for future program planning
• Assess program successes and challenges
8

Evaluation ActivitiesProcess Evaluation
In-depth staff interviews
Pilot document review
Participant interviews
Impact Evaluation
Analysis of first-year pilot outcomes as reported in annual reports
Collect facility-level energy use data
Regression analysis of each site’s energy use and savings estimation
Estimate pilot savings for 2014 and 2015
Analyze pilot cost-effectiveness
Synthesis
Provided technical expertise and consultation to produce findings that informed actionable recommendations for the CEI Pilot
Entertained alternate scenarios for measure life

Methods
In-Depth Interviews
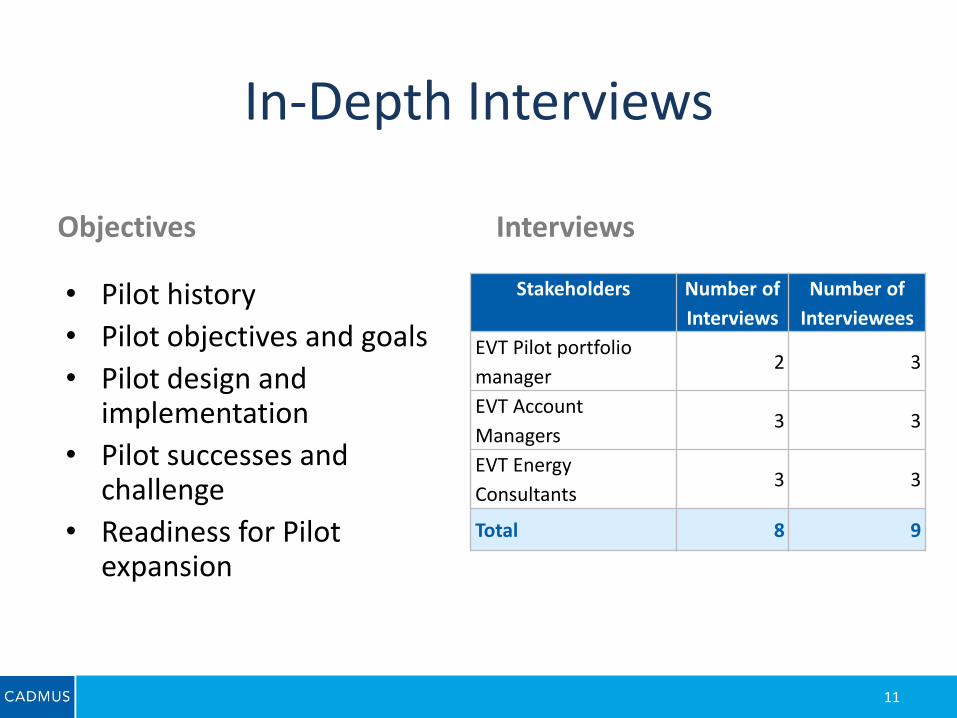
Objectives
• Pilot history
• Pilot objectives and goals
• Pilot design and implementation
• Pilot successes and challenge
• Readiness for Pilot expansion
Interviews
11
Stakeholders Number of
Interviews
Number of
Interviewees
EVT Pilot portfolio
manager2 3
EVT Account
Managers3 3
EVT Energy
Consultants3 3
Total 8 9
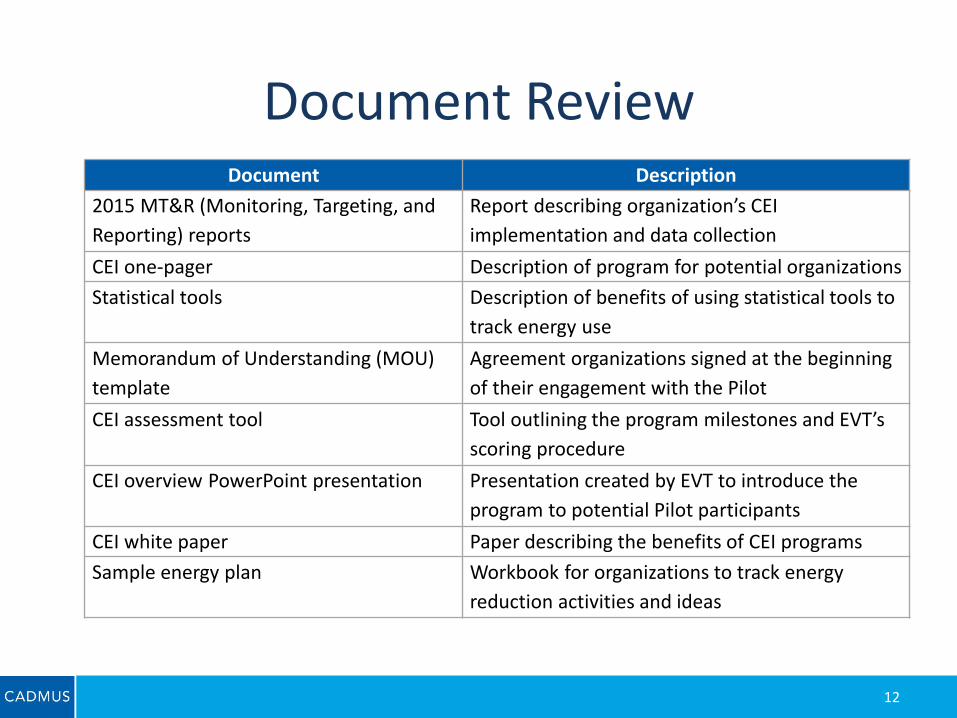
Document ReviewDocument Description
2015 MT&R (Monitoring, Targeting, and
Reporting) reports
Report describing organization’s CEI
implementation and data collection
CEI one-pager Description of program for potential organizations
Statistical tools Description of benefits of using statistical tools to
track energy use
Memorandum of Understanding (MOU)
template
Agreement organizations signed at the beginning
of their engagement with the Pilot
CEI assessment tool Tool outlining the program milestones and EVT’s
scoring procedure
CEI overview PowerPoint presentation Presentation created by EVT to introduce the
program to potential Pilot participants
CEI white paper Paper describing the benefits of CEI programs
Sample energy plan Workbook for organizations to track energy
reduction activities and ideas
12
Impact Method
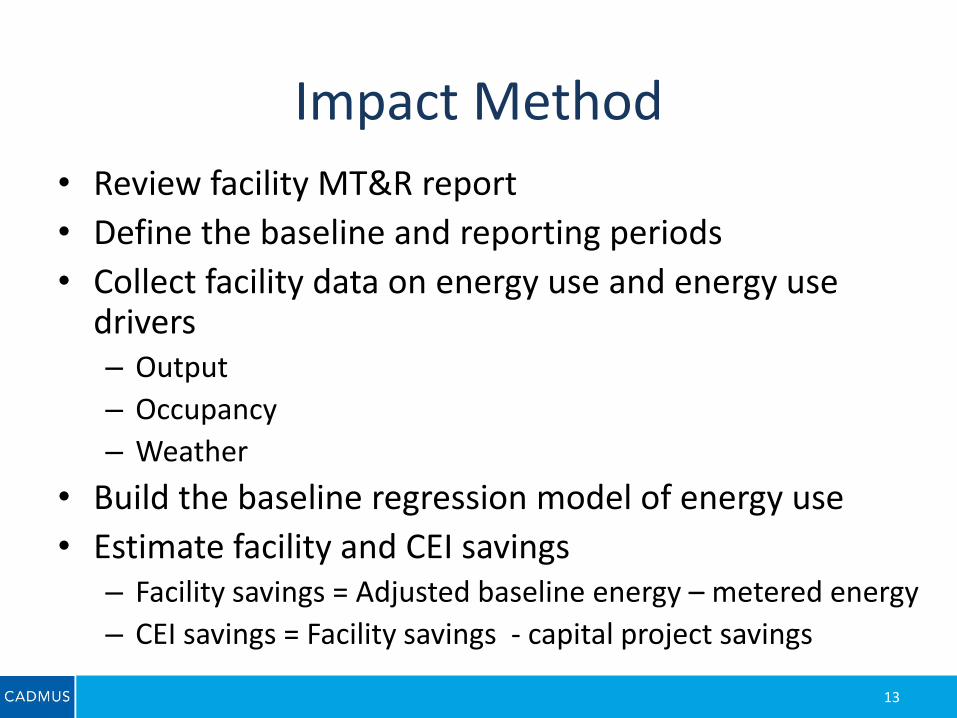
• Review facility MT&R report
• Define the baseline and reporting periods
• Collect facility data on energy use and energy use drivers– Output
– Occupancy
– Weather
• Build the baseline regression model of energy use
• Estimate facility and CEI savings– Facility savings = Adjusted baseline energy – metered energy
– CEI savings = Facility savings - capital project savings
13
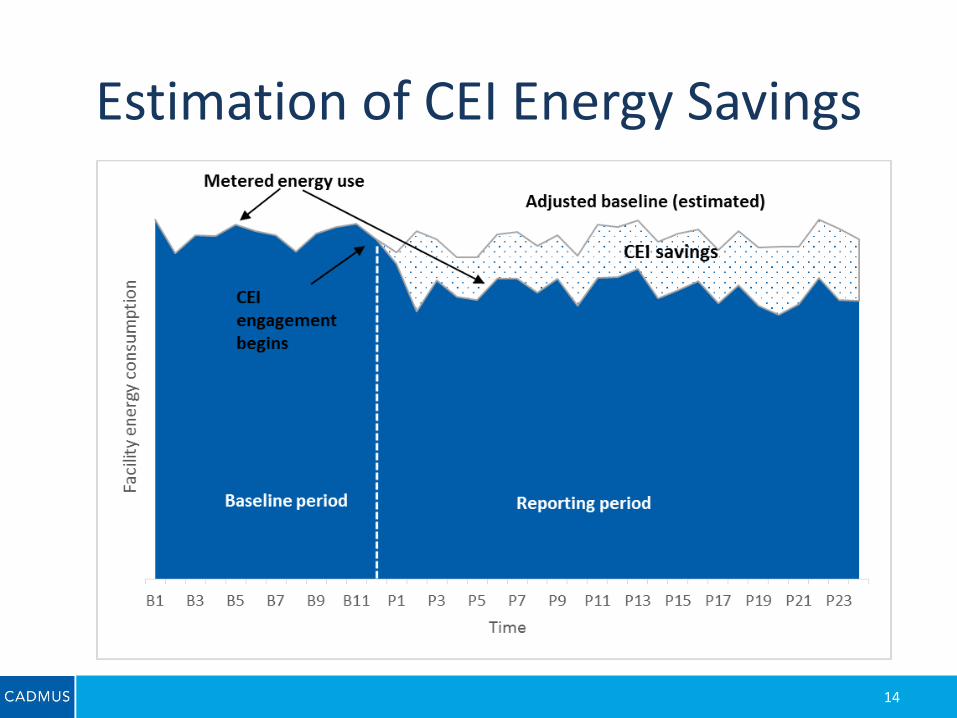
Estimation of CEI Energy Savings
14
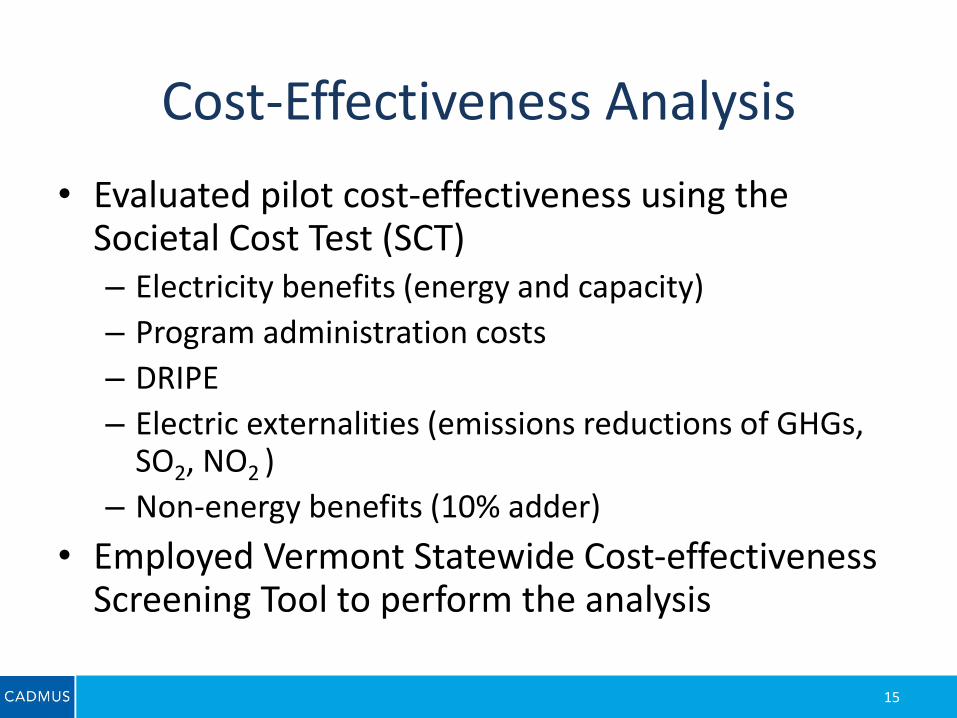
Cost-Effectiveness Analysis
• Evaluated pilot cost-effectiveness using the Societal Cost Test (SCT)– Electricity benefits (energy and capacity)
– Program administration costs
– DRIPE
– Electric externalities (emissions reductions of GHGs, SO2, NO2 )
– Non-energy benefits (10% adder)
• Employed Vermont Statewide Cost-effectiveness Screening Tool to perform the analysis
15

16
Key Findings
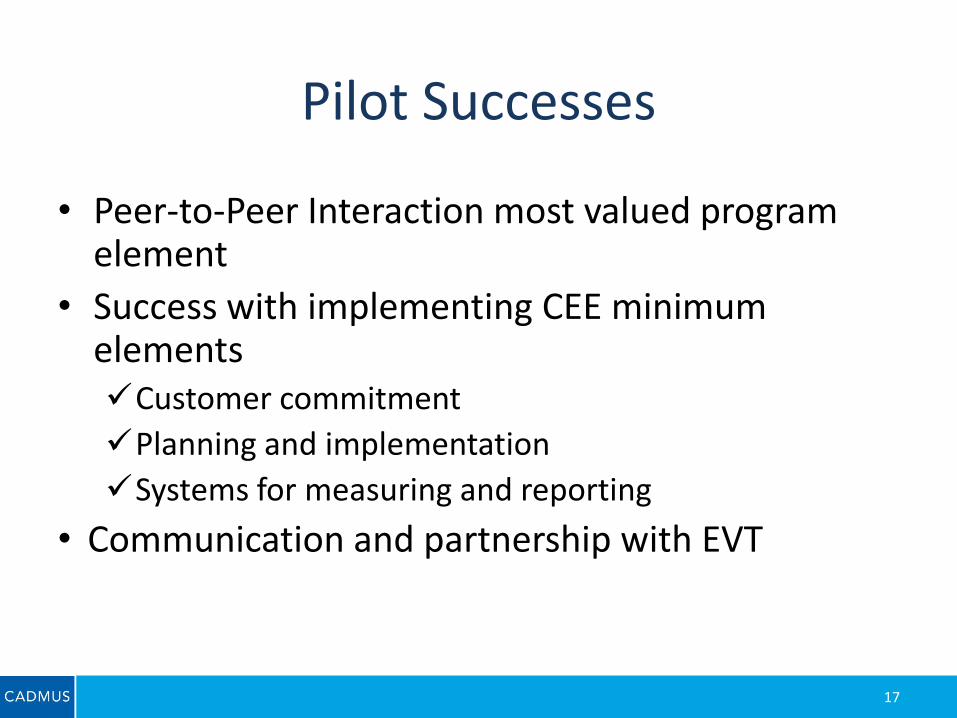
Pilot Successes
• Peer-to-Peer Interaction most valued program element
• Success with implementing CEE minimum elementsCustomer commitment
Planning and implementation
Systems for measuring and reporting
• Communication and partnership with EVT
17
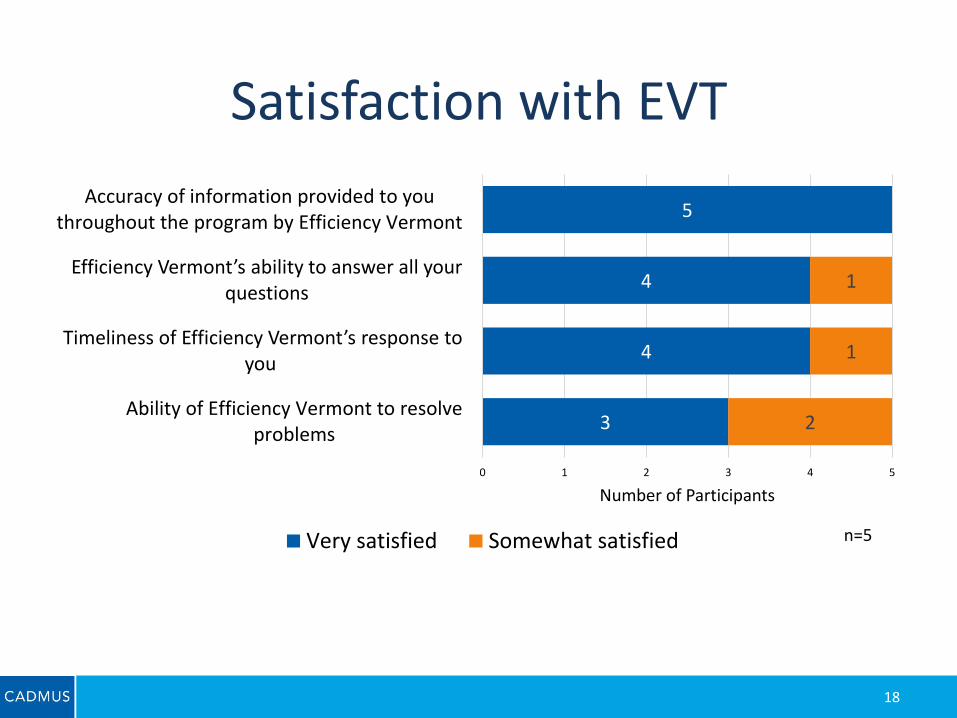
Satisfaction with EVT
18
3
4
4
5
2
1
1
0 1 2 3 4 5
Ability of Efficiency Vermont to resolveproblems
Timeliness of Efficiency Vermont’s response to you
Efficiency Vermont’s ability to answer all your questions
Accuracy of information provided to youthroughout the program by Efficiency Vermont
Number of Participants
Very satisfied Somewhat satisfied n=5
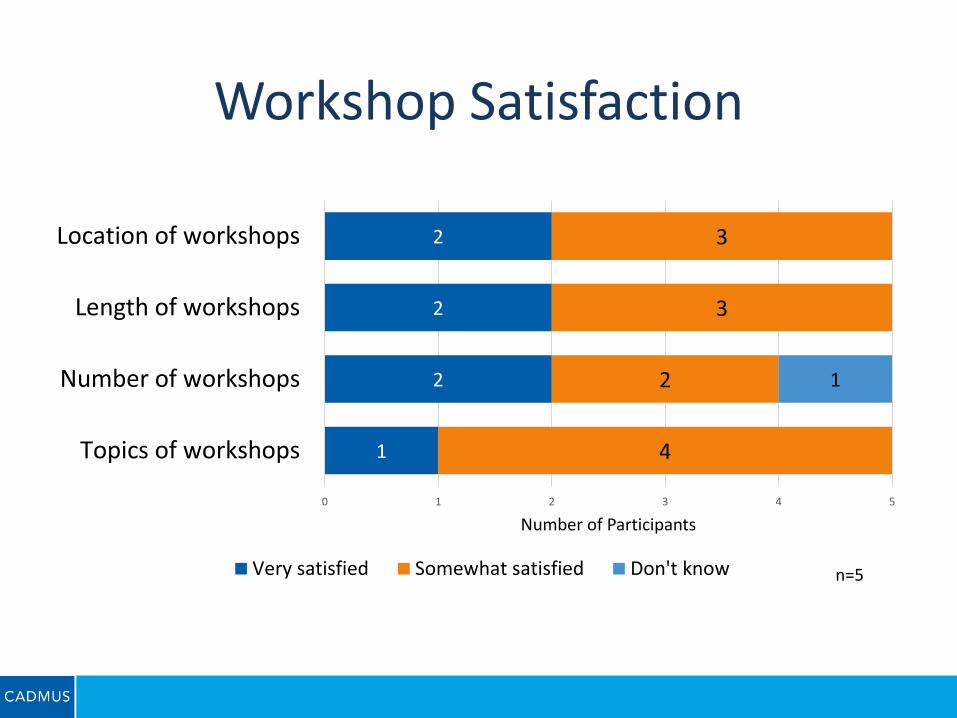
Workshop Satisfaction
1
2
2
2
4
2
3
3
1
0 1 2 3 4 5
Topics of workshops
Number of workshops
Length of workshops
Location of workshops
Number of Participants
Very satisfied Somewhat satisfied Don't know n=5
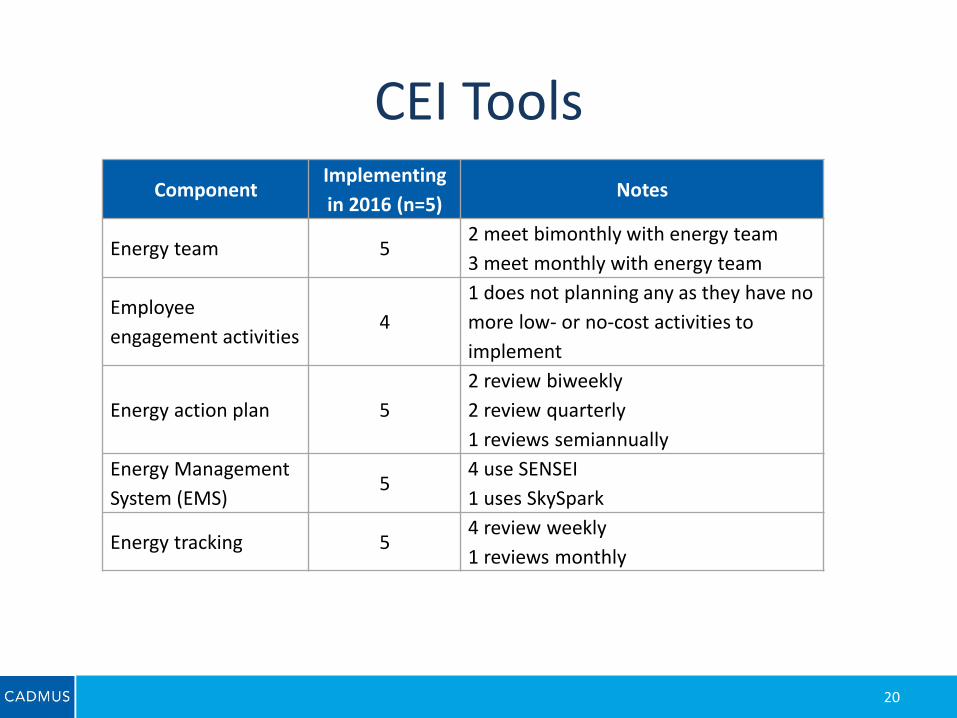
CEI Tools
ComponentImplementing
in 2016 (n=5)Notes
Energy team 52 meet bimonthly with energy team
3 meet monthly with energy team
Employee
engagement activities4
1 does not planning any as they have no
more low- or no-cost activities to
implement
Energy action plan 5
2 review biweekly
2 review quarterly
1 reviews semiannually
Energy Management
System (EMS)5
4 use SENSEI
1 uses SkySpark
Energy tracking 54 review weekly
1 reviews monthly
20
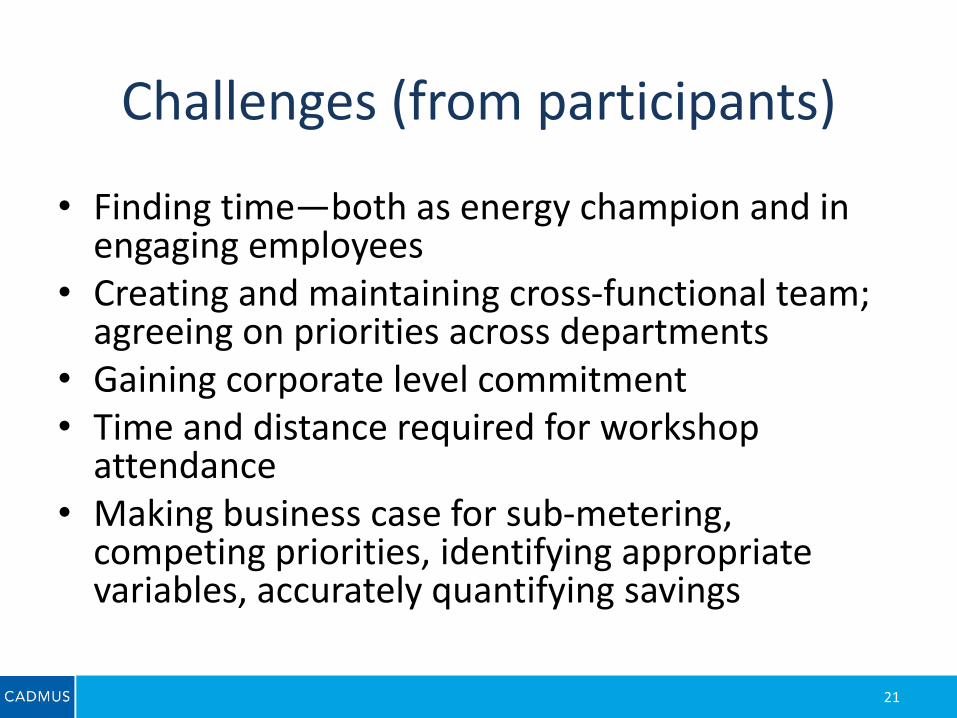
Challenges (from participants)
• Finding time—both as energy champion and in engaging employees
• Creating and maintaining cross-functional team; agreeing on priorities across departments
• Gaining corporate level commitment • Time and distance required for workshop
attendance• Making business case for sub-metering,
competing priorities, identifying appropriate variables, accurately quantifying savings
21

Impact Evaluation Findings
22
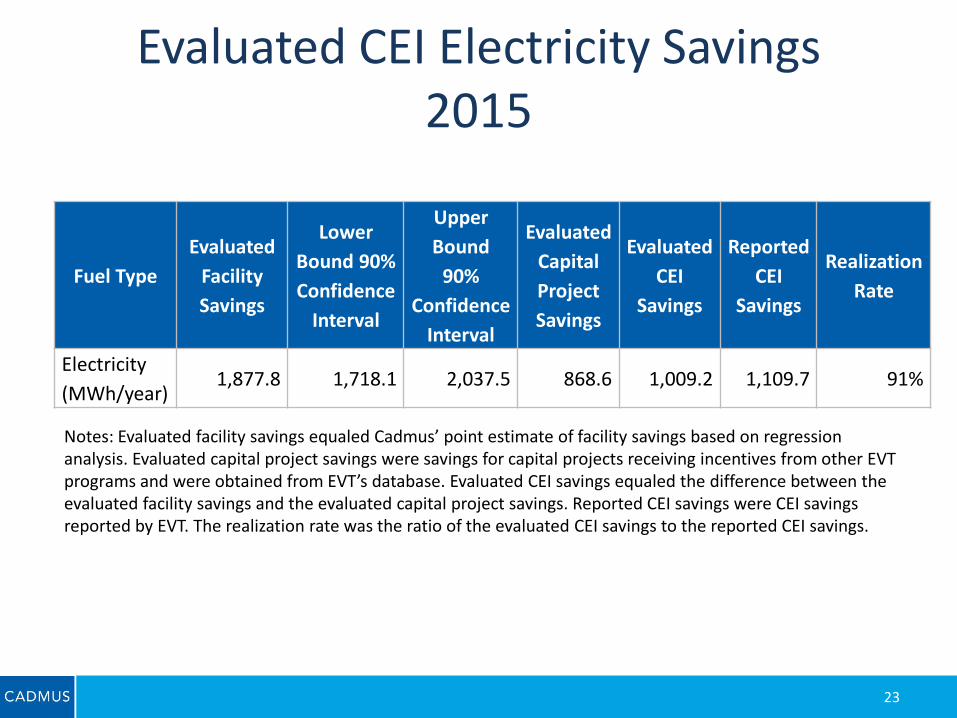
Evaluated CEI Electricity Savings2015
23
Fuel Type
Evaluated
Facility
Savings
Lower
Bound 90%
Confidence
Interval
Upper
Bound
90%
Confidence
Interval
Evaluated
Capital
Project
Savings
Evaluated
CEI
Savings
Reported
CEI
Savings
Realization
Rate
Electricity
(MWh/year)1,877.8 1,718.1 2,037.5 868.6 1,009.2 1,109.7 91%
Notes: Evaluated facility savings equaled Cadmus’ point estimate of facility savings based on regression analysis. Evaluated capital project savings were savings for capital projects receiving incentives from other EVT programs and were obtained from EVT’s database. Evaluated CEI savings equaled the difference between the evaluated facility savings and the evaluated capital project savings. Reported CEI savings were CEI savings reported by EVT. The realization rate was the ratio of the evaluated CEI savings to the reported CEI savings.
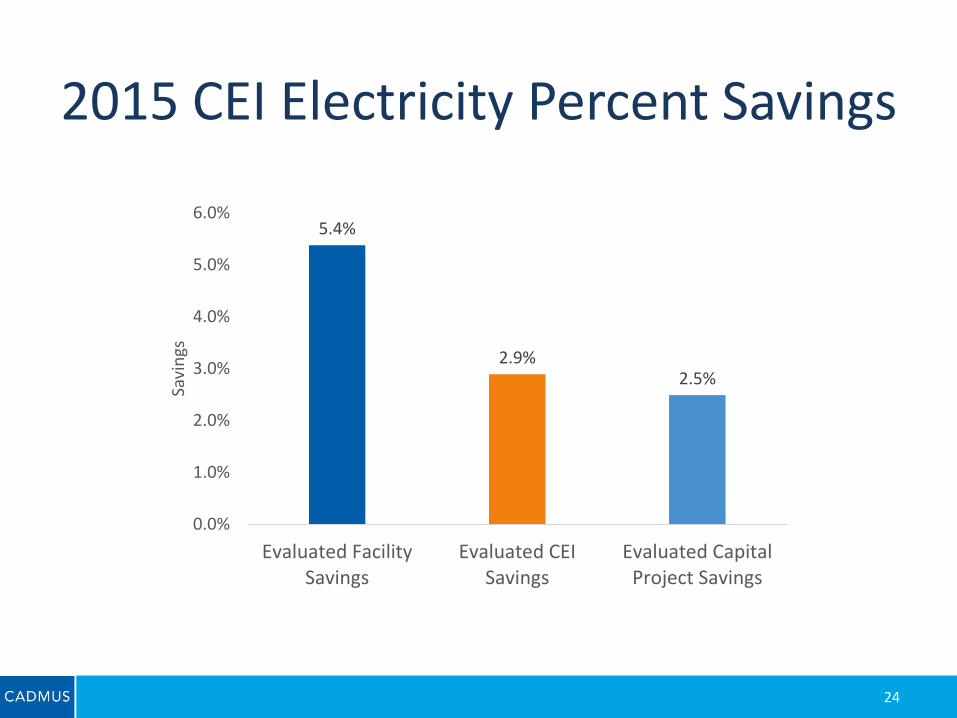
2015 CEI Electricity Percent Savings
24
5.4%
2.9%2.5%
0.0%
1.0%
2.0%
3.0%
4.0%
5.0%
6.0%
Evaluated FacilitySavings
Evaluated CEISavings
Evaluated CapitalProject Savings
Savi
ngs
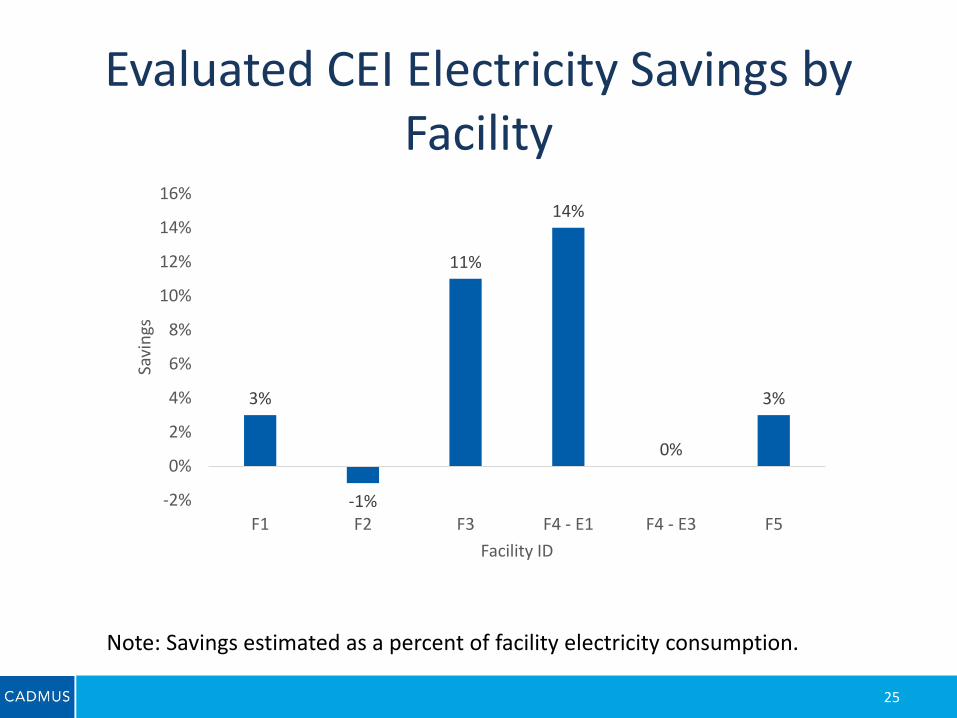
Evaluated CEI Electricity Savings by Facility
25
Note: Savings estimated as a percent of facility electricity consumption.
3%
-1%
11%
14%
0%
3%
-2%
0%
2%
4%
6%
8%
10%
12%
14%
16%
F1 F2 F3 F4 - E1 F4 - E3 F5
Savi
ngs
Facility ID
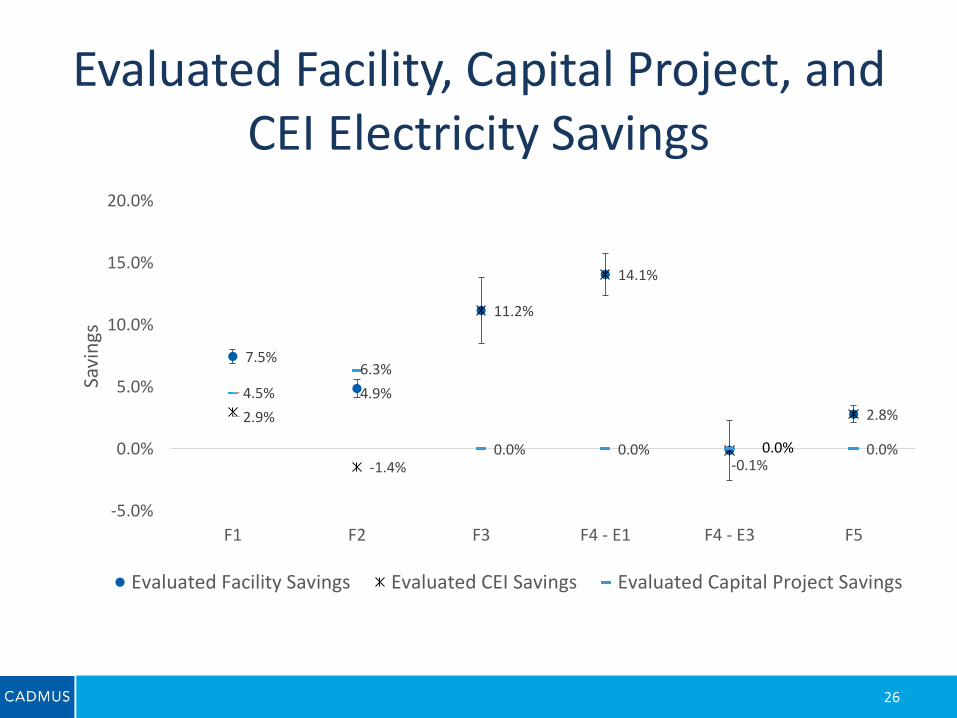
Evaluated Facility, Capital Project, and CEI Electricity Savings
26
7.5%
4.9%
11.2%
14.1%
2.8%2.9%
-1.4% -0.1%
4.5%
6.3%
0.0% 0.0% 0.0%
-5.0%
0.0%
5.0%
10.0%
15.0%
20.0%
F1 F2 F3 F4 - E1 F4 - E3 F5
Savi
ngs
Evaluated Facility Savings Evaluated CEI Savings Evaluated Capital Project Savings
0.0%
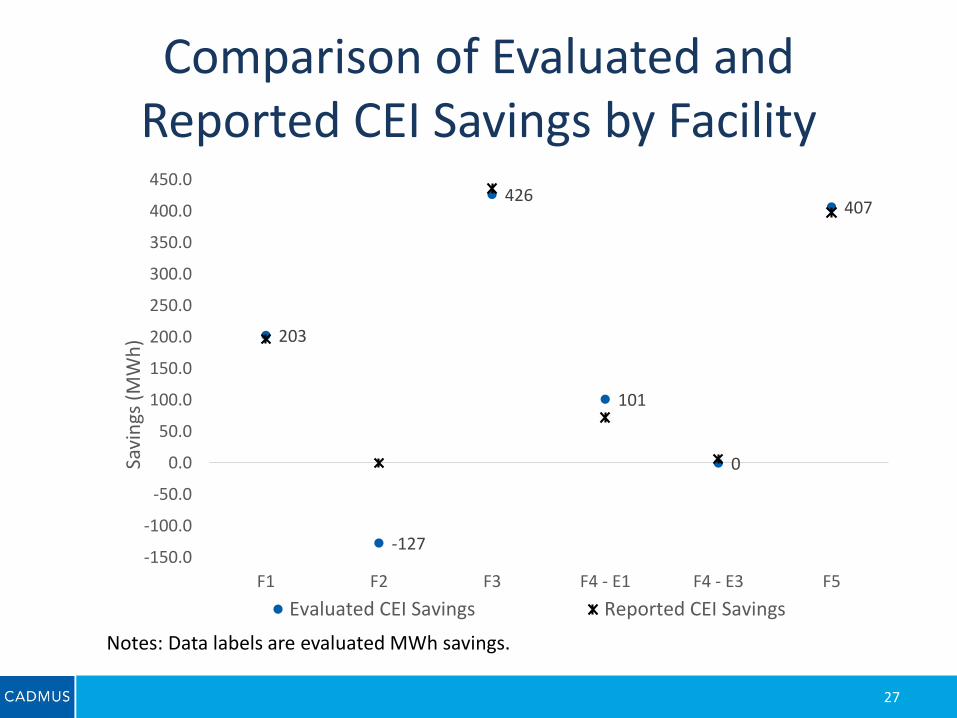
Comparison of Evaluated and Reported CEI Savings by Facility
27
203
-127
426
101
0
407
-150.0
-100.0
-50.0
0.0
50.0
100.0
150.0
200.0
250.0
300.0
350.0
400.0
450.0
F1 F2 F3 F4 - E1 F4 - E3 F5
Savi
ngs
(M
Wh
)
Evaluated CEI Savings Reported CEI Savings
Notes: Data labels are evaluated MWh savings.
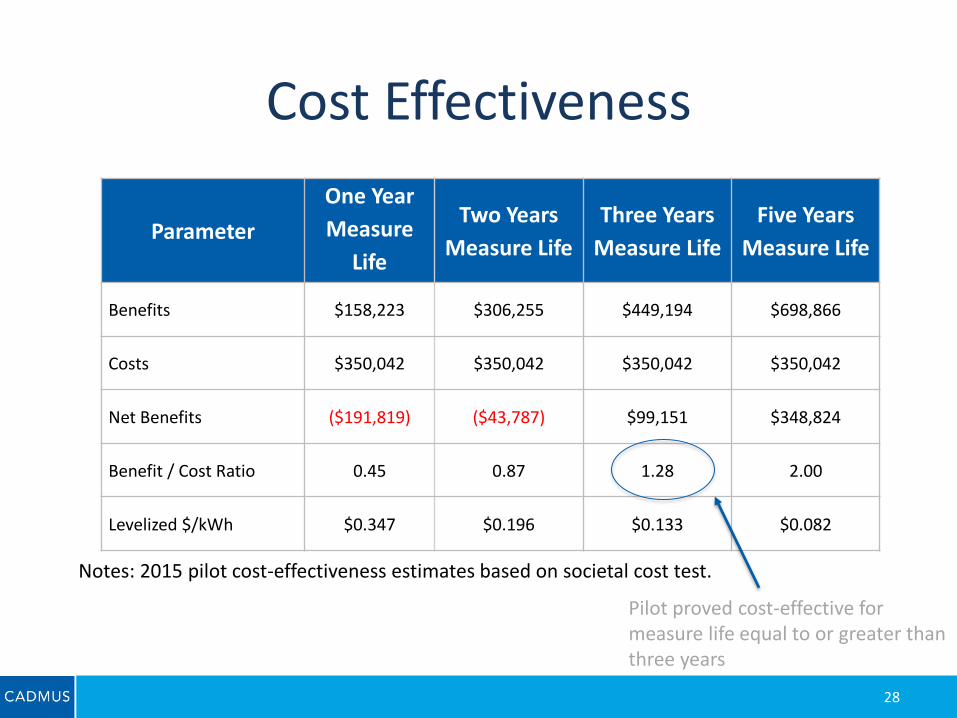
Cost Effectiveness
28
Parameter
One Year
Measure
Life
Two Years
Measure Life
Three Years
Measure Life
Five Years
Measure Life
Benefits $158,223 $306,255 $449,194 $698,866
Costs $350,042 $350,042 $350,042 $350,042
Net Benefits ($191,819) ($43,787) $99,151 $348,824
Benefit / Cost Ratio 0.45 0.87 1.28 2.00
Levelized $/kWh $0.347 $0.196 $0.133 $0.082
Notes: 2015 pilot cost-effectiveness estimates based on societal cost test.
Pilot proved cost-effective for measure life equal to or greater than three years

29
Conclusions
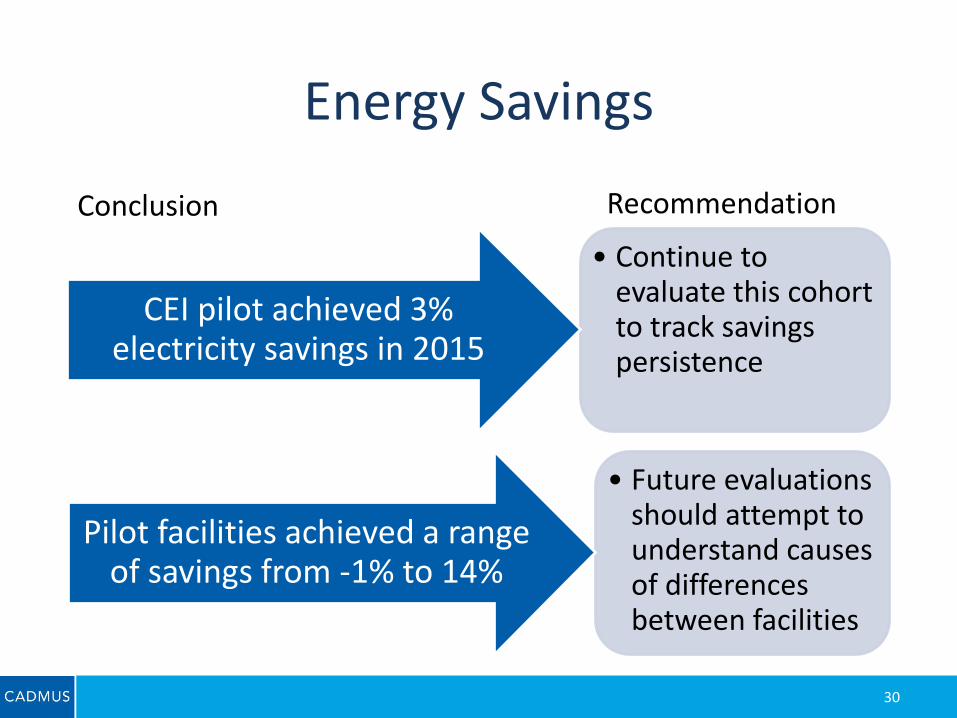
Energy Savings
30
• Continue to evaluate this cohort to track savings persistence
CEI pilot achieved 3% electricity savings in 2015
• Future evaluations should attempt to understand causes of differences between facilities
Pilot facilities achieved a range of savings from -1% to 14%
Conclusion Recommendation
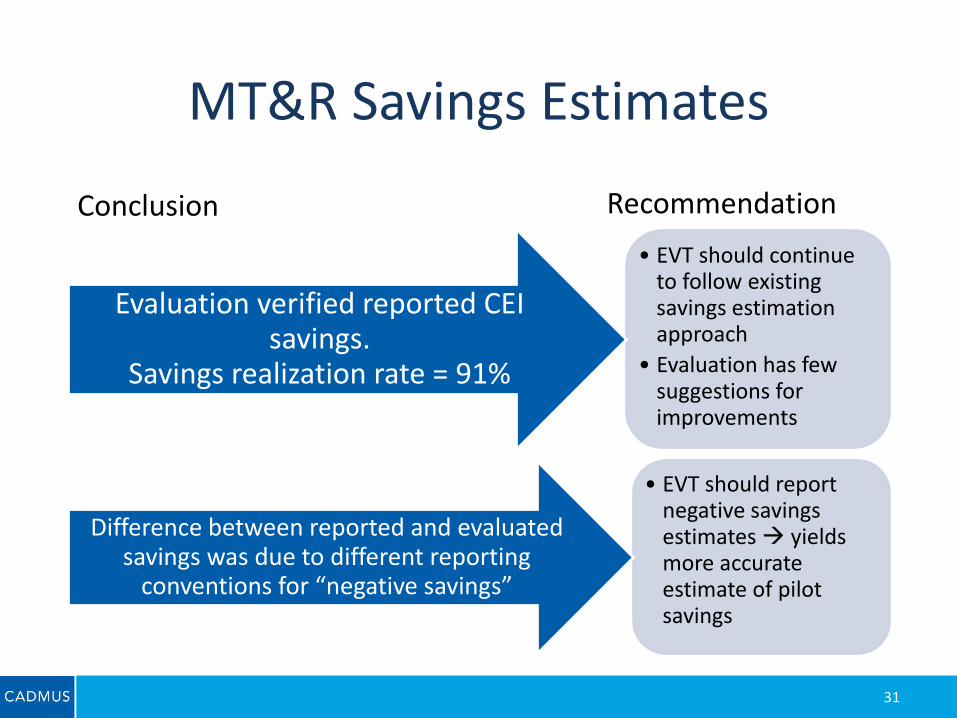
MT&R Savings Estimates
31
• EVT should continue to follow existing savings estimation approach
• Evaluation has few suggestions for improvements
Evaluation verified reported CEI savings.
Savings realization rate = 91%
• EVT should report negative savings estimates yields more accurate estimate of pilot savings
Difference between reported and evaluated savings was due to different reporting
conventions for “negative savings”
Conclusion Recommendation
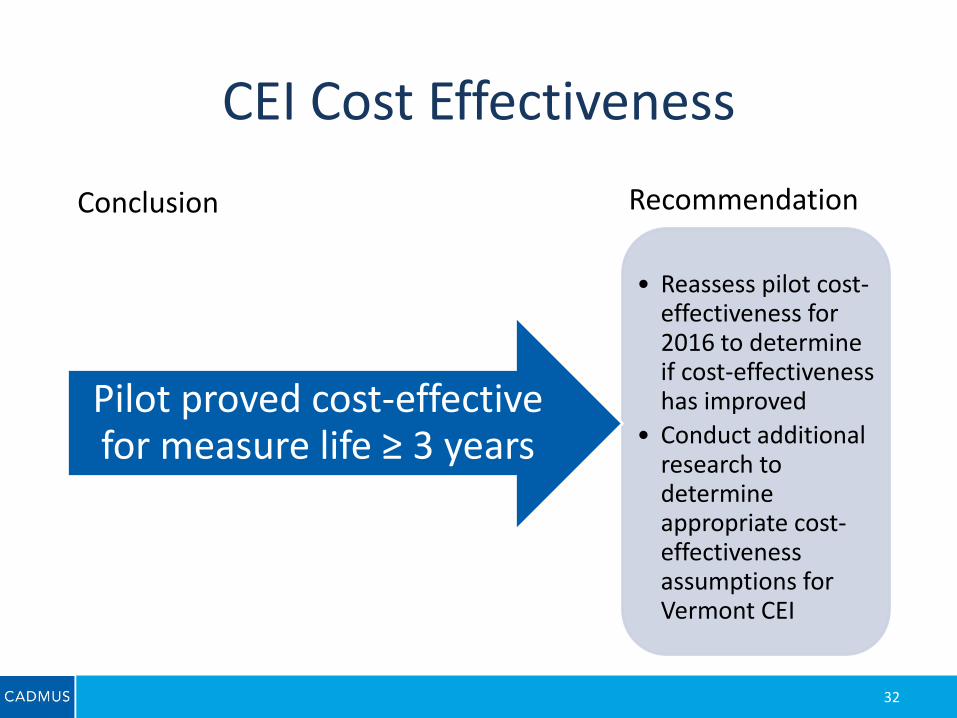
CEI Cost Effectiveness
32
• Reassess pilot cost-effectiveness for 2016 to determine if cost-effectiveness has improved
• Conduct additional research to determine appropriate cost-effectiveness assumptions for Vermont CEI
Pilot proved cost-effective for measure life ≥ 3 years
Conclusion Recommendation
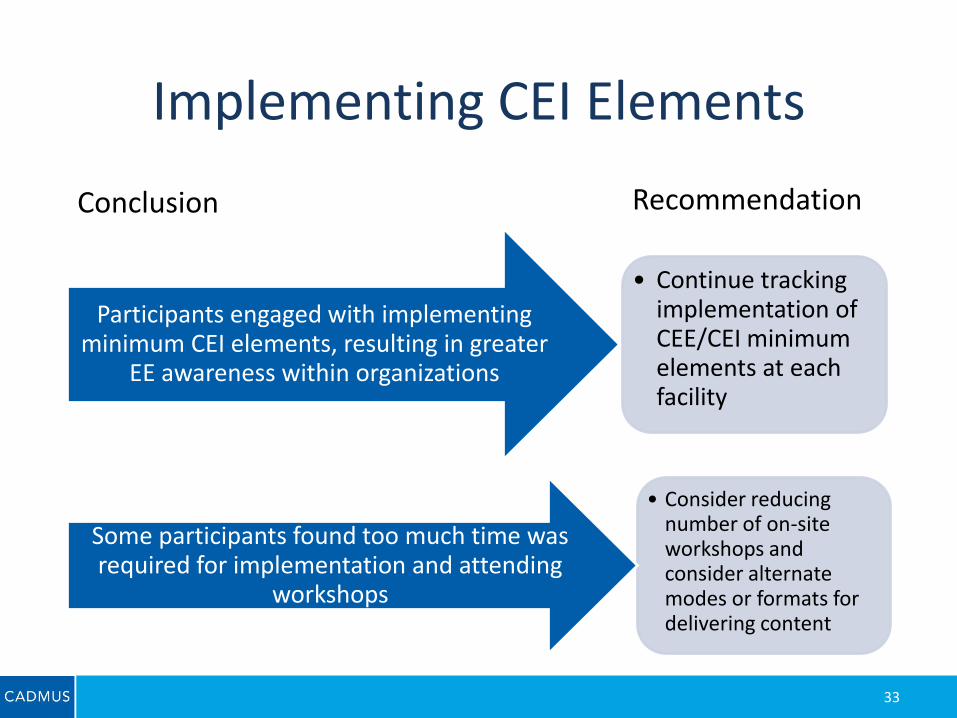
Implementing CEI Elements
33
• Continue tracking implementation of CEE/CEI minimum elements at each facility
Participants engaged with implementing minimum CEI elements, resulting in greater
EE awareness within organizations
• Consider reducing number of on-site workshops and consider alternate modes or formats for delivering content
Some participants found too much time was required for implementation and attending
workshops
Conclusion Recommendation
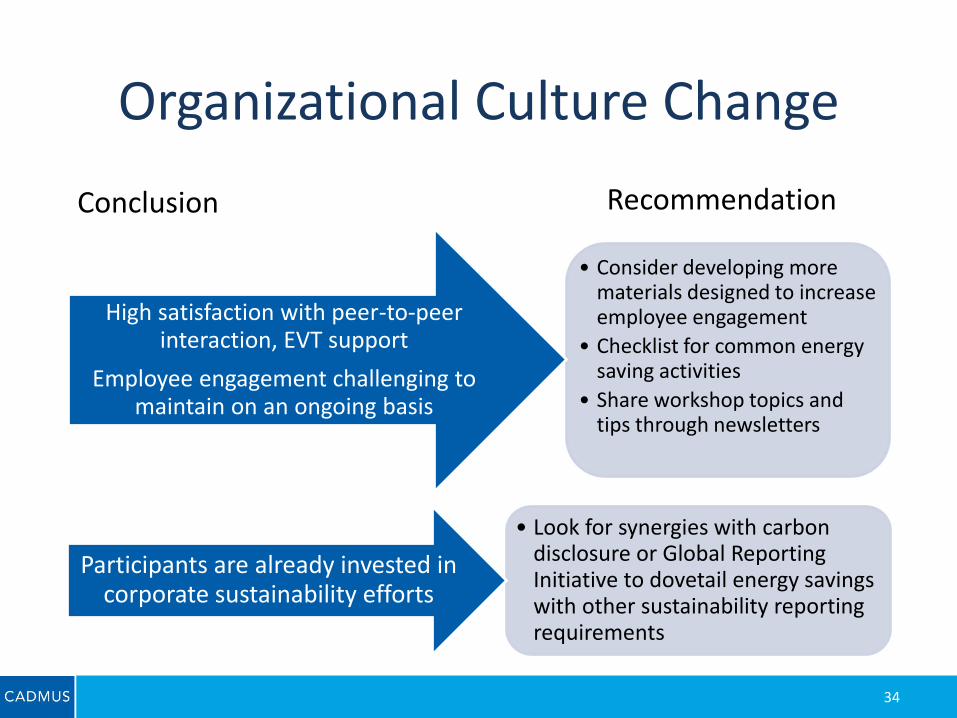
Organizational Culture Change
34
• Consider developing more materials designed to increase employee engagement
• Checklist for common energy saving activities
• Share workshop topics and tips through newsletters
High satisfaction with peer-to-peer interaction, EVT support
Employee engagement challenging to maintain on an ongoing basis
• Look for synergies with carbon disclosure or Global Reporting Initiative to dovetail energy savings with other sustainability reporting requirements
Participants are already invested in corporate sustainability efforts
Conclusion Recommendation
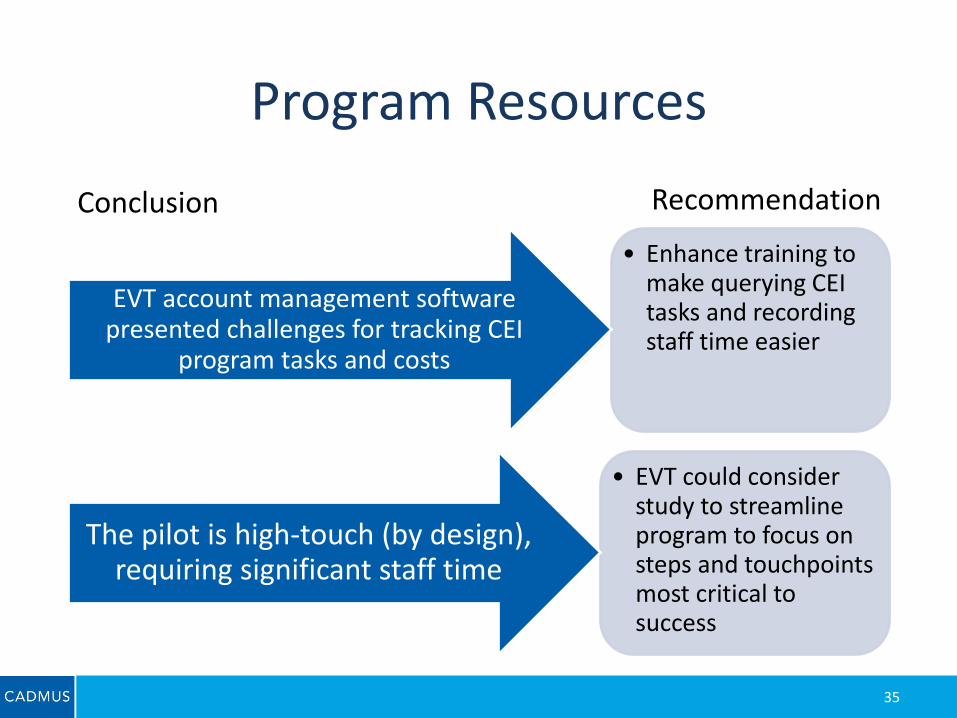
Program Resources
35
• Enhance training to make querying CEI tasks and recording staff time easier
EVT account management software presented challenges for tracking CEI
program tasks and costs
• EVT could consider study to streamline program to focus on steps and touchpoints most critical to success
The pilot is high-touch (by design), requiring significant staff time
Conclusion Recommendation

QUESTIONS/DISCUSSION
36
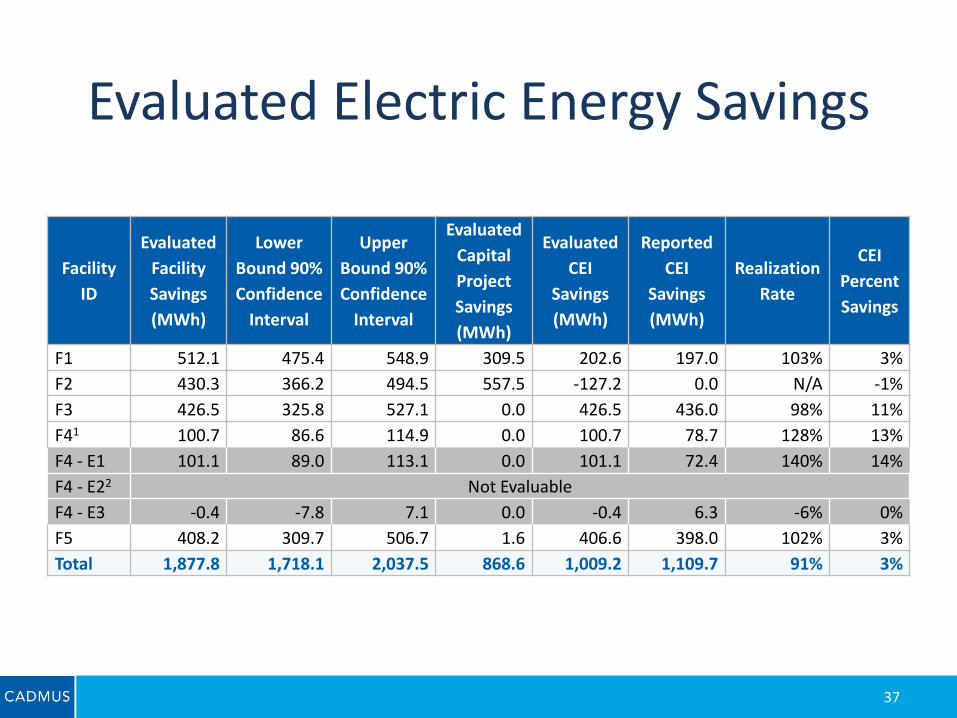
Evaluated Electric Energy Savings
37
Facility
ID
Evaluated
Facility
Savings
(MWh)
Lower
Bound 90%
Confidence
Interval
Upper
Bound 90%
Confidence
Interval
Evaluated
Capital
Project
Savings
(MWh)
Evaluated
CEI
Savings
(MWh)
Reported
CEI
Savings
(MWh)
Realization
Rate
CEI
Percent
Savings
F1 512.1 475.4 548.9 309.5 202.6 197.0 103% 3%
F2 430.3 366.2 494.5 557.5 -127.2 0.0 N/A -1%
F3 426.5 325.8 527.1 0.0 426.5 436.0 98% 11%
F41 100.7 86.6 114.9 0.0 100.7 78.7 128% 13%
F4 - E1 101.1 89.0 113.1 0.0 101.1 72.4 140% 14%
F4 - E22 Not Evaluable
F4 - E3 -0.4 -7.8 7.1 0.0 -0.4 6.3 -6% 0%
F5 408.2 309.7 506.7 1.6 406.6 398.0 102% 3%
Total 1,877.8 1,718.1 2,037.5 868.6 1,009.2 1,109.7 91% 3%