Embed Size (px)
Citation preview
Continuous friction measurement vs. sample
based friction measurement (e.g. locked wheel
skid trailer)
Andrew Mergenmeier, P.E.
Senior Pavement and Materials Engineer
USDOT-Federal Highway Administration
August 9, 2018

Agenda
FHWA Friction Management Program Study
Friction Testing Methods
Continuous vs Sample Based Friction Testing
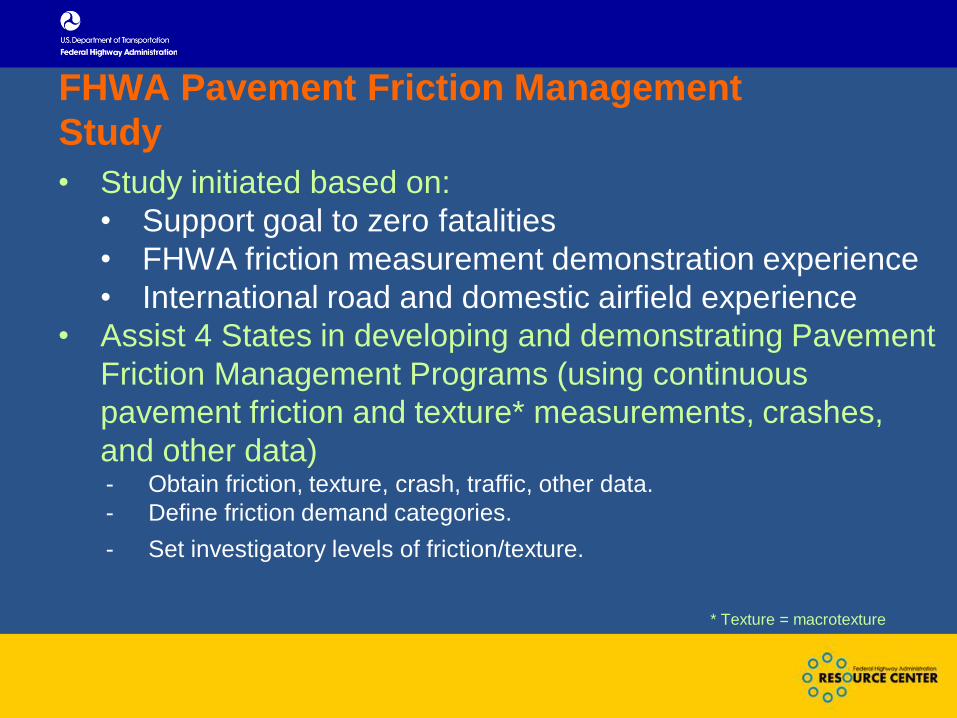
FHWA Pavement Friction Management
Study
• Study initiated based on:
• Support goal to zero fatalities
• FHWA friction measurement demonstration experience
• International road and domestic airfield experience
• Assist 4 States in developing and demonstrating Pavement
Friction Management Programs (using continuous
pavement friction and texture* measurements, crashes,
and other data)- Obtain friction, texture, crash, traffic, other data.
- Define friction demand categories.
- Set investigatory levels of friction/texture.
* Texture = macrotexture
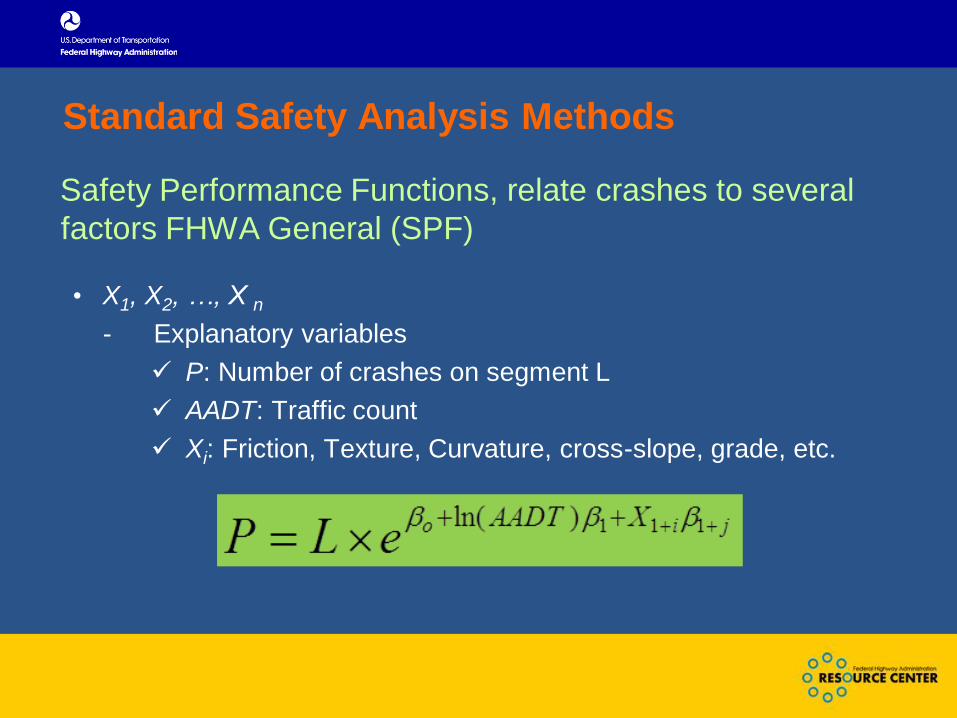
Standard Safety Analysis Methods
Safety Performance Functions, relate crashes to several
factors FHWA General (SPF)
• X1, X2, …, X n
- Explanatory variables
P: Number of crashes on segment L
AADT: Traffic count
Xi: Friction, Texture, Curvature, cross-slope, grade, etc.
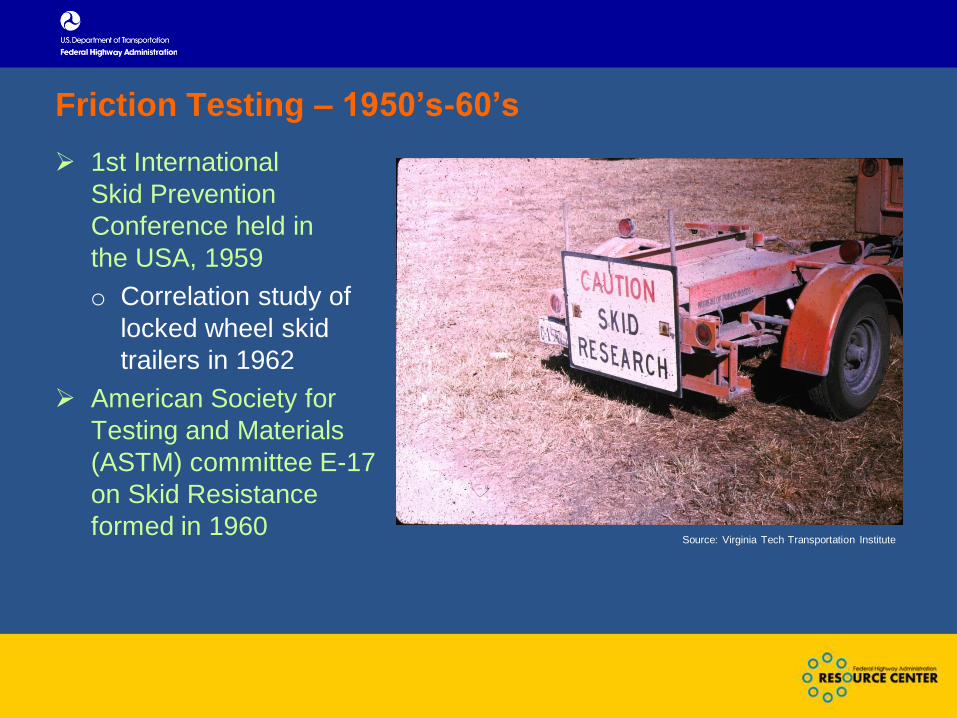
Friction Testing – 1950’s-60’s
1st International
Skid Prevention
Conference held in
the USA, 1959
o Correlation study of
locked wheel skid
trailers in 1962
American Society for
Testing and Materials
(ASTM) committee E-17
on Skid Resistance
formed in 1960Source: Virginia Tech Transportation Institute
Friction Testing – 1950’s-60’s (cont’d)
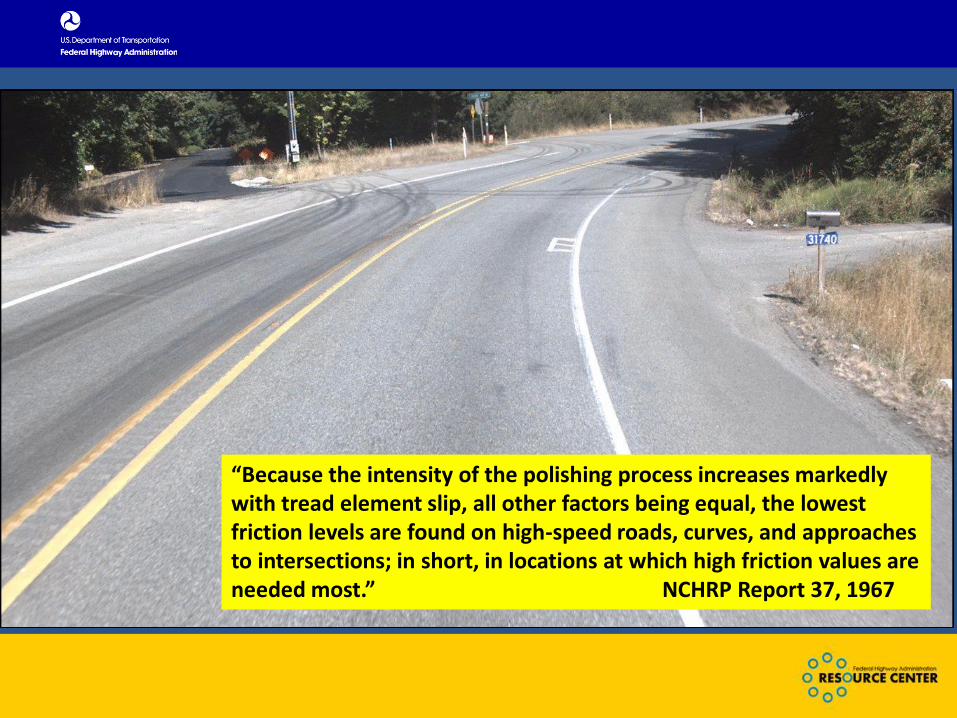
NCHRP Report 37, 1967:
• Vehicle speeds increased, younger drivers
• “Because the intensity of the polishing process increases
markedly with tread element slip, all other factors being
equal, the lowest friction levels are found on high-speed
roads, curves, and approaches to intersections; in short, in
locations at which high friction values are needed most.”
Continuous vs Sampled Based Testing
Standard friction testing in the USA is sample based
Do pavement conditions vary markedly as you travel down the
road?
• Density (Intelligent Compaction, Infrared Technology, GPR)
• Structural Integrity (TSD, GPR)
• Segregation (Texture)
• Ride
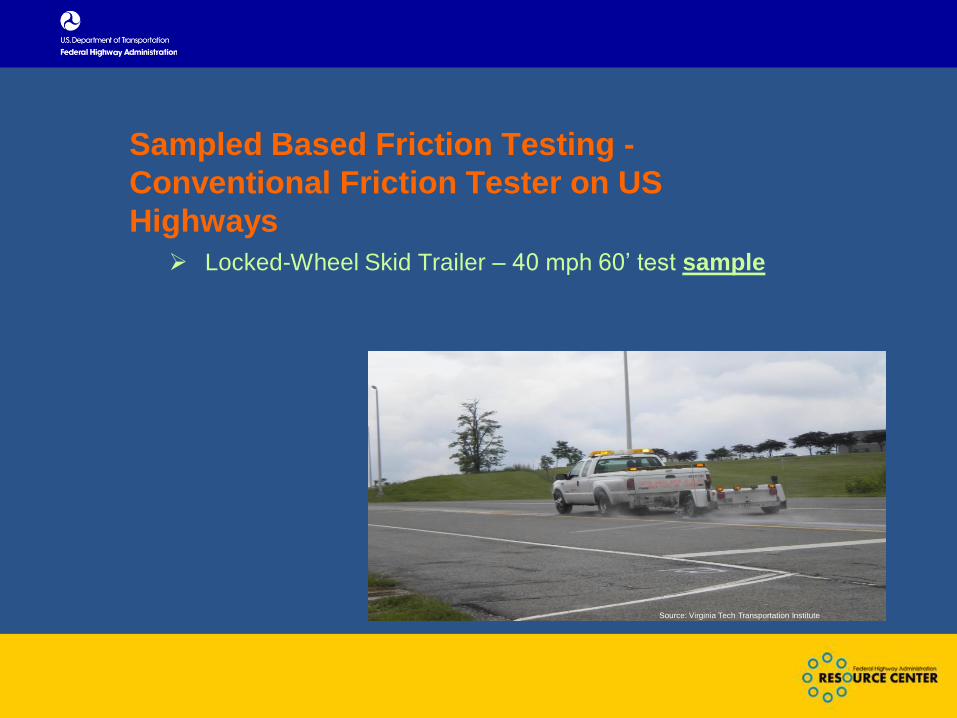
Sampled Based Friction Testing -
Conventional Friction Tester on US
Highways
Locked-Wheel Skid Trailer – 40 mph 60’ test sample
Source: Virginia Tech Transportation Institute
County Road Friction Test
Source: ICC youtube
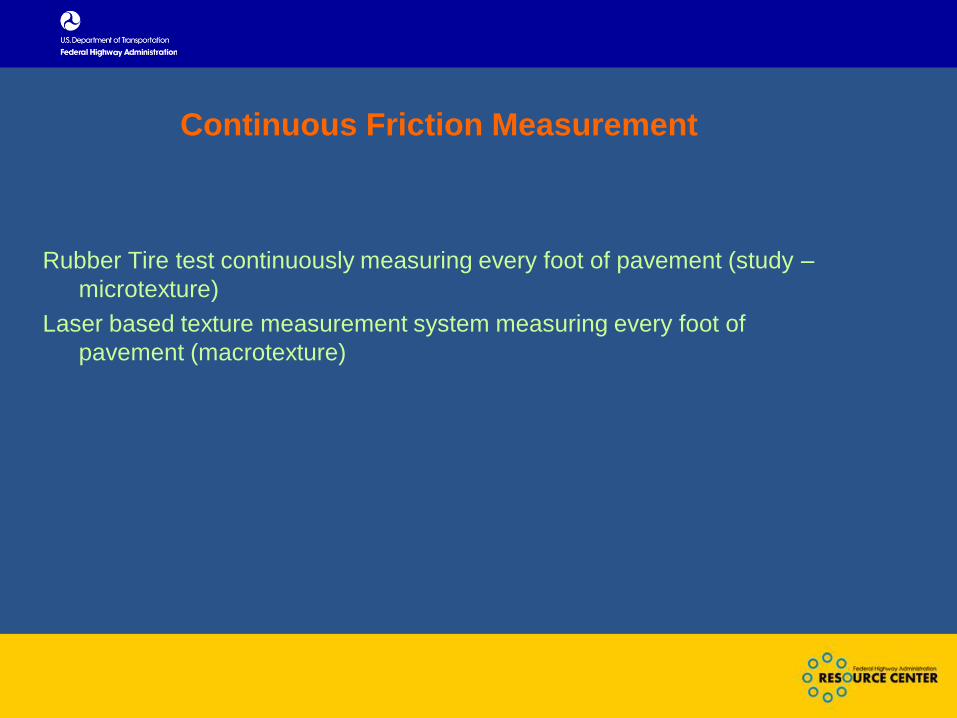
Continuous Friction Measurement
Rubber Tire test continuously measuring every foot of pavement (study –
microtexture)
Laser based texture measurement system measuring every foot of
pavement (macrotexture)
Microtexture Macrotexture
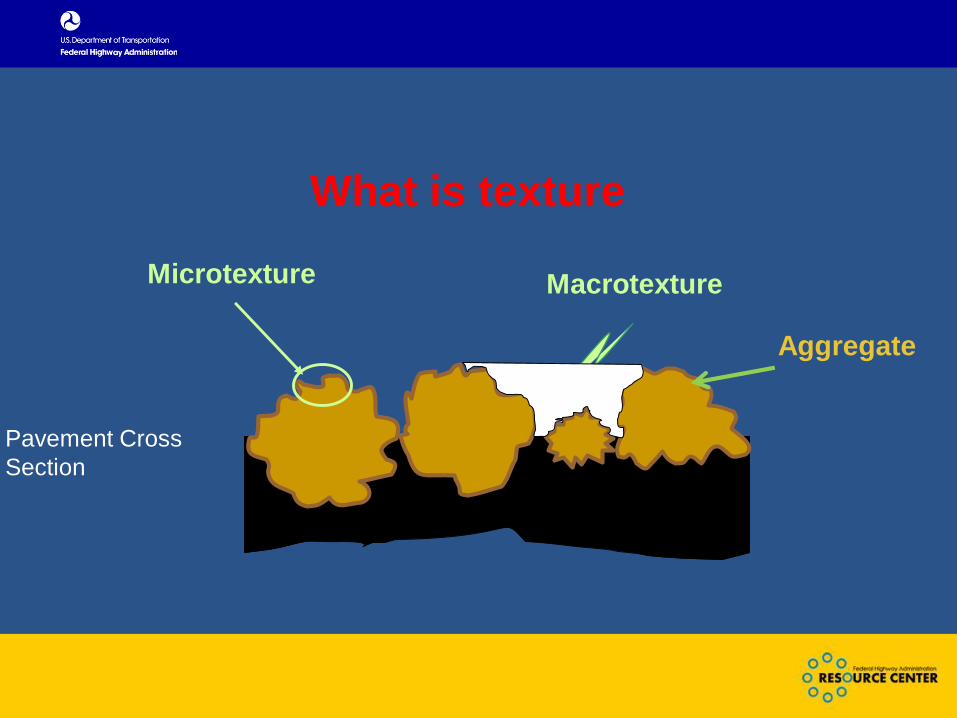
What is texture
Aggregate
Pavement Cross
Section
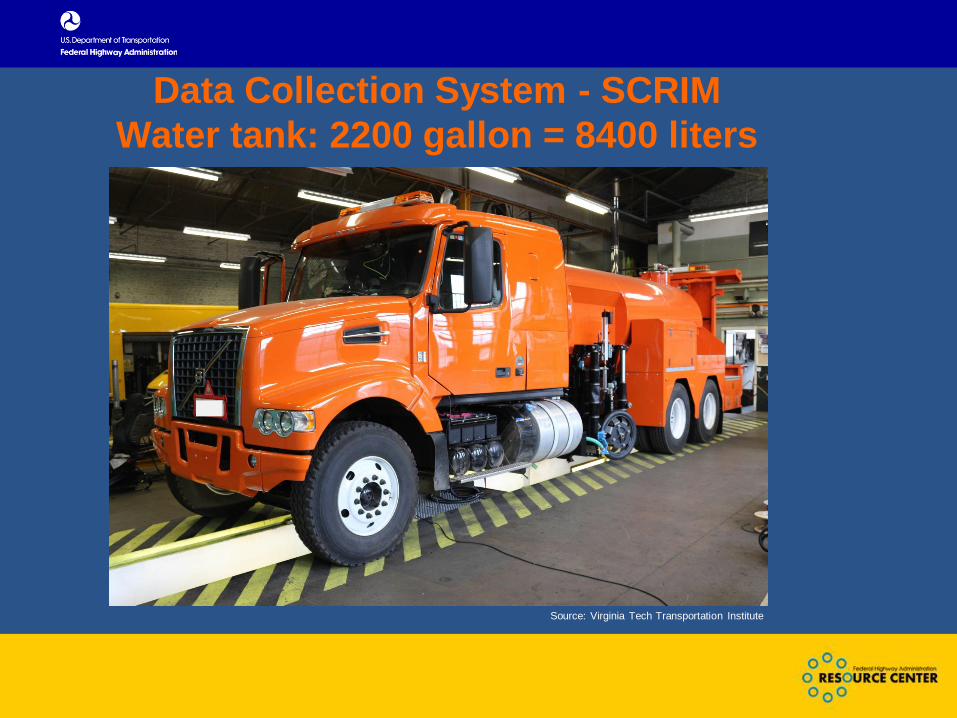
Data Collection System - SCRIM
Water tank: 2200 gallon = 8400 liters
Source: Virginia Tech Transportation Institute
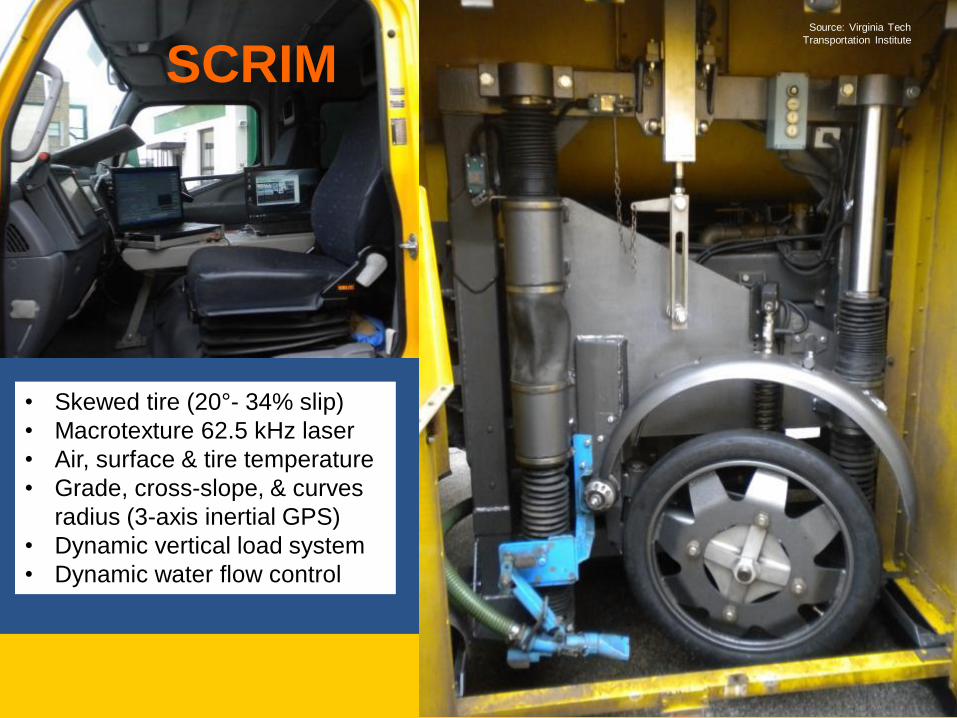
• Skewed tire (20°- 34% slip)
• Macrotexture 62.5 kHz laser
• Air, surface & tire temperature
• Grade, cross-slope, & curves
radius (3-axis inertial GPS)
• Dynamic vertical load system
• Dynamic water flow control
SCRIMSource: Virginia Tech
Transportation Institute

Friction-slip curve
0
1.2
0 100
Tire Slip, %
Peak friction
Full
Sliding
friction
(fully locked)Increased Braking
Critical slip
Intermittent
sliding
(free rolling)
Coefficient of Friction
Pavement surface
influence area
Tire
influence
area
(after Henry, 2000)
𝜇 =𝐹𝑥𝐹𝑦=𝐹𝑥𝑊
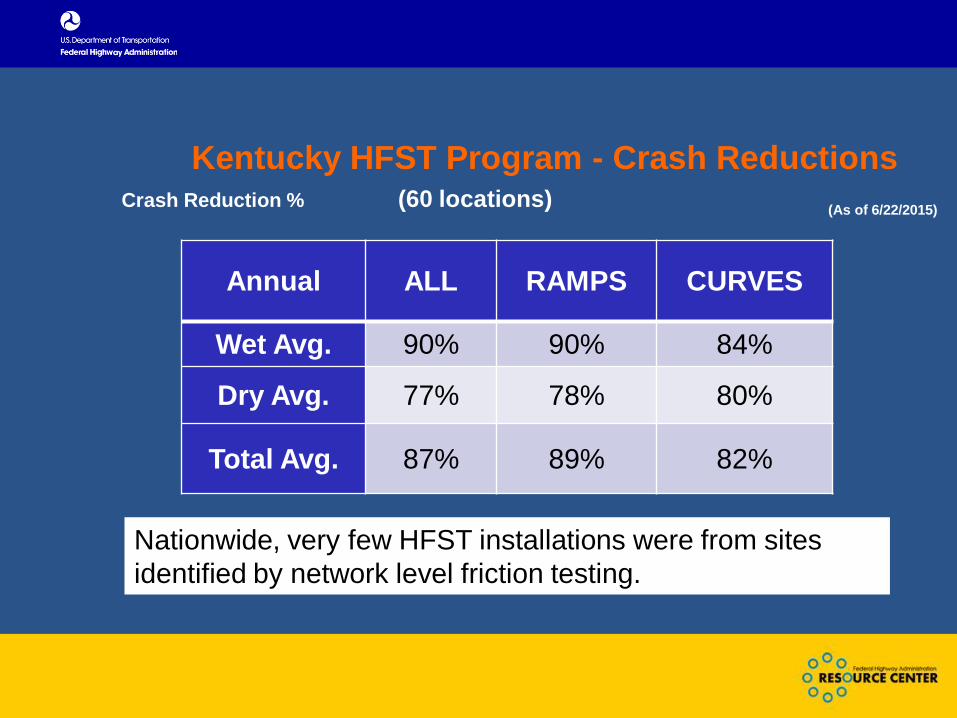
Annual ALL RAMPS CURVES
Wet Avg. 90% 90% 84%
Dry Avg. 77% 78% 80%
Total Avg. 87% 89% 82%
(As of 6/22/2015)Crash Reduction % (60 locations)
Nationwide, very few HFST installations were from sites
identified by network level friction testing.
Kentucky HFST Program - Crash Reductions
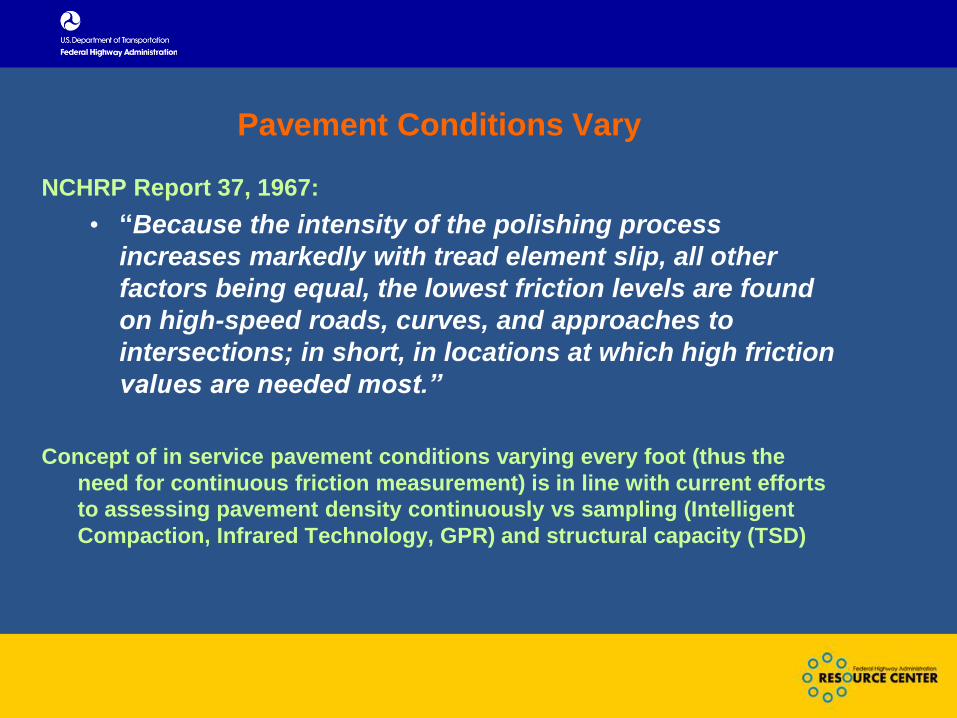
Pavement Conditions Vary
NCHRP Report 37, 1967:
• “Because the intensity of the polishing process
increases markedly with tread element slip, all other
factors being equal, the lowest friction levels are found
on high-speed roads, curves, and approaches to
intersections; in short, in locations at which high friction
values are needed most.”
Concept of in service pavement conditions varying every foot (thus the
need for continuous friction measurement) is in line with current efforts
to assessing pavement density continuously vs sampling (Intelligent
Compaction, Infrared Technology, GPR) and structural capacity (TSD)
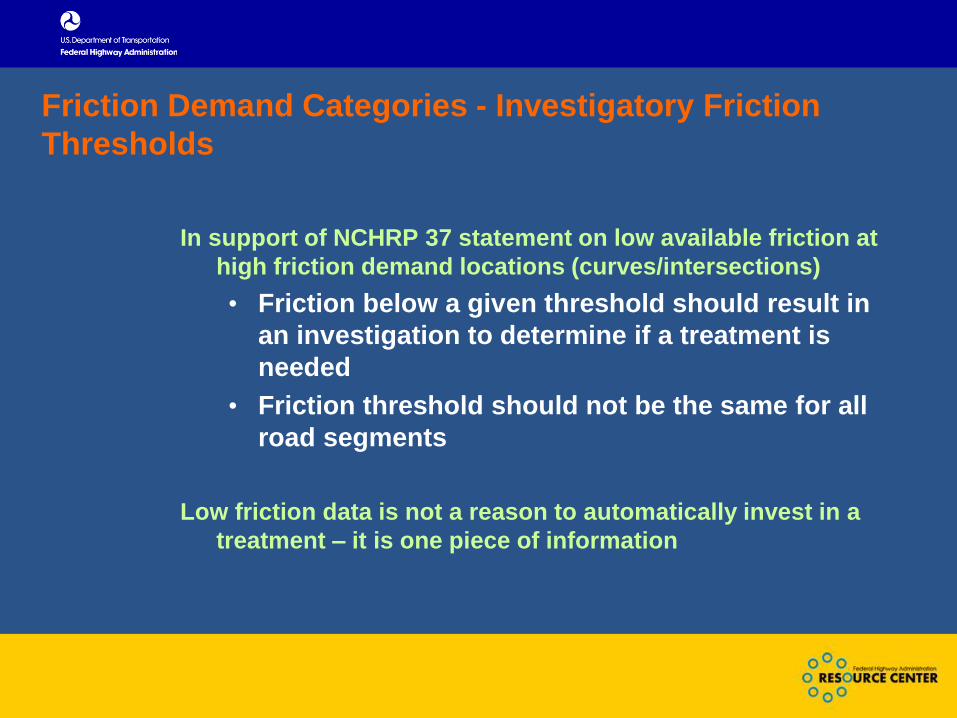
Friction Demand Categories - Investigatory Friction
Thresholds
In support of NCHRP 37 statement on low available friction at
high friction demand locations (curves/intersections)
• Friction below a given threshold should result in
an investigation to determine if a treatment is
needed
• Friction threshold should not be the same for all
road segments
Low friction data is not a reason to automatically invest in a
treatment – it is one piece of information
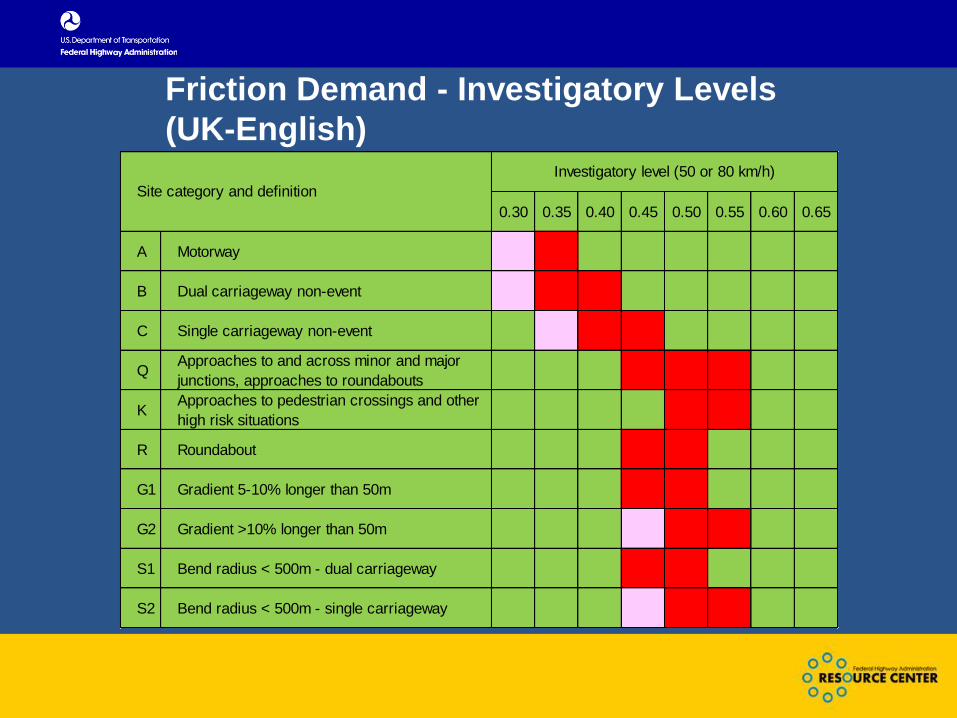
0.30 0.35 0.40 0.45 0.50 0.55 0.60 0.65
A Motorway
B Dual carriageway non-event
C Single carriageway non-event
QApproaches to and across minor and major
junctions, approaches to roundabouts
KApproaches to pedestrian crossings and other
high risk situations
R Roundabout
G1 Gradient 5-10% longer than 50m
G2 Gradient >10% longer than 50m
S1 Bend radius < 500m - dual carriageway
S2 Bend radius < 500m - single carriageway
Investigatory level (50 or 80 km/h)
Site category and definition
Friction Demand - Investigatory Levels
(UK-English)
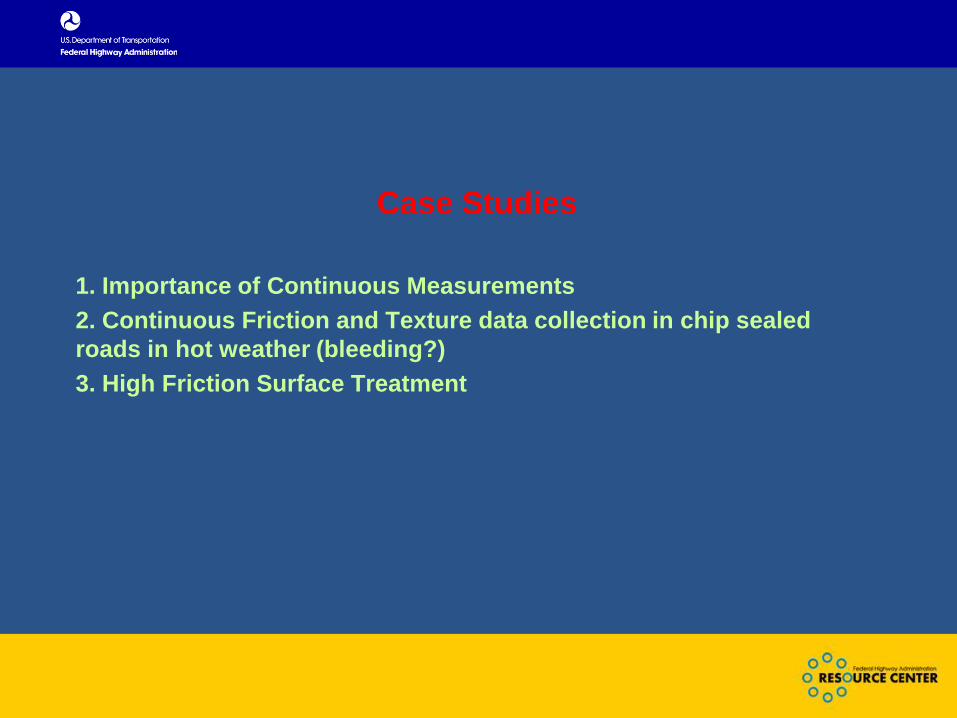
Case Studies
1. Importance of Continuous Measurements
2. Continuous Friction and Texture data collection in chip sealed
roads in hot weather (bleeding?)
3. High Friction Surface Treatment
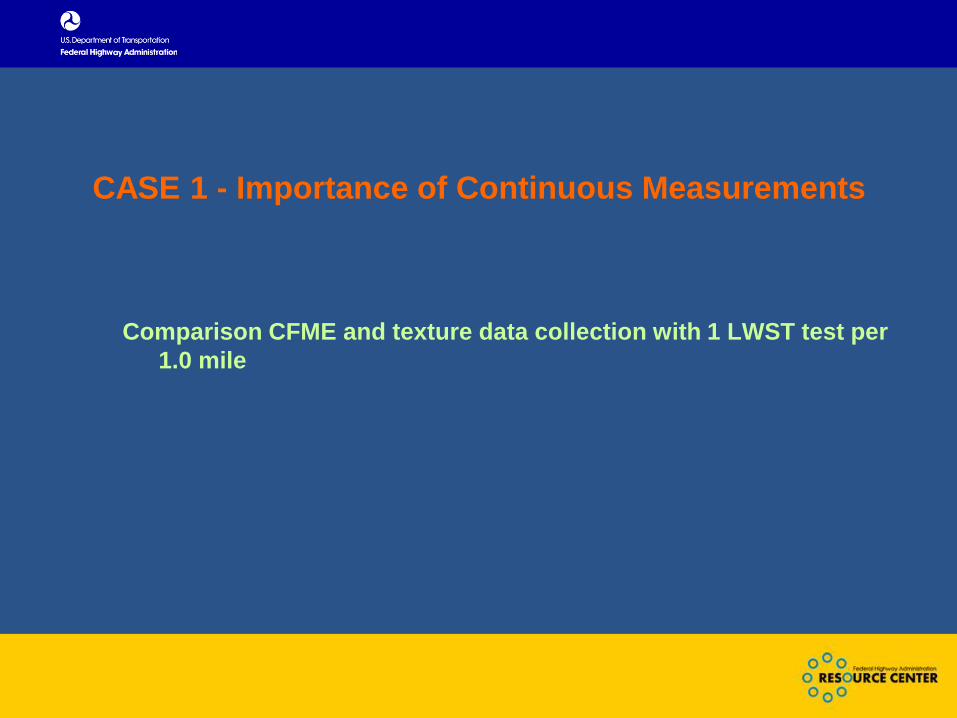
CASE 1 - Importance of Continuous Measurements
Comparison CFME and texture data collection with 1 LWST test per
1.0 mile
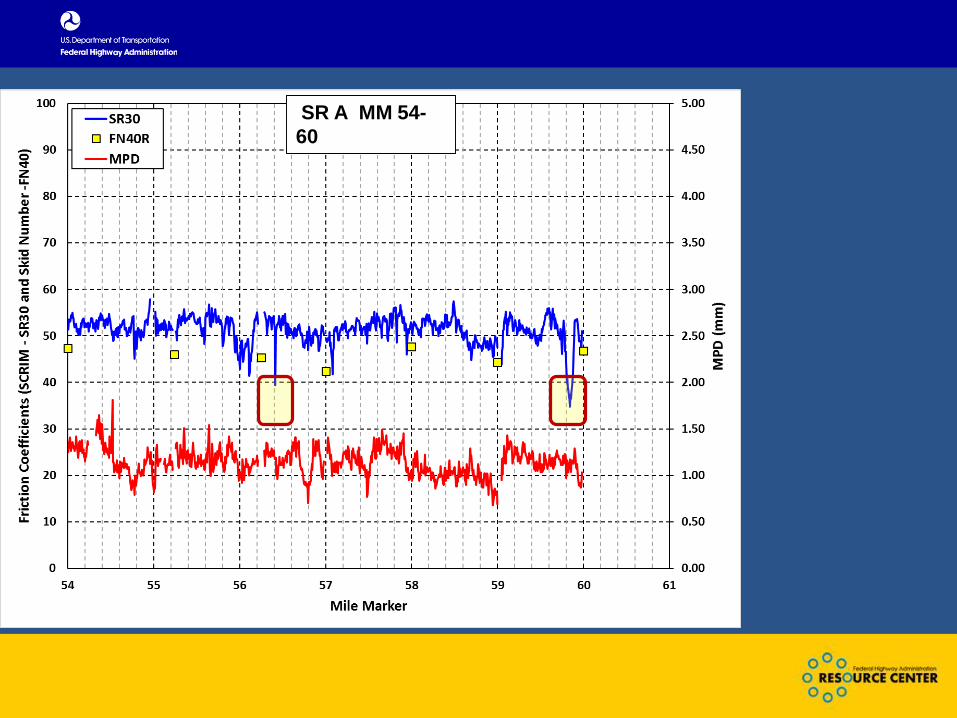
SR A MM 54-
60
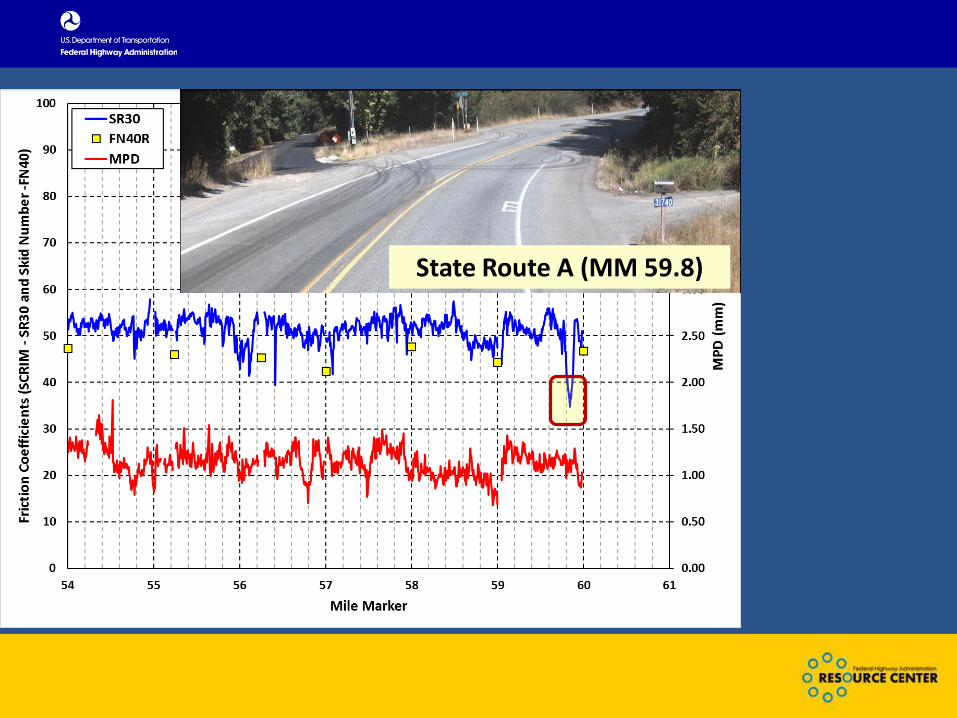
State Route A (MM 59.8)
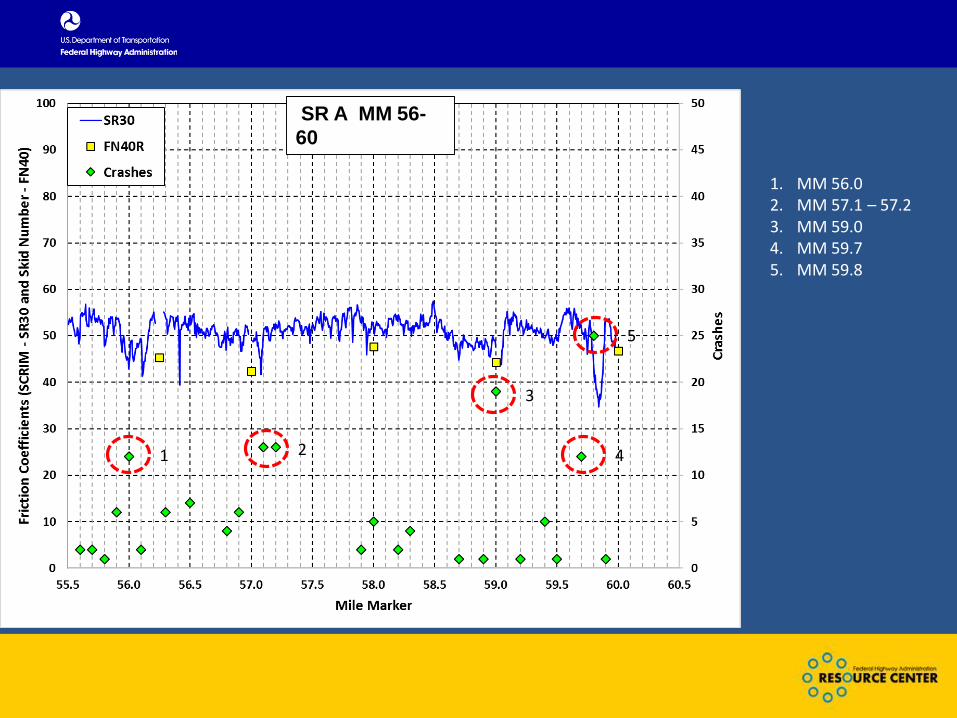
“Because the intensity of the polishing process increases markedly with tread element slip, all other factors being equal, the lowest friction levels are found on high-speed roads, curves, and approaches to intersections; in short, in locations at which high friction values are needed most.” NCHRP Report 37, 1967
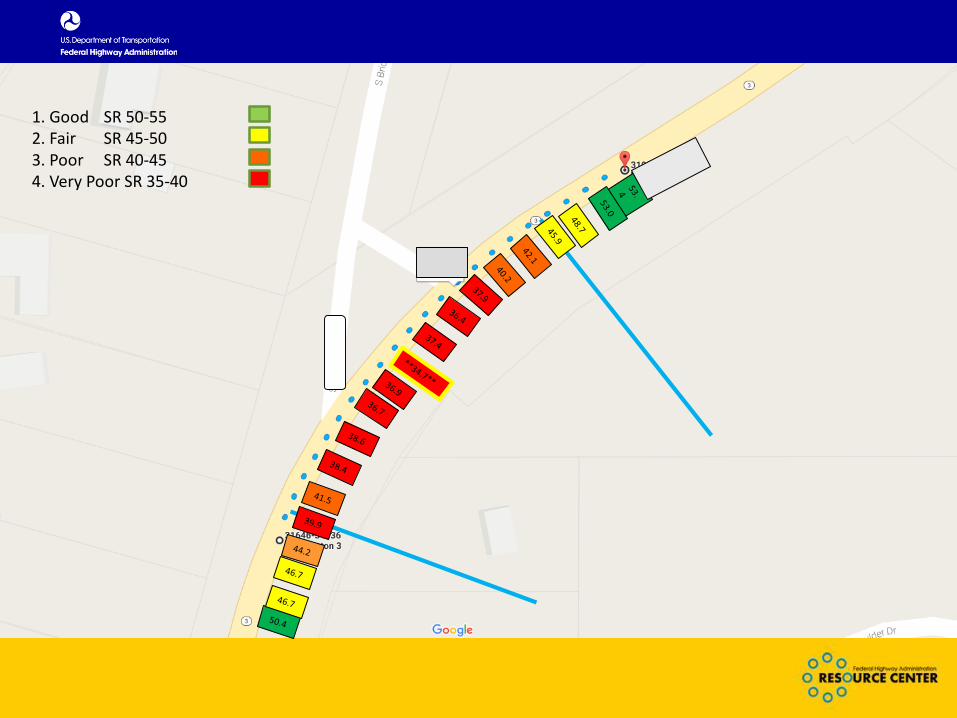
1. Good SR 50-552. Fair SR 45-503. Poor SR 40-454. Very Poor SR 35-40
1 2
3
4
5
1. MM 56.0 2. MM 57.1 – 57.23. MM 59.04. MM 59.75. MM 59.8
SR A MM 56-
60
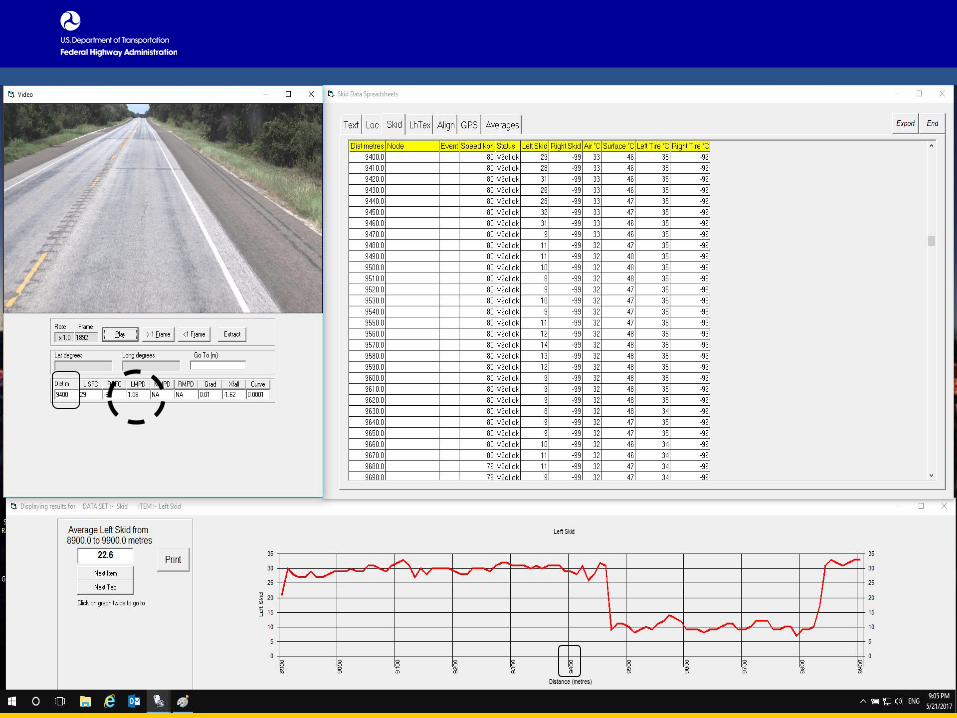
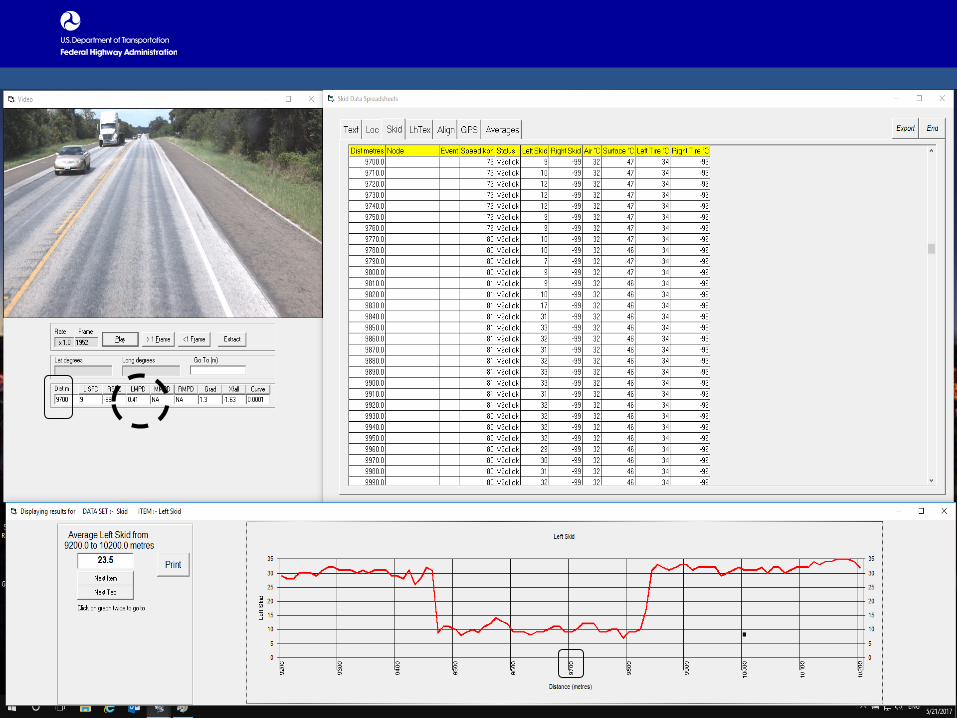
CASE 2
Continuous Friction and Texture data collection on chip
sealed roads in hot weather (bleeding?)
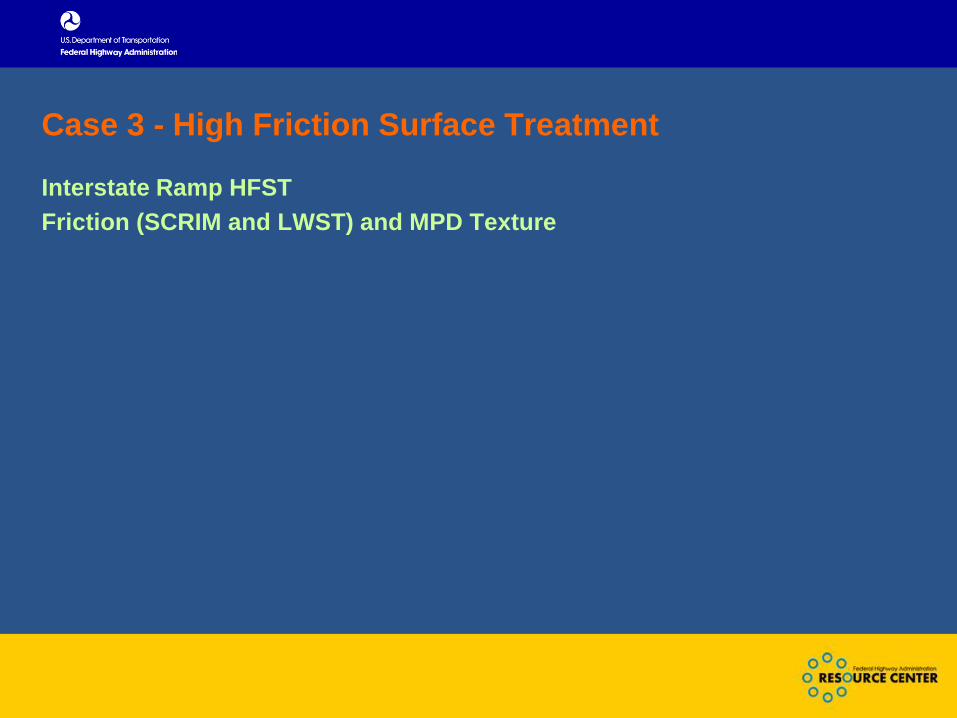
Case 3 - High Friction Surface Treatment
Interstate Ramp HFST
Friction (SCRIM and LWST) and MPD Texture
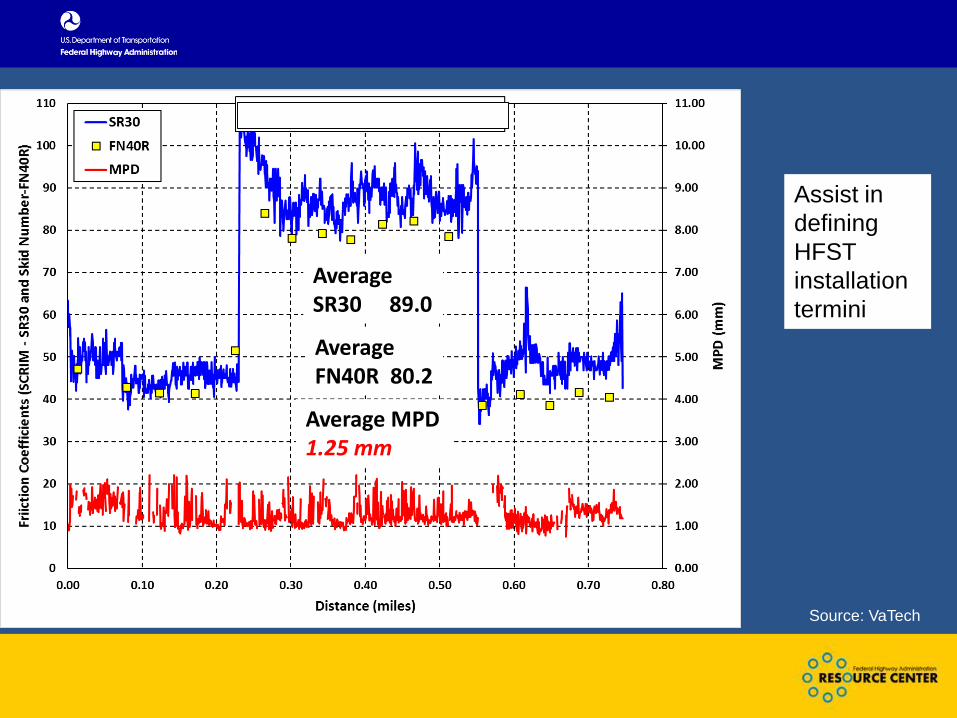
Average SR30 89.0
Average FN40R 80.2
Average MPD 1.25 mm
Source: VaTech
Assist in
defining
HFST
installation
termini
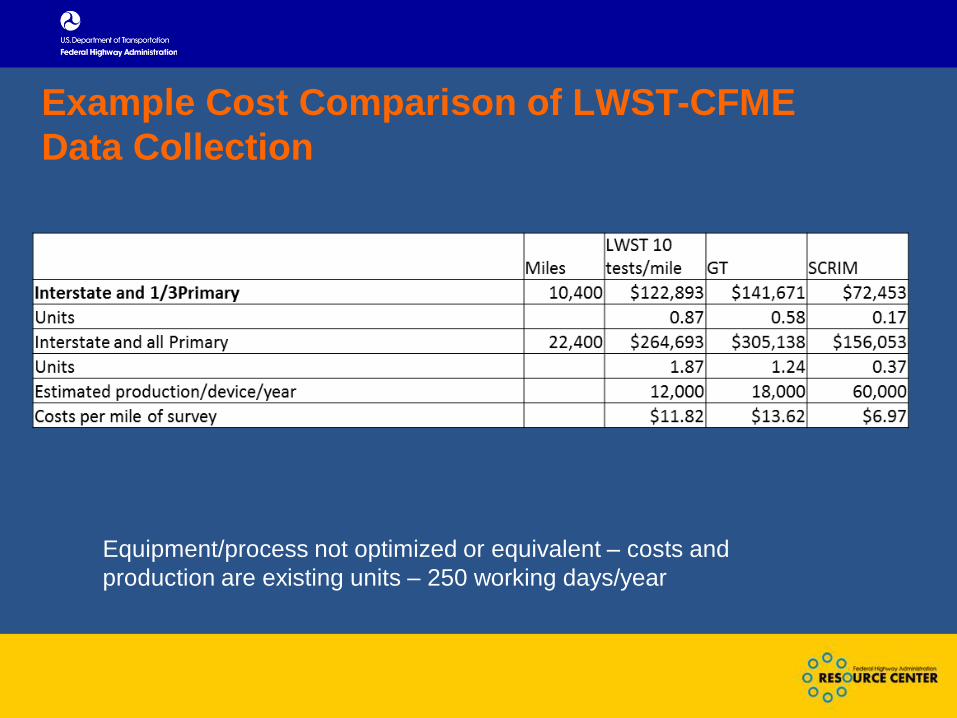
Example Cost Comparison of LWST-CFME
Data Collection
Equipment/process not optimized or equivalent – costs and
production are existing units – 250 working days/year
LWST Data Collection
LWST is a high quality test procedure for the 60’ of pavement that is
tested when test speed is 40 mph
• United Kingdom uses the LWST for research purposes
not production work (continuous)
Very challenging and sometimes not possible to test at critical
locations (curves/intersections/ramps)
Current sampling approach (1 test/mile) = 1% of the pavement surface
Friction varies at a higher degree of granularity, especially in high
demand areas (curves/intersections/ramps)
Preliminary Conclusions
Measuring friction continuously (macro and micro), especially when
complemented by road geometry, traffic, and crash data, provides
a more effective method for identifying the most critical sections
and allow focusing the safety improvement efforts on the higher
risk locations, such as intersections and curves.

Thank You
Andrew Mergenmeier P.E.
Senior Pavement and Materials Engineer
U.S. Department of Transportation
Federal Highway Administration
FHWA Resource Center