Embed Size (px)
Citation preview

A1
For author disclosure information, see page 797.ADA-Funded Research
ORA
LS
CONTINUOUS GLUCOSE MONITORING
CONTINUOUS GLUCOSE MONITORING
1-ORImpact of Study Design and Analytic Techniques on the Reported Accuracy of Continuous Glucose Monitoring (CGM) SystemsDAVID A. PRICE, TOM PEYSER, PETER SIMPSON, KATHERINE NAKAMURA, AARTHI MAHALINGAM, San Diego, CA
CGM performance is an important factor considered by clinicians recom-mending a CGM system and commonly used metrics are often compared across systems. However, these comparisons are challenging. CGM per-formance is often worst on the fi rst and last days of use and studies that minimize data from those days may be misleading. Clinical trials with lim-ited data in hypo- or hyperglycemia can distort the appearance of overall sensor performance. Real time systems for commercial use by patients re-quire a prospectively determined calibration curve using SMBG. However, retrospective calibration optimized for each sensor, increased frequency of calibration, or calibration with reference glucose values are used in some analyses to optimize results and affecting apparent accuracy. Some studies report median, instead of mean differences from reference glucose, negat-ing the impact of outlier data and impacting the accuracy perception. Stud-ies commonly exclude data but the amount of data excluded and the criteria for exclusion often lack transparency. Some studies report combined Clarke Error Grid A and B zones as a way of improving the perceived accuracy. As an example, we demonstrated different methods of analyzing data from a study of Dexcom Seven Plus CGM to show the effects of excluding selected data, retrospective calibration, and frequent calibration on the performance metrics of the system
SevenPlus No
exclusion
ExcludeDay
Seven
ExcludeHypo
Euglycemia(70-180)
RetrospectiveCalibration( 4x/day)
RetrospectiveCalibration( 4x/day)
Mean ARD 16% 15% 15% 16% 13% 9%Median ARD 13% 13% 12.5% 13% 10% 7%Clarke A 74% 76% 75% 71% 79% 92%Clarke A+B 97% 97% 100% 100% 99% 100%N 1827 1272 1675 927 1899 2714
Different study designs and methods of analysis confound the ability to compare accuracy of different CGM systems. There is a need for standardized study designs and metrics to allow such comparisons.
2-ORA1C and Mean Glucose (MG) in Insulin Treated Diabetes Using the Dexcom SevenPlus Continuous Glucose Monitor (CGM): Correlation and Intra-Patient Consistency Over TimeNICHOLAS B. ARGENTO, KATHERINE NAKAMURA, ROBERT D. SALA, Columbia, MD, San Diego, CA
The relationship between A1C and MG is controversial. An estimated A1C derived glucose (eAG) is said to be useful, but CGM data shows signifi cant variation between eAG and CGM measured MG (CMG). Little information is available on the consistency of this relationship in an individual patient over time. We report this relationship between eAG and CMG (eAG-CMG) in insulin requiring patients and the consistency of the relationship in a sub-group. Patients using Dexcom SevenPlus were identifi ed by review of clinic downloads, and included if an A1C value was drawn when the 60 days prior included at least 50% utilization of CGM (n=138). A subgroup had between 2 to 6 data points (n=98). The most recent eAG-CMG was used to derive the linear regression model. Within patients, the prior eAG-CMG were examed for consistency. Mean age 48.7 yr (18-75), duration 26 yr (1-58), 61% male, 39% female, 91% T1D, 9% T2D, 80% CSII, 20% MDI.
A1C 7.0% = eAG 153.2 mg/dl The intra-patient eAG-CMG relationship is gen-erally consistent over time. For example, subj 1: A1C 7.3, CMG 139, eAG 159, (CMG - eAG) /eAG x 100 = -12.7%; A1C 7.7, CMG 149, eAG 166, -10.4%. Subj 2: A1C 7.2, CMG 204, eAG 157, +30.2%; A1C 7.1, CMG 189, eAG 155, +21.6%. In conclusion, the Dexcom SevenPlus yields similar eAG-CGM correlation to the JDRF CGM study. There is signifi cant individual patient variability. Some subjects have striking differences between CMG and eAG, which trends consistently over time. Clinicians should consider modifi cation of A1C goals in patients with persistent signifi cant divergence of CMG and eAG.
3-ORAccuracy and Large Inaccuracy of Two Continuous Glucose Moni-toring (CGM) SystemsLALANTHA LEELARATHNA, MARIANNA NODALE, JANET M. ALLEN, DANIELA ELLERI, KAVITA KUMARESWARAN, AHMAD HAIDAR, KAREN CALDWELL, MAL-GORZATA E. WILINSKA, CARLO L. ACERINI, MARK L. EVANS, HELEN R. MURPHY, DAVID B. DUNGER, ROMAN HOVORKA, Cambridge, United Kingdom, Montreal, QC, Canada
Sensor inaccuracy can lead to potentially harmful insulin over or under delivery particularly during closed-loop glucose control and has yet to be quantifi ed for commercial CGM systems. We analysed data from 32 adults (36.2 ± 9.3 yrs) and 20 adolescents (15.3 ± 1.5 yrs) with type 1 diabetes who attended clinical research facility to undergo testing of closed-loop. Paired CGM and plasma glucose values (PG; measured by YSI 2300 STAT Plus Anal-yser) were collected every 15 to 60min using Freestyle Navigator (FSN, 1548 hours of data collection, 4218 data pairs) and DexCom Seven Plus (DSP, 1440 hours, 2964 pairs). Median absolute relative difference was 10% for FSN and 13% for DSP; 78.4% of FSN and 70.9% of DSP values were in Zone A of Clarke Error Grid. Large sensor over-reading by 40%, 50% and 60% (or 2.4, 3.0, and 3.6 mmol/L at PG below 6 mmol/L) occurred 2 - 3 fold more com-monly with DSP than FSN (Table 1). At higher error thresholds, duration of sensor over-reading decreased with FSN but remained unchanged with DSP (Table 1). Sensor errors of 1 hour or longer duration were absent with FSN at 50% and 60% error levels but one out of ten errors was of 1 hour or longer with DSP. Frequency and duration of large sensor under-reading was com-parable. We conclude that FSN and DSP differ little in their overall accuracy but substantial differences in frequency and duration of large inaccuracies favour FSN for use in closed-loop insulin delivery systems.

A2
For author disclosure information, see page 797. ADA-Funded Research
ORA
LSCONTINUOUS GLUCOSE MONITORING
Table 1: Incidence and Duration of Large Sensor InaccuracyFree Style Navigator
(FSN)DexCom Seven Plus
(DSP)Over-
readingUnder-reading
Over-reading
Under-reading
40% error Incidence (per 100 days use) 40.0 27.8 83.3 26.3Duration in min (median, IQR) 36(20-63) 22(13-44) 28(9-61) 24(9-31)
50% error Incidence (per 100 days use) 21.8 14.1 50.0 5.0Duration in min (median, IQR) 37(15-44) 23(18-29) 32(22-47) 43(15-54)
60% error Incidence (per 100 days use) 9.3 4.6 27.0 5.0Duration in min (median, IQR) 14(7-31) 2(1-16) 28(13-43) 29(1-35)
Supported by: JDRF, Diabetes UK, NDDK and EU Commission (7th FP)
4-ORA Comparative Analysis of Three Continuous Glucose Monitors: Not All Are Created EqualEDWARD R. DAMIANO, FIRAS H. EL-KHATIB, KENDRA L. MAGYAR, DAVID M. NATHAN, STEVEN J. RUSSELL, Boston, MA
The goal of this study was to compare three continuous glucose monitor-ing (CGM) devices in subjects with type 1 diabetes under closed-loop blood-glucose (BG) control. Six subjects with type 1 diabetes (age 52±14 years, diabetes duration 32±14 years) each participated in two 51-hour closed-loop BG control experiments in the hospital. Venous plasma glucose (PG) mea-surements (GlucoScout, International Biomedical) obtained every 15 minutes (2,360 values) were paired in time with corresponding CGM glucose (CGMG) measurements obtained from three CGM devices (FreeStyle Navigator, Ab-bott Diabetes Care; DexCom Seven Plus, DexCom; Guardian RT, Medtronic) worn simultaneously by each subject. Errors in paired PG-CGMG measure-ments and data reporting percentages were obtained for each CGM device. The Navigator had the best overall accuracy, with an aggregate mean absolute relative difference (MARD) of all paired points of 11.8±11.1% and an average MARD across all 12 experiments of 11.8±3.8%. The DexCom and Guardian pro-duced aggregate MARDs of all paired points of 16.5±17.8% and 20.3±18.0%, respectively, and average MARDs across all 12 experiments of 16.5±6.7% and 20.2±6.8%, respectively. Data reporting percentages, a measure of reliability, were 76% for the DexCom and nearly 100% for the Navigator and Guardian. A comprehensive head-to-head-to-head comparison of three CGM devices for BG values from 36-563 mg/dl revealed marked differences in performance characteristics that include accuracy, precision, and reliability. The Navigator was found to out-perform the other two in these areas.
5-ORGlycemic Variability is Higher in Type 1 Diabetic Patients With Mi-crovascular Complications Irrespective of Glycemic ControlJAN SOUPAL, MARTIN PRAZNY, JAN SKRHA, Prague, Czech Republic
Increased glycemic variability (GV) may be associated with higher risk of microvascular complications (MVC). Continuous glucose monitoring systems (CGMS) can provide more data for the assessment of GV. The aim of the study is to compare GV in T1DM patiens with and without MVC. Thirty-two T1DM patients (age 43±13 yrs, duration of DM 19±11 yrs), of them 15 patients with and 17 without MVC (HbA1C 71±9 and 66±13 mmol/mol, p=0.21, NS), participated in the study. CGM was recorded for two weeks using blinded CGM systems. GV was analyzed using proprietary software. Among other parameters, standard deviation (SD) and coeffi cient of variation (CV) were calculated. Vibration perception threshold (VPT) was measured by neuroth-esiometer and used as an estimate of neuropathy (0-15 V normal and >15 V impared VPT). GV was higher in patients with retinopathy (n=13) compared to patients without retinopathy (SD: 4.1±0.7 vs. 3.4±0.9, p=0.03) although there was no signifi cant difference in HbA1C. Similarly, GV was higher in pa-tients with impaired VPT (n=12, SD: 4.3±0.7 vs. 3.4±0.8, p=0.003). Moreover, a positive association was observed between VPT and SD in all patients (r=0.53, p=0.002). Patients with microalbuminuria (n=7) had higher GV (CV: 0.46±0.07 vs. 0.38±0.07, p=0.02) even though HbA1C was nonsignifi cantly higher in the group without microalbuminuria (68±13 vs. 67±8 mmol/mol). In general, patients with any MVC had signifi cantly higher GV compared to patients without MVC (SD: 4.1±0.7 vs. 3.4±0.8, p=0.01 and CV: 0.44±0.06 vs. 0.37±0.07, p=0.005) although their HbA1C was comparable. T1DM patients with any MVC had signifi cantly higher GV than the patients without compli-cations although they did not differ in glycemic control. This fi nding supports the hypothesis that high GV may contribute to the development of MVC in T1DM and that HbA1C may not describe diabetes control completely.
6-ORPerformance of a Microdialysis-Based Continuous Glucose Moni-toring (CGM) SystemERIC ZIJLSTRA, TIM HEISE, WOLFGANG KÜNNECKE, Neuss, Germany, Braunsch-weig, Germany
Combining intravenous microdialysis with on-line glucose analysis for CGM may prove to become an important development to achieve tight glycemic control in hospitalized patients without blood loss, measurement delays or frequent manual interventions. In this study we evaluated the performance of a microdialysis-based CGM system for up to 48 hours use. Twenty-one healthy adult subjects were connected to 1 or 2 CGM systems. Blood glucose was sampled automatically without blood loss by means of microdialysis every 1-2 minutes and the dialysate was analyzed immediately by an on-line glucose sensor. The glucose sensor was calibrated once every 24 hours. Reference blood samples were taken manually and analyzed using a laboratory glucose analyzer every 10-60 minutes. The subjects consumed meals or glucose was administered orally or intravenously to analyze the accuracy of the CGM system over a range of blood glucose concentrations. A total of 1796 paired sensor-reference data points were evaluated. Mean relative deviation was 9.4% and 91.4% of data points were accurate ac-cording to the ISO15197 criteria. Accuracy in the hypoglycemic range was comparable: 94.6% of the sensor values below 75 mg/dL were within 15 mg/dL of the reference value. Clark Error Grid analysis showed that 99.3% of the data points were located within the accurate and acceptable zones. This study shows that CGM using microdialysis in blood is feasible for up to 48 hours and provides reasonably accurate glucose results with only a once-daily calibration. Improved calibration and/or referencing strategies may increase the accuracy of the system further in future studies.
7-ORTransdermal Continuous Glucose Monitoring Following Skin Per-meationWAYNE MENZIE, JAMES HURLEY, KEITH KRYSTYNIAK, MY-QUYEN TRIEU, JASON BERLIN, KENNETH GARY, Franklin, MA
The skin is an effective barrier, limiting access to interstitial fl uid (ISF) for diagnostic monitoring. Invasive techniques such as subcutaneous inser-tion of sensors are generally required to access ISF. Prelude® SkinPrep Sys-tem is a non-invasive device for skin permeation to provide ISF access for continuous analyte measurements. This study was performed to evaluate the potential for transdermal continuous glucose measurement in patients with diabetes without requiring needles or other invasive techniques, using Symphony® Transdermal Continuous Glucose Monitoring (tCGM) System on sites pre-treated with Prelude SkinPrep. Twenty adult volunteers with either type 1 or type 2 diabetes were evaluated. Prelude was used to permeate the skin and a tCGM device was applied to each of 2 test sites. Venous reference blood samples were taken from intravenous lines at 15-minute intervals for 24 hours. The reference blood glucose (BG) values were measured with a YSI 2300 Stat+ glucose analyzer. At the conclusion of the study, the skin at the test sites was inspected for redness or any other undesirable effects. Ac-curacy of the tCGM data relative to the reference BG values was determined

A3
For author disclosure information, see page 797.ADA-Funded Research
ORA
LS
THE CLINICAL MANAGEMENT OF DIABETES
using Continuous Glucose Error Grid Analysis (CG-EGA) and mean absolute relative difference (MARD). Using over 2,600 Symphony tCGM glucose read-ings from the 20 study subjects paired with reference BG measurements, CG-EGA showed that 94.4% of the readings were clinically accurate (A) and 2.5% were benign (B) errors with a combined A+B of 96.9% . The MARD for the study was 12.6%. Values for BG measurements ranged from 38 to 399 mg/dL. There were no unanticipated adverse device effects reported from the Prelude skin permeation or the Symphony tCGM biosensor. Continuous glucose measurement with Symphony tCGM was reliably achieved using Prelude SkinPrep for transdermal access to ISF. This approach represents a simple, convenient, needle-free solution for continuous glucose monitoring in patients with diabetes.
8-ORLong-Term Effects of Sensor-Augmented Pump Therapy in Type 1 Diabetes: A 3-Year Follow-Up StudySIGNE SCHMIDT, KIRSTEN NØRGAARD, Hvidovre, Denmark
Sensor-augmented pump (SAP) therapy can improve glycemic control in adults with type 1 diabetes. This has been demonstrated in studies of up to 18 months duration, but the long-term effects remain to be determined. Eu-rythmics was a 26-week randomized European multi-center trial comparing the effects of SAP with multiple daily injections (MDI). Eighty-three adults with type 1 diabetes participated in the trial; 24 of these were from Den-mark. Thirteen of the 24 Danish patients were randomized to receive the study intervention, SAP (Paradigm REAL-Time System), while 11 were ran-domized to the control group continuing MDI. After completion of the trial, the 11 Danish patients in the control group started SAP and the 13 patients in the intervention group continued using SAP with quarterly follow-up visits. In this study we assessed the metabolic and psychosocial effects of SAP 3 years after therapy start by changes in HbA1c and DTSQ, HFS and PAID questionnaire scores in the Danish subgroup of Eurythmics participants. Figure 1 shows mean HbA1c values 3 years before and after SAP start. The mean decrease in HbA1c from SAP start to 3 years was 1.5% (P < .0001). At 3 years, 14 of 16 SAP users were using SAP > 70% of time. The mean DTSQ score increased from 20.4 at SAP start to 32.1 at 3 years of SAP use (P < .0001), the mean HFS score decreased from 28.2 to 21.4 (P = .257), and the mean PAID score decreased from 29.6 to 16.2 (P = .002). In summary, this 3-year follow-up study documents long-term benefi cial effects of SAP on HbA1c, treatment satisfaction and magnitude of perceived diabetes-related problems in patients with poorly controlled type 1 diabetes.
THE CLINICAL MANAGEMENT OF DIABETES
9-ORIncreased Glucose Variability is Independently Associated With Longer Length of Stay and Mortality in Non-Critically Ill Hospital-ized PatientsCARLOS E. MENDEZ, KI-TAE MOK, ASHAR ATA, ROBERT J. TANENBERG, Albany, NY, Greenville, NC
Increased glucose variability (GV) has been associated in vitro with oxida-tive stress damage. In the critical care setting, patients with high GV have been found to have increased mortality. Studies assessing the correlation between GV and length of stay (LOS) or mortality in the non-critically ill are limited. In this retrospective study, we included hospitalized patients admit-ted to medicine or surgery from 2008 to 2010. We analyzed 56,777 glucose values from a total of 4,262 inpatient encounters. Those with daily glucose
monitoring averaging a minimum of two values per day were selected. ICU, long term care, and patients with a hospital stay greater than 60 days were excluded. Glucose Standard Deviation (GSD) was calculated as a surrogate for GV. Linear and logistic regression analyses were used to assess the ef-fects of GSD on LOS and mortality. There was a positive association be-tween GSD and LOS. For every10 units increment in the GSD, LOS increases by 6.03%. There were no signifi cant differences between diabetic and non-diabetic, or in between medical and surgical cohorts. This correlation was demonstrable even when stratifying the sample by mean glycemia and hy-poglycemia occurrence. GSD was also positively associated with mortality, increasing the odds of dying by 8% per every 10 units increment in GSD. These results suggest that GV is independently associated with increased LOS and mortality in non-critically ill patients. Prospective studies with precise measurement of GV are necessary to confi rm these results and to elucidate factors that may infl uence GV.
Summary of ResultsEffect of GSD on LOS Effect
(log scale)P value 95% Confi dence Interval
All Patients (n=962) 6.03 <0.001 4.20 7.85With Diabetes (n=818) 6.31 <0.001 4.28 8.33Without Diabetes (n=144) 5.94 0.008 1.59 10.29Surgical (n=179) 6.82 0.008 1.77 11.87Medical (783) 6.04 <0.001 4.08 7.99Effect of GSD on Mortality Odds Ratio P value 95% Confi dence IntervalAll Patients (n=962) 1.08 <0.001 1.04 1.13
10-ORHospital Discharge Algorithm Based on Admission HbA1C for the Management of Patients With Type 2 DiabetesKATHIE HERMAYER, DAWN SMILEY, DARIN E. OLSON, AMNA KHAN, CHRISTO-PHER NEWTON, VIVIAN FONSECA, SOL JACOBS, LIMIN PENG, INGRID PINZON, MARIA FEREIRA, ASHWINI GORE, VICKIE HUNT, DAVID REYES, MONICA RIZZO, GUILLERMO UMPIERREZ, Charleston, SC, Atlanta, GA, New Orleans, LA
Few studies have focused on the optimal management of patients with type 2 diabetes (T2DM) after hospital discharge. Accordingly, we conducted a prospective, multicenter trial to determine the effi cacy and safety of a hospital discharge algorithm based on admission HbA1c to guide outpatient therapy in medicine and surgery patients with T2DM. Discharge algorithm: patients with admission HbA1c <7% were discharged on the same outpa-tient therapy. Those with an HbA1c between 7% and 9% were discharged on glargine at 50-80% of total daily dose (TDD) in combination with their outpatient oral antidiabetic (OAD) agents. Those with an HbA1c >9% were discharged on glargine at 80-100% of hospital TDD in combination with OAD or with basal bolus regimen with glargine and glulisine. A total of 224 pa-tients (age: 58±12 yr, duration DM: 9.3±8 yr) were followed after discharge every 4 weeks with treatment adjusted to achieve a target HbA1c <7%. The primary outcome was change in HbA1C at 4 and 12 weeks after discharge. Pharmacologic therapy and treatment response during follow-up is shown in the table. In summary, the proposed HbA1c-based hospital discharge al-gorithm was found to be effective and safe for the management of general medicine and surgical patients with T2DM.
Outcomes by Discharge TreatmentAll
patientsOAD OAD + Glargine Glargine +
GlulisineGlargine Diet
Number of patients, n (%) 224 81 (36) 61 (27) 54 (24) 20 (9) 8 (4)HbA1c on admission, % 8.7±2.5 6.9±1.5 9.2±1.9 11.1±2.3 8.2±2.2 7.0±1.2HbA1c 4 weeks of F/U, % 7.9±1.7 7.0±1.4† 8.0±1.4† 8.8±1.8 7.7±1.7 5.9HbA1c 12 weeks of F/U, % 7.3±1.5 6.6±1.1‡ 7.5±1.6‡ 8.0±1.6‡ 6.7±0.8 7.1±1.3BG<70mg/dL, n (%) 62 (29) 17 (22) 17 (30) 23 (44) 5 (25) 0 (0)BG<40mg/dL, n (%) 7 (3) 3 (4) 0 (0) 3 (6) 0 (0) 0 (0)†p<0.0001: HbA1c at admission vs 4 wks; ‡p<0.001: HbA1c at admission vs 12 wks
Supported by: sanofi -aventis

A4
For author disclosure information, see page 797. ADA-Funded Research
ORA
LSTHE CLINICAL MANAGEMENT OF DIABETES
13-ORAssociation of Treatment Persistence and Adherence With Real-World Outcomes Among Insulin-Treated Patients With Type 2 Dia-betes Mellitus (T2DM)WENHUI WEI, CHUNSHEN PAN, LIN XIE, ONUR BASER, Bridgewater, NJ, Boca Raton, FL, Ann Arbor, MI
Administrative data are often used to measure treatment persistence/adherence and the associated outcomes in real-world patients; however, they are diffi cult to measure for insulin-treated T2DM patients due to non-fi xed dosing and titration. This study pooled patient-level data from 3 published observational studies−all used IMPACT®, a national managed care database, and had similar study designs−to examine T2DM patients previously on oral anti-diabetes drugs (OADs) and/or glucagon-like peptide 1 (GLP1) analogs and initiating insulin glargine (IG) or insulin detemir (ID). Endpoints included the correlations of 1-year follow-up treatment persis-tence (remaining on treatment without discontinuation) and adherence (medication possession ratio 80%) with A1C, A1C reduction from baseline ( A1C), hypoglycemia-related event rate, health care utilization and costs. Included were 4804 patients (IG disposable pen: 2257, IG vial: 1915, ID dis-posable pen: 632; 43% women; baseline mean age 56 years; baseline A1C 9.37%; baseline # OADs 2.05). Overall, higher treatment persistence/ad-herence was associated with signifi cantly lower A1C, greater A1C, lower hospitalization and emergency room (ER) visit rates, and higher drug costs (Table). This study showed that real-world administrative data is a viable source for measuring treatment persistence/adherence among insulin-treated T2DM patients. Improved 1-year follow-up persistence/adherence was associated with better clinical outcomes and higher drug costs, but offset by lower hospitalization/ER rates.
Table: Pearson correlation coeffi cients between 1-year follow-up treatment persistence (r-persistence )/adherence (r-adherence) and health outcomes. * P<0.05; ** P<0.01; *** P<0.001.1-Year follow-up health outcome
n rpersistence radherence
A1C ( A1C) 1867 (1489) −0.054* (−0.069**) −0.081*** (−0.034)Hypoglycemia-relatedevent rate
4804 −0.031* −0.006
Overall rate of hospitalizations (rate of diabetes-related hospitalizations)
4804 (4804) −0.080*** (−0.046**) −0.047** (−0.040**)
Rate of ER visits 4804 −0.039** −0.032*Total health care costs 4804 0.022 0.011Drug costs 4804 0.129*** 0.178***
Supported by: sanofi -aventis
14-ORClinical Characteristics and Outcomes of T2DM Patients Adding 1 to 3 Stepwise Prandial Insulin Doses to Basal Insulin and Oral Ther-apy: Identifying a Problematic SubgroupMATTHEW C. RIDDLE, LING GAO, ALEKSANDRA VLAJNIC, Portland, OR, Hillsbor-ough, NJ, Bridgewater, NJ
Stepwise addition of prandial insulin to basal insulin in T2DM theoreti-cally allows all patients to reach 7.0% A1C, but studies suggest adding 1 prandial dose may be as effective. We studied subgroups of patients in an arm of the All to Target trial (NCT00384084). Titrated insulin glargine was added to oral agents (OAs), followed by 1 prandial dose of insulin glulisine if A1C was not improved at wk-12, and up to 3 doses if A1C was >7.0% at wk-24, 36, or 48. 191 patients began treatment (mean age 55 y; T2DM duration 9.5 y; BMI 32.7; A1C 9.4%; all used 2-3 OAs) and 150 completed 60 weeks. At endpoint (wk-60 or LOCF) 38% took insulin glargine only (G+0), and 24, 21, and 18% took insulin glargine + 1 (G+1), + 2 (G+2), or + 3 (G+3) insulin glulisine doses respectively. Groups did not differ in gender, age, T2DM duration, BMI, or OA use; but differed in mean baseline A1C: G+0, 9.0%; G+1, 9.2%; G+2, 9.6%; G+3, 10.4% (P<0.01; Fig A). Mean A1C was higher in the G+3 group at endpoint: G+0, 6.8%; G+1, 6.9%; G+2, 7.3%, G+3, 8.3% (P<0.001; Fig A). Weight gain was similar (6.1, 6.5, 7.8, 7.4 kg) but insulin dose higher in multiple-dose regimens (0.54, 0.73, 1.01, 1.39 U/kg; P<0.01; Fig B). G+0 and G+1 groups comprised 62% of patients and achieved mean A1C of 6.8 and 6.9%, respectively. Patients in the G+3 group had higher baseline A1C and along with G+2 patients generally failed to reach 7.0% despite higher total insulin dose. In conclusion, patients unsuccessful with
11-ORReal-World Outcomes of Initiating Injectable Therapy With Insulin Glargine or Liraglutide Among Patients With Type 2 DiabetesPHILIP LEVIN, WENHUI WEI, ALEKSANDRA VLAJNIC, CHUNSHEN PAN, LIN XIE, JAY LIN, ONUR BASER, Baltimore, MD, Bridgewater, NJ, Boca Raton, FL, Ann Ar-bor, MI, Flemington, NJ
To date, no real-world comparative data has been published on initiation of injectable therapy with insulin glargine disposable pen (GLA-P) or glucagon-like peptide-1 agonist liraglutide (LIRA) among patients with type 2 diabetes mellitus (T2DM). Using the IHCIS national managed care claim database, this study assessed 1-year clinical outcomes and plan-paid health care costs of T2DM patients failing oral antidiabetic drugs (OADs) and initiating LIRA or GLA-P. Included were adult T2DM patients who were previously on 1 OADs, had A1C>7%, initiated GLA-P or LIRA between 01/2010 and 06/2010, and had 1 year follow-up. Stringent 1:1 propensity score matching was applied to remove observed differences in baseline demographic and clinical char-acteristics between the two cohorts. Analysis was conducted among 336 matched patients (n=168/cohort; 45% women; mean baseline age 53 years, baseline A1C 8.9%, number of OADs 2.32, Charlson comorbidity index 0.32). During follow-up, there were no statistically signifi cant differences between GLA-P and LIRA cohorts in treatment persistence (51.7% vs 47.6%, P=non-signifi cant [NS]), A1C reduction from baseline (−1.02% vs −0.95%, P=NS) and % patients achieving A1C <7% (23.3% vs 28.5%, P=NS) among those with follow-up A1C data available (n=77/cohort). Hypoglycemia-related event rates were low in both cohorts (overall: 10.7 vs 6.6 per 100 patient/year, P=NS; hospital/emergency room-related events: 1.1 vs 1.1 per 100 patient/year, P=NS). This database did not have information on weight. GLA-P pa-tients, compared to LIRA patients, had signifi cantly lower study drug costs ($1,198 vs $2,784; P<0.001), resulting in lower diabetes-related health care costs ($5,653 vs $7,976; P=0.02). This real-world comparative study sug-gested that among T2DM patients who failed OADs and initiated injectable therapy, GLA-P may be a more cost-effective option than LIRA with similar clinical outcomes yet lower diabetes care cost.
Supported by: sanofi -aventis
12-ORComparison of 24-Week Treatment With Exenatide, Insulin and Pio-glitazone in Newly Diagnosed and Drug-Naïve T2DMWEN XU, JIN LI, LONGYI ZENG, DALONG ZHU, ZILIN SUN, LIXIN GUO, TAO YANG, GE WU, CAIPING LI, LIXIN SHI, QIFU LI, QIANG LI, XIAOHUI GUO, ZUOJIE LUO, JUMING LU, ZHONGYAN SHAN, WENYING YANG, QIUHE JI, LI YAN, HONG LI, XUEFENG YU, SHAOQING LI, ZHIGUANG ZHOU, XIAOFENG LV, GUOCHUN LUO, LINONG JI, SHAODA LIN, JIANPING WENG, Guangzhou, China, Nanjing, China, Beijing, China, Zhanjiang, China, Inner Mongolia, China, Guiyang, China, Chongqing, China, Harbin, China, Nanning, China, Shenyang, China, Xian, China, Kunming, China, Wuhan, China, Qingyuan, China, Changsha, China, Shenzhen, China, Shantou, China
Exenatide has been demonstrated to have -cell protective effect. To date no studies compare the effects of exenatide with other -cell protecting hypo-glycemic agents, like insulin and pioglitazone, in newly diagnosed and drug-na-ïve T2DM. Hence, the CONFIDENCE trial was designed to evaluate the effects of exenatide, insulin and pioglitazone on glycemic control and -cell function in these patients. 416 newly diagnosed and drug-naïve T2DM with HbA1cbetween 7% and 10% were enrolled from 25 centers in China and randomly assigned to exenatide, insulin or pioglitazone group for a predictive follow-up period of 48 weeks from August 2010. HbA1c, glucose and insulin during fi xed breakfast and IVGTT are measured at baseline, 24 weeks and 48 weeks to assess glycemic control. -cell function was evaluated at baseline and 48 weeks. By November 2011, 127 patients completed 24- week treatment. These 127 patients (mean age 52 years, BMI 26 Kg/m2) were allocated in exenatide group (40), insulin group (43) and pioglitazone group (44). Baseline character-istics were similar among three groups. After 24-week therapy, HbA1c, FPG and 2hPG after fi xed breakfast decreased in all patients. But change of HbA1cfrom baseline to 24 week was more signifi cant in exenatide and insulin group (exenatide: -1.8±1.1%, insulin: -1.8±1.3%, pioglitazone: -1.3±1.0%, P=0.036). Greater weight change was found in exenatide group (exenatide: -5.0±2.6 Kg, insulin: -0.7±2.7Kg, -2.6±3.2Kg, P<0.01). No severe hypoglycemic episodes were reported in all patients. The most common adverse events in exenatide group were gastrointestinal reactions (60%). One case of acute pancreatitis was reported in exenatide group. This preliminary data from CONFIDENCE trial demonstrated that 24-week exenatide treatment is more effective on glycemic control with regard to HbA1c reduction at 24 weeks, accompanied with more distinct weight reduction, compared with insulin and pioglitazone in newly diagnosed and drug-naïve T2DM.
Supported by: Project of Clinical Discipline of Hospital Affi liated to Ministry of Health

A5
For author disclosure information, see page 797.ADA-Funded Research
ORA
LS
NOVEL RISK FACTORS FOR DIABETES
16-ORThe Association of Serum Cotinine Level and Diabetes in Never SmokersOMAYMA O. ALSHAARAWY, JIE XIAO, ANOOP SHANKAR, Morgantown, WV
Several studies have shown that smoking is associated with an increased risk of developing diabetes. However, there are no studies investigating the relationship between environmental tobacco smoking (ETS or passive smok-ing), measured objectively by serum cotinine levels, and diabetes in never smokers. We examined n=3151 never smokers from the National Health and Nutrition Examination Survey (NHANES) 2005-08. Our exposure of interest was ETS estimated by serum cotinine level and our outcome was diabetes (n=404), defi ned based on the guidelines of the American Diabetes Asso-ciation. We found that in never smokers, higher serum cotinine levels were positively associated with diabetes. Compared to those with serum cotinine levels 0.025 ng/mL, the multivariable odds ratio (OR) (95% confi dence in-terval [CI]) of diabetes among those with cotinine levels of 0.026-0.053 ng/mL was 1.27 (0.84-1.92), among those with cotinine levels of 0.054-0.223 ng/mL was 1.39 (0.99-1.95) and among those with cotinine level 0.224 ng/mL was 1.52 (1.01-2.29); p-trend=0.0284. Higher ETS exposure measured objectively by serum cotinine was found to be associated with diabetes in never smokers.
insulin glargine alone or with 1 prandial dose pose a therapeutic problem not routinely solved by a full basal-prandial insulin regimen.
Supported by: sanofi -aventis
NOVEL RISK FACTORS FOR DIABETES
15-ORRelationship Between Obstructive Sleep Apnea and Diabetes Risk—A Meta-AnalysisKAZUYA FUJIHARA, SATORU KODAMA, CHIKA HORIKAWA, YORIKO HEIANZA, AYUMI SUGAWARA, MIHO MAKI, YOKO YACHI, HITOSHI SHIMANO, KAZUMI SAITO, HIROHITO SONE, Mito, Ibaraki, Japan, Tsukuba, Ibaraki, Japan
Obstructive sleep apnea (OSA) and diabetes mellitus (DM) are hypoth-esized to be mutually associated. However, epidemiological data to eluci-date this hypothesis remain inconsistent. Our aim of this meta-analysis is to clarify the strength and causal direction of the association between OSA and DM. MEDLINE- and EMBASE-based electronic literature searches were conducted for studies that examined the relationship between OSA and DM using a cross-sectional or cohort design. The risk of or odds ratios for diabe-tes for the highest or lowest group of OSA grade or that of OSA for DM or non-DM were pooled by an inverse-variance method. Twenty-four eligible studies were included in this meta-analysis. The pooled odds ratio (95% con-fi dence interval [CI]) of 17 cross-sectional studies examining DM risk related to severe OSA was 1.92 [1.55-2.39] (Fig. 1). In 6 cohort studies, OSA was also related to future DM risk (pooled risk estimate [95% CI], 2.06 [1.77-2.40]). However, according to the pooled analysis of 5 cohort studies examining future OSA risk related to DM, DM did not signifi cantly predict OSA risk (pooled risk estimate [95% CI], 1.03 [0.89-1.19]) (Fig. 2). These results suggest that OSA causes incident DM, but that the reverse is not true.
A6
For author disclosure information, see page 797. ADA-Funded Research
ORA
LSNOVEL RISK FACTORS FOR DIABETES
19-ORRacial/Ethnic Differences in Risk Factors for Type 2 Diabetes: The Northern Manhattan Study (NOMAS)TIFFANY L. GARY-WEBB, YESEON P. MOON, TANJA RUNDEK, RALPH L. SACCO, MYUNGHEE PAIK, MITCHELL S. ELKIND, New York, NY, Miami, FL
Disparities in diabetes for African Americans and Hispanics compared to whites are well known, but the role of risk factors among minority popula-tions remains uncertain. We conducted an analysis to determine if risk fac-tors for diabetes differ for three racial/ethnic groups. Among 2,498 partici-pants free from diabetes at enrollment into the Northern Manhattan Study (NOMAS), a prospective cohort study among a tri-ethnic, urban population aged >40 yrs, diagnosis of diabetes was assessed annually (median 9 yrs; data collected 1993-2009). Weibull regressions for interval censoring were used to estimate hazard ratios (HR) and 95% confi dence intervals (CI) for the effect of risk factors at baseline: waist-hip ratio, physical activity, alcohol use, smoking, hypertension, and HDL with interaction terms specifi ed for race and each risk factor in separate models. At baseline, participants were mean age 69±10 yrs; 52% Hispanic, 23% black, and 23% white. By 2009, 351 (14.1%) developed diabetes. Waist-hip ratio predicted diabetes among whites (HR per SD 1.68, 95% CI 1.28-2.19) and Hispanics (HR per SD 1.31, 1.14-1.50), but not blacks (HR per SD 0.97, 0.76-1.25) (p for interaction=0.01). Moderate alcohol use was inversely associated with risk of diabetes among whites (HR 0.30, 0.13-0.71), but much less strongly among blacks (HR 0.86) and Hispanics (HR 0.92) (p for interaction=0.035). Furthermore, current smok-ing was a strong risk factor for diabetes among whites (HR 5.22, 1.99-13.69), but not for blacks or Hispanics (p for interaction=0.017). After adjusting for baseline risk factors, Hispanics (HR 2.09, 1.32-3.32) and blacks (HR 1.54, 0.97-2.45) still had greater risk of diabetes than whites. These results sug-gest that the risk of diabetes was higher among minorities than whites for those living in a single urban community. Risk factors for diabetes also dif-fered by race-ethnicity, with several risk factors that were important among whites playing a small or insignifi cant role among minorities.
Supported by: NIH
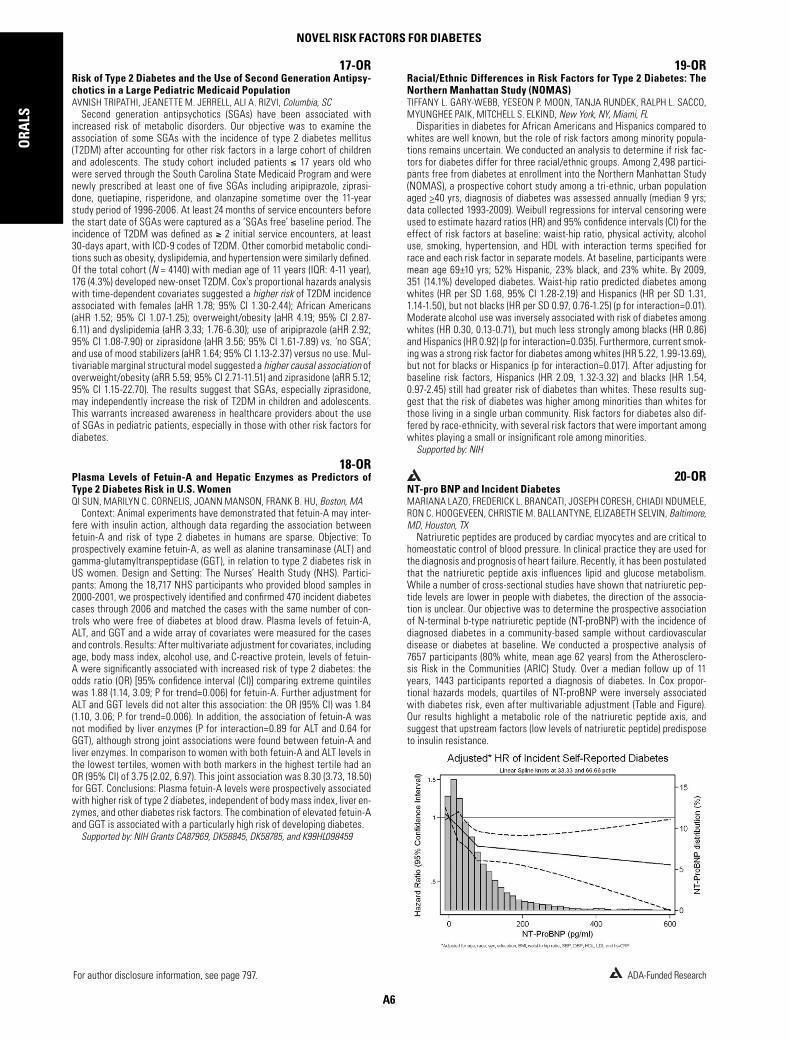
20-ORNT-pro BNP and Incident DiabetesMARIANA LAZO, FREDERICK L. BRANCATI, JOSEPH CORESH, CHIADI NDUMELE, RON C. HOOGEVEEN, CHRISTIE M. BALLANTYNE, ELIZABETH SELVIN, Baltimore, MD, Houston, TX
Natriuretic peptides are produced by cardiac myocytes and are critical to homeostatic control of blood pressure. In clinical practice they are used for the diagnosis and prognosis of heart failure. Recently, it has been postulated that the natriuretic peptide axis infl uences lipid and glucose metabolism. While a number of cross-sectional studies have shown that natriuretic pep-tide levels are lower in people with diabetes, the direction of the associa-tion is unclear. Our objective was to determine the prospective association of N-terminal b-type natriuretic peptide (NT-proBNP) with the incidence of diagnosed diabetes in a community-based sample without cardiovascular disease or diabetes at baseline. We conducted a prospective analysis of 7657 participants (80% white, mean age 62 years) from the Atherosclero-sis Risk in the Communities (ARIC) Study. Over a median follow up of 11 years, 1443 participants reported a diagnosis of diabetes. In Cox propor-tional hazards models, quartiles of NT-proBNP were inversely associated with diabetes risk, even after multivariable adjustment (Table and Figure). Our results highlight a metabolic role of the natriuretic peptide axis, and suggest that upstream factors (low levels of natriuretic peptide) predispose to insulin resistance.
17-ORRisk of Type 2 Diabetes and the Use of Second Generation Antipsy-chotics in a Large Pediatric Medicaid PopulationAVNISH TRIPATHI, JEANETTE M. JERRELL, ALI A. RIZVI, Columbia, SC
Second generation antipsychotics (SGAs) have been associated with increased risk of metabolic disorders. Our objective was to examine the association of some SGAs with the incidence of type 2 diabetes mellitus (T2DM) after accounting for other risk factors in a large cohort of children and adolescents. The study cohort included patients 17 years old who were served through the South Carolina State Medicaid Program and were newly prescribed at least one of fi ve SGAs including aripiprazole, ziprasi-done, quetiapine, risperidone, and olanzapine sometime over the 11-year study period of 1996-2006. At least 24 months of service encounters before the start date of SGAs were captured as a ‘SGAs free’ baseline period. The incidence of T2DM was defi ned as 2 initial service encounters, at least 30-days apart, with ICD-9 codes of T2DM. Other comorbid metabolic condi-tions such as obesity, dyslipidemia, and hypertension were similarly defi ned. Of the total cohort (N = 4140) with median age of 11 years (IQR: 4-11 year), 176 (4.3%) developed new-onset T2DM. Cox’s proportional hazards analysis with time-dependent covariates suggested a higher risk of T2DM incidence associated with females (aHR 1.78; 95% CI 1.30-2.44); African Americans (aHR 1.52; 95% CI 1.07-1.25); overweight/obesity (aHR 4.19; 95% CI 2.87-6.11) and dyslipidemia (aHR 3.33; 1.76-6.30); use of aripiprazole (aHR 2.92; 95% CI 1.08-7.90) or ziprasidone (aHR 3.56; 95% CI 1.61-7.89) vs. ‘no SGA’; and use of mood stabilizers (aHR 1.64; 95% CI 1.13-2.37) versus no use. Mul-tivariable marginal structural model suggested a higher causal association of overweight/obesity (aRR 5.59; 95% CI 2.71-11.51) and ziprasidone (aRR 5.12; 95% CI 1.15-22.70). The results suggest that SGAs, especially ziprasidone, may independently increase the risk of T2DM in children and adolescents. This warrants increased awareness in healthcare providers about the use of SGAs in pediatric patients, especially in those with other risk factors for diabetes.
18-ORPlasma Levels of Fetuin-A and Hepatic Enzymes as Predictors of Type 2 Diabetes Risk in U.S. WomenQI SUN, MARILYN C. CORNELIS, JOANN MANSON, FRANK B. HU, Boston, MA
Context: Animal experiments have demonstrated that fetuin-A may inter-fere with insulin action, although data regarding the association between fetuin-A and risk of type 2 diabetes in humans are sparse. Objective: To prospectively examine fetuin-A, as well as alanine transaminase (ALT) and gamma-glutamyltranspeptidase (GGT), in relation to type 2 diabetes risk in US women. Design and Setting: The Nurses’ Health Study (NHS). Partici-pants: Among the 18,717 NHS participants who provided blood samples in 2000-2001, we prospectively identifi ed and confi rmed 470 incident diabetes cases through 2006 and matched the cases with the same number of con-trols who were free of diabetes at blood draw. Plasma levels of fetuin-A, ALT, and GGT and a wide array of covariates were measured for the cases and controls. Results: After multivariate adjustment for covariates, including age, body mass index, alcohol use, and C-reactive protein, levels of fetuin-A were signifi cantly associated with increased risk of type 2 diabetes: the odds ratio (OR) [95% confi dence interval (CI)] comparing extreme quintiles was 1.88 (1.14, 3.09; P for trend=0.006) for fetuin-A. Further adjustment for ALT and GGT levels did not alter this association: the OR (95% CI) was 1.84 (1.10, 3.06; P for trend=0.006). In addition, the association of fetuin-A was not modifi ed by liver enzymes (P for interaction=0.89 for ALT and 0.64 for GGT), although strong joint associations were found between fetuin-A and liver enzymes. In comparison to women with both fetuin-A and ALT levels in the lowest tertiles, women with both markers in the highest tertile had an OR (95% CI) of 3.75 (2.02, 6.97). This joint association was 8.30 (3.73, 18.50) for GGT. Conclusions: Plasma fetuin-A levels were prospectively associated with higher risk of type 2 diabetes, independent of body mass index, liver en-zymes, and other diabetes risk factors. The combination of elevated fetuin-A and GGT is associated with a particularly high risk of developing diabetes.
Supported by: NIH Grants CA87969, DK58845, DK58785, and K99HL098459
A7
For author disclosure information, see page 797.ADA-Funded Research
ORA
LS
GLUCOSE TRANSPORT AND INSULIN RESISTANCE
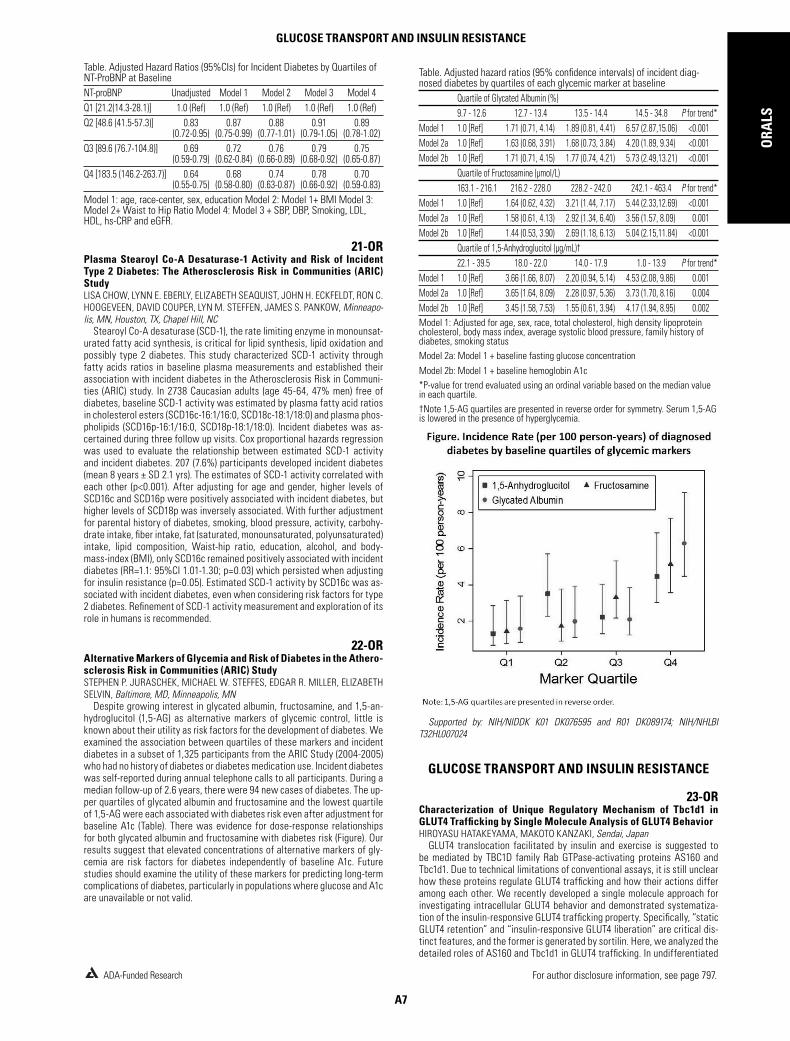
Table. Adjusted hazard ratios (95% confi dence intervals) of incident diag-nosed diabetes by quartiles of each glycemic marker at baseline
Quartile of Glycated Albumin (%)9.7 - 12.6 12.7 - 13.4 13.5 - 14.4 14.5 - 34.8 P for trend*
Model 1 1.0 [Ref] 1.71 (0.71, 4.14) 1.89 (0.81, 4.41) 6.57 (2.87,15.06) <0.001Model 2a 1.0 [Ref] 1.63 (0.68, 3.91) 1.68 (0.73, 3.84) 4.20 (1.89, 9.34) <0.001Model 2b 1.0 [Ref] 1.71 (0.71, 4.15) 1.77 (0.74, 4.21) 5.73 (2.49,13.21) <0.001
Quartile of Fructosamine (μmol/L)163.1 - 216.1 216.2 - 228.0 228.2 - 242.0 242.1 - 463.4 P for trend*
Model 1 1.0 [Ref] 1.64 (0.62, 4.32) 3.21 (1.44, 7.17) 5.44 (2.33,12.69) <0.001Model 2a 1.0 [Ref] 1.58 (0.61, 4.13) 2.92 (1.34, 6.40) 3.56 (1.57, 8.09) 0.001Model 2b 1.0 [Ref] 1.44 (0.53, 3.90) 2.69 (1.18, 6.13) 5.04 (2.15,11.84) <0.001
Quartile of 1,5-Anhydroglucitol (μg/mL)†22.1 - 39.5 18.0 - 22.0 14.0 - 17.9 1.0 - 13.9 P for trend*
Model 1 1.0 [Ref] 3.66 (1.66, 8.07) 2.20 (0.94, 5.14) 4.53 (2.08, 9.86) 0.001Model 2a 1.0 [Ref] 3.65 (1.64, 8.09) 2.28 (0.97, 5.36) 3.73 (1.70, 8.16) 0.004Model 2b 1.0 [Ref] 3.45 (1.58, 7.53) 1.55 (0.61, 3.94) 4.17 (1.94, 8.95) 0.002Model 1: Adjusted for age, sex, race, total cholesterol, high density lipoprotein cholesterol, body mass index, average systolic blood pressure, family history of diabetes, smoking statusModel 2a: Model 1 + baseline fasting glucose concentrationModel 2b: Model 1 + baseline hemoglobin A1c*P-value for trend evaluated using an ordinal variable based on the median value in each quartile.†Note 1,5-AG quartiles are presented in reverse order for symmetry. Serum 1,5-AG is lowered in the presence of hyperglycemia.
Supported by: NIH/NIDDK K01 DK076595 and R01 DK089174; NIH/NHLBI T32HL007024
GLUCOSE TRANSPORT AND INSULIN RESISTANCE
23-ORCharacterization of Unique Regulatory Mechanism of Tbc1d1 in GLUT4 Traffi cking by Single Molecule Analysis of GLUT4 BehaviorHIROYASU HATAKEYAMA, MAKOTO KANZAKI, Sendai, Japan
GLUT4 translocation facilitated by insulin and exercise is suggested to be mediated by TBC1D family Rab GTPase-activating proteins AS160 and Tbc1d1. Due to technical limitations of conventional assays, it is still unclear how these proteins regulate GLUT4 traffi cking and how their actions differ among each other. We recently developed a single molecule approach for investigating intracellular GLUT4 behavior and demonstrated systematiza-tion of the insulin-responsive GLUT4 traffi cking property. Specifi cally, “static GLUT4 retention” and “insulin-responsive GLUT4 liberation” are critical dis-tinct features, and the former is generated by sortilin. Here, we analyzed the detailed roles of AS160 and Tbc1d1 in GLUT4 traffi cking. In undifferentiated
Table. Adjusted Hazard Ratios (95%CIs) for Incident Diabetes by Quartiles of NT-ProBNP at BaselineNT-proBNP Unadjusted Model 1 Model 2 Model 3 Model 4Q1 [21.2(14.3-28.1)] 1.0 (Ref) 1.0 (Ref) 1.0 (Ref) 1.0 (Ref) 1.0 (Ref)Q2 [48.6 (41.5-57.3)] 0.83
(0.72-0.95)0.87
(0.75-0.99)0.88
(0.77-1.01)0.91
(0.79-1.05)0.89
(0.78-1.02)Q3 [89.6 (76.7-104.8)] 0.69
(0.59-0.79)0.72
(0.62-0.84)0.76
(0.66-0.89)0.79
(0.68-0.92)0.75
(0.65-0.87)Q4 [183.5 (146.2-263.7)] 0.64
(0.55-0.75)0.68
(0.58-0.80)0.74
(0.63-0.87)0.78
(0.66-0.92)0.70
(0.59-0.83)Model 1: age, race-center, sex, education Model 2: Model 1+ BMI Model 3: Model 2+ Waist to Hip Ratio Model 4: Model 3 + SBP, DBP, Smoking, LDL, HDL, hs-CRP and eGFR.
21-ORPlasma Stearoyl Co-A Desaturase-1 Activity and Risk of Incident Type 2 Diabetes: The Atherosclerosis Risk in Communities (ARIC) StudyLISA CHOW, LYNN E. EBERLY, ELIZABETH SEAQUIST, JOHN H. ECKFELDT, RON C. HOOGEVEEN, DAVID COUPER, LYN M. STEFFEN, JAMES S. PANKOW, Minneapo-lis, MN, Houston, TX, Chapel Hill, NC
Stearoyl Co-A desaturase (SCD-1), the rate limiting enzyme in monounsat-urated fatty acid synthesis, is critical for lipid synthesis, lipid oxidation and possibly type 2 diabetes. This study characterized SCD-1 activity through fatty acids ratios in baseline plasma measurements and established their association with incident diabetes in the Atherosclerosis Risk in Communi-ties (ARIC) study. In 2738 Caucasian adults (age 45-64, 47% men) free of diabetes, baseline SCD-1 activity was estimated by plasma fatty acid ratios in cholesterol esters (SCD16c-16:1/16:0, SCD18c-18:1/18:0) and plasma phos-pholipids (SCD16p-16:1/16:0, SCD18p-18:1/18:0). Incident diabetes was as-certained during three follow up visits. Cox proportional hazards regression was used to evaluate the relationship between estimated SCD-1 activity and incident diabetes. 207 (7.6%) participants developed incident diabetes (mean 8 years ± SD 2.1 yrs). The estimates of SCD-1 activity correlated with each other (p<0.001). After adjusting for age and gender, higher levels of SCD16c and SCD16p were positively associated with incident diabetes, but higher levels of SCD18p was inversely associated. With further adjustment for parental history of diabetes, smoking, blood pressure, activity, carbohy-drate intake, fi ber intake, fat (saturated, monounsaturated, polyunsaturated) intake, lipid composition, Waist-hip ratio, education, alcohol, and body-mass-index (BMI), only SCD16c remained positively associated with incident diabetes (RR=1.1: 95%CI 1.01-1.30; p=0.03) which persisted when adjusting for insulin resistance (p=0.05). Estimated SCD-1 activity by SCD16c was as-sociated with incident diabetes, even when considering risk factors for type 2 diabetes. Refi nement of SCD-1 activity measurement and exploration of its role in humans is recommended.
22-ORAlternative Markers of Glycemia and Risk of Diabetes in the Athero-sclerosis Risk in Communities (ARIC) StudySTEPHEN P. JURASCHEK, MICHAEL W. STEFFES, EDGAR R. MILLER, ELIZABETH SELVIN, Baltimore, MD, Minneapolis, MN
Despite growing interest in glycated albumin, fructosamine, and 1,5-an-hydroglucitol (1,5-AG) as alternative markers of glycemic control, little is known about their utility as risk factors for the development of diabetes. We examined the association between quartiles of these markers and incident diabetes in a subset of 1,325 participants from the ARIC Study (2004-2005) who had no history of diabetes or diabetes medication use. Incident diabetes was self-reported during annual telephone calls to all participants. During a median follow-up of 2.6 years, there were 94 new cases of diabetes. The up-per quartiles of glycated albumin and fructosamine and the lowest quartile of 1,5-AG were each associated with diabetes risk even after adjustment for baseline A1c (Table). There was evidence for dose-response relationships for both glycated albumin and fructosamine with diabetes risk (Figure). Our results suggest that elevated concentrations of alternative markers of gly-cemia are risk factors for diabetes independently of baseline A1c. Future studies should examine the utility of these markers for predicting long-term complications of diabetes, particularly in populations where glucose and A1c are unavailable or not valid.
A8
For author disclosure information, see page 797. ADA-Funded Research
ORA
LSGLUCOSE TRANSPORT AND INSULIN RESISTANCE
and 8a are required for the formation of GSVs from the endosomes/TGN, a step that is also regulated by AS160. KD of either Rabs14 or 8a leads to accumulation of Glut4 and LRP1 in the pre-GSV sorting compartment. LRP1 is effi ciently traffi cked from this compartment through the constitutive cy-cling pathway (so exocytosis increases in KD cells), while Glut4 is traffi cked slowly from this compartment (so exocytosis decreases in KD cells).
26-ORGLUT4 Endosomal Traffi cking, but Not Signaling is Altered During Insulin Resistance in 3T3-L1 CellsANN L. OLSON, KANDICE TESSNEER, Oklahoma City, OK
Glucose transporter isoform 4 (GLUT4) is the insulin-responsive glucose transporter mediating peripheral glucose uptake by skeletal muscle and adipose. Insulin-mediated recruitment from intracellular storage vesicles to the plasma membrane is the rate-limiting step in peripheral glucose dis-posal making GLUT4 an important regulator of glucose homeostasis. In white adipose tissue (WAT), GLUT4 protein expression and recruitment to the cell surface are decreased during insulin resistance and Type II diabetes mellitus (T2DM). These conditions are accompanied by fasting hyperinsulinemia and hyperglycemia. We hypothesize that chronic hyperinsulinemia may cause the alterations in GLUT4 regulation observed during insulin resistance in vivo. To test this hypothesis, we have characterized GLUT4 endosomal traffi cking in 3T3-L1 adipocytes treated with 100 mM insulin for 24 hours (CHI). This treat-ment reduced insulin-mediated redistribution of an exogenous HA-GLUT4-GFP reporter by 60%. Using a GLUT4 traffi cking mutant in combination with mutant Rab5, we next demonstrated that chronic insulin treatment targets GLUT4 to an endosomal compartment that has a reduced capacity to equilibrate with the cell surface in response to acute insulin treatment. Co-expression of dominant negative Rab5 S34N prevented CHI-dependent sequestration of GLUT4, as did an EE499/501AA mutation in the T498ELEY motif of the GLUT4-C-terminus. Overexpression of wild type Rab5, increased sequestration of GLUT4 in the moderately insulin responsive compartant. Proximal insulin signaling through phosphorylation of AS160 was not altered by CHI, however, basal phosphory-lation of AKT and AS160 was elevated by CHI. The results suggest that CHI sequesters GLUT4 into a rab5-dependent intracellular compartment, leading to reduced equilibration of GLUT4 with the plasma membrane in response to insulin. This may be an adaptive response to nutrient excess to buffer glucose clearance by an expanding adipose mass.
Supported by: OCAST
27-ORCaMKKalpha Stimulates Skeletal Muscle Glucose Uptake in Insulin Resistant Mice In VivoJAMES M. HINKLEY, LAURA A. GILLIAM, JEFFREY J. BRAULT, CAROL A. WITC-ZAK, Greenville, NC
Signaling via the Ca2+-activated, serine/threonine kinase, Ca2+/calmodu-lin-dependent protein kinase kinase (CaMKK ) stimulates skeletal muscle glucose uptake in healthy, insulin-sensitive mice. The goal of this study was to determine whether CaMKK could stimulate glucose uptake in muscles from insulin-resistant mice. Male mice (C57BL6/J strain; 6 wks old) were fed either a low fat (14% kcal fat; control) or a high fat (60% kcal fat) diet for 12 wks. To assess insulin resistance, in vivo muscle [3H]-2-deoxyglucose uptake was examined following an intravenous injection of glucose (1 mg/g body wt) to induce a physiological insulin response. In control mice, insulin increased muscle glucose uptake 2-fold over basal and this was signifi cantly impaired in the high fat fed mice (1.6-fold increase over basal), indicating that the high fat fed mice were insulin resistant. To stimulate CaMKK sig-naling, tibialis anterior muscles were transfected with plasmid DNA (100 μg) containing constitutively active CaMKK or empty vector using in vivo elec-troporation. Two weeks later, active CaMKK protein levels were robustly increased over endogenous CaMKK levels, and were not different between control and insulin-resistant mice. Basal and insulin-induced muscle glucose uptake were assessed in vivo as described above. In control mice, uptake was increased 1.6-fold by active CaMKK and 2.6-fold by active CaMKK+ insulin, demonstrating for the fi rst time that CaMKK and insulin have additive effects on muscle glucose uptake. In high fat fed mice, uptake was increased 2-fold by active CaMKK , and 3-fold by active CaMKK + insulin, indicating that CaMKK is effective at stimulating glucose uptake in insu-lin resistant muscles. In conclusion, these results show that activation of CaMKK signaling can stimulate glucose uptake in both insulin-sensitive and insulin-resistant muscles, and suggest that CaMKK may be a novel therapeutic target for the treatment of impaired muscle glucose uptake in type 2 diabetes.
Supported by: NIH R00AR056298
3T3L1 fi broblasts expressing neither sortilin nor AS160 endogenously, we successfully reconstituted “insulin-responsive GLUT4 liberation” essentially the same as in differentiated 3T3L1 adipocytes by exogenously expressing these two proteins. In contrast, fi broblasts exogenously expressing sortilin and Tbc1d1 showed no insulin-responsive liberation. Instead, these cells exhibited GLUT4 liberation in response to AICAR, an AMPK activator. After AICAR removal, GLUT4 was effi ciently recycled back to the “static” com-partment, and importantly, the restored static GLUT4 now exhibited marked “insulin-responsive liberation” even several hours after AICAR removal, in-dicating that Tbc1d1 gains insulin-responsiveness by pre-AICAR/restoration treatment. In addition, we revealed the importance of a rise in intracellular Ca2+ level for the temporal acquisition of “insulin-responsive” activity of Tbc1d1. Thus, our fi ndings demonstrate the unique regulatory mechanism of Tbc1d1 in the GLUT4 liberation process, and suggest that combined and/or sequential stimulation with multiple signals (i.e. AMPK, Ca2+ -> Akt) is es-sential for “insulin-responsive GLUT4 liberation” activity of Tbc1d1.
24-ORPhosphorylation of Tmod3 by Akt2 Regulates GLUT4 Translocation by Remodeling Cortical ActinCHUN YAN LIM, XUEZHI BI, WANJIN HONG, WEIPING HAN, Singapore, Singapore
Insulin stimulates glucose uptake into muscle and fat cells by promoting the translocation of glucose transporter 4 (GLUT4) from intracellular storage compartment to the plasma membrane (PM) via the activation of PI3K/Akt signaling pathway. Most notably, Akt2 is essential for directing the insu-lin action by phosphorylating a number of downstream substrates that are required in multiple discrete steps of vesicle traffi cking and exocytosis. In this study, we identifi ed Tropomodulin 3 (Tmod3 or UTmod), a ubiquitously expressed actin-capping protein, as an interacting partner of constitutively active Akt2 in differentiated 3T3-L1 adipocytes by a proteomic screening. Using biochemical and RNAi-functional analyses in combination with TIRF imaging, we demonstrated that Tmod3 was a novel Akt2-specifi c substrate, and was required for insulin-stimulated glucose transport, and GLUT4 trans-location. Tmod3 proteins were found to be associated with cortical actin, and clustered around reorganized actin in response to insulin stimulation. We further identifi ed that S71 residue of Tmod3 was the target site of Akt phosphorylation, and critical for actin monomer-binding and -nucleating activities. A phospho-defective Tmod3 mutant showed stronger potency of actin-stabilizing activity in vitro, and signifi cantly inhibited insulin-induced GLUT4 translocation when overexpressed in adipocytes; while a phospho-mimetic Tmod3 mutant facilitated F-actin rearrangements, a necessary process for translocation and fusion of GLUT4 vesicles at the cell surface. Taken together, these fi ndings establish cortical actin remodeling as a novel molecular link between insulin signaling pathway and GLUT4 translocation from intracellular storage to the PM, and suggest that defects in membrane cytoskeletal-based mechanism could contribute to GLUT4 dysregulation in insulin-resistant state.
25-ORRabs 10, 14, and 8a/b are Required for Glut4 Translocation in Adipo-cytes, but Affect Different Traffi cking StepsCYNTHIA C. MASTICK, PAUL D. BREWER, ESTIFANOS N. HABTEMICHAEL, IRINA ROMENSKAIA, Reno, NV
AS160 regulates the conversion of sequestered Glut4 Storage Vesicles (GSVs) into vesicles that are competent to fuse to the plasma membrane (PM), but does not directly regulate the fusion step itself. AS160 is a Rab-GTPase activating protein that inhibits translocation by reversing the GTP loading of Rabs required for Glut4 traffi cking. Four Rabs that are substrates for AS160 in vitro co-localize with cycling Glut4 in adipocytes: Rabs 10, 14, 8a, and 8b. The effect of shRNA-mediated knockdown (KD) of these Rabs on the traffi cking kinetics of Glut4 and LRP1 were measured in 3T3-L1 adi-pocytes. LRP1 co-localizes with Glut4 in GSVs, although a signifi cant frac-tion (50-60%) is also constitutively cycling through the endocytic pathway in these cells. The effects of KD were also measured in fi broblasts to de-termine if they act through the constitutive or specialized insulin-regulated traffi cking pathways (there are no GSVs in these cells). Knockdown of Rabs 10, 14, 8b, or 8a decreased PM Glut4 (65%, 47%, 29%, or 24%, respectively). KD of Rab10 decreased exocytosis (kex) of both Glut4 and LRP1 in adipocytes, but not fi broblasts, consistent with a role in specialized GSV traffi cking. KD of Rab14 or 8a also decreased the kex of Glut4 in adipocytes, but surprisingly, it increased the kex of LRP1 2-3-fold. This was not observed in fi broblasts. Mathematical modeling/simulations support the following model: Rab10 is required to make GSVs competent for fusion to the PM; AS160 inhibits the accumulation of Rab10-GTP on GSVs in basal cells. In contrast, Rabs14

A9
For author disclosure information, see page 797.ADA-Funded Research
ORA
LS
MECHANISMS OF INSULIN RESISTANCE IN HUMANS—INFLAMMATION AND LIPIDS
Supported by: NIH/NIDDK R01
30-ORCapillary Density is Blunted in the Postprandial State in Men With T2DM or Metabolic SyndromeRENATE E. VAN GENUGTEN, ERIK H. SERNÉ, DANIËL H. VAN RAALTE, MICHAELA DIAMANT, Amsterdam, The Netherlands
Hyperinsulinemia during a euglycemic-hyperinsulinemic clamp increases capillary density, which contributes to overall glucose uptake. We investi-gated whether similar responses occur after meal-ingestion and hypoth-esized that postprandial capillary recruitment, compared to controls, is impaired in metabolic syndrome (MetS) and type 2 diabetes (T2DM), and associates with insulin sensitivity and postprandial hyperglycemia. We recruited 12 healthy men (HC), 13 with MetS (IDF-criteria) without T2DM and 12 with uncomplicated T2DM. Microvascular function was assessed by skin capillary videomicroscopy. Capillary density at baseline and during post-occlusive peak reactive hyperemia (PRH) was measured fasting (T0), 60 (T60) and 120 min (T120) after ingestion of a mixed-meal. Oral glucose insulin sensitivity (OGIS) and postprandial hyperglycemia (4h-AUCgluc) were calcu-lated. Groups were matched for age (mean±SD: 56.6±5.7y) and differed for BMI (HC 26.9±2.1; MetS 32.1±2.7; T2DM 30.4±14.7kg/m2), fasting glucose (HC 5.3±0.2; MetS 5.8±0.6; T2DM 8.0±2.0mmol/l) and HbA1c (HC 5.4±0.2; MetS 5.6±0.2; T2DM 6.7±1.0%). As expected, OGIS and 4h-AUCgluc dif-fered between groups. Fasting baseline capillary density was similar among groups but PRH was highest in HC (HC 69.3±14.1; MetS 58.6±16.7; T2DM: 56.6±7.3n/mm2 P<0.05). Postprandial capillary recruitment was blunted in MetS and T2DM (PRH T60 vs. T0 P<0.05 for HC only; T120 vs. T0 P<0.05 for all groups). In all groups, postprandial AUC for PRH correlated with OGIS (r0.492 P<0.05) and with 4h-AUCgluc (r-0.350 P<0.05). In summary, both MetS and T2DM individuals are characterized by decreased capillary density during PRH and impaired meal-related effects on capillary recruitment. Postpran-dial PRH associated with both insulin sensitivity and postprandial hypergly-cemia. These data suggest that microvascular dysfunction might contribute to postprandial hyperglycemia and may already be present in those at high risk to develop T2DM.
MECHANISMS OF INSULIN RESISTANCE IN HUMANS—INFLAMMATION AND LIPIDS
31-ORRelationship Between Body Fat Depots and Spillover of Fatty Acids from Dietary Fat in Type 2 Diabetes: Effect of Weight LossJAIME ALMANDOZ, EKTA SINGH, KAREN GROTHE, LISA HOWELL, DANIELLE VLAZNY, ALMIRA SMAILOVIC, BRIAN IRVING, ROBERT H. NELSON, JOHN M. MILES, Rochester, MN
Spillover (SO) of lipoprotein lipase-generated fatty acids from chylomi-crons into the plasma free fatty acid (FFA) pool is an important source of FFA and refl ects ineffi ciency in dietary fat storage. The present study was conducted to examine the relationship between SO and various body fat depots, and to determine whether weight loss (WL) reduces SO in people with type 2 diabetes (T2DM) on oral agents (n=13, 9 men, 4 women, age 52±2 y, BMI 33.4±1.0 kg/m2, HbA1c 7.9±0.3%). We measured SO with infusions of a [3H] triolein-labeled lipid emulsion and [U-13C] oleate during ingestion of liquid mixed meal aliquots q 15 min x 6.5h to produce steady-state chylo-
28-ORGenetic Deletion of Matrix Metalloproteinase 9 (MMP9) in C57BL/6J Mice Exacerbates Diet-Induced Muscle Insulin Resistance (IR)LI KANG, WESLEY H. MAYES, FREYJA D. JAMES, DEANNA P. BRACY, DAVID H. WASSERMAN, Nashville, TN
Increased deposition of extracellular matrix (ECM) collagens is a charac-teristic of muscle IR. MMP9 is the primary enzyme that degrades collagen IV (ColIV), a major component of the basement membrane which plays a key role in ECM remodeling. The hypotheses that genetic deletion of MMP9 in mice 1) increases muscle ColIV, 2) induces IR in lean mice and 3) worsens diet-induced muscle IR were tested. Wildtype (mmp9+/+) and MMP9 null (mmp9-/-) mice were chow fed (CF) or high fat (HF) fed (HFF) for 16wks. The hyperinsulinemic (4mU/kg/min) euglycemic clamp (IC) was used to assess in-sulin action in conscious mice with indwelling arterial (sampling) and venous (infusion) catheters. A muscle glucose metabolic index (Rg) was assessed using 2[14C]deoxyglucose. mmp9-/- increased muscle ColIV by 1.7±0.3 fold in CF mice. HF feeding increased ColIV by 1.4±0.1 fold in mmp9+/+. ColIV in HFF mmp9-/- was further increased compared to HFF mmp9+/+ (1.3±0.1 fold). Body weight and composition did not differ between CF mmp9+/+ and mmp9-/-. HFF female mmp9-/- weighed less than HFF female mmp9+/+ (27±1 vs 35±2g) pri-marily due to less fat mass. HFF male mmp9+/+ and mmp9-/- were of equal weight. IC’s were performed in weight-matched mice. mmp9-/- did not affect fasting insulin or glucose in CF or HFF mice. Glucose infusion rate (GIR) and muscle Rg were the same in CF mmp9+/+ and mmp9-/-. In contrast, HFF mmp9-/-
decreased GIR (Females: 40±1 vs 45±2; Males: 27±3 vs 38±3mg/kg/min) and muscle Rg (Females: 14±2 vs 27±1; Males: 11±2 vs 20±2μmol/100gtissue/min). In conclusion, genetic deletion of MMP9 is insuffi cient to induce IR in CF mice despite a marked increase in ColIV, demonstrating that impaired ECM remodeling is not a signifi cant barrier to insulin-stimulated glucose uptake in otherwise healthy mice. However, muscle IR in HFF mmp9-/- is consider-ably worse highlighting the importance of ECM remodeling in determining IR in the presence of the metabolic and infl ammatory challenges posed by HF diet.
Supported by: NIDDK54902
29-ORInsulin-Stimulated Glucose Transport Defects are More Resilient than Phosphorylation Defects in Type 2 Diabetes: A Dose Response Study With Dynamic PET ImagingJASON M. NG, ALESSANDRA BERTOLDO, DAVNEET S. MINHAS, NICOLE L. HELBLING, PAUL M. COEN, JULIE C. PRICE, CLAUDIO COBELLI, DAVID E. KELLEY, BRET H. GOODPASTER, Pittsburgh, PA, Padova, Italy, Rahway, NJ
Prior PET imaging studies employing sequential triple tracers revealed dual defects in skeletal muscle glucose transport and phosphorylation under physiological hyperinsulinemia can more clearly defi ne specifi c loci in muscle insulin resistance. Normal weight (NW; N=6), obese (OB; N=7) and obese type 2 diabetes (T2D; N=6) subjects were studied with PET imaging under separate 6-hour euglycemic clamps at 40 (Mid) and 120 mU/min-m2 (Hi) levels of hyperinsulinemia. Compartmental modeling with arterial input function of [15O]-H2O, [11C]3-OMG, and [18F]FDG PET analogs provided quantitative rates of glucose delivery, transport, and phosphorylation, respectively, within soleus muscle. Rates of glucose delivery (k1) did not increase with higher insulin dose stimulation, nor was k1 signifi cantly different across groups. Insulin-stimulated inward glucose transport rates (k3) were signifi cantly higher (p<0.05) in NW vs. T2D during Mid, and were also higher (p<0.01) in NW vs. OB and T2D during Hi. The fractional phosphorylation rate of glucose (k5) trended higher in NW (p=0.07) vs. T2D (Mid) although this difference was not evident in Hi. These PET imaging studies provide novel in vivo human data indicating that greater insulin stimulation reduces the defect in glucose phosphorylation in T2D. Defects in glucose transport, however, persist in both OB and T2D. Further PET imaging studies could determine how specifi c defects in glucose metabolism are rectifi ed by interventions designed to im-prove insulin resistance in obesity and T2D.

A10
For author disclosure information, see page 797. ADA-Funded Research
ORA
LSMECHANISMS OF INSULIN RESISTANCE IN HUMANS—INFLAMMATION AND LIPIDS
(23.4±7.2%), while DAG and ceramide were unchanged. Dihydroceramide in-creased in LS (27.0±27.5%), but not in ET (-23.0±10.3%) and OS (-26.5±9.0%). In all subjects, carbohydrate supported ex vivo mitochondrial respiration de-creased (-16.6±5.7%, P<0.05), P-Akt was unchanged, while PDK4 decreased (-16.3±10.1%, P<0.05). Whole-body fat oxidation increased in ET and OS to a greater degree than LS. Carbohydrate oxidation was decreased to a greater degree in ET, while non-carbohydrate disposal was less effected. In sum-mary, acute lipid-induced IR is not attenuated by high oxidative capacity muscle, nor associated with increased DAG or ceramide, decreased Akt ac-tivation or increased PDK4. Rather, key substrate pathways (whole-body fat oxidation and non-oxidative glucose disposal) handle the excess substrate at the expense of “insulin sensitivity” in exercise-trained muscle.
Supported by: NIH K01 DK084213-01
34-ORMechanisms of Lipid-Induced Insulin Resistance by Oral and Paren-tal Application in HumansBETTINA NOWOTNY, LEJLA ZAHIRAGIC, PETER J. NOWOTNY, JULIA SZENDRO-EDI, TORU YOSHIMURA, DONGYAN ZHANG, CHRISTIAN HERDER, NANETTE SCHLOOT, PETER SCHADEWALDT, GERALD I. SHULMAN, MICHAEL RODEN, Düs-seldorf, Germany, New Haven, CT, Bad Homburg, Germany
Increased lipid availability and subclinical infl ammation are involved in the development of insulin resistance. Increased free fatty acids (FFA) im-pair insulin action in skeletal muscle and liver. Besides direct cellular ef-fects, FFA may activate immune cells, stimulate infl ammatory processes and thereby affect insulin sensitivity. This study compared the effects of identical amounts and composition of lipids given i.v. or p.o. on muscular insulin sensitivity and systemic infl ammation in humans. Healthy glucose-tolerant subjects (5f/11m; age 24±2 years; body mass index 22.7±1.2 kg/m2)were given in random order for 6 hours: i.v. Intralipid® infusion (IVL; 1.5 ml/min), p.o. corresponding amount of soy bean oil (POL; 100ml) and i.v. glycerol-infusion (CON; 2.5% glycerol, 1.5ml/min). Insulin sensitivity was assessed by hyperinsulinemic-euglycemic clamps combined with isotopic dilution ([2H2]glucose). Skeletal muscle biopsies were taken after 5 hours in 7 sub-jects. Time courses of metabolic, endocrine and infl ammatory markers were analyzed with repeated blood sampling. Whole body insulin sensitivity (M value) was lower during IVL and POL at 5.7±0.4 and 6.5±0.6 mg/kg*min (all p<0.01) compared with CON (9.7±0.7 mg/kg*min). Endogenous glucose pro-duction (EGP) was suppressed by insulin only after IVL (-0.7±0.1 vs. -1.6±0.3 mg/kg*min for CON; p<0.05). IVL and POL were associated with a tendency to increased PKC theta levels in skeletal muscle (1.50±0.20 and 1.49±0.23; p=0.046 and 0.08 respectively) compared to CON. FFA and triglyceride lev-els were increased 1.7fold after IVL, but not POL or CON (p<0.01). Systemic levels of infl ammatory markers (IL-6, TNF-alpha, IL-1ra) remained unchanged. In conclusion, increased lipid availability by both oral and intravenous routes results in comparable degree of peripheral insulin resistance which is likely mediated by novel PKC isoform activation, but does not seem not involve infl ammatory pathways.
Supported by: EFSD
35-ORRole of Diacylglycerol Activation of PKC in Lipid-Induced Muscle Insulin Resistance in HumansJULIA SZENDRÖDI, TORU YOSHIMURA, ESTHER PHIELIX, MELISSA MARCUCCI, DONGYAN ZHANG, CHRISTIAN HERDER, PETER NOWOTNY, GERALD I. SHUL-MAN, MICHAEL RODEN, Düsseldorf, Germany, New Haven, CT
Multiple mechanisms have been invoked to explain muscle insulin resis-tance associated with obesity and type 2 diabetes (T2D) including infl amma-tion and increased myocellular lipid metabolites [ceramides, diacylglycerols (DAGs)]. To examine which mechanism might underlie lipid-induced muscle insulin resistance in humans we measured circulating cytokines (TNF , IL-6, sICAM, adiponectin, RBP-4), intramuscular DAG and ceramide content, ac-tivities of protein kinase C isoforms (PKC , , ) before, at 2.5 h and 4 h lipid or glycerol infusion in healthy humans (CON, n=16, 30±5 years, BMI: 24±2 kg/m2). In addition we assessed these parameters in obese, insulin resistant but glucose tolerant subjects (OB, n=5, 26±2 years, 45±3 kg/m2) and patients with T2D (T2D, n=4, 61±1 years, 35±3 kg/m2). Hyperinsulinemic-euglycemic clamps combined with [6,6-2H2]glucose were performed to measure insulin sensitivity. Whole-body insulin-stimulated glucose disposal was 57% lower during lipid infusion (P<10-6) than during glycerol infusion. Myocellular to-tal DAG increased ~2fold (P<0.005) at 2.5 h and remained ~1.4fold higher (P<0.05) at 4 h lipid infusion. Consistent with increasing muscle DAG content PKC activity increased by 64% (P<0.005) at 4 h lipid infusion. Circulating cy-tokines and myocellular ceramide content did not change. Insulin-stimulated
micronemia and suppression of lipolysis. Subjects were studied at baseline and again 5 months after starting a lifestyle modifi cation program (diet and daily exercise). Body fat was measured with DXA and CT. At baseline, there was a strong negative correlation between SO and both total body fat (r = -0.78, P=0.002) and gynoid fat (r = -0.75, P=0.003), whereas the negative correlation between SO and android fat was borderline (r = -0.52, P=0.07). SO was positively correlated with truncal:leg fat ratio (R=0.56, P=0.047), but there was no correlation between SO and visceral fat area. Multivariate analysis revealed that leg fat was a stronger negative predictor of SO than truncal fat ( = -0.8 vs. -0.3). All signifi cant correlations disappeared after a >13% WL, which decreased BMI to 29.2±1.1 kg/m2 and HbA1c to 6.3±0.2% (both P<0.0001). During WL, 11 of 12 subjects discontinued sulfonylureas. There was a decrease in both meal-suppressed FFA concentration (186±17 to 115±10 μmol/L, P<0.0001) and oleate fl ux (65±9 to 50±7 μmol/min, P=0.007). Fractional SO did not change (28±3% to 31±4%, P=0.23). These results indi-cate that in T2DM SO relates negatively to fat storage capacity, and specifi -cally that there is an inverse association between SO and lower body fat. WL results in marked improvement in meal-suppressed lipolysis, but not in SO.
32-OREffect of Aging on JNK Phosphorylation and Insulin Resistance in Human Skeletal MuscleSANGEETA GHOSH, RAWEEWAN LERTWATTANARAK, RALPH A. DEFRONZO, NICOLAS MUSI, San Antonio, TX
Aging is an important risk factor for glucose intolerance and type 2 dia-betes. Mitogen activated protein kinases (MAPK), such as JNK and ERK, have been implicated in the development of insulin resistance in the elderly. We hypothesized that (i) MAPK signaling (phosphorylation of JNK and ERK) would be increased and insulin signaling (IRS1-tyrosine, AKT, AS160 and GSK3 phosphorylation) would be decreased in skeletal muscle from older subjects; and (ii) physical activity would reduce MAPK signaling and improve insulin action (signaling and sensitivity). Insulin sensitivity (M/I) was mea-sured with a hyperinsulinemic (40 mU/mg.min) euglycemic clamp and vastus lateralis muscle biopsies were performed in 13 lean, young, normal glucose tolerant (NGT) (age=25±1y, BMI=23.5±0.7 kg/m2, VO2max=27.3±2.5 ml/kg.min, M/I=17.8±2.1 mg/kg FFM.min/mU/ml x100) and 12 lean, older, NGT (age= 74±2y, BMI=24.1±1 kg/m2, VO2max=16.3±0.8, M/I=13.0±1.7mg/kg FFM.min/mU/ml x100) subjects. In 11 older subjects, these measurements were done before and after a 16-week aerobic exercise program. At baseline, JNK phosphorylation was signifi cantly elevated (2.4 fold, P<0.05) in muscle from older subjects. There was no difference in ERK between the groups. Before training, insulin stimulated AKT phosphorylation was signifi cantly lower in the older group (50% of younger, P<0.05), however, IRS-1, GSK3 and AS160 phosphorylation were not different. The exercise training program did not affect phosphorylation of JNK, ERK or the phosphorylation of insulin signal-ing molecules (IRS-1, Akt, GSK3, AS160). Summary: (1) Aging is associated with increased MAPK (JNK) signaling; (2) Activation of JNK is associated with impaired insulin stimulation of proximal insulin signaling molecules (Akt); and (3) training does not reverse aging related changes in MAPK and insulin signaling in muscle from older subjects, suggesting that physical ac-tivity improves insulin sensitivity through a different mechanism.
Supported by: NIH (AG030979, DK080157) and American Federation for Aging Research
33-ORHigh Oxidative Muscle is not Protected From Acute Lipid-Induced Insulin ResistanceJOHN J. DUBE, NICOLE L. HELBLING, MAJA STEFANOVIC-RACIC, PAUL M. COEN, KAZANNA C. HAMES, ALEX A. DESPINES, BRET H. GOODPASTER, Pittsburgh, PA
Excess accumulation of deleterious lipids, diacylglycerol (DAG) and cer-amide, is associated with insulin resistance (IR). Exercise increases muscle oxidative capacity and improves lipid partitioning as evidenced by increased intramuscular triglyceride and decreased ceramide. We hypothesized that high oxidative muscle (exercise trained) would be protected from acute lipid-induced IR compared to sedentary subjects. Eleven endurance-trained (ET), 11 obese (OS) and 11 lean sedentary (LS) subjects completed two 6-h insulin clamps with a co-infusion of saline or Intralipid. IMCL, DAG and ce-ramide, insulin signaling and glucose metabolism proteins and ex vivo mi-tochondrial respiration were measured in biopsy samples in a fasted and insulin-stimulated condition. ET (17.5±4.3) were more insulin sensitive (mg/kgFFM/min) at baseline compared to OS (10.7±3.9). Baseline IMCL tended to be higher in ET compared to OS and LS, while DAG, ceramide or other sphingolipids we not different. In response to Intralipid: All subjects were equally insulin resistant (-41.0±1.9%). IMCL increased similarly in all subjects

A11
For author disclosure information, see page 797.ADA-Funded Research
ORA
LS
STIMULUS-SECRETION COUPLING IN ISLET CELLS
minimal model (MINMOD). At baseline, African Americans had signifi cantly lower insulin sensitivity (Si) than Caucasians (2.5 vs. 4.4 P<0.0001), however pancreatic beta cell function as measured by the acute insulin response to glucose (AIRg), was signifi cantly higher in African Americans (1010 vs. 405, P<0.0001). BMI did not differ between groups, and there were no within-race differences by gender. Remarkably, while (Si) and glucose effectiveness (Sg)declined signifi cantly in Caucasians post-LPS (4.4 to 2.8 and 0.02 to 0.016, P<0.0001), there was no signifi cant change in African Americans (2.5 to 2.2 and 0.019 to 0.018). While baseline insulin sensitivity was lower in African Americans than in Caucasians, this appeared to be compensated for by a higher pancreatic beta cell function, indicating race-specifi c differences in maintaining glucose and insulin homeostasis. LPS induced a robust reduc-tion in insulin sensitivity in Caucasians, not observed in African Americans. The specifi c effect of infl ammation on insulin sensitivity may thus be dif-ferent in African Americans compared to Caucasians, providing insight into mechanisms of race differences in cardiometabolic traits.
38-ORCombined Training Improves Ex-vivo Skeletal Muscle Substrate Metabolism in Type 2 DiabeticsLAUREN M. SPARKS, NEIL M. JOHANNSEN, TIMOTHY S. CHURCH, ESTHER MOONEN-KORNIPS, MATTHIJS K. HESSELINK, STEVEN R. SMITH, PATRICK SCHRAUWEN, Maastricht, The Netherlands, Baton Rouge, LA, Orlando, FL
Type 2 diabetes (T2D) is a disease of disordered lipid and glucose metabo-lism. The current study investigated effects of 9-months of aerobic (AT), re-sistance (RT) or combined aerobic and resistance (ATRT) exercise training on mitochondrial content and ex vivo myocellular lipid oxidation in individuals with T2D. Fifty-two individuals (57.5 ± 7.6y, 34.8 ± 5.7kg/m2) from the HART-D study were randomized to 9-months of either AT (n=13), RT (n=17), ATRT (n=12) or non-exercise Control (n=10). Muscle biopsies were taken before and after intervention, and ex vivo palmitate, octanoate, pyruvate and ac-etate oxidation (14C labeled CO2 production) were measured. Mitochondrial DNA (mtDNA) copy number was assessed by qPCR. Data were not normally distributed and natural log transformed. All variables were similar across groups at baseline. Mitochondrial content was higher in RT and ATRT after intervention compared with Control (mean±95%CI; 1104±163 and 1106±192 vs. 793±150, resp; P<0.05 for both). Complete palmitate oxidation was higher after intervention in all exercise groups compared with Control (0.89±0.37, 1.07±0.40 and 1.27±0.55 vs. 0.35±0.16 nmol/2h/mg protein for AT, RT, ATRT vs. Control, resp; P<0.05); however, only AT and ATRT had higher complete to incomplete palmitate ratios compared with Control (0.26±0.10 and 0.56±0.29 vs. 0.06±0.03, resp; P<0.05). Complete pyruvate and acetate oxidation were signifi cantly higher after all 3 exercise modalities compared with Control (P<0.05 for all), while complete octanoate oxidation was signifi cantly higher after AT and ATRT compared with Control (1.20±0.53 and 1.16±0.52 vs. 0.34±0.16, resp; P<0.05). Nine months of RT and ATRT signifi cantly improves mitochondrial content in T2Ds. While AT and RT alone improve some aspects of ex vivo lipid oxidation, only ATRT improves all measures of lipid and carbo-hydrate oxidation indicating a combined exercise program as a more effec-tive lifestyle therapy to improve muscle substrate metabolism in T2Ds.
Supported by: NIH Grant DK068298 and VICI Grant 918.96.618
STIMULUS-SECRETION COUPLING IN ISLET CELLS
39-ORFunctional Evaluation of Islets from Infants With KATP Hyperinsu-linismPUJA PATEL, CHANGHONG LI, STEPHANIE GIVLER, FRANZ M. MATSCHINSKY, CHARLES A. STANLEY, DIVA D. DE LEON, Philadelphia, PA
Loss-of-function mutations in the KATP channel are the most common cause of congenital hyperinsulinism (KATPHI). The clinical phenotype of KAT-
PHI is characterized by severe fasting and protein-induced hypoglycemia. In contrast, glucose-stimulated insulin secretion is impaired. Islets from the KATPHI mouse model (SUR1-/- ) have elevated cytosolic calcium and respond to stimulation with amino acids but not glucose. Our goal is to examine the fuel responsiveness and cytosolic calcium changes in KATPHI human islets. We hypothesize that KATPHI islets will have similar responses as SUR1-/- islets. Islets from 27 diffuse HI cases (age 5.9 ± 2.3 m) were collected and com-pared to islets from cadaver donors. 21 HI cases have confi rmed disease-causing mutations in ABCC8 (n=19) or KCNJ11 (n=2). 6 cases were negative for mutations in either gene. Islet fuel responsiveness and calcium infl ux were examined by perifusion and static incubations. Basal insulin secretion in perifused KATPHI islets was greater than in controls (3.0 ± 0.5 vs. 0.4 ±
glucose disposal was 78% and 88% lower in OB and T2D (both P<0.005 vs. CON). Cytosolic DAGs were 180% and 220% greater in OB and T2D than in CON (both P<0.0001 vs. CON) while muscle ceramide content in OB and T2D were not increased compared to CON. In conclusion these data support the concept that DAG-induced activation of PKC is responsible for muscle insulin resistance during lipid infusion as well as in obese and type 2 diabetic individuals.
Supported by: DFG, DZD e.V., EFSD, Lilly, NIH (DK-49230, DK-045735)
36-OREffect of Macronutrients on Markers of Oxidative Stress, Proinfl am-matory Cytokines, Adipokines, CV Risk Factors and Lipid Peroxida-tion in Obese Non-Diabetic WomenABBAS E. KITABCHI, FRANKIE B. STENTZ, EBENEZER A. NYENWE, KRISTIN A. MCDANIEL, FRANCES A. TYLAVSKY, JIM Y. WAN, CHRISTOPHER W. SANDS, Memphis, TN
Various dietary macronutrients infl uence weight loss but metabolic ad-vantages of high-protein (HP) diet (30% protein, 30% fat, and 40% CHO) vs high-carbohydrate (CHO) diet (HC) (15% protein, 30%fat, 55% CHO) are not established. We assessed the effect of HP vs HC diets on biomarkers of insu-lin sensitivity, oxidative stress, cardiovascular risk (CVR), lipid peroxidation and weight loss for 6 months. Diets were designed as a 500 Kcal reduction from each subject’s resting energy expenditure and provided by prepack-aged foods on a weekly basis. The subjects were non-diabetic, obese, pre-menopausal females ages 20 to 50 years with BMI > 30 to < 55 who were randomized to the HP or HC diet. An Oral Glucose Tolerance Test (OGTT) and Meal Tolerance Test (MTT) (HP or HC) were done with sampling at 0, 30, 60, 90, and 120 minutes at baseline and 6 months. To date 23 (12 HP, 11 HC) women were studied in a randomized prospective protocol. Proinfl ammatory cytokines (TNF , IL6), markers of oxidative stress (dichlorofl uorescein - DCF), lipid peroxidation (MDA), insulin sensitivity (HOMA IR), CVR (BP,BMI, CRP, E-selectin), adiponectin and leptin were measured at baseline and 6 months.
HP (n=12) HC (n=11) Parameters Baseline 6 months p* Baseline 6 months p* p** BMI (kg/m2) 41.3 ± 1.8 37.3 ± 1.9 <0.001 37.4 ± 1.7 34.1 ± 1.6 0.002 0.391% Weight Loss 9.8 ± 1.4 <0.001 8.7 ± 1.8 <0.001 0.692BP (sys/diast) 130/84 ± 4/3 118/73 ±3/3 .01/.01 129/83 ± 3/3 119/74 ±3/3 .01/.01 .70/.81TG (mg/dl) 113 ± 16 86 ± 11 0.01 114 ± 13 95 ± 10 0.01 0.02hCRP (mg/L) 5.6 ± 4.8 3.83 ± 2.1 0.01 5.4 ± 4.7 4.0 ± 3.8 0.03 0.04E-Selectin (ng/ml) 42.6 ±1.3 37.4 ± 1.2 0.02 43.4 ± 1.4 39.7 ± 1.6 0.07 0. 03HOMA IR 4.1 ± 0.8 1.6 ± 0.2 0.01 3.9 ± 0.5 2.7 ± 0.3 0.02 0.04DCF (μM) 3.4 ± 0.2 2.3 ± 0.1 0.01 3.3 ± 0.3 2.8 ± 0.1 0.04 0.02MDA (μM) 1.3 ±0.07 0.6 ± 0.04 0.01 1.2 ± 0.08 0.9 ± 0.07 0.04 0.04TNF (pg/ml) 5.0 ± 2.8 4.08 ± 2.4 0.03 6.0 ± 3.0 5.5 ± 2.6 0.05 0.02IL-6 (pg/ml) 6.2 ± 4.2 5.8 ± 1.8 0.63 5.7 ± 4.4 5.4 ± 1.3 0.68 0.08Adiponectin (ng/ml) 5556 ± 81 5840 ± 87 0.01 5531 ± 77 5471 ± 69 0.6 0.01Leptin (ng/ml) 43.4± 3.7 29.6 ± 3.1 0.01 44.6 ± 3.9 33.1 ± 3.4 0.02 0.07% Compliance 94 89 0.646
The * indicates Wilcoxon Signed Rank Test and ** indicates Wilcoxon Rank Sum Test for 6 months HP vs HC Although both diets demonstrated signifi cant but similar improvement in weight loss, and BP; with similar compliance, the HP diet exhibited greater improvement in insulin sensitivity, CV Risk Factors, adipokines, lipid peroxidation and infl ammatory parameters than the HC diet.
37-ORAcute Endotoxemia Reduces Insulin Sensitivity and Glucose Effec-tiveness in Healthy Caucasians, but not in African AmericansRHIA Y. SHAH, JANE F. FERGUSON, RACHANA SHAH, MICHAEL R. RICKELS, NE-HAL N. MEHTA, MUREDACH P. REILLY, Philadelphia, PA
Previous studies have shown marked variation in metabolic responses to endotoxemia and have supported the importance of insulin resistance in cardiometabolic disease. We hypothesized that the change in insulin sensitivity induced by endotoxemia may differ by race and gender. Healthy volunteers (ages 18-45, BMI (body mass index) 18-30, 47% female, African American N=30 and Caucasian N=69), recruited as part of the Genetics of Evoked-Responses to Niacin and Endotoxemia (GENE) Study, were subjected to an inpatient endotoxin challenge (1ng/kg lipopolysaccharide (LPS)). Insu-lin and glucose values obtained during a frequently sampled intravenous glucose tolerance test (FSIGTT) pre- and post-LPS were analyzed using the

A12
For author disclosure information, see page 797. ADA-Funded Research
ORA
LSSTIMULUS-SECRETION COUPLING IN ISLET CELLS
long chain saturated MAGs that activate insulin exocytosis via Munc 13-1. ABHD6 is the major MAG hydrolase in the -cell and is a new target for the development of anti-diabetic drugs.
42-ORGck-Mody Due to Protein Misfolding, Cellular Self-Association and DegradationMARIA NEGAHDAR, BENTE B. JOHANSSON, INGVILD AUKRUST, JANNE MOLNES, JØRN SAGEN, KNUT DAHL-JØRGENSEN, ANDERS MOLVEN, FRANZ M. MATSCH-INSKY, ROHIT N. KULKARNI, ODDMUND SØVIK, TORGEIR FLATMARK, PÅL R. NJØLSTAD, LISE BJØRKHAUG, Bergen, Norway, Oslo, Norway, Philadelphia, PA, Boston, MA
Heterozygous inactivating mutations in the glucokinase (GK) encoding gene (GCK) generally increase the threshold for glucose-stimulated insulin secretion, resulting in mildly elevated fasting plasma glucose levels (5.5-8.0 mmol/L) and maturity-onset diabetes of the young (GCK-MODY). The purpose of the present study was to address the question whether protein misfolding and instability could be the molecular basis for the previously unexplained GCK-MODY mutations S263P, G264S and R275C. These muta-tions, when expressed as recombinant mutant proteins, have demonstrated near-normal (wild-type) enzyme kinetics and normal interactions with known regulatory proteins. Here, an instability of the recombinant mutant proteins was observed by limited proteolysis (S263P and G264S) and by an in vitroubiquitin-proteasomal degradation system (all three mutants). The recovery and molecular properties of the mutant proteins were investigated in stably transfected MIN6 -cells and HEK293 cells. All three mutants revealed an increased rate of cellular degradation with a contribution of both the lyso-somal and proteasomal quality control systems. Moreover, the mutations lead to misfolded and conformationally unstable proteins causing dimeriza-tion and aggregation (R275C>G264S>S263P), and were recovered both in the cytosol and in a subcellular fraction enriched in lysosomes. Our structural analyses demonstrate that the residues S263, G264 and R275 contribute to the stability of the F260-L270 loop structure, and that the single point muta-tions elicit conformational changes in the loop structure which is considered to promote the dimerization of their mutant proteins by a domain swapping mechanism. Our data underline the importance of a cell biological approach to fully characterize the GCK-MODY mutant enzymes, and suggests a pos-sible new therapeutic approach by prevention of self-association (conforma-tional rescue) of some mutant proteins using bioactive small molecules.
43-ORThe Roles of Voltage-Gated Potassium Channels Kv2.1 and Kv2.2 in the Regulation of Insulin and Somatostatin Release from Pancreatic IsletsXIAOYAN NINA LI, Rahway, NJ
Objectives: To defi ne the role(s) of voltage-gated potassium channel Kv2.1 and Kv2.2 in the regulation of islet hormone secretion. Research Design and Methods: Using genetic and pharmacological approaches, we examined the effects of Kv2 inhibition on insulin and somatostatin release in isolated is-lets and perfused pancreata, as well as in glucose tolerance in vivo. Results: Pancreatic -cells from Kv2.1-/- mice possess reduced Kv current and display greater glucose-stimulated insulin secretion (GSIS) relative to wild-type
-cells. Inhibition of Kv2 channels with peptidyl (GxTX-1E) or selective small molecule (RY796) inhibitors enhanced GSIS in isolated mouse and human islets. However, in wild-type mice neither inhibitor improved glucose toler-ance in vivo, and this lack of glucose lowering effect was associated with an increase in plasma somatostatin levels. GxTX-1E and RY796 enhanced somatostatin release in isolated human and mouse islets and perfused pancreata from WT and Kv2.1-/- mice; Moreover, Kv2.2 silencing in mouse islets by adenovirus-shRNA specifi cally enhanced islet somatostatin, but not insulin, secretion. In mice lacking somatostatin receptor 5, GxTX-1E sig-nifi cantly elevated plasma insulin and improved glucose tolerance. Conclu-sions: Kv2.1 and Kv2.2 channels play distinct roles in pancreatic islets - with Kv2.1 primarily regulating insulin secretion in -cells and Kv2.2 modulating somatostatin release in -cells. Paracrine somatostatin is a powerful inhibi-tor of -cell function and can counteract mechanisms that normally would enhance insulin secretion, such as Kv2.1 inhibition. Development of selective Kv2.1 inhibitors may provide new avenues to promote GSIS for the treatment of type 2 diabetes.
0.1 ng/150 islets/min, p<0.01). Basal [Ca2+]i was higher compared to controls (1.68 ± 0.07 vs. 0.86 ± 0.03 - 340/380 ratio, p<0.01). Opposite to controls, [Ca2+]i and insulin secretion in KATPHI islets increased after stimulation with amino acids but not glucose. Exendin (9-39), a GLP-1 receptor antagonist, inhibited amino acids-stimulated insulin secretion in KATPHI islets. Islets from 3 cases with clinical phenotype of KATPHI but without confi rmed mutations exhibited the same fuel responsiveness as islets from genetically confi rmed KATPHI cases. In summary, KATPHI islets replicate the islet phenotype of the SUR1-/- mouse and are congruent with the clinical phenotype. The stimula-tory effect of amino acids in KATPHI islets may be mediated by the GLP-1 receptor. Overall, the clinical and islet phenotype may help elucidate the pathophysiology in cases without confi rmed mutations. Further studies may reveal specifi c genotype-phenotype correlations.
Supported by: The Goldsmith Foundation
40-ORPlasma Membrane Electron Transport Regulates Redox Status and Insulin Secretion in Pancreatic Beta CellsJOSHUA P. GRAY, GARY W. CLINE, REBECCA F. FOLLMER, EMMA A. HEART, New London, CT, New Haven, CT, Woods Hole, MA
Plasma Membrane Electron Transport (PMET) mediates the oxidation of intracellular reducing equivalents and the transfer of their electrons to extracellular targets. PMET, a plasma membrane analog of the mitochon-drial electron transport chain, consists of a family of cytosolic and plasma membrane oxidoreductases, electron carriers and terminal acceptors. PMET activity, measured by the degree of reduction of extracellular membrane im-permeable electron acceptors (ferricyanide and WST-1), is proportional to the concentration of glucose in beta cells. Using INS-1 832/13 cells and iso-lated islets from NQO1 knockout mice, we have investigated role of NQO1, a NAD(P)H-dependent cytosolic oxidoreductase and component of PMET, on beta cell intermediary metabolic pathways and glucose-stimulated insulin secretion (GSIS). Adenoviral-mediated over-expression of NQO1 increased PMET activity in parallel to a decrease in the NADH/NAD+ ratio in INS-1 832/13 cells, in accordance with PMET-dependent re-oxidation of NADH. Since the NADH/NAD+ ratio regulates glycolytic fl ux, the effect of NQO1 over-expression on glucose oxidation and utilization was measured. NQO1 over-expression increased glucose oxidation and utilization and enhanced insulin secretion in response to stimulatory glucose levels. In contrast, INS-1 832/13 cells with adenoviral-mediated NQO1 knock-down and NQO1-KO islets had decreased PMET, elevated NADH/NAD+ ratio, decreased glucose oxidation and utilization and decreased GSIS. These data demonstrate a critical role for the PMET/NQO1 axis in the regulation of beta cells NADH redox status, glycolytic fl ux and insulin secretion.
Supported by: R56DK088093
41-ORLipolysis-Derived Long Chain Saturated Monoacylglycerol as a Meta bolic Coupling Factor in Glucose-Stimulated Insulin SecretionSHANGANG ZHAO, JOSE IGLESIAS, YVES MUGABO, VIVIANE DELGHINGARO-AUGUSTO, IAN BOUDREAU, ROXANE LUSSIER, MARCO PINEDA, MARIE-LINE PEYOT, ERIK JOLY, MURTHY MADIRAJU, MARC PRENTKI, Montreal, QC, Canada
Glycerolipid/free fatty acid cycle and its lipolytic segment are essential components of the lipid amplifi cation pathway of glucose stimulated insulin secretion (GSIS) by -cells. However, little is known about the molecular na-ture of the lipid metabolic coupling factor(s) involved in this process. We now provide evidence that monoacylglycerol (MAG) acts as a metabolic coupling factor in GSIS. Obliterated GSIS, due to lipolysis inhibition in -cells with orlistat, is restored by exogenous MAG. In rat islets and INS832/13 -cells MAG levels increase in the presence of high glucose concentration. Inhibi-tion of the major membrane-bound MAG hydrolase, ABHD6, in INS832/13 cells and islets with WWL70 leads to accumulation of MAG with concomi-tant increase in GSIS. The predominant MAG species elevated by high glu-cose as well as by WWL70 addition are the saturated long chain MAGs 1-stearoylglycerol (C18:0) and 1-palmitoylglycerol (C16:0), which strongly potentiate GSIS in vitro, unlike monounsaturated and polyunsaturated MAGs. Overexpression and RNAi-knockdown of ABHD6 in INS832/13 cells, resulted in decreased and increased GSIS, respectively. Administration of WWL70 (i.p.) in normal CD-1 mice enhance GSIS, and it greatly improves glucose tolerance by increasing insulin secretion in the low-dose streptozo-tocin type 2 diabetes mouse model. We also show that MAGs can bind the C1-domain of the exocytotic effector protein, Munc13-1 more effi ciently than diacylglycerol, and as effi ciently as the phorbol ester PMA, an established activator of Munc13-1. Collectively, the results provide strong evidence that the lipid amplifi cation arm of GSIS in -cells is mediated by lipolysis-derived

A13
For author disclosure information, see page 797.ADA-Funded Research
ORA
LS
DIABETIC DYSLIPIDEMIA
46-ORPhosphatidylinositol 4,5-Biphosphate Modulates Interaction of Syntaxin-1A With Sulfonylurea Receptor 1 to Regulate Pancreatic Beta-Cell ATP-Sensitive Potassium ChannelsTAO LIANG, CHRISTIN CHAO, YOUHOU KANG, TAIRAN QIN, LI XIE, HERBERT Y. GAISANO, Toronto, ON, Canada
Pancreatic beta-cell regulates glucose-stimulated insulin secretion through association with ATP-sensitive potassium (KATP) channels. We previously demonstrated that syntaxin (Syn)-1A, a SNARE protein mediating exocytotic fusion, binds and inhibits the KATP channels at its sulfonylurea receptor (SUR) 1 regulatory subunit. Phosphatidylinositol 4,5-biphosphate (PIP2) participates in a wide variety of cellular functions including regulation of KATP channel by its direct action on the Kir6.2 subunit, and also from interactions with various exocytotic fusion proteins, including syn-1A. In this study, we have hypothesized that these actions of PIP2 on Syn-1A could infl uence Syn-1A interactions with SUR1 to affect KATP channel activities in rat islet beta-cells, using FRET assay and patch clamp electrophysiology. FRET data showed that PIP2 can disrupt the intimate FRET interactions of full length SUR1 and Syn-1A on the plasma membrane in living cells. To examine whether PIP2 could block Syn-1A inhibition of SUR1/KATP chan-nel current, we performed inside-out patch-clamp recordings in INS-1E cells and found that exposure to PIP2 can fully recover the Syn-1A-inhibitory. To delineate the physiological relevance of our fi ndings in INS-1E, we employed rat islet beta-cells using whole-cell recordings. Dialysis of GST-Syn-1A with PIP2 gave a maximum KATP current density equal to GST control, compared to much reduced current by GST-Syn-1A alone. Taken together, our results demonstrate that application of PIP2 could disrupt the molecular interac-tion between Syn-1A and SUR1, which abolished Syn-1A inhibitory on KATP channels. Our fi ndings suggest the effect of membrane lipid composition on beta-cell insulin secretion is contributed by its profound consequences on membrane electrical activity through several modes of actions, now includ-ing regulating Syn-1A interactions with SUR1.
Supported by: CIHR
DIABETIC DYSLIPIDEMIA
47-ORLong-Term Atorvastatin Administration Improves Barorefl ex Sensi-tivity in Subjects With Type 2 Diabetes and DyslipidaemiaPINELOPI GRIGOROPOULOU, IOANNA ELEFTHERIADOU, CHRISTOS ZOUPAS, DE-SPOINA PERREA, STAUROS LIATIS, KONSTANTINOS MAKRILAKIS, NICHOLAS TENTOLOURIS, Athens, Greece
Barorefl ex sensitivity (BRS) is reduced in patients with type 2 diabetes mellitus (T2DM), even in the absence of clinically apparent autonomic neu-ropathy. Statins improve endothelial function and BRS in subjects without diabetes. However, no data exist on the effect of treatment with statins on BRS in individuals with T2DM. This study examined the effect of chronic administration of low dose of atorvastatin on BRS in subjects with T2DM. A total of 76 patients with T2DM and dyslipidemia were recruited. The main inclusion criteria were age between 40-75 years, low density lipoprotein cholesterol (LDLc) 100 mg/dl and absence of clinically apparent macro-vascular disease.. Forty-three patients (15 men/28 women) were assigned to atorvastatin (10 mg per day) and low-fat diet and 33 age-matched pa-tients (15 men/18 women) to low-fat diet only. Both groups were compa-rable regarding baseline serum lipids, HbA1c, arterial blood pressure and BRS values. BRS was measured by the sequence method using the BaroCor system (Atcor Medical, Australia). All patients underwent 3 more visits, at 3,6 and 12 months, during which the same blood tests and BRS estima-tion were repeated. Atorvastatin signifi cantly reduced total cholesterol by 27.30% (from 235.88 ± 28.41 mg/dl to 170.05 ± 21.33 mg/dl, p < 0.001), LDLc by 36.9% (from 154.91 ± 26.41 mg/dl to 96.42 ± 22.65 mg/dl, p < 0.001) and TG by 12.86% (from 147.30 ± 71.46 mg/dl to 117.42 ± 56.03 mg/dl, p = 0.001) after 12 months.nBRS was signifi cantly improved in atorvastatin treated pa-tients after 12 months therapy from 6.38 ± 2.90 msec/mmHg to 8.08 ± 4.35 msec/mmHg (p=0.007). Diet had no infl uence on BRS values. No difference in BMI, arterial blood pressure, heart rate, HbA1c, and fasting glucose was observed at both groups compared with baseline. Long-term administration of low dose of atorvastatin, beyond the benefi cial effects on plasma lipids, improves BRS in dydlipidaemic subjects with T2DM.
44-ORGlucose Dependent Down Regulation of GLP-1 ReceptorSINDHU RAJAN, ELIZABETH MATHEW, BARTON WICKSTEED, LOUIS H. PHILIP-SON, Chicago, IL
Glucagon Like Peptide-1 based therapy is central to the treatment of Type 2 diabetes. Activation of GLP-1 receptor (GLP-1R) results in rapid elevation of cAMP and enhanced insulin secretion. However, the incretin effect may be signifi cantly reduced in diabetes. We show for the fi rst time that for-ward traffi cking of GLP-1R to the plasma membrane in pancreatic beta cells is impaired in hyperglycemia and Protein Kinase A (PKA) dependent post-translational modifi cation by SUMO (Small Ubiquitin-like Modifi er protein) is an important contributing mechanism. Pancreatic islets and insulinoma cells exposed to high glucose conditions showed diminished GLP-1R density at the plasma membrane. Hyperglycemia augmented expression levels of SUMO and SUMO conjugating enzyme, Ubc-9. Elevated SUMO levels resulted in impaired cell surface traffi cking of the GLP-1R and attenuated receptor sig-naling. In addition, elevated expression of SUMO also inhibited insulin secre-tion and caused reduced insulin content. The role of hyperglycemia induced SUMO modifi cation in GLP-1R function was evaluated in mouse islets by par-tial knock-down of SUMO conjugating enzyme Ubc-9 by retroviral shRNA. GLP-1R agonist stimulated insulin secretion was signifi cantly enhanced in Ubc-9 shRNA transduced mouse islets exposed to high glucose concentra-tions. A dynamic FRET based real-time protein interaction assay between GLP-1R-CFP and YFP-SUMO showed that SUMO modifi cation of GLP-1R is dependent on PKA activity. Increasing cAMP levels or expression of con-stitutively active PKA resulted in intracellular retention of the GLP-1R, both in high and low glucose. Furthermore, down-regulation of PKA activity by expressing a dominant negative PKA subunit was able to reverse SUMO me-diated glucose induced intracellular retention of the receptor. We conclude that a glucose induced “phospho SUMIOyl switch” modulates the function of GLP-1R. Understanding the mechanisms that regulate GLP-1 receptor will help improve drug effi cacy of GLP-1 based treatments.
Supported by: NIDDK, Merck (IISP)
45-ORWFS1 Protein Regulates Insulin Granule Exocytosis via Mainte-nance of Intragranular Acidifi cation and Modulation of the SNARE ProteinsMANABU KONDO, MASAYUKI HATANAKA, KATSUYA TANABE, YASUHARU OHTA, YUKIO TANIZAWA, Ube, Japan
Wolfram syndrome (WFS) is an autosomal recessive disorder character-ized by juvenile-onset diabetes mellitus and optic atrophy. The gene respon-sible for the disorder, WFS1, encodes a transmembrane protein. Previous studies suggested that WFS1 protein localizes to endoplasmic reticulum (ER) and is related to ER stress responses. Recently we found that WFS1 protein also localizes to insulin secretory granules and determines granule acidifi ca-tion. Intragranular acidifi cation is essential for priming of insulin secretory granule. However, the role of WFS1 protein in glucose-stimulated insulin secretion (GSIS) is still unknown. Moreover, detailed analyses of insulin dynamics of WFS1-defi cient beta cell have not been performed yet. In the present study, we conducted in vivo and in vitro experiments to elucidate the role of WFS1 protein in GSIS. All the experiments were performed with young Wfs1-null mice (8-10 weeks of age), because both beta cell mass and pancreatic insulin content were similar to those of wild type mice at this age. In perfusion experiments with 16.7 mM glucose, GSIS, especially in the fi rst phase, was markedly blunted in Wfs1-null mice. Stimulatory effect of high K+
was also impaired in these experiments. Exendin-4 remained stimulatory in Wfs1-null mice (fi rst phase = 3.2 fold increase; second phase = 4.4 fold in-crease), but stimulation was nevertheless reduced relative to wild type (3.8 fold and 10.5 fold, respectively). These results were consistent with static incubation study using isolated islets, and ipGTT. Western blot analysis of WFS1-defi cient islets revealed signifi cantly decreased expression level of Syntaxin1A and SNAP25, both of them are reported to be involved in the fi rst phase insulin secretion. Taken together, these results suggest that WFS1 protein play an important role in granule exocytosis, especially in the trig-gering pathway, via maintenance of granular acidifi cation and modulation of SNARE proteins.

A14
For author disclosure information, see page 797. ADA-Funded Research
ORA
LSDIABETIC DYSLIPIDEMIA
in gastric emptying. This fi nding expands our understanding of the effects of exenatide in metabolic regulation beyond its primary therapeutic role in regulation of glucose homeostasis.
Supported by: CIHR
50-ORGlycine Normalizes Hepatic Triglyceride-Rich VLDL Secretion by Triggering the CNS in High-Fat Fed RatsJESSICA T. YUE, PATRICIA I. MIGHIU, MARK NAPLES, KHOSROW ADELI, TONY K. LAM, Toronto, ON, Canada
Dysregulation of hepatic triglyceride-rich very low-density lipoproteins (VLDL-TG) in obesity and type 2 diabetes contributes to the dyslipidemia that leads to cardiovascular morbidity. The hypothalamus regulates hepatic lipid metabolism, but it is unknown whether extrahypothalamic regions, such as the dorsal vagal complex (DVC), regulate VLDL-TG. Given that gly-cine enhances CNS N-methyl-D-aspartate receptor (NMDAr)-mediated transmission, we here tested whether glycine regulates hepatic VLDL-TG secretion by potentiating NMDAr-mediated transmission in the DVC. Using 10-h fasted male Sprague-Dawley rats implanted with stereotaxic cannulae into the DVC and vascular catheters to enable direct DVC infusion and blood sampling, respectively, the rate of hepatic VLDL-TG secretion was measured following tyloxapol injection. Direct DVC glycine infusion lowered VLDL-TG secretion (saline, n=5: 0.051±0.002 vs. glycine, n=12: 0.041±0.002 mmol/L·min; P<0.01). DVC NR1 subunit of NMDAr antagonist 7-chlorokynurenic acid (n=11, 0.053±0.003; P<0.02 vs. glycine), DVC injection of NR1 shRNA (n=9, 0.052±0.002; P<0.01 vs. glycine), and hepatic vagotomy (n=8, 0.053±0.003; P<0.02 vs. glycine) nullifi ed glycine’s effect. Finally, DVC glycine normalized the hypersecretion of VLDL-TG induced by high-fat feeding (HFF+saline, n=9: 0.061±0.003 vs. HFF+glycine, n=8: 0.049±0.003; P<0.03). In summary, mo-lecular and pharmacological inhibition of the NR1-containing NMDAr in the DVC negated the ability of glycine to inhibit hepatic secretion of VLDL-TG in vivo. Importantly, the hypersecretion of hepatic VLDL-TG induced by high-fat feeding was restored by the hepatic lipid control of DVC glycine sensing. These fi ndings suggest that glycine or a glycine analogue may have thera-peutic benefi ts in lowering plasma lipid levels in diabetes and obesity by triggering the CNS.
Supported by: CIHR (TKT Lam, MOP-86554)
51-ORGenome-Wide Association Study of Genetic Determinants of LDL-c Response to Atorvastatin Therapy: Importance of Lp(a)HELEN M. COLHOUN, HARSHAL DESHMUKH, TOBY JOHNSON, PAUL M. MCK-EIGUE, D. JOHN BETTERIDGE, PAUL DURRINGTON, JOHN FULLER, SHONA LIV-INGSTONE, VALENTINE CHARLTON-MENYS, ANDREW NEIL, NEIL POULTER, PETER SEVER, DENIS SHIELDS, ALICE STANTON, AUROBINDO CHATTERJEE, CRAIG HYDE, ROBERTO CALLE, DAVID DEMICCO, MARK CAULFIELD, GRAHAM HITMAN, Dundee, United Kingdom, London, United Kingdom, Edinburgh, United Kingdom, Manchester, United Kingdom, Oxford, United Kingdom, Dublin, Ireland, New York, NY
We carried out a genome wide association study of LDL-c response to statin using data from participants in the CARDS trial (n=1156), ASCOT trial (n=895) and the observational phase of ASCOT (n=651), all prescribed atorvastatin 10 mg. Following genome wide imputation, we combined data from the three studies in a meta-analysis. We found associations of LDL-c response to atorvastatin that reached genome-wide signifi cance at rs10455872 (p=6.13 x 10⁻⁹) within the LPA gene and at two SNPs within the APOE region (rs445925; p= 2.22 x 10⁻¹⁶ and rs4420638; p=1.01 x 10⁻¹¹) that are proxies for 2 and 4 variants in APOE respectively. Using CARDS data we further showed that atorvastatin therapy did not alter Lp(a) and that Lp(a) levels, accounted for all of the association of SNPS in LPA gene and apparent LDL-c response levels . However statin therapy had a similar effect in reducing CVD in patients in the top quartile for serum Lp(a) lev-els (HR=0.60) compared with those in the lower three quartiles (HR=0.66) (p=0.8 for interaction). Lp(a) levels, accounted for all of the association of SNPs in LPA gene and apparent LDL-c response. The data emphasise that high Lp(a) levels affect the measurement of LDL-c and the clinical estima-tion of LDL-c response. Therefore, an apparently lower LDL-c response to statin therapy may indicate a need for measurement of Lp(a). However statin therapy seems benefi cial even in those with high Lp(a).
Supported by: Pfi zer
48-ORFavorable Effect of Intensive Glucose Lowering on Lipoprotein Par-ticle Profi lesJURAJ KOSKA, ARAMESH SAREMI, GIDEON BAHN, PETER D. REAVEN, FOR VET-ERANS AFFAIRS DIABETES TRIAL (VADT), Phoenix, AZ, Hines, IL
Intensive glucose-lowering therapy (INT) did not reduce cardiovascu-lar (CV) risk outcomes in randomized trials, possibly because INT did not improve, or worsened, lipid profi les. Increased prevalence of small dense particles within both low- and high-density lipoprotein (LDL and HDL) frac-tions is common in diabetes and is associated with greater CV risk. Standard plasma lipids and cholesterol content of lipid subfractions (via the vertical auto profi le assay) were therefore determined in 262 subjects from a sub-study of the VA Diabetes Trial (VADT) at baseline and after 9 months of INT or standard therapy (STD). Despite greater increases in BMI (medians, 4% INT vs. 1% STD, p<0.001), INT reduced triglycerides (11% vs. 0%, p<0.01), did not change total LDL cholesterol but increased total HDL cholesterol (9% vs. 4%, p<0.05). INT also caused greater decreases in pro-atherogenic dense LDL4, and larger increases in less dense LDL2 and HDL2 subfractions, while STD slightly increased LDL1 only (Figure).
Figure: Changes in LDL and HDL subclasses after 9 months. Plot outlines (top to bottom): 95th, 75th, 50th, 25th & 5th percentile; *p<0.05, 9 months vs. baseline.
In conclusion, in addition to lowering glucose, INT was associated with improved lipid levels and a favorable shift in LDL and HDL particle profi le patterns. The lack of benefi t of INT on CV risk reported in the VADT despite these lipid changes may be due to (1) their relatively modest magnitude, (2) a limited role for TG, LDL and HDL particle size in modulating CV risk in ad-vanced type 2 diabetes and/or (3) factors (e.g. BMI) that were not improved or possibly worsened with INT.
Supported by: VA CSP465, NIH R01067690, P01HL076491, P01HL77107, P01HL70621
49-ORExenatide, a Glucagon-Like Peptide Receptor Agonist, Acutely In-hibits Intestinal Lipoprotein Production in Healthy HumansCHANGTING XIAO, ROBERT H. BANDSMA, SATYA DASH, LINDA SZETO, GARY F. LEWIS, Toronto, ON, Canada, Groningen, The Netherlands
Incretin-based therapies for the treatment of type 2 diabetes improve plasma lipid profi les and postprandial lipemia, but their exact mechanism of action remains unclear. Here we examined the acute effect of the GLP-1 receptor agonist, exenatide, on intestinal and hepatic triglyceride-rich lipoprotein (TRL) production and clearance in healthy humans. Fifteen nor-molipidemic, normoglycemic men underwent two studies each (s.c. 10 ug exenatide vs placebo), 4-6 weeks apart, in random order, in which TRL par-ticle kinetics were examined with a primed, constant infusion of deuterated leucine and analyzed by multicompartmental modeling, under pancreatic clamp conditions. A fed state was maintained during each study by infusing a high fat, mixed macronutrient, liquid formula at a constant rate directly into the duodenum via a nasoduodenal tube. Exenatide signifi cantly sup-pressed the plasma concentration (exenatide 1.83 ± 0.30 vs placebo 1.24 ± 0.19 mg/L, P<0.05) and production rate (exenatide 0.12 ± 0.02 vs placebo 0.08 ± 0.02 mg/kg/day, P<0.05) of TRL-apoB-48. TRL-apoB-100 concentrations and production rates were not signifi cantly different between exenatide and placebo. These results suggest a possible direct effect of exenatide on intestinal lipoprotein particle production, independent of changes in body weight and satiety as seen in chronic studies, and independent of changes

A15
For author disclosure information, see page 797.ADA-Funded Research
ORA
LS
INCRETIN THERAPIES
54-ORHypertriglyceridemic Waist Does Not Predict Metabolic Triad in Men of African DescentSOPHIA S. YU, NATALIE L. RAMSEY, DARLEEN C. CASTILLO, MADIA RICKS, ANNE E. SUMNER, Bethesda, MD
Hypertriglyceridemic waist (HTGW) identifi es the Metabolic Triad, a set of three factors highly associated with cardiovascular disease (CVD). These three factors are: hyperinsulinemia, hyperapoB and sdLDL. As HTGW con-sists of only 2 criteria, waist circumference (WC) 90 cm and triglyceride (TG) 177 mg/dL, it is simple, inexpensive, and has potential for worldwide use as a screening test. However, HTGW has never been validated in Afri-cans or African Americans. Of particular concern is that TG levels are lower in blacks than other races and ethnicities. Therefore, we determined in 146 black men (71 Africans, 75 African American) (age: 35±8y, BMI: 28.5±5.4 kg/m2) the ability of HTGW to predict the Metabolic Triad. While the preva-lence of Metabolic Triad was 42%, only 7% of black men had both HTGW and Metabolic Triad (Table). Hence, HTGW failed to predict Metabolic Triad because less than 10% of black men met the TG threshold of 177 mg/dL (Figure). In fact, the mean TG level in black men with Metabolic Triad was only 97±44 mg/dL. Therefore, screening tests such as HTGW which require hypertriglyceridemia to detect CVD risk are unlikely to be effective in African or African American men.
Table: CharacteristicsMetabolic Triad
Absent (n=85)Metabolic TriadPresent (n=61)
P-value
% HTGW 0% 7% 0.02WC (cm) 89 ± 12 101 ± 14 <0.01TG (mg/dL) 64 ± 28 97 ± 44 <0.01Insulin (mU/mL) 3.9 ± 3.8 8.4 ± 4.8 <0.01ApoB (mg/dL) 72 ± 21 100 ± 24 <0.01LDL Size (nm) 21.3 ± 0.6 20.6 ± 0.5 <0.01
INCRETIN THERAPIES
55-OROnce-Weekly GLP-1 Receptor Agonist Albiglutide vs. Titrated Pran-dial Lispro Added on to Titrated Basal Insulin Glargine in Type 2 Diabetes (T2D) Uncontrolled on Glargine Plus Oral Agents: Similar Glycemic Control With Weight Loss and Less HypoglycemiaJULIO ROSENSTOCK, BO AHREN, FRANCIS CHOW, VIVIAN FONSECA, JORGE GROSS, ROBERT RATNER, SUSAN JOHNSON, MURRAY STEWART, FRED YANG, LAWRENCE LEITER, Dallas, TX, Lund, Sweden, Hong Kong, China, New Orleans, LA, Rio Grande do Sul, Brazil, Hyattsville, MD, Research Triangle Park, NC, King of Prussia, PA, Toronto, ON, Canada
GLP-1 receptor agonists (RA) and prandial insulin are 2 options for advanc-ing T2D uncontrolled on insulin glargine (GL) + oral agents. Harmony 6 was a randomized, open label, active controlled trial with primary endpoint at week 26 and continued treatment to week 52 that tested once weekly (QW) albiglutide (ALBI), a GLP-1 RA, vs prandial insulin lispro (LIS) both combined with titrated GL. Basal insulin-treated patients (mean A1C 8.4%, FPG 152
52-ORAlterations in Intestinal Insulin Signaling in Obese Subjects and their Effect on Lipid and Lipoprotein MetabolismALAIN VEILLEUX, ÉMILIE GRENIER, ANDRÉ CARPENTIER, DENIS RICHARD, ÉMILE LEVY, Montreal, QC, Canada, Sherbrooke, QC, Canada, Quebec, QC, Canada
Insulin resistance, a central feature of type 2 diabetes (T2D), is commonly associated with atherogenic dyslipidemia. Impaired hepatic VLDL produc-tion and clearance are known to play a key role, but mounting evidence in-dicates the active implication of the small intestine in this hyperlipidemia. The present study aimed to establish whether alterations in small intestine insulin sensitivity modify intestinal lipid and lipoprotein homeostasis in obese insulin-resistant compared to obese insulin-sensitive subjects. Mark-ers of insulin sensitivity, oxidative stress and infl ammation as well as of lipid, cholesterol, apolipoproteins (apo) and lipoprotein homeostasis were analyzed in small intestine sections obtained from obese subjects undergo-ing bariatric surgery. In obese insulin-resistant subjects, we observed: (a) a defect in insulin signaling as pointed out by a decreased phosphorylation of insulin receptor, insulin receptor substrate-1 and Akt as well as an increased phosphorylation of p38 MAPK; (b) a higher level of lipid peroxidation mark-ers, including malondiadehyde, which support the occurrence of oxidative stress; (c) a higher TNF- and IL-6 levels, suggesting a local infl ammatory state; (d) an increased protein levels of fatty acid-binding proteins, SR-B1 cholesterol transporter, SAR1B and microsomal triglyceride transfer protein; and fi nally (e) an elevated lipogenesis rate and apo B-48 synthesis along with triglyceride-rich lipoprotein production. Accordingly, higher expression levels of transcription factors (SHREBP and LXR) were noticed in small intes-tine of obese insulin-resistant subjects. In conclusions, the small intestine could be classifi ed as an insulin-sensitive organ. Its deregulation, caused by oxidative stress and infl ammation, may lead to the amplifi cation of lipid and lipoprotein synthesis, which could therefore contribute to atherogenic dyslipidemia observed in metabolic syndrome and T2D in humans.
53-ORSignaling Through GPR119 Increases HDL Cholesterol and Reduces Post-Prandial TriglyceridesKATHLEEN K. BROWN, MANDY L. BERGQUIST, MELANIE K. SHADOAN, DEREK J. NUNEZ, ANDREW A. YOUNG, ANDREW J. CARPENTER, PAUL L. FELDMAN, Research Triangle Park, NC
In addition to its previously described activity in the endocrine pancreas and on enteroendocrine cells in the gastrointestinal tract, GPR119 is also a sensor for a range of endogenous fatty acid ligands. The receptor is likely to have a functional role in the integration and coordination of the systemic appearance of organic nutrients in part by releasing peptides necessary for their absorption and assimilation. However, additional biology with effects on lipid and lipoprotein metabolism has not been described. Using a random-ized crossover study design with a 4 wk washout period, we investigated the effects of chronic dosing with a potent and selective GPR119 agonist GSK1292263 (6 mg/kg) or vehicle in canine model (n=9), acclimatized to a diet high in saturated fat. Serum chemistries (glucose, FFAs, glycerol, trig-lycerides [TG], total and HDL Cholesterol [TC, HDLc]) were measured weekly. Lipoprotein profi les were evaluated by FPLC at the end of each treatment period and a 2 meal tolerance test was performed. By the 2nd wk of dosing with agonist, there was a signifi cant increase in TC and HDLc (21.5% and 16.4%, p=0.0008 and 0.0025, respectively) and the differences persisted throughout the active treatment period. The signifi cant differences by FPLC were an increase in the C content of HDL particles with remodeling of the particles and the appearance of “big HDL” on the chromatogram. In the 2 meal tolerance test, evaluation of paired data showed an average of 61% re-duction in the TG area under the curve for the 1st meal and a 57%% reduction in the AUC of the 2nd meal (p=0.0379 and p=0.0582 respectively). There was considerable variability in the TG AUC between the dogs. Fasting serum TGs in this study were not different between the treatments but as there was a signifi cant lowering in the prandial period, some aspects of the HDL remod-eling may have been driven by the triglyceride response. Other mechanisms such as effects on Apolipoprotein A1, phospholipid transfer protein and LCAT may also be implicated.

A16
For author disclosure information, see page 797. ADA-Funded Research
ORA
LSINCRETIN THERAPIES
tion following ischemia-reperfusion was signifi cantly prevented by chronic lixisenatide treatment. In conclusion, lixisenatide has shown, in a rat model of myocardial ischemia/reperfusion-induced injury, cardioprotective effects comparable to the ACE inhibitor ramipril.
Supported by: sanofi -aventis
57-ORZYOG1, A Novel Orally Effi cacious Peptidomimetic GLP-1 Receptor AgonistMUKUL R. JAIN, RAJESH BAHEKAR, AMIT JOHARAPURKAR, DEBDUTTA BAND-HYOPADHYAY, RAJESH SUNDAR, HARILAL PATEL, VISHWANATH PAWAR, Ahmedabad, India
GLP-1 (Glucagon-like Peptide) agonists have emerged as effective therapeu-tic agents for managing diabetes and obesity. Currently available GLP-1 ago-nists are all parenteral products. While these agents are effective in manag-ing diabetes, they cause nausea & vomiting. Using peptidomimetic approach, we have developed ZYOG1, a novel orally effi cacious GLP-1 receptor agonist. ZYOG1 is a potent and selective agonist of GLP-1 receptor. In an in vitro as-say using CHO cells stably transfected with hGLP1R, ZYOG1 showed concen-tration-dependent cAMP production with an EC50 of 6.6 nM. The agonistic activity of ZYOG1 was blocked by GLP-1 antagonist, Exendin 9-39. ZYOG1 dose-dependently increased glucose-stimulated insulin release in isolated mouse islets. When given orally to C57 mice, ZYOG1 showed dose-dependent reduction in glucose excursion during intraperitoneal glucose tolerance test, with an ED50 of 2.6mg/kg. In ob/ob and db/db mice, the animal models of diabetes, acute dosing of ZYOG1 at 2.6mg/kg or 10mg/kg signifi cantly reduced fed serum-glucose and glucose excursion during IPGTT with a concomitant elevation of plasma insulin levels. In a type 2 diabetic C57 mice model pre-pared by high fat diet feeding and low doses of streptozotocin injection, oral ZYOG1 not only lowered glucose during a 8 week treatment, but also reduced %HbA1c, indicating a long term glycemic control with this compound. ZYOG1 also reduced the body weight, adiposity and improved glucose homeostasis in a diet-induced obesity model in C57 mice and in genetically obese db/db mice, after a 4 weeks oral treatment. ZYOG1 is eliminated mainly via non-renal path-ways. Repeated-dose toxicity studies in Wistar rats and Beagle dogs revealed good safety profi le, and absence of any immunogenicity. ZYOG1 was devoid of any nausea or vomiting effects in relevant models including Beagle dogs. In conclusion, ZYOG1 represents a novel and orally effi cacious GLP-1 agonist for the safe and effective treatment of Type 2 Diabetes.
mg/dL, weight 92 kg) with A1C 7-10% ± oral agents (no sulfonylurea) entered a run-in standardization GL period followed by randomization to ALBI 30 mg QW (n = 282) or LIS (n = 281) and continued on metformin and/or TZD. GL was titrated to a target FPG 80-130 mg/dL. LIS was adjusted per prespeci-fi ed algorithm based on BG monitoring. ALBI could be uptitrated to 50 mg QW. A1C was reduced from baseline by −0.82% and −0.66% with ALBI and LIS, respectively, meeting the primary non-inferiority endpoint at week 26 with further A1C decreases by week 52 among completers. Weight changes were sustained to week 52: ALBI, −0.96 kg; LIS, +1.66 kg (Table). Mean GL dose increased in both groups. Adverse events of interest with ALBI/LIS were: nausea (13.0%/2.1%); vomiting (7.0%/1.4%), injection site reactions (9.5%/5.3%), and hypoglycemia (32.6%/49.8%). Once weekly ALBI may be-come a therapeutic option in T2D inadequately controlled on basal insulin to improve glucose control with a lower risk of hypoglycemia and signifi cant weight loss vs thrice daily LIS.
Week 26 (LOCF)a Week 52 (Completers)b
ALBI(n = 279)c
LIS(n = 278)c
Treatment Difference(95% CI)
PValue
ALBI(n = 121)c
LIS(n = 141)c
Treatment Difference(95% CI)
PValue
A1C, MA from BL, % ± SE
−0.82 ± 0.06
−0.66 ± 0.06
−0.16d
(−0.32,0.00)
< .0001 non-
inferiority
−1.01 ± 0.07
−0.85 ± 0.06
−0.17d
(−0.35,0.02)
.0861
A1C < 6.5%, n (%)
31(11.1)
23(8.3)
1.372e
(0.73,2.57)
.3518 18(14.9%)
17(12.1%)
1.057e
(0.48,2.34)
.7694
A1C < 7.0%, n (%)
83(29.7)
70(25.2)
1.21e
(0.78,1.88)
.3977 54(44.6%)
42(29.8%)
1.487e
(0.80,2.78)
.2301
FPG, MA from BL at week 26, mg/dL ± SE
−17.9 ± 2.95
−12.9 ± 2.96
−4.9d
(−13.2,3.3)
.2390 −26.7 ± 3.65
−15.5 ± 3.39
−11.2d
(−21.2,−1.2)
.0278
Weight, MA from BL at week 26, kg ± SE
−0.73 ± 0.19
+0.81 ± 0.20
−1.54d
(−2.09,−1.00)
< .0001 −0.96 ± 0.36
+1.66 ± 0.34
−2.61d
(−3.61,−1.62)
< .0001
GL dose, U ( from BL)
52(+5)
50(+7)
54(+7)
52(+8)
LIS dose, U ( from BL)
30(+14)
35(+19)
Hyperglycemiarescue, n (%)
61(21.6)
66(23.5)
123(43.6)a
109(38.8)a
.3260f
A1C, glycosylated hemoglobin; ALBI, albiglutide; BL, baseline; CI, confi dence interval; FPG, fasting plasma glucose; LIS, insulin lispro; LOCF, last observa-tion carried forward; MA, model-adjusted; SD, standard deviation. a Intent-to-treat population with last observation carried forward. b Observed cases pop-ulation with the exception of hyperglycemia rescue. c n listed is that of A1C; n varies slightly for different parameters. d ALBI minus LIS. e Odds ratio for ALBI vs LIS. f Log-rank test for overall hyperglycemia rescue for 1 year.
56-ORCardioprotective Effect of Chronic Treatment With Lixisenatide in an In Vivo Rat Model of Myocardial Ischemia/Reperfusion-Induced InjuryWOLFGANG LINZ, DOMINIK LINZ, PAULUS WOHLFART, ULRICH WERNER, THOM-AS HÜBSCHLE, HARTMUT RUETTEN, Frankfurt, Germany, Homburg/Saar, Germany
Effects of GLP-1R agonists on the cardiovascular system have been described recently. In isolated rat hearts, the GLP-1R agonist lixisenatide signifi cantly reduced infarct size after ischemia-reperfusion (I/R) ex vivo. In this study, the effect of chronic lixisenatide treatment vs placebo (PBO) on cardiovascular outcome after ischemia (30 min) and long-term reperfusion of the left coronary artery was investigated in vivo. Male Wistar rats (250-300 g) were randomized into 4 groups: 1. sham-operated controls without I/R (Sham); 2. I/R PBO; 3. I/R ramipril (1 mg/kg/d in chow; I/R RA); 4. I/R lixisen-atide (10 μg/kg/d s.c. via osmotic minipump). After 10 wk of treatment, heart function was investigated via tip catheter, an autopsy performed and lung weighed. Plasma brain natriuretic peptide (BNP) was determined as a marker of chronic heart failure. Lixisenatide signifi cantly attenuated I/R-induced de-terioration of diastolic function (Left Ventricular end-diastolic Pressure) and Tau Weiss, a measure of myocardial relaxation (Figure). Lung weight was sig-nifi cantly increased with PBO (a measure of congestion), but was normalized by lixisenatide and ramipril (Figure). Moreover, BNP levels were signifi cantly (p<0.05) reduced by either agent. Thus, deterioration of left ventricular func-

A17
For author disclosure information, see page 797.ADA-Funded Research
ORA
LS
INCRETIN THERAPIES
60-OREffects of Sitagliptin and Metformin Treatment on GLP-1 Responses to Oral Glucose and on the Incretin Effect in Patients With Type 2 DiabetesIRFAN VARDARLI, ELISABETH ARNDT, CAROLYN F. DEACON, JENS J. HOLST, LARS D. KÖTHE, MICHAEL A. NAUCK, Bad Lauterberg, Germany, Copenhagen, Denmark
DPP-4 inhibitors (sitagliptin; S) prevent inactivation of incretin hormones (GLP-1 and GIP). Metformin (M) may also increase GLP-1 levels. The present study was designed to study the infl uence of M, S, or their combination on GLP-1 responses after oral glucose and on the incretin effect. 20 patients with type 2 diabetes (age: 59 ± 7 yrs., duration of diabetes 5.1± 2.7 yrs., HbA1c: 7.0 ± 0.6 %, BMI 30.6 ± 3.0 kg/m2, means ± SD, drug-naïve/OAD mono-therapy, 6 weeks wash-out) entered a 4-period crossover trial with placebo, S (100 mg/d), M (escalation to 2000 mg/d), and M/S combination for 6 days (order randomized). On day 5, an oral glucose challenge (75 g) and on day 6, an “isoglycaemic” intravenous glucose infusion was performed. Glucose, insulin, C-peptide, insulin secretion rates (deconvolution), and GLP-1 (total and intact) were determined. Statistics: Repeated-measures ANOVA. Total GLP-1 in the fasting state was increased by M (p = 0.010) and not changed by S (p = 0.23). After oral glucose, M increased (p = 0.0018) and S decreased (p = 0.0055) total post-load GLP-1 (AUC). Intact GLP-1, fasting and post-load, increased with S (both p < 0.0001) and M (p = 0.06 and 0.0081, respectively). After oral glucose, only S (p = 0.0021), but not M (p = 0.39) augmented insulin secretion. Insulin secretion in response to oral glucose was higher than with ”isoglycaemic” intravenous glucose with all treatments (p < 0.01). Numeri-cally, the incretin effect (placebo: 26 ± 22 %) did not change with any treat-ment (S: p = 0.33, M: p = 0.48, interaction 0.46). In conclusion, sitagliptin in-creases intact GLP-1 through DPP-4 inhibition, but reduces total increments in post-load GLP-1 (L-cell feedback). Metformin increases fasting GLP-1 and post-load GLP-1 (total and intact). Against expectations, although raising intact GLP-1 levels, neither treatment signifi cantly increased the numerical contribution of the incretin effect to insulin secretion after oral glucose.
Supported by: Merck Research Labs
61-ORThe DPP-4 Inhibitor Linagliptin Protects from Experimental Dia-betic RetinopathyNADINE DIETRICH, STEPHANIE BUSCH, VALERIE SCHWARZ, PETRA BUGERT, UL-RIKE KAISER, JIHONG LIN, THOMAS KLEIN, ANGELIKA BIERHAUS, HANS-PETER HAMMES, Mannheim, Germany, Ingelheim, Germany, Heidelberg, Germany
Dipeptidyl peptidase (DPP)-4 inhibition improves glycemic control in type 2 diabetes. GLP-1 receptor agonists are heart- and brain-protective, but the effects of DPP-4 inhibitors on the diabetic vasculature are still unclear. To assess the effect of DPP-4 inhibition on vascular damage in the diabetic retina, streptozotocin-induced (35 mg/kg) diabetic male Wistar rats (n=25) were treated with the DPP-4 inhibitor linagliptin (0.083 g/kg chow) for 26 weeks. Blood glucose and HbA1c were increased by diabetes (p<0.001) and were reduced by approximately 10% in the linagliptin-treated diabetic group, while body weight remained unchanged. Linagliptin reduced DPP-4 enzyme activity by 75% and increased active levels of GLP-1 by more than 12 fold. Methylglyoxal levels increased by 4 fold in the retina of diabetic animals (p<0.001 vs non-diabetic controls), and were reduced by more than 60% in the linagliptin-treated diabetic group. IL-1b, ICAM-1, CXC-R4, and MCP-1 ex-pression were all signifi cantly upregulated in the diabetic group (p<0.05 or less), whereas only IL-1b expression was signifi cantly reduced in the linaglip-tin group (p<0.01). The GLP-1 receptor was localized in neuroglial cells of the inner retina and the photoreceptors. p-AKT was predominantly found in cells of the ganglion layer, and was reduced in diabetic rats. Linagliptin treat-ment induced a substantial increase in the number of p-AKT-positive cells in diabetic animals. Most importantly, in retinal digest preparations, linagliptin signifi cantly reduced the number of diabetes-induced acellular capillaries by 75% (p<0.01). In conclusion, our data suggest that DPP-4 inhibition by lina-gliptin has a protective effect on the microvasculature of the diabetic retina most likely due to a combined effect on the neurovascular unit.
Supported by: Boerhinger Ingelheim, DFG GRK 880
58-ORExenatide Treatment for 6 Months Improves Insulin Sensitivity in Adults With Type 1 Diabetes MellitusGAYATRI SARKAR, MAY ALATTAR, REBECCA J. BROWN, MICHAEL J. QUON, DAVID M. HARLAN, KRISTINA I. ROTHER, Bethesda, MD, Baltimore, MD, Worcester, MA
Adjunctive exenatide treatment improves blood glucose control in adults with type 2 diabetes and reduces post-prandial hyperglycemia in adoles-cents with type 1 diabetes mellitus. We studied effects of exenatide on glucose metabolism in 14 adult patients with long-standing type 1 diabetes mellitus using a cross-over study of 6 months on exenatide (10 mcg four times daily) and 6 months off. We assessed changes in fasting and postpran-dial blood glucose, daily insulin requirements, and changes in insulin sen-sitivity (hyperinsulinemic euglycemic clamps) before and after each study arm. Exenatide reduced post-prandial blood glucose but was associated with higher fasting glucose levels without change in hemoglobin A1C (pa-tients lost weight as previously reported). Insulin requirements were signifi -cantly reduced and insulin sensitivity increased after 6 months of exenatide therapy by amounts that exceeded those expected from weight loss per se. Thus, in patients with well controlled type 1 diabetes mellitus at baseline, high dose exenatide therapy increased fasting and decreased postprandial glucose levels without effecting a net change in hemoglobin A1C. Exenatide decreased daily insulin requirements and increased insulin sensitivity be-yond effects expected due to weight reduction per se. We conclude that exenatide is a promising adjunctive agent to insulin therapy in adult patients with type 1 diabetes mellitus that reduces postpandrial blood glucose and improves insulin sensitivity.
Effects of 6-month Exenatide Use on Weight,Plasma Glucose, A1C, Insulin Requirement, SIVariable On Exenatide Off exenatide P valueWeight (kg) 74.2± 12.6 78.4± 12.1 0.0003A1c (%) 6.6± 0.6 6.8± 0.6 0.388Fasting plasma glucose (mg/dl) 136.9± 3.19 129.7± 3.19 0.0002Postpandrial plasma glucose (mg/dl) 135.5± 4.43 142.5± 4.42 0.0005Insulin requirement (unit/kg/day) 0.48± 0.11 0.55± 0.13 0.0062Insulin Sensitivity Index(SI) (mg/m2/min per mU/ml)
7.15± 2.046 5.21± 1.642 0.0039
Supported by: NIDDK
59-ORVildagliptin Reduces Glucagon During Hyperglycemia and Sustains Glucagon Counter-Regulation in Type 1 DiabetesBO AHREN, JOHAN FARNGREN, MARGARETHA PERSSON, ANJA SCHWEIZER, JAMES FOLEY, Lund, Sweden, Basel, Switzerland, East Hanover, NJ
The DPP-4 inhibitor, vildagliptin, improves glycemia in type 2 diabetes with low risk of hypoglycemia. Vildagliptin inhibits glucagon secretion at hyperglycemia but appears to improve glucagon counter-regulation during hypoglycemia in type 2 diabetes. We hypothesized that vildagliptin also improves alpha-cell function in type 1 diabetes (T1D) and examined its ef-fect on glucagon levels at hyper- and hypoglycemia in patients with T1D. The study was a single-center, double-blind, randomized, placebo-controlled crossover study involving 28 patients with T1D (21M, 7F, mean age 30 yrs, diabetes duration 11 yrs, HbA1c 60 mmol/mol (7.7%), BMI 24.7 kg/m2) treated with long acting (30U/day) and short-acting (29U/day) insulin. Patients re-ceived vildagliptin (50 mg BID) or placebo as add-on to insulin for four weeks in random order with a four week washout in-between. On day 28 of the respective treatment, patients were served a standard meal (500 kcal) fol-lowed by a hyperinsulinemic hypoglycemic clamp at 2.5 mmol/l. Vildagliptin but not placebo reduced HbA1c (-3.6 mmol/mol (-0.3%), P<0.001). During the meal, glucagon levels were lower with vildagliptin than with placebo (8.4±0.6 vs. 9.5±0.7 ng/ml x min, P=0.022). In contrast, during hypoglycemia, the glucagon counter-regulation was not reduced by vildagliptin (5.5±3.7 vs. 6.2±3.0 pg/ml, NS). Also the counter-regulatory responses in epinephrine, norepinephrine and cortisol were not different. Interestingly, during the recovery from hypoglycemia, glucose levels reached 6.4±0.3 mmol/l with vildagliptin and 7.6±0.6 mmol/l with placebo (P=0.040). The study shows that vildagliptin improves glycemia, reduces glucagon during meal and pre-serves glucagon counter-regulation during hypoglycemia in T1D. The study therefore suggests that action of vildagliptin via alpha-cells maybe an ap-propriate add-on to insulin therapy in T1D.

A18
For author disclosure information, see page 797. ADA-Funded Research
ORA
LSFRONTIERS OF THE DIAGNOSIS AND TREATMENT OF NEURAL DYSFUNCTION
mates and Cox regression models for incidence rate.Results are reported for 2159 BARI 2D participants with valid baseline and at least one follow-up MNSI score (mean age 62±9 years, mean HbA1c 7.7±1.6%, diabetes dura-tion 10 ±9 years, 70% males). There were no baseline clinical differences between groups. The prevalence of DPN throughout the 4 years of follow-up was similar (p=0.83). However, for the 1075 BARI 2D participants with no DPN at baseline, the 4-year cumulative incidence rate of DPN was signifi -cantly lower in the IS (54%) compared to the IP group (63%) (p=0.022). After adjusting for the in-trial hemoglobin A1c values, the hazard ratio (HR) of new DPN for IS vs. IP was 0.81 (p=0.009). In subgroups analyses, the effects of the IS strategy in preventing DPN were higher compared to the IP strategy, in participants who were < 65 years (HR=0.75, p=0.004), were males (HR=0.74, p=0.003) and had higher triglycerides (>=150 mg/dl) at baseline (HR=0.74, p=0.009). Among patients with T2DM followed for up to 4 years during BARI 2D, a glycemic control therapy with IS signifi cantly reduced the cumulative incidence of DPN compared with IP therapy.
Supported by: NHLBI (U01 HL061746, U01 HL061748, U01 HL063804) and NIDDK (HL061744)
64-ORNew Collagen-Linked Advanced Glycation Endproducts (AGEs) Pre-dict Microvascular (MV) Disease Progression Risk in Type 1 Dia-betes—16 Years after the Diabetes Control and Complication Trial (DCCT)VINCENT M. MONNIER, WANJIE SUN, DAVID R. SELL, CHRISTOPHER M. STRAUCH, PATRICIA A. CLEARY, JOHN M. LACHIN, SAUL GENUTH AND THE DCCT/EDIC RESEARCH GROUP, Cleveland, OH, Rockville, MD
We previously reported that 6 collagen-linked AGEs measured in skin obtained near DCCT closeout may in part explain the “metabolic memory” phenomenon of the DCCT/EDIC study, i.e. the persistent effect of glycemic exposure (DCCT A1c) on progression of retinopathy (RET) and nephropathy (NEPH) 10 years post DCCT. We now report 4 new added AGEs, glucosepane (GSPNE), methylglyoxal (MG-H1) and glyoxal (G-H1) hydroimidazolones, and carboxyethyl-lysine (CEL), enhances prediction of incident RET, NEPH and neuropathy (NEU) events during 16 years post DCCT. The AGEs were mea-sured by LC/MS in collagen digest. Multivariate logistic regression was used to assess AGE effects on risk of MV progression in EDIC in those free of events at DCCT closeout. The complete 10 AGE panel predicts 3 step ETDRS worsening of RET (p 0.002), independent of either mean DCCT or EDIC A1c. In multivariate models, GSPNE and fructose-lysine (as furosine, FUR) play dominant roles in RET progression, and the RET dependence on A1c loses signifi cance when adjusted for these 2 AGEs. The 10 AGE panel also predicts microalbuminuria (p=.008),despite adjustment for A1c. FUR is the dominant AGE for NEPH independent of A1c (p .02). Notably, the 10 AGE panel pre-dicts NEU (peripheral and/or autonomic neuropathy) in EDIC despite adjust-ment for DCCT and EDIC mean A1c (p 0.005). Of these, MG-H1 and FUR are dominant, independent of A1c (p<.0001) whereas A1c loses predictive signifi cance after adjustment for them. Overall, the new 4 AGEs add to the predictive effect of the original 6 in RET and NEU (p<0.04) but not in NEPH. These results further implicate collagen AGEs as one factor in the pathogen-esis of complications. GSPNE and methylglyoxal derived MG-H1 emerge as the principal new risk factors associated with NEU development. The AGEs were predictive up to 16 years of follow-up, arguing for early and sustained implementation of intensive therapy.
Supported by: JDRF
65-ORPeroxynitrite and Protein Nitration in the Pathogenesis of Diabetic Peripheral NeuropathySERGEY LUPACHYK, HANNA SHEVALYE, ROMAN STAVNIICHUK, JOHN T. GROVES, IRINA OBROSOVA, Baton Rouge, LA, Princeton, NJ
Peroxynitrite, a product of the reaction of superoxide anion radical with nitric oxide, is the most potent oxidant formed in a variety of pathological conditions including diabetes. Peroxynitrite injury causes oxidative stress with concomitant inactivation of enzymes, poly(ADP-ribosyl)ation, mito-chondrial dysfunction, impaired stress signaling, as well as protein nitra-tion. This study evaluated the role for peroxynitrite injury in toto vs protein nitration in advanced diabetic peripheral neuropathy (DPN). Male control and streptozotocin (STZ)-diabetic C57Bl6/J mice were treated with the potent peroxynitrite decomposition catalyst Fe(III) tetramesitylporphyrin octasulfonate (FeTMPS, 10 mgkg-1 d-1) or protein nitration inhibitor (-)-epi-catechin (Epi, 20 mg-1d-1i.p.) for 4 wks, after initial 7 mo without treatment. Dose selection for both agents was performed in short-term studies in STZ-
62-OREffi cacy and Safety of Once-Daily Lixisenatide Added on to Titrated Glargine plus Oral Agents in Type 2 Diabetes: GetGoal-Duo 1 StudyJULIO ROSENSTOCK, THOMAS FORST, RONNIE ARONSON, LEOBARDO SAU-QUE-REYNA, ELISABETH SOUHAMI, LIN PING, MATTHEW RIDDLE, Dallas, TX, Mainz, Germany, Toronto, ON, Canada, Cuernavaca, Mexico, Frankfurt, Germany, Portland, OR
Lixisenatide (LIXI) is a once-daily GLP-1R agonist with robust postpran-dial effects that could complement basal insulin therapy. This randomized, double-blind, multicenter trial in T2D inadequately controlled on metformin ± SU ± TZD assessed the effi cacy and safety of LIXI added on to titrated insulin glargine [NCT00975286]. Glargine was initiated and titrated in a 12-wk run-in phase to achieve FPG 80-100 mg/dL. Subjects with A1C 7% were then randomized to AM once-daily LIXI 20 μg (n=223) or placebo (PBO; n=223) for 24 wk while glargine titration continued. At randomization, SU therapy was stopped and all subjects were on metformin and 12% on a TZD. Patient demographics were similar in both groups (mean age 56.2 y, T2D duration 9.2 y, BMI 31.8 kg/m2). Primary endpoint was change in A1C from randomization. A1C decreased during run-in from 8.6% to 7.6% and LIXI further reduced A1C vs PBO (LS mean difference: -0.32%; p<0.0001), with more LIXI achieving A1C<7.0% (56% vs 39%, respectively). LIXI signifi cantly improved 2-h PPG after a standardized breakfast and had a benefi cial effect on body weight vs PBO (LS mean difference: -0.89 kg; p=0.0012) despite glargine titration. AEs occurred in 80% on LIXI vs 68% on PBO; nausea/vomiting were more com-mon with LIXI (27.4%/9.4% vs 4.9%/1.3%) as was discontinuation due to AEs (8.5% vs 3.6%). More LIXI vs PBO had symptomatic hypoglycemia (22.4% vs 13.5%). In conclusion, LIXI added to optimally titrated glargine and oral agents signifi cantly improved A1C, reduced PPG and had a benefi cial effect on weight with an expected GLP-1 AE profi le that subsided over time.
Supported by: sanofi -aventis
FRONTIERS OF THE DIAGNOSIS AND TREATMENT OF NEURAL DYSFUNCTION
63-ORImpact of Glycemic Control Strategies on the Incidence of Diabetic Peripheral Neuropathy in the Bypass Angioplasty Revasculariza-tion Investigation 2 Diabetes (BARI 2D) CohortRODICA POP-BUSUI, JIANG LU, ALBERT STEWART, BRUCE PERKINS, JENNIFER GREEN, JORGE ESCOBEDO, PASQUALE PALUMBO, FRED WHITEHOUSE, TERESA L. JONES, Ann Arbor, MI, Pittsburgh, PA, St. Louis, MO, Toronto, ON, Canada, Dur-ham, NC, Mexico City, Mexico, Rochester, MN, Detroit, MI, Bethesda, MD
The BARI 2D trial demonstrated similar long-term clinical effectiveness of insulin-sensitizing (IS) versus insulin-providing (IP) treatments for type 2 diabetes (T2DM) on cardiovascular outcomes in a cohort with documented coronary artery disease. We evaluated the effects of randomized glycemic control strategy (IS vs.IP) on the prevalence and incidence of diabetic pe-ripheral neuropathy (DPN) in this cohort. DPN was assessed at baseline and yearly thereafter during 4 years of follow-up and defi ned as a clinical exami-nation score >2 on the Michigan Neuropathy Screening Instrument (MNSI). DPN prevalence and incidence were compared by intention-to-treat, i.e. IS vs. IP, modeling by logistic (GEE) models for prevalence, Kaplan-Meier esti-

A19
For author disclosure information, see page 797.ADA-Funded Research
ORA
LS
FRONTIERS OF THE DIAGNOSIS AND TREATMENT OF NEURAL DYSFUNCTION
FA values were substantially reduced in T1DM patients relative to control subjects (F1,46 = 7.49, P=0.007). Whole-brain voxelwise analyses showed that T1DM-related FA reductions were particularly salient in the fronto-temporal regions. Lower FA values in bilateral superior longitudinal fasciculi, where group differences were prominent, correlated with decreased performance on working memory in T1DM patients (left, r=0.57, P<0.001; right, r=0.44, P=0.009). No subjects met criteria for current major depression. However, subsyndromal depressive symptoms, assessed using the Hamilton Depres-sion Rating Scale, were also associated with lower FA values in the right inferior fronto-occipital fasciculus (r=-0.49, P=0.004). Fronto-temporal white matter microstructural abnormalities may lead to both emotional and cogni-tive dysregulation, thereby serving as mechanisms underlying T1DM-related CNS complications that compromise the quality of life of T1DM patients.
Supported by: NIH/NIDDK, National Research Foundation of Korea
68-ORThe Effect of DA-9801 on the Peripheral Nerve Protection in Strep-tozotocin Induced Diabetic RatsHEUNG YONG JIN, TAE SUN PARK, KYUNG AE LEE, HONG SUN BAEK, JAE MOON KIM, SUN HEE KIM, Jeon Ju, Republic of Korea
DA-9801, a mixture extract of Dioscorea japonica and Dioscorea nipponica,was reported to have neurotrophic activity. Therefore, we investigated the effect of DA-9801 on the peripheral nerve protection in diabetic rats. Ani-mals were divided into 6 groups (N=8-10) and designated as follows accord-ing to the DA-9801 dose: Normal, Normal+DA-9801-100(mg), Diabetes(DM), DM+DA-9801-10(mg), DM+DA-9801-50(mg), and DM+DA-9801-100(mg). Sta-tistical analyses for functional parameters and neuronal quantifi cation were performed after 16 weeks treatment. In results, blood glucose levels were not affected, however thermal withdrawal latency, and mechanical allodynia using von frey fi lament were improved in the DA-9801 treated DM group as shown in the [Figure1]. Intraepidermal nerve fi ber (IENF) density less reduced signifi cantly in the DM+DA-9801 groups than DM group although dose de-pendant effect was not observed (9.12±0.96 vs 8.96±0.60 vs 9.30±0.70 vs 5.81±0.52/mm, DM+DA-9801-10, DM+DA-9801-50, DM+DA-9801-100, and DM, respectively, P<0.05) [Figure1]. Mean myelinated axonal area in the sci-atic nerves was also higher signifi cantly in the DM+DA-9801 treated groups than DM group (70.2±3.46, vs 71.5±2.15, vs 72.1±1.57, and 59.1±2.91 μm2,DM+DA-9801-10, DM+DA-9801-50, DM+DA-9801-100, and DM, respec-tively, P<0.05) [Figure1]. Our results demonstrated that DA-9801 is benefi cial in the respect of peripheral nerve preservation in diabetes. Therefore, this agent can be used in the pathogenic treatment for diabetic peripheral neu-ropathy in the future.
69-ORCan Simple Function Tests for Cardiovascular Autonomic Neuropa-thy (CAN) Predict Coronary Artery Disease (CAD) in Type 1 Diabetes (T1D)?GEORGIA PAMBIANCO, TREVOR ORCHARD, Pittsburgh, PA
CAN is thought to confer a high risk of mortality, CAD, heart failure and tachycardia. Since there is no agreement on the optimal screening for auto-nomic neuropathy in TID, the long term predictive power of two simple tests, E/I ratio and 30:15 ratio, were assessed with regard to CAD incidence in the Pittsburgh Epidemiology of Diabetes Complications (EDC) study of childhood onset T1D cohort. At study entry (1986-1988, n=658), the mean age was
diabetic C57Bl6/J mice in which FeTMPS counteracted both nitration and poly(ADP-ribosyl)ation in the peripheral nerve, whereas Epi blunted nitration without any effect on oxidative stress. C57Bl6/J mice with 7-mo duration of STZ-diabetes developed 13% motor and 20% sensory nerve conduction ve-locity defi cits, clearly manifest thermal and mechanical hypolagesia, tactile allodynia, and 20% loss of intraepidermal nerve fi bers. Both FeTMPS and Epi partially corrected sensory nerve conduction slowing and small sensory nerve fi ber dysfunction without alleviation of hyperglycemia. Correction of MNCV defi cit and increase in intraepidermal nerve fi ber density were found with FeTMPS treatment only. In conclusion, peroxynitrite injury in toto and its component, protein nitration, are implicated in the development of DPN. The fi ndings indicate that both structural and functional changes of DPN can be reversed at a very advanced stage, and provide rationale for the devel-opment of a new generation of antioxidants, peroxynitrite decomposition catalysts, for treatment of this complication.
Supported by: NIH DK081147
66-ORThe Impact of Depression on Central Pain Processing in Painful Dia-betic Peripheral Neuropathy—A Functional Magnetic Resonance StudyDINESH SELVARAJAH, JENNIFER DAVIES, ADITHYA SANKAR, ELAINE CACHIA, IAIN WILKINSON, SOLOMON TESFAYE, Sheffi eld, United Kingdom
We have reported a high prevalence of mood disorders in painful diabetic neuropathy (DN) that infl uence response to pharmacotherapy. It is also well recognised that antidepressants are effective at relieving neuropathic pain. However, as most trials exclude depressed patients it is unknown whether any pain relieving properties are partly mediated by easing depression. We sought to explore the complex interaction between painful DN and depres-sion by looking at regional brain activation during pain processing using fMRI. Methods: 15 painful DN and 12 healthy volunteers (HV) underwent neurophysiological assessment. Mood disorders were assessed using the Hospital Anxiety and Depression Scale (HADS). All subjects underwent fMRI whilst heat pain was applied to the thigh (non-neuropathic region) at a pain level of at least 7 (11 point Likert scale). MR data was analysed using SPM5. Results In painful DN, there was signifi cantly (p<0.001, uncorrected) greater activation in the ventromedial prefrontal cortex (BA 9), stereotac-tic coordinates: x=28, y=34, z=24) and cingulate gyrus (-8,2,30) compared with HV. Subjects with painful DN were then divided into two groups based on HADS-D. Painful DN subjects with depression (HADS-D>8,n=9) had sig-nifi cantly greater activation (p<0.001, uncorrected) in the prefrontal cortex (BA 9, 8,46,52) compared with those without (HADS-D<8,n=6). Discussion Increased activation in BA9 and the cingulate gyrus suggests a greater per-ception of suffering in painful-DN as these regions are involved in emotional pain processing. Increased activation in BA9 in subjects with depressive symptoms suggests a neurocortical link between mood disorders and ab-normal acute pain processing. Further studies are required to investigate the impact of antidepressant treatment on this abnormal activation. Using this novel technique, we report new insights into abnormal pain processing which maybe amenable to targeted treatments.
Supported by: JDRF
67-ORFrontal-Temporal White Matter Microstructural Alterations in Type 1 Diabetes MellitusALAN M. JACOBSON, INKYOON LYOO, SUJUNG YOON, NICOLAS R. BOLO, DON-ALD C. SIMONSON, GAIL F. MUSEN, PERRY F. RENSHAW, SOO M. LIM, JAEUK HWANG, JI-HYUN KIM, JIEUN E. KIM, SOJIN LEE, DO-UN JEONG, CHRISTOPHER RYAN, Mineola, NY, Seoul, Republic of Korea, Boston, MA, Salt Lake City, UT, Pitts-burgh, PA
Structural defi cits in specifi c brain regions may account for emotional and cognitive changes in T1DM. Frontal and temporal white matter may be es-pecially vulnerable because it becomes myelinated later than other regions during childhood and adolescence when active brain development occurs. To identify regional abnormalities in white matter tracts in T1DM patients and examine their contributions to cognitive and emotional dysfunction, dif-fusion tensor (DT) images were obtained from 34 T1DM patients (age = 32 ± 4.8 yrs, Male/Female=16/18, HbA1c =7.7 ± 1.2%, DM duration = 21 ± 3.4 yrs, BP mean = 122/76 mmHg, Total Cholesterol=193 ± 60 mg/dL) and 16 age and sex-matched control subjects (age = 31 ± 5.5 yrs, HbA1c = 5.1 ± 0.3%, BP mean = 116/72 mmHg, Total Cholesterol = 176 ± 35 mg/dL). Images were analyzed using tract-based spatial statistics. All analyses were corrected for multiple comparisons. Fractional anisotropy (FA), which is highly sensitive to white matter integrity, was the primary outcome variable. Global mean
A20
For author disclosure information, see page 797. ADA-Funded Research
ORA
LSEXPANDING THE DOMAINS OF DIABETES EDUCATION
life (P = 0.008). There was a trend effect on effi cacy for controlling blood pressure (P = 0.08). The two interventions were equally effective (between intervention P = 0.637, P = 0.983, P = 0.771, P = 0.429, P = 0.734, respectively). A strong majority of the subjects found that the game was more fun (71%), more interesting (60%) and made learning easier (55.7%). Seventy-four percent would replay the game rather than read the pamphlet again. While both digital gaming and reading improve diabetes management knowledge and self-effi cacy among adults, gaming is overwhelmingly favored by the subjects. Their expressed willingness to replay the games rather than read more, provides a viable strategy for diabetes education and reinforcement in a low-literacy adult population.
72-ORHow Do You Get from Here to There With Diabetes?BLAKE E. ELKINS, MARK W. TRUE, MARCUS M. CRANSTON, Lackland AFB, TX, Keesler AFB, MS
Despite available travel advice for patients with diabetes mellitus, little is known regarding the practice of medical providers or the level of patient knowledge. This study examined provider and patient beliefs and behav-iors regarding travel medicine recommendations during routine diabetic visits. This cross-sectional study surveyed 228 diabetic patients at Wilford Hall Medical Center, San Antonio, Texas using a self-report questionnaire. Survey questions addressed provider practices and patient behaviors and knowledge. The study population was predominantly older patients with established diabetes mellitus, type 2 (87.3 % > 50 years-old; 81.5% type 2; 85.6% had diagnosis > 5 years). Only 23.5% of subjects had ever been asked about travel by a provider and only 18.5% had ever inquired about glucose monitoring during travel. Among those using insulin, only 27.8% had ever inquired about insulin dosing during travel. Patients that sought advice most often obtained information from Nurse Educators (35.5%) or written materi-als (32.2%), while only 16.5% obtained information from the ADA. When traveling outside the United States only 27.9% stated they would pre-ar-range a medical facility, in case of illness. The majority would depend on the U.S. Embassy or hotel staff for recommendations for medical care (72.1%) or prescription medication replacement (63.0%). Finally, when given travel scenarios crossing multiple time zones, subjects rarely stated they would anticipate a need to adjust medications, 25.0% for westward and 24.6% for eastward travel. Adults with diabetes mellitus are not commonly asked about travel during routine diabetes clinic appointments. In addition, few patients inquire about care prior to travel and most do not prepare for medi-cation dose changes, illness or lost medications. This study reveals a signifi -cant gap in patient knowledge and provider practice in which a concerted effort is needed to ensure safe travel for patients with diabetes mellitus.
73-ORDiabetes Self-Management Education Patterns Associated With Glycemic Control in Youth With Type 1 DiabetesLINDSAY M. JAACKS, RONNY A. BELL, DANA DABELEA, RALPH B. D’AGOSTINO, JR., LAWRENCE M. DOLAN, GIUSEPPINA IMPERATORE, GEORGEANNA J. KLINGENSMITH, JEAN M. LAWRENCE, SHARON SAYDAH, JOYCE YI-FRAZIER, ELIZABETH MAYER-DAVIS, FOR THE SEARCH FOR DIABETES IN YOUTH STUDY GROUP, Chapel Hill, NC, Winston-Salem, NC, Denver, CO, Cincinnati, OH, Atlanta, GA, Pasadena, CA, Seattle, WA
Poor glycemic control increases the risk of diabetes-related complica-tions. The specifi c components of diabetes self-management education as-sociated with glycemic control in youth with type 1 diabetes (T1D) have not been fully elucidated. SEARCH for Diabetes in Youth is a study of youth < 20 yrs old at diagnosis in the US. This analysis includes cross-sectional data from 1,368 participants from 5 centers in the 2002-2005 incident cohorts (mean ± SD age and A1C: 14.6 ± 4.4 yrs and 8.8 ± 1.8 %). Principal component analysis was used to identify patterns of diabetes education. Associations between resulting factor scores and glycemic control (A1C 9.5% versus < 9.5%) were evaluated using multivariable logistic regression adjusted for age, diabetes duration, parental education and family composition. Four factors were identifi ed using eigen value-one criteria and a scree plot. Of these factors, Direct Communication about Care was associated with lower odds of A1C 9.5% and Medical Nutrition Therapy and Attendance at Visitswere associated with greater odds of A1C 9.5% while Receiving Diabetes-Related Information was not signifi cantly associated with glycemic control. A limitation of these results is the potential for reverse causality: youth with A1C 9.5% may be more likely to be referred to attend visits or for receipt of additional nutrition recommendations. Prospective research is needed to further understand this relationship and patterns of diabetes education for improving glycemic control in youth with T1D.
28 years and mean diabetes duration was 19 years. Follow up (mean=10.3 years) was determined from the time of fi rst assessment of the 30:15 ratio test (1994) in 248 participants. The E/I ratio was measured by means of heart rate response to deep breathing and dichotomized as >=1.1 (normal) and <1.1 (abnormal). The 30:15 ratio was measured by the longest RR interval around the 30th heartbeat and the shortest around the 15th heart beat after standing up and dichotomized as >1.04 (normal) and <=1.04 (abnormal). CAD was de-fi ned as clinic physician diagnosed angina, ischemic ECG changes, revascu-larization, confi rmed MI, or CAD death. Risk factors examined were diabetes duration, age, HbA1c, hypertension, smoking, total cholesterol, HDL, triglyc-erides and LDL cholesterol, waist/hip ratio (WHR), gender, WBC, estimated glomerular fi ltration rate (GFR), and albumin excretion rate (AER). Forty seven (19%) out of 248 participants developed CAD in the follow up period. Univari-ately, E/I ratio (HR 2.8, 95% CI 1.5, 5.1) but not 30:15 ratio (HR 1.3, 95% CI .7, 2.3) predicted CAD. In the fully adjusted model, E/I ratio remained indepen-dently predictive (HR 1.9, 95% CI 1.1, 3.5), along with diabetes duration (HR 1.1, CI 1.0, 1.1), WBC (HR 1.2, CI 1.0, 1.4), and HbA1c (HR 1.3, CI 1.1, 1.7). The study indicates that the E/I, but not the 30:15, is an independent predictor of CAD, and thus the preferred simple measure.
70-ORTransplantation of Neural Progenitor-Like Cells Derived from Sphe-roidal Dermal Cells Improves Diabetic Polyneuropathy in MiceMASAKI KONDO, HIDEKI KAMIYA, TATSUHITO HIMENO, JIRO KATO, TETSUJI OKAWA, ATSUSHI FUJIYA, KEIKO NARUSE, YOJI HAMADA, NAOMI NISHIO, SA-CHIKO ITO, YUTAKA OISO, KEN-ICHI ISOBE, JIRO NAKAMURA, Nagoya, Japan
Background and Aims: We have identifi ed and established spheroidal der-mal cells (sDCs) from skin that possess pluripotency, and succeeded to de-rive neural progenitor-like cells (NPLCs) from sDCs. Here we investigated the effects of NPLC transplantation on diabetic polyneuropathy (DPN) in mice. Materials and Methods: We cultured dermal cells from 5-week old EGFP- C57BL/6 male mice and formed 1x10⁴ dermal cells into spheroids (sDCs) on U-bottom 96-well plates. NPLCs were induced from sDCs by co-culturing with PA 6 for 10 days. Diabetes was induced by intraperitoneal injection of STZ to 8-week old C57BL/6 male mice. Then, NPLCs (1x10³ cells per cluster) or saline were injected into the right or left hindlimb muscles (10 clusters/limb) of 12-week STZ diabetic (D) and age-matched normal (N) mice, respectively. Four weeks later, thermal planter test (TPT), current perception thresholds (CPTs), and nerve conduction velocities (MNCV and SNCV) were evaluated. Result: Induced NPLCs were positive for p75 and beta-III tubulin. Four weeks after transplantation, NPLCs resided in the injected muscles and did not produce teratoma or other tumors. D showed impaired thermal sensation (TPT; N: 5.5±1.7s, D: 9.6±3.6) indicating hypoalgesia, and delayed MNCV (N: 53.6±6.9 m/s, D: 36.9±6.7) and SNCV (N: 32.9±4.9 m/s, D: 21.9±2.7), which were signifi cantly ameliorated by NPLC transplantation (TPT: 5.2±1.1, MNCV: 48.1±5.5, SNCV: 33.7±5.8). Conclusion: These results indicate that transplan-tation therapy with NPLCs would be effective for DPN.
EXPANDING THE DOMAINS OF DIABETES EDUCATION
71-ORGames are a Preferred Method to Improve Diabetes Knowledge and Self-Effi cacy in AdultsCIRCE W. TSUI, JANE M. CAUDLE, ADRIENNE R. HERRON, IRMGARD U. WILL-COCKSON, CATHERINE S. BARNES, DAVID C. ZIEMER, Atlanta, GA, Conroe, TX
Digital gaming promotes positive health outcomes in juvenile diabetes pa-tients, but its usefulness for adults with diabetes is unknown. We conducted a randomized pilot to examine the effectiveness of a custom-designed com-puter game, Wheel of Diabetes (WOD), on diabetes management among adults. WOD took a ‘repetition and reward’ approach to teaching patients about hemoglobin A1c, cholesterol and blood pressure. Playing WOD (n=60) was compared to reading a pamphlet (n=55). A knowledge test and a 4-ques-tion self-effi cacy survey were administrated before and after. After post-testing, all subjects completed the alternative intervention and preference survey. Subjects were recruited in the Grady Diabetes Center, a hospital-based outpatient clinic previously shown to have a high prevalence of low literacy. The population was 91% African American, 71% female, with mean age 55 (20-85) yr and diabetes duration 11 yr; 69% had not or rarely played computer games before. Pre-Post outcomes were analyzed by a mixed effect model for repeated measures. The interventions had signifi cant and positive effect on knowledge (P < 0.001 ), self-effi cacy for controlling blood glucose (P = 0.001), controlling cholesterol (P = 0.007 ), as well as living a normal

A21
For author disclosure information, see page 797.ADA-Funded Research
ORA
LS
EXPANDING THE DOMAINS OF DIABETES EDUCATION
and T1D duration of 7.5±4.7 years. A1c was 8.5±1.1% (range 5.8-12.6%) at CGM insertion. Experienced RNs/NPs evaluated CGM tracings and provided Rx recommendations (RECs). Post CGM use (median 76 days, inter-quartile range 50-99), 115 youth (7 not done) had A1c of 8.4±1.2%. CGM tracings for 122 youth (3 required reinsertion) yielded CGM mean glucose of 181±34 and SD glucose of 75±16 mg% with an average of 894±136 readings (range 435-1151) per youth; CGM mean glucose and SD were correlated with in-sertion A1c (r=0.43, p<.0001; r=0.24, p<.009). Patients received 3.1±1.1 RECs after CGM use. RECs were to: give pre-meal/snack boluses (81%), change bolus doses (64%), change basal/intermediate doses (51%), use advanced boluses/attend to active insulin (39%), adjust exercise plan (35%), count carbs/macronutrients (15%), adjust hypoglycemia Rx (12%), and increase BG monitoring (6%). Post CGM use, 39 youth (34%) improved A1c by 0.5%. Those who improved were older (15.5±4.4 vs 14.0±3.6), had higher insertion A1c (8.9±1.0 vs 8.3±1.1%), and received more RECs (3.5±1.1 vs 3.0±1.1) than those who did not (all p<.05); mode of insulin delivery was not associated with improvement. Those who received REC to use advanced boluses/at-tend to active insulin were 3.5 times (p<.002) more likely to improve A1c by
0.5%. Educator use of masked CGM in youth with T1D is clinically practical. Patients amenable to advanced bolus dosing and attending to active insulin appear likely to improve A1c after CGM use.
76-ORHospital Survival Skills DSME DVD Improves Post Discharge Medi-cation AdherenceMICHELLE F. MAGEE, NAWREEN H. KHAN, CARINE M. NASSAR, Washington, DC
Diabetes self-management education (DSME) improves knowledge, clini-cal outcomes, e.g. A1C, and costs. While the hospital may be considered a suboptimal environment in which to provide DSME, admissions present an opportunity to deliver education. The ADA (Standards of Care 2012) sug-gest “survival skills” education as a feasible approach to inpatient DSME. Evidence is needed to defi ne strategies for hospital DSME delivery. We have piloted a diabetes survival skills instructional DVD entitled “Diabetes-To-Go” in an urban teaching hospital. Content was aligned with ADA suggested areas for hospital DSME. The primary goal was to reduce readmissions. Pa-tients with uncontrolled diabetes (BG> 200mg/dL or < 40mg/dL) admitted to the hospital were eligible for inclusion. Knowledge and diabetes medication adherence were assessed at baseline, 2 and 3 months post-discharge. Pa-tients were directed to watch DVD sections corresponding to survey identi-fi ed knowledge defi cits prior to discharge. Patients, n=125, were consented and enrolled in this IRB approved study. Interim data analysis has been performed for 72 program completers. Mean age 59±13 years; 68% female; 86% African American; Mean BG 282 + 141mg/dL; Mean A1C 9.7 + 2.8%.
ITEM TIME PERIODKnowledge Test Baseline Post-, p value> 5 out of 8 questions correct 64.29% 85.71%, p=0.006Medication Adherence Baseline to
2 weeksBaseline to 3 months
2 weeks to 3 months
Change in Morisky Scale* Adherence Scores
-2.83,p<0.0001
-2.9,p<0.0001
0.23,p<0.8195
Hospital Admission(s) 3 months before study
3 months after study
Did NOT require hospitalization 82.4% 91.2%, p=0.1797*Morisky Scale used with permission from David Morisky
A targeted survival skills DSME DVD offered in the hospital demonstrated preliminary evidence of knowledge improvement, an increase in medication adherence from baseline to 2 weeks which persisted until 3 months, and a trend toward reduction in hospital readmissions.
Supported by: sanofi -aventis
77-ORImpact of a Pocket Insulin Dosing Guide on Utilization of Basal/Bo-lus Insulin by Internal Medicine Resident PhysiciansMICHAEL G. JAKOBY, MOHAMMED ALNIJOUMI, SHERYLL SORIANO, DANXUAN LONG, DOMINIKA JANOWSKI, SOO AH KIM, OWAISE MANSURI, EDWARD RICO, CHAITANYA MAMILLAPALLI, DEEPIKA NALLALA, JENNIFER BOND, Springfi eld, IL
Basal/bolus insulin (BBI) is superior to sliding scale insulin (SSI) for diabe-tes patients admitted to general medicine and surgery services, but little is published on strategies to promote utilization of BBI by resident physicians. We completed a prospective study with historical controls to evaluate the impact of a pocket insulin dosing guide on diabetes management practices of internal medicine resident physicians at the SIU School of Medicine rotat-
Factor Variable Factor Loading OR (95% CI)*
Direct Communica-tion about Care
Received info in-person Received a copy of laboratory results Received appointment reminder Received info via tele-phone
0.68 0.68 0.61 0.43
0.78 (0.68, 0.90)
Medical Nutrition Therapy
Calorie tracking recommenda-tion Fat gram tracking recom-mendation Dietary exchanges recommendation Low glycemic index recommendation
0.76 0.76 0.76 0.69
1.22 (1.06, 1.40)
Attendance at Visits Met with dietician or nutritionist in past 12 months Met with dia-betes educator or nurse in past 12 months
0.82 0.79 1.20 (1.04, 1.39)
Receiving Diabetes-Related Information
Received info about diabetes support groups Received info about camps Received written info about diabetes, such as pamphlets Received info on how to fi nd diabetes info online Received info about other research studies
0.73 0.63 0.53 0.53 0.40
1.02 (0.88, 1.19)
*Odds ratio (OR) and 95% confi dence interval (95% CI) for a 1 SD change in factor scores predicting A1C 9.5% compared to < 9.5%, adjusted for age, diabetes duration, parental education and family composition.
Supported by: The CDC with support from the NIDDK
74-ORKnowledge Application (KA) Predicts Reproductive Health Atti-tudes and Behaviors in Teens With DiabetesDENISE CHARRON-PROCHOWNIK, SUSAN SEREIKA, DOROTHY BECKER, NEIL H. WHITE, ANDREA R. FISCHL, WILLIAM HERMAN, A.B. POWELL, PATRICIA SCHMITT, ANA DIAZ, JACKIE JONES, MONICA DINARDO, FENG GUO, LAURA MCEWEN, JULIE DOWNS, Pittsburgh, PA, St. Louis, MO, Ann Arbor, MI
ADA recommends that preconception counseling (PC) start at puberty. READY-Girls is a self-administered PC program (DVD, book) for teens with type 1 (T1D) or type 2 (T2D) diabetes. We used a diabetes and reproductive health knowledge assessment to evaluate the long-term effectiveness of READY-Girls. At 2 sites, 113 teens [mean age=16.2yrs (13.3-19.9yrs)] with T1D or T2D, were randomized to a standard care control group (CG; N=59) or a READY-Girls intervention group (IG; N=54). 17% were African American and 8% had T2D. READY-Girls was given over 3 visits. At baseline, about 20% (n=11) in each group were sexually active with mean sexual debut of 15.4yrs (12-18yrs); 50% had unsafe sex. The KA measure has multiple choice prob-lem-solving vignettes and 7 subscales: PC, pregnancy, contraception, sexu-ality, puberty, general family planning, and general diabetes; scored 100% correctness. Attitudes and behaviors included: self-effi cacy, benefi ts and barriers to birth control (BC) and PC; severity and susceptibility to unplanned pregnancy/complications; and initiating discussion with health profession-als. Baseline mean total KA score for IG = 65% and CG = 68% (p=.10). Over 12mos, IG had improvements in KA with signifi cant group-by-time effects for total score (p<.0001), PC (p=.0005), pregnancy (p<.0001), and sexuality (p=.0041). CG had no improvements. Total knowledge was signifi cantly as-sociated with self-effi cacy (p=.05), benefi ts (p<.0001), barriers (p<.0001), severity (p<.05), susceptibility (p<.05), and intention to use family plan-ning (p=.059), but not with initiating discussion (p>.05). We conclude that the READY-Girls program has signifi cant and sustained benefi cial effects on knowledge, and that knowledge is positively associated with reproductive health attitudes and behaviors.
Supported by: NIH/NICHD (R01 HD44097)
75-OREducator Use of Masked Continuous Glucose Monitoring Device (CGM) in a Clinic Population of Youth With Type 1 Diabetes (T1D)KERRY M. MILASZEWSKI, JOYCE KEADY, LISA M. SCHMIDT, LISA E. RASBACH, ASHLEY E. ATKINS, LISA K. VOLKENING, LORI M. LAFFEL, Boston, MA
Despite advanced diabetes technologies, many youth with T1D fail to meet target A1c goals. We assessed use of a 3-day, masked CGM and evalu-ated its impact on glycemic control in a diabetes clinic caring for >2000 chil-dren, teens, and young adults. Over ~2 years, 122 patients with T1D were referred for CGM use to evaluate elevated A1c, unexplained hypoglycemia, post-prandial BG excursions, and/or impact of activity on BG. Youth (47% male, 61% pump-treated) had a mean age of 14.3±3.9 years (range 7-28)

A22
For author disclosure information, see page 797. ADA-Funded Research
ORA
LSSGLT-INHIBITORS
and insulin were measured frequently for 6 h; these values were used to calculate the rate of appearance in plasma of oral G (RaO), endogenous G production, and G disposal. CANA was well tolerated. CANA delayed RaO(Figure A) and reduced cumulative oral G appearance (AUC RaO) by 31% at 1 h (geometric mean PBO=381 vs. CANA = 264 mg/kg, p<.001) and by 20% at 2 h (PBO=723 vs. CANA = 576 mg/kg, p=.002); this was nearly matched by increased RaO over 2-6 h, so that AUC RaO over 0-6 h was <6% lower for CANA than PBO (PBO=1018 vs. CANA = 960 mg/kg, p=.003), consistent with the lack of notable malabsorption. CANA also increased urinary glucose ex-cretion (UGE) over 0-2 h (PBO<0.2 g; CANA=6±3 g), and 2-6 h (PBO<0.1 g; CANA=12±4 g). Total G disposal over 0-6 h was similar for PBO and CANA. In conclusion, CANA reduces postprandial plasma glucose and insulin (Figures B and C) by both increasing UGE (due to renal SGLT2 inhibition) and delayingRaO (likely due to intestinal SGLT1 inhibition).
Supported by: Janssen Research and Development, L.L.C.
80-ORTofoglifl ozin, a Novel and Selective SGLT2 Inhibitor Improves Gly-cemic Control and Lowers Body Weight in Patients With Type 2 Dia-betes Mellitus Inadequately Controlled on Stable Metformin or Diet and Exercise AloneTAKASHI KADOWAKI, SACHIYA IKEDA, YASUKI TAKANO, OSAMU CYNSHI, ANDREAS D. CHRIST, VIKTOR BOERLIN, ULRICH BEYER, ANDREAS BECK, Tokyo, Japan, Basel, Switzerland
Urinary glucose excretion (UGE) induced by selective inhibition of sodium-glucose cotransporter 2 (SGLT2) elicits a complex set of metabolic changes and ameliorates type 2 diabetes mellitus (T2DM). Tofoglifl ozin (TOFO) is a novel and highly selective SGLT2 inhibitor. Safety, tolerability and effi cacy of TOFO was evaluated in a double-blind, randomized, placebo (PBO)-controlled 12-week dose fi nding study. After 4-week PBO run-in period, a total of 398 T2DM patients (pts), either (1) treated with diet and exercise (D&E) and a stable dose of metformin or (2) treated with D&E alone were randomized to TOFO 2.5, 5, 10, 20, 40 mg or PBO (qd, 15 min before breakfast, approx. 60% of D&E+Met). Signifi cant (except for 2.5 mg) and dose-dependent reductions of HbA1c were shown with a maximum lowering of 0.56% (PBO-adjusted, 40 mg), along with increased UGE. No clear difference was found between two treatment backgrounds. Dose-dependent BW reduction was also ob-served (Table), glucose intolerance was improved accompanied with plasma adiponectin increase and there was a trend for median blood pressure to de-crease by 3-4 mmHg. Once daily doses of TOFO for 12 weeks were well toler-ated and did not increase the incidence of hypoglycemia, urinary or genital tract infection, or cardiovascular events relative to placebo.
TableChange from baseline at week-12 (LOCF)
PBO(n=65)
2.5mg(n=64)
5mg(n=65)
10mg(n=66)
20mg(n=64)
40mg(n=66)
BL HbA1c (%) 7.87 7.94 8.01 8.00 7.92 7.93BL Body weight (BW; kg) 84.0 85.5 82.1 83.4 84.9 81.6
HbA1c (%) -0.27 -0.44 -0.62** -0.69** -0.77** -0.83**
BW (kg) -0.7 -1.6* -1.9** -2.2** -2.6** -2.8**
24h UGE (mmol/24h) 16.9 217.9** 272.3** 346.2** 396.0** 402.9**
Adiponectin (μg/mL) -0.22 -0.22 0.22 0.36 0.10 0.53*
unadjusted p-value: * <0.05, ** <0.01
ing on general medicine. Pocket insulin dosing cards with instructions for initiation of BBI and daily insulin adjustments were provided to all internal medicine residents November 2010. BBI utilization rates were monitored November 2010-February 2011 and compared to the corresponding four month period the previous academic year (November 2009-February 2010) before pocket insulin dosing cards were introduced. Study patients (N=212) and historical controls (N=223) were generally well matched. BBI orders in-creased from 12.8% of all resident insulin orders November 2010 to 58.1% of all orders February 2011 (P < 0.0001 for trend) compared to BBI insulin order rates of 0-8% November 2009-February 2010. Overall, BBI as a proportion of all insulin orders was 35.7% during the four month study window, a six-fold increase over the previous academic year (6%) that was highly and sta-tistically signifi cant (P<0.0001). In February 2011, when BBI utilization was maximal, proportion of capillary blood glucose (CBG) measurements 70-140 mg/dL for BBI managed patients was 42.8% compared to 35.9% for SSI man-aged patients, a signifi cant improvement (P=0.005) that occurred without an increase in CBG measurements < 70 mg/dL (2.8% for BBI patients, 2.4% for SSI patients, P=0.73). The SIU pocket insulin dosing guide signifi cantly increased utilization of BBI, decreased SSI orders, and improved hospital glycemic control for patients with diabetes mellitus.
78-ORBehavior Score InstrumentAMPARO GONZALEZ, SANDRA BURKE, ROBERTO MEJIA, RUTH LIPMAN, GUILLERMO UMPIERREZ, Atlanta, GA, Chicago, IL, Medellin, Colombia
The Behavior Score Instrument (BSI) developed by the American Asso-ciation of Diabetes Educators (AADE) provides quantitative assessment on behavior changes during Diabetes Self-Management Education/Training (DSME/T). The BSI tool covers healthy eating, being active, monitoring, medications, problem-solving, healthy coping and reducing risks (7 AADE Self-Care Behaviors™). Three questions for each behavior evaluate fre-quency, confi dence and conviction of patient’s intervention acceptance. We report the fi rst prospective evaluation of the BSI with 92 diabetes patients from the Grady Health System (Atlanta, GA). Participants were assessed us-ing the BSI, SF-12v2 for quality of life (QOL) measures, and clinical indicators (A1C, blood pressure and BMI) at baseline and 3-6 months. Demographics (age 55±11 yr, female 63%, high school education 53.3%, household income <$15,000/year 71.7%). BSI overall scores: 2.64±0.19 baseline and 2.7±0.27 (6 mo). A1C: 9.0% ±2baseline, 8.0%±2 (6 mo). BMI: 34.5±7 initial, 35.7±14 (6 mo). Systolic BP: 133.4±2 baseline, 127.8±20 (6 mo). Pearson correlation showed signifi cant correlation between overall initial and 3 mo BSI score (p <0.01) suggesting internal consistency. BSI score signifi cantly correlated with A1C (p<0.01) level and with QOL aggregate SF-12v2 mental component at baseline and 6 mo (p<0.01). The trend over time for overall BSI was driv-en by change in healthy eating and monitoring. Among each of the AADE Self-Care Behaviors™, only healthy eating (p=0.08) and monitoring (p=0.09) trended toward improvement at 3 mo and were signifi cant at 6 mo (p=0.001 and 0.004, respectively). Factor analysis suggests that 80% of the variance in the model is accounted for by two integrated factors. The fi rst factor is being active and taking medication. The second factor is the combination of healthy coping and monitoring behaviors. In summary, the BSI appears to be a valuable tool to access patient readiness to initiate behavior change and may also have use in redirecting patient’s goal setting to facilitate behavior change.
Supported by: Johnson and Johnson Diabetes Institute
SGLT-INHIBITORS
79-ORCanaglifl ozin Lowers Postprandial Glucose and Insulin by Delaying Intestinal Glucose Absorption in Addition to Increasing Urinary Glu-cose ExcretionDAVID POLIDORI, SUE SHA, SUNDER MUDALIAR, THEODORE P. CIARALDI, ATA-LANTA GHOSH, NICOLE VACCARO, KRISTIN FARRELL, PAIVI M. BURKE, PAUL ROTHENBERG, ROBERT R. HENRY, San Diego, CA, Raritan, NJ
Canaglifl ozin (CANA), a potent sodium glucose co-transporter 2 (SGLT2) inhibitor, is also a low-potency SGLT1 inhibitor; intestinal CANA levels post-dose may be suffi ciently high to transiently inhibit intestinal SGLT1. A 2-period crossover study was performed in 20 healthy subjects (mean±SD age=26±6 yr, BW=78±10 kg) to assess effects of a single 300 mg CANA dose on intestinal glucose (G) absorption using a dual tracer method (IV 3H-G and oral 14C-G). Placebo (PBO) or CANA was given 20 min prior to a 600 kcal mixed-meal tolerance test containing 75 g of G. Plasma G, 3H-G, 14C-G,

A23
For author disclosure information, see page 797.ADA-Funded Research
ORA
LS
SGLT-INHIBITORS
DAPA (mg/qd)Baseline HbA1c PBO 2.5 5 10Proportion of patients with a reduction in HbA1c 0.5% n (%) 24 weeks (LOCF)
N 689 558 695 690<8% N# 287 232 272 290
96 (33.4) 108 (46.6) 123 (45.2) 175 (60.3)8% to <9% N# 245 220 230 242
98 (40.0) 151 (68.6) 153 (66.5) 179 (74.0)9% N# 143 99 184 147
67 (46.9) 79 (79.8) 150 (81.5) 127 (86.4)Mean UGE/creatinine ratio g/g (SD) 4 weeks
N 689 625 763 766<8% N# 111 110 99 107
1.4 (5.1) 14.9 (18.0) 25.9 (23.4) 32.3 (21.5)8% to <9% N# 116 135 109 128
3.0 (9.3) 19.9 (24.7) 28.9 (22.9) 40.4 (24.2)9% N# 62 57 84 60
9.3 (20.5) 34.2 (28.9) 36.4 (29.9) 52.7 (37.5)N is the number of subjects in the Full Analysis Set. N# is the number of sub-jects with non-missing baseline and Week 24 (LOCF) values in the Random-ized Subjects/Full Analysis Set.
Supported by: AstraZeneca and Bristol-Myers Squibb
83-ORRenal Glucose Kinetics in Response to Dapaglifl ozinRALPH A. DEFRONZO, MARCUS HOMPESCH, SREENEERANJ KASICHAYANULA, XIAONI LIU, YING HONG, MARC PFISTER, LINDA A. MORROW, BRUCE R. LES-LIE, DAVID W. BOULTON, AGATHA CHING, STEVEN C. GRIFFEN, San Antonio, TX, Chula Vista, CA, Princeton, NJ
Dapaglifl ozin (DAPA) is a selective SGLT2 inhibitor that reduces hypergly-cemia in type 2 diabetes (T2D) by promoting urinary glucose excretion. This study (NCT01165268) examined the effect of DAPA on renal glucose kinetics in 12 healthy, age-, BMI -, gender -, and ethnicity-matched control (HbA1c 5.5%, 41 y, 27 kg/m2, 7 M/5 F) and 12 T2D (HbA1c 6.5%, 53 y, 30 kg/m2,7 M/5 F) subjects. All subjects had an estimated glomerular fi ltration rate (eGFR) 60 and 160 mL/min·1.73 m2 by the Modifi cation of Diet in Renal Disease equation. Subjects underwent a pancreatic stepped hyperglycemic clamp (SHC) (plasma glucose range 100-550 mg/dL) at baseline (BL) and after 7 d of DAPA, 10 mg/d. The SHC was performed with octreotide and basal insulin/glucagon/growth hormone replacement. T2D subjects continued on BL therapy, unless taking metformin, which was held for 48 h before SHC. A model was developed to describe maximum tubular glucose transport (TmG), renal glucose threshold (for onset of glucosuria), and splay of the glucose titration curve for healthy and T2D populations and then used to estimate these parameters from individual titration curves. At BL, the TmG (443 vs 326 mg/min, P <0.04) and splay (28650 vs 14248 mg2/min2, P <0.0001) were signifi cantly increased in T2D vs controls. DAPA treatment reduced TmG by 58% in T2D subjects and 53% in healthy subjects. The splay declined simi-larly by ~37% for both groups. The BL threshold was similar in T2D (196 mg/dL) and control (171 mg/dL) subjects. Following DAPA, the modeled threshold was markedly reduced in T2D patients by 89% (21 mg/dL) and in healthy subjects by 78% (37 mg/dL). These modeled threshold values were well be-low the plasma glucose levels evaluated in this study. eGFR was reduced by ~14% in both groups with DAPA. In summary, T2D subjects have a higher TmG than that of healthy controls. DAPA treatment for 7 d reduced TmG and
81-ORCanaglifl ozin, a Sodium Glucose Co-Transporter 2 Inhibitor, Im-proves Glycemic Control and Lowers Body Weight in Subjects With Type 2 Diabetes Inadequately Controlled With Diet and ExerciseKAJ STENLÖF, WILLIAM T. CEFALU, MARIA ALBA, KEITH USISKIN, YUE ZHAO, WILLIAM CANOVATCHEL, Gothenburg, Sweden, New Orleans, LA, Raritan, NJ
Canaglifl ozin (CANA), a novel inhibitor of the sodium-glucose co-trans-porter 2, is in development for the treatment of patients with type 2 diabetes mellitus (T2DM). This randomized, double-blind, placebo (PBO)-controlled, Phase 3 study evaluated CANA 100 or 300 mg versus PBO in subjects with T2DM inadequately controlled with diet and exercise (N=584; age 55.4 years; A1c 8.0%; fasting plasma glucose [FPG] 9.5 mmol/L; body mass index 31.7 kg/m2). At 26 weeks, A1c was signifi cantly reduced with CANA 100 mg (8.1% to 7.3%) and CANA 300 mg (8.0% to 7.0%) versus PBO (8.0% to 8.1%; P<0.001). Both CANA doses signifi cantly improved FPG, 2-hr postprandial glucose, and percentage of subjects reaching A1c <7% versus PBO. CANA also reduced body weight, reduced systolic blood pressure, and improved HDL-C versus PBO. The overall incidence of adverse events (AEs) was mod-estly higher with CANA 100 and 300 mg (61% and 60%, respectively) versus PBO (49%). Rates of serious AEs and AE-related discontinuations were low and similar among groups. Incidences of AEs consistent with genital mycotic infections were higher with CANA in women and men. A slightly higher rate of urinary tract infections was seen with CANA as well as AEs consistent with osmotic diuresis (eg, pollakiuria); these were generally mild and led to few discontinuations. The incidence of hypoglycemia was similar among groups. In summary, CANA improved glycemic control, reduced body weight, and was well tolerated in subjects with T2DM inadequately controlled with diet and exercise.
Supported by: Janssen Research and Development, L.L.C.
82-OREffi cacy Increases With Increasing Baseline HbA1c Category With Dapaglifl ozin TherapyELISE HARDY, AFSHIN SALSALI, VERONIKA HRUBA, TRACI MANSFIELD, KATJA ROHWEDDER, CATRIN WESSMAN, JENNIFER SUGG, LI WEI, AGATA PTASZYN-SKA, SHAMIK PARIKH, Wilmington, DE, Princeton, NJ, Prague, Czech Republic, Wedel, Germany, Molndal, Sweden
For patients with type 2 diabetes (T2DM) baseline HbA1c is an important factor in the choice of therapy and the magnitude of effect of antidiabetic agents. Dapaglifl ozin (DAPA) is a selective SGLT2 inhibitor that reduces hyperglycemia through the inhibition of renal glucose reabsorption and a resulting increase in urinary glucose excretion (UGE). Data from 5 phase III studies were pooled to assess the impact of baseline HbA1c on the effi cacy of DAPA (2.5mg, 5mg or 10mg) QD or matched placebo (PBO) for 24 weeks. HbA1c levels were reduced with all doses of DAPA vs. PBO and across all baseline HbA1c levels. Higher baseline values were associated with greater reductions in HbA1c at 24 weeks (Figure). An increase in the proportion of patients with HbA1c levels reduced by 0.5% was observed with DAPA vs. PBO across all baseline HbA1c categories and was greatest in patients with the highest HbA1c levels at baseline (Table). Higher baseline HbA1c levels were also associated with greater increases in UGE/creatinine ratio as early as week 4. In conclusion, higher baseline HbA1c levels were associated with greater improvements in glycemic effi cacy and greater increases in UGE with DAPA in T2DM patients with inadequate glycemic control.

A24
For author disclosure information, see page 797. ADA-Funded Research
ORA
LSHUMAN IMMUNOLOGY AND DIABETES
after dx (0.33/0.45 vs 0.27/0.40) but the test of treatment effect of dura-tion was not signifi cant (p=0.4). In addition, subjects age 8-14 showed better responses (p=0.017) compared to older subjects (p=0.36). We conclude that immune therapy can attenuate the decline in C-peptide in T1D even 8 mos after diagnosis with children showing greater responses to this therapy.
86-ORAdministration of CD4+CD25highCD127- T Regulatory Cells as a Ther-apy for Remission in Type 1 Diabetes in ChildrenNATALIA MAREK-TRZONKOWSKA, MALGORZATA MYSLIWIEC, ANITA DOBYSZUK, MARCELINA GRABOWSKA, ILONA TECHMANSKA, JOLANTA JUS-CINSKA, MAGDALENA A. WUJTEWICZ, PIOTR WITKOWSKI, WOJCIECH MLY-NARSKI, ANNA BALCERSKA, JOLANTA MYSLIWSKA, PIOTR TRZONKOWSKI, Gdansk, Poland, Chicago, IL, Lodz, Poland
Type 1 diabetes (DM1) is a condition in which pancreatic islets are de-stroyed by autoreactive T cells. The process is facilitated by defi cits in the number and suppressive activity of T regulatory cells (Tregs). Here, we show for the fi rst time that the infusion of ex vivo expanded Tregs may prolong a clinical remission in children with recently diagnosed DM1. The study was conducted according to the ethically approved protocol (NKEBN/8/2010). Written Informed consent was obtained from parents and children over 16 yo prior to the study inclusion. We administered Tregs in ten DM1 chil-dren within two months since the diagnosis. Autoimmunity was confi rmed with anti-GAD, ICA and, IAA. The preparation consisted of autologous CD3+CD4+CD25highCD127- Tregs sorted with single-use-sample-line FACS-sorter and expanded under GMP-conditions. The number of infused Tregs was up to 20x106/kg b.w. No adverse effects were observed during and af-ter Tregs infusion. A signifi cant increase in the percentage of Tregs in the peripheral blood was recorded after the treatment. Half a year after the diagnosis of DM1 all patients treated with Tregs were still in the remission defi ned as daily dose of insulin (DDI) less than 0.5UI/kg b.w.. Study patients were followed along with ten DM1 patients not treated with Tregs. This control group matched Tregs-treated group in regards to DDI and C-peptide levels at the time of DM1 diagnosis, as well as age, sex and BMI. Signifi -cant differences between the groups were apparent six months after the diagnosis. The remission was over at this time in the group not treated with Tregs. In addition, plasma C-peptide levels were signifi cantly higher in the Treg treated group as compared to those not treated [median(min-max) 0.65 (0.46-2.11)ng/ml versus 0.40 (0.15-0.74)ng/ml; U-Mann-Whitney test, p=0.04)]. During the ADA Congress the results of 1-year follow up will supplement the presentation.
Supported by: Polish Ministry of Science and Kosciuszko Foundation
87-ORLADA is not a Distinct Form of Autoimmune DiabetesRICHARD D. LESLIE, MOHAMMED I. HAWA, HUBERT KOLB, NANETTE SCHLOOT, HURIYA BEYAN, STAVROULA A. PASCHOU, RAFFAELLA BUZZETTI, DIDAC MAU-RICIO, ALBERTO DE LEIVA, KNUD YDERSTRAEDE, HENNING BECK-NIELSEN, CIN-ZIA SARTI, JAAKKO TUOMILEHTO, CHARLES THIVOLET, DAVID HADDEN, STE-VEN HUNTER, SCHERNTHANER GUNTRAM, WERNER A. SCHERBAUM, SINEAD BROPHY, RHYS WILLIAMS, PAOLO POZZILLI, London, United Kingdom, Düsseldorf, Germany, Rome, Italy, Lleida, Spain, Barcelona, Spain, Odense, Denmark, Helsinki, Finland, Lyon, France, Belfast, Ireland, Vienna, Austria, Swansea, United Kingdom
Type 1 diabetes is characterized by specifi c autoantibodies, also found in adult-onset diabetes even when initially non-insulin requiring i.e. in latent autoimmune diabetes (LADA). Our aim was to characterise adult-onset auto-immune diabetes in Europe. Consecutive diabetes patients within 5 years of diagnosis (age range 30-70 years) attending European clinics were examined clinically and for autoantibodies to glutamic acid decarboxylase (GADA), insulinoma-associated antigen-2 (IA-2A) and zinc-transporter8 (ZnT8A) us-ing established radio-immunoprecipitation assays. Autoantibody-positive patients were designated type 1 diabetes (insulin-treated at diagnosis), and LADA, (6 months insulin-free). Of 6,156 patients, 541 (8.8%) had GADA alone or in combination with the other autoantibodies. GADA titers showed two modes. An additional 57 (0.9%) had IA-2A and/or ZnT8A alone. Of au-toantibody positive patients, those classifi ed as type 1 diabetes compared with LADA had a lower age of onset and BMI, (p<0.001 for both), but similar number with high GADA titre (80% vs 76%). Autoimmune diabetes patients with high titre (>200 WHO IU) GADA (n=403), in contrast to low titre GADA (n=138), were more likely to be female, younger, with lower BMI (p<0.01 for all) with lower triglycerides (p<0.001) and more insulin treated (54.6% ver-sus 39.7%; p=0.005). Compared to GADA negative patients, the low GADA titre group also had lower BMI (p<0.01) with more insulin treated (p<0.001). Among all GADA positive patients, GADA titre was positively correlated
splay. However, the markedly decreased renal glucose threshold was the primary mechanism responsible for the induction of glucosuria with DAPA in both T2D and healthy subjects.
Supported by: AstraZeneca and Bristol-Myers Squibb
84-ORCanaglifl ozin (CANA), a Sodium Glucose Co-Transporter 2 (SGLT2) Inhibitor, Reduces Post-meal Glucose Excursion in Patients With Type 2 Diabetes Mellitus (T2DM) by a Non-Renal MechanismPETER P. STEIN, JOLENE K. BERG, LINDA MORROW, DAVID POLIDORI, EUNICE ARTIS, SARAH RUSCH, KIRK WAYS, NICOLE VACCARO, DAMAYANTHI DEVINE-NI, Raritan, NJ, San Antonio, TX, Chula Vista, CA, San Diego, CA, Beerse, Belgium
In early studies of CANA, doses 200 mg lowered post-prandial glucose excursions (PPGE) more than lower doses studied, despite similar urinary glucose excretion (UGE), raising the potential for an additional, non-renal effect of CANA on PPGE. This study examined this by separating CANA’s effect to lower PPGE by increased UGE vs non-renal effects during a meal tolerance test (MTT): 37 subjects with T2DM inadequately controlled (A1c 7-9%) on metformin (mean age 55 yrs, 62% male, mean BMI 31.2 kg/m2,mean A1c 8.0%) were randomized to a 4-period crossover study with 3-day inpatient stays (+ 2 wk wash-out). Treatments (TRT) administered on the morning of Day 2/Day 3 were: A=Placebo (PBO)/PBO; B=CANA 300 mg/PBO; C=CANA 300 mg/CANA 300 mg; D=CANA 300 mg/CANA 150 mg. The MTT was started 20 min post-dose on Day 3. CANA 300 mg provides near-maximal effects on UGE for 24h so TRTs B-D were expected to have similar UGE during MTT so differences in PPGE between C or D vs B should refl ect a non-renal mechanism, while differences between B-D vs A refl ect both UGE and non-renal effects. Thirty-six subjects completed all periods. CANA 300 mg lowered FPG on Day 3: mean (95% CI): 171 (161; 181) mg/dL for A, 146 (141; 152) mg/dL for B and similar for C and D. During MTT, TRT C lowered total (t) GLU AUC0-2h vs A by 16% (p<0.001) and incremental ( )AUC0-2h by 19% vs A, with TRT C lowering AUC0-2h by 12% vs B (p=0.012). Similar results were observed for GLU AUC0-4h: TRT C lowered t-AUC by 17% vs A and lowered
AUC by 15% vs B. There was no effect of D vs B on AUC. UGE over 2 and 4 h was similar for B, C, and D. CANA was generally well tolerated. Thus, 1) single doses of CANA 300 mg lower FPG and 2) an additional, non-renal mechanism contributes to the PPGE-lowering observed with CANA 300 mg (but not 150 mg). The non-renal effect on CANA to lower PPGE may be due to local / transient intestinal SGLT1 inhibition from high intraluminal CANA levels during drug absorption.
Supported by: Janssen Research and Development, L.L.C.
HUMAN IMMUNOLOGY AND DIABETES
85-ORTeplizumab Preserves Insulin Production in Type 1 Diabetes After the New Onset PeriodKEVAN C. HEROLD, STEPHEN GITELMAN, STEVEN WILLI, PETER GOTTLIEB, JAMES DZIURA, JEFFREY BLUESTONE, New Haven, CT, San Francisco, CA, Phila-delphia, PA, Aurora, CO
Successful immune therapy trials in T1D have generally enrolled pa-tients soon after onset but loss of insulin production continues for years afterwards. To determine whether immune modulation affects C-peptide responses after onset, we performed a randomized placebo (pcbo) con-trolled trial of anti-CD3 mAb (teplizumab) in patients with T1D for 4-12 mos duration. A total of 58 patients with T1D (mean age 12.3±2.01 yrs) of 4-12 mos duration (mean=7.11±0.31 mos) were enrolled at 4 sites and received a 14 day course of teplizumab or pcbo. At baseline, subjects were taking 0.40±0.022 units/kg/d of insulin. The baseline C-peptide AUC (ln(AUC+1)) in drug and pcbo tx’d groups were 0.466±0.032 pmol/ml/min and 0.441±0.045 pmol/ml/min respectively. The drug was well tolerated: a total of 6 SAEs in 5 subjects were reported. Teplizumab treatment preserved C-peptide at 12 months (0.379±0.041 vs 0.300±0.044 pmol/ml/min, p=0.03) and had a signifi cant effect on C-peptide responses over 1 year in a mixed model cor-rected for baseline C-peptide and duration of diabetes (p=0.045). Of the 58 randomized subjects, fi ve lost detectable levels of C-peptide at 12 months and all were in the pcbo group (p=0.02). Insulin use was also decreased in drug treated subjects (average of 0.438±0.24 vs 0.522±0.025 units/kg/d, p=0.019). A drug-dependent decrease in the CD4:CD8 T cell ratio (p=0.049) at 2 wks and an increase in the absolute number of CD8+CD45RO+CD62L+
central memory cells (p=0.018) at 2mos distinguished responders from non-responders. The effects on subjects enrolled within 4-8 mos after dx were greater (95%CI: 0.32/0.40 vs 0.25/0.35) than in individuals treated 9-12 mos

A25
For author disclosure information, see page 797.ADA-Funded Research
ORA
LS
HUMAN IMMUNOLOGY AND DIABETES
help aid clinical decision-making in regards to specifi c treatment regimens and novel therapies if performed at diagnosis.
Supported by: Dr. Briscoe is supported by a Genentech fellowship training grant
90-ORGlucagon-Like Peptide-1: A Key Regulator of Innate Immune Func-tion With Clinical Effi cacy in a Range of Infl ammatory DiseasesANDREW E. HOGAN, OBESITY IMMUNOLOGY RESEARCH GROUP, DONAL O’SHEA, OBESITY IMMUNOLOGY RESEARCH GROUP, Dublin, Ireland
Invariant natural killer T (iNKT) cells are key innate immune cells impli-cated in the pathogenesis of many diseases. Glucagon-like peptide-1 (GLP-1) is an incretin hormone implicated in the regulation of glucose metabolism and body weight. We recently demonstrated that psoriasis is improved in patients treated with GLP-1 analogue therapy and that GLP-1 is a regulator of iNKT cell cytokine production. We proposed that GLP-1 therapy would improve other infl ammatory conditions, both with and without co-morbid diabetes, and that GLP-1 regulates other innate immune cells, including monocytes and macrophages. Two diabetes patients, one with rheumatoid arthritis (RA) and one with ulcerative colitis (UC), were treated with the GLP-1 analogue liraglutide. Twelve weeks of therapy resulted in improvements in the symptoms and signs of RA (28-joint Disease Activity Score reduced from 5.5 to 3.0), and a reduction of bowel frequency from 5-6 bloody mo-tions/day to 2-3 motions/day, respectively. This was associated with a signifi cant reduction in pathogenic cytokine production by peripheral blood mononuclear cells in each patient (TNF : 200 to 98 pg/ml in RA; IL-13: 82 to 32 pg/ml in UC). GLP-1 analogue therapy in standard non-diabetic animal models of UC and RA led to a reduction in colitis disease severity, acceler-ated repair of colon infl ammation, and a decrease in serum amyloid levels in the UC model, and amelioration of the severity of arthritis-like disease by multiple parameters in the RA model. GLP-1 receptor activation on innate immune cells (iNKT cells, monocytes and macrophages) in vitro activated the anti-infl ammatory transcription factor CREB and inhibited the classic pro-infl ammatory transcription factor NF B. We conclude that GLP-1 therapy is immunomodulatory and may impact on the clinical course of a range of in-fl ammatory diseases. Future work should investigate the range of benefi cial, and potentially adverse, immune effects of incretin therapies.
Supported by: National Children’s Research Centre, OLCH
91-ORProinsulin/Insulin Autoantibodies Measured With Electrochemi-luminescent Assay Are the Earliest Indicator of Prediabetic Islet AutoimmunityANDREA K. STECK, LIPING YU, FRAN DONG, DONGMEI MIAO, JANET WENZLAU, JOHN HUTTON, MARIAN J. REWERS, GEORGE S. EISENBARTH, Aurora, CO
The pre-clinical phase of type 1 diabetes is marked by the presence of per-sistent islet autoantibodies. The Diabetes Autoimmunity Study in the Young (DAISY) follows prospectively for development of islet autoimmunity (de-fi ned as presence of autoantibodies to insulin, GAD65, IA-2 or ZnT8) and type 1 diabetes children at increased genetic risk (general population children and fi rst-degree relatives). Serial serum samples from subjects that progressed to type 1 diabetes (N=63), most followed from birth, were tested using a novel electrochemiluminescent assay for insulin/proinsulin autoantibodies (ECL-IAA). The ECL-IAA detected onset of islet autoimmunity earlier than any of the four traditional biochemical antibodies in 15 (24%) children. ECL-IAA antedated the onset of islet autoimmunity in these children by a mean of 2.6 years (range: 0.3-7.6 years). At the fi rst positive autoantibody visit, ECL-IAA was the most frequent autoantibody present (95%), followed by mIAA (48%), GAD65 (41%), ZnT8 (22%), and IA-2 (19%) autoantibodies (p<0.0001). This new ECL-IAA assay defi nes more precisely the onset of prediabetic autoim-munity and may help identify events triggering islet autoimmunity as well as allow earlier intervention for type 1 diabetes.
Supported by: JDRF (11-2010-206)
92-ORThe Identifi cation of Islet Autoantibodies in Patients With Mono-genic DiabetesJANA URBANOVÁ, CERA, M. ANDEL, B. RYPÁCKOVÁ, P. HENEBERG, Z. BAZALOVÁ, P. KU, Prague, Czech Republic
Introduction: The incidence of islet autoantibodies (iAb) is considered as manifestation of autoimmune insulitis and diagnostic criteria of T1DM. On the other hand absence of iAb at the time of diagnosis, especially with the evidence of preserved insulin production outside the honeymoon period at lean adults with at least 1 diabetic parent increases the susceptibility for monogenic diabetes (MDM). However, cases of patient with MDM and posi-
with age at diagnosis (r = 0.129, p=0.010). European patients with adult-onset autoimmune diabetes, whilst usually non-insulin requiring with GADA, have a broad clinical spectrum. Between type 1 diabetes and LADA there were some quantitative, but no categorical, immunophenotypic differences apart from initial insulin therapy. This largest study of adult-onset autoim-mune diabetes indicates a gradation in features so, insulin treatment apart, LADA is not a distinct form of autoimmune diabetes.
88-ORLADA China Study—Frequency, Immunogenetics and Clinical Char-acteristics of Latent Autoimmune Diabetes in ChinaZHIGUANG ZHOU, YUFEI XIANG, LINONG JI, WEIPING JIA, GUANG NING, GAN HUANG, LIN YANG, JIAN LIN, ZHENQI LIU, WILLIAM A. HAGOPIAN, RICHARD D. LESLIE, LADA CHINA STUDY GROUP, Changsha, China, Beijing, China, Shanghai, China, Charlottesville, VA, Seattle, WA, London, United Kingdom
We sought to determine features of adult-onset autoimmune diabetes among recently-diagnosed diabetes patients with glutamic acid decar-boxylase antibodies (GADA) in 46 hospital-based clinics across China. We screened ketosis-free diabetes patients, within one year of diagnosis, who were independent of insulin therapy for > 6 months and aged >15 years, for GADA and for HLA-DQ genotype measured centrally and clinical data collect-ed locally. Latent Autoimmune Diabetes of Adult-onset (LADA) was identi-fi ed in GADA-positive patients aged >30 years at diagnosis. Of 5128 patients, 6.2% had GADA, most with LADA (5.9%). LADA showed a north-south gradi-ent (6.5% vs. 5.4% respectively; P=0.040). Compared with GADA-negative type 2 diabetes, LADA patients were leaner [body mass index(BMI): 23.9±3.7 vs. 24.8±3.4 kg/m2, P<0.001], with lower fasting C-peptide [0.47 (0.01-3.34) vs. 0.64 (0.01-4.96) ng/ml, P<0.001) ], and less Metabolic Syndrome (62.0% vs. 75.6%, P<0.001). These differences were even greater in LADA patients with higher GADA titers. HLA diabetes-susceptible haplotypes were more frequent in LADA [63.9% (115/180)], than in both type 2 diabetes [47.1% (82/174); P<0.010)] and controls [43.2% (214/495); P<0.001]. HLA diabetes-protective haplotypes were less frequent in LADA [22.8% (41/180)], than in both type 2 diabetes [33.3 % (58/174), P<0.05] and controls [32.7 % (162/495), P<0.05]. Among patients with the clinical characteristics of type 2 diabetes, GADA-positive and LADA diabetes was prevalent in China (6.2% and 5.9%, respectively) with north-south frequency gradient. The immunogenetic and clinical features of LADA in China are strikingly similar to those in Europe, some differences are noted. Our study implicates universal immunogenetic effects, with some ethnic differences, associated with adult-onset autoim-mune diabetes.
Supported by: EFSD
89-ORImmune Responses During the Honeymoon Phase in Children With Type 1 Diabetes—A Longitudinal StudyAUDREY BRISCOE, GHANASHYAM SARIKONDA, SOWBARNIKA SACHITHANAN-THAM, MICHAEL GOTTSCHALK, MATTHIAS VON HERRATH, San Diego, CA, La Jolla, CA
Pediatric patients with Type 1 diabetes mellitus (T1DM) transition into the honeymoon phase (a time of continued endogenous insulin secretion and improved glycemic control) shortly after diagnosis. The strength and dura-tion of the honeymoon is variable. Changes in the immune system may help explain the honeymoon phase. We began a longitudinal study following the immune response of patients newly diagnosed with T1DM from diagnosis through 12mo. We recruited 35 patients (18M/17F) age 7.2-16.7 yo (mean 12.3 yo); 49% presented in DKA. Forty-eight percent had a signifi cant hon-eymoon ( 0.5U/kg/d) 3mo after diagnosis. Regulatory T-cells (Treg) were evaluated by fl ow cytometry and CD4 specifi c cytokine secretion in response to pancreatic peptides (PI, IA2 and GAD) was evaluated by ELISPOT. Neither the presence of DKA nor the day of the blood draw affected either param-eter at diagnosis. The frequency of Treg (CD4+CD25+FoxP3+(%CD4+)) didn’t change during the 12mo study and no associations were seen with HbA1C, insulin dose or C-peptide. IL-10 secretion did not differ at the 3 time points nor showed any association with HbA1C, insulin dose or C-peptide at 3mo. IFN- , however, increased over time from diagnosis to 12mo for all patients (p 0.0121) and showed the same trend in those with a signifi cant honey-moon (p 0.108). There was a consistent positive correlation between IFN-secretion at diagnosis and a higher C-peptide value at 3mo in those with and without a signifi cant honeymoon when evaluated by average absolute number and stimulation index above background (3 peptides summed and GAD when evaluated individually). The secretion of IFN- can be measured in newly diagnosed children with T1DM to help predict the strength of the honeymoon phase as measured by an increased C-peptide value. This may
WITHDRAWN

A26
For author disclosure information, see page 797. ADA-Funded Research
ORA
LSINSULIN SIGNAL TRANSDUCTION AND ACTION
profi les the phosphorylation of most of the detected sites. Moreover, insulin-stimulated Ser/Thr phosphorylation displayed similarities and difference in each cell type. Using small molecule inhibitors of PI3 kinase, AKT and mTOR we found a close inverse relation between insulin-stimulated Ser/Thr and tyrosine phosphorylation, but the contribution of individual sites to insulin resistance was diffi cult to resolve. Moreover, agonists of cellular stress—anisomycin, thapsigargin, and tunicamycin—also revealed distinct phos-phorylation pattern and a close inverse relation between multisite Ser/Thr phosphorylation and insulin-stimulated tyrosine phosphorylation. Together our results suggest that multisite Ser/Thr phosphorylation—rather than the phosphorylation of any single residue—modulates the insulin signal.
Supported by: NIH, HHMI
95-ORPar14 Associates With IRS-1, Thereby Enhancing Insulin-Induced IRS-1 Phosphorylation and Metabolic ActionsJUN ZHANG, YUSUKE NAKATSU, TSUYOSHI YAMAMOTOYA, YING GUO, MIDORI FUJISHIRO, AKIFUMI KUSHIYAMA, HIDEYUKI SAKODA, TOMOICHIRO ASANO, Hiroshima City, Japan, Tokyo, Japan
Pin1 and PAR14 are parvulin-type peptidyl prolyl cis/trans isomerases. While numerous proteins have been identifi ed as Pin1 substrates, the target proteins of PAR14 remain largely unknown. We previously reported the asso-ciation of Pin1 and IRS-1, and found that the PAR14 expression level increased in Pin1 KO mouse tissues or Pin1 siRNA-treated HepG2 cells, suggesting a compensatory relationship between the functions of Pin1 and PAR14. Herein, we demonstrated that PAR14 associates with IRS-1, employing a pull-down experiment with GST-PAR14 protein and HepG2 cell lysates. The association of PAR14 with IRS-1 was confi rmed in not only overexpression experiments using HepG2 cells, but also endogenously in the mouse liver. The analysis us-ing deletion-mutated PAR14 and IRS-1 constructs revealed the DBD domain located in the N-terminal side of PAR14 and the two relatively C-terminal portions of IRS-1 to be involved in their association, in contrast to the WW domain of Pin1 and the SAIN domain of IRS-1. The PAR14 overexpression in HepG2 markedly enhanced insulin-induced IRS-1 phosphorylation and its downstream events; PI 3-kinase binding with IRS-1 and Akt phosphoryla-tion. In contrast, treating HepG2 cells with PAR14 siRNA suppressed these events. In addition, overexpression of PAR14 in the ob/ob mouse liver by adenoviral transfer signifi cantly improved hyperglycemia with normalization of hepatic PEPCK and G6Pase mRNA levels. Therefore, Pin1 and PAR14 as-sociate with different portions of IRS-1, but it is very likely that the cis-trans conformational change in these proline residues enhances the effi ciency of insulin receptor-induced IRS-1 phosphorylation. This process constitutes a potential therapeutic target for novel insulin-sensitizing agents.
96-ORGenetic or Pharmacologic Inhibition of the STARS-SRF Pathway Increases AMPK Phosphorylation and Oxidative MetabolismWEN KONG, ALISON BURKART, MICHAEL CHEN, WANZHU JIN, MICHAEL HIR-SHMAN, LAURIE GOODYEAR, RICHARD NEUBIG, SCOTT LARSEN, PAUL ALLEN, C.G. TEG PIPES, RHONDA BASSEL-DUBY, ERIC OLSON, MARY-ELIZABETH PATTI, Boston, MA, Wuhan, China, Ann Arbor, MI, Dallas, TX
We recently reported expression of the serum response factor (SRF) regu-lator STARS (striated muscle activator of Rho signaling) was increased by 2.5-fold in skeletal muscle of humans with T2D and correlated with insu-lin resistance (r=-0.42). To identify the role of STARS in vivo, we analyzed metabolic phenotypes in mice with whole-body ablation of STARS (STARS KO) and wild type (WT) littermates. STARS KO mice are resistant to diet-induced obesity, with a 41% reduction in body weight (p<0.01 vs. WT) de-spite unchanged food intake. STARS KO mice have a 30% increase in energy expenditure (p<0.05 vs. WT) and increased fi tness, as indicated by increased running duration (2-fold increase, p<0.05), and increased VO2max (30% in-crease, p<0.05). These results indicate that inhibition of the STARS-SRF pathway can have benefi cial effects on systemic metabolism. To determine potential mechanisms mediating these effects, we isolated primary myo-blasts from WT and STARS KO mice. STARS KO myotubes had increased AMP kinase (AMPK) phosphorylation (53% increase, p<0.05) with no change in AMPK protein. This occurred in parallel with an 18% reduction in mTOR phosphorylation (p<0.05). Moreover, STARS KO myotubes had a 77% reduc-tion in mitochondrial DNA content (p=0.01), a 63% decrease in OXPHOS complex II protein (p<0.05) and a 4-fold increase in UCP3 mRNA and protein expression (p<0.05 for both). To determine whether effects of STARS abla-tion could be recapitulated by inhibition of SRF, we treated C2C12 myotubes with the SRF inhibitors CCG203471 at 3uM overnight. CCG203471 increased AMPK phosphorylation (4 fold, p<0.05), decreased mTOR phosphorylation
tive titre iAb has been published. Aims: The aim of this research was to de-termine the incidence of islet autoantibodies in patients with MDM. Meth-ods: GADA and IA2A were currently determined or retrospectively searched at 24 patients with molecular genetically verifi ed MDM (HNF4A diabetes: n = 3, HNF1A diabetes: n = 12, GCK diabetes: n = 9). GADA / IA2A were de-termined by RIA. Genetic testing was performed by direct sequencing (ABI PRISM 3130), evaluated in the program SeqScape. Results: We have shown a signifi cant presence of specifi c iAb in almost one third of the patients with the most common subtypes of monogenic diabetes (7/24; 29.16%), es-pecially at HNF1A diabetes (4/8; 16.66%), small group of HNF4A diabetics (2/1; 8.33%), and rather exceptionally at GCK diabetes (1/6; 4.16%). The most prevalent antibody was GADA (6/7; 85,71%). iAb were present at the time of manifestation of diabetes and also many years later. In most of the iAb positive patients sulfonyulurea derivates have been found not suffi cient for good glycemic control and these patients lately needed also insulin regard-less of the suffi cient level of C-peptide. Conclusion: It is diffi cult to interpret simultaneous presence of iAb and mutation in HNF1A / HNF4A gene. One possibility could be explained as rare coexistence of autoimmune insulitis and MDM. However, the iAb may also refl ect an increased destruction of beta-cells (progressive beta-cell loss possibly due to impaired cell turnover in the course of MDM).
INSULIN SIGNAL TRANSDUCTION AND ACTION
93-ORRegulation of Insulin on Tyrosine Phosphorylation in Human Skel-etal MuscleDANJUN MA, XIANGMIN ZHANG, MICHAEL CARUSO, ZHENGPING YI, Detroit, MI, Tempe, AZ
Tyrosine phosphorylation plays a fundamental role in many cellular pro-cesses such as growth and insulin signaling. In insulin resistant skeletal muscle, aberrant tyrosine phosphorylation of a few proteins has been re-ported. Here, we report the 1st tyrosine phosphoproteomic study of human skeletal muscle from a lean, healthy volunteer. Hyperinsulinmic, euglycemic clamp was performed, and biopsies at basal, 0.5h and 2h after insulin in-fusion were obtained. Trypsinized muscle proteins were subjected to im-munoprecipitation of phosphortyrosine peptides and HPLC-ESI-MS/MS. 52 distinct tyrosine phosphorylation sites in 35 proteins were identifi ed, 8 major glycolytic enzymes (such as ENO1 & ALDOA), 6 enzymes regulating glycogen metabolism (such as GYS1 & GSK3), 8 sarcomeric proteins (such as MYH1/2/7 & MYL3), as well as proteins involved in MAP kinase signal-ing (MAPK12 & PTPN11) and phosphocreatine resynthesis (CKM & CKMT2). Among the identifi ed phosphorylation sites, 23 were not listed in the largest phosphorylation site database, www.phosphosite.org, and thus appeared to be novel. One of the sites is pY140 in creatine kinase M-type (CKM) detected with 5 spectra in the basal, 2 in the 0.5h, and 5 in the 2h biopsies, indicating that pY140 level decreased after 0.5h insulin infusion and came back to the basal level after 2h insulin infusion. On the other hand, pY539 of phosphoglu-comutase-1(PGM1) was identifi ed with 2 spectra each in the basal, 0.5h, and 2h biopsies, suggesting little effect of insulin on this site. Besides, pY353 in phosphorylase b kinase gamma catalytic chain (PHKG1) was not detected in the basal biopsy, while detected with 2 spectra in the 0.5h and 1 spectrum in the 2h biopsies, implying pY353 was an insulin stimulated site. More ex-periments are on-going to confi rm these results. These results provided the 1st evidence that multiple novel tyrosine phosphorylation sites have distinct response to insulin in vivo in a time dependent manner, and may lead to new insights into the pathogenesis of T2D.
94-ORInvestigating Global IRS1 Ser/Thr Phosphorylation Using a Phos-phospecifi c Monoclonal Antibody ApproachNANCY HANCER, WEI QIU, MORRIS WHITE, Boston, MA
Insulin Receptor Substrate 1 (Irs1) is an important adapter protein that lies immediately downstream of the insulin receptor. IRS1 coordinates insulin signaling upon tyrosine phosphorylation; however, phosphorylation of serine and threonine residues in Irs1 is generally thought to have a negative regula-tory role. Mass spec analysis of insulin-stimulated IRS1 reveals more than 50 phosphorylated Ser/Thr residues, but quantitative analysis is diffi cult to ac-complish. We have solved this problem by generating phosphospecifi c mono-clonal antibodies that span the length of IRS1 and using Luminex technology to study Irs1 Ser/Thr phosphorylation. Using CHO cells, L6 myoblasts or Fao hepatoma cells, insulin stimulates or inhibits with distinct time-dependent

A27
For author disclosure information, see page 797.ADA-Funded Research
ORA
LS
INSULIN ACTION IN ANIMALS
99-ORp70S6-Kinase is a Novel AMPK Kinase that Suppresses Hypotha-lamic AMPK Activity to Inhibit Food IntakeYOSSI DAGON, Boston, MA
The hypothalamic mammalian Target of Rapamycin (mTOR)-p70S6-kinase (S6K) pathway responds to hormonal and nutrient signals, suppresses food intake and is necessary for leptin’s anorexigenic effect. We aimed to iden-tify S6K downstream targets that mediate these effects in hypothalamus. Bioinformatic analysis of the S6K consensus motif RXXS identifi ed a poten-tial phosphorylation site on serine 491 in the catalytic a2 subunit of AMPK (AMPK 2). A proline at -5 is likely to impede phosphorylation by other AGC kinases. Expression of constitutively active S6K1 in hypothalamic GT1-7 neurons stimulated AMPK phosphorylation on serine 491 but not on threo-nine 172. In vitro, recombinant S6K1 directly phosphorylated recombinant AMPK 2 on serine 491. Immunoprecipitation of S6K from brains and GT1-7 neurons revealed an AMPK 2-S6K1 complex, suggesting a direct interaction. Modulation of hypothalamic AMPK activity is a central mechanism for food intake regulation and is necessary for leptin’s anorexigenic effect. S6K-/- mice do not respond to leptin’s anorectic action and exhibit increased AMPK activity. Leptin injection increased AMPK serine 491 phosphorylation by 47% in arcuate and 53% in ventromedial/dorsomedial hypothalamus but had no effect in S6K-/- mice. To test the effect of S6K dependent phosphoryla-tion of AMPK serine 491, we expressed a phosphodefective AMPK 2-S491A mutant (S491A) in basomedial hypothalamus in normal mice. S491A expres-sion increases food intake by 48%/day compared to WT-AMPK (p<0.05) and blocks leptin’s effects to inhibit AMPK 2 activity and to reduce food intake (WT-AMPK -42% vs S491A -6%/24h p<0.05) and body weight. Thus, AMPK serine 491 phosphorylation is necessary for leptin’s effects on food intake and body weight. Conclusion: S6K is a novel inhibitory AMPK-kinase and AMPK can be a substrate for mTOR-S6K. This has broad implications since mTOR-S6K and AMPK have multiple and generally opposing cellular effects in metabolism, cell growth and development.
100-ORThe Role of Inositol Polyphosphate in Energy HomeostasisSOOKHEE BANG, SEYUN KIM, MEGAN J. DAILEY, YONG CHEN, TIMOTHY H. MO-RAN, SOLOMON H. SNYDER, SANGWON F. KIM, Philadelphia, PA, Baltimore, MD
Energy homeostasis is essentially a balancing act between energy intake and energy expenditure. Obesity by the excess energy intake is strongly associated with type 2 diabetes. AMP-activated protein kinase (AMPK), a phylogenetically conserved serine/threonine protein kinase, acts as an inte-grator of regulatory signals monitoring systemic and cellular energy status. Moreover, AMPK in the hypothalamus plays an important role in food intake control. Hence, AMPK pathway has become one of the major targets to treat type 2 diabetes and the metabolic syndromes. We have previously identifi ed that inositol polyphosphate multikinase (IPMK), one of the enzymes involved in the inositol pathway, is regulated by nutrient availability in the hypothala-mus. Therefore, we explored whether IPMK plays any role in nutrient sens-ing in the hypothalamus. We fi nd that IPMK physically interacts with AMPK and this interaction is enhanced by glucose supplementation. Importantly, a dominant negative peptide which interferes interaction between IPMK and AMPK attenuates glucose-mediated regulation of AMPK. Moreover, we found that IPMK regulates glucose signaling to AMPK in a pathway whereby glucose activates phosphorylation of IPMK at tyrosine-174 enabling the enzyme to bind to AMPK and regulate its activation. Furthermore, we ob-served that genetic deletion of IPMK in hypothalamus reduces food intake measured under fasting/refeeding paradigm. In conclusion, IPMK appears to play a major role regulating AMPK signaling pathway. Therefore these fi ndings imply that IPMK will be a new therapeutic target for the treatment of obesity and type 2 diabetes.
Supported by: R01DK084336 and NARSAD
INSULIN ACTION IN ANIMALS
101-ORPhysical Inactivity and High Fat Diet Synergically Induce Insulin Resistance in Skeletal Muscle Through PTP1B ActivationSAORI KAKEHI, YOSHIFUMI TAMURA, SHIN-ICHI IKEDA, KAGEUMI TAKENO, MI-NAKO KAWAGUCHI, TAKAHIRO WATANABE, TAKASHI FUNAYAMA, FUMIHIKO SATO, RYUZO KAWAMORI, HIROTAKA WATADA, Tokyo, Japan
Both physical inactivity and high fat diet (HFD) are associated with insulin resistance. In rodent model, not only very short-term (~24h) physical inac-tivity by hind-limb cast immobilization (HCI), but also long-term (more than
(33% decrease, p<0.05), and in parallel increased UCP3 expression (4.7 fold, p<0.05). Together, our data indicate that STARS can modulate cellular and whole body-energy metabolism, potentially via SRF-dependent alterations in mitochondrial metabolism and activation of AMPK-dependent pathways.
Supported by: China Scholarship Council Fund, NIH-DK-062948, 5T32DK07260-34, Lilly Foundation
97-ORMitochondrial Akt1 Signaling Enhanced Reprogramming to Induced Pluripotent Stem Cells—A Novel Gateway of Cell Fate DecisionHANK CHEN, YUMAY CHEN, HSIN-BANG LEU, WU DENG, LESLIE LOCK, RYAN LIM, MATTHEW KAYALA, PIERRE BALDI, PETER DONOVAN, PING H. WANG, Irvine, CA
This project was to test a novel hypothesis that activation of Akt1 in mito-chondria plays a role in somatic cell reprogramming and stem cell differentia-tion. Generation of induced pluripotent stem cells (iPSC) via reprogramming is a promising path toward cell replacement therapy for diabetes. We have identifi ed mitochondria as a major location where Akt1 translocated into upon growth factor stimulation. A mitochondria-targeting constitutively ac-tive Akt1 (Ad-mito-Akt) was expressed in human embryonic stem cells (hESC) and up-regulated genes controlling stem cell stemness and pluripotency, and down-regulated genes promoting differentiation. To confi rm its role in hESC stemness, a mitochondria-targeting dominant negative Akt (mito-dnAkt) was introduced to hESC via a Tet-on lentiviral vector. Compared to the controls, mito-dnAkt induced rapid in vitro differentiation and embryoid body forma-tion, thus indicated a critical role in the regulation of hESC differentiation. To further verify its role in cell fate decision, we have studied the effi ciency of fi broblasts reprogramming to iPSC by the four factors (Sox2/Klf4/Oct4/c-Myc), with Ad-mito-Akt or Ad-GFP. Ad-mito-Akt signifi cantly increased the number of iPSC colonies and SSEA1/4-positive cells during reprogramming, whereas mito-dnAkt inhibited iPSC induction. Demethylation of Oct4 and Nanog pro-moter is a key regulatory step in reprogramming. Activation of mitochondrial Akt1 during reprogramming was associated with complete demethylation of Nanog and Oct4 prsomoter, similar to hESCs. Four factors alone, without mito-chondrial Akt1 activation, achieved only partial demethylation of Nanog and Oct4 promoters. The Ad-mito-Akt-iPSC lines are pluripotent and capable of de-veloping into pancreatic islet-like cells expressing insulin. Mitochondria Akt1 signaling presents a new opportunity to develop novel strategies to modulate somatic cell reprogramming and stem cell differentiation.
Supported by: Oxnard Foundation
98-ORHepatic mTORC2 Activates Glycolysis and Lipogenesis through Akt, Glucokinase and SREBP1cASAMI HAGIWARA, MARION CORNU, NADINE CYBULSKI, PAZIT POLAK, CHARLES BETZ, FRANCESCA TRAPANI, LUIGI TERRACCIANO, MARKUS H. HEIM, MARKUS A. RÜEGG, MICHAEL N. HALL, Basel, Switzerland
The liver plays a key role in insulin-mediated glucose and lipid homeo-stasis. Mammalian target of rapamycin complex 2 (mTORC2) is one of the key components of insulin signaling pathway as it phosphorylates hydro-phobic motif of Akt. To assess the role of hepatic mTORC2 in metabolism, we generated liver-specifi c rictor knockout (LiRiKO) mice. Fed LiRiKO mice displayed loss of Akt Ser473 phosphorylation in the liver, whereas phospho-rylation of Akt Thr308, a site in the catalytic loop phosphorylated by PDK1, was normal. The Akt substrates FoxO1 and GSK3 were hypophosphorylated, while phosphorylation status of S6K and S6, mTORC1 substrates that act as Akt downstream effectors, was normal. The aberrant Akt signaling in LiRiKO liver led to unsuppressed gluconeogenesis and reduced glycogen synthesis. Insulin-induced activation of glucokinase and SREBP1c was also impaired in LiRiKO liver, leading to reduced glycolysis and lipogenesis. These liver specifi c defects resulted in impaired systemic glucose homeostasis, as indicated by signifi cantly higher blood glucose and insulin levels in both fasted and fed states, and higher glucose area under the curve (AUC) after intraperitoneal glucose tolerance test (IPGTT). To investigate further the role of mTORC2-mediated Akt phosphorylation, we introduced phosphomimetic mutant Akt2 in which Ser474 (equivalent to Ser473 in Akt1) is substituted by aspartic acid (Akt2-S474D) in mTORC2 defi cient hepatocytes. Expression of Akt2-S474D restored insulin signaling pathway and suppressed defects in glucose uptake and lipogenesis in LiRiKO hepatocytes. In conclusion, mTORC2-mediated Akt phosphorylation is essential for hepatic glucose and lipid metabolism to control whole body metabolic homeostasis.

A28
For author disclosure information, see page 797. ADA-Funded Research
ORA
LSINSULIN ACTION IN ANIMALS
upregulated by RAR . Deletion analysis of FGF21 promoter showed that various lengths of FGF21 promoter from -2090 to -650 displayed a robust response to RA. Conversely, each of 5’-deletion FGF21 promoters from -600 to -70 abrogated the inducibility by RA. We functionally dissected FGF21 promoter and characterized that a putative RA responsible element (RARE) was primarily located between positions -650 and -600. Disruption of the RARE sequence abolished RA responsiveness in HepG2 cells. Importantly, chromatin immunoprecipitation assays revealed that hepatic RAR was recruited to the FGF21 promoter in a fasting inducible manner in vivo, subse-quently driving FGF21 transcription and increasing hepatic and plasma FGF21 levels in fasted mice. Induction of FGF21 by RAR promoted expression of key enzymes governing fatty acid oxidation and ketogenesis in the liver of fasted mice. These results unravel RAR as a novel component to control hepatic FGF21 in response to nutrient deprivation. Hepatic RAR -dependent activation of FGF21 provides a potential druggable target for the treatment of metabolic disorders.
Supported by: NIH/NIDDK RO1
104-ORLosartan Increases Muscle Insulin Delivery via Microvascular RecruitmentNASUI WANG, WEIDONG CHAI, LINA ZHAO, EUGENE J. BARRETT, ZHENQI LIU, Charlottesville, VA
To exert its biological actions on muscle cells, insulin fi rst has to be de-livered to the microvascular beds perfusing the muscle cells and then trans-verse the endothelial layer to reach the interstitium, two discrete steps that limit insulin action. We have previously reported that angiotensin II recep-tors modulate basal microvascular tone and insulin responses in muscle. While angiotensin II type 1 receptor (AT1R) blockade increases muscle microvascular recruitment, it is unclear whether AT1R blockade increases muscle insulin delivery. After an overnight fast, male SD rats received a bo-lus injection of losartan (AT1R blocker, 0.3 mg/kg, i.v.) ± infusion of L-NAME (NOS inhibitor). Additional rats received saline as control. Muscle microvas-cular blood volume (MBV), an index of microvascular surface area and perfu-sion, was measured using contrast-enhanced ultrasound before and 30 min after losartan injection. Muscle insulin delivery was quantifi ed at the end of the study using 125I-insulin as tracer. Losartan increased muscle MBV by ~ 2.5-fold (p<0.02) without affecting plasma insulin and glucose levels. This was associated with a signifi cant increase in muscle insulin delivery (20.5 ± 3.6 vs. 32.7 ± 3.8 fmol/g tissue, p=0.03). Simultaneous infusion of L-NAME abolished losartan-induced increase in MBV and brought muscle insulin de-livery back to the control level (19.3 ± 1.9 fmol/g). To assess whether AT1R modulates endothelial cell insulin uptake, bovine aortic endothelial cells were treated with vehicle or losartan (10 μM) for 15 min and 125I-insulin (200 pM) internalization was assessed. Losartan ± angiotensin II did not alter endothelial internalization of insulin (97 ± 11% of control, n=6). We conclude that the AT1R blockade increases insulin delivery to muscle mainly via micro-vascular recruitment without altering endothelial uptake of insulin. This may contribute to the clinical fi ndings of decreased cardiovascular events and new onset of diabetes in patients receiving AT1R blockers.
Supported by: NIH
105-ORTribbles 3 (TRB3) Mediates Endoplasmic Reticulum (ER) Stress-Induced Decreases in Insulin-Stimulated Glucose Uptake in Mouse Skeletal MuscleHO-JIN KOH, NICOLAS MUSI, MICHAEL F. HIRSHMAN, LAURIE J. GOODYEAR, Boston, MA, San Antonio, TX
Insulin stimulation of glucose uptake in peripheral tissues is critical for glucose homeostasis and people with type 2 diabetes have increased insulin resistance in skeletal muscle. ER stress has been linked to the development of insulin resistance in multiple tissues. Using C2C12 muscle cells, we found that ER stress induced by thapsigargin (THAP) and tunicamycin (TUNI) treat-ment increased TRB3 expression, and that knockdown of TRB3 reversed the effects of ER stress to inhibit insulin signaling (IRS1 Y612 and AKT T308) and glucose uptake. We next determined if ER stress causes insulin resistance via induction of TRB3 in adult skeletal muscle. Mice fed a high fat diet for 6 wks had a 1.9 fold increase in TRB3 protein expression in tibialis anterior (TA) muscle (p<0.05). Overexpression of TRB3 in mouse TA by electropora-tion (4 fold) decreased insulin-stimulated IRS1 Y612 phosphorylation by 22% (P<0.05) and tended to decrease Akt T308 phosphorylation (23%; P=0.12). In-cubation of extensor digitorum longus (EDL) muscles with THAP and TUNI signifi cantly increased TRB3 mRNA (3.6 to 4.0 fold; P<0.001) and protein ex-pression (10 fold; P<0.01). THAP and TUNI also resulted in insulin resistance
~4wk) HFD induce insulin resistance in skeletal muscle. Although physical inactivity is generally coincident with HFD in real world, combined effect of these factors has not been clarifi ed yet. To elucidate this combined ef-fect, C57BL6J mice were randomly assigned to four groups; control group, 24h HCI group, short-term (2wk) HFD group, 24h HCI after 2wk HFD group. Then, we evaluated insulin sensitivity (M-IS) and insulin signal transduction in plantaris muscle by ex-vivo insulin-stimulated 2-deoxy glucose uptake and Western blot analysis, respectively. The 24h HCI signifi cantly decreased M-IS by ~30%. Interestingly, although 2wk HFD did not change M-IS, 24h HCI after 2wk HFD dramatically decreased M-IS by ~70%. In parallel with impaired M-IS, we observed decreased insulin stimulated phosphorylation levels of insulin receptor (IR), IR substrate (IRS)-1 and Akt after 24h HCI, which were more exacerbated in HCI after HFD group, while only 2wk HFD did not change those phosphorylation states. According to this mechanism, it has been shown that protein tyrosine phosphatase 1B (PTP1B) impair insulin action by dephosphorylation of IR. Thus, we examined association between IR and PTP1B and found that the association was increased by HCI, which was more robust in HCI after HFD group. Finally, PTP1B inhibitor treatment normalized the association between IR and PTP1B and completely cancelled both impaired insulin signal transduction and decreased M-IS induced by HCI combined with/without HFD. These results suggested that physical in-activity and HFD synergically induce insulin resistance in skeletal muscle. In addition, impaired insulin stimulated IR phosphorylation by activated PTP1B is, at least in part, involved in this mechanism.
102-ORDe Novo Lipogenesis in Skeletal Muscle Promotes Insulin Resis-tanceKATSUHIKO FUNAI, LI YIN, TREY COLEMAN, HAOWEI SONG, IRFAN J. LODHI, CLAY F. SEMENKOVICH, St. Louis, MO
High fat diets and obesity are linked to insulin resistance and diabetes. En-dogenous fat production is not thought to be relevant to insulin resistance in muscle, a major site of glucose disposal. Unexpectedly, fatty acid synthase (FAS), necessary for de novo lipogenesis, was elevated in skeletal muscle from high fat diet (HFD)-fed mice. We generated FAS KnockOut in Skeletal muscle (FASKOS) mice to determine if de novo lipogenesis promotes skel-etal muscle insulin resistance. This intervention did not affect HFD-induced weight gain. Glucose/insulin tolerance testing, hyperinsulinemic euglycemic clamp studies, and measurements of insulin-stimulated glucose uptake in isolated skeletal muscles showed that FASKOS mice were protected from HFD-induced skeletal muscle insulin resistance. Insulin-stimulated Akt phosphorylation was not altered in FASKOS skeletal muscle. However, AMP-activated protein kinase (AMPK) activity and phosphorylation of Akt substrate of 160kD (AS160, a Rab GTPase-activating protein that regulates GLUT4 vesicular traffi cking) were increased in FASKOS skeletal muscle. In C2C12 myocytes, FAS knockdown also promoted AMPK activation and phos-phorylation of AS160. AMPK is known to be activated by Ca2+/calmodulin-dependent protein kinase kinase (CaMKK ), and knockdown of CaMKKeliminated the increase in AMPK activity induced by FAS knockdown. FAS knockdown also increased cytosolic calcium detected by a fl uorophore. Subcellular fractionation showed that fractions containing sarco/endoplas-mic reticulum (SR) are highly enriched in FAS. Mass spectrometry and co-immunoprecipitation experiments demonstrated an association between SR Ca2+-ATPase 1/2 (SERCA1/2) and FAS in skeletal muscle. These results suggest that the endogenous production of lipid by FAS in skeletal muscle modulates calcium fl ux to alter insulin-stimulated glucose transport through effects on CaMKK and AMPK.
103-ORTranscriptional Regulation of Fasting Inducible Hormone FGF21 by Retinoic Acid Receptor in the LiverYU LI, KIMBERLY WONG, AMBER GILES, MENGWEI ZANG, Boston, MA
All-trans retinoic acid (RA), a natural ligand of retinoic acid receptor (RAR) ameliorates glucose tolerance and hepatic steatosis in ob/ob mice. Fibro-blast growth factor 21 (FGF21) is the hepatocyte-derived hormone that plays a role in lipid homeostasis with benefi cial effects on diabetes. However, whether there is a potential link between RAR and FGF21 remain unknown. Here we defi ne the mechanism for RAR to stimulate FGF21 transcription during fasting. RAR activity was stimulated by RA in HepG2 hepatocytes, as determined by RARE-Luc reporter activity. Consequently, a FGF21 promoter-driven luciferase reporter and expression of FGF21 mRNA were increased by RA. FGF21 induction by RA was unaffected by selective RAR or antago-nists. RA-induced FGF21 expression was mimicked by RAR overexpression and diminished by RAR knockdown, suggesting that FGF21 is selectively

A29
For author disclosure information, see page 797.ADA-Funded Research
ORA
LS
SIGNALING IN THE ISLET
Rab-GAP domain. These data suggest that overexpression of AS160 sup-presses GLUT4 translocation consistent with AS160 functioning as a “brake”, while lack of AS160 may alter GLUT4 recycling and protein stability, leading to impaired insulin-stimulated glucose uptake in the heart. In conclusion, AS160 plays a key role in regulating glucose metabolism in the heart.
108-ORHistone Deacetylase Inhibition (HDACi), a Promising Approach to Enhance Energy Metabolism and Mitochondrial Function in Skel-etal MuscleVIDHI GAUR, SEAN MCGEE, KEN WALDER, Waurn Ponds, Australia
Impaired energy metabolism and mitochondrial function in skeletal muscle contributes to the pathogenesis of metabolic diseases such as type 2 diabe-tes. The class IIa histone deacetylases (HDACs) contribute to this response, by repressing metabolic genes in muscle (McGee et al., unpublished data). These enzymes induce chromatin remodelling through histone deacetyla-tion, which favours transcriptional silencing. Therefore, HDAC inhibitors (HDIs) could potentially be used to enhance skeletal muscle metabolism and mitochondrial function and could represent a novel therapeutic interven-tion for metabolic diseases. We have developed and screened novel class IIa specifi c HDIs analogues (MRU062, MRU059, MRU047, MRU066) along with commercially available broad spectrum HDIs (Scriptaid, TSA) for their effi cacy to regulate energy metabolism and mitochondrial function in vitro using the Seahorse bioanalyser. Initial analyses showed that all of these compounds, except MRU66, induced histone 3 acetylation. L6 myotubes were then treated with each HDI for 1 hour, twice per day, on day 4 and day 5 of differentiation. The mitochondrial function analyses on the follow-ing day demonstrated that MRU047 and MRU 059 signifi cantly improved maximal mitochondrial respiration whereas Scriptaid and MRU062 signifi -cantly increased basal (by ~17.6% and ~49.5% respectively) and maximal mitochondrial respiration (by ~23.4% and ~71% respectively), with MRU062 showing the maximum response (data are mean ± SEM, *p< 0.05, n=6-14). The increase in basal respiration was due to increased ATP turnover, but not uncoupled respiration. In contrast, TSA reduced the maximal respira-tion (p<0.05, n=6-7). These studies show that selective HDI(s) improve mito-chondrial function and muscle metabolism. We are currently examining the effi cacy of HDAC inhibition as a therapeutic strategy for metabolic diseases in vivo.
Supported by: Diabetes Australia Research Trust Viertel Award
SIGNALING IN THE ISLET
109-ORInsulin Signaling Regulates Insulin Processing and Modulates ER Stress in Pancreatic -CellsCHONG WEE LIEW, ANKE ASSMANN, KATHRYN L. LIPSON, SINDHU RAJAN, JI-ANG HU, IRIS LINDBERG, LOUIS H. PHILIPSON, ANDREW T. TEMPLIN, RAGHAV-ENDRA G. MIRMIRA, NAHUM SONENBERG, ALLISON B. GOLDFINE, FUMIHIKO URANO, ROHIT N. KULKARNI, Boston, MA, Worcester, MA, Chicago, IL, Baltimore, MD, Indianapolis, IN, Montreal, QC, Canada
Hyperproinsulinemia is among the early features observed in the patho-genesis of Type 2 Diabetes (T2D). The -cell is unique in its ability to process immature proinsulin into bioactive insulin using prohormone convertases PC1/3, PC2 and Carboxypeptidase E (CPE). Insuffi cient action of either of these enzymes leads to accumulation of unprocessed proinsulin. To explore the role of insulin action in proinsulin processing we examined mice lacking functional insulin receptors in -cells ( IRKO). IRKO mice, primary islets and
-cell lines exhibited increased circulating and cellular proinsulin content. This was associated with reduced (~60%) expression of CPE. Concomitantly, we observed that IRKO -cells exhibit dilated endoplasmic reticulum (ER) and concordant alterations in expression of unfolded protein response in-cluding phospho- and total IRE1 , BiP, spliced and total XBP1, suggesting compensation for the increased proinsulin biosynthesis. Reduced expression of CPE was due to a decrease in the biosynthesis of CPE protein and not due to alterations in transcripts or protein stability. Polyribosome profi le analysis from -cell treated with thapsigargin to mimic ER stress revealed a shift in CPE mRNA from polyribosomes to monoribosomes, indicating a block in translational initiation of the mRNA. Interestingly, we observed downregu-lation of the translational initiation scaffolding protein eIF4G1 in IRKO cells, which was confi rmed by acute knockdown of the insulin receptor in control
-cells. We provide evidence, for the fi rst time to our knowledge, for direct regulation by insulin signaling of the key proinsulin processing enzyme, CPE, via the scaffolding protein eIF4G1. Re-expression of the insulin receptor,
as determined by decreased insulin-stimulated glucose uptake (P<0.05). The THAP and TUNI-induced decrease in insulin-stimulated glucose uptake was prevented in EDL and soleus muscles from TRB3 knockout mice. Finally, vastus lateralis muscle biopsies from insulin resistant human subjects with obesity and type 2 diabetes had a 1.7 to 1.9 fold increase in TRB3 (p<0.01) accompanied by an increase in multiple ER stress markers (XBP1: 1.2-1.5 fold; CHOP: 1.2-1.4 fold; PERK: 2.6-3.0 fold; and Bip: 1.2-1.5 fold vs. lean subjects; p<0.05), raising the possibility that ER stress and TRB3 may be involved in muscle insulin resistance in humans. In conclusion, ER stress impairs insulin-stimulated glucose uptake through induction of TRB3 expression in mouse skeletal muscle.
106-ORMuscle-Infi ltrating Macrophages in Type 2 DiabetesLISBETH N. FINK, ANDREAS OBERBACH, THOMAS E. JENSEN, ANETTE SAMS, MATTHIAS BLÜHER, AMIRA KLIP, Gentofte, Denmark, Toronto, ON, Canada, Leipzig, Germany
Muscle insulin sensitivity is critical for optimal whole body metabolism as muscle is the major site of glucose disposal. Recent detection of mac-rophages in adipose tissue connects infl ammatory inputs to insulin resis-tance. We hypothesize that skeletal muscle may also be susceptible to im-mune cell infi ltration, and thus our aim was to explore whether immune cells are present in muscle of T2D humans and in mice fed a high fat diet (HFD). By isolating free cells from quadriceps muscle of C57Bl6 mice fed HFD, we observed a clear increase in the number of CD11c-positive pro-infl ammatory macrophages (48% increase by 1 week HFD, 77% by 10 weeks). A compa-rable increase in this macrophage subtype in mouse adipose tissue corre-lates with insulin resistance. In contrast to epididymal fat, T cell counts in muscle were low and unchanged by HFD. In muscle biopsies of humans, we measured by qRT-PCR the expression of genes characteristic of macrophage subsets, and quantifi ed infi ltrating CD68-positive macrophages by immu-nohistochemistry. CD11c expression was 2.5-fold higher in T2D compared to obese normo-glucotolerant individuals and correlated positively with HbA1c and negatively with glucose disposal rate measured by euglycemic-hyperinsulinemic clamps, whereas the anti-infl ammatory marker TGF cor-related negatively with HbA1c. The number of CD68-positive macrophages was 2X higher in T2D muscle, and CD11c-positive cells were also detected. With 1 year of exercise intervention, expression of two anti-infl ammatory macrophage markers (macrophage galactose binding lectin and mannose receptor) correlated strongly with glucose disposal rate. We conclude that, in addition to the disease risk associated with ‘infl amed fat’, there is a link between CD11c-positive macrophages in muscle and insulin resistance. Con-versely, anti-infl ammatory macrophages track with insulin sensitivity. The occurrence of macrophages in muscle may afford the opportunity to resolve muscle insulin resistance leading to T2D by locally targeting infl ammation.
107-ORAS160 Regulates Glucose Uptake in the HeartDING AN, TARO TOYOTA, KRISTEN HITCHCOX, MIN-YOUNG LEE, KRISTEN GETCHELL, LILI GUO, MICHAEL F. HIRSHMAN, SUSANNA KELLER, LAURIE J. GOODYEAR, Boston, MA, Charlottesville, VA
Maintaining glucose utilization is critical for normal cardiac function, yet the distal signaling mechanisms mediating myocardial glucose uptake are not known. Akt substrate of 160 kDa (AS160) is a Rab GTPase-activating pro-tein (GAP) that contains consensus Akt phosphorylation sites (PAS) and other phospho-sites including Ser711, an AMPK consensus sequence. In adipocytes and skeletal muscle, insulin causes AS160 PAS phosphorylation, inactivat-ing the GAP domain, resulting in GLUT4 translocation. There have been no studies of AS160 phosphorylation or function in the heart. Here we found that insulin stimulation in vivo increased AS160 phosphorylation at PAS and Ser711 sites in the heart, an effect partially inhibited in Akt2 knockout mice. Exercise and ischemia did not increase AS160 PAS phosphorylation, but did increase Ser711 phosphorylation; an effect fully inhibited in muscle-specifi c AMPK 2 inactive TG mice. To study AS160 function in vivo we used wild type and global AS160 knockout (KO) mice. Basal glucose uptake was not altered in KO hearts, while insulin-stimulated glucose uptake was com-pletely abolished. Insulin-stimulated IRSY612 and AktT308 phosphorylation were normal. Interestingly, KO hearts had a 60% decrease in GLUT4 protein with no change in GLUT4 mRNA. Immunostaining confi rmed the reduction in total GLUT4, which was due to depletion of the intracellular compartment. To study the effects of AS160 overexpression, HL-1 cardiomyocytes were transfected with wild type AS160 (70% increase vs control). AS160 over-expression had no effect on basal glucose uptake, but inhibited insulin and phenformin-induced glucose uptake, effects reversed by disruption of the

A30
For author disclosure information, see page 797. ADA-Funded Research
ORA
LSSIGNALING IN THE ISLET
112-ORA Complex Integration of Distinct -Cell Adaptation Phases over 12 Weeks of HFD in Normal MiceTHOMAS L. JETTON, DHANANJAY GUPTA, NAVJOT MONGA, KYLA LAROCK, JAMES LAUSIER, BASANTHI SATISH, MINA PESHAVARIA, JACK L. LEAHY, Colchester, VT
High energy fat-enriched diets in rodents are useful to study adaptive changes in -cell mass (BCM) and function in response to obesity and in-sulin resistance. However the mechanistic details and signaling pathways are poorly known, as is their relationship to impaired insulin sensitivity. We previously showed a key role for PPAR-g and its transcriptional regulation of pdx-1, pyruvate carboxylase (PC), and GIPR following a loss of BCM from a partial pancreatectomy (Px). We have now studied B6 mice fed on a HFD (60% fat) or control chow for 12 wks to identify -cell adaptive responses. Within 1 wk, HFD mice became glucose intolerant and mildly hyperinsuline-mic. However, insulin sensitivity was normal until 3-4 wks. At the same time, hyperinsulinemia that had been maintained at ~2-fold over the control diet mice rapidly rose to ~25-fold by 12 weeks. Also, the BCM was unchanged until 4 weeks, and then progressively doubled by non-proliferative mecha-nisms. We focused on the time point before insulin resistance (<3 weeks), and found hyperexpression of a gene profi le that was nearly identical to the pattern onserved post Px - ppar-g, mafa, pdx1, nkx6.1, PC, gipr, ins1/2.At 4 weeks, this surge was followed by increased levels of -cell activated CREB, Irs2 and cytoplasmic FoxO1, suggesting that enhanced growth and survival underlie the BCM increase. Another wave in gene expression oc-curred at 8 weeks with enhanced neuroD, ins1/2, and glp1r. In summary, the
-cell adaptive responses to fat feeding in normal mice are complex and multifaceted. Early on, before detectable insulin resistance, there was acti-vation of the ppar-g/Pdx-1 pro-differentiation pathway. By 4 weeks, insulin resistance was present in tandem with enhancements of BCM, survival, and function as refl ected in marked hyperinsulinemia. These data collectively point to a complex integration of distinct -cell responses that ensure the progressively increasing insulin demands are met in the context of nutrient overabundance and obesity.
113-ORDirect Transcriptional Regulation of the Histone Methytransferase Set7/9 Gene By Peroxisome Proliferator-Activated Receptor-Gam-ma (Ppar ) in Islet Beta CellsDHANANJAY GUPTA, THOMAS JETTON, MINA PESHAVARIA, JACK LEAHY, Colchester, VT
We previously reported PPAR signaling in islet -cells transcriptionally regulates the pro-differentiation gene pdx-1 and the incretin receptor GIPR during states of metabolic stress such as partial pancreatectomy (Px) or changes in insulin sensitivity. An islet enriched SET domain-containing his-tone methyltransferase Set7/9 promotes euchromatin modifi cations through methylation of the histone3-lysine-4 residue. Activation of PPAR signaling in -cells is reported to enhance Set7/9 expression, but the mechanism is unknown. We now have investigated the molecular mechanism of PPAR -mediated transcriptional regulation of Set7/9. Sequence analysis of the mouse Set7/9 promoter revealed a putative PPAR response element (PPRE) (-578 to -590 bp) that was conserved both in rat and human orthologue sequences. PPAR specifi c binding on the Set7/9 PPRE was confi rmed by electrophoretic mobility shift/super-shift and ChIP (chromatin immuno-pre-cipitation) assays. In INS-1 cells transfected with a Set7/9 promoter driven luciferase reporter construct, 48-hour stimulation with the PPAR agonist troglitazone (TZD, 10 μM) increased the reporter activity 2.0-fold (p<0.001) compared to vector alone-transfected INS-1 cells. A 72-hour TZD treatment of INS-1 cells and primary mouse islets resulted in a 2-fold (p<0.004; p<0.008 respectively) increase in Set7/9 protein levels. Also, in the normoglycemic model of -cell adaptation in rats (60% Px), 14-day post-Px islets had a 2.1-fold increase in Set7/9 protein levels compared to islets from sham-operated rats corresponding to the adaptive phase when islet PPAR , Pdx-1, and GIPR levels are upregulated (p< 0.0001). Combined together, our data provide evidence for a novel mechanism of direct transcriptional regulation of the Set7/9 gene by PPAR , plus that interaction may be an important element of the adaptive -cell transcriptional machinery to metabolic stresses.
knocking down proinsulin, or restoring the levels of CPE each independently reversed the phenotype. Together these data provide compelling evidence for a novel link between insulin signaling, translational initiation, insulin pro-cessing and ER stress in -cells.
110-ORLoss of Canonical Wnt Signaling in the Beta-Cell Results in De-creased Beta-Cell Insulin Content and Secretion Without Changes in Beta-Cell MassERICA V. GONZALEZ, RENUKA T. MENON, VIJAY YECHOOR, LAYLA ABU-SHAMAT, SUSAN L. SAMSON, Houston, TX
Genetic variations of transcription factor 7-like 2 (TCF7L2) are associ-ated with risk for T2D. TCF7L2 communicates signaling from the canonical Wnt pathway, working with co-factor beta-catenin (beta-cat) to alter gene expression. Wnt signaling has a role in neonatal beta-cell proliferation in rodents, but contributions in the adult are not established. We knocked out canonical Wnt signaling in beta-cells using a tamoxifen (Tam) inducible rat insulin promoter II driven Cre recombinase (Ins2Cre-ERT) to delete fl oxed beta-cat in adult C57BL/6J mice (8 weeks). The mice received a High Fat/High Sucrose diet to determine if beta-cat was necessary for beta-cell com-pensation if challenged with obesity and insulin resistance. We previously reported that this model displays marked impairment of glucose tolerance and insulin secretion, and here we have investigated the underlying mecha-nisms. After 20 weeks on diet, Tam+ mice have decreased pancreatic insulin content compared to control mice (Tam+ 252+68 vs Tam- 649+77 ng /mg protein, p=0.004, n=5 each group), but this was due to reduced islet insulin content (Tam+ 665+64 vs 1266 +22 ng/mcg nucleic acid, p=0.012) rather than reduced beta-cell mass. Also, there were no differences in islet expression of Wnt-regulated cell cycle genes (cyclin D1, D2, c-myc, cdk4). Islets from Tam+ mice had 79% (p=0.001) reduction in basal insulin secretion at 2.8 mM glucose, with a 52% reduction at 11 mM glucose (p=0.02). KCl stimulated insulin release also was reduced 48% (p=0.002) indicating there were less primed insulin granules without beta-cat. Expression of genes for insulin processing (prohormone convertases 1/3 and 2) and granule priming and exocytosis (ZnT8, Munc 18-1, Rab3A) were decreased. These results indicate that canonical Wnt signaling is required for compensation of the beta-cell for insulin resistance by regulating granule maturation and insulin secretion rather than beta-cell proliferation.
Supported by: Alkek Foundation, NIH (P30DK079638)
111-ORRole of Tcf7l2-Mediated Pathway in Pancreatic Beta Cell In VivoISEKI TAKAMOTO, NAOTO KUBOTA, KATSUYOSHI KUMAGAI, ATSUSHI OBATA, TETSUYA KUBOTA, KOHJIRO UEKI, TAKASHI KADOWAKI, Tokyo, Japan
Tcf7l2 was identifi ed as one of the major type 2 diabetes susceptibility genes, though the molecular mechanisms by which Tcf7l2 affect insulin se-cretion in vivo are still unclear. To elucidate the pathophysiological role of Tcf7l2-mediated pathway in vivo, we generated genetically engineered mice in which the function of Tcf7l2 was impaired in pancreatic beta cell. We con-structed an expression vector of murine dominant-negative form of Tcf7l2 (DNTcf) under the rat insulin promoter (RIP) and generated beta-cell specifi c DNTcf transgenic mice (RIP-DNTcf-Tg mice). 3 independent RIP-DNTcf-Tg mice lines were established, in the islets of which exogenous expression level of DNTcf showed more than 10-fold increase compared with endog-enous expression level of Tcf7l2. In all 3 lines, RIP-DNTcf-Tg mice and their littermate wild-type mice exhibited the same level of body weight. Though both mice showed similar degree of insulin resistance in insulin tolerance test, RIP-DNTcf-Tg mice developed overt diabetes with impaired insulin secretion in oral and intraperitoneal glucose tolerance test. Interestingly, exogenous administration of GLP1-agonist exendin-4 ameliorated intraperi-toneal glucose tolerance with improved insulin secretion in RIP-DNTcf-Tg mice, indicating that incretin effect was still preserved. Histological analysis of RIP-DNTcf-Tg mice revealed that beta-cell mass was markedly decreased with low BrdU incorporation rate, and total insulin content of the whole pancreas was also diminished. Consistently, quantitative RT-PCR analysis of isolated islets from RIP-DNTcf-Tg mice showed decreased gene expression of insulin 1, insulin 2, Cyclin D2 and MafA. Moreover, similar phenotypes of adult RIP-DNTcf-Tg mice described above were observed in the weaning age and neonatal state. Taken together, these fi ndings provide new evidence that Tcf7l2-mediated pathway in pancreatic beta cell plays a crucial role in glucose metabolism through regulation of beta-cell mass and total insulin amount in vivo.

A31
For author disclosure information, see page 797.ADA-Funded Research
ORA
LS
DIABETIC FOOT DISEASE—WHAT CONTRIBUTES TO HEALING?
Using Bonferroni analysis, we found 700 genes signifi cantly modulated by GLU vs. SAL, 20 modulated by IL vs. SAL, and 791 by GLU+IL vs. SAL. Gene set enrichment analysis showed that the most highly regulated pathways in GLU+IL vs. SAL were related to cell cycle and mitosis, consistent with the increase in beta-cell proliferation. Of these, many targets of the transcrip-tion factor FoxM1, including FoxM1 itself, were signifi cantly upregulated in the GLU+IL group. This was confi rmed by qRT-PCR analysis which showed increased expression of FoxM1 (3.32±0.35 fold vs. SAL, N=5, P<0.05) and its targets Polo-like kinase 1 (9.41±0.92 fold vs. SAL, N=5, P<0.01) and Aurora kinase B (24.68±1.80 fold vs. SAL, N=5, P<0.001). FoxM1 protein expression was also increased by 2.63 ± 0.03 fold in GLU+IL vs. SAL (N=4, P<0.01). We conclude that the FoxM1 pathway is implicated in beta-cell proliferation in response to nutrient excess in this model.
Supported by: NIH (R01-DK58096), Eli Lilly
DIABETIC FOOT DISEASE—WHAT CONTRIBUTES TO HEALING?
117-ORMesenchymal Stem Cells Improve Impaired Foot Ulcer Healing in Diabetic RatsJIRO KATO, HIDEKI KAMIYA, TATSUHITO HIMENO, TAIGA SHIBATA, TETSUJI OKAWA, MASAKI KONDO, ATSUSHI FUJIYA, YUSUKE SEINO, SHIN TSUNEKA-WA, YOJI HAMADA, KEIKO NARUSE, YUTAKA OISO, JIRO NAKAMURA, Nagoya, Japan
Aim: This study was conducted to evaluate the therapeutic effects of mesenchymal stem cells (MSCs) transplantation on the delayed foot ulcer healing under the diabetic condition using STZ-diabetic rats. Methods: 1) MSCs were isolated from bone marrow of 5-week old SD rats, and their characters were analyzed by FACS and RT-PCR. 2) Human keratinocytes (HKCs) were cultured in 6 mM (NG), 12 mM (HG) or 25 mM (HHG) glucose concentrations with or without MSC-conditioned media (MSC-CM) for 72 hrs. Cell viabilities were evaluated by MTS assay. The abilities of migration and cytokine production were evaluated by RT-PCR. 3) Diabetic foot ulcer model: diabetes was induced by intraperitoneal injection of STZ to 6-week old SD rats. After 8 weeks of diabetes, a full thickness 4mm diameter punch holes were created in the hind paw of normal (N) and diabetic rats (D). MSCs (1x10⁶) labeled with PKH were injected around the wounds. Wounds were photographed every other day. Wound tissues were excised and histologi-cal evaluations were performed. Results:1) MSCs were positive for CD29/ CD90 and negative for CD34/ CD45. mRNA expressions of VEGF, bFGF, NGF, EGF and KGF were detected. 2) HKC viabilities were signifi cantly impaired by HG or HHG, which was improved by MSC-CM. mRNA expression of MMP-2, MMP-9, EGF and IGF-1 were decreased by HG or HHG. And MSC-CM restored these HG-induced defi cits. 3) MSCs survived in dermal and subcutaneous tissues even 2 weeks after transplantation. The duration of wound heal-ing was signifi cantly prolonged in D (N: 15.8±2.5 days, D: 21.2±1.9), which was signifi cantly ameliorated by MSC transplantation (D+MSC: 18.3±2.1). Conclusion:These observations indicate that MSC transplantation would be useful for treatment of diabetic foot ulcer through improving impaired kera-tinocyte functions.
118-ORExpression of Cytokines and Growth Factors in Patients With Heal-ing versus Non Healing Foot WoundsSTEPHANIE C. WU, EYAYU BELAY, DANIEL PETERSON, Chicago, IL
The percent change in foot ulcer area after 4 weeks is typically used as a predictor of healing. Wound healing is regulated by a network of complex cellular signaling cascades involving numerous growth factors, cytokines, and chemokines, however, the level of growth factor and cytokine distribu-tion in healing versus non healing wounds are ill-defi ned. The purpose of this initial study was to assess the gene expression profi les of healing versus nonhealing foot ulcers Patients with chronic foot ulcers were recruited for the study. All wounds were cleansed prior to debridement, tissue specimens obtained, and the gene expression profi le of key factors involved in wound healing analyzed. Factors included Interleukin-1beta (IL-1 ), Interleukin-8 (IL-8), Tumor Necrosis Factor alpha (TNF- ), Vesicular Endothelial Growth Factor (VEGF) and Platelet Derived Growth Factor (PDGF). Wounds were fol-lowed on a weekly basis for twelve weeks to tract clinical healing. Chronic wounds have decreased expression levels of the cytokines and growth fac-tors. Wounds that did not heal in 12 weeks have a 10% lower expression level than wounds that healed over time. The expression level of TNF- ,IL-1 and IL-8 was up to 25% less in the nonhealing wounds (both diabetic
114-ORPAS Kinase Regulates PDX-1 Stability via GSK3 Beta in Pancreatic Beta-CellsMERIEM SEMACHE, GHISLAINE FONTÉS, SARAH FOGARTY, CHINTAN KIKANI, JARED RUTTER, VINCENT POITOUT, Montreal, QC, Canada, Salt Lake City, UT
PAS kinase (PASK) is a serine/threonine kinase implicated in the regu-lation of insulin gene expression via modulation of the transcription factor pancreas-duodenum homeobox-1 (PDX-1). However, the precise mechanisms by which PASK regulate PDX-1 expression and activity are unknown. The aim of this study was to test the hypothesis that PASK phosphorylates and thereby inactivates glycogen synthase kinase-3 beta (GSK3 ), to alleviate PDX-1 protein degradation. In beta-cells, GSK3 is known to phosphorylate PDX-1 on Ser residues at low glucose and trigger its proteasomal degrada-tion. First, in vitro we observed that PASK directly phosphorylates GSK3 on Ser9 (a known inactivating phosphorylation site of GSK3 ). Second, we ex-amined the effects of PASK on GSK3 and PDX-1 phosphorylation in isolated rat islets and HIT-T15 insulin secreting lines by adenoviral transduction or transient transfection, respectively, of a wild-type (WT) or kinase-dead (KD, acting as a dominant-negative) form of PASK. We observed that overexpres-sion of KD-PASK completely blocks the ability of glucose to phosphorylate GSK3 on Ser9. Third, WT-PASK mimics the effect of glucose in inhibiting PDX-1 serine phosphorylation, as assessed by immunoprecipitation. Fourth, overexpression of WT-PASK protects PDX-1 protein from degradation in the presence of cycloheximide. We conclude that in beta-cells PASK phosphory-lates and inactivates GSK3 , resulting in a decrease in PDX-1 serine phos-phorylation and stabilization of PDX-1 protein.
Supported by: NIH (R01 DK-58096), FRQS
115-ORMolecular Characterization of Store-Operated Ca2+ Infl ux in Pan-creatic Beta Cells: Role of Stim1COLIN A. LEECH, RICHARD KOPP, OLEG CHEPURNY, GEORGE G. HOLZ, MICHAEL W. ROE, Syracuse, NY
Store-operated Ca2+ entry (SOCE) is known to occur in pancreatic cells but the molecular basis, regulation and function of this current remain un-certain. Here we demonstrate that SOCE is activated following endoplas-mic reticulum (ER) Ca2+ store depletion by the ER Ca2+ sensor Stim1. ER Ca2+
stores in the MIN6 or INS-1 cell lines were depleted by bathing cells in Ca2+-free media containing carbachol and cyclopiazonic acid. Subsequent re-introduction of Ca2+ to the bathing solution produces a pronounced nife-dipine-insensitive rise of cytosolic [Ca2+] as a result of SOCE. Cells were then transfected with either a scrambled control or short hairpin RNA (shRNA). A robust SOCE remained in cells treated with scrambled control RNA but SOCE was substantially inhibited by treatment with shRNA targeted against Stim1. Transient knockdown of Stim1 using shRNA inhibited glucose-stim-ulated insulin secretion. Stable cell lines expressing scrambled control or shRNA were generated for studies using patch clamp whole cell recording (WCR). These studies revealed that the shRNA did not signifi cantly change voltage-dependent Ca2+ currents or Ca2+-induced exocytosis, determined by capacitance measurements. WCR using a Cs+ pipette solution containing 1 mM Mg2+ and 200 μM EGTA, to passively deplete ER stores, revealed an in-ward current in cells held at -60 mV that had a linear current-voltage relation and was tolbutamide-sensitive. This current was signifi cantly smaller in cells treated with shRNA against Stim1. Store depletion under these recording conditions was confi rmed in cells expressing an ER-targeted Ca2+ reporter. We propose that Stim1 acts as a sensor of the fi lling state of ER Ca2+ stores in cells and regulates SOCE. This current is likely to play a role in regu-lating cell excitability and cytosolic Ca2+ dynamics and therefore infl uences glucose-induced insulin secretion.
Supported by: NIH
116-ORThe FoxM1 Pathway is Implicated in Nutrient-Induced Beta-Cell Proliferation in RatsBADER ZARROUKI, GHISLAINE FONTÉS, ONDREJ SEDA, VINCENT POITOUT, Montreal, QC, Canada
A compensatory increase in beta-cell mass occurs in several physiological and pathophysiological situations, such as pregnancy, obesity and insulin resistance. We have previously observed that a 72-h infusion of glucose (GLU) + Intralipid (IL) in 6-mo-old rats causes insulin resistance and beta-cell dysfunction, despite a marked increase in beta-cell proliferation and mass. To further examine the effects of nutrient excess on islet function in vivo, 6-mo old rats were infused with saline (SAL), GLU, IL, or GLU+IL for 72h, and gene expression profi les were examined using Affymetrix GeneChip 1.0 ST.

A32
For author disclosure information, see page 797. ADA-Funded Research
ORA
LSHYPOGLYCEMIA AND THE BRAIN
121-ORPlasma Adiponectin, IL-6, hsCRP and TNF- Levels in Subject With Diabetic Foot and its Correlation With Clinical Variables in a North Indian Tertiary Care HospitalMOHAMMAD ZUBAIR, ABIDA MALIK, JAMAL AHMAD, Aligarh, India
Pro-and-anti-infl ammatory processes are crucial in different phases of wound healing and its disturbances interfere with tissue homeostasis after the manifestation of ulcers leading to chronic non-healing wounds. Howev-er, data on the association between infl ammation and acute foot syndrome are scarce. Circulating levels of acute-phase reactant and cytokines were measured in diabetic patients with an ulcer (n=162) and without ulcer (n=162) in a case-control study. Every subject with diabetic foot was matched for age, sex and BMI. Of the patients, 85.1% had type 2 diabetes. Subjects with diabetic foot ulcer showed lower median plasma level of adiponectin [8.4(7.1-9.2) vs 13.4(12.1-14.2)] ng/ml, higher median plasma levels of IL-6 [32.5(9.4-44.8) vs 6.7(4.6-14.6)] ng/ml, hsCRP [12.6(11.2-13.6) vs 8.4(7.1-9.2)] mg/ml and TNF- [99.4(79.9-121.5) vs 4.9(4.5-5.6)] ng/ml. A positive corre-lation was found between BMI and retinopathy for adiponectins, for IL-6, between grades of ulcer, BMI, LDL-C, triglycerides, retinopathy, nephropathy & smoking, for hsCRP: grades of ulcer, BMI, LDL-C, triglycerides, retinopathy, nephropathy & smoking, while total cholesterol and neuropathyfor TNF- .This study demonstrates that diabetic subjects with various grades of dia-betic foot ulcer showed a higher plasma IL-6, hsCRP, TNF- and lower adi-ponectin levels in comparison with diabetes without foot ulcer independent of the concomitant infections. It would be interesting to fi nd out whether an activation of immune system precedes the development of foot ulcer and whether anti-infl ammatory therapies will be effective in improving the out-come in such patients.
122-ORA Retrospective Analysis of Risk of Acute Kidney Injury among Peo-ple With Diabetic Foot Disease Undergoing Surgical InterventionsJUNAID IQBAL, ELAINE HIGGINS, ANDREW FISHER, JANE ASTLE, IRFAN AKHTAR, KHALID MAKDHOOMI, DEVAKA J. FERNANDO, Sutton in Ashfi eld, United Kingdom
Acute Kidney injury (AKI) is a signifi cant cause of in patient morbidity and mortality. Renal impairment is often associated with foot ulceration. Patients with diabetic foot disease are exposed to nephrotoxic antibiotics, radiological investigations involving potentially nephrotoxic contrast me-dia and surgical interventions. Hence they are at higher risk of developing AKI. We reviewed the medical records of 45 consecutive people (Mean age 68.1 SD 10.2 years, 30 males) with diabetes (HBa1c 8.1 SD 1.5%) admitted with diabetic foot problems to a district general hospital retrospectively during a six month period. The frequency of Chronic Kidney Disease (CKD) and progression to AKI if any, during their in patient stay was determined. 23 (51%) satisfi ed criteria for CKD on admission. 12 (26.7%) developed AKI during in patient stay. 10 (43.5%) of those with CKD developed AKI (Likeli-hood ratio 7.2, p= 0.007) compared to 2 (9.1%) in whom AKI developed de novo. 5 (41.7%) of those receiving contrast media, developed AKI compared to 7 (21.2%) of those who did not (Likelihood ratio 69.2, p = 0.001) while 11 (18.3%) of those undergoing surgery developed AKI compared to 8 (25%) of those who did not (Likelihood ratio 67.4, p=0.001). Those who did not receive surgery had a higher frequency of co morbidities and were hence deemed unsuitable for surgical treatment. Patients admitted with diabetic foot problems are at high risk of deteriorating renal function requiring inputs from specialist nephrologists. Service provision for this patient group should include early assessment of risk of AKI, access to renal care and acute renal support services.
HYPOGLYCEMIA AND THE BRAIN
123-ORHypothalamic GABA Drops in Response to Acute Hypoglycemia in Healthy HumansGULIN OZ, AMIR MOHEET, UZAY E. EMIR, MELISSA TERPSTRA, ANJALI KUMAR, LYNN E. EBERLY, ELIZABETH R. SEAQUIST, Minneapolis, MN
Hypothalamic GABA signaling has been shown to play an important role in regulating the counterregulatory response (CR) to hypoglycemia (HG) in ani-mal models. While a fall in hypothalamic GABA levels appears necessary for activation CR to HG in rodents, the role of GABA in regulating the CR to HG in humans is uncertain. Here we used ultra-high fi eld magnetic resonance spectroscopy (MRS) to determine if hypothalamic GABA levels decrease in response to hypoglycemia in healthy volunteers. Subjects underwent a
and non-diabetic) relative to levels of VEGF and PDGF. In the group of wounds that did not heal in 12 weeks, there was a 10 to 20 % decrease in all the cy-tokines and growth factor expression level in the diabetic wound compared to non-diabetic wound. There appeared to be no marked spatial variation of the expression level of these factors around the wound. Wound expression levels of cytokines and growth factors can affect the fate of an ulcer. Further research in this area may lead to individualized supplementation of wound healing factors to facilitate healing.
119-ORDepression and Not Specifi c Emotional Distress Predicts Diabetic Foot Ulcer IncidenceLORETTA VILEIKYTE, JEFFREY S. GONZALEZ, ANDREW J. BOULTON, Manchester, United Kingdom, Bronx, NY
Prior diabetic foot ulceration (DFU) does not increase risk for depression. However, depression is associated with increased DFU risk. We re-exam-ined these relationships substituting depression (Hospital and Anxiety De-pression Scale; HADS-D) with a measure of foot problem-Specifi c Emotional Distress (NeuroQoL-SED). Data from an 18-month prospective cohort study of 333 patients with diabetic peripheral neuropathy, DPN (71% male; age 62yrs; 73% type 2 diabetes; Neuropathy Disability Score 7.4) showed that those with prior DFU had signifi cantly (p < .001) greater NeuroQoL-SED (M = 2.70, SD = 1.19) at baseline than those without (M = 2.00, SD = 1.10). This difference persisted (p = .003) in multivariate regression models controlling for demographics, comorbidities, DPN-severity, symptoms and functional impairment, and was enhanced, rather than attenuated, when HADS-D was controlled for (p < .001). However, longitudinal multivariate models showed that NeuroQoL-SED did not predict DFU over time. Controlling for NeuroQoL-SED did not attenuate previously reported association between HADS-D and DFU risk. Item-level analyses showed HADS-D items assessing positive affect were not signifi cantly associated with DFU risk. Only ‘feeling slowed down’ (p = .030) and ‘losing interest in appearance’ (p = .003) were signifi -cantly associated with increased risk of DFU. Controlling for DPN-related DFU risk factors and subjective health ratings (general or DPN-specifi c) did not attenuate the relationship between HADS-D and DFU risk. These results suggest that while prior DFU is associated with increased specifi c emotional distress and not depression, it is depression, particularly negative affect, that is associated with increased risk for the development of new DFU over time. While the mechanism for this relationship is unclear, it does not appear to be accounted for by confounding with specifi c emotional distress or with objective or subjective indicators of poor health.
120-ORHigh Mortality Rates from Foot Complications in Diabetic Patients on DialysisAGBOR NDIP, ANAND VARDHAN, KAREN BREISLIN, ANDREW J. BOULTON, Manchester, United Kingdom
Diabetes is the commonest cause of end-stage renal disease (ESRD), re-quiring renal replacement therapy. Lower extremity complications in diabe-tes can result in signifi cant morbidity and mortality further compounding the poor survival of the dialysis population. A prospective observational study involving diabetic patients with ESRD on dialysis was undertaken to evalu-ate the impact of foot ulcers and amputations on mortality. We studied 192 diabetic patients receiving dialysis at the Manchester Royal Infi rmary, UK. These included 17 (8.9%) African-Caribbeans, 38 (19.8%) Indo-Asians and 137 (71.4%) White Europeans aged (mean ± SD) 59 ± 14 years, with a male/female ratio of 121/71. Comprehensive foot assessment was performed at baseline including evaluating for neuropathy, peripheral arterial disease, foot deformities, and foot ulcers/amputation. Patients were followed up for a two-year period. Overall mortality at the end of two years was high (102/192, 53.1%). Patients who had a foot ulcer at baseline (35/59, 59.3%) had a higher mortality after 2 years of follow-up, compared with patients without (55/133, 41.4%, p = 0.028). Similarly, patients who had had an ampu-tation at baseline had higher mortality at 2 years (26/35, 74.3%) compared to patients without amputation (64/157, 40.8%, p < 0.0001). These data high-light the excess mortality in dialysis-treated diabetic patients resulting from foot ulcers and amputations, therefore underpinning the importance of inte-grating foot care and amputation prevention within the dialysis population.
Supported by: Diabetes UK

A33
For author disclosure information, see page 797.ADA-Funded Research
ORA
LS
HYPOGLYCEMIA AND THE BRAIN
approximately 40% higher in control subjects compared to T1DM subjects (1.8±0.4 vs. 1.3±0.3 mmol/L; P=0.05), while plasma lactate fractional 13C enrichments were not different (26.2±4.0 vs. 31.6±6.7%; P=0.92). Despite the lower plasma lactate concentrations, brain lactate concentrations were approximately twofold higher in the T1DM subjects compared to the control subjects (2.0±0.9 mmol/L vs. 1.0±0.6 mmol/L; P=0.04). Taken together these data support the hypothesis that upregulation of the MCA transporter pro-motes increased brain lactate uptake in T1DM patients with hypoglycemic unawareness. During hypoglycemia brain lactate may serve as an important alternative fuel to support brain energetics and be responsible for hypogly-cemic unawareness in patients with T1DM.
Supported by: AICR10A847, NIHR24DK085638, R01AG034953, R01AG23686, R01DK49230, R01NS051854, HHM
126-OREnhanced Brain Alternate Fuel Metabolism Following Recurrent Antecedent Hypoglycemia and STZ DiabetesRAIMUND I. HERZOG, LIHONG JIANG, ROBERT S. SHERWIN, New Haven, CT
Intensive insulin therapy increases the risk of recurrent hypoglycemia. It blunts central counterregulatory responses to low blood glucose magnify-ing the risk of severe hypoglycemia and brain injury. Here we show in rats exposed to 3 days of recurrent hypoglycemia and others exposed to three weeks STZ-diabetes that brain energy substrate and neurotransmitter ho-meostasis undergo signifi cant changes favoring the uptake and oxidation of fuels other than glucose. Isotopically labeled [2 13C] acetate infused into separate groups of animals allowed characterization of key metabolic rates: Exposure to antecedent recurrent hypoglycemia led to differential changes of neuronal and glial glucose and acetate utilization. Comparing the relative contributions of acetate and glucose when going from eu- to hypoglycemia (CMRac/CMRgl), control animals showed a 12% decrease from baseline (p<0.06), whereas recurrently hypoglycemic rats revealed a 24% increase from baseline (p<0.006), indicating a higher relative contribution of acetate to brain metabolism in 3dRH animals under hypoglycemic conditions. We observed a similar trend in STZ diabetic animals during NMR spectroscopy at euglycemia, where the glial 13C-glutamine enrichment rate was sig-nifi cantly higher than in healthy control animals (Figure 1). In conclusion, a higher metabolic activity in STZ animals supports the concept that acetate as a metabolic substrate is more readily metabolized in the brain of diabetic animals than in controls and that alternate fuels could better support brain metabolism of diabetic and recurrently hypoglycemic animals.
Supported by: NIDDK (K08 to R.H.), NCRR/YCCI/CTSA (Kl2 to R.H.), JDRF, Yale DERC
2-step hyperinsulinemic (2.0 mU/kg/min) clamp in a 7 tesla scanner where blood glucose was fi rst maintained at 90 mg/dL by the IV infusion of dextrose, then allowed to drop to 50 mg/dL by the discontinuation of the dextrose infu-sion, and then maintained at the HG plateau by a variable dextrose infusion. GABA levels in the hypothalamus (voxel size 13 x 12 x 10 mm3) were mea-sured using short-echo single voxel spectroscopy (STEAM, TE=8ms, TR=5s) with a 16 channel transceiver array coil and B1 shimming. Concentrations were corrected for cerebrospinal fl uid in the voxel. Four subjects returned for a subsequent scanning session without IV infusions to assess the test-retest coeffi cient of variance (CV) of the measure. Eight subjects completed the hypoglycemia experiment (4F/4M, age 28.2± 4.5 yrs, BMI 22.5±2.5 kg/m2, mean ± SD). Hypothalamic GABA concentration signifi cantly decreased from mean 3.6 ± SD 0.4 to 3.1 ± 0.4 μmol/g (p = 0.02) as glucose fell from mean 89 ± SD 6 mg/dl at baseline to 61 ± 3 mg/dl within 10-20 minutes of stopping the glucose infusion. This 13% decrease in GABA was greater than the 9% CV determined for the GABA measurement in a subset of the subjects. Our experiments demonstrate that GABA concentration can be measured in the human hypothalamus and decrease signifi cantly in response to an abrupt fall in blood glucose. These experiments suggest that GABA signaling may be important in regulating the CR to HG in humans.
124-ORHypothalamic Glucosensing Neurons Display Blunted Electrical Response to Hypoglycemia After Recurrent Low Glucose Exposure and Antecedent KATP ActivationELIZABETH A. HAYTHORNE, CRAIG BEALL, D. LEE HAMILTON, MICHAEL L. ASH-FORD, RORY J. MCCRIMMON, Dundee, United Kingdom
Recurrent Hypoglycemia (RH) results in the attenuation of the Counter-regulatory Response (CRR) to subsequent hypoglycemic episodes in both humans and rodents. Hypothalamic Glucosensing (GS) neurons are thought to be involved in hypoglycemia detection and activation of the CRR. We have recently established that GT1-7 cells, a population of mouse hypothalamic GS neurons, display characteristic features of a GS system. The electrical activity of these cells is directly regulated by glucose metabolism, including glucokinase, AMPK and ATP-sensitive K+ channels (KATP). The aim of the current study was to determine whether the response to hypoglycemia of GS neurons is altered following RH, and whether this defect is driven by prior KATP activation. Patch-clamp electrophysiology was used to examine the electrical activity of GT1-7 cells after exposure to RH (3 hours of 0.1mM glucose for 3 days) or antecedent KATP opener NN414 (3 hours during the previous day) versus appropriate controls. Radiolabeled metabolic assays were used to investigate if any change occurred in glucose oxidation capac-ity or uptake kinetics. After exposing GT1-7 cells to RH, the magnitude of the Vm hyperpolarizing response to 0.5mM glucose was reduced by 66.7% compared to control ( VRH=4.9 ± 1.0mV vs. VCont=14.7 ± 0.9mV, p<0.0001; n = 7-10). Antecedent NN414 exposure (5μM) also produced a defect in the ability of the cells to hyperpolarize to 0.5mM glucose by 73.1% compared to control ( VNN414=3.8 ± 1.7mV vs. VCont=14.2 ± 1.4mV, p<0.01; n=6). Maximum KATP conductance and glucose uptake and oxidation were unaf-fected by RH and antecedent NN414 treatments. Thus exposure of GT1-7 cells to RH induces defective GS, which was mimicked by antecedent direct activation of KATP, independently of any change in glucose uptake or oxida-tion. This suggests that defective GS, following RH, may be dependent on prior KATP activation.
125-ORIncreased Brain Uptake of Lactate in Type 1 Diabetic Patients With Hypoglycemia UnawarenessHENK M. DE FEYTER, GERALD I. SHULMAN, DOUGLAS L. ROTHMAN, KITT F. PETERSEN, New Haven, CT
Previous studies have reported that brain metabolism of acetate is in-creased more than twofold in intensively treated type 1 diabetic (T1DM) subjects with hypoglycemia unawareness. These data support the hypoth-esis that upregulation of blood-brain barrier monocarboxylic acid (MCA) transport activity may contribute to the maintenance of brain energetics during hypoglycemia in T1DM patients with hypoglycemia unawareness. In contrast to acetate, which circulates in plasma at relatively low concentra-tions (~0.1 mM), plasma lactate concentrations are approximately tenfold higher making it a primary candidate as an alternative brain fuel during hypoglycemia. We therefore examined this hypothesis by measuring 13C label incorporation from infused [3-13C] lactate [10 μmol/(kg-min)] into brain lactate by 13C magnetic resonance spectroscopy in T1DM patients (n=5) with hypoglycemia unawareness and non-diabetic control subjects (n=6) during a hypoglycemic (~3 mM) clamp. Plasma lactate concentrations were
Figure 1: Representative brain glutamine (diamonds) and glutamate (squares) enrichment time courses from nourmal control (black symbols), recurrently hypoglycemic (white symbols) and STZ diabetic (blue and pink) animals.

A34
For author disclosure information, see page 797. ADA-Funded Research
ORA
LSHYPOGLYCEMIA AND THE BRAIN
129-ORThe AMP-Activated Protein Kinase (AMPK)-Uncoupling Protein 2 Pathway Controls Hypothalamic Glucosensing and Whole Body Glucose CounterregulationCRAIG BEALL, D. LEE HAMILTON, LISA LOGIE, FIONA ASHFORD, MARC P. SOU-TAR, JENNIFER GALLAGHER, XIAONING FAN, MICHAEL L. ASHFORD, SABRINA DIANO, RORY J. MCCRIMMON, Dundee, United Kingdom, New Haven, CT
Hypoglycemia is a limitation to intensive insulin therapy. Defi ning path-ways of hypoglycemia detection may expose therapeutic targets aimed at reducing hypoglycemia risk. AMPK plays an important role in hypoglycemia detection within the hypothalamus, an important glucosensing region of the brain, although the mechanism by which AMPK controls glucosensing remains largely unknown. We have previously reported that lentiviral knock-down of 2AMPK in hypothalamic glucose-excited GT1-7 cells reduces their glucose sensitivity, which was mimicked by the UCP2 inhibitor, genipin. We now show that knockdown of 1AMPK, despite representing >90% of total AMPK activity, does not alter the threshold for GT1-7 cell glucose sensing, whereas 2AMPK knockdown reduced the glucose threshold to lower than <0.25 mM glucose before we could observe signifi cant changes in membrane potential. 2AMPK knockdown also led to a signifi cant reduction in UCP2 mRNA. To further examine the role of UCP2, hyperinsulinemic-hypoglycemic clamp studies were performed in whole body UCP2 null mice. Loss of UCP2 signifi cantly increased the mean glucose-infusion rate, which was mediated by reduced glucagon and epinephrine responses to hypoglycaemia (Table 1). The putative link between AMPK and UCP2 appears to be important for the maintenance of glucosensing machinery at the cellular and whole body level.
Control UCP2-/-Mean GIR (mg/kg/min) 8.3±2.4 16.7±2.6*Glucagon (ng/l) 648.1±157 193.5±31*Epinephrine (pg/ml) 2128±233 636±74*
Supported by: JDRF, Diabetes UK, Anonymous Trust
130-ORSerotonergic Signaling in the Ventromedial Hypothalamus Modu-lates the Counterregulatory Response to HypoglycemiaOLEG OTLIVANCHIK, AMBROSE A. DUNN-MEYNELL, BARRY E. LEVIN, Newark, NJ, East Orange, NJ
Serotonin (5HT) selective reuptake inhibitors (SSRIs) enhance the counter-regulatory response (CRR) to insulin-induced hypoglycemia (IIH) and reverse the blunted CRR to recurrent hypoglycemia in rats and humans. To assess the role of hypothalamic 5HT activity in modulating the CRR to IIH in adult rats (n=12/group), we fi rst found that a single bout of IIH (30-40mg/dl over 2h after 4.5U/kg insulin, i.v.) increased 5HT turnover (5HIAA/5HT; IIH: 2.14±0.20 vs. saline: 1.69±0.11; p=0.05) selectively in the ventromedial, (VMH) but not in the dorsomedial, paraventricular or lateral hypothalamus. We then selectively depleted VMH 5HT by bilateral stereotaxic injection of 4 μg (in 1μL per side) 5,7-dihydroxytryptamine (57DHT) in desmethylimipramine (25 mg/kg, i.p) pre-treated rats (n=6-8/group). Across all rats, there were nega-tive correlations between: VMH 5HT and 60min epinephrine (Epi; r= -0.628; P=0.009), Epi 2h AUC (r= -0.744; P=0.002) and norepinephrine (NE) 2h AUC (r= -0.541; P=0.031). Compared to saline controls, rats with complete 57DHT VMH 5HT ablations, had increased baseline plasma glucose (104±2 vs. 118±4 mg/dL; p= 0.012), but similar glucose and corticosterone levels over 2h of IIH; increased 90 min plasma Epi (1313±195 vs. 2594±510 pg/μL; p= 0.041) and 2h AUC (181±17 vs. 276±21 ng/2h; p= 0.006); 60min (255±40 vs. 436±59 pg/μL; p= 0.030) and 90min (343±33 vs. 449±31 pg/μL; p= 0.043) plasma NE and 2h AUC (18.7±0.8 vs. 28.1±3.12 ng/2h; p= 0.017); baseline (66±4 vs. 84±4 pg/mL; p= 0.013) and 60min glucagon levels (112±13 vs. 228±38 pg/mL; p= 0.017). Therefore, a single bout of IIH selectively increases VMH 5HT turnover while selective depletion of VMH 5HT increases the Epi, NE, glucagon but not cor-ticosterone responses to IIH. This suggests that SSRI enhancement of the CRR is either not mediated by VMH 5HT or that systemic SSRI therapy may decrease VMH 5HT turnover and/or VMH 5HT receptor sensitivity.
Supported by: NIDDK DK53181; VA Research Svc
127-ORBrain Lactate Uptake During Acute Hypoglycemia in HumansYI SU, CARMEN S. DENCE, NADIA KHOURY, KRISHAN G. JETHI, PHILIP E. CRYER, ANA MARIA ARBELAEZ, St. Louis, MO
It appears that the human brain does not ordinarily utilize physiological concentrations of circulating alternative fuels aside from glucose effec-tively; nonetheless, some data suggest that hypoglycemia per se increases brain acetate transport in patients with diabetes. Thus, this study was un-dertaken to determine if there is an increase in blood-to-brain transport of lactate as an alternative brain metabolic fuel in humans during acute hy-poglycemia using a novel [3-11C]lactate PET method. We measured global blood-to-brain lactate transport using [3-11C]lactate PET in 5 healthy sub-jects. PET scans were performed during hyperinsulinemic euglycemic (~92 mg/dL) and hypoglycemic (~55 mg/dL) clamps. Dynamic PET acquisition started immediately after [3-11C]lactate injection. T1 weighted anatomical magnetic resonance (MR) data were acquired with 1 mm isotropic voxels, and time-of-fl ight (TOF) MR angiography (MRA) images were obtained with 0.3 mm in-plane resolution and 0.6 mm slice thickness. The PET data and the MR data were co-registered for quantitative analysis. Two approaches were taken to estimate the blood-to-brain lactate transport rate. In the fi rst ap-proach, area-under-curve ratio (AUCR) of tissue and blood time activity pro-fi les was calculated. In the second approach, a one-compartmental model was used to fi t the data and rate constant K1 was used as the measurement of blood-to-brain transfer rate. For both approaches, the fi rst 200 seconds of data were used to minimize the impact of tracer metabolism and deviation from a one-compartmental model. Hypoglycemia per se did not signifi cantly increase global lactate uptake (AUCR: 0.11±0.05 (Euglycemia) vs. 0.09±0.04 (Hypoglycemia), p=0.11; K1: 0.051±0.029 min-1 (Euglycemia) vs. 0.041±0.022 min-1 (Hypoglycemia), p=0.13). Better understanding of the central integra-tion of the hypoglycemic responses may provide insight into the problem of recurrent hypoglycemia in diabetes.
Supported by: Children’s Discov. Inst. 1KL2RR024994-01
128-ORHypothalamus Functional Connectivity is Altered in Type 1 DiabetesNICOLAS R. BOLO, GAIL MUSEN, LISA NICKERSON, RICHARD MCCARTNEY, PERRY F. RENSHAW, DONALD C. SIMONSON, ALAN M. JACOBSON, Boston, MA, Belmont, MA, Salt Lake City, UT, Mineola, NY
The hypothalamus is functionally connected to a network of brain regions. This functional connectivity (FC) may be altered by hypoglycemia. To exam-ine this question, we employed a novel, model-free approach to obtain indi-vidual maps of resting state networks (RSN) while subjects were exposed to gradually declining blood glucose levels. We used blood oxygen level dependent (BOLD) functional MRI (fMRI) during a hyperinsulinemic clamp to compare FC in type 1 diabetes patients (T1DM, n=16) and age-matched con-trols (n=10) while blood glucose declined from euglycemia (EU, 5.0 mmol/l, 5 min) to hypoglycemia (HY, 2.8 mmol/l) over 40 min. Independent component analysis (ICA) was applied to the 45-min time courses (TC) of all subjects’ fMRI data to obtain 30 maps of RSNs with temporally coherent BOLD sig-nals. The fi rst and last 10 min of individual TCs were extracted to defi ne EU and HY TCs. We fi rst computed subject/condition-specifi c TCs for each map by spatial regression. A second regression used these TCs to compute indi-vidual RSNs for each condition. We also computed between-network cor-relations. The initial ICA revealed 2 RSNs containing the hypothalamus and 7 other RSNs of interest, including several that have been associated with feeding behavior and obesity. During EU, a RSN connecting hypothalamus, brainstem, thalamus, caudate and insula showed increased FC with basal ganglia in T1DM vs. controls (p<0.05). During HY, controls increased FC in this RSN, with no change in FC for T1DM. There were widespread altera-tions of between-network FC from EU to HY in T1DM, but not in controls. The hypothalamus-related RSNs have not been reported previously, and may activate only during hypoglycemia. RSNs previously associated with intero-ception, insulin sensitivity and hunger showed larger changes in between-network connectivity in T1DM than controls during HY. These FC alterations in T1DM suggest that ICA may be a useful tool for understanding clinical conditions related to diabetes such as hypoglycemia unawareness.
Supported by: NIH (5R01-DK073843-03, DK-60754, DK-62218-01A1)

A35
For author disclosure information, see page 797.ADA-Funded Research
ORA
LS
CAN WE REIN IN THE COSTS OF DIABETES WITH BETTER DIABETES CARE?
Number of subjects
Number of test strips per patient
per year
Mean annual test strip cost
per patient
Test strips as proportion total diabetes-related
pharmacy costOverall 142,551 1094 CAD $860 41.6%Basal 45,003 935 CAD $740 33.7%Basal-bolus 38,553 1324 CAD $1056 41.5%Bolus only 43,470 1413 CAD $1112 52.8%Premix 15,525 890 CAD $678 41.4%
133-ORChronic Kidney Disease Progression and Associated Medical Costs in Type 2 DiabetesSUMA VUPPUTURI, TERESA M. KIMES, MICHAEL O. CALLOWAY, JENNIFER B. CHRISTIAN, DAVID BRUHN, ALAN A. MARTIN, GREGORY A. NICHOLS, Atlanta, GA, Portland, OR, Research Triangle Park, NC
Chronic kidney disease (CKD) is a common and costly complication of diabetes. We estimated the rate of progression to CKD and calculated as-sociated medical costs. We identifi ed 25,583 members of the Kaiser Perma-nente Northwest and Georgia regions who had type 2 diabetes and a serum creatinine measurement in 2005. We used estimated glomerular fi ltration rate (GFR) to assign patients to baseline stages of kidney function (stage 0/1, >90 ml/min/1.73m2, n=8,647; stage 2, 60-89, n=12,371; stage 3, 30-59, n=3,882; stage 4, 15-29, n=683). CKD was considered present at stage 3 or higher (GFR <60 on two occasions). We examined all subsequent GFRs through 2010 to assess progression of kidney disease. Inpatient, outpatient, pharmacy and total medical costs before and after progression to CKD were calculated and compared. Mean age of patients was 60 years, 51% men, and mean diabetes duration was 5.1 years. Patients in higher stages were older with longer diabetes duration and more likely to be women. At baseline, 17.9% of patients with T2D also had CKD. Of the 21,018 patients with stages 1 or 2 at baseline, 11.6% (n=2,439) subsequently progressed to CKD (stage 3 or greater) over mean follow-up of 4.5 years (incidence rate 26.0/1,000 person-years, 95% CI 24.3-27.8). Among patients who progressed to CKD (stage 3 or greater), annual total medical costs approximately doubled after progression compared to pre-progression costs, even when dialysis costs were not included. Progression to CKD drives substantial medical care costs. Interventions designed to minimize progressive kidney damage would re-duce the burden of CKD in type 2 diabetes.
Stages of Kidney Disease at Baseline and Over Mean Follow-up of 4.5 YearsFollow-upStage 0/1
Follow-upStage 2
Follow-upStage 3
Follow-upStage 4
Follow-upStage 5
Total
Baseline Stage 0/1 3,534 4,860 197 39 17 8,647(33.8%)
Baseline Stage 2 563 9,622 1,839 288 59 12,371(48.4%)
Baseline Stage 3 0 554 2,181 930 217 3,882(15.2%)
Baseline Stage 4 0 65 122 310 186 683(2.7%)
Total 4,097(16.0%)
15,101(59.0%)
4,339(17.0%)
1,567(6.1%
479(1.9%)
25,583
134-ORIntensive Glucose, Blood Pressure, or Lipid Control had No Sig-nifi cant Negative Impact on Health Utility or Quality-Adjusted Life Years in the ACCORD TrialPING ZHANG, LANEY LIGHT, PATRICK OCONNOR, DENNIS RAISCH, ALI MOHAM-MED, K.M. VENKAT NARAYAN, WENKE HWANG, ROGER ANDERSON, JOANN SPERL-HILLEN, ROBERT COHEN, LOIS KATZ, MARK SULLIVAN, Atlanta, GA, Win-ston-Salem, NC, Bloomington, MN, Albuquerque, NM, Hershey, PA, Minneapolis, MN, Cincinnati, OH, New York, NY, Seattle, WA
ACCORD study is a multicenter randomized trial to compare cardiovascu-lar disease (CVD) outcomes in 10,251 high-CVD risk participants with type 2 diabetes receiving intensive or standard glucose, blood pressure (BP), and lipid control strategies. Here we report the impact of the ACCORD interven-tions on health-related quality of life (HRQOL), measured by Health Utilities Index Mark 3(HUI-3) and the Feeling Thermometer (FT) and quality adjusted life years (QALY)s, calculated as the product of survival time and HUI or FT score. HUI-3 and FT were measured at the baseline and repeated at 12, 36, 48 month visit, and the end of the study. We analyzed the change in HUI-3 and
CAN WE REIN IN THE COSTS OF DIABETES WITH BETTER DIABETES CARE?
131-ORMedical Expenditures Associated With Diabetes: The Change in Last Two DecadesXIAOHUI ZHUO, PING ZHANG, KAI BULLARD, RUI LI, EDWARD GREGG, Atlanta, GA
Advances in anti-diabetic medications and medical technologies have sub-stantially changed the way diabetic patients are treated, but the impact of the changes on medical expenditures has not been well documented. Using 1987 National Medical Expenditure Survey (N=22538), and the Medical Ex-penditure Panel Survey in years 1997-98 (N=57652) and 2007-08(N=44815), we produced nationally representative estimates of the medical utilization and expenditures attributed to diabetes in persons age 90 years at 3 dif-ferent times. A two-part model was used to estimate medical expenditures and a zero-infl ated Poisson model was used to estimate the numbers of out-patient visits, hospital admissions, and prescription drugs taken for persons with and without self-reported diabetes. Excess expenditures and utiliza-tions due to diabetes were calculated as the incremental effects of having diabetes in the regressions. We also estimated excess medical expenditures for those with and without macrovascular complications. The total expen-diture declined from 1987 to 1998 and then remained near the 1998 level (table). From 1987 to 2008, the share of inpatient costs decreased due to reduced utilization. However, the share of prescription drugs substantially increased due to increased use of drugs per patient. Annual expenditure decreased by 29% in patients without macrovascular compliations but in-creased 13% in those with macrovascular complications.
Table, * : p <0.05, reference is year 1987. No difference was found between 2007-08 and 1997-98.Medical Expenditures (Year 2008 $) Year 1987 Year 1997-98 Year 2007-08Total 5692 4560* 4621*Inpatient 3967(70%) 1913*(42%) 1500*(32%)Outpatient 1023(18%) 901*(20%) 742*(16%)Prescription Drug 474(8%) 1391*(31%) 2121*(46%)Other 227(4%) 355* (8%) 258 (6%)Persons with no macrovascular complications
3856 2662* 2735*
Persons with macrovascular complications
7939 8334* 8986*
In conclusion, from 1987 to 2008, the medical expenditure attributed to diabetes among persons without macrovascular complications declined in the fi rst decade and changed little in the second decade.
132-ORSelf-Monitoring Blood Glucose Test Strip Utilization in CanadaJASON YEAW, TORSTEN E. CHRISTENSEN, DANIELLE GROLEAU, MICHAEL L. WOLDEN, WON C. LEE, Redwood City, CA, Søborg, Denmark, Mississauga, ON, Canada, Alexandria, VA
Self-monitoring blood glucose (SMBG) tests are a recommended part of diabetes management for patients on insulin therapy, in order to assess glycemic control and optimize treatment. However, little real-world infor-mation is currently available on the utilization and associated cost impact of SMBG use. The aim of this study was to investigate the annual utiliza-tion and per-patient cost of SMBG tests as a proportion of diabetes-related pharmacy costs in Canada. A retrospective cohort study was conducted us-ing the IMS Brogan Inc. drug plan database for the period of July 1 2006 to June 30 2010. The database contains patient-level medical claims data from private and public sources. A total of 142,551 patients with type 1 or type 2 diabetes who had at least two prescriptions of insulin (basal only, basal-bolus, bolus only or premix) were identifi ed. Overall mean utilization for blood-glucose strips across all patients, regardless of the type of insulin, was approximately 1094 strips per patient per year, with an average cost per strip of approximately CAD $0.79. SMBG testing constituted 41.6% of the total annual diabetes-related pharmacy costs (Table). The mean numbers of test strips (by regimen) per patient per year were: 935, basal only; 1324, basal-bolus; 890, premix; and 1413, bolus only. The proportion of diabetes-related pharmacy costs were: 33.7%, basal only; 41.5%, basal-bolus; 41.4%, premix; and 33.7%, bolus only. SMBG test strips account for more than 40% of the total diabetes-related pharmacy cost among patients with type 1 and insulin-treated type 2 diabetes in Canada.

A36
For author disclosure information, see page 797. ADA-Funded Research
ORA
LSCAN WE REIN IN THE COSTS OF DIABETES WITH BETTER DIABETES CARE?
predict the healthcare costs and benefi ts associated with diabetes manage-ment. The CDM was initialized to baseline characteristics consistent with ACCORD and predicted 5-year relative risks of cardiovascular morbidity and all cause mortality was compared to random effects meta-analysis of AC-CORD, ADVANCE and VADT. Results were extrapolated over a lifetime to obtain life and quality-adjusted life expectancy (QALE). Healthcare benefi ts were discounted at 3.5%. Five-year relative risk for non-fatal myocardial infarction (MI), non-fatal stroke, heart failure and all cause mortality were 0.76, 0.83, 0.93 and 0.94 for intensive versus conventional therapy respec-tively; all within 95% confi dence intervals of the meta analysis results. Lifetime relative risks were 0.90 (non-fatal MI), 0.88 (non-fatal stroke), 0.89 (heart failure) and 0.91 (diabetes specifi c mortality), favoring intensive glyce-mic control. Life expectancy was 11.49 and 11.13 years, QALE was 7.4 and 7.2 years in the intensive versus conventional arms respectively. The CDM rela-tive risk reductions associated with intensive glycemic control in high-risk type 2 diabetes patients were consistent with recent meta-analysis results. Long-term projections suggest that intensive therapy contributes to both increased life and quality-adjusted life expectancy in high cardiovascular risk patients.
137-ORImplications of Key Biomarkers Trends on Health Outcomes in Pa-tients With Type 2 Diabetes Mellitus (T2DM) in the U.S.MICHAEL WILLIS, CHERYL NESLUSAN, JIANMING HE, Lund, Sweden, Raritan, NJ
The objectives of this study were to examine trends in key biomarkers among patients with T2DM in the US since 2000 and to estimate their im-pact on the cumulative incidences (CIs) of micro- and macrovascular events and survival over a 10-year period. Data on HbA1c and Total Cholesterol to HDL ratio (TC/HDL) were obtained from IMS LifeLink™, a database of pri-vately insured patients with linked laboratory results. Data on BMI and systolic blood pressure (SBP) were taken from a recent publication that used the National Health and Nutrition Examination Survey (NHANES) over 2000 to 2008. To estimate the impact of these trends on future health out-comes, we utilized a validated micro-simulation model, the Economic and Health Outcomes in T2DM (ECHO-T2DM) model. In the Lifelink™ database, most of the improvement in HbA1c had occurred by 2005 (mean values were 8.1±1.6% in 2000, 7.1±1.5% in 2005, and 7.2±1.3% in 2010), while the mean TC/HDL ratio decreased (4.4 ±1.3 to 3.8 ±1.2) from 2000 to 2010. Mean BMI increased from 31.9±1.1 kg/m2 in 2000 to 33.4±0.51 kg/m2 in 2005, and de-creased to 32.0±0.51 kg/m2 in 2008. Mean values of SBP did not change over this period. Simulations indicated that had patients in 2000 been treated to the biomarker values observed in 2005, 4.4% more patients would have survived, and the rates of micro- and macrovascular disease would have been substantially lower over a 10 year period (e.g., the CIs of background diabetic retinopathy, microalbuminuria and myocardial infarction would have been respectively, 27%, 23% and 16% lower). The lower CIs of mac-rovascular events were primarily driven by trends in HbA1c and the TC/HDL ratio, whereas the lower CIs of microvascular events were largely driven by the trends in HbA1c alone. The improvements in biomarkers after 2005 were smaller, resulting in smaller predicted improvements in patient outcomes. These results suggest that although these trends have likely resulted in bet-ter health outcomes, further progress is needed.
Supported by: Janssen Global Services, LLC
138-ORThe Cost-Effectiveness of MODY Genetic TestingROCHELLE N. NAYLOR, PRIYA M. JOHN, AARON N. WINN, LOUIS H. PHILIPSON, SIRI ATMA W. GREELEY, GRAEME I. BELL, ELBERT S. HUANG, Chicago, IL, Boston, MA
Maturity-onset diabetes of the young (MODY) is caused by mutations in genes important to beta cell function. Mutations in HNF1A, HNF4A and GCK account for the majority of MODY cases and frequently allow for treat-ment with sulfonylureas (SU) (HNF1A, HNF4A) or no therapy (GCK). However, MODY diagnosis requires genetic testing, which is not routinely obtained. Assessing the economic value of routine genetic screening may inform pro-vider behavior and coverage decisions. The aim of this study was to evaluate the societal cost-effectiveness of a genetic testing policy for HNF1A, HNF4Aand GCK-MODY in individuals diagnosed with type 2 diabetes (T2D) between the ages of 20-50 years. We used a simulation model of T2D complications based on the UKPDS, and also accounted for the natural history of disease by genetic subtype, to compare a screening policy of genetic testing at diag-nosis versus a policy of no testing. Under the screening policy we assumed 75% of patients with HNF1A or 4A-MODY would transition to SU therapy with a resultant glycemic benefi t of 0.8% and that all patients with GCK-
FT measures as a function of follow-up time, and of which glucose, BP, and lipid treatment strategies the patient was randomly assigned to. Tests of signifi cance were done using general linear models for repeated measures. Differences in QALYs by treatment strategy were assessed using analysis of variance model. During a mean follow up of 5 years (range 3.4 to 8.5 years), no difference could be detected between groups in HUI and FT scores at the baseline and the end of the study (P values for testing all group differ-ence were greater than 0.10). No signifi cant difference was detected in total QALYs calculated using either HUI-3 scores or FT scores (P values for testing all group difference were greater than 0.20). These results indicate that in-tensive glucose, BP, and lipid control as implemented in the ACCORD trial in subjects with established type 2 diabetes did not signifi cantly alter patient-reported measures of health utility or QALYs. While, no adverse effect of intensive glucose, BP, or lipid control were observed on measures of HRQOL or QALYs in the ACCORD Trial , the resources needed for implementing the interventions in relation to benefi ts as measured by other clinical outcomes should be taken into consideration for policy formulation.
Supported by: NIH, CDC
135-ORHealth-Related Quality of Life Associated With Daytime and Noc-turnal Hypoglycemic Events: a Time Trade-Off SurveyMARC EVANS, KAMLESH KHUNTI, MUHAMMAD MAMDANI, STEWART HAR-RIS, CLAUS GALBO-JØRGENSEN, JENS GUNDGAARD, METTE BØGELUND, Car-diff, United Kingdom, Leicester, United Kingdom, Toronto, ON, Canada, London, ON, Canada, Holte, Denmark, Søborg, Denmark
Hypoglycemic events (hypos) can affect health-related quality of life (HRQoL) via acute symptoms, altered behavior and fear of future hypos. Nocturnal hypos, in particular, are unpredictable and diffi cult to avoid, and may affect HRQoL more than daytime hypos. We examined if HRQoL differs between daytime and nocturnal, severe and non-severe hypos, using time trade-off (TTO) methods. HRQoL was quantifi ed via an online TTO survey with 10,087 respondents from the general population in the UK, USA, Cana-da, Germany and Sweden. Descriptions of hypo health states were derived from a survey of 247 UK patients with diabetes. HRQoL was measured on a utility scale: 0 (dead), 1 (perfect health). Respondents traded-off length of life for improving health states and evaluated health states of well-controlled diabetes and diabetes with non-severe/severe and daytime/noc-turnal hypos. Table 1 shows the results. Non-severe nocturnal hypos were associated with 0.0026 (95% CI: 0.0016; 0.0034) higher disutility compared with non-severe daytime hypos (equivalent to a 63.4% increase in nega-tive impact); severe nocturnal hypos were associated with 0.0057 (95% CI: -0.0001; 0.0114) higher disutility compared with severe daytime hypos (not statistically signifi cant). The study estimates the disutility associated with diabetes, uniquely illustrating the detrimental effect of hypos on HRQoL and in particular demonstrating the adverse effect of nocturnal hypos on HRQoL compared with daytime hypos. These results highlight the clinical impera-tive of avoiding hypos, particularly nocturnal hypos.
Table 1 Utility estimates from the time trade-off surveyType of hypoglycemia n Average
utilityStandard
error95% CI Lower
95% CI Upper
Diabetes with no hypoglycemia 7642 0.8440 0.0022 0.8395 0.8484Non-severe daytime event 7435 -0.0041 0.0003 -0.0035 -0.0047Non-severe nocturnal event 7347 -0.0067 0.0004 -0.0059 -0.0074Severe daytime event 3603 -0.0565 0.0021 -0.0527 -0.0606Severe nocturnal event 3647 -0.0622 0.0021 -0.0582 -0.0663
136-ORValidation and Evaluation of the Risk-To-Benefi t Ratio of Glucose Lowering Therapies in High Cardiovascular Risk Type 2 Diabetes Patients; Projections using the IMS CORE Diabetes ModelVOLKER FOOS, NICK FREEMANTLE, JAMES PALMER, DAVID GRANT, ADAM LLOYD, MARC EVANS, PHIL MCEWAN, Basel, Switzerland, London, United King-dom, Cardiff, United Kingdom, Swansea, United Kingdom
Meta-analyses of recent outcomes trials in type 2 diabetes (T2DM) have demonstrated an overall reduction in coronary events without increased risk of mortality. The aim of this study is to demonstrate the predictive validity of a diabetes simulation model to 5-year meta-analyzed trial data and assess the long term expected outcomes of intensive versus conventional glycemic control in high cardiovascular risk T2DM patients. The IMS CORE Diabetes Model (CDM) is a validated and widely used simulation model designed to

A37
For author disclosure information, see page 797.ADA-Funded Research
ORA
LS
APPLICATIONS OF HIGH-THROUGHPUT SEQUENCING
now make it possible to carry out whole genome sequencing on a scale large enough to enable complex disease gene discovery. As part of the T2D-GENES Consortium, we aim to identify causal variants infl uencing type 2 diabetes risks and related traits. We examined richly phenotyped individuals from 20 Mexican American pedigrees from San Antonio with a high prevalence (30%) of diabetes. Our current data includes 483 sequenced by Complete Ge-nomics (CGI) at average 60x coverage. Sequenced samples were optimally selected to provide for highly accurate family-based imputation. We used a novel multi-sample SNP fi ltering pipeline to collect quality measures across all samples, and applied support vector machine classifi ers to fi lter out low quality SNPs. Modifi ed MACH software was used to fully impute complete WGS data to all 959 individuals. We identifi ed a total of 26.8M SNPs in 483 individuals. Quality control eliminated in 17 outlier individuals and a cleaned set of 24M SNPs. >69% of the quality controlled SNPs are not in dbSNP 129, and the overall transition to transversion ratio (Ti/Tv) is 2.18, while SNPs in dbSNP has Ti/Tv=2.19. >51% have minor allele frequency <1%. We discov-ered 37 non-synonymous SNPs affecting known MODY genes, including an HNF1B/G370S transition (MODY5) transmitted in one parent child pair. Of particular relevance for diabetes, we provide, for the fi rst time in this impor-tant ethnic group, exhaustive frequency spectra for all major positional can-didate genes previously supported for infl uencing type 2 diabetes risk. As expected, these genes show large amounts of rare variation, much of which is privately limited to specifi c lineages. The identifi cation of likely functional regulatory variants in these well-established diabetes-related genes will aid our quest for understanding the causal state space of inherited risk.
141-ORWhole Genome Sequencing to Discover Type 2 Diabetes Risk Genes in Mexican American Pedigrees: T2D-GENES Consortium Project 2MARCIO ALMEIDA, GOO JUN, TANYA M. TESLOVICH, ANDREW R. WOOD, TIMO-THY M. FRAYLING, CHRISTIAN FUCHSBERGER, PABLO CINGOLANI, THOMAS W. BLACKWELL, THOMAS D. DYER, JOANNE CURRAN, DONNA M. LEHMAN, ROB-ERT SLADEK, JASON GRUNSTAD, ROBERT GROSSMAN, JASON M. LARAMIE, STEPHEN E. LINCOLN, MARK MCCARTHY, MICHAEL BOEHNKE, RAVINDRANATH DUGGIRALA, GONCALO ABECASIS, JOHN BLANGERO, T2D-GENES CONSOR-TIUM, San Antonio, TX, Ann Arbor, MI, Exeter, United Kingdom, Montreal, QC, Canada, Chicago, IL, Mountain View, CA, Oxford, United Kingdom
The T2D-GENES Consortium is a collaborative international effort to iden-tify genes involved in type 2 diabetes risk in multiple ethnic groups using next generation sequencing. In the T2D-GENES Project 2, deep coverage (60x) whole genome sequencing has been performed by Complete Genomics on 483 individuals from 20 large Mexican American pedigrees from San An-tonio. Family-based imputation based on a high density GWAS SNP frame-work provided comprehensive WGS data on 959 individuals with known diabetes status in these pedigrees. We observed ~12M variants (many previously undiscovered) that have passed quality control and frequency fi ltering. Initial analyses focused on a variety of rational prior hypotheses based on QTL information from existing linkage and GWA studies, potential functional consequences of coding or regulatory variants, and evolutionary conservation or selective constraint information. Association analysis was performed using a variance component-based approach as implemented in SOLAR allowing for residual correlation amongst relatives under a classical threshold normal probit model. Several existing linkage-derived QTL regions observed in Mexican American families yielded associations with novel variants. These included rare variants in the NCAPD3 gene (p=1 ×10⁻⁸) on chromosome 11 and in the DMRT3 gene (p=1×10⁻⁷) on chromosome 9. Simi-larly, examination of comprehensive sequence variation in/near the TCF7L2gene (a well-replicated type 2 diabetes risk region) identifi ed an associated novel intragenic rare variant (p= 9×10⁻⁵). Our preliminary results already sug-gest that the chance accumulation of rare, even private, variants in large pedigrees permits variant-specifi c statistical inference on a whole genome sequence scale. These rare variants of moderate to large effect may lead to more rapid causal gene identifi cation.
142-ORWhole-Exome Sequencing of Overweight Individuals With and Without Type 2 DiabetesMARGARIDA C. LOPES, OVERWEIGHT DIABETES EXOME STUDY, Hinxton, United Kingdom
To identify low frequency and rare exonic variants associated with the ill effects of excess weight, we performed whole-exome sequencing of 416 overweight individuals, 221 of whom had type 2 diabetes (T2D) and 195 were normoglycaemic. Subjects were drawn from the CoLaus population-based Swiss cohort of ~6,000 individuals with genome-wide single nucleotide vari-
MODY would discontinue therapy. We estimated a 2% prevalence of MODY in the screened population with genetic testing costs of $2000 per individual screened. Outcomes included costs and quality-adjusted life years (QALYs), based on lifetime risk of complications and treatments, expressed as the incremental cost-effectiveness ratio (ICER, $/QALY). The testing policy yielded an average lifetime gain of 0.02 QALYs. The base case resulted in an ICER of $91,389/QALY. In sensitivity analysis the testing policy became cost-savings if screening was done in a more limited population where the expected prevalence of MODY was 8%. Reducing genetic testing costs in the base case to $500 would also make the screening policy cost-savings. In the United States context, routine screening for MODY subtypes in incident cases of T2D is a cost-effective use of personalized genetic medicine, and may be seen as a compelling argument for routine coverage of genetic test-ing in diabetes.
APPLICATIONS OF HIGH-THROUGHPUT SEQUENCING
139-ORSearch for Novel Type 2 Diabetes Susceptibility Loci Using Genome-Wide Association Studies Imputed From a 1000 Genomes Reference PanelINGA PROKOPENKO, CLEMENT MA, REEDIK MÄGI, HAN CHEN, BENJAMIN F. VOIGHT, LU QI, NATALIE VAN ZUYDAM, HARALD GRALLERT, LOIC YENGO, CHRISTIAN DINA, GUDMAR THORLEIFSSON, CHRISTIAN FUCSHBERGER, LIM-ING LIANG, MARTINA MUELLER-NURASYID, SARA M. WILLEMS, LINDA KAO, PAU NAVARRO, VALGERDUR STEINTHORSDOTTIR, CORNELIA M. VAN DUIJN, MICHAEL BOEHNKE, JOSÉE DUPUIS, MARK I. MCCARTHY, LAURA J. SCOTT, ON BEHALF OF DIAGRAM+ CONSORTIUM, Oxford, United Kingdom, Ann Arbor, MI, Tartu, Estonia, Boston, MA, Philadelphia, PA, Dundee, United Kingdom, Neuher-berg, Germany, Lille, France, Nantes, France, Reykjavik, Iceland, Rotterdam, The Netherlands, Baltimore, MD, Edinburgh, United Kingdom
To date more than 50 common variant associations have been described for type 2 diabetes (T2D); however these account for <10% of inherited susceptibility. Most T2D-associated variants have minor allele frequency (MAF) >10%. Our goal was to identify causal variants at known T2D loci and to uncover novel sites by performing imputation from a large refer-ence panel generated by genome resequencing. We imputed SNP variants using the 1000 Genomes European reference panel (566 CEU haplotypes, December/2010 release) within each of 12 European descent cohorts with genome-wide association (GWA) data. Following T2D association analysis, we performed a fi xed-effects inverse variance meta-analysis for 14,890 indi-viduals with T2D and 62,932 controls. 7.9M SNPs were present in at least 4 studies; 2.4M of these SNPs had MAF<0.05. We observed genome-wide sig-nifi cant (p-value<5x10⁻⁸) associations at 17 and suggestive (p-value<1x10⁻⁵)associations at 16 more known T2D loci. Within 3 of these loci (TCF7L2,CDKN2A/2B and CDKAL1), we identifi ed common variants (rs35198068, rs7451008, rs10965246, respectively) which on imputation demonstrated more signifi cant association than previously detected variants. In TCF7L2, we also observed association (OR=1.6[1.4-1.7], p-value=6x10-16) at a low frequency (rs116369954; MAF=0.03) variant, 35kb from the known signal (p-value=5x10-76): conditional tests of independence are in process. We observed novel association at a common variant near VPS13C (rs12437560, OR=1.11[1.07-1.16], p-value=2x10⁻⁸) not well-tagged in previous imputations, and suggestive associations at/near ATXN7L1 (p-value=2x10⁻⁷) and LRCH1 (p-value=3x10⁻⁷). Imputation with the current 1000 Genomes reference panel has not revealed novel association signals driven by low MAF variants. How-ever, imputation for many low-MAF variants remains suboptimal given the size of the current reference panel and the density of much existing GWAs data.
140-ORDetecting Functional Rare Variants Relating to Type 2 Diabetes Using Deep Whole Genome SequencingGOO JUN, MARCIO ALMEIDA, PABLO CINGOLANI, ANDREW R. WOOD, CHRIS-TIAN FUCHSBERGER, TANYA M. TESLOVICH, THOMAS D. DYER, JOANNE CUR-RAN, JASON GRUNSTAD, THOMAS W. BLACKWELL, DONNA M. LEHMAN, ROB-ERT GROSSMAN, STEPHEN E. LINCOLN, JASON LARAMIE, MICHAEL BOEHNKE, MARK MCCARTHY, TIMOTHY M. FRAYLING, ROBERT SLADEK, RAVINDRANATH DUGGIRALA, JOHN BLANGERO, GONCALO ABECASIS, T2D-GENES CONSOR-TIUM, Ann Arbor, MI, San Antonio, TX, Montreal, QC, Canada, Exeter, United King-dom, Chicago, IL, Mountain View, CA, Oxford, United Kingdom
The contribution of low frequency, rare, and private genomic variants to type 2 diabetes risk is unknown. Recent advances in sequencing technology

A38
For author disclosure information, see page 797. ADA-Funded Research
ORA
LSAPPLICATIONS OF HIGH-THROUGHPUT SEQUENCING
and 12p11-q22 and the LOD scores were 1.80. To identify the susceptibil-ity mutation, we used the Agilent SureSelect Human All Exon 50Mb Kit to enrich all exons from the genomic DNA of an affected family member. We sequenced the DNA using an Illumina Genome Analyzer IIx sequencer. We aligned the sequence reads to the hg19 human genome data. We predicted the familial clustering of diabetes is caused by a rare non-synonymous vari-ant, and therefore we focused our analysis on non-synonymous variants absent in the dbSNP131. In the linkage regions exome sequencing identifi ed 10 such variants. Seven of them were concordant with the affection status in the family. We genotyped 105 normal subjects and 67 diabetes subjects for the 7 variants. The only variant that was signifi cantly more frequent in the diabetes subjects than in the normal subjects was the E1072K variant of EEA1 gene (0 in the normal subjects, 4 in the diabetes subjects, p=0.022). We propose that the E1072K variant of EEA1 gene is a susceptibility mutation in Japanese population. Although further study is required to evaluate the bio-logical function of the mutation, family-based linkage analysis with exome sequencing may be a promising strategy to elucidate the complex genetic background of type 2 diabetes.
145-ORAnalysis of Coding Variants from Exome Sequencing in Diabetic Nephropathy (DN) Genes in African AmericansJESSICA N. COOKE, PAMELA J. HICKS, NICHOLETTE D. PALMER, MAGGIE C. NG, JESSICA M. HESTER, LIJUN MA, CARL D. LANGEFELD, BARRY I. FREEDMAN, DONALD W. BOWDEN, Winston-Salem, NC
Type 2 diabetes (T2D) and T2D-associated end-stage renal disease (T2D-ESRD) disproportionately affect African Americans (AAs). While prior stud-ies have identifi ed common variants, rare coding variants likely contribute additional risk in complex diseases such as T2D-ESRD. We identifi ed 55 non-synonymous coding SNPs in 23 genes with prior evidence of association with nephropathy or ESRD in the NHLBI Exome Sequencing Project ESP_GO database. These variants were genotyped in 1024 AA T2D-ESRD cases and 1104 non-T2D-ESRD controls. Fourteen SNPs were trending (P<0.1) or associ-ated (P<0.05) with disease in a model adjusting for African ancestry. These 14 SNPs were genotyped in a replication set of 786 AA T2D-ESRD cases and 1331 non-T2D-ESRD controls. In joint analysis of all samples, 7 were associated (P<0.05) with T2D-ESRD. The most strongly associated SNPs were in ACACB (acetyl-CoA carboxylase beta; rs113576948, P=5.9x10⁻³, OR=2.6 [1.3-5.1]), AGER (advanced glycosylation end product-specifi c recep-tor; rs77170610, P=1.6x10⁻³, OR=0.67 [0.52-0.86]), APOL2 (apolipoprotein 2; rs7285167, 8.6x10⁻⁵, OR=1.2 [1.1-1.3]), APOL3 (apolipoprotein 3; rs116147257, 3.1x10⁻³, OR=0.72 [0.58-0.90]), and C6orf167 (rs9481410, 7.6x10⁻³, OR=0.89 [0.81-0.97]) (all additive model). When the 14 SNPs were tested condition-ing on the APOL1 G1 and G2 non-T2D ESRD risk variants, association of 5 SNPs was strengthened (rs116147257 in APOL3, rs9492393 in C6orf191, rs4925583 and rs4478844 in OR2L13, and rs34585936 in UNC5C) while as-sociation of3 SNPs weakened but retained signifi cance (P<0.05) (rs77170610 in AGER, rs9481410 in C6orf167, and rs113576948 in ACACB). These results suggest some infl uence from non-T2D ESRD variants. Thus, studies of coding variants complement and extend common variant analyses although odds ratios are not striking and recessive models, a likely model for rare variants, are diffi cult to test.
Supported by: NIH (DK66358)
146-ORmRNA-seq of the Mouse Pancreatic Beta Cell Reveals a Large Class of Long Intergenic Non-Coding RNAsGREGORY M. KU, HAIL KIM, IAN VAUGHN, MATTHEW HANGAUER, MICHAEL S. GERMAN, MICHAEL T. MCMANUS, San Francisco, CA, Daejeon, Republic of Korea
The pancreatic beta cell is critical for the maintenance of glycemic con-trol. Knowing the compendium of genes expressed in beta cells will further our understanding of this critical cell type and will allow the identifi cation of future anti-diabetes drug targets. While previous studies have used microar-rays to measure gene expression in beta cells, these studies are limited to those printed on the arrays and may have diffi culty confi dently identifying genes expressed at low levels. One novel class of RNAs that might not have been detected by existing microarrays are long intergenic non-coding RNAs (lincRNAs). Several lincRNAs have now been demonstrated to be function-ally important in biological processes ranging from epigenetic silencing to cell cycle control. Here, we report the use of next generation sequencing to interrogate the transcriptome of the mouse pancreatic beta cell. We have obtained nearly 500 million reads from the poly-adenylated RNAs of beta cells from mouse insulin promoter-GFP mice. Indeed, the expression of known beta cell specifi c genes is enriched in the sorted beta cell popula-
ant (SNV) data available. Exomes were captured using either the NimbleGen or Agilent CCDS solution capture products, in which over 90% of the sam-ples achieved more than 10x coverage over at least 80% of the bait regions and sequenced at an average depth of 65x. In total, 317,664 autosomal SNVs passed quality control fi ltering (call rate 90% and Hardy-Weinberg equi-librium p 1x10⁻⁶). Seven samples were excluded on the basis of deviation from observed autosomal heterozygosity, genome-wide call rate <50% and genotype concordance failure; 218 cases and 191 controls remained in the study. We searched for known disease-causing variants in the 409 exome dataset by comparing calls with the Human Gene Mutation Database. After excluding overlapping variants that were found in the homozygous state in the 1000 Genomes pilot dataset or had a Condel score <0.99, we identifi ed 286 candidate disease variants, over two-thirds of which were singletons. Among these were Ser94Asn in MCR4 and Arg143Term in UCP3 which have been linked to relevant phenotypes in literature reports. Moreover, we test-ed for association with T2D through single point tests and methods testing for an aggregation of rare variants. We have prioritized 23 candidate genes for follow-up, including VEGFA, TNKS and VCAM1, which are interesting as they achieved aggregate test p<0.01 across all methods and/or single-point p<10-4, were in the top three of each individual aggregate analysis and had strong biological credentials. This is one of the largest exome sequencing studies for a common disease that we are aware of, raising both challenges and exciting opportunities for further investigation.
Supported by: Wellcome Trust Grant 098051
143-ORExome Sequencing to Identify Variants that Contribute to Type 2 Diabetes in Pima IndiansLESLIE J. BAIER, KE HUANG, YUNHUA MULLER, SAYUKO KOBES, MELISSA DEL ROSARIO, MARYAM ABDUSSAMAD, ALEJANDRA MARINELARENA, SHEENA CARBAUGH, VENKATA YELLAPANTULA, CLIFTON BOGARDUS, Phoenix, AZ
To identify rare or novel variants that affect risk for type 2 diabetes in Native Americans, we obtained exome sequence data on 177 Pima Indi-ans. These unrelated individuals had been metabolically characterized for predictors of type 2 diabetes when they were nondiabetic, which included measures of insulin secretion, insulin action, and percent body fat (pfat). A subset (N 50) had undergone abdominal fat and/or skeletal muscle bi-opsies for genome-wide gene expression profi ling. Exome sequencing was performed by ShanghaiBio Corp. SNP validation showed that variants with a quality score of 100, that met HWE expectations, were unlikely to be arti-facts. Among SNPs that met these criteria (N=408,487) only 88,005 mapped within exons; of these, 71,367 were coding (35,195 nonsynonymous), while 3,913 and 12,725 were in 5’ and 3’ UTRs, respectively. There were also 1,359 coding indels (698 predicted a frameshift). Variants occurring in 5 subjects were preliminarily analyzed for association with a metabolic trait in the 177 individuals, and those SNPS with the strongest associations are currently being genotyped in a sample of 3500 Pima Indians informative for type 2 dia-betes and BMI. SNPs detected by sequencing are also being analyzed for as-sociation with cis-acting gene expression levels in subjects with expression data. In the preliminary analyses, 3 of the 8 top signals for pfat (P=10-5-10-6)resulted from novel variants. Five of these signals were in genes unknown to be associated with obesity (LYSMD4, ANKRD36, USP5, DHX32, AGPAT1) and require validation which is ongoing. Another top signal (CYB5A) had been detected in our prior GWAS for BMI, and the BMI association replicated in two independent samples (total N= 7285, P= 10-7). Another signal (PARP1) is an obesity gene in mice. SNPs in several biologically relevant genes were associated with other traits that predict type 2 diabetes (e.g. SNPs in LMX1 and NEDD4 were associated with acute insulin secretion and insulin action, respectively; both P 10-5).
144-ORExome Sequencing Identifi es a New Diabetes Susceptibility Muta-tion in a Japanese Family With Highly Aggregated Type 2 DiabetesDAISUKE TANAKA, KAZUAKI NAGASHIMA, MAYUMI SASAKI, SHOGO FUNAKO-SHI, AKIO KOIZUMI, NOBUYA INAGAKI, Kyoto, Japan
In most Japanese families with highly aggregated type 2 diabetes, famil-ial clustering cannot be attributed to known genetic factors. The aim of this study was to investigate the genetic background of familial clustering of diabetes using genome-wide linkage analysis with exome sequencing. We recruited a family with 3-generation history of diabetes in Japan. The family contained 16 members and 13 of them had been diagnosed with diabetes. Nine affected members had been diagnosed before the age of 40. For the family, we performed linkage analysis assuming an autosomal dominant model. Linkage regions were observed on chromosomes 4q34, 5q11-q13,

A39
For author disclosure information, see page 797.ADA-Funded Research
ORA
LS
DIABETES PREVENTION AND LIFESTYLE RISK FACTORS
FINDRISC score (16.2/15.8 points), fasting (5.3/5.2 mmol/l), 2-h (7.1/6.9 mmol/l) plasma glucose and motivation to make lifestyle changes at base-line. Diabetes was diagnosed in 124 subjects-63(28.8%) in the SC group and 61(18.3%) in the II group. During a 4.2-year median follow-up, the incidence of diabetes was 7.2 and 4.6 cases per 100 person-years, respectively (p<0.005, 36.5% relative risk reduction). Similarly, the incidence of diabetes in subjects with prediabetes was 13.4 cases per 100 person-years in the SC group and 8.9 cases per 100 person-years year in the II group (p<0.02, 33.6% relative risk reduction). The number needed to be treated for 4 years to reduce one case of diabetes by intensive intervention was 9.5. A substantial reduction in diabetes incidence can be achieved in real-life primary healthcare settings among high-risk individuals by a feasible intensive lifestyle intervention.
Supported by: University of Helsinki, Instituto Salud Carlos III, Generalitat Cata-lunya
149-ORTianjin Gestational Diabetes Mellitus Prevention Program: Study Design, Methods, and 1-Year Interim Report on the Feasibility of Lifestyle Intervention ProgramGANG HU, HUIGUANG TIAN, FUXIA ZHANG, HUIKUN LIU, CUIPING ZHANG, SH-UANG ZHANG, GONGSHU LIU, ZHIJIE YU, XILIN YANG, LU QI, CUILIN ZHANG, HUA WANG, MIN LI, JUNHONG LENG, LEISHEN WANG, YI LI, LING DONG, JAAK-KO TUOMILEHTO, Baton Rouge, LA, Tianjin, China, St. Catharines, ON, Canada, Boston, MA, Rockville, MD, Helsinki, Finland
Whether lifestyle management can prevent type 2 diabetes among wom-en with gestational diabetes mellitus (GDM) shortly after delivery has not been systematically tested. The aims of the Tianjin Gestational Diabetes Mellitus Prevention Program are to assess whether lifestyle intervention can reduce the incidence of type 2 diabetes in women with a history of GDM, and to test the gene-intervention interactions in relation to type 2 diabetes related metabolic changes among such women. A total of 1,180 GDM women diagnosed with GDM from 2005 to 2009 were randomly as-signed to either a lifestyle intervention (n=586) or control group (n=594). The control women will receive general information about the lifestyle changes necessary to prevent diabetes at the start of the trial (26.7 months after delivery) and at annual follow-up visits. Major elements of the intensifi ed intervention include fi ve face-to-face meetings with study dietitians in the fi rst year, and two additional sessions and two telephone calls at each sub-sequent year. During the fi rst year, body weight loss in the fi rst 404 women entering the trial was 1.40 (2.05%) vs 0.21 kg (0.27%) in the intervention and control group, respectively (P=0.001); the decrease was greater among women overweight at baseline (BMI >=24 kg/m2) in the intervention group (2.91 kg/4.15%) and in the control group (0.51 kg/0.71%) (P<0.001). Women in the intervention group, compared with those in the control group, also had decreased body mass index, body fat, waist circumference, serum insulin and insulin resistance (HOMA), and had improved health behavior indicators including increased leisure time activity, vegetable and fi ber intakes, and de-creased fat consumption and sitting time. These interim results have shown the effi cacy and feasibility of the lifestyle intervention for the prevention of type 2 diabetes among women with a history of GDM.
Supported by: EFSD
150-ORMaternal Glucose in Pregnancy and After Delivery in GDM Mothers on Obesity Status of Their ChildrenSHUANG ZHANG, HUIKUN LIU, CUIPING ZHANG, ZHEYING TANG, NAN LI, SHUT-ING WANG, GONGSHU LIU, GANG HU, Tianjin, China, Baton Rouge, LA
Gestational diabetes mellitus (GDM) is a strong risk factor for obesity in GDM offspring, but maternal glucose in pregnancy and after delivery in GDM mothers on obesity status of their children are unknown. The aim of the pres-ent study is to examine the relation of glycemia during pregnancy and after delivery with anthropometry in offspring of GDM mothers. A total of 1,263 GDM women diagnosed with GDM from 2005 to 2009 and their children fi nished baseline survey from August 2009 to July 2011 for the Tianjin GDM Prevention Program. These women had a 75-g glucose 2-h OGTT at 26-30 gestational weeks. We have been using the WHO’s criteria to defi ne GDM. Of 1263 GDM women, 9.1% were diagnosed as diabetes and 90.9% were diagnosed as impaired glucose tolerance (IGT) based on their OGTT glucose concentrations at 26-30 gestational weeks. The offspring of GDM mothers who were diagnosed as diabetes during pregnancy had higher prevalence of overweight (body mass index Z score the 85th percentile for age- and gender-specifi c distribution using the World Health Organization growth ref-erence) and obesity (body mass index Z score the 95th), and higher mean values of Z scores of weight for age, weight for height, and BMI for age than
tion as compared to total mouse islet while known non-beta cell specifi c genes are substantially depleted, demonstrating that our sorting strategy is robust and capable of identifying beta cell specifi c genes. Besides beta cell specifi c genes, we identifi ed known and novel beta cell specifi c splice forms and promoter use. We then capitalized on the unbiased nature of mRNA-seq and assembled a de novo transcriptome to identify potential long inter-genic non-coding RNAs (lincRNAs). After removing transcripts shorter than 200 nucleotides and those with poor conservation, we identifi ed over 1,100 unique potential lincRNAs expressed in mouse beta cells. The majority of these lincRNAs are beta cell specifi c and we hypothesize that this large set of novel RNAs may play a functional role in beta cell function.
DIABETES PREVENTION AND LIFESTYLE RISK FACTORS
147-ORThe Impact of Lifestyle Intervention on All-Cause and Cardiovascu-lar Mortality in Adults With Impaired Glucose Tolerance: 23-Year Follow-Up of the Da Qing Diabetes Prevention StudyGUANGWEI LI, PING ZHANG, JINPING WANG, YALI AN, QIUHONG GONG, ED-WARD GREGG, GOJKA ROGLIC, WENYING YANG, MICHEAL ENGELGAU, YAN-YAN CHEN, YINGHUA HU, PETER BENNETT, Beijing, China, Atlanta, GA, Daqing, China, Geneva, Switzerland, Phoenix, AZ
Lifestyle interventions in people with impaired glucose tolerance (IGT) re-duce the incidence of diabetes, but the impact on cardiovascular disease and all-cause mortality is unclear. We aimed to determine the long-term effects of lifestyle intervention on all-cause and cardiovascular (CVD) mortality in adults with IGT. In 1986, 576 adults with IGT from 33 clinics were randomly assigned by clinic to control or one of three lifestyle intervention groups (diet, exercise, and diet plus exercise). The intervention took place from 1986 to 1992. In 2009, 23 years after randomization, study participants were traced to determine the long-term effects of the intervention on all-cause and CVD mortality. We compared mortality rates in women and men in the control group to those in the combined intervention groups using intent-to-treat analyses. Over the 23 year follow-up period, 47 women and 127 men died. In women, intervention reduced all-cause mortality by 53% (Hazard rate ratio 0.47; 95%CI 0.25-0.86) with a cumulative all-cause mortality of 29.3% (95%CI 17.5-48.0) in the control arm and 16.2% (95%CI 11.2-21.2) in the intervention arm (p=0.02). The reduction in all-cause mortality in women was mainly due to differences in CVD mortality (heart disease and stroke) (HRR 0.30; 95%CI 0.12-0.68) with 23-year cumulative mortality of 18.8% (95% CI 8.8-28.8) in the control and 6.8% (95%CI 3.4-10.2) in the intervention arm (p=0.006). Among men, there was no signifi cant difference between the intervention and control groups in cumulative all-cause mortality (41.1%; 95%CI 34.7-47.5 versus 46.7; 95%CI 35.4-58.0) (P=0.41) or CVD mortality (26.4%; 95%CI 21.1-31.6 versus 27.4%; 95%CI 18.6-32.2) (P=0.47). Over the 23-year follow-up, lifestyle intervention resulted in signifi cantly lower all-cause and CVD mortality among women with IGT but not in men.
Supported by: CDC, WHO, China-Japan Friendship Hospital
148-ORDelay in Progression to Type 2 Diabetes among High-Risk Spanish Individuals Following Lifestyle Intervention in Real-Life Primary CareXAVIER COS, BERNADO COSTA, FRANCISCO BARRIO, JOAN JOSEP CABRÉ, JO-SEP LLUIS PIÑOL, SONIA SARRET, CLAUSTRE SOLÉ, XAVIER MUNDET, TERESA MUR, MONTSERRAT COT, JACINT CAULA, FRANCESC PUJOL, JAANA LIND-STRÖM, JAAKKO TUOMILEHTO, THE DE-PLAN-CAT RESEARCH GROUP, Barce-lona, Spain, Helsinki, Finland, Seinajoki, Finland, Krems, Austria
To assess the feasibility and effectiveness of an active real-life primary care lifestyle intervention in preventing type2 diabetes within a high-risk Mediterranean population. Longitudinal cohort assessment conducted in primary healthcare. White European individuals without diabetes aged 45-75 years (n=2054) were screened using the FINRISC and a subsequent 2-h OGTT. High-risk non-diabetic screenees (n=552) participated in lifestyle intervention: either general information on diet and cardiovascular health (standard-care intervention group, n=219) or intensive reinforced DE-PLAN (Diabetes in Europe-Prevention using Lifestyle, Physical Activity and Nutri-tional intervention) programme (intensive intervention group, n=333). The primary outcome was the development of diabetes (WHO criteria). Analyses were performed based on the intention-to-treat principle. The standard-care(SC) and the intensive intervention groups(II) were comparable in terms of age (62.0/62.2 years), sex (64.4/68.2% women), BMI (31.3/31.2 kg/m2),
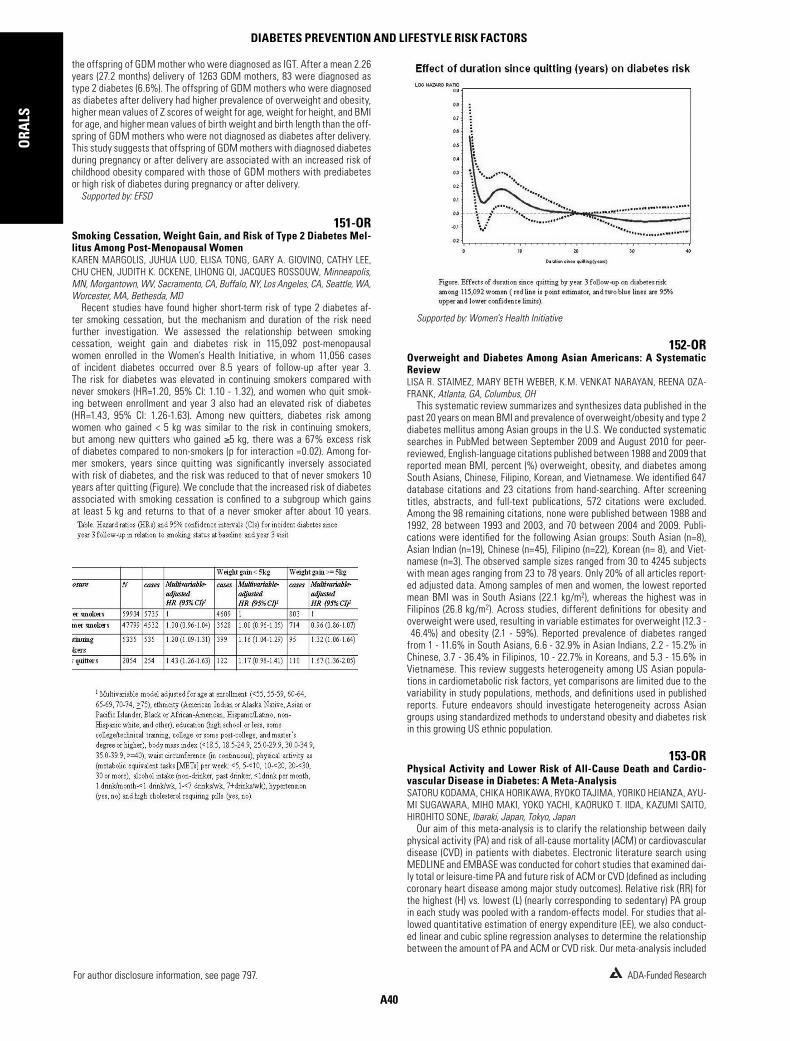
A40
For author disclosure information, see page 797. ADA-Funded Research
ORA
LSDIABETES PREVENTION AND LIFESTYLE RISK FACTORS
Supported by: Women’s Health Initiative
152-OROverweight and Diabetes Among Asian Americans: A Systematic ReviewLISA R. STAIMEZ, MARY BETH WEBER, K.M. VENKAT NARAYAN, REENA OZA-FRANK, Atlanta, GA, Columbus, OH
This systematic review summarizes and synthesizes data published in the past 20 years on mean BMI and prevalence of overweight/obesity and type 2 diabetes mellitus among Asian groups in the U.S. We conducted systematic searches in PubMed between September 2009 and August 2010 for peer-reviewed, English-language citations published between 1988 and 2009 that reported mean BMI, percent (%) overweight, obesity, and diabetes among South Asians, Chinese, Filipino, Korean, and Vietnamese. We identifi ed 647 database citations and 23 citations from hand-searching. After screening titles, abstracts, and full-text publications, 572 citations were excluded. Among the 98 remaining citations, none were published between 1988 and 1992, 28 between 1993 and 2003, and 70 between 2004 and 2009. Publi-cations were identifi ed for the following Asian groups: South Asian (n=8), Asian Indian (n=19), Chinese (n=45), Filipino (n=22), Korean (n= 8), and Viet-namese (n=3). The observed sample sizes ranged from 30 to 4245 subjects with mean ages ranging from 23 to 78 years. Only 20% of all articles report-ed adjusted data. Among samples of men and women, the lowest reported mean BMI was in South Asians (22.1 kg/m2), whereas the highest was in Filipinos (26.8 kg/m2). Across studies, different defi nitions for obesity and overweight were used, resulting in variable estimates for overweight (12.3 - 46.4%) and obesity (2.1 - 59%). Reported prevalence of diabetes ranged from 1 - 11.6% in South Asians, 6.6 - 32.9% in Asian Indians, 2.2 - 15.2% in Chinese, 3.7 - 36.4% in Filipinos, 10 - 22.7% in Koreans, and 5.3 - 15.6% in Vietnamese. This review suggests heterogeneity among US Asian popula-tions in cardiometabolic risk factors, yet comparisons are limited due to the variability in study populations, methods, and defi nitions used in published reports. Future endeavors should investigate heterogeneity across Asian groups using standardized methods to understand obesity and diabetes risk in this growing US ethnic population.
153-ORPhysical Activity and Lower Risk of All-Cause Death and Cardio-vascular Disease in Diabetes: A Meta-AnalysisSATORU KODAMA, CHIKA HORIKAWA, RYOKO TAJIMA, YORIKO HEIANZA, AYU-MI SUGAWARA, MIHO MAKI, YOKO YACHI, KAORUKO T. IIDA, KAZUMI SAITO, HIROHITO SONE, Ibaraki, Japan, Tokyo, Japan
Our aim of this meta-analysis is to clarify the relationship between daily physical activity (PA) and risk of all-cause mortality (ACM) or cardiovascular disease (CVD) in patients with diabetes. Electronic literature search using MEDLINE and EMBASE was conducted for cohort studies that examined dai-ly total or leisure-time PA and future risk of ACM or CVD (defi ned as including coronary heart disease among major study outcomes). Relative risk (RR) for the highest (H) vs. lowest (L) (nearly corresponding to sedentary) PA group in each study was pooled with a random-effects model. For studies that al-lowed quantitative estimation of energy expenditure (EE), we also conduct-ed linear and cubic spline regression analyses to determine the relationship between the amount of PA and ACM or CVD risk. Our meta-analysis included
the offspring of GDM mother who were diagnosed as IGT. After a mean 2.26 years (27.2 months) delivery of 1263 GDM mothers, 83 were diagnosed as type 2 diabetes (6.6%). The offspring of GDM mothers who were diagnosed as diabetes after delivery had higher prevalence of overweight and obesity, higher mean values of Z scores of weight for age, weight for height, and BMI for age, and higher mean values of birth weight and birth length than the off-spring of GDM mothers who were not diagnosed as diabetes after delivery. This study suggests that offspring of GDM mothers with diagnosed diabetes during pregnancy or after delivery are associated with an increased risk of childhood obesity compared with those of GDM mothers with prediabetes or high risk of diabetes during pregnancy or after delivery.
Supported by: EFSD
151-ORSmoking Cessation, Weight Gain, and Risk of Type 2 Diabetes Mel-litus Among Post-Menopausal WomenKAREN MARGOLIS, JUHUA LUO, ELISA TONG, GARY A. GIOVINO, CATHY LEE, CHU CHEN, JUDITH K. OCKENE, LIHONG QI, JACQUES ROSSOUW, Minneapolis, MN, Morgantown, WV, Sacramento, CA, Buffalo, NY, Los Angeles, CA, Seattle, WA, Worcester, MA, Bethesda, MD
Recent studies have found higher short-term risk of type 2 diabetes af-ter smoking cessation, but the mechanism and duration of the risk need further investigation. We assessed the relationship between smoking cessation, weight gain and diabetes risk in 115,092 post-menopausal women enrolled in the Women’s Health Initiative, in whom 11,056 cases of incident diabetes occurred over 8.5 years of follow-up after year 3. The risk for diabetes was elevated in continuing smokers compared with never smokers (HR=1.20, 95% CI: 1.10 - 1.32), and women who quit smok-ing between enrollment and year 3 also had an elevated risk of diabetes (HR=1.43, 95% CI: 1.26-1.63). Among new quitters, diabetes risk among women who gained < 5 kg was similar to the risk in continuing smokers, but among new quitters who gained 5 kg, there was a 67% excess risk of diabetes compared to non-smokers (p for interaction =0.02). Among for-mer smokers, years since quitting was signifi cantly inversely associated with risk of diabetes, and the risk was reduced to that of never smokers 10 years after quitting (Figure). We conclude that the increased risk of diabetes associated with smoking cessation is confi ned to a subgroup which gains at least 5 kg and returns to that of a never smoker after about 10 years.

A41
For author disclosure information, see page 797.ADA-Funded Research
ORA
LS
CLINICAL ISLET TRANSPLANTATION
CLINICAL ISLET TRANSPLANTATION
155-OR
Supported by: NIDDK and JDRF
156-OR-Cell Secretory Capacity in Human Islet Transplantation Accord-
ing to the CIT07 ProtocolMICHAEL R. RICKELS, CARISSA FULLER, CORNELIA DALTON-BAKES, ALLEN J. CHIOU, EILEEN MARKMANN, MARAL PALANJIAN, SCOTT A. SOLEIMANPOUR, RICHARD D. SHLANSKY-GOLDBERG, KUMAR VIVEK, CHENGYANG LIU, ALI NAJI, Philadelphia, PA
The multi-center Clinical Islet Transplantation 07 (CIT07) protocol utilizes anti-thymocyte globulin & etanercept induction, islet culture, heparinization and intensive insulin therapy, with the same low-dose tacrolimus and si-rolimus maintenance immunosuppression as in the Edmonton protocol. To determine whether CIT07 improves engrafted islet -cell mass, our center measured -cell secretory capacity from glucose-potentiated arginine tests
17 studies, 13 of which investigated ACM risk and 11 CVD risk. Qualitatively, the H group had a lower RR [95% confi dence interval] for ACM (0.61 [0.52-0.70]) and CVD (0.65 [0.59-0.72]) than the L group. Linear regression analysis indicated that a 1 MET x h/d increase in PA was associated with ACM and CVD risk reduction by 9.5% (P=0.001) and 7.9% (P=0.001), respectively. The cubic spline regression curve suggested that daily PA yielding more than 5.6 METs x h of EE accelerated the preventive effect of ACM although the ben-efi t of additional PA was smaller for CVD than for ACM (Figure). The meta-analysis suggests an association between lower mortality or CVD risk and more PA in diabetic patients.
154-OREndogenous Sex Hormone Changes in Postmenopausal Women in the Diabetes Prevention Program (DPP)CATHERINE KIM, SHENGCUN KONG, GAIL A. LAUGHLIN, SHERITA H. GOLDEN, KIEREN J. MATHER, BIN NAN, SHARON L. EDELSTEIN, JOHN R. RANDOLPH, FERNAND LABRIE, ELIZABETH OSBORNE, ELIZABETH BARRETT-CONNOR, Ann Arbor, MI, San Diego, CA, Baltimore, MD, Indianapolis, IN, Washington, DC, Que-bec, QC, Canada
Few studies have examined changes in endogenous sex hormones or ESH [sex hormone binding globulin (SHBG), estradiol (E2), testosterone (T), and dehydroepiandrosterone (DHEA)] in response to intensive lifestyle change (ILS) and subsequent effects on glucose. We examined if randomization to ILS or metformin changed ESH compared to placebo among postmenopausal glucose-intolerant women. The DPP was a randomized trial that assessed the impact of ILS and metformin upon diabetes incidence in glucose intol-erant adults. This report includes 382 postmenopausal women not using estrogen therapy. The main outcome measures were intervention-related ESH changes between baseline and 1 year and associations between ESH changes and glucose changes. Linear regression models determined the association between study arm and ESH changes and the associations be-tween ESH changes and glucose changes after adjustment for age, race/ethnicity, follicle stimulating hormone, and changes in 1/fasting insulin and waist circumference (WC). ILS increased SHBG by 10.4 nmol/l and decreased DHEA by -0.31 ng/ml, and these ESH changes were signifi cantly different from changes in the placebo arm after adjustment for all covariates. SHBG increases were associated with fasting plasma glucose (FPG) decreases (p<0.01) and 2-hour glucose (2HG) decreases (p=0.04). DHEA decreases were associated with FPG decreases (p=0.02) and 2HG decreases (p=0.01) after adjustment for variables including changes in WC and 1/fasting insulin. ILS did not decrease E2 or T, although E2 decreases were associated with FPG decreases after adjustment for all variables (p=0.02). Metformin did not sig-nifi cantly impact ESH or glucose. Among postmenopausal glucose intolerant women, ILS increases SHBG and decreases DHEA, and these ESH changes were associated with FPG and 2HG independent of WC and fasting insulin.
Supported by: NIDDK
WITHDRAWN

A42
For author disclosure information, see page 797. ADA-Funded Research
ORA
LSCLINICAL ISLET TRANSPLANTATION
line then started liraglutide 0.6mg daily, increasing to 1.2mg after 1 week. Data were analyzed using ANOVA and T-tests. The GLP-1 0min mean was 1.65±1.19; 8.65±3.5 pM/L at 0 and 6 months respectively (P>0.05). The GLP1 mean peak at baseline was 13.95±17.43 pM/L and at 6 months 42.73±42.02 pM/L (P<0.01). Glucose; c-peptide, glucagon response and HbA1c remained stable (6.0±0.30 to 6.3±0.39 %) (P>0.05).No difference was observed in the acetaminophen absorption. Study dose(1.2mg) was achieved in 100%(6/6) of patients, and sustained in 66.67%(4/6). Dose was decreased due to constipation and diarrhea. No nausea was observed and appetite was in-creased in 66.67%(4/6) of patients. Weight loss was reported in 66.67%(4/6) (mean:2.85±2.32 Kg). Liraglutide was tolerated in the majority of subjects. Its action improved glucose response to MMTT, decreased weight. Liraglutide improved GLP-1 physiologic response to MMTT in these subjects, decreas-ing time to peak and increasing levels after a meal. The chronic higher GLP-1 levels (basal and stimulated) might lead to longer islet survival. Controlled studies are needed to confi rm these observations.
159-ORIslet Autotransplant to Prevent Diabetes in Children Undergoing To-tal Pancreatectomy for Chronic PancreatitisVISHA PARNERKAR, DAVID E. SUTHERLAND, GREGORY J. BEILMAN, TY B. DUNN, TIMOTHY L. PRUETT, SRINATH CHINNAKOTLA, SARAH J. SCHWARZEN-BERG, BERNHARD J. HERING, A.N. BALAMURUGAN, MELENA D. BELLIN, Minneapolis, MN
For children with severe chronic pancreatitis (CP), total pancreatectomy (TP) with islet autotransplant (IAT) can alleviate pain and avoid or lessen surgical diabetes. The objective of this analysis was to report metabolic outcomes in a large cohort of children who underwent TPIAT at a single cen-ter from 1989 -2011. Medical records were reviewed for insulin use, HbA1c levels, and mixed meal tolerance tests. 53 patients (29 female) underwent TPIAT at a mean age of 14±4 years (range 5-18y). Mean islet yield was 213,854 ±166,990 islet equivalents (IE) or 4,054 ±3,295 IE/kg, but was lower in the 12 pts with prior distal resection or Puestow drainage (2,417 ±1,981 IE/kg, p=0.01). Most (n=50) were non-diabetic before TPIAT, with mean HbA1c 5.1±0.4%. In all, 24 patients (44%) achieved insulin independence (at 0.2 -3 years post-IAT),with 5 returning to insulin use 1-6 years after IAT. Of those with >1 year follow up, 17 (45%) were insulin independent, 6 (16%) required once daily insulin, and 15 (39%) were fully insulin dependent at 1 year. Fac-tors associated with insulin independence included younger patient age (p=0.007) and greater IEQ/kg (p=0.001). 85% (10/12) of patients aged <10 years were insulin independent. For each 2500 IEQ/kg in islet yield, odds of insulin independence increased 3.5 fold (95% CI 1.8, 8.5). HbA1c was <7% in 75% of all post-IAT measurements, and in >94% of insulin independent and high islet yield (>5,000 IE/kg) recipients. HbA1c was lower and C-peptide higher in those who achieved insulin independence vs dependent: HbA1c 5.6±0.5% vs 7.1±1.6%, peak C-peptide 3.5 ±1.6 vs 1.7 ±1.4 ng/mL, and AUC C-peptide 5.2±1.7 vs 2.7±2.1 ng/mL*hr (p<0.001 for all). HbA1c was lower, and C-peptide higher in high yield recipients (p<0.001). In conclusion, IAT permits goal glycemic control in the majority of children undergoing TPIAT for severe CP. Younger age and high islet yield were associated with greater likelihood of insulin independence and lower HbA1c.
160-ORImproved Insulin Secretion by Autologous Islet Transplantation, Com-pared to Oral Anti-Diabetic Agents after Distal Pancreatectomy JI WON YOON, HYE SEUNG JUNG, JUNG HEE KIM, MIN JOO KIM, YENNA LEE, EUN KY KIM, MIN KYEONG KIM, SHIN HEE HONG, HAK MO LEE, HYO CHEOL KIM, JIN YOUNG JANG, KYOUNG BUN LEE, KYONG SOO PARK, Seoul, Republic of Korea
Effects of autologous islet transplantation (ITx) after distal pancreatec-tomy (d-Px) have not been compared directly to those of oral anti-diabetic drugs (OAD). We present results of interim analysis of a study comparing the effects of ITx and OAD after d-Px. Non-diabetic patients who underwent d-Px for benign tumors were enrolled to either ITx or control group. The ITx group received autologous islets 1 or 2 days after Px via portal vein. Metabolic pa-rameters were monitored for 12 months, and metformin ± vildagliptin were added to control blood glucose levels. Twelve patients in the control group and 5 in the ITx group completed 12-month assessment. Eight patients in the control group started metformin, 4 of whom needed additional vildagliptin. None of the ITx group started OAD. Age and sex ratio were not different be-tween the groups. Extent of pancreas resection was signifi cantly greater in the ITx group (ITx vs. control, 60 vs. 35%, p<0.05). Average islet graft amount was 1,062 IEQ/kg of bodyweight. Pre-operative HbA1c was comparable, but that of 12-month was signifi cantly higher in the control group (5.5±0.2 vs.
75 days post-transplant (n = 11), and compared the results to those achieved by our group with the Edmonton protocol (n = 5), and to normal (n = 11). CIT07 subjects received fewer islets (9,097 ± 803 vs. 14,313 ± 2237 IE/kg, p < 0.05) from a median 1 vs. 2 donors in Edmonton with all subjects off insulin. The acute insulin and C-peptide responses to 5 g iv arginine were measured fast-ing (AIRarg & ACRarg) and during a 230 mg/dl glucose clamp (AIRpot & ACRpot).AIRarg was not different across CIT07, Edmonton and normal (28 ± 4 vs. 15 ± 2 vs. 28 ± 3 μU/ml), while ACRarg was greater in CIT07 than Edmonton and not less than normal (1.3 ± 0.2 vs. 0.5 ± 0.1 vs. 1.5 ± 0.2 ng/ml, p < 0.01 for both). AIRpot was greater in CIT07 than Edmonton with both transplant groups less than normal (57 ± 8 vs. 29 ± 3 vs. 143 ± 15 μU/ml, p < 0.05 between transplant groups & p < 0.01 for both vs. normal), with similar fi ndings for ACRpot (3.0 ± 0.6 vs. 1.1 ± 0.2 vs. 6.4 ± 0.8 ng/ml, p < 0.05 between transplant groups & p < 0.01 for both vs. normal). Six CIT07 subjects have completed reassess-ment at 365 days post-transplant with a trend toward increasing AIRpot (64 ± 11 vs. 88 ± 15 μU/ml, p < 0.1). These data indicate that while still less than normal, engrafted islet -cell mass is markedly improved with the CIT07 vs. Edmonton protocol, especially given the smaller number of islets transplant-ed. While several peri-transplant differences may have each contributed to this improvement, the lack of deterioration in -cell secretory capacity over time in CIT07 suggests that low-dose tacrolimus and sirolimus may not be toxic to islets.
Supported by: PHS (U01DK070430, UL1RR024134, and P30DK19525)
157-ORSitagliptin Plus Pantoprazole Enhances Graft Function and Tempo-rarily Restores Insulin Independence in Clinical Islet TransplantationPETER A. SENIOR, JONATHAN YAU, PARASTOO DINYARI, SHARLEEEN IMES, ANDREW J. MALCOLM, JAMES SHAPIRO, ANGELA KOH, Edmonton, AB, Canada
Maintenance of insulin independence after islet transplantation is chal-lenging. Incretins can augment insulin secretion and may increase beta cell mass. The combination of GLP-1 and gastrin can restore normoglycemia in NOD mice. Therefore we tested a combination of pantoprazole and sitaglip-tin in islet transplant recipients with early graft dysfunction. 7 male and 1 female subjects (mean age 55±8 years, 2 months to 12 years since last transplant), with early islet graft dysfunction (A1c >6% or fasting glucose >7mmol/L or random glucose >10mmol/L and insulin use <10U/day) were re-cruited. Treatment was with sitagliptin 100mg daily and pantoprazole 40mg bid for 6 months. Glycemic control and graft function were assessed using A1c, insulin dose, mixed meal test, intravenous arginine stimulation test and continuous glucose monitoring system (CGMS) at baseline, 3 and 6 months, and after a 3 month washout. 5 of 8 subjects became insulin independent after 6 months of treatment. At baseline the mean HbA1c was 6.3±0.65%, which decreased to 6.1±0.46% after 1 month of treatment (P=0.043) with no further change during treatment. HbA1c increased when treatment was withdrawn (6.4±0.59% to 6.8±0.59% (P=0.032) . Measures of graft function were stable during the study (mean fasting and stimulated C-peptide/glucose ratios: 0.080±0.030 and 0.20±0.10; 0.10±0.050 and 0.20±0.16; 0.080±0.010 and 0.21±0.08, at baseline, 6 and 9 months respectively. There were no statistically signifi cant changes in CGMS data, or acute insulin response to arginine. The study drugs were well tolerated, and there were no increases in hypoglycemia in any subjects. Insulin independence can be regained and glycemic control improved with the use of sitagliptin and pantoprazole, but these improvements may not be maintained when drugs are withdrawn. These data suggest that beta cell function is augmented by the study drugs, but theres is no evidence of signifi cant beta cell regeneration.
Supported by: JDRF
158-ORUse of Liraglutide in Islet Transplant RecipientsEDUARDO M.L. PEIXOTO, LEONOR G. MIRELES-ZAVALA, NUJEN C. BOZKURT, VALENTINA DELMONTE, ANDREA CORRALES, CAMILLO RICORDI, RODOLFO ALE JANDRO, Miami, FL
Glucagon Peptide Like-1(GLP-1) analogs have been used in our center as an adjuvant therapy for islet transplantation. This population benefi ts from the unique GLP-1 actions such as optimization of glucose control by promot-ing glucose dependent insulin secretion and beta cell protection. Recently, our center switched subjects from a short acting GLP-1 analog (exenatide) to a long acting (liraglutide) in the attempt to improve metabolic outcomes and minimize side effects. A prospective study was done in a subset of islet transplant recipients (n=6). Data on insulin, glucose, c-peptide, acetamino-phen, glucagon and GLP-1 in response to a 300 minute Mixed Meal Tolerance Test (MMTT) were collected at 0 and 6 months, in addition to weight and HbA1c. All subjects discontinued exenatide at least 3 days prior to base-
WITHDRAWN

A43
For author disclosure information, see page 797.ADA-Funded Research
ORA
LS
HOT TOPICS IN HUMAN OBESITY
HOT TOPICS IN HUMAN OBESITY
163-ORExpression of Mir-17-92 Cluster in Adipose Tissue: Potential Role in the Regulation of Fibrosis and AngiogenesisLATHA MUNIAPPAN, RESAT UNAL, BRIAN S. FINLIN, CHARLOTTE A. PETERSON, PHILIP A. KERN, Lexington, KY
A prominent feature of adipose tissue with obesity is an increase in fi bro-sis and a decrease in capillaries. Thrombospondin (TSP1) is pro-fi brotic and anti-angiogenic, and TSP1 expression in adipose is increased with obesity and insulin resistance. Because the mechanism for TSP1 up-regulation is un-known, we examined the functional signifi cance of the microRNA (miR) 17-92 cluster, which is composed of 7 miRs (miR 17-3p, 17-5p, 18a, 19a, 19b, 20a and 92) in tandem. In this cluster, miR-19a and 19b are known to decrease TSP1 and CTGF expression in cancer and other cell types, but no studies have examined adipose tissue. We hypothesized that miR-17-92 plays an impor-tant role in the development of obesity associated insulin resistance through regulation of TSP1 and other targets. Adipose tissue biopsies from 14 obese (BMI: 33.5 ±1.2, SI: 1.87 ±0.2) and 14 lean human subjects (BMI: 24.2 ±1.2, SI:4.57 ±1.2) were examined for miR-17-92 cluster expression using a cluster plate assay and were confi rmed by qRT-PCR experiments. Expression of all miR-17-92 cluster members was signifi cantly lower in obese subjects, com-pared to lean, by 30-80% (all p<0.05). Overexpression of miR-17-92 cluster members miR-19a/b and 18a in cultured 3T3L1 adipocytes decreased TSP1 and CTGF expression by 80% and 75%, respectively (p<0.05). In addition, the knockdown of miR-19a/19b with siRNA increased the abundance of TSP1 and CTGF mRNA by 65% and 59%, respectively (p<0.05). TSP1 is expressed by both macrophages and adipocytes, and the coculture of macrophages with adipocytes induces TSP1 expression by both cells, but especially M2c polarized macrophages. Adipocyte conditioned medium (ACM) increased TSP1 expression, and the knockdown of miR-19a and 19b in M2c macrophag-es in the presence of ACM further increased TSP1 mRNA. These results suggest that down-regulation of miR-17-92 in obese subjects may provide a mechanism for the increase in TSP1, and hence the increased fi brosis and decreased angiogenesis.
Supported by: R01 DK71349
164-ORMicroRNAs in the Liver and Visceral Adipose Tissue in Non-Alco-holic Fatty Liver Disease (NAFLD)JARKKO SORONEN, JULIA PERTTILÄ, HANNELE YKI-JÄRVINEN, VESA OLK-KONEN, Helsinki, Finland
MicroRNAs (miRNAs) are small endogenous RNA molecules which regu-late gene expression by reducing mRNA stability and translational activity. We aimed to determine whether miRNAs are abnormally expressed in NA-FLD vs. normal human liver and in visceral adipose tissue in subjects with NAFLD compared to visceral adipose tissue in those with no NAFLD. Total RNA was extracted from liver and visceral adipose tissue (VAT) of patients who had either severe NAFLD (liver fat >30%, mean 38.3 ± 4.5%, n=15) or no NAFLD (liver fat <5%, mean 3.0 ± 1.2%, n=15). The groups were matched for age (49 ± 2 vs. 48 ± 3 yrs), gender (9 females and 6 males vs. 11 females and 4 males) and BMI (48.8 ± 1.2 vs. 44.4 ± 1.7 kg/m2). RNA was subjected to miRNA profi ling on Exiqon mercury LNATM microRNA arrays detecting 1438
6.3±0.5%, p<0.05). At 6-month, HOMA-B and insulinogenic index (IGI) were decreased in both the groups, however, ITx group showed better insulin se-cretion than the control (HOMA-B: 63.5±11.8, vs. 37.6±10.2 % from the base-line, p=0.001, IGI: 77.4±77.3, vs. 46.0±39.7 % from the baseline, p=0.375). Both indices tended to recover after 6-month in both the groups, with the ITx group slightly better at 12-month (HOMA-B: 73.1±24.7, vs. 48.4±23.1 % from the baseline, p=0.073, IGI: 95.6±80.6, vs. 52.4±28.3 from the baseline, p=0.247). In conclusion, ITx had a role in maintaining insulin secretory capac-ity after d-Px, while metformin ± vildagliptin did not, in spite of the larger extent of pancreas resection in the ITx group.
Supported by: The Innovative Research Institute for Cell Therapy
161-ORIslet Autotransplantation After About 50% Partial Pancreatectomy in Patients Without Diffuse Parenchymal Disease of Pancreas—Importance of Effectiveness of Islet IsolationSANG-MAN JIN, SUN-MI PARK, JI CHEOL BAE, JAE HYEON KIM, MYUNG-SHIK LEE, MOON KYU LEE, KWANG-WON KIM, Seoul, Republic of Korea
There has been only little experience in islet autotransplantation (IAT) in patients without diffuse parenchymal disease of pancreas, unless the extent of pancreatic excision was more than 80%. We aimed to identify the fac-tors associated with earlier diabetes development in the patients without diffuse parenchymal disease of pancreas, who underwent IAT after about 50% partial pancreatectomy. Among the 37 patients without pre-operative diabetes and diffuse parenchymal disorders of pancreas, 20 underwent IAT after about 50% partial pancreatectomy with informed consent. In these 20 patients, annual oral glucose tolerance test was performed. Factors as-sociated with earlier development of diabetes were identifi ed. The median follow-up period was 61 months (range, 16-126). Higher preoperative levels of fasting plasma glucose (FPG, p = 0.005), higher preoperative insulin resis-tance (p = 0.040, QUICKI index), less total transplanted islet mass (p = 0.012), less islet isolation yield in islet equivalent per resected pancreas weight in gram (IEQ/g, p = 0.039) were associated with diabetes development in 12 months post-operation (n = 5). Receiver-operator characteristic analy-sis revealed that islet isolation yield per resected pancreas mass of <5154 IEQ/g, but not the total transplanted islet mass, predicted the development of diabetes in 12 months (sensitivity 87%, specifi city 100%; p = 0.005). In Kaplan-Meier survival analysis, diabetes-free survival was signifi cantly pro-longed when islet isolation yield was >5154 IEQ/g (p = 0.0179). In patients without diffuse parenchymal disease of pancreas, preoperative FPG, insulin resistance, and islet isolation yield per pancreas weight predicted earlier diabetes development. A clinical trial designed to control these factors could prove the benefi t of IAT in this population.
162-ORInsulin Independence After Islet Autotransplant is Associated With Subtle Differences in Early Post-Transplant Glycemic ControlMELENA D. BELLIN, DAVID E. SUTHERLAND, SRINATH CHINNAKOTLA, TY DUNN, YONG KIM, JEREMIAH JOHNSON, ASAD SAEED, CAROL MANCHESTER, A.N. BALAMURUGAN, BERNHARD J. HERING, TIMOTHY L. PRUETT, GREGORY J. BEIL MAN, Minneapolis, MN
Beta cell apoptosis after islet transplant is reduced when frank hypergly-cemia is avoided. However, the impact of small deviations from normogly-cemia is unclear. We reviewed early glycemic control in 255 islet autotrans-plant (IAT) recipients since 2006. In 2009, the hospital insulin drip shifted from strictly targeting euglycemia (80-110 mg/dL, “Era 1”) to more liberal goals (100-120 mg/dL, “Era 2”). All patients were maintained on an insulin drip for >3 days. Average blood glucose (BG) was calculated for each of the fi rst three post-operative days and for the fi rst week. Insulin use was known for 171 cases, 1 year C-peptide for 70. Mean BG were lower in Era 1 vs Era 2: 113 ±11 mg/dL vs 119 ±12 mg/dL 119 ±14 vs 126 ±18 mg/dL over the fi rst 3 and 7 days respectively (p<0.001), but insulin independence did not differ between Era 1 and Era 2 (40% vs 39%). In logistic regression, lower BG was associated with higher likelihood insulin independence (fi g 1, p<0.001). Mean BG was lower in patients who achieved insulin independence (fi gure 2), an effect which was strongest in patients with <5000 IE/kg transplanted. There was a modest correlation between peak C-peptide at 1 year and 7 day BG av-erage only in those with low islet yield, (<2500 IE/kg,r=0.54, p=0.04). These data suggest a relationship between small (6-10 mg/dL) differences in early glycemic control and long-term IAT outcomes, which is strongest in those with marginal mass grafts. Lower BG in the insulin independent patients may mediate better graft survival, or conversely, may be a marker of better quality islets allowing fewer glycemic excursions.

A44
For author disclosure information, see page 797. ADA-Funded Research
ORA
LSHOT TOPICS IN HUMAN OBESITY
166-OREnhanced Adipo/Lipogenic Potential of Human Adipose Tissue Stem Cells in ObesitySEBASTIO PERRINI, PASQUALE NIGRO, ANGELO CIGNARELLI, MARIA BAR-BARO, ROMINA FICARELLA, ALESSANDRO PESCHECHERA, MICHELE DE FAZIO, FRANCESCO PUGLISI, ANNALISA NATALICCHIO, LUIGI LAVIOLA, FRANCESCO GIORGINO, Bari, Italy
An impaired adipo/lipogenic capacity of human adipose stem cells (ASCs) may contribute to obesity and the related metabolic abnormalities. Aim of this study was to investigate whether obesity is associated with changes in the adipogenic and/or lipogenic potential of ASCs from the subcutane-ous (SC) and visceral (V) fat tissue depots. ASCs were isolated from SC and V fat biopsies, obtained from 8 lean (L) (BMI 24.1±2.3 kg/m2) and 8 obese (Ob) (BMI 37.4±3.2 kg/m2) subjects. Cells were differentiated in vitro with adipogenic inducers in the absence or presence of 100 nM insulin. Staining with Nile Red or Oil-Red-O was used to quantify adipocyte conversion and the lipid droplet size and number, respectively. mRNA levels of lipogenic and adipogenic genes were measured by qRT-PCR. No signifi cant differences in the conversion to mature adipocytes were seen in SC-ASCs from L and Ob subjects, whereas adipogenesis was about 60% higher in V-ASCs from Ob compared to L donors. Following differentiation of both V-ASCs and SC-ASCs into mature adipocytes in the absence of insulin, there was a 70-80% higher number of lipid droplets, with no apparent change in size, in Ob compared to L cells (p<0.05). Similar results were obtained in the presence of insulin, and insulin-induced Akt and Erk-1/2 phosphorylation was similar in L and Ob ASCs. When the expression of 14 lipogenic and adipogenic genes was as-sessed in both ASCs and adipocytes from the experimental subjects, larger differences were found in V compared to SC cells (p<0.05). Specifi cally, the SIRT1/2 mRNA levels were lower in Ob compared to L V-ASCs and adipo-cytes. A trend to an inverse relationship between SIRT1/2 mRNA expression and BMI was also found in V fat biopsies (R= -0.145). In conclusion, Ob ASCs, particularly from the V fat depot, exhibit lower SIRT1/2 gene expression and possess an enhanced inherent adipo/lipogenic potential, which is largely insulin-independent.
167-ORMitochondrial Function of Human Subcutaneous and Omental AdipocytesXIAO YIN, JAMES SWAIN, MICHAEL SARR, IAN LANZA, K.S. NAIR, MICHAEL D. JENSEN, Rochester, MN
Some investigators suggest that mitochondrial (MITO) dysfunction, in-cluding adipocyte MITO, contributes to obesity-related metabolic compli-cations. However, obese humans have larger adipocytes and the reported MITO defects might be related to cell size vs. obesity per se. Aim: To deter-mine whether obesity, cell size and fat depot determine MITO dysfunction in white adipose tissue. Methods: Omental (OM) and/or abdominal subcutane-ous (SQ) adipose tissue was collected from 20, age matched, non-diabetic men and women undergoing elective abdominal surgery or research needle biopsy. By separating large from small adipocytes (differential fl oatation) we isolated populations of large OM and SQ (0.50 ± 0.21 and 0.86 ± 0.18 μg lipid/cell) from lean adults that were not different from small populations from obese OM and SQ (0.46 ± 0.03 and 0.61 ± 0.06 μg lipid/cell). mtDNA-encoded NADH dehydrogenase 1 genes (ND1/28S) for both populations of cells was were measured using qPCR. MITO were isolated from each cell population for measurement of protein content, stage 2, 3, 4 and uncoupled MITO oxy-gen consumption rates (OCR) using a Clark-type oxygen electrode and citrate synthase (CS) activity. OCR and CS activity were normalized to MITO protein to allow comparison across groups. Results: mtDNA abundance was less (P = 0.02) in cells from obese vs. lean adults. SQ CS activity was greater in MITO from lean than obese (1.2 ± 0.18 vs. 0.56 ± 0.06 μmole/min/mg protein, respectively, P = 0.007) as was OM CS activity (1.0 ± 0.14 vs. 0.67 ± 0.11, respectively, P = 0.09) when matched for cell size. MITO OCR across all mea-sured phases of respiration were greater (all P < 0.05) in lean than obese OM and SQ when matched for fat cell size. MITO function and content were not signifi cantly different between small and large cell groups, between differ-ent depots or between men and women. Conclusions: Adipocyte MITO oxi-dative capacity and mtDNA copy number is decreased in non-diabetic obese vs. lean adults, which cannot be attributed to fat cell size differences.
Supported by: NIH
human miRNAs. The VAT and liver miRNA profi les were found to be distinct but overlapping. In liver of NAFLD, 8 miRNAs (miR-3663-5p, miRPlus-I137*, miR-576-5p, miR-3924, miR-892a, miR-106b, miR-103a-2*, miR-1282) were signifi cantly increased compared to liver in no NAFLD. In VAT of NAFLD, one miRNA, miR-192*, was signifi cantly up-regulated compared to VAT in no NA-FLD. Analysis of predicted miRNA target genes suggests that the differen-tial miRNA expression may downregulate insulin and IGF-1 signaling routes. These human data describe miRNAs in human liver and VAT and show that expression of miRNAs is altered in human NAFLD both in the liver and in VAT compared to subjects with no NAFLD. Studies in cultured hepatocytes and adipocytes are currently underway to explore the functional role of the miRNAs identifi ed.
165-ORObese Women Display Infl ammatory Changes in Liver Which Are Not Correlated to Hepatic Insulin Sensitivity or Liver Fat ContentBARBARA A. DE WEIJER, M. VAN EIJK, M.T. ACKERMANS, I. JANSSEN, F. BER-ENDS, A. VAN DE LAAR, A.P. HOUDIJK, E. FLIERS, A.J. NEDERVEEN, M.J. SERLIE, Amsterdam, The Netherlands, Alkmaar, The Netherlands
Obesity is associated with hepatic steatosis, hepatic insulin resistance and low grade infl ammation. Although liver infl ammatory markers, insulin re-sistance and liver fat were shown to be associated in animal models, this is less clear in humans. We studied liver fat content using 1H-MRS and insulin sensitivity using the hyperinsulinemic euglycemic clamp technique in obese women undergoing bariatric surgery. We compared the expression of he-patic infl ammatory markers between these women and a lean control group. We included 16 women (BMI 45 [39 - 51]kg/m2) scheduled for RYGB and 6 lean healthy women (BMI 22 [20 - 24]kg/m2) scheduled for elective cholecys-tectomy. In the obese women, basal EGP was 13.6 (10.3-18.1) μmol/kgFFM/min, insulin-mediated suppression of EGP was 79 (55 - 99)% peripheral glu-cose uptake was 25.9 (11.6- 42.5) μmol/kg/min and liver fat content was 8.5 (0-23.3)%. Basal EGP and Rd were not correlated with liver fat content while hepatic insulin sensitivity showed a signifi cant negative correlation. In liver biopsies, mRNA expression of the pro-infl ammatory markers TNF , CCL2, the anti-infl ammatory markers IL-10 and MR and macrophage markers CD68 and MIP1- were all signifi cantly increased compared to the lean controls (fi g.1). Within the obese group no correlation was seen between the expres-sion profi les and liver fat content, EGP, Rd or hepatic insulin sensitivity. In conclusion, morbidly obese women are characterized by an infl amed liver which is independent of liver fat content. Moreover, this infl ammatory state is not correlated to measures of insulin sensitivity.

A45
For author disclosure information, see page 797.ADA-Funded Research
ORA
LS
TARGETING HYPOGLYCEMIA
170-ORFinding Obesity Genes by Whole Exome Sequencing in a UK Cohort of Severely Obese ChildrenAUDREY E. HENDRICKS, Cambridge, United Kingdom
Within the UK10K project, we are undertaking whole exome sequencing (WES) in 1,000 patients from the Severe Childhood Onset Obesity Project (SCOOP). SCOOP consists of UK white patients with severe obesity (BMI Standard Deviation (SD) Score > 3) of early onset (< 10 years), a design that is enriched for rare, highly penetrant causes of obesity. Patients were se-lected for WES after known causes of obesity had been excluded on the basis of clinical phenotype, measurement of serum leptin, insulin/proinsulin, and sequencing of the MC4R gene, the most common monogenic form of obesity. Using Agilent SureSelect Human All Exon 50Mb array and Illumina HiSeq sequencing a mean target coverage of ~ 50x was achieved, 90% of the samples had 10x coverage for more than 80% of the target bases. We took the union of variants after calling with both GATK and SAMtools. We then fi ltered by several quality control (QC) measures (including 4 depth 2000, mapping quality > 25, strand bias -0.1). After this initial QC, ~ 50,000 non-reference, good quality variants were produced per subject. As an ini-tial analysis, we focused on rare variants residing in genes in one of three candidate lists: known to cause human obesity syndromes, strong biological candidates (disruption/overexpression associated with obesity in mice), and associated with obesity through hypothesis free approaches such as ge-nome-wide association study meta-analyses. We confi rmed subject specifi c variants that we found previously in this cohort using Sanger sequencing (including variants in MC4R, LEPR, SIM1), and identifi ed novel variants that are predicted to be deleterious; we are following these up in the probands and family members. Within Uk10K we are also undertaking WES in BMI extremes from UK population based cohorts. These parallel approaches will provide a large set of data on which further analyses, such as case-control association analysis, are planned.
Supported by: Wellcome Trust 091310/B/10/Z
TARGETING HYPOGLYCEMIA
171-ORCoronary Flow Reserve During Acute Hypoglycemia in Type 1 DiabetesRADZI M. NOH, NINIAN N. LANG, ALEX J. GRAVELING, AUDREY C. WHITE, CHIM C. LANG, DAVID E. NEWBY, BRIAN M. FRIER, Edinburgh, United Kingdom, Ab-erdeen, United Kingdom, Dundee, United Kingdom
Hypoglycemia exerts a profound hemodynamic effect through sym-pathoadrenal stimulation. Progressive microvascular dysfunction associat-ed with increasing duration of type 1 diabetes may compromise myocardial blood fl ow at times of stress. The present study evaluated coronary blood fl ow reserve during hypoglycemia in people with type 1 diabetes of differ-ing duration. Coronary blood fl ow velocity was evaluated in the left anterior descending coronary artery using trans-thoracic Doppler echocardiography before and during adenosine-induced microvascular hyperemia. Coronary Flow Reserve (CFR) is the maximum hyperemic blood fl ow velocity divided by baseline blood fl ow velocity and is a well-validated non-invasive mea-sure of coronary microvascular function. Ten non-diabetic control subjects and 16 adults with type 1 diabetes (6 <5 years; 10 >15 years duration) were studied (age range 20-46 years). CFR was measured (a) during euglycemia (4.5 mmol/L; 81 mg/dL) and (b) during hypoglycemia (2.5 mmol/L; 45 mg/dL) using a glucose-insulin clamp method. During euglycemia, there appeared to be a trend toward lower CFR in the diabetic group (diabetic vs. control group 3.69+0.6 vs. 4.00+0.87, p=0.07). The long-duration diabetic group had the lowest CFR during euglycemia (3.56+0.66). During hypoglycemia, CFR appeared to rise slightly in normal controls and fall further in those with diabetes such that CFR was lower in those with diabetes compared to non-diabetic controls (diabetic vs. control group 3.53+ 0.48 vs. 4.08 +0.81, p<0.05). In conclusion, diabetes is associated with impaired coronary micro-vascular function especially during acute hypoglycemia. This may enhance the propensity for myocardial ischemia in people with diabetes at times of hypoglycaemia and could explain the tendency to poorer cardiovascular out-comes observed in large randomised trials examining the effects of strict glycemic control.
Supported by: Scottish Chief Scientist Offi ce
168-ORHigh Serum Leptin Concentration is an Independent Feature of Indi vi-duals With Lower than Expected Resting Energy Expenditure (REE)GUIDO LATTUADA, FRANCESCA RAGOGNA, ELISABETTA DEVECCHI, GIANLUCA PERSEGHIN, Milan, Italy
Adipocytokines may play a role in the regulation of energy metabolism. To test this hypothesis we established whether lower than expected REE was associated with altered fasting serum adipocytokines concentrations in humans.We performed indirect calorimetry and measured serum leptin, adiponectin, resistin in 296 white normal-weight (n=129), over-weight (n=88) and obese (n=79) eu-thyroid individuals. The measured REE was normal-ized to the expected REE (Harris Benedict equation based on age, sex, body weight, height and ethnic group) and study subjects were segregated in tertiles of % of expected REE. Cut-offs were: < 97% (tertile 1), > 97% but < 102% (tertile 2) and > 102% of expected REE (tertile 3). Habitual physical activity index (PAI) at work, during sport and leisure time was assessed us-ing a questionnaire. Individuals in tertile 1 were more likely women, younger, and with higher fasting serum leptin and adiponectin concentrations with respect to tertiles 2 and 3 (p<0.0001 for all). They had lower sport PAI (p<0.0001), higher BMI (p<0.02), and in spite of these features lower fasting glucose (p<0.01), LDL- chol (p=0.04), triglycerides (p<0.02) and intra-hepatic fat content (1HMR-Spectroscopy) with respect to tertile 3. No difference in PAI at work and leisure time, respiratory quotient, insulin, HOMA-IR, ghrelin, resistin, FFA and TSH were found. Stepwise regression analyses selected the sport PAI (r=0.34; 12%) and sport PAI + leptin (r=0.40; 16%) as indepen-dent predictors of the % of expected REE. In conclusion low resting energy expenditure is independently associated with higher serum leptin refl ecting a compensatory adaptation for the low metabolic rates; whether this may be also responsible for the lower fasting serum glucose, LDL-chol and trig-lycerides that characterized these subjects theoretically at greater risk of obesity-related disorders is yet to be clarifi ed.
Supported by: Musazzi and Stellato families
169-ORA Variant in ACACB Associates With BMI and Gene ExpressionLIJUN MA, MARIANA MUREA, JAMES A. SNIPES, PAMELA J. HICKS, ALEJAN-DRA MARINELARENA, JACQUELINE KRÜGER, KURT A. LANGBERG, MEREDITH A. BOSTROM, JESSICA N. COOKE, DAISUKE SUZUKI, TETSUYA BABAZONO, TAKASHI UZU, SYDNEY C. TANG, ASHIS K. MONDAL, NEERAJ K. SHARMA, PE-TER A. ANTINOZZI, LAWRENCE L. RUDEL, MATTHEW DAVIS, SWAPAN K. DAS, JOHN S. PARKS, SAYUKO KOBES, MATTHIAS BLÜHER, MICHAEL STUMVOLL, DONALD W. BOWDEN, SHIRO MAEDA, ROBERT L. HANSON, PETER KOVACS, LESLIE J. BAIER, STEVEN C. ELBEIN, BARRY I. FREEDMAN, Winston-Salem, NC, Phoenix, AZ, Leipzig, Germany, Tokyo, Japan, Otsu, Japan, Hong Kong, China, Yo-kohama, Japan
The single nucleotide polymorphism (SNP) rs2268388 in the acetyl coen-zyme A carboxylase B gene (ACACB) is reproducibly associated with type 2 diabetic (T2D) nephropathy (DN) in multiple populations. ACACB knock-out mice are protected against obesity when fed a high-fat diet. This study explored relationships between rs2268388, BMI and gene expression. In a meta-analysis containing 4905 initially non-T2D individuals, rs2268388 (T allele) was associated with higher BMI (Stouffer p =0.0056), comprised of 512 non-T2D European American (EA) subjects from Utah and Arkansas (p= 0.096), 1146 German Caucasians (p=0.055), and 3247 Pima Indians (mixed model p=0.042 from 19718 longitudinal exams). Rs2268388 was not as-sociated with BMI in a large sample of T2D cases of Japanese (n=2720) and EA (n=1136) descents; however, the risk allele T for DN was associated with higher BMI in the subset of these subjects with BMI >30kg/m2: 568 EAs (additive p=0.049) and 196 Japanese (additive p=0.049) adjusting for age, gender, and diabetes duration. The association was strengthened in a meta-analysis that included additional 763 African Americans (AAs, p=0.09) and 48 Hong Kong Chinese (p=0.81) with T2D and BMI >30kg/m2 (Stouffer additive p=0.004; n=1575). We next assessed the effect of rs2268388 on gene expression in available tissue /cell samples. The T allele was asso-ciated with higher gene expression in transformed lymphocytes (p=0.05, Sanger HapMap in silico, n=162), adipose tissue in 41 EAs and 20 AAs with BMI >30kg/m2 (adjusted additive p=0.03, Illumina H12 array), and liver tis-sue (mixed model p=0.03, 25 bariatric surgery EA subjects examined by 75 Western blot tests, BMI >30kg/m2). The T allele was also associated with higher hepatic triglyceride levels (adjusted additive p=0.03, n= 38). These data support a role for ACACB in obesity and a conditional role for altered lipid metabolism in susceptibility to DN.
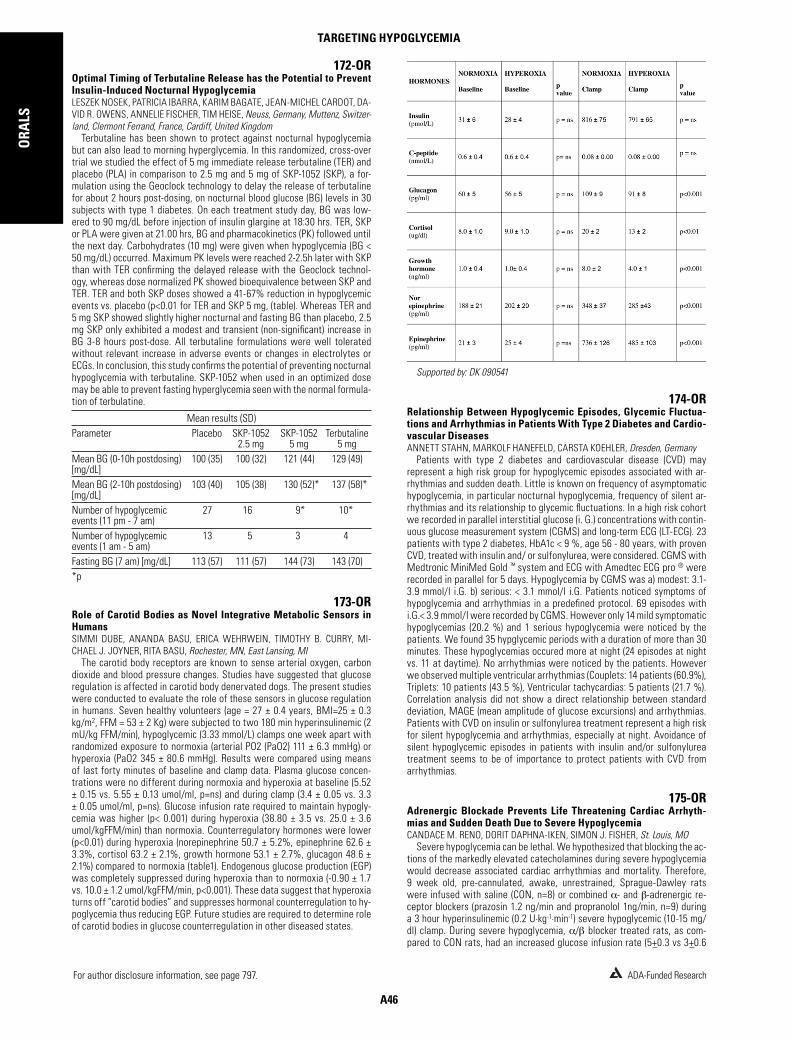
A46
For author disclosure information, see page 797. ADA-Funded Research
ORA
LSTARGETING HYPOGLYCEMIA
Supported by: DK 090541
174-ORRelationship Between Hypoglycemic Episodes, Glycemic Fluctua-tions and Arrhythmias in Patients With Type 2 Diabetes and Cardio-vascular DiseasesANNETT STAHN, MARKOLF HANEFELD, CARSTA KOEHLER, Dresden, Germany
Patients with type 2 diabetes and cardiovascular disease (CVD) may represent a high risk group for hypoglycemic episodes associated with ar-rhythmias and sudden death. Little is known on frequency of asymptomatic hypoglycemia, in particular nocturnal hypoglycemia, frequency of silent ar-rhythmias and its relationship to glycemic fl uctuations. In a high risk cohort we recorded in parallel interstitial glucose (i. G.) concentrations with contin-uous glucose measurement system (CGMS) and long-term ECG (LT-ECG). 23 patients with type 2 diabetes, HbA1c < 9 %, age 56 - 80 years, with proven CVD, treated with insulin and/ or sulfonylurea, were considered. CGMS with Medtronic MiniMed Gold ™ system and ECG with Amedtec ECG pro ® were recorded in parallel for 5 days. Hypoglycemia by CGMS was a) modest: 3.1-3.9 mmol/l i.G. b) serious: < 3.1 mmol/l i.G. Patients noticed symptoms of hypoglycemia and arrhythmias in a predefi ned protocol. 69 episodes with i.G.< 3.9 mmol/l were recorded by CGMS. However only 14 mild symptomatic hypoglycemias (20.2 %) and 1 serious hypoglycemia were noticed by the patients. We found 35 hypglycemic periods with a duration of more than 30 minutes. These hypoglycemias occured more at night (24 episodes at night vs. 11 at daytime). No arrhythmias were noticed by the patients. However we observed multiple ventricular arrhythmias (Couplets: 14 patients (60.9%), Triplets: 10 patients (43.5 %), Ventricular tachycardias: 5 patients (21.7 %). Correlation analysis did not show a direct relationship between standard deviation, MAGE (mean amplitude of glucose excursions) and arrhythmias. Patients with CVD on insulin or sulfonylurea treatment represent a high risk for silent hypoglycemia and arrhythmias, especially at night. Avoidance of silent hypoglycemic episodes in patients with insulin and/or sulfonylurea treatment seems to be of importance to protect patients with CVD from arrhythmias.
175-ORAdrenergic Blockade Prevents Life Threatening Cardiac Arrhyth-mias and Sudden Death Due to Severe HypoglycemiaCANDACE M. RENO, DORIT DAPHNA-IKEN, SIMON J. FISHER, St. Louis, MO
Severe hypoglycemia can be lethal. We hypothesized that blocking the ac-tions of the markedly elevated catecholamines during severe hypoglycemia would decrease associated cardiac arrhythmias and mortality. Therefore, 9 week old, pre-cannulated, awake, unrestrained, Sprague-Dawley rats were infused with saline (CON, n=8) or combined - and -adrenergic re-ceptor blockers (prazosin 1.2 ng/min and propranolol 1ng/min, n=9) during a 3 hour hyperinsulinemic (0.2 U·kg-1·min-1) severe hypoglycemic (10-15 mg/dl) clamp. During severe hypoglycemia, / blocker treated rats, as com-pared to CON rats, had an increased glucose infusion rate (5+0.3 vs 3+0.6
172-OROptimal Timing of Terbutaline Release has the Potential to Prevent Insulin-Induced Nocturnal HypoglycemiaLESZEK NOSEK, PATRICIA IBARRA, KARIM BAGATE, JEAN-MICHEL CARDOT, DA-VID R. OWENS, ANNELIE FISCHER, TIM HEISE, Neuss, Germany, Muttenz, Switzer-land, Clermont Ferrand, France, Cardiff, United Kingdom
Terbutaline has been shown to protect against nocturnal hypoglycemia but can also lead to morning hyperglycemia. In this randomized, cross-over trial we studied the effect of 5 mg immediate release terbutaline (TER) and placebo (PLA) in comparison to 2.5 mg and 5 mg of SKP-1052 (SKP), a for-mulation using the Geoclock technology to delay the release of terbutaline for about 2 hours post-dosing, on nocturnal blood glucose (BG) levels in 30 subjects with type 1 diabetes. On each treatment study day, BG was low-ered to 90 mg/dL before injection of insulin glargine at 18:30 hrs. TER, SKP or PLA were given at 21.00 hrs, BG and pharmacokinetics (PK) followed until the next day. Carbohydrates (10 mg) were given when hypoglycemia (BG < 50 mg/dL) occurred. Maximum PK levels were reached 2-2.5h later with SKP than with TER confi rming the delayed release with the Geoclock technol-ogy, whereas dose normalized PK showed bioequivalence between SKP and TER. TER and both SKP doses showed a 41-67% reduction in hypoglycemic events vs. placebo (p<0.01 for TER and SKP 5 mg, (table). Whereas TER and 5 mg SKP showed slightly higher nocturnal and fasting BG than placebo, 2.5 mg SKP only exhibited a modest and transient (non-signifi cant) increase in BG 3-8 hours post-dose. All terbutaline formulations were well tolerated without relevant increase in adverse events or changes in electrolytes or ECGs. In conclusion, this study confi rms the potential of preventing nocturnal hypoglycemia with terbutaline. SKP-1052 when used in an optimized dose may be able to prevent fasting hyperglycemia seen with the normal formula-tion of terbulatine.
Mean results (SD)Parameter Placebo SKP-1052
2.5 mgSKP-1052
5 mgTerbutaline
5 mgMean BG (0-10h postdosing) [mg/dL]
100 (35) 100 (32) 121 (44) 129 (49)
Mean BG (2-10h postdosing) [mg/dL]
103 (40) 105 (38) 130 (52)* 137 (58)*
Number of hypoglycemic events (11 pm - 7 am)
27 16 9* 10*
Number of hypoglycemic events (1 am - 5 am)
13 5 3 4
Fasting BG (7 am) [mg/dL] 113 (57) 111 (57) 144 (73) 143 (70)*p
173-ORRole of Carotid Bodies as Novel Integrative Metabolic Sensors in HumansSIMMI DUBE, ANANDA BASU, ERICA WEHRWEIN, TIMOTHY B. CURRY, MI-CHAEL J. JOYNER, RITA BASU, Rochester, MN, East Lansing, MI
The carotid body receptors are known to sense arterial oxygen, carbon dioxide and blood pressure changes. Studies have suggested that glucose regulation is affected in carotid body denervated dogs. The present studies were conducted to evaluate the role of these sensors in glucose regulation in humans. Seven healthy volunteers (age = 27 ± 0.4 years, BMI=25 ± 0.3 kg/m2, FFM = 53 ± 2 Kg) were subjected to two 180 min hyperinsulinemic (2 mU/kg FFM/min), hypoglycemic (3.33 mmol/L) clamps one week apart with randomized exposure to normoxia (arterial PO2 (PaO2) 111 ± 6.3 mmHg) or hyperoxia (PaO2 345 ± 80.6 mmHg). Results were compared using means of last forty minutes of baseline and clamp data. Plasma glucose concen-trations were no different during normoxia and hyperoxia at baseline (5.52 ± 0.15 vs. 5.55 ± 0.13 umol/ml, p=ns) and during clamp (3.4 ± 0.05 vs. 3.3 ± 0.05 umol/ml, p=ns). Glucose infusion rate required to maintain hypogly-cemia was higher (p< 0.001) during hyperoxia (38.80 ± 3.5 vs. 25.0 ± 3.6 umol/kgFFM/min) than normoxia. Counterregulatory hormones were lower (p<0.01) during hyperoxia (norepinephrine 50.7 ± 5.2%, epinephrine 62.6 ± 3.3%, cortisol 63.2 ± 2.1%, growth hormone 53.1 ± 2.7%, glucagon 48.6 ± 2.1%) compared to normoxia (table1). Endogenous glucose production (EGP) was completely suppressed during hyperoxia than to normoxia (-0.90 ± 1.7 vs. 10.0 ± 1.2 umol/kgFFM/min, p<0.001). These data suggest that hyperoxia turns off “carotid bodies” and suppresses hormonal counterregulation to hy-poglycemia thus reducing EGP. Future studies are required to determine role of carotid bodies in glucose counterregulation in other diseased states.

A47
For author disclosure information, see page 797.ADA-Funded Research
ORA
LS
TARGETING HYPOGLYCEMIA
177-ORThe Counterregulatory Response to Hypoglycemia is Positively Cor-related to Thalamic ActivationSILVIA MANGIA, AMIR MOHEET, FEDERICO DE MARTINO, NOLA TESFAYE, ANJALI KUMAR, PETE KOLLASCH, LYNN EBERLY, ELIZABETH SEAQUIST, Min-neapolis, MN
The thalamus has been identifi ed as a brain region involved in the sensing and coordination of the counterregulatory (CR) response to hypoglycemia (HG). Activation of this region is reduced during HG in patients with type 1 diabetes (T1DM) and HG unawareness relative to controls. However, the relationship between reduced activation and blunting of HG induced CR hor-mone secretions is unknown. Here we test the hypothesis that the magni-tude of thalamic activation during HG correlates with the magnitude of the CR response. Fifteen controls (7 M/8 F, age 43 ± 15 yrs, BMI 25 ± 5 kg/m2) and 15 patients (6 M/9 F, age 43 ± 14 yrs, BMI 27 ± 4 kg/m2) with well controlled T1DM (A1c 6.7 ± 0.4%) underwent a two step hyperinsulinemic (2.0 mU/kg/min) clamp while cerebral blood fl ow (CBF) weighted images were acquired at 3T using arterial spin labeling (ASL) technique to monitor cerebral acti-vation. Blood glucose was fi rst held at 95 mg/dl and then allowed to drop to 50 mg/dl. CBF weighted images were collected over 10 min, as soon as target glycemia was reached. Blood was collected at baseline and every 10 min during HG for measurement of CR hormones. Relative difference of CBF weighted ASL signals between euglycemia and HG were measured in the thalamus of each subject, and then correlated with the average values of CR hormones (e.g., epinephrine in fi gure) during HG. Our results demonstrate a positive correlation between thalamic response and epinephrine, growth hormone and cortisol responses to HG (r=0.62, p=0.0003; r=0.48, p=0.0079; r=0.46, p=0.011, respectively), confi rming that this region plays role in the coordination of the CR response to HG.
Supported by: NIH (BTRR-P41RR008079, P30 NS057091, R01 DK62440)
178-ORComparable Regional Brain Responses to Hypoglycemia by ASL and PETANA MARIA ARBELAEZ, YI SU, JEWELL B. THOMAS, BEAU M. ANCES, TAMARA HERSHEY, St. Louis, MO
As plasma glucose falls, different brain regions sense and modulate coun-terregulatory responses to changes in circulating glucose. The aim of this study was to determine if pulsed arterial spin labeling magnetic resonance imaging (PASL-MRI) provides a method for measuring absolute regional ce-rebral blood fl ow (rCBF) responses throughout the brain to changes in circu-lating glucose levels as reliably as positron emission tomography (PET). Nine non-diabetic volunteers underwent a hyperinsulinemic euglycemic (92+3 mg/dL) - hypoglycemic (53+1 mg/dL) clamp in which 2 runs of ASL and 4 of [15O]water PET were used to measure rCBF at each glucose level. Plasma glucose and counterregulatory hormones were measured during both study sessions and ROIs were defi ned for both methodologies using the FreeSurfer program. rCBF in the thalamus, medial prefrontal cortex, and globus pallidus signifi -cantly increased during hypoglycemia by both PASL and PET methodology. Our data suggest that PASL is reliable and feasible for measuring blood fl ow responses to hypoglycemia compared to PET. These data also underscore the presence of a brain network involved in the response to hypoglycemia that includes the thalamus, medial prefrontal cortex, and globus pallidus.
mg/kg/min, p<0.008), decreased heart rate (244+5 vs 358+5 BPM, p<0.001), and increased QTc to a lesser extent (134+3 vs 163+2 ms, p<0.001). Potas-sium levels fell to a similar degree in CON and / blocker rats (3.1+0.2 vs. 2.8+0.1 mmol, p=NS). Severe hypoglycemia induced mortality was 50% in CON rats, and remarkably, was 0% in / blocker treated rats (p<0.029). Continuous EKG analysis during severe hypoglycemia demonstrated that
/ blocker rats displayed no premature ventricular contractions, nor 1st or 2nd degree heart block arrhythmias frequently observed in CON rats. In sum-mary, blocking the actions of catecholamines during severe hypoglycemia provided a considerable survival advantage and prevented pre-terminal car-diac arrhythmias. We conclude that under studied conditions, lethal cardiac arrhythmias and sudden death induced by severe hypoglycemia were medi-ated by the counterregulatory sympathoadrenal response.
176-ORSomatostatin Receptor Type 2 Antagonism Improves Glucagon Counter regulatory Response to Hypoglycemia in Type 1 Diabetes BB RatsTAIRAN QIN, NEGAR KARIMIAN, MAYOWA OSUNDIJI, YACHI HUANG, DAVID H. COY, MLADEN VRANIC, HERBERT Y. GAISANO, Toronto, ON, Canada, New Orleans, LA
Impaired counterregulation during hypoglycemia in type 1 diabetes (T1D) is partly due to inadequate islet alpha-cell glucagon secretion, and this is a major limiting factor of intensive insulin treatment in diabetes. One of the reasons could be that the normal intra-islet somatostatin suppression of hypoglycemia-stimulated alpha-cell glucagon release becomes accentuated during T1D. We hypothesized that hypoglycemia can be prevented in autoim-mune T1D by selective somatostatin receptor type 2 (SSTR2) antagonism of alpha cells to relieve SSTR2 inhibition thereby increasing glucagon secretion. We have employed the Biobreeding diabetes prone (BBDP) rats, a model that closely mimics human autoimmune T1D. In the in vivo study, non-diabetic BBDP(N) and diabetic BBDP(D) rats underwent 3-h infusion of vehicle or SSTR2a during insulin-induced hypoglycemia clamped at 2.5±0.5mmol/l. D rats treated with SSTR2a needed 95% less glucose infusion than untreated D rats (p<0.05) to attain hypoglycemia, implying that attenuated glucagon response to hypoglycemia in diabetic BB rats was restored by SSTR2a. To monitor real-time glucagon secretory response directly, we developed a technique of thin slices of pancreas subjected to perifusion to changing conditions, specifi cally with control vehicle vs SSTR2a, then subjected to se-quential non-stimulatory 7mM glucose (G). This was followed by stimulatory 1mM G and 20mM arginine (7mM G). 30 uM SSTR2a treatment similarly en-hanced glucagon secretion from both N and D BBDP rat slices: 7mM G (by 1-2 fold), 1mM G (2-3 fold), and 20mM arginine (in 7mM G, by 2 fold) (p<0.001). Thus, somatostatin may contribute to impaired glucagon responsiveness to hypoglycemia in autoimmune T1D. We conclude that SSTR2 antagonism can enhance hypoglycemia-stimulated glucagon release suffi cient for normogly-cemic control.

A48
For author disclosure information, see page 797. ADA-Funded Research
ORA
LSIMPACT OF EXERCISE IN TYPE 1 AND TYPE 2 DIABETES
evaluate ORs for having a high liver enzyme based on physical activity. The risk for NAFLD was signifi cantly reduced in physically active groups with age- and sex-adjusted ORs of 0.62-0.78 for all BMI deciles except at BMI groups of <19.6 and 20.7-21.6 kg/m2. No difference was seen in BMI be-tween physically active and inactive subjects across the BMI deciles. How-ever, the values of body fat percentage and metabolic risk factors differed between physically active and inactive subjects across the BMI categories. Among NAFLD patients, physically active subjects had a lower risk for hav-ing elevated liver enzymes with multivariable adjusted OR of 0.85 (95 % CI 0.74-0.99, for AST) and 0.74 (95 % CI 0.67-0.81, for ALT) than did physically inactive subjects. Regular exercise was associated with a reduced risk for having NAFLD and decreased severity of disease, and this relationship was also independent of obesity.
181-ORImpact of Lifestyle Intervention on Sedentary Time in Subjects at High-Risk for DiabetesANDREA KRISKA, BONNY ROCKETTE-WAGNER, GEORGE A. BRAY, HERMES FLOREZ, SHARON EDELSTEIN, DEEPTI REDDY, MARY LOU CARRION-PETERSEN, DANA DABELEA, LINDA DELAHANTY, PAUL FRANKS, MARIA G. MONTEZ, RICH-ARD R. RUBIN, ELIZABETH M. VENDITTI, DPP RESEARCH GROUP, Pittsburgh, PA, Baton Rouge, LA, Miami, FL, Rockville, MD, La Jolla, CA, Aurora, CO, Boston, MA, Malmö, Sweden, San Antonio, TX, Baltimore, MD
Sedentary behavior, often estimated as time spent in activities with low energy expenditure such as watching TV and sitting at work, has been shown to be related to risk factors for diabetes and metabolic syndrome. Whether a lifestyle intervention effective in increasing physical activity would also impact on two of the key components of sedentary time is not known. The Diabetes Prevention Program examined this question in 3234 participants randomized to lifestyle intervention, metformin or placebo. The activity goal of the lifestyle intervention was to achieve 150 minutes per week of moderate-intensity activity. Both physical activity and sedentary behavior were estimated by questionnaire, with the latter being assessed
Quantitative regional cerebral blood fl ow (mL.100g-1. min-1) responses between euglycemia and hypoglycemia by PET and ASL. *p <0.05; THAL=thalamus, MPF=medial prefrontal cortex, GP=globus pallidus, AMYG=amygdala, ROPF=right orbitoprefrontal, HIPP=hippocampus, OCCIP=occipital.
Supported by: Children’s Discov. Inst. 1KL2RR024994-01 and WU Mallinckrodt Inst. Radiol. Pilot
IMPACT OF EXERCISE IN TYPE 1 AND TYPE 2 DIABETES
179-ORIncreased Skeletal Muscle Capillarization After Aerobic Exercise Training and Weight Loss Predicts Improved Insulin Sensitivity and Glucose Tolerance in Older Adults With IGTSTEVEN J. PRIOR, LYNDON JOSEPH, JACOB B. BLUMENTHAL, LESLIE I. KATZEL, ANDREW P. GOLDBERG, ALICE S. RYAN, Baltimore, MD
Transcapillary transport of insulin is one determinant of glucose uptake in skeletal muscle; thus, a reduction in capillary density (CD) may worsen in-sulin sensitivity and contribute to impaired glucose tolerance (IGT). Skeletal muscle CD is reduced in older adults with IGT compared to normal adults and may be modifi able through aerobic exercise training and weight loss (AEX+WL). We tested the hypothesis that 6-mo AEX+WL increases CD to increase insulin sensitivity (M) and improve glucose tolerance in older adults with IGT. Before and after 6-mo AEX+WL, 16 sedentary (VO2max = 1.8 ± 0.1 L/min), obese (BMI 32 ± 1 kg/m2; mean ± SEM), older (63 ± 2yrs) men (n = 8) and women (n = 8) with IGT underwent hyperinsulinemic-euglycemic clamps (3-hr, 80 mU/m2/min), OGTTs, exercise and body composition testing, and vastus lateralis skeletal muscle biopsies to determine CD. ANCOVA tested for differences before and after AEX+WL; regression analyses tested as-sociations between CD and metabolic variables. At baseline, 120-min post-prandial glucose (G120) inversely correlated with CD (r = -0.68, p < 0.01) and M directly correlated with CD (r = 0.69, p < 0.01). After AEX+WL, VO2max in-creased 12% (p = 0.02) and both weight and fat mass decreased by >7.5% (p < 0.02). Fat-free mass did not change (54.4 ± 3 vs. 53.8 ± 3 kg). CD increased 15% (264 ± 11 vs. 304 ± 12 cap/mm2, p < 0.01), M increased 20% (43.2 ± 4 vs. 51.7 ± 4 μmol/kgFFM/min, p < 0.05), and G120 decreased 16% (9.3 ± 0.4 vs. 7.8 ± 0.5 mmol/L, p = 0.02). The AEX+WL-induced increase in CD independently predicted the increase in M (r = 0.63 p < 0.05) as well as the decrease in G120 (r = -0.51, p < 0.05) in regression analyses accounting for age, sex, and baseline CD. We conclude that 6-mo AEX+WL increases skeletal muscle CD in older adults with IGT, and that the increase in CD contributes in part to improvements in insulin sensitivity and glucose tolerance.
180-ORRegular Exercise Reduces the Risk and Severity of Non-Alcoholic Fatty Liver Disease Independent of ObesityJI CHEOL BAE, JAE HYEON KIM, JI YOUNG JOUNG, KWANG-WON KIM, SUN-MI PARK, SANG-MAN JIN, YOON YOUNG CHO, MOON KYU LEE, Seoul, Republic of Korea
Non-alcoholic fatty liver disease (NAFLD) is associated with insulin re-sistance and obesity. We evaluated the role of physical activity in relation to obesity and insulin resistance as a primary contributor in the develop-ment and progression of NAFLD. A cross-sectional analysis was conducted in 72,359 healthy adults without diabetes who participated in a compre-hensive health check-up. All subjects were categorized into deciles based on their BMI level. We estimated the odds ratios (ORs) for having NAFLD according to physical activity in deciles. Among all subjects, patients with NAFLD (n=19,921) proven by ultrasonography were analyzed separately to

A49
For author disclosure information, see page 797.ADA-Funded Research
ORA
LS
IMPACT OF EXERCISE IN TYPE 1 AND TYPE 2 DIABETES
lipid data), p=0.027) and heart rate at submaximal exercise was increased (at lactate threshold: 115 ± 15 vs 125 ± 17, p=0.007; 127 ± 14, p=0.001). Ex-ercise parameters were signifi cantly correlated with GIR at baseline. VO2peak correlated positively (R2=0.44, p=0.016) and tau2 negatively (R2=0.41, p=0.019). In summary, acute induction of IR with lipid infusion is insuffi cient to fully recapitulate the substantial exercise defects observed in diabetes. IR does however impair submaximal exercise performance, cardiac effi cien-cy (increased HR/workload) and the ability to transition to increased oxygen demand. These data support a relationship between IR and specifi c defects in exercise performance.
Supported by: VA Merit Award
184-ORResistance Exercise in Already-Active Type 1 Diabetic Individuals: The READI TrialRONALD J. SIGAL, GLEN P. KENNY, BRUCE A. PERKINS, MICHAEL C. RIDDELL, GARY S. GOLDFIELD, REJEANNE GOUGEON, LOIS DONOVAN, JANINE MAL-COLM, FARAH KHANDWALA, THE READI TRIAL INVESTIGATORS, Calgary, AB, Canada, Ottawa, ON, Canada, Toronto, ON, Canada, Montreal, QC, Canada, Win-nipeg, MB, Canada
The Resistance Exercise in Already-active Diabetic Individuals (READI) trial was undertaken to determine the effects of resistance exercise (weight lifting) on A1C (primary outcome), body composition, lipids and hypoglyce-mia in physically active type 1 diabetic (T1D) adults. We recruited subjects who habitually performed >90 min/wk of vigorous aerobic exercise, or >150 min/wk of moderate-to-vigorous aerobic exercise. Before randomization, we stabilized subjects on therapy including multiple-dose insulin or insulin pump, carbohydrate (CHO) counting and frequent glucose monitoring. 131 subjects [49M/82F, age 37+12 (SD) yr, A1C 7.9+0.8%], were randomized to 22 wks of resistance exercise training (RT, n=71), 3 sets of 8 exercises at 8 rep max 3X/wk or control (C, no resistance exercise, n=60); both groups continued their usual aerobic exercise. Exercise training took place at lo-cal gyms, supervised by personal trainers. Pre-exercise CHO supplements and post-randomization insulin adjustments were done according to pre-specifi ed protocols. Analyses were intention-to-treat, using mixed model repeated measures. RESULTS: Strength increased signifi cantly more in RT than C (p<0.001 for each strength exercise). There were no signifi cant in-tergroup differences in A1C change (-0.10% in RT, -0.07% in C), lipids, or hypoglycemia frequency. There were 5 cases of hypoglycemia requiring as-sistance during the intervention period (3 in RT, 2 in control). The RT group had a signifi cantly greater decrease in waist circumference than C (-2.0 cm vs. -0.5 cm, p=0.023 between groups). Therefore, in people with T1D who were already aerobically active, the addition of resistance training increased strength and decreased waist circumference, but did not change A1C, lipids, or frequency of hypoglycemia.
Supported by: CIHR (MCT-80682)
185-OR
as reported hours per day spent watching TV (Sit-TV) and sitting at work (Sit-Work). At study end (average 3.2 yrs), both Sit-TV and Sit-Work decreased (p<0.05) in the lifestyle arm for all age (<40; 40-49; 50-59; 60+ yrs) and sex groups except the youngest age group. The range of means for all age and sex specifi c lifestyle groups decreased 0.4-0.5 hrs/day from baseline values of 2.15- 2.93 hrs/day for Sit-TV; and 0.1-0.4 hrs/day from baseline values of 3.99-4.98 hrs/day for Sit-Work. Compared with the other two arms, the lifestyle group increased over time in moderate physical activity levels and had greater decreases in both Sit-TV and Sit-Work (p< 0.05). However, in the oldest age group, signifi cant differences were noted only after eliminating those visits during which physical limitations to movement were reported. The DPP lifestyle intervention focused on increasing moderate intensity activity but also caused a residual decrease in sedentary behavior. Future research should investigate the impact of an intervention that more directly addresses sedentary behavior change.
Supported by: NIDDK (U01-DK048489)
182-ORDecreased Fetuin-A Correlates With Improved Glucose Tolerance After Short-Term Exercise Training in Adults With NAFLDSTEVEN K. MALIN, CIARAN FEALY, JACOB M. HAUS, MANGESH PAGADALA, AMANDA R. SCELSI, HAZEL HUANG, ARTHUR MCCULLOUGH, CHRIS FLASK, JOHN P. KIRWAN, Cleveland, OH
Fetuin-A is a hepatokine associated with non-alcoholic fatty liver disease (NAFLD) and type 2 diabetes. Reductions in body weight, hepatic triglyceride content (HTGC) and skeletal muscle insulin resistance are related to lower circulating fetuin-A levels. However, the effect of exercise on fetuin-A in-dependent of weight loss and lower HTGC is unknown. The purpose of this study was to determine the effect of short-term exercise training, during which we expected no change in body weight or HTGC, on plasma fetuin-A concentrations. Thirteen (50.5 ± 3.4 yr) obese adults (BMI = 33.3 ± 0.9 kg/m2) with NAFLD underwent 7-days of exercise training (60 min/d at ~85% HRmax). After an overnight fast, an oral glucose tolerance test was conduct-ed and blood was collected at 0, 30, 60, 90, 120 and 180 min before and after the intervention. The Matsuda Index and area under the curve (AUC) was used to assess insulin action and glucose tolerance. Magnetic Resonance Spectroscopy was used to determine HTGC before and after the intervention (subset n = 12). Exercise had no effect on body weight (97.1 ± 4.5 vs. 97.7 ± 4.6 kg; p < 0.12), (21.8 ± 4.3 vs. 21.2 ± 4.1%; p < 0.73), or aerobic fi tness (24.9 ± 1.9 vs. 26.3 ± 1.8 mg/kg/min; p < 0.14). Exercise increased insulin action by 25% (1.6 ± 0.3 vs. 1.9 ± 0.3; p < 0.05) and decreased glucose AUC by 13% (34798.5 ± 2068.4 vs. 31530.5 ± 1656.5 mg/dl-180min; p < 0.01). Importantly, exercise decreased fetuin-A concentrations by 10% (0.66 ± 0.05 vs. 0.56 ± 0.03 g/L; p < 0.02) and this change correlated with reduced glucose AUC (r = 0.58; p < 0.04). Independent of weight loss and HTGC, our fi ndings indicate that lower-ing fetuin-A may, in part, contribute to the exercise-induced improvement in glucose tolerance. Based on our ongoing work, we speculate that decreased fetuin-A may improve glucose regulation by accentuating skeletal muscle insulin signaling.
Supported by: NIH (RO1 AG12834 and UL1-RR024989)
183-OREffect of Acute Induction of Insulin Resistance on Exercise Para metersIRENE E. SCHAUER, LEAH HERLACHE, JUDITH G. REGENSTEINER, JANE E. RE-USCH, Aurora, CO
People with type 2 diabetes are sedentary despite the known associa-tion between fi tness and mortality. One factor may be the decreased func-tional exercise capacity associated with insulin resistance (IR) observed in people with diabetes. We hypothesized that acute induction of IR in lean young individuals would reproduce the exercise defects in diabetes attribut-able to IR. We recruited 18 young (29.4 ± 6.1yo), lean (BMI 23.3 ± 4.4), and sedentary to moderately active subjects with no evidence of IR. Subjects received infusions of saline vs low (45 ml/hr) and/or high dose (90 ml/hr) 20% lipid emulsion/heparin to induce IR. Insulin sensitivity (hyperinsuline-mic euglycemic clamp), endothelial function (brachial artery fl ow-mediated dilation), blood fl ow (venous plethysmography), and exercise parameters (bi-cycle ergometry) were measured after 6-8 hours of infusion. Lipid infusion elevated fatty acid levels (381 ± 162 vs 1094 ± 222 vs 2496 ± 425 μM) and induced IR (glucose infusion rate: 8.7 ± 2.9 vs 6.5 ± 2.2 vs 5.4 ± 1.8 mg/kg/min, p<0.0001) as expected. No signifi cant defects were noted in blood fl ow or endothelial function after lipid infusion. Peak exercise capacity was also unaffected (VO2peak 30 ± 6 vs 31 ± 5 vs 31 ± 6 ml/kg/min, p=0.91). However, oxygen uptake kinetics were slowed (tau2 = 30 ± 9 vs 35 ± 12 sec (combined
WITHDRAWN

A50
For author disclosure information, see page 797. ADA-Funded Research
ORA
LSPREGNANCY AND NEW METABOLIC MARKERS—IMPACT ON MATERNAL FETAL HEALTH
188-ORPlasma HDL is Associated With Endothelium-Dependent Microvas-cular Function in Pregnancy and is Reduced in Maternal ObesityDILYS J. FREEMAN, ELEANOR M. JARVIE, MURIEL J. CASLAKE, BRUCE A. GRIF-FIN, Glasgow, United Kingdom, Guildford, United Kingdom
Maternal vascular function is improved in healthy pregnancy and compro-mised in obesity and obesity-associated pregnancy complications such as gestational diabetes mellitus. Cardiovascular research shows that HDL pro-tects vascular function via anti-oxidant and anti-infl ammatory mechanisms. Our aim was to assess whether HDL might protect vascular function in preg-nancy and whether this is compromised in maternal obesity in a longitudinal study of 55 mothers with a range of BMI (18-46kg/m2) sampled at 12, 25 & 35 weeks’ gestation and 17 weeks post partum. HDL cholesterol levels were 0.19mmol/L higher by 12 weeks compared to non-pregnant levels (P<0.001) and were maintained throughout pregnancy. Maternal BMI had a signifi cant impact on HDL levels (P<0.001) with lean individuals reaching a maximum of 1.51 [0.42] and obese 1.36 [0.29] mmol/L. We have previously shown in these subjects that endothelium-dependent microvascular function (EDMVF) as assessed by laser Doppler iontophoresis is signifi cantly lower in obese compared to non-obese women. Across all time points HDL was correlated with EDMVF (r=0.24, P<0.001) and the gestational change in HDL explained 18% (P=0.013) of the variance in gestational change in EDMVF independent of maternal age, BMI, parity and smoking. Plasma markers of infl ammation (IL-6, TNFalpha, CRP) and endothelial activation (sICAM-1, sVCAM-1, PAI-1) were not associated with plasma HDL levels. The gestational change in lipo-protein lipase (LPL) mass was positively correlated with the change in HDL (r=0.55, P<0.001) and negatively with change in very low density lipoprotein (VLDL)-2 triglyceride (r=-045, P=0.010) consistent with current knowledge that LPL activity generates much of the lipid that forms HDL. The relationship between plasma HDL levels and markers of oxidation are under investiga-tion. HDL may afford vascular protection during pregnancy but we provide no evidence that this is via anti-infl ammatory mechanisms.
Supported by: Wellbeing of Women, BMA OHRT
186-ORContraction Stimulates IL-6 Release from Skeletal Muscle Fibers via an AMPK 2 Independent MechanismHANS P. LAURITZEN, JOSEF BRANDAUER, PETER SCHJERLING, HENRIK GALBO, LAURIE J. GOODYEAR, Boston, MA, Gettysburg, PA, Copenhagen, Denmark
Recent studies suggest that Interleukin 6 (IL-6) is released from contracting muscles during exercise. However, the precise cellular origins of IL-6 within the muscle, the secretion kinetics, and the signaling mechanisms regulating secretion are not known. The aims of this study were to: 1) determine IL-6 protein level and localization in rested and contracted intact mouse muscle fi bers; 2) determine the kinetics of contraction-induced IL-6 secretion in liv-ing muscle fi bers in situ; and 3) determine if AMPK activation and increased intracellular calcium cause IL-6 secretion in living muscle fi bers in situ. Con-focal imaging was used to visualize endogenous IL-6 protein in fi xed muscle fi bers. In addition, intact quadriceps muscles were transfected in situ with EGFP-tagged IL-6 and the kinetics of IL-6 secretion was determined in re-sponse to 25 min of in situ contractions, AICAR (AMPK activator), or caffeine (Ca2+ release agent). Under basal conditions IL-6 protein was found in small vesicle structures distributed throughout the muscle fi bers. Contractions reduced IL-6 containing vesicles by 62% (p<0.05). Kinetic image analysis of IL-6-EGFP vesicles in muscle fi bers in vivo showed that contraction-induced IL-6 reduction occurred gradually over a 25 min contraction period. Similar to contraction, AICAR (iv: 1 gr/kg) resulted in a 45% decrease of IL-6-EGFP vesicles; however, contraction-mediated IL-6-EGFP reduction was normal in muscle specifi c AMPK 2 inactive transgenic mice. Caffeine had no effect on IL-6-EGFP reduction. In conclusion, resting skeletal muscle fi bers contain a depot of IL-6 containing vesicles. AICAR and muscle contractions gradually reduce IL-6 protein in the muscle fi bers, although the effect of contraction to release IL-6 occurs through an AMPK 2-independent mechanism.
Supported by: NIH (R01AR45670 and R01DK68626)
PREGNANCY AND NEW METABOLIC MARKERS—IMPACT ON MATERNAL FETAL HEALTH
187-ORHigher Carbohydrate vs. Higher Fat Diet in Gestational Diabetes: A Randomized StudyTERI L. HERNANDEZ, RACHAEL E. VANPELT, MOLLY A. KRAUSE, MELANIE S. RE-ECE, WILLIAM T. DONAHOO, ARCHANA MANDE, JACOB E. FRIEDMAN, LINDA A. BARBOUR, Aurora, CO, Denver, CO
The practice of advising a low carbohydrate (carb), thus higher fat, diet in the treatment of gestational diabetes mellitus (GDM) is controversial given data that maternal lipids infl uence fetal growth. We tested the hypothesis that a higher complex carb/lower fat diet (HC/LF) would result in higher postprandial (PP) glucose (BG), but an overall 24-hr BG area-under-the-curve (AUC) similar to a low carb/higher fat diet (LC/HF), with lower postprandial lipids. In a randomized cross-over study, women with diet-controlled GDM consumed a prepared HC/LF (60% CHO, 25% fat, 15% protein) and a LC/HF (40%, 45%, 15%), equivalent in calories, for 3 days each (washout in be-tween) while wearing a continuous glucose monitor (CGM). On day 4 of each, PP lipemia was measured hourly after breakfast (30% of total daily calories). In 10 women (Mean±SEM; BMI 33.6±1.5kg/m2; 30.4±0.5wks gestation), the HC/LF resulted in modestly higher 1- and 2-hr PP BG compared to the LC/HF (CGM; 115±3 vs 106±3, p=0.009, and 108±5 vs 98±3mg/dL, p=0.01, respec-tively, Fig 1A); all values were lower than recommended targets. The 24-hr BG AUC was slightly higher on the HC/LF diet (p<0.005), but there was no difference in nocturnal or fasting BG and the BG patterns were remarkably similar. Although both diets were low in saturated fat, the PP 5-hr FFA AUC was higher on the LC/HF diet (p=0.005, Fig 1B) potentially worsening mater-nal insulin resistance and providing excess fuel for fetal growth. These pilot data from the fi rst RCT of its kind require extension until delivery to discern whether the conventional GDM diet could have unintended metabolic con-sequences in the mother and offspring.
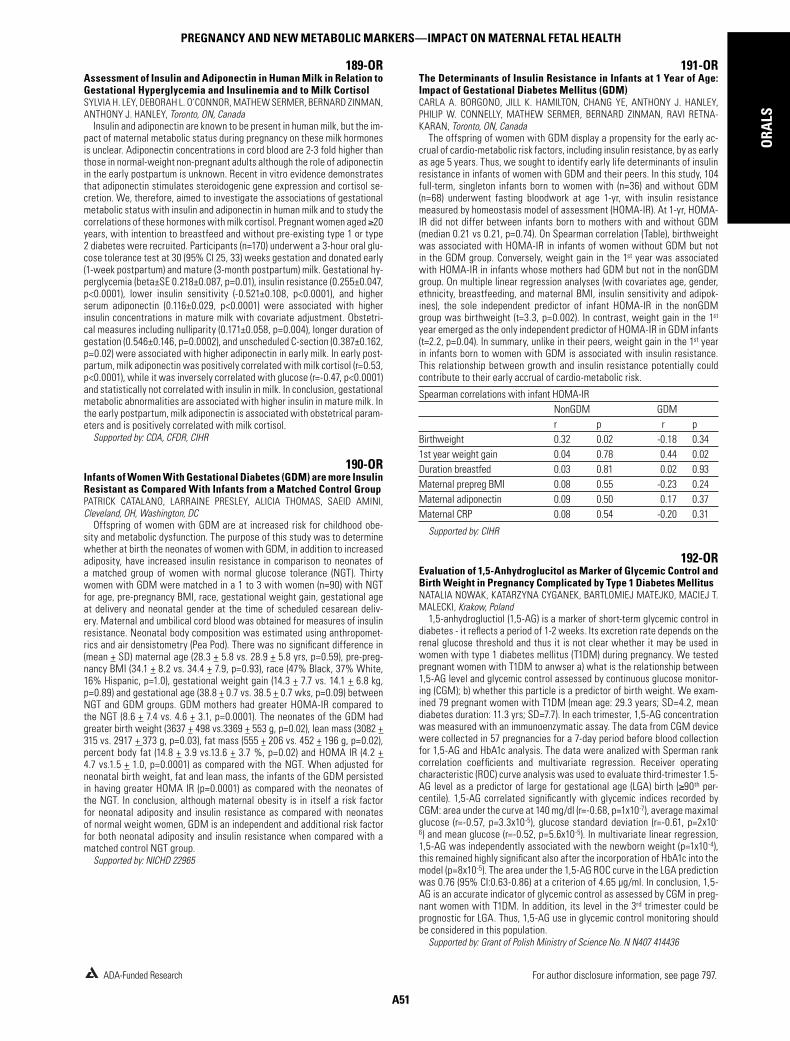
A51
For author disclosure information, see page 797.ADA-Funded Research
ORA
LS
PREGNANCY AND NEW METABOLIC MARKERS—IMPACT ON MATERNAL FETAL HEALTH
191-ORThe Determinants of Insulin Resistance in Infants at 1 Year of Age: Impact of Gestational Diabetes Mellitus (GDM)CARLA A. BORGONO, JILL K. HAMILTON, CHANG YE, ANTHONY J. HANLEY, PHILIP W. CONNELLY, MATHEW SERMER, BERNARD ZINMAN, RAVI RETNA-KARAN, Toronto, ON, Canada
The offspring of women with GDM display a propensity for the early ac-crual of cardio-metabolic risk factors, including insulin resistance, by as early as age 5 years. Thus, we sought to identify early life determinants of insulin resistance in infants of women with GDM and their peers. In this study, 104 full-term, singleton infants born to women with (n=36) and without GDM (n=68) underwent fasting bloodwork at age 1-yr, with insulin resistance measured by homeostasis model of assessment (HOMA-IR). At 1-yr, HOMA-IR did not differ between infants born to mothers with and without GDM (median 0.21 vs 0.21, p=0.74). On Spearman correlation (Table), birthweight was associated with HOMA-IR in infants of women without GDM but not in the GDM group. Conversely, weight gain in the 1st year was associated with HOMA-IR in infants whose mothers had GDM but not in the nonGDM group. On multiple linear regression analyses (with covariates age, gender, ethnicity, breastfeeding, and maternal BMI, insulin sensitivity and adipok-ines), the sole independent predictor of infant HOMA-IR in the nonGDM group was birthweight (t=3.3, p=0.002). In contrast, weight gain in the 1st
year emerged as the only independent predictor of HOMA-IR in GDM infants (t=2.2, p=0.04). In summary, unlike in their peers, weight gain in the 1st year in infants born to women with GDM is associated with insulin resistance. This relationship between growth and insulin resistance potentially could contribute to their early accrual of cardio-metabolic risk.
Spearman correlations with infant HOMA-IRNonGDM GDMr p r p
Birthweight 0.32 0.02 -0.18 0.341st year weight gain 0.04 0.78 0.44 0.02Duration breastfed 0.03 0.81 0.02 0.93Maternal prepreg BMI 0.08 0.55 -0.23 0.24Maternal adiponectin 0.09 0.50 0.17 0.37Maternal CRP 0.08 0.54 -0.20 0.31
Supported by: CIHR
192-OREvaluation of 1,5-Anhydroglucitol as Marker of Glycemic Control and Birth Weight in Pregnancy Complicated by Type 1 Diabetes MellitusNATALIA NOWAK, KATARZYNA CYGANEK, BARTLOMIEJ MATEJKO, MACIEJ T. MALECKI, Krakow, Poland
1,5-anhydrogluctiol (1,5-AG) is a marker of short-term glycemic control in diabetes - it refl ects a period of 1-2 weeks. Its excretion rate depends on the renal glucose threshold and thus it is not clear whether it may be used in women with type 1 diabetes mellitus (T1DM) during pregnancy. We tested pregnant women with T1DM to anwser a) what is the relationship between 1,5-AG level and glycemic control assessed by continuous glucose monitor-ing (CGM); b) whether this particle is a predictor of birth weight. We exam-ined 79 pregnant women with T1DM (mean age: 29.3 years; SD=4.2, mean diabetes duration: 11.3 yrs; SD=7.7). In each trimester, 1,5-AG concentration was measured with an immunoenzymatic assay. The data from CGM device were collected in 57 pregnancies for a 7-day period before blood collection for 1,5-AG and HbA1c analysis. The data were analized with Sperman rank correlation coeffi cients and multivariate regression. Receiver operating characteristic (ROC) curve analysis was used to evaluate third-trimester 1.5-AG level as a predictor of large for gestational age (LGA) birth ( 90th per-centile). 1,5-AG correlated signifi cantly with glycemic indices recorded by CGM: area under the curve at 140 mg/dl (r=-0.68, p=1x10⁻⁷), average maximal glucose (r=-0.57, p=3.3x10⁻⁵), glucose standard deviation (r=-0.61, p=2x10-
6) and mean glucose (r=-0.52, p=5.6x10⁻⁵). In multivariate linear regression, 1,5-AG was independently associated with the newborn weight (p=1x10⁻⁴), this remained highly signifi cant also after the incorporation of HbA1c into the model (p=8x10⁻⁵). The area under the 1,5-AG ROC curve in the LGA prediction was 0.76 (95% CI:0.63-0.86) at a criterion of 4.65 μg/ml. In conclusion, 1,5-AG is an accurate indicator of glycemic control as assessed by CGM in preg-nant women with T1DM. In addition, its level in the 3rd trimester could be prognostic for LGA. Thus, 1,5-AG use in glycemic control monitoring should be considered in this population.
Supported by: Grant of Polish Ministry of Science No. N N407 414436
189-ORAssessment of Insulin and Adiponectin in Human Milk in Relation to Gestational Hyperglycemia and Insulinemia and to Milk CortisolSYLVIA H. LEY, DEBORAH L. O’CONNOR, MATHEW SERMER, BERNARD ZINMAN, ANTHONY J. HANLEY, Toronto, ON, Canada
Insulin and adiponectin are known to be present in human milk, but the im-pact of maternal metabolic status during pregnancy on these milk hormones is unclear. Adiponectin concentrations in cord blood are 2-3 fold higher than those in normal-weight non-pregnant adults although the role of adiponectin in the early postpartum is unknown. Recent in vitro evidence demonstrates that adiponectin stimulates steroidogenic gene expression and cortisol se-cretion. We, therefore, aimed to investigate the associations of gestational metabolic status with insulin and adiponectin in human milk and to study the correlations of these hormones with milk cortisol. Pregnant women aged 20 years, with intention to breastfeed and without pre-existing type 1 or type 2 diabetes were recruited. Participants (n=170) underwent a 3-hour oral glu-cose tolerance test at 30 (95% CI 25, 33) weeks gestation and donated early (1-week postpartum) and mature (3-month postpartum) milk. Gestational hy-perglycemia (beta±SE 0.218±0.087, p=0.01), insulin resistance (0.255±0.047, p<0.0001), lower insulin sensitivity (-0.521±0.108, p<0.0001), and higher serum adiponectin (0.116±0.029, p<0.0001) were associated with higher insulin concentrations in mature milk with covariate adjustment. Obstetri-cal measures including nulliparity (0.171±0.058, p=0.004), longer duration of gestation (0.546±0.146, p=0.0002), and unscheduled C-section (0.387±0.162, p=0.02) were associated with higher adiponectin in early milk. In early post-partum, milk adiponectin was positively correlated with milk cortisol (r=0.53, p<0.0001), while it was inversely correlated with glucose (r=-0.47, p<0.0001) and statistically not correlated with insulin in milk. In conclusion, gestational metabolic abnormalities are associated with higher insulin in mature milk. In the early postpartum, milk adiponectin is associated with obstetrical param-eters and is positively correlated with milk cortisol.
Supported by: CDA, CFDR, CIHR
190-ORInfants of Women With Gestational Diabetes (GDM) are more Insulin Resistant as Compared With Infants from a Matched Control GroupPATRICK CATALANO, LARRAINE PRESLEY, ALICIA THOMAS, SAEID AMINI, Cleveland, OH, Washington, DC
Offspring of women with GDM are at increased risk for childhood obe-sity and metabolic dysfunction. The purpose of this study was to determine whether at birth the neonates of women with GDM, in addition to increased adiposity, have increased insulin resistance in comparison to neonates of a matched group of women with normal glucose tolerance (NGT). Thirty women with GDM were matched in a 1 to 3 with women (n=90) with NGT for age, pre-pregnancy BMI, race, gestational weight gain, gestational age at delivery and neonatal gender at the time of scheduled cesarean deliv-ery. Maternal and umbilical cord blood was obtained for measures of insulin resistance. Neonatal body composition was estimated using anthropomet-rics and air densistometry (Pea Pod). There was no signifi cant difference in (mean + SD) maternal age (28.3 + 5.8 vs. 28.9 + 5.8 yrs, p=0.59), pre-preg-nancy BMI (34.1 + 8.2 vs. 34.4 + 7.9, p=0.93), race (47% Black, 37% White, 16% Hispanic, p=1.0), gestational weight gain (14.3 + 7.7 vs. 14.1 + 6.8 kg, p=0.89) and gestational age (38.8 + 0.7 vs. 38.5 + 0.7 wks, p=0.09) between NGT and GDM groups. GDM mothers had greater HOMA-IR compared to the NGT (8.6 + 7.4 vs. 4.6 + 3.1, p=0.0001). The neonates of the GDM had greater birth weight (3637 + 498 vs.3369 + 553 g, p=0.02), lean mass (3082 + 315 vs. 2917 + 373 g, p=0.03), fat mass (555 + 206 vs. 452 + 196 g, p=0.02), percent body fat (14.8 + 3.9 vs.13.6 + 3.7 %, p=0.02) and HOMA IR (4.2 + 4.7 vs.1.5 + 1.0, p=0.0001) as compared with the NGT. When adjusted for neonatal birth weight, fat and lean mass, the infants of the GDM persisted in having greater HOMA IR (p=0.0001) as compared with the neonates of the NGT. In conclusion, although maternal obesity is in itself a risk factor for neonatal adiposity and insulin resistance as compared with neonates of normal weight women, GDM is an independent and additional risk factor for both neonatal adiposity and insulin resistance when compared with a matched control NGT group.
Supported by: NICHD 22965

A52
For author disclosure information, see page 797. ADA-Funded Research
ORA
LSTYPE 1 DIABETES—21ST CENTURY UPDATE ON INCIDENCE, CENTRAL NERVOUS SYSTEM EFFECTS, AND METABOLISM
TYPE 1 DIABETES—21ST CENTURY UPDATE ON INCIDENCE, CENTRAL NERVOUS SYSTEM EFFECTS,
AND METABOLISM
195-ORTrends in Incidence of Type 1 Diabetes Among Non-Hispanic White (NHW) Youth in the US, 2002–2009JEAN M. LAWRENCE, RONNY A. BELL, DANA DABELEA, LAWRENCE M. DOLAN, GIUSEPPINA IMPERATORE, GEORGEANNA J. KLINGENSMITH, BARBARA LINDER, ELIZABETH MAYER-DAVIS, DAVID J. PETTITT, CATHERINE PIHOKER, SHARON SAYDAH, DEBRA A. STANDIFORD, JENNIFER W. TALTON, JOAN THOMAS, RALPH B. D’AGOSTINO JR., FOR THE SEARCH FOR DIABETES IN YOUTH STUDY GROUP, Pasadena, CA, Winston-Salem, NC, Aurora, CO, Cincinnati, OH, Atlanta, GA, Bethesda, MD, Chapel Hill, NC, Santa Barbara, CA, Seattle, WA, Hyattsville, MD
Although type 1 diabetes (T1D) incidence is increasing in several countries, US data are limited. The SEARCH Study identifi ed persons newly-diagnosed with diabetes from 2002 onward using multiple sources and a consistent timeframe. We report trends in incidence of T1D among NHW youth age < 20 years in the US from between 2002 and 2009. Cases are NHW youth with physician-diagnosed T1D from centers in Ohio, Colorado, Washington, South Carolina, or California; denominators are age- and sex-specifi c estimates of year-end population using US census data (OH, CO, WA, SC) and membership counts (CA). Age- and sex- specifi c T1D incidence rates per 100,000 and 95% CI were calculated from pooled data. Poisson regression was used to test for trends in incidence. In total, 5,796 NHW youth with T1D (range 668-780/year) were identifi ed from 2.9 million NHW youth annually. Case complete-ness was > 96% and stable over time. The incidence of T1D was 24.1 (95% CI 22.4-25.9) in 2002 and 27.2 (95% CI 25.4-29.2) in 2009 (Figure). After adjust-ing for age and sex, a signifi cant increase in T1D incidence was observed (2.7% relative increase/year, p<0.002). In age-specifi c models adjusted for sex, incidence increased in 5-9 (p<0.02) and 10-14 year olds (p<0.001) but not in 0-4 (p<0.20) or 15-19 year olds (p<0.08). Among 5-9 year olds, the trend was signifi cant for males (p<0.008) but not females (p<0.06); for 10-14 year olds, it was signifi cant for both sexes (p<0.02 and p<0.001, respectively). More time may be needed to detect trends for lower incidence age groups. Our fi ndings suggest an overall increase in T1D incidence from 2002-2009 among US NHW youth.
Supported by: The CDC with support from the NIDDK
196-ORDysregulation of -cell Function in Youth During the First 2 Years of T1D: Reciprocal Abnormalities in Glucagon Responses to Mixed Meal Feedings and HypoglycemiaJENNIFER SHERR, EVA TSALIKIAN, LARRY FOX, BRUCE BUCKINGHAM, STUART WEINZIMER, WILLIAM TAMBORLANE, NEIL H. WHITE, ANA MARIA ARBELAEZ, CRAIG KOLLMAN, DONGYUAN XING, KATRINA RUEDY, DIABETES RESEARCH IN CHILDREN NETWORK (DIRECNET), New Haven, CT, Iowa City, IA, Jacksonville, FL, Stanford, CA, St. Louis, MO, Tampa, FL
Inappropriate increases in glucagon with meals and reduced glucagon responses to hypoglycemia play important roles in the wide swings in glu-cose in youth with Type 1 diabetes (T1D). Little is known about the evolution of these reciprocal abnormalities in -cell function early in the course of T1D. Mixed meal tolerance tests (MMTT) and hypoglycemic clamps (glucose lowered to 55 mg/dl) were performed in 25 youth with T1D (9-18 yrs) who had a 1.5-12 months duration of T1D(Year 1); studies were repeated 1 year
193-ORHuman Placental LPL Activity is Strongly Associated With Infant Adiposity at BirthMARGARET J. HEERWAGEN, BECKY A. DELAHOUSSAYE, MOLLY A. KRAUSE, ANITA KRAMER, BARBRA FISHER, MELANIE S. REECE, VIRGINIA D. WINN, RA-CHEL VANPELT, DALAN R. JENSEN, JACOB E. FRIEDMAN, TERI L. HERNANDEZ, LINDA A. BARBOUR, Aurora, CO
The role of maternal lipids as a major contributor to fetal fat accretion is becoming increasingly recognized, but little is known about mechanisms regulating lipid transport across the placenta. Placental lipoprotein lipase (LPL) is thought to be the major lipase involved in the uptake and delivery of maternal triglyceride (TG) to the fetus, however its activity in relation to infant adiposity is unstudied. Immediately after term delivery, placental samples were obtained in 8 normal glucose tolerant women (pre-pregnancy BMI 20-34) and villous heparin releasable LPL activity was measured using a 14C-triolene substrate. Results were normalized to an internal standard, and adjusted for gestational age. Infant adiposity at birth was determined by skin fold thickness at 2 days of age. Placental LPL activity, as determined by villous activity per gram multiplied by placental weight, was strongly as-sociated with infant adiposity (R2=0.84; p=0.002), but not infant birth weight (BW). Placental weight alone was also associated infant adiposity (R2=0.71, p=0.02), and as expected correlated with infant BW (r=0.72, p=0.04). Villous LPL activity was most strongly associated with the change in maternal fast-ing insulin and the change in maternal insulin resistance (IR) (HOMA-IR) from early (14-16 wk) to late (37 wk) gestation (R2=0.83,p=0.02; R2=0.89,p=0.017 respectively). This increase in maternal IR was also strongly correlated with late gestation levels of maternal fasting TG (r=0.73, 0.006). Our pilot data suggest that increased maternal insulin resistance and plasma insulin con-centrations from early to late gestation may not only drive lipid substrate availability to the placenta, but may also increase the rate of substrate deliv-ery to the fetus via placental TG hydrolysis. Corroboration of these fi ndings in a larger group of women with obesity or gestational diabetes may provide a novel mechanism to explain excess infant adiposity in pregnancies charac-terized with and without nutritional excess.
Supported by: NIH (RO1 DK078645)
194-ORGenome-Wide Signifi cant Associations With Maternal Glycemia During Pregnancy in Two Novel Genes: HKDC1 and BACE2M.G. HAYES, DOUGLAS A. SCHEFTNER, JEAN MORRISON, DAVID LEVINE, CAITLIN P. MCHUGH, LYNN P. LOWE, ANNA PLUZHNIKOV, MARGRIT URBANEK, LOREN L. ARMSTRONG, CHRISTINE M. ACKERMAN, DANIEL B. MIREL, KIM-BERLY F. DOHENY, ALAN R. DYER, BOYD E. METZGER, NANCY J. COX, WILLIAM L. LOWE, FOR THE HAPO STUDY COOPERATIVE RESEARCH GROUP, Chicago, IL, Seattle, WA, Cambridge, MA, Baltimore, MD
The multicenter, multiethnic and international Hyperglycemia and Ad-verse Pregnancy Outcome (HAPO) study examined associations of maternal glucose levels with fetal growth and outcomes in >25,000 pregnant women. Using Illumina 610 and 1M platforms, we conducted a genome-wide asso-ciation study in 1,382 Northern European-ancestry, 847 Mexican American, 1,087 Afro-Caribbean, and 1,200 Thai HAPO mothers to determine genetic associations with maternal glycemia (fasting [FPG], 1-hr [1HPG], 2-hr [2HPG] plasma glucose) and insulin secretion (fasting [FCP] C-peptide) from an oral glucose tolerance test (OGTT) at ~28 weeks gestation. Associations were assessed with linear regression under an additive genetic model adjust-ing for confounders (mother’s age, BMI, height, mean arterial pressure and gestational age at OGTT, parity, fi eld center and ancestry) using genotyped and imputed SNPs (cosmopolitan HapMap II reference panel). Results from cohorts were then combined through meta-analyses weighting each stratum by sample size. We replicated known associations of PCSK1 (FPG), PPP1R3B(FPG, FCP), MTNR1B (FPG, 1HPG), and GCKR (FCP) and identifi ed two novel genes associated at a genome-wide signifi cance level of p<5x10⁻⁸. The lead SNP in HKDC1 (hexokinase domain containing 1), rs5030938, was associated with increased 2HPG (0.16-0.20 mg/dL per T allele; p=5.7x10⁻¹⁵), and found in a region of high LD upstream from the fi rst intron of HKDC1. Based on sequence homology, HKDC1 is predicted to have hexokinase activity. The other novel fi nding was rs6517656 in BACE2, which was associated with in-creased FCP (0.05-0.15 μg/L per G allele; p=3.1x10⁻⁸). BACE2 has been shown to modulate glucose stimulated insulin secretion in human islets. These data demonstrate two new loci for metabolic traits and raise the possibility that some genetic loci different from those published in nonpregnant populations may impact glucose metabolism in pregnancy.

A53
For author disclosure information, see page 797.ADA-Funded Research
ORA
LS
TYPE 1 DIABETES—21ST CENTURY UPDATE ON INCIDENCE, CENTRAL NERVOUS SYSTEM EFFECTS, AND METABOLISM
198-ORCognitive and Behavioral Differences in Young Children With Type 1 Diabetes Mellitus: Preliminary ResultsTAMARA HERSHEY, ALLISON CATO, AIDEN BONDURANT, TANDY AYE, AMY CONRAD, JODIE AMBROSINO, NEIL H. WHITE, NELLY MAURAS, CRAIG KOLL-MAN, KATRINA RUEDY, DONGYUAN XING, DIABETES RESEARCH IN CHILDREN NETWORK (DIRECNET), St. Louis, MO, Jacksonville, FL, Stanford, CA, Iowa City, IA, New Haven, CT, Tampa, FL
Retrospective studies of cognitive function in type 1 diabetes mellitus (T1DM) commonly fi nd that diagnosis during early childhood is associated with poorer neuropsychological outcome. The objective of this preliminary analysis was to determine whether there are neuropsychological differenc-es between young children with T1DM and non-diabetic controls. Five Direc-Net sites tested 128 children aged 4 to 9 years (T1DM, n=73, median (inter-quartiles) diabetes duration=2.3 (1.1, 4.2) years; Controls, n=55) on standard neuropsychological tests. Age and gender distribution were not different across the two groups (T1DM: mean (SD) age=6.5(1.2), 51% female; Control: 6.4(1.4), 58%). Twelve (22%) controls were siblings of T1DM participants. A parent fi lled out questionnaires about their child’s behavior and performed a brief intelligence test. Cognitive domain z scores (Delayed Memory, Ex-ecutive Function, Working Memory & Attention, Processing Speed, IQ) were calculated from individual tests and Internalizing and Externalizing scores were derived from the parent questionnaires. The T1DM group had signifi -cantly lower IQ (p=0.01), and Executive Function, Working Memory & Atten-tion (p=0.02) than the non-diabetic control group, and had more Internalizing behavioral problems than Controls (p=0.001). These preliminary fi ndings sug-gest that certain cognitive and behavioral differences can appear quite early in T1DM. Future work will determine if these differences change over time and whether or not they are related to exposure to severe hypoglycemia or chronic hyperglycemia.
T1DM N=73
Mean±SD
Control N=55
Mean±SD
P-value(P-value from
repeated measures least square
regression model, adjusted for sib-lings from same
family, age, gender and parent IQ.)
Delayed Memory +0.08 ± 1.00 -0.11 ± 0.93 0.15Executive function/Working memory/Attention
-0.11 ± 0.88 +0.14 ± 1.07 0.02
Processing Speed -0.04 ± 1.01 +0.05 ± 0.93 0.85Child IQ -0.20 ± 0.98 +0.27 ± 0.90 0.01BRIEF (Behavior Rating by Parent)
+0.12 ± 0.91 -0.17 ± 1.03 0.12
Externalizing (Behavior Assessment by Parent)
+0.04 ± 0.94 −0.05 ± 1.02 0.73
Internalizing (Behavior Assessment by Parent)
+0.21 ± 0.87 −0.29 ± 1.03 0.001
199-ORGlucose Variability is Associated With Simultaneous EEG Changes in Youth With Type 1 Diabetes MellitusMARIANNA RACHMIEL, MICHAL COHEN, MIRIT LEZINGER, DORIT INBAR, ELI HEYMEN, SHLOMO GILAT, RONY BRAUNSHTEIN, ELI LAHAT, DANA EKSTEIN, Zerifi n, Israel, Tel Aviv, Israel, Jerusalem, Israel
Type 1 diabetes mellitus (T1DM) may cause various neurologic abnormali-ties. Electroencephalographic (EEG) abnormalities in diabetic children were found to be acquired, and apparently produced by a metabolic disturbance. Controversy remains about whether abnormalities result from severe hy-poglycemic episodes or rather due to effect of chronic hyperglycemia. Our aim was to assess simultaneously and continuously the glucose and EEG variability, in youth with T1DM. Ten youth, mean age 14.2±1.9 years, with T1DM for an average 5.57±3.54 years were recruited. They were monitored simultaneously clinically and continuously by EEG recording and interstitial glucose monitoring by CGMS, for 48 hours. The parts of the recordings that included artifacts and those corresponding to times when the subject’s activity was unknown were deleted. A total of 1253 combined readings of glucose levels and 16 electrodes EEG comprise the study data. Mean glu-cose concentration was 206.95±94.8 mg/dl. Analysis of variance (ANOVA)
later (Year 2) in 17 subjects. MMTT were performed in 20 age and gender-matched non-T1D children and hypoglycemic clamps in 12 non-T1D adults (19-25 yrs). A response was defi ned as a rise in plasma glucagon > 11 pg/ml (the lowest value in non-T1D). MMTT-stimulated increases in glucagon were greater in T1D than in non-T1D subjects during Year 1 and 2 with twice as many T1D subjects achieving increases of > 11 pg/ml (p 0.001 in Year 1 and 2 vs. ND)(Table). Conversely, glucagon responses to hypoglycemia in T1D subjects was much lower than in non-diabetic controls (p=0.02 in Year 1 vs. ND, p=0.004 in Year 2 vs. ND). By Year 2, only 60 % of T1D subjects were able to achieve a > 11pg/ml rise in glucagon. The rise in glucagon during the MMTT in the T1D subjects in Year 2 approached the response to hypogly-cemia in adult controls. These data suggest that progressive dysregulation of -cell function contributes to increasing problems with hyper-, as well as hypoglycemia with increasing duration of T1D.
PlasmaGlucagonLevels(pg/ml)
MMTTT1D
Year 1N=25
MMTTT1D
Year 2N=17
MMTTNon-diabetic
ChildrenN=20
Hypo ClampT1D
Year 1N=22
Hypo ClampT1D
Year 2N=15
Hypo ClampNon-diabetic
AdultsN=12
Baselinemedian(25th, 75th)
44 (34, 53) 43 (41,51) 50 (46, 57) 34 (24, 38) 36 (31, 47 43 (35, 54)
Peak median(25th, 75th)
59 (52, 79) 64 (59, 81) 64 (52, 73) 50 (37, 72) 49 (42, 66) 93 (60, 111)
Rise Median(25th, 75th)
21 (16, 30) 25 (16, 27) 9 (5, 16) 19 (7, 32) 12 (8, 18) 38 (19, 66)
% subjects with rise in glucagon> 11 pg/ml
88 94 40 73 60 100
197-OREstimated Insulin Sensitivity and Cardiovascular Disease Risk Fac-tors in Adolescents With and Without Type 1 DiabetesBRIAN J. SPECHT, R.P. WADWA, JANET K. SNELL-BERGEON, FRANZISKA K. BISHOP, DAVID M. MAAHS, Aurora, CO
Cardiovascular disease (CVD) is the primary cause of death in type 1 diabetes (T1D), with many risk factors beginning in adolescence, includ-ing reduced insulin sensitivity (IS). We tested the hypotheses that: 1) CVD risk factors are similar in non-DM as compared to T1D adolescents in the most IS tertile and 2) CVD risk factors are more atherogenic with increasing IS in T1D adolescents. IS for adolescents with T1D (n=290; age 15.4±2.1 years; duration 8.8±3.0 years, A1c=8.9±1.6%) and non-DM controls (n=89; age 15.4±2.1 years) was determined using the model: logeIS=4.64725 - 0.02032(waist, cm) - 0.09779(A1c, %) - 0.00235(TG, mg/dl). The T1D adolescents were divided into IS tertiles (IS 6.84, IS 6.84-8.64, and IS 8.64). CVD risk factors were compared between all non-DM and T1D adolescents in the most IS tertile and then examined for a linear trend by IS tertile in T1D adolescents, adjusted for sex, race/ethnicity and Tanner Stage. IS was signifi cantly different in non-DM vs T1D adolescents (non-DM=11.5±2.9, T1D=7.8±2.4; p<0.0001). CVD risk factors were similar for non-DM as compared to the most IS T1D adolescents, except for higher HDL-c and DBP and lower TG in T1D adolescents (p<0.05). Among adoles-cents with T1D, all CVD risk factors except for HDL-c, were more atherogenic in T1D adolescents in decreasing IS tertiles in linear regression (Figure).
T1D adolescents who are the most IS have similar CVD risk factors compared to non-DM adolescents. CVD risk factors are inversely associated with IS in T1D adolescents. IS may be an important therapeutic target for reducing CVD risk in adolescents with T1D.
Supported by: NIDDK, JDRF

A54
For author disclosure information, see page 797. ADA-Funded Research
ORA
LSGLUCAGON AND GLUCAGON-LIKE PEPTIDES—ANIMALS
the adverse effects of acute H on EF in adolescents with T1D can be pre-vented with AA, possibly by reducing oxidative stress.
202-ORThe Prediction of Type 1 Diabetes by Multiple Autoantibody Lev-els and Their Incorporation into an Autoantibody Risk Score in the TrialNet Natural History StudyJAY SOSENKO, JAY SKYLER, GEORGE EISENBARTH, JEFFREY KRISCHER, LIP-ING YU, JEFFREY MAHON, CRAIG BEAM, DAVID BOULWARE, LISA RAFKIN, DESMOND SCHATZ, JERRY PALMER, THE TYPE 1 DIABETES TRIALNET STUDY GROUP, Miami, FL, Denver, CO, Tampa, FL, London, ON, Canada, Gainesville, FL, Seattle, WA
We studied whether levels of multiple autoantibodies add to the predic-tion of type 1 diabetes (T1D) beyond designations of positivity and negativity in the TrialNet Natural History Study (TNNHS). All participants were tested for 3 autoantibodies (GADA, IA-2A, and mIAA) at their initial screening. Sam-ples from those positive for at least one autoantibody (n=784; age: 19.4±13.8 years) were subsequently tested for ICA and ZnT8A. An autoantibody risk score (ARS) was developed on the basis of a proportional hazards model that included levels of each autoantibody along with the designations of positivity and negativity. The ARS was strongly predictive of T1D [hazard ratio (with 95% CI): 2.72 (2.23, 3.31); p<0.001]. Receiver operating character-istic curve (ROC) areas (with 95% CI) for the ARS were: 0.84 (0.78, 0.90) at 2 years of follow-up and 0.81 (0.74, 0.89) at 3 years (p<0.001 for both). The ROC areas for autoantibody number were: 0.79 (0.72, 0.86) at 2 years and 0.79 (0.73, 0.86) at 3 years (both p<0.001). Compared to the ROC areas for autoantibody number, the ROC area for the ARS was signifi cantly higher at 2 years (p<0.05), but not at 3 years. When another autoantibody risk score was developed on the basis of a model excluding ICA information, the ROC areas were virtually identical to those of the ARS. After adjusting for the pattern of positivity, the composite measure of the multiple autoantibody levels from the ARS model was predictive of T1D (p<0.001). Among individu-als positive for the same autoantibodies, risk estimates (from the ARS) var-ied substantially due to differences in their composite autoantibody levels. For example, 3-year risks ranged from 6% to 36% among those with GADA/ZnT8A (n=30). These fi ndings show the importance of considering levels of multiple autoantibodies in assessing the risk of T1D. Moreover, levels of mul-tiple autoantibodies can be incorporated into an autoantibody risk score that accurately predicts T1D.
Supported by: NIDDK
GLUCAGON AND GLUCAGON-LIKE PEPTIDES—ANIMALS
203-ORThe Role of XBP1 in Endoplasmic Reticulum Stress in Pancreatic
-cellMASARU AKIYAMA, CHONG WEE LIEW, RACHAEL MARTINEZ, BEN HAMBRO, ROHIT N. KULKARNI, Boston, MA
Type 2 diabetes (T2D) is characterized by insulin resistance, hypergluca-gonemia and -cell failure while -cell mass is largely unaltered. Although endoplasmic reticulum (ER) stress has been suggested to promote loss of
-cells in T2D its role in -cells is virtually unknown. XBP1 (X-box binding protein 1) is a transcription factor that plays a crucial role in the unfolded protein response (UPR). Spliced XBP1 promotes ER biogenesis and activates the expression of ER chaperones to facilitate protein secretion. XBP1 defi -ciency impairs secretion of pancreatic -cells leading to glucose intolerance. To evaluate the role of XBP1 in -cells, we created complementary in vivo ( -cell specifi c Xbp1 knockout, XbpKO mice) and in vitro (stable Xbp1 knock
demonstrated that during sleep, glucose > 200 mg/dl was associated with higher power of delta, theta, alpha and beta EEG frequencies in temporal and central areas (p=0.005). Glucose <70 mg/dl was associated with lower delta and theta power (p<0.001), suggesting a decrease in slow-wave (deep) sleep, when compared to glucose 70-199 mg/dl. During wakefulness, lower glucose was associated with increase in fast brain activity, in the gamma range (p=0.012). Glucose levels >200 mg/dl were associated with EEG slow-ing, as suggested by lower beta and gamma power, and higher delta power (p=0.005). This study is the fi rst to assess simultaneously and continuously diurnal and nocturnal glucose variability, clinical state and EEG recording, in youth with T1DM. We demonstrated that both asymptomatic hypoglycemia and hyperglycemia change the electrical activity in various brain regions and may therefore infl uence cognitive function, in a subtle but clinically impor-tant way.
Supported by: Chief Scientist Offi ce of the Ministry of Health, Israel
200-ORIdentifi cation of Clinical Predictors of Insulin Resistance in Pa-tients With Type 1 DiabetesMEGAN M. KELSEY, DANA DABELEA, JERI E. FORSTER, KRISTEN J. NADEAU, Aurora, CO
The presence of relative insulin resistance (IR) in patients with type 1 diabetes (T1D) has been thought to be related to glucotoxicity, although evi-dence for this is limited in pediatrics. We have shown that lean adolescents with T1D are more IR than lean controls, but do not show typical markers for IR. Recently, an equation was proposed for clinical identifi cation of IR us-ing patients with both T1D and T2D. Factors included in this equation were: fasting triglycerides (TG), waist circumference (WC) and HbA1c. The goal of the current study was to identify which of these factors contributes most to IR in T1D youth alone. We studied 62 adolescents (age= 15.5+2.2 yrs, BMI z-score=0.33+0.95) with T1D. Insulin sensitivity was measured by an 80 mU/m2/min-1 hyperinsulinemic euglycemic clamp to assess glucose disposal rate (GDR). Regression analysis was used to determine associations among TG, WC, HbA1c, BMI and GDR, with GDR (mg/m2/min-1) as the outcome vari-able. We found that, of the three equation variables, only WC was signifi -cantly associated with GDR, such that for every 1 cm increase in WC, there was a 0.13 mg/m2/min-1 decrease in M-value (p=0.0001). When BMI was added into the regression equation, WC remained signifi cant, whereas BMI was not signifi cantly associated with GDR. In summary, we did not fi nd a signifi cant association between HbA1c and IR, suggesting that glucotoxicity may not be the driving force behind IR in T1D youth. In contrast, WC signifi -cantly predicted IR in T1D youth independently from BMI and, therefore, may be a simple clinical measure of IR in these patients, who lack other typical IR risk markers. Analysis of hepatic, abdominal and muscle fat distribution as measured by magnetic resonance is currently underway to further assess underlying pathophysiology. Further studies are also needed to evaluate the additional impact of obesity on insulin sensitivity in children with T1D.
Supported by: 5K12HD057022-04 NIH BIRCWH K12; NIH/NCRR UL1 RR025780
201-ORAscorbic Acid Prevents Adverse Effects of Hyperglycemia on En-dothelial Function in Adolescents With Type 1 DiabetesKATHRYN STEPHENS, AMANDA S. DYE, HONG HUANG, JOHN A. BAUER, ROB-ERT HOFFMAN, Columbus, OH
Hyperglycemia (H) induced oxidative stress plays a key pathophysiological role in altering endothelial function (EF) in type 1 diabetes (T1D). Children with T1D have evidence of increased oxidative stress and reduced oxida-tive defense. It has been shown that ascorbic acid (AA) may reverse the ef-fects of H on EF in adults with well controlled or newly diagnosed diabetes. We have found that H adversely impacts EF in adolescents with T1D. To determine if AA infusion prevents H induced changes in EF in adolescents with T1D, reactive hyperemic changes (5 minutes of upper arm vascular oc-clusion) in forearm vascular resistance (FVR) were measured using venous occlusion plethysmography with (1) continuous infusion of AA (3 mg/min), and (2) without AA during (a) euglycemic (eugly) state (~90 mg/dL; using 40 mU/m2/insulin infusion), followed by induction of (b) H state (~200 mg/dL with insulin infusion) in 6 adolescents with T1D (age 14+1, BMI 22+4, HgA1c 7.9+0.9, duration of diagnosis 4+2.5yrs, mean +SD). EF was assessed as percent change in FVR pre and post upper arm vascular occlusion. Soluable intracellular adhesion molecules (sICAM) was measured at each stage of glycemia as a marker of endothelial activation. Repeated measures ANOVA revealed that the decrease in FVR from eugly to H was eliminated with AA treatment (p=0.043). Figure 1 displays our results. sICAM levels were lower in both arms during treatment with AA (p<0.001). These results indicate that

A55
For author disclosure information, see page 797.ADA-Funded Research
ORA
LS
GLUCAGON AND GLUCAGON-LIKE PEPTIDES—ANIMALS
pharmacological infusion with OXM lowers the incretin hormone GIP relative to a GLP-1R-selective agonist and this difference was associated with higher plasma FFA. These fi ndings indicate differential engagement of a gut-adipo-cyte axis by OXM compared to a GLP-1R-selective agonist that is mediated by differing effect in modulation of GIP secretion. We postulate that this differ-ence could contribute to the greater weight loss observed with chronic OXM treatment compared to chronic GLP-1 treatment.
206-ORExendin-4 (Ex4) Attenuates Cardiomyocyte Apoptosis by Inhibiting Oxidative Stress-Induced Endoplasmic Reticulum (ER) StressCRAIG YOUNCE, MELISSA BURMEISTER, JULIO AYALA, Orlando, FL
Cardiomyocyte apoptosis is a contributor to diabetic cardiomyopathy. We show that activation of the GLP1 Receptor (GLP1R) with Ex4 prevents hyperglycemia-induced cardiomyocyte apoptosis. This is associated with reduced expression of ER stress markers. Oxidative stress is a key trigger of hyperglycemia-induced ER stress in cardiomyocytes. We therefore tested the hypothesis that Ex4 attenuates hyperglycemia-induced ER stress in car-diomyocytes by reducing oxidative stress. Neonatal rat ventricular myocytes (NRVM) were incubated in 5 mM glucose (LG), 33 mM glucose (HG) or 33 mM glucose + 30 nM Ex4 (HGEx4) for 1, 6, 12 and 24 h. Reactive Oxygen Species (ROS) levels were assessed using dihydrorhodamine 123 (DHR123) and were used as a marker of oxidative stress. ROS levels peaked at 12 h but were not different between HG and HGEx4 (2.4±0.2 vs. 2.1±0.3 fold above LG). In response to the oxidative stressor H2O2 (250μM), Ex4 also failed to reduce ROS levels (H2O2 = 4.8±0.5 vs. H2O2+Ex4 = 5.1±0.04 fold over control), but as with hyperglycemia, Ex4 attenuated H2O2-mediated apoptosis (Control =12±2; H2O2 = 25±2; H2O2+Ex4 = 16±1% death assessed by Trypan Blue). Ex4 also reduced H2O2-induced protein levels of the ER stress chaperone GRP78 and proapoptotic CHOP. This suggests that Ex4 directly inhibits ER stress. To test this, NRVM were treated with the ER stress inducers thapsigargin (Tg, 300 nM) or Tunicamycin (Tm, 10 ug/μL) with or without Ex4. Ex4 at-tenuated Tg- (Control = 10±2; Tg = 39±4; Tg+Ex4 = 22±4% death) but not Tm-induced (Control = 9±3; Tm = 33±6; Tm+E4 = 28±2% death) apoptosis. Ex4 also reduced Tg- but not Tm-induced protein levels of GRP78 and CHOP. In sum, these data show that Ex4 prevents cardiomyocyte apoptosis by di-rectly inhibiting ER stress independently of effects on oxidative stress. This proposes a mechanism by which Ex4 attenuates hyperglycemia-induced cardiomyocyte loss further supporting a potential role in the treatment of diabetic cardiomyopathy.
207-ORGlucagon-Like Peptide 1 (GLP-1) Recruits Microvasculature and In-creases Glucose Extraction in Muscle via a PKA-Dependent PathwayZHENGHUA DONG, WEIDONG CHAI, LINA ZHAO, ZHUO FU, EUGENE J. BARRETT, WENHUI WANG, ZHENQI LIU, Charlottesville, VA
GLP-1 causes vasodilation and increases muscle glucose uptake inde-pendent of insulin. We have recently shown that GLP-1 recruits muscle microvasculature and increases glucose use via a nitric oxide (NO)-depen-dent mechanism. Protein kinase A (PKA) is a major signaling intermediate downstream of GLP-1 receptors. To examine whether PKA mediates GLP-1’s microvascular action in muscle, overnight fasted male SD rats were given a systemic infusion of GLP-1 (7-36) amide (30 pmol/kg/min) for 120 min ± sys-temic infusion of H89 (PKA inhibitor, 160 pmol/kg/min) which began 30 min before starting GLP-1 infusion. Hindleg muscle microvascular blood volume (MBV), microvascular blood fl ow velocity (MFV) and microvascular blood fl ow (MBF) were determined using contrast-enhanced ultrasound. GLP-1 in-fusion acutely increased muscle MBV (p<0.05) within 30 min without alter-ing MFV and blood pressure. This effect persisted throughout the 120 min in-fusion period, leading to an increase in muscle MBF (~2-fold, p<0.05). These changes were paralleled by increases in plasma NO levels (~2-fold, p<0.05) and hindleg glucose extraction (~2-fold, p<0.05). Systemic infusion of H89 blocked GLP-1-mediated increases in muscle MBV, MBF, glucose extraction and NO production. To ascertain that GLP-1 can directly stimulate NO pro-duction, bovine aortic endothelial cells were treated with GLP-1 (1 ng/ml) for 20 min with or without H89 (10 μM) pre-treatment. Endothelial NO synthase (eNOS) phosphorylation, NO production and PKA activity were determined. GLP-1 acutely stimulated eNOS (Ser1177) phosphorylation and NO produc-tion. Inhibition of PKA abolished GLP-1-induced eNOS phosphorylation and NO production. We conclude that GLP-1 expands microvascular volume and increases substrate exchange in muscle via a PKA-eNOS dependent path-way in vascular endothelium. This may contribute to postprandial glycemic control and diabetes complication prevention in diabetes.
Supported by: NIH
down -cell line, XbpKD) models. XBPKO mice exhibited mild glucose in-tolerance on oral glucose gavage ( XbpKO: 249 mg/dl vs. control 195 mg/dl at 15 min; p<0.05; n=6-12). Thapsigargin treatment of XBPKD cells activat-ed IRE1 (pIRE1/IRE1; 1.4 fold increase compared to control; p<0.05; n=3), an upstream activator of XBP1, while reducing the expression of downstream targets of XBP1 (Bip and Chop) and cleaved caspase 3. Interestingly, insulin treatment of XBPKD cells exhibited reduced tyrosine phosphorylation of IRS-1 (pY896) (IRS-1-pY/IRS-1; 30% decrease; p<0.001; n=3), and phosphoryla-tion (Ser473) of Akt (pAkt/Akt; 75% decrease: p<0.001; n=3) leading to acti-vated JNK (pJNK/JNK; 3.5 fold increase: p<0.01; n=3) and serine phosphory-lation of IRS1 (IRS-1-pS/IRS1; 2.2 fold increase: p<0.05; n=3). Consequent to the impaired insulin signaling, the XBPKD cells showed enhanced glucagon secretion following insulin treatment (2.0 fold increase: p<0.01; n=3-6), in agreement with our earlier report of hyperglucagonemia in -cell insulin receptor knockout mice. Together, these data suggest that XBP1 cross talks with proteins in the insulin signaling pathway and plays a crucial role in the regulation of -cell secretory function and survival.
Supported by: Sunstar Foundation for Oral Health Promotion
204-ORHypothalamic Glucagon Signaling Regulates Glucose ProductionPATRICIA I. MIGHIU, JESSICA T. YUE, BEATRICE M. FILIPPI, TONY K. LAM, To-ronto, ON, Canada
Hypothalamic insulin action regulates hepatic glucose production in nor-mal rodents, but little is known in regards to a potential role of glucagon. We here fi rst demonstrated that direct administration of glucagon into the mediobasal hypothalamus (MBH) of rats under pancreatic (basal-insulin) euglycemic clamp conditions surprisingly lowered glucose production (GP) from 13.6 ± 0.8 mg kg-1 min-1 to 4.8 ± 1.0 mg kg-1 min-1 (vs 10.4 ± 0.9 mg kg-1
min-1 [MBH saline], P < 0.05), but did not alter the rate of peripheral glucose uptake compared to MBH saline (11.3 ± 0.8 mg kg-1 min-1 vs. 11.8 ± 0.8 mg kg-1
min-1). This GP-lowering effect was prevented when glucagon receptor sig-naling was blocked via MBH infusion of a mouse-monoclonal anti-glucagon antibody (9.3 ± 0.6 mg kg-1 min-1) or a glucagon receptor antagonist (Des-His1
[Glu9]glucagon amide) (10.6 ± 1.7 mg kg-1 min-1) or PKA-inhibitor Rp-cAMPS (9.5 ± 0.8 mg kg-1 min-1). Conversely, direct activation of hypothalamic PKA signalling via MBH PKA-activator Sp-cAMPS administration was suffi cient to lower GP from 12.2 ± 0.9 mg kg-1 min-1 to 5.2 ± 0.7 mg kg-1 min-1. We next evaluated in a non-clamp condition whether MBH glucagon signaling is nec-essary for circulating glucagon to regulate plasma glucose levels and GP. In-travenous (i.v.) injection of glucagon increased plasma glucose levels by 23% and GP by 27% within 10 minutes of injection in normal rats. When MBH cAMP-PKA signaling was disrupted, i.v. glucagon injection increased plasma glucose levels and GP to a signifi cantly greater extent compared to normal rats with intact MBH cAMP-PKA signaling. In summary, these data unveil a novel function of glucagon action in the MBH that stimulates MBH cAMP-PKA signaling and inhibits GP, and counteracts the direct hepatic stimulatory effect of circulating glucagon on GP in normal rodents.
Supported by: CDA, OGS and BBDC
205-OROxyntomodulin Lowers Plasma GIP in DIO miceJULIE LAO, XIAOBING DU, XIAOLAN SHEN, EDWARD KOWALIK, WENYU LI, DA-VID E. KELLEY, ALESSANDRO POCAI, Rahway, NJ
Oxyntomodulin (OXM) is a peptide secreted postprandially from the L-cells of the gut that has a weak affi nity for both the glucagon-like receptor-1 (GLP-1R) and the glucagon receptor (GCGR). OXM administration causes weight loss in humans and rodents. Glucose-dependent insulinotropic polypeptide (GIP) is another peptide known to improve glucose-stimulated insulin secretion in postprandial state. Recent studies also provide evidences for an important role of GIP on adipose tissue lipogenesis and possibly in the pathogenesis of obesity. Because glucagon has been reported to decrease fasting GIP levels in humans, we examined whether short-term infusion of OXM lowers plasma GIP levels and if this effect is distinct from that of a GLP-1R-selective agonist. Comparisons of the effects of GLP-1 and OXM are confounded by the different pharmacokinetics and receptor affi nities of the two peptides. We identifi ed an equipotent GLP-1R-selective peptide agonist that differs from OXM by only one residue (Q3 E, OXMQ3E), but has no signifi cant GCGR agonist activity. We compared the effects of intravenous infusion of OXM and OXMQ3E on GIP levels in DIO mice. Vehicle, OXM and OXMQ3E were infused for 180 min in chronically catheterized mice. Free fatty acids (FFA) levels were signifi cantly elevated in OXM but not in OXMQ3E treated mice. Interestingly, OXM but not OXMQ3E treatment lowered GIP levels to the values observed in lean mice (9.4±0.5 vs. 2.5±0.3 pg/mL; DIO vs. lean mice p<0.05). In summary, short-term
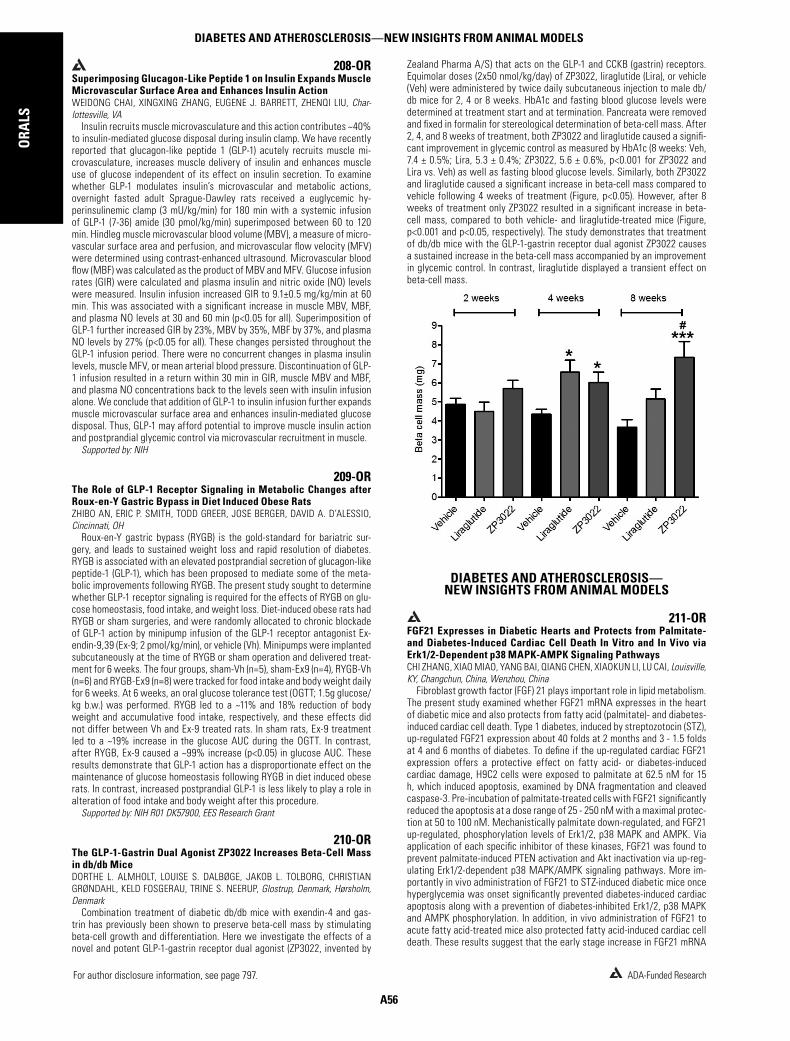
A56
For author disclosure information, see page 797. ADA-Funded Research
ORA
LSDIABETES AND ATHEROSCLEROSIS—NEW INSIGHTS FROM ANIMAL MODELS
Zealand Pharma A/S) that acts on the GLP-1 and CCKB (gastrin) receptors. Equimolar doses (2x50 nmol/kg/day) of ZP3022, liraglutide (Lira), or vehicle (Veh) were administered by twice daily subcutaneous injection to male db/db mice for 2, 4 or 8 weeks. HbA1c and fasting blood glucose levels were determined at treatment start and at termination. Pancreata were removed and fi xed in formalin for stereological determination of beta-cell mass. After 2, 4, and 8 weeks of treatment, both ZP3022 and liraglutide caused a signifi -cant improvement in glycemic control as measured by HbA1c (8 weeks: Veh, 7.4 ± 0.5%; Lira, 5.3 ± 0.4%; ZP3022, 5.6 ± 0.6%, p<0.001 for ZP3022 and Lira vs. Veh) as well as fasting blood glucose levels. Similarly, both ZP3022 and liraglutide caused a signifi cant increase in beta-cell mass compared to vehicle following 4 weeks of treatment (Figure, p<0.05). However, after 8 weeks of treatment only ZP3022 resulted in a signifi cant increase in beta-cell mass, compared to both vehicle- and liraglutide-treated mice (Figure, p<0.001 and p<0.05, respectively). The study demonstrates that treatment of db/db mice with the GLP-1-gastrin receptor dual agonist ZP3022 causes a sustained increase in the beta-cell mass accompanied by an improvement in glycemic control. In contrast, liraglutide displayed a transient effect on beta-cell mass.
DIABETES AND ATHEROSCLEROSIS—NEW INSIGHTS FROM ANIMAL MODELS
211-ORFGF21 Expresses in Diabetic Hearts and Protects from Palmitate- and Diabetes-Induced Cardiac Cell Death In Vitro and In Vivo via Erk1/2-Dependent p38 MAPK-AMPK Signaling PathwaysCHI ZHANG, XIAO MIAO, YANG BAI, QIANG CHEN, XIAOKUN LI, LU CAI, Louisville, KY, Changchun, China, Wenzhou, China
Fibroblast growth factor (FGF) 21 plays important role in lipid metabolism. The present study examined whether FGF21 mRNA expresses in the heart of diabetic mice and also protects from fatty acid (palmitate)- and diabetes-induced cardiac cell death. Type 1 diabetes, induced by streptozotocin (STZ), up-regulated FGF21 expression about 40 folds at 2 months and 3 - 1.5 folds at 4 and 6 months of diabetes. To defi ne if the up-regulated cardiac FGF21 expression offers a protective effect on fatty acid- or diabetes-induced cardiac damage, H9C2 cells were exposed to palmitate at 62.5 nM for 15 h, which induced apoptosis, examined by DNA fragmentation and cleaved caspase-3. Pre-incubation of palmitate-treated cells with FGF21 signifi cantly reduced the apoptosis at a dose range of 25 - 250 nM with a maximal protec-tion at 50 to 100 nM. Mechanistically palmitate down-regulated, and FGF21 up-regulated, phosphorylation levels of Erk1/2, p38 MAPK and AMPK. Via application of each specifi c inhibitor of these kinases, FGF21 was found to prevent palmitate-induced PTEN activation and Akt inactivation via up-reg-ulating Erk1/2-dependent p38 MAPK/AMPK signaling pathways. More im-portantly in vivo administration of FGF21 to STZ-induced diabetic mice once hyperglycemia was onset signifi cantly prevented diabetes-induced cardiac apoptosis along with a prevention of diabetes-inhibited Erk1/2, p38 MAPK and AMPK phosphorylation. In addition, in vivo administration of FGF21 to acute fatty acid-treated mice also protected fatty acid-induced cardiac cell death. These results suggest that the early stage increase in FGF21 mRNA
208-ORSuperimposing Glucagon-Like Peptide 1 on Insulin Expands Muscle Microvascular Surface Area and Enhances Insulin ActionWEIDONG CHAI, XINGXING ZHANG, EUGENE J. BARRETT, ZHENQI LIU, Char-lottesville, VA
Insulin recruits muscle microvasculature and this action contributes ~40% to insulin-mediated glucose disposal during insulin clamp. We have recently reported that glucagon-like peptide 1 (GLP-1) acutely recruits muscle mi-crovasculature, increases muscle delivery of insulin and enhances muscle use of glucose independent of its effect on insulin secretion. To examine whether GLP-1 modulates insulin’s microvascular and metabolic actions, overnight fasted adult Sprague-Dawley rats received a euglycemic hy-perinsulinemic clamp (3 mU/kg/min) for 180 min with a systemic infusion of GLP-1 (7-36) amide (30 pmol/kg/min) superimposed between 60 to 120 min. Hindleg muscle microvascular blood volume (MBV), a measure of micro-vascular surface area and perfusion, and microvascular fl ow velocity (MFV) were determined using contrast-enhanced ultrasound. Microvascular blood fl ow (MBF) was calculated as the product of MBV and MFV. Glucose infusion rates (GIR) were calculated and plasma insulin and nitric oxide (NO) levels were measured. Insulin infusion increased GIR to 9.1±0.5 mg/kg/min at 60 min. This was associated with a signifi cant increase in muscle MBV, MBF, and plasma NO levels at 30 and 60 min (p<0.05 for all). Superimposition of GLP-1 further increased GIR by 23%, MBV by 35%, MBF by 37%, and plasma NO levels by 27% (p<0.05 for all). These changes persisted throughout the GLP-1 infusion period. There were no concurrent changes in plasma insulin levels, muscle MFV, or mean arterial blood pressure. Discontinuation of GLP-1 infusion resulted in a return within 30 min in GIR, muscle MBV and MBF, and plasma NO concentrations back to the levels seen with insulin infusion alone. We conclude that addition of GLP-1 to insulin infusion further expands muscle microvascular surface area and enhances insulin-mediated glucose disposal. Thus, GLP-1 may afford potential to improve muscle insulin action and postprandial glycemic control via microvascular recruitment in muscle.
Supported by: NIH
209-ORThe Role of GLP-1 Receptor Signaling in Metabolic Changes after Roux-en-Y Gastric Bypass in Diet Induced Obese RatsZHIBO AN, ERIC P. SMITH, TODD GREER, JOSE BERGER, DAVID A. D’ALESSIO, Cincinnati, OH
Roux-en-Y gastric bypass (RYGB) is the gold-standard for bariatric sur-gery, and leads to sustained weight loss and rapid resolution of diabetes. RYGB is associated with an elevated postprandial secretion of glucagon-like peptide-1 (GLP-1), which has been proposed to mediate some of the meta-bolic improvements following RYGB. The present study sought to determine whether GLP-1 receptor signaling is required for the effects of RYGB on glu-cose homeostasis, food intake, and weight loss. Diet-induced obese rats had RYGB or sham surgeries, and were randomly allocated to chronic blockade of GLP-1 action by minipump infusion of the GLP-1 receptor antagonist Ex-endin-9,39 (Ex-9; 2 pmol/kg/min), or vehicle (Vh). Minipumps were implanted subcutaneously at the time of RYGB or sham operation and delivered treat-ment for 6 weeks. The four groups, sham-Vh (n=5), sham-Ex9 (n=4), RYGB-Vh (n=6) and RYGB-Ex9 (n=8) were tracked for food intake and body weight daily for 6 weeks. At 6 weeks, an oral glucose tolerance test (OGTT; 1.5g glucose/kg b.w.) was performed. RYGB led to a ~11% and 18% reduction of body weight and accumulative food intake, respectively, and these effects did not differ between Vh and Ex-9 treated rats. In sham rats, Ex-9 treatment led to a ~19% increase in the glucose AUC during the OGTT. In contrast, after RYGB, Ex-9 caused a ~99% increase (p<0.05) in glucose AUC. These results demonstrate that GLP-1 action has a disproportionate effect on the maintenance of glucose homeostasis following RYGB in diet induced obese rats. In contrast, increased postprandial GLP-1 is less likely to play a role in alteration of food intake and body weight after this procedure.
Supported by: NIH R01 DK57900, EES Research Grant
210-ORThe GLP-1-Gastrin Dual Agonist ZP3022 Increases Beta-Cell Mass in db/db MiceDORTHE L. ALMHOLT, LOUISE S. DALBØGE, JAKOB L. TOLBORG, CHRISTIAN GRØNDAHL, KELD FOSGERAU, TRINE S. NEERUP, Glostrup, Denmark, Hørsholm, Denmark
Combination treatment of diabetic db/db mice with exendin-4 and gas-trin has previously been shown to preserve beta-cell mass by stimulating beta-cell growth and differentiation. Here we investigate the effects of a novel and potent GLP-1-gastrin receptor dual agonist (ZP3022, invented by

A57
For author disclosure information, see page 797.ADA-Funded Research
ORA
LS
DIABETES AND ATHEROSCLEROSIS—NEW INSIGHTS FROM ANIMAL MODELS
214-ORMetformin and Saxagliptin Combination Treatment Reduces Nitrox-idative Stress and Restores Nitric Oxide Release in the Endothelium of Obese RatsR. PRESTON MASON, ROBERT F. JACOB, J. JOSE CORBALAN, LU-LIN JIANG, TADEUSZ MALINSKI, Boston, MA, Beverly, MA, Athens, OH
Endothelial cell (EC) dysfunction in diabetes is characterized by reduced nitric oxide (NO) and increased peroxynitrite (ONOO-) levels, an imbalance causally related to atherothrombotic disease. In this study, we hypothesized that EC dysfunction in diabetic rats is reversed with combination treatment using a DPP4 inhibitor (saxagliptin) and metformin due to their distinct and benefi cial effects on endothelial NO synthase (eNOS) activity. To test this hypothesis, obese Zucker rats were fed a high-fat diet and treated with saxagliptin (10 mg/kg/day), with or without metformin (300 mg/kg/day), for 4 weeks. Aortic and glomerular ECs were then assayed ex vivo for NO and ONOO- release using amperometric nanosensors. Changes in EC func-tion were correlated with fasting glucose levels. Saxagliptin was found to increase aortic and glomerular endothelial NO release by 20% (299 ± 57 nM to 360 ± 29 nM) and 21% (110 ± 14 nM to 133 ± 24 nM), respectively, while decreasing ONOO- release by 11% and 16%, respectively, as com-pared to vehicle-treated controls. Combination treatment with metformin increased aortic and glomerular NO release by 45% (435 ± 81 nM) and 53% (168 ± 32 nM), respectively, with comparable reductions in ONOO- levels. The NO/ONOO- ratio, an indicator of eNOS coupling, increased more than two-fold with the combination treatment and was signifi cantly greater than that observed with saxagliptin alone. Reversal of EC dysfunction with the combination was observed prior to reductions in elevated fasting glucose levels (156 ± 14 mg/dL). These data indicate that saxagliptin and metformin combination therapy has direct effects on arterial and renal EC function in obese rats, including enhanced NO bioavailability and reduced nitroxidative stress, independent of changes on fasting glucose levels.
215-ORTIMP3 Regulates Fatty Acid Metabolism, Atherosclerosis and Sur-vival in ApoE Knockout MiceMICHELE CAVALERA, STEFANO MENINI, VIVIANA CASAGRANDE, MARIA MA-VILIO, ROSSELLA MENGHINI, STEFANO RIZZA, GIUSEPPE PUGLIESE, DAVIDE LAURO, RENATO LAURO, MASSIMO FEDERICI, Rome, Italy
TIMP3 is reduced in the muscle and carotid plaques from patients with Type 2 Diabetes but if TIMP3 alters glucose and lipid metabolism is unclear. We analyzed ApoE-/- (EKO) and ApoE-/-Timp3-/- (ET3KO) mice by monitor-ing the survival rate; lipids, metabolites and atherosclerotic plaques with LC-MS metabolomics and conventional staining; physiological values by calorimetric cages. ET3KO mice revealed a signifi cant higher rate of sud-den death compared to EKO mice during a follow up of 12 months (N=18 per group; p<0.001); Sudan-IV and Oil-Red staining of ET3KO aorta and aortic root displayed increased positive staining (40% increase, p<0.01) compared to EKO. Moreover, ET3KO mice showed higher levels of total cholesterol, HDL-cholesterol and triglycerides (p<0.05 for all). Furthermore, ET3KO mice exhibited lower heart rate (p<0.01), higher systolic and diastolic pressures (p=0.06; p<0.05), higher O2 consumption and CO2 production, and lower re-spiratory exchange ratio compared to EKO mice (p<0.0001 for all). These data suggested a different use of metabolic substrates; specifi cally we found increased levels of C14:OH, C16:OH and C18:OH (p<0.01 for all) in the blood of ET3KO mice, together with higher amount of arginine (p<0.05) and histidine (p<0.01). No differences in food and water intake were found. Western blot analysis showed reduced pThr172 AMPK phosphorylation and increased pSer473 AKT phosphorylation in skeletal muscle from ET3KO com-pared to EKO mice (p<0.05 for all), suggesting that lipid oxidation may be dysfunctional in ET3KO mice. Loss of timp3 accelerates atherosclerosis and causes higher amount of atherosclerotic plaques, increased sudden death, plus defects in intermediary metabolism. The latter results in accumulation in the circulation of hydroxylated long-chain fatty acids that may complicate atherosclerotic plaque composition or perturb heart metabolism.
Supported by: JDRF, Fondazione Roma, Telethon
216-ORObesity-Related Hypertension via Hypothalamic Infl ammation-Induced Glutamatergic ActivationSUDARSHANA PURKAYASTHA, DONGSHENG CAI, Bronx, NY
Obesity-related hypertension is an integral component of metabolic syndrome and diabetic cardiovascular complications. In our recent study (Nature Medicine 2011), we discovered that obesity-related hypertension is caused by proinfl ammatory IKK-beta activation in the hypothalamic arcuate
expression may represent an early protective mechanism; administration of exogenous FGF21 to diabetic mice or acute fatty acid-treated mice can pre-vent cardiac damage. The cardioprotection by FGF21 from diabetes is medi-ated by ERK1/2-dependent p38 MAPK and AMPK signaling pathway.
212-ORArachidonic 12/15-Lipoxygenase-Induced Infl ammation Promotes the Development of Diabetic CardiomyopathyMASAYA SAKAMOTO, HIROFUMI SUZUKI, YOSUKE KAYAMA, KAZUNORI UT-SUNOMIYA, Tokyo, Japan
Diabetic mellitus increases the risk of heart failure independently of un-derlying coronary artery disease, and many believe that diabetes leads to cardiomyopathy. The underlying pathogenesis is partially understood, but precise mechanism underlying diabetic cardiomyopathy is still unknown. To investigate the molecular mechanisms of diabetic cardiomyopathy, we created a diabetic cardiomyopathy model (streptozotocin (STZ) injection rat) and performed microarray analysis. Echocardiography showed that STZ in-jection rat developed diastolic and systolic dysfunction and cardiac fi brosis was increased in STZ injection rat. Among the genes analyzed, arachidonic 12-lipoxygenase (12-LOX) was upregulated in the heart of STZ rat. mRNA level of 12-LOX and production of 12(s)-HETE, a major metabolite of 12-LOX, were upregulated in the heart of STZ rat. Until recently, 12-LOX has been reported to play an important role in the development of atherogenesis and neurogenerative disease. However, the role of 12-LOX in diabetic cardiomyo-pathy has not been examined. To determine the role of 12-LOX in STZ injec-tion heart, we created STZ injection mice (WT-STZ) and compared to those of 12-LOX KO (KO-STZ) mice. Disruption of 12-LOX signifi cantly reduced car-diac fi brosis and improving diastolic and systolic dysfunction. Moreover the expression of infl ammatory cytokine genes such as TNF- and STZ-induced reactive oxygen species were signifi cantly inhibited by disruption of 12-LOX. In vitro experiment reveal that hyperglycemia induced expression of 12-LOX as well as TNF- by neonatal cardiomyocyte. Treatment with Cinnamy1-3,4-dihydroxy- -cyanocinnamate (CDC) , a inhibitor of 12-LOX, decreased the expression of TNF- by cardiomyocyte under high glucose stimulation. Our results suggest that cardiac 12-LOX-induced infl ammation is involved in the development of diabetic cardiomyopathy and that inhibition of 12-LOX could be a novel treatment for this condition.
213-ORAdipoR1 in Macrophages and AdipoR2 in Endothelial Cells via PPARgamma/SOD Play the Protective Roles against Atherosclero-sis In VivoMIKI O. IWABU, TOSHIMASA YAMAUCHI, MASATO IWABU, TETSUYA KUBOTA, NAOTO KUBOTA, TAKASHI KADOWAKI, Bunkyo-ku, Japan
The adipocyte-derived hormone adiponectin (Ad) has been proposed to play the central roles as antidiabetic and antiatherogenic adipokine. How-ever, whether Ad receptors AdipoR1 (R1) and AdipoR2 (R2) have the protec-tive roles against atherosclerosis in vivo are still undetermined. Ad has been shown to be downregulated in obesity. Here we showed that in mice, ApoE defi ciency and obesity induced by high-fat diet or leptin defi ciency resulted in signifi cantly decreased expression of R2 in aorta. We showed that R1 knock-out (KO) mice exhibited signifi cantly more neointimal formation in response to external vascular cuff injury than wild-type (WT) mice (intima to media volume ratio (I/M); WT:25.3±1.1; R1KO:30.1±1.8%). R2KO or R1 · R2 double KO mice exhibited much more neointimal formation in response to cuff in-jury than R1KO mice (I/M; R2KO:42.8±4.0; R1R2KO:49.6±2.6%). Interestingly, neointimal formation induced by cuff injury was increased by transplanta-tion of bone marrow from R1KO but not increased by transplantation of bone marrow from R2KO mice. Importantly, the extent of neointimal formation ob-served in endothelial cells-specifi c R2KO mice was almost the same as that in conventional R2KO mice. Moreover, adenovirus-mediated supplement of R2 in cuff injury region or endothelial cells-specifi c R2 upregulation signifi -cantly attenuated neointimal proliferation. Adenovirus-mediated expression of R2 in aorta resulted in increased PPARgamma and increased oxidative stress-detoxifying enzymes such as SOD1. Conversely, targeted disruption of R2 in endothelial cells resulted in decreased PPARgamma and SOD1. This study provides the direct evidence that R2 in endothelial cells and R1 in mac-rophages play the protective roles against atherosclerosis. Moreover, this study raises the possibility that a therapeutic strategy to increase AdipoRs in injured artery could be useful in preventing vascular diseases such as rest-enosis after angioplasty.

A58
For author disclosure information, see page 797. ADA-Funded Research
ORA
LSCLOSED LOOP SYSTEMS
creased myelopoiesis and suppressed the expression of lineage commitment markers. Mice or bone marrow cells defi cient in S100 calcium binding proteins (S100A8/9) or its receptor, the RAGE (Receptor for Advanced Glycation End-products), were protected from diabetes-induced monocytosis in vivo and high glucose conditions in vitro. Enhanced myelopoiesis was not cell-autonomous but mediated by S100A8/9, secreted predominantly by circulating neutrophils and sensed by RAGE on common myeloid progenitors. Binding of S100A8/A9 to RAGE but not to TLR2/4 (Toll Like Receptor) initiated a signaling cascade via NF- B to induce cytokine release and stimulate proliferation/ differentiation of progenitor cells. Further, in a mouse model of atherosclerotic regression, normalizing plasma glucose reduced lesion area by lowering the number of circulating monocytes as well as their accumulation in the lesion. We propose that hyperglycemia enhances myelopoiesis and that disruption of S100A8/A9-RAGE signaling could be a potential therapeutic strategy in the management of diabetic atherosclerosis.
Supported by: NIH (U01-HL087945 and P01-HL54591), CIHR
CLOSED LOOP SYSTEMS
219-ORFactors Affecting Performance of Overnight Closed-Loop Insulin Delivery in Type 1 Diabetes (T1D)MARIANNA NODALE, DANIELA ELLERI, JANET M. ALLEN, KAVITA KUMARE-SWARAN, JULIE HARRIS, AHMAD HAIDAR, LALANTHA LEELARATHNA, KAREN CALDWELL, HELEN R. MURPHY, MALGORZATA E. WILINSKA, CARLO L. ACERINI, MARK L. EVANS, DAVID B. DUNGER, ROMAN HOVORKA, Cambridge, United King-dom, Montreal, QC, Canada
We investigated factors which might infl uence the performance of over-night closed-loop insulin delivery. 79 subjects with T1D [45 female, 11 chil-dren, 43 adolescents, 25 adults, BMI 22.4 (4.1)kg/m2, T1D duration 10.6 (9.0)yrs, A1c 8.1(1.3)%, total daily insulin 49.0(21.7)U/day; mean(SD)] attended a clinical research facility to undergo closed-loop treatment with basal rates on insulin pump adjusted every 15min using a model-predictive-control (MPC) algorithm and real-time sensor glucose levels. Reference plasma glu-cose (PG) taken every 15min to hourly assessed closed-loop performance. Time spent in target glucose range 71-145mg/dl [82% (63-100), median (IQR)] increased with age and total daily insulin dose, but no relationship was ob-served with A1c levels or insulin absorption rate [time-to-peak of plasma insulin Tmax; 63.3 (22.5) min]. Time spent below 70mg/dl [0.0 (0.0-0.8) %] and low blood glucose index [LBGI; 0.5 (0.0-1.7)] increased with Tmax. Mean PG [117 (101-133) mg/dl] and variability of PG [SD of PG 20 (13-22) mg/dl] increased with the controller algorithm effort [ratio of delivered insulin ad-vised by MPC and pre-programmed pump delivery profi le 1.1 (0.3)], while time spent in target range, time spent below target and LBGI all decreased. We conclude that delayed insulin absorption may increase risk of low glu-cose levels. The MPC controller may be equally effective irrespective of A1C levels, but its performance may be hindered by acutely elevated insulin re-quirements or by underestimated pump delivery profi le.
Correlation between closed-loop outcomes and explanatory factorsN Mean
PGSDPG
Time spentbelow
70 mg/dl
Time in target range
71-145mg/dl
LBGI
Age 79 -0.03 -0.01 -0.06 0.23† 0.04A1c 79 -0.05 0.16 0.24† -0.19 0.17Total daily insulin dose 79 -0.16 -0.15 -0.05 0.29† 0.07Controller effort 79 0.51* 0.24† -0.28† -0.40* -0.42*Insulin absorption Tmax 70 -0.20 0.06 0.24† 0.05 0.28†* P < 0.05 † P < 0.01
Supported by: JDRF, Diabetes UK, NIH, EC FTP7
220-ORThe Order Effect of the In-Clinic ASPIRE Study: Hypoglycemia Be-gets HypoglycemiaSATISH GARG, RONALD L. BRAZG, TIMOTHY S. BAILEY, BRUCE A. BUCKINGHAM, DAVID C. KLONOFF, JOHN SHIN, JOHN B. WELSH, FRANCINE R. KAUFMAN, Au-rora, CO, Renton, WA, Escondido, CA, Stanford, CA, San Mateo, CA, Northridge, CA
In the in-clinic ASPIRE study of induced hypoglycemia with the low glucose suspend (LGS) feature, we examined the effect of the order of experiments on the duration of hypoglycemia. ASPIRE enrolled 50 subjects (48 fi nished) with type 1 diabetes using the Veo sensor-augmented insulin pump system
nucleus (ARC) and particularly the comprised proopiomelanocortin (POMC) neurons; however, the underlying mechanism is still unknown. In this study, we explored if brain excitatory glutamatergic system could be involved and how. We found that the hypertensive response following hypothalamic TNF-alpha injection in mice was normalized by prior hypothalamic injection of glutamatergic inhibitor kynurenic acid (mean blood pressure: 121.7±5.1 vs. 94.97±6.3 mmHg, p<0.001). To dissect the underlying neurocircutry, we found that an intra-ARC injection of TNF-a led to neuronal activation (indi-cated by c-fos) evidently in the hypothalamic paraventricular nucleus (PVN) and promotion of glutamate release from the PVN, but these effects were prevented in POMC neuron-specifi c IKK-beta knockout mice (offspring from crossing POMC-Cre mice and IKK-beta lox/lox mice). These data indicate that IKK-beta in POMC neurons employs a glutamatergic pathway within the ARC-PVN axis to mediate hypertension. In relation with obesity-related hy-pertension - which is signifi cantly due to hyperleptinemia-induced hyperten-sion, we found that hypothalamic treatment of glutamate inhibitor kynurenic acid prevented leptin-induced hypertension, just as did the treatment of IKK-beta inhibitor PS-1145. The hypertensive outcome of hypothalamic glutamatergic activation was related to increased sympathetic outfl ow, as hypothalamic injection of leptin or TNF-alpha similarly upregulated the renal sympathetic pathway. In conclusion, obesity-related hypertension is mecha-nistically mediated by hypothalamic infl ammation-dependent glutamatergic activation and downstream renal sympathetic upregulation.
Supported by: NIH
217-ORChronic Activation of Sphingosine 1-Phosphate 1 Receptors Causes Hyperglycemia and Exacerbates Cardiac Fibrosis in Type 1 Diabetic MiceZHAO LI, ZHU-QIU JIN, Brookings, SD
Diabetic cardiomyopathy features myocardial hypertrophy and cardiac fi -brosis. Sphingosine 1-Phosphate (S1P) is a bioactive small lipid molecule that is involved in multiple cellular functions through binding to fi ve distinct S1P receptors (from S1P1 to S1P5). High plasma level of S1P has been reported in patients with type 1 diabetes. Role of S1P receptors in the onset of dia-betic cardiomyopathy remains unknown. Since S1P1 is the dominant recep-tors in the heart and blood vessels. We tested the hypothesis that chronic modulation of S1P1 may play a critical role in diabetic cardiomyopathy. Type 1 diabetic mouse model was established by low-dose streptozotocin (STZ) induction protocol (50 mg/kg, for 5 days consecutively) in C57BL/6J mice. Mouse tail blood glucose was measured twice: 4 weeks and 11 weeks after STZ injection. SEW2871 (0.125 mg/kg), a selective S1P1 receptor agonist, was given once a day (i.p.) for 4 weeks (fi rst phase) and 2 weeks (second phase) before evaluation of the cardiac function. STZ increased the fast-ing blood glucose level at 4 weeks of post-injection (490.3 +/- 40.1 mg/dL, P<0.01 compared with 201.7 +/- 12.5 mg/dL in vehicle control group). SEW2871 remained no effect on blood glucose level at 4 weeks (527.7+/-23.8 mg/dL, P=N.S. compared with STZ group) but aggravated the glucose level at 11 weeks (543.3 +/- 25.4, P<0.05, compared with 421.5 +/- 40.0 in STZ group). SEW2871 dilated the left ventricular lumen area (41.8 +/- 1.8 mm2, P<0.01, compared with 17.0 +/- 1.2 in control group) and decreased cardiac contractile force at 11 weeks (0.14 +/- 0.034 g, P<0.01, compared with 0.54 +/- 0.055 in control group). S1P1 receptor expression and cardiac fi brosis were increased in diabetic mice. Enhanced nitrotyrosine in heart tis-sue was also observed in SEW2871-treated hearts. In conclusion, chronic activation of S1P1 by SEW2871 aggravates cardiac remodeling and cardiac fi brosis and plays a detrimental role in diabetic cardiomyopathy.
218-ORHyperglycemia Enhances Myeloid Cell Proliferation and Impairs Atherosclerosis Regression in DiabetesPRABHAKARA R. NAGAREDDY, ANDREW J. MURPHY, BERND HEWING, LI-SHIN HUANG, ANN MARIE SCHMIDT, EDWARD A. FISHER, ALAN R. TALL, IRA J. GOLDBERG, New York, NY
Diabetes is one of the most potent risk factors for coronary heart diseases. Although atherosclerosis is initiated by deposition of cholesterol-rich lipo-proteins in the artery wall, the entry of monocytes into the lesion drive the disease progression and/or impair its resolution. We found that hyperglyce-mia, independently of cholesterol, drives monocytosis in type I diabetic mouse models. Monocytosis was caused by increased proliferation of progenitor cells in the bone marrow but not in spleen. Hyperglycemia-mediated monocytosis was driven by PU.1 (Purine-rich box-1) and CCAAT/enhancer-binding proteins, C/EBP and C/EBP , the key transcriptional factors involved in myelopoiesis. Lowering plasma glucose with sodium glucose co-transporter inhibitors de-

A59
For author disclosure information, see page 797.ADA-Funded Research
ORA
LS
CLOSED LOOP SYSTEMS
222-ORAutomated Management of Blood Glucose in Children With Type 1 Diabetes using a Bi-Hormonal Bionic PancreasSTEVEN J. RUSSELL, FIRAS H. EL-KHATIB, KENDRA L. MAGYAR, DAVID M. NATHAN, LYNNE L. LEVITSKY, NICOLE A. SHERRY, EDWARD R. DAMIANO, Boston, MA
Automated blood-glucose control with a bionic pancreas could reduce average blood plasma glucose (PG), glucose variability, and hypoglycemia, and improve quality of life for people with type 1 diabetes. Twelve sub-jects, 12-18 years of age, with type 1 diabetes and no endogenous insulin secretion each participated in a 51-hour closed-loop blood-glucose control experiment, which included six carbohydrate-rich meals and a period of structured exercise. Plasma glucose was managed with a fully automated bionic pancreas using a continuous glucose monitor (CGM) and a computer algorithm controlling subcutaneous delivery of insulin and glucagon with in-sulin pumps. A partial priming bolus of insulin was given at the beginning of each meal. The priming bolus was preset to 0.08 u/kg/meal on the fi rst day, and then automatically adapted on the second day with the goal of providing 45% of the 4-hour post-prandial insulin for each meal. Plasma glucose con-trol was evaluated with a reference quality measurement on venous blood every 15 minutes. There were no signifi cant differences in either PG or CGM glucose control between the fi rst and second days. The overall mean PG was 166 mg/dl on the fi rst day and 174 mg/dl on the second, with 61% of PG values in the 70-180 mg/dl range (CGM glucose averaged 162 mg/dl on the fi rst day and 158 mg/dl on the second). On average, the partial priming bolus accounted for 33±5% of the 4-hour post-prandial insulin on the fi rst day and 42±4% on the second. Hypoglycemia (PG<70 mg/dl) was rare with 10 instances (4 requiring supplemental carbohydrates) during 576 hours of closed-loop control (0.7% of total time). During the nighttime hours, mean PG was 137 mg/dl. An automated, bi-hormonal bionic pancreas achieved safe and effective glycemic control in children with type 1 diabetes with minimal hypoglycemia over two days of continuous use despite high-carbohydrate meals and exercise. A trial testing a wearable version of the system in close to free-living conditions is justifi ed.
223-ORDual-Hormone Closed-Loop (CL) System in Adults With Type 1 Dia-betes (T1D): Randomized Crossover TrialAHMAD HAIDAR, MARYSE DALLAIRE, ANNABELLE MATHIEU, AMMAR ALKHA-TEEB, ADÈLE CORIATI, ANNIE TARDIF, VIRGINIE MESSIER, MAUDE MILLETTE, PEIYAO CHENG, BENOIT BOULET, LAURENT LEGAULT, RÉMI RABASA-LHORET, Montreal, QC, Canada, Farwaniya, Kuwait, Tampa, FL
We are conducting a randomized crossover study to compare dual-hor-mone CL system with conventional pump therapy (CSII) in regulating glucose levels in 15 adults with T1D. Patients were admitted twice to a clinical facil-ity (CF) and received CL and CSII treatments. Patients received interventions starting from 16h00, exercised at 17h50 for 30 min (60% VO2max), ingested a meal at 19h20 (80g CHO for males and 60g CHO for females), ingested a 15g CHO snack at 22h00 and stayed in the CF until 7h00 next morning. In CL, based on glucose sensor readings (Sofsensor, Medtronic), subcutaneous insulin and glucagon were delivered following 10-minutes recommendations from a dosing algorithm. The algorithm is based on fuzzy-supervised model-based predictive controller combined with extended Kalman fi lter and a set of heuristic rules. Plasma glucose (PG) was measured using YSI2300 STAT Plus Analyser. Results of the fi rst 14 completed subjects (Age 47±12yrs, A1c 7.8±0.7%, total daily dose 0.6±0.1U/kg/day) demonstrate that CL increased the percentage of time for which PG is in target range by a median 15% [-1 to 21] (P = 0.009) and decreased the time less than 4 mmol/L by 2.1% [0-10.2] (P = 0.01). Seven patients (50%) had at least one hypoglycemic event (PG < 3.0 mmol/L) requiring oral treatment during CSII intervention compared with one patient (7%) in closed-loop (P = 0.04), demonstrating a 7-fold reduction. We conclude that dual-hormone CL combined with advanced algorithms could reduce the risk of hypoglycemia in adults with T1D. Comparisons between CL and CSII (median [IQR])
Time plasma glucose is (%)
CL CSII Paireddifference
P value
in target‡ 69 [46-85] 60 [25-72] 15 [-1 to 21] 0.009< 4.0 mmol/L 0.0 [0.0-3.0] 6.4 [0.0-12.2] -2.1 [-10.2 to 0.0] 0.01< 3.3 mmol/L 0.0 [0.0-0.0] 2.3 [0.0-5.9] -2.3 [-5.9 to 0.0] 0.008above target‡ 31 [11-49] 30 [23-63] -7 [-21 to 3] 0.14
‡Target range 4-8 mmol/L from 21h to 7h and 4-10 mmol/L otherwiseSupported by: Diabète Québec, Canadian Diabetes Association, JA Sève Chair,
and Medtronic
(Medtronic) with the LGS feature on or off. Exercise began after an overnight fast and continued until plasma glucose (YSI) reached 85 mg/dL. In LGS-ON experiments, the LGS feature stopped the pump for 2 h when a sensor glucose (SG) value 70 mg/dL was detected. Subjects were randomly assigned to Group A (LGS-ON fi rst) or Group B (LGS-OFF fi rst). Experiments were separated by at least 3 d. To achieve pre-defi ned criteria for success, some experiments had to be repeated. Hypoglycemia was signifi cantly less in successful LGS-ON vs. LGS-OFF experiements (138.3±76.68 vs 170.7±75.91 min, p=0.0006). The duration of hypoglycemia in successful LGS-ON experiments was 63.7 min less for Group A than for group B (p<0.01). The number of inductions prior to a suc-cessful LGS-ON experiment was lower for Group A than for group B (0.36±0.64 vs. 1.57±0.84, p<0.001), as was the cumulative duration of antecedent hypo-glycemia (Table). The difference in hypoglycemia duration between Groups A and B was not attributable to differences in SG rates of change, the duration of exercise, or AUC<70 in the 2 d before the successful induction (all p>0.3). The ASPIRE study shows that antecedent hypoglycemia can signifi cantly exac-erbate subsequent hypoglycemia. Despite the crossover design leading to an order effect, the LGS feature was shown to reduce hypoglycemia.
Hypoglycemia in Successful LGS-ON experiments in the In-Clinic ASPIRE studyCumulative hypoglycemia* duration prior to successful
LGS-ON experiment (mean ± SD, min)
Hypoglycemia* duration in the successful
LGS-ON experiment (mean ± SD, min)
Group A N=25 16.6 ± 57.3 107.8 ± 71.2Group B N=23 204.6 ± 123.7 171.5 ± 67.0p value <0.001 0.003*, defi ned as YSI <70 mg/dL
Supported by: Medtronic, Inc.
221-ORAutomatic Insulin Pump Suspension for Induced Hypoglycemia: The ASPIRE StudySATISH GARG, RONALD L. BRAZG, TIMOTHY S. BAILEY, BRUCE A. BUCKING-HAM, DAVID C. KLONOFF, JOHN SHIN, JOHN B. WELSH, FRANCINE R. KAUF-MAN, Aurora, CO, Renton, WA, Escondido, CA, Stanford, CA, San Mateo, CA, Northridge, CA
Automatic insulin pump suspension by the Medtronic Veo insulin pump system may safely and effectively reduce hypoglycemia. The ASPIRE study examined the utility of the low glucose suspend (LGS) feature in hypogly-cemia induced by overnight fasting and exercise. Fifty insulin pump users (56% male, mean [±SD] age 34.3 ± 12.4 yr, BMI 26.9 ± 4.3 kg/m2, A1C 7.9 ± 0.6%) exercised until their YSI glucose value was <85 mg/dL with LGS-ON (set to suspend insulin for 2 hours at sensor glucose values 70 mg/dL) and with LGS-OFF. A successful experiment was defi ned by YSI glucose values <70 and >50 mg/dL with an observation period of up to 4 h that was not interrupted by symptomatic hypoglycemia or protocol deviations. Of the 134 experiments, 98 were successful and 36 failed (Table). Failures were attributable to YSI values falling to <50 mg/dL, YSI values not reaching <70 mg/dL, and protocol deviations. The mean duration of hypoglycemia in the 98 successful experiments was signifi cantly less with LGS-ON compared to LGS-OFF (138.5 ± 76.68 vs. 170.7 ± 75.91 min, p=0.006). Mean nadir (59.5 ± 5.72 vs 57.6 ± 5.69 mg/dL, p=0.015) and mean end-observation YSI glucose values (91.4 ± 41.84 vs 66.2 ± 13.48 mg/dL, p<0.001) were both higher with LGS-ON than with LGS-OFF. The ASPIRE study showed the effi cacy of the LGS feature in reducing the duration and severity of hypoglycemia without the development of signifi cant rebound hyperglycemia.
ASPIRE ExperimentsLGS-ON
Experiments (n)LGS-ON
Subjects (n)LGS-OFF
Experiments (n)LGS-OFF
Subjects (n)Attempts 69 50 65 50SuccessfulAttempts
48* 48* 50 50
Failed Attempts 21 14 15 12YSI 70 mg/dL 9 8 5 5YSI < 50 mg/dL 9 5 8 7Protocol deviation 3 3 2 2* one subject’s YSI did not reach 70 mg/dL after 3 attempts and one subject’s YSI fell below 50 mg/dL on each of 3 attempts. These 2 subjects had both previously completed a successful LGS OFF session and refused to undergo further attempts.
Supported by: Medtronic, Inc.

A60
For author disclosure information, see page 797. ADA-Funded Research
ORA
LSPEDIATRIC OBESITY AND TYPE 2 DIABETES—PHENOTYPES AND GENOTYPES, PRE- AND POST-DIAGNOSIS
HbA1c < 5.7%n=161 (43% male)
HbA1c > 5.7-< 6.5%n=39 (38% male)
P
Age 14.1 ± 0.2 14.3 ± 0.4 0.68Race (% B/W) 37/63 67/33 0.001BMI (kg/m2) 33.6 ± 0.5 37.5 ± 0.8 <0.001Fasting insulin (mu/ml) 35.7 ± 1.4 47.9 ± 4.1 0.001IS (mg/kg/min per mu/mL) 2.8 ± 0.2 2.0 ± 0.2 0.02First phase insulin (mu/mL) 217 ± 10 247 ± 31 0.79DI (mg/kg/min) 511 ± 26 424 ± 56 0.01
Supported by: NIH (R01HD27503, K24HD01357 and UL1RR024153)
226-OREvidence of Early Beta Cell Defi ciency in Children who Develop Impaired Fasting Glucose—A 10-Year Longitudinal StudyJOANNE HOSKING, BRAD S. METCALF, ALISON N. JEFFERY, ADAM J. STREETER, MOHAMMOD MOSTAZIR, LINDA D. VOSS, TERENCE J. WILKIN, Plymouth, United Kingdom
Blood glucose levels are a combined function of the demand for insulin (insulin sensitivity) and the capacity of the beta cells to supply it. Impaired fasting glucose ( 5.6 mmol/l) is a predictor of future diabetes and increas-ingly common in children, but the extent to which it results from excess demand or failure of supply is unclear. We compared the trajectories of glu-cose, BMIsds, insulin resistance (HOMA-IR) and beta cell function (HOMA-B) in children who developed IFG and those whose glucose levels remained within the normal range annually from 5y to 15y. We also examined their association with corresponding measures in the parents at baseline. Fifty-fi ve children showed IFG, mostly after age 11y, the majority of whom (39) were boys. Fasting glucose rose progressively in both groups, but was higher throughout in those who developed IFG compared with those who did not (p= 0.002). IR and BMI correlated (r= 0.4, p< 0.001), but there was no difference in BMI at any age between those who showed IFG and those who did not (p = 0.58). IR was biphasic, falling from 5y and rising after 7y, but again was the same in both groups at all ages (p= 0.08). HOMA-B, on the other hand, was lower in those who developed IFG even at 5y (81.1 v 94.1, p= 0.02). Glucose levels of the parents whose children developed IFG were higher than those whose children did not (mother’s glucose: 4.9 v 4.6 mmol/l, p< 0.001; father’s glucose: 5.0 v 4.8 mmol/l, p= 0.03). There was no difference in the IR of ei-ther parent group (p 0.81), but the HOMA-B of the mothers whose children had IFG was lower (112.7 v 129.6, p= 0.01), IFG is common in contemporary children, and it appears to be dependent on a defect in beta cell function, which is already present at 5y. The parental associations suggest a possible genetic cause, which needs IR to reveal it. As the IR of puberty falls, further weight gain seems likely to be the determinant of progression to diabetes.
227-OROne Hour Glucose during an Oral Glucose Challenge Prospectively Predicts -Cell Deterioration and Prediabetes in YouthJOON YOUNG KIM, MICHAEL I. GORAN, CLAUDIA TOLEDO-CORRAL, MARC J. WEIGENSBERG, MYUNGHAN CHOI, GABRIEL Q. SHAIBI, Phoenix, AZ, Los Ange-les, CA
In adults, a 1-hr glucose concentration of 155 mg/dl during an Oral Glu-cose Tolerance Test (OGTT) prospectively predicts the development of type 2 diabetes (T2D). Whether this threshold is useful in younger populations is unknown. The purpose of this study was to examine the utility of a 1-hr glucose threshold 155 mg/dl to predict diabetes risk factors in high-risk Latino youth. Obese Latino youth with a family history of T2D (133 M / 100 F; 11.1 ± 1.7 yrs) underwent a baseline OGTT and were subsequently divided into two groups based upon 1-hr glucose concentrations (Below155: <155 mg/dl, n=151 or Above155: 155 mg/dl, n=82). Participants were followed for up to 8 years where serial frequently sampled IV glucose tolerance tests were performed to estimate insulin sensitivity (Si), acute insulin response (AIR), and -cell function using the disposition index (DI = Si X AIR). At base-line, no group differences were noted for BMI percentile, total fat mass, or Si while the Above155 group had lower AIR (1572.9 ± 1292.7 vs. 1848.2 ± 1246.4 μU/ml, p<0.01) and DI (2321.0 ± 120.0 vs. 2708.4 ± 100.0 X10⁻⁴ min-1,p<0.01) compared to the Below155 group. Using linear mixed model analy-sis, assignment in the Above155 group at baseline was associated with a signifi cantly lower DI over time even after controlling for fasting and 2-hour glucose (B=-20495.9, p<0.05). The pattern of change for the Above155 group was characterized by a steady decline in DI resulting in a 54.8% decrease by year 8. In contrast, Below155 was characterized by an initial decrease fol-lowed by an increase in DI of 28.6% by year 8. When data were restricted to
224-ORComparison of Two Closed Loop Algorithms With Open Loop Control in Type 1 DiabetesJ. HANS DEVRIES, ANGELO AVOGARO, CARSTEN BENESCH, DANIELA BRUT-TOMESSO, KAREN CALDWELL, CLAUDIO COBELLI, WERNER DOLL, SIMONE DEL FAVERO, LUTZ HEINEMANN, ROMAN HOVORKA, LALANTHA LEELARATHNA, YOERI M. LUIJF, JULIA MADER, LALO MAGNI, MARIANNA NODALE, JEROME PLACE, ERIC RENARD, CHIARA TOFFANIN, AP@HOME CONSORTIUM, Amster-dam, The Netherlands, Padua, Italy, Neuss, Germany, Cambridge, United Kingdom, Graz, Austria, Pavia, Italy, Montpellier, France
Closed loop systems aim to automate blood glucose control in patients with type 1 diabetes by optimal insulin delivery, driven by a control algo-rithm based on continuous glucose monitoring (CGM). Blood glucose was controlled for 23 h in 47 patients in six centers by a Model Predictive Control algorithm developed at the University of Pavia with a Safety Supervision Module from UVA & UCSB (iAP), or at Cambridge University (CAM), with a patient driven open loop (OL) control session in a randomized three-way cross-over design, during three clinical research center admissions including three meals and an exercise bout. CGM data were provided by the Dexcom Seven Plus (Dexcom Inc, San Diego, CA, USA) and insulin was administered by the Omnipod Insulin Pump (Insulet Corp, Bedford, MA, USA), either au-tomatically with the Artifi cial Pancreas System (UCSB/Sansum, CA, USA) (three centers) or manually (three centers). For glucose reference measure-ments the YSI glucose analyzer was used. An intention-to-treat analysis was done using a general linear model for repeated measures. There was no signifi cant difference in time spent in euglycemia (70-144, postmeal 180 mg/dL) between closed loop and open loop (62.6% for OL, 59.2% for iAP and 58.3% for CAM, overall P=0.377). Mean glucose level was signifi cantly lower in open loop (126 for OL vs. 148 for iAP and 149 mg/dL for CAM, overall P=0.001). There was signifi cantly less time spent in hypoglycemia (<70 mg/dL) during closed loop (6.4%, 2.1 and 2.0%, overall P=0.001) with a trend towards less hypoglycemia 50 mg/dL (0.92%, 0.43 and 0.17%, overall P= 0.072). There were no signifi cant differences in any of these outcomes be-tween the two closed loop algorithms. From the largest and fi rst multicenter head-to-head closed loop study performed so far, we conclude that both CAM and iAP algorithms allow safe automated control of blood glucose in a closed loop system, also during meal and exercise challenges, with less hypoglycemia at the expense of a higher mean glucose.
Supported by: European Community Framework Programme 7 (FP7-ICT-2009-4)
PEDIATRIC OBESITY AND TYPE 2 DIABETES—PHENOTYPES AND GENOTYPES,
PRE- AND POST-DIAGNOSIS
225-ORHbA1c Diagnostic Categories and -Cell Function Relative to Insu-lin Sensitivity in Overweight/Obese AdolescentsLINDSEY A. SJAARDA, SOJUNG LEE, HALA TFAYLI, FIDA BACHA, ELISA AN-DREATTA, SILVA ARSLANIAN, Pittsburgh, PA, Beirut, Lebanon, Houston, TX
The recommended HbA1c diagnostic categories remain controversial and their utility in doubt in pediatrics. Because impaired fasting glucose (IFG) and impaired glucose tolerance (IGT) in youth are linked to impaired insulin secretion, we hypothesized that alterations in the pathophysiological mech-anisms of type 2 diabetes (T2DM) may be evident in the ADA recommended at-risk/prediabetes category. Thus, we compared insulin sensitivity (IS) and
-cell function in overweight/obese adolescents categorized with predia-betes (HbA1c 5.7-<6.5%) to those with normal HbA1c (<5.7%). Adolescents (n=200) with body mass index (BMI) 85th percentile were evaluated by a 2-h oral glucose tolerance test, body fat by dual energy x-ray absorptiom-etry, IS by a 3-h (80mu/m2/min) hyperinsulinemic-euglycemic clamp, and fi rst phase insulin secretion by a 2-h hyperglycemic clamp (~225 mg/dL). -cell function relative to IS was calculated (disposition index, DI = IS × fi rst phase insulin). Differences between normal and prediabetes groups (Table) were adjusted for race since HbA1c and DI are known to be higher in blacks (B) than whites (W). The prediabetes group had lower IS, lower -cell function relative to IS (DI) and higher % body fat (P=0.003). Rates of IGT (25 vs. 33%) and IFG (23 vs. 36%) were not different between the two groups (P>0.10). In conclusion, overweight/obese adolescents with HbA1c in the currently recommended at-risk/prediabetes range manifest metabolic impairments associated with heightened risk for T2DM. The predictive value of HbA1c for the development of T2DM in youth remains to be determined.

A61
For author disclosure information, see page 797.ADA-Funded Research
ORA
LS
PEDIATRIC OBESITY AND TYPE 2 DIABETES—PHENOTYPES AND GENOTYPES, PRE- AND POST-DIAGNOSIS
of the TODAY cohort (those who did and did not complete accelerometry did not statistically differ by age, gender, race/ethnicity, or BMI). A comparison of mean (SE) minutes of PA and sedentary time is presented.
Statistical signifi cance for between group differences is based on means and standard error of the means for NHANES and TODAY, * P<.05, ** P<.01Overall, minutes of moderate/vigorous PA were low and similar between the two cohorts. However, relative to the obese NHANES subset, TODAY youth had signifi cantly higher levels of sedentary behavior for all age/gender groups (p<0.01). These data demonstrate that treatment efforts in T2D youth should focus on increasing non-sedentary activities.
Supported by: NIDDK/NIH
230-ORBody Composition during the TODAY Randomized Clinical TrialKENNETH COPELAND, LAURE EL GHORMLI, FOR THE TODAY STUDY GROUP, Oklahoma City, OK, Washington, DC
TODAY (Treatment Options for type 2 Diabetes in Adolescents and Youth) examined the effects of three treatments on time to glycemic failure in a cohort of 699 youth with recent-onset type 2 diabetes, followed at least 2 years. The treatment groups were (1) metformin alone (M), (2) metformin + rosiglitazone (M+R), and (3) metformin + intensive lifestyle (M+L). Body composition was measured by anthropometry and DEXA. Differences across treatments at 24 months were tested with baseline value in the model as a covariate. Data presented include measures collected prior to glycemic failure - i.e., while the participant was taking the randomized treatment. The table provides results at 24 months for the overall sample. There was a sig-nifi cant treatment effect for BMI, BMI z-score, waist circumference, abdomi-nal height, fat, and percent fat free mass (FFM) (all p-values <0.05). BMI, BMI z-score, waist circumference, abdominal height, and fat were lowest in the M+L group and highest in the M+R group, whereas FFM was highest in the M+L group but lowest in the M+R group. Similar patterns were seen in males and in females. There were no differences across treatments in the non-Hispanic Black subgroup. FFM differed by treatment group among Hispanic participants (p=0.0034), and BMI and waist circumference differed by treat-ment in non-Hispanic Whites (p=0.0044 and p=0.0097, respectively).
only participants with normal glucose tolerance at baseline, 70% of those in the Above155 group progressed to prediabetes compared to only 43% in the Below155 group (p<0.01). These data suggest a 1-hour glucose threshold of 155 mg/dl during an OGTT may predict future deterioration of -cell function and progression to prediabetes among obese Latino youth.
Supported by: NIH (R01 DK 59211)
228-ORIs Prevalence of Type 2 Diabetes Increasing in Youth? The SEARCH for Diabetes in Youth StudyDANA DABELEA, ELIZABETH MAYER-DAVIS, JENNIFER W. TALTON, RICHARD F. HAMMAN, RONNY A. BELL, LAWRENCE M. DOLAN, JASMIN DIVERS, GIUSEPPI-NA IMPERATORE, LENNA L. LIU, BARBARA LINDER, ANWAR MERCHANT, KRISTI REYNOLDS, SHARON SAYDAH, FOR THE SEARCH FOR DIABETES IN YOUTH STUDY, Aurora, CO, Chapel Hill, NC, Winston-Salem, NC, Cincinnati, OH, Atlanta, GA, Seattle, WA, Bethesda, MD, Columbia, SC, Pasadena, CA
Type 2 diabetes (T2D) among youth is of increasing concern, with some reports suggesting an epidemic. However, there is a paucity of population-based data to quantify such trends. SEARCH aimed to estimate temporal changes (2001 to 2009) in the prevalence of T2D in youth. Data from four geographic-based SEARCH sites were included (Colorado, South Carolina, Ohio and Washington). Similar methods were used for 2001 and 2009 preva-lent cases. Cases had a physician diagnosis of T2D and were < 20 years on December 31, 2001 and 2009, respectively. Population denominators were projected from age- race- and sex-specifi c population counts for youth < 20 years old using vintage 2009 US census data. Race/ethnicity was catego-rized as non-Hispanic white (NHW), Hispanic (HISP), African American (AA), Asian/Pacifi c Islander (API) and American Indian (AI). A total of 382 and 464 youth with T2D prevalent in 2001 and 2009 were included. Completeness of ascertainment was estimated at 91% in 2001 and 88% in 2009 using cap-ture-recapture. Since T2D was exceedingly rare below 10 years, prevalence estimates in 2001 and 2009 (per 1000) are presented for youth age 10 years, by sex, race/ethnicity, and age-group (Figure). Overall, the prevalence of T2D increased from 0.29 (0.27-0.33) to 0.36 (0.32-0.39, p=0.007), a 21% increase over eight years. The increase was signifi cant in females (p=0.003), HISP (p=0.0002) and NHW youth (p=0.05) and not signifi cant among AA, API and AI youth. Our data suggest that the prevalence of diagnosed T2D is in-creasing in U.S. youth. A longer study period is needed to fully quantify these trends in all racial/ethnic groups.
Supported by: The CDC with support from the NIDDK
229-ORPhysical Inactivity and Activity in Youth With Recent Onset of Type 2 DiabetesANDREA KRISKA, LINDA DELAHANTY, SHARON EDELSTEIN, NANCY AMO-DEI, JENNIFER CHADWICK, KENNETH COPELAND, BRYAN GALVIN, LAURE EL GHORMLI, MOREY HAYMOND, MEGAN KELSEY, CHAD LASSITER, ELIZABETH MAYER-DAVIS, KERRY MILASZEWSKI, AMY SYME, Pittsburgh, PA, Boston, MA, Washington, DC, San Antonio, TX, Oklahoma City, OK, Houston, TX, Aurora, CO, Philadelphia, PA, Chapel Hill, NC, New Haven, CT
With the rise of type 2 diabetes (T2D) in youth, it is critical to investi-gate factors such as physical activity (PA) and sedentary time (inactivity) that may be contributing to this public health problem. We compared PA and inactivity levels in youth with T2D to a similarly aged, obese subset of the NHANES (2005-2006) cohort. The 699 youth (aged 10-17 years) with T2D were part of the Treatment Options for type 2 Diabetes in Adolescents and Youth (TODAY) multi-center study. Accelerometry measurement was similar in TODAY and NHANES. At baseline, accelerometry was completed in 35%

A62
For author disclosure information, see page 797. ADA-Funded Research
ORA
LSINSULIN ACTION—METABOLISM
observed the rs738409 variant was associated with HFF% (p<.001) and ALT levels (p=0.010). ALT levels and HFF% were signifi cantly infl uenced by the interaction between genotype and n6/n3 independent of age, gender BMI and ethnicity (0.01 and 0.05, respectively) . HFF% and ALT levels were, in fact, related to the n6/n3 consumption only in subjects homozygote for the G allele of the rs738409 (r2=0.42, p=0.0036 and r2=0.38, p=0.0086, respec-tively). These fi ndings suggest that obese youths carrying the GG genotype are susceptible to develop hepatic steatosis and liver damage when dietary n6/n3 intake is high. Thus, specifi c dietary interventions based on genetic predisposition may lead to more effective therapeutic outcomes for NAFLD.
Supported by: NIH, AHA
INSULIN ACTION—METABOLISM
233-ORImproved Insulin Sensitivity in a Mouse Model of Mitochondrial Dys functionDEEPA SATHYASEELAN, DANIEL PULLIAM, NING ZHANG, HANYU LIANG, LAU-REN SLOANE, ADAM SALMON, NICOLAS MUSI, HOLLY VAN REMMEN, San An-tonio, TX
A decline in the oxidative phosphorylation capacity of mitochondria plays a critical role in the development of insulin resistance. Surfeit locus protein 1 (Surf1) is essential for the assembly of electron transport chain complex IV (Cytochrome c oxidase, COX) and Surf1-/- mice have a 50-80% decrease in COX activity compared to control littermates, yet a signifi cant increase in lifespan. Because mitochondrial dysfunction causes insulin resistance, we asked whether Surf1-/- mice with specifi c down regulation of COX activ-ity have altered insulin sensitivity. Surprisingly, insulin sensitivity was sig-nifi cantly increased in Surf1-/- mice both under normal chow as well as high fat diet, while glucose tolerance remained unaffected. Surf1-/- mice have a reduced body weight that can be attributed to decreased fat mass due to increased fatty acid oxidation. We also observed a strong up-regulation of PGC-1alpha and PPARalpha as well as increased mitochondrial biogenesis in multiple tissues suggesting the up-regulation of compensatory pathway(s) in response to reduced COX activity. One such pathway is the mitochondrial unfolded protein response (mtUPR), a retrograde signaling response that re-sults in the induction of mitochondrial specifi c chaperones and proteases involved in refolding misfolded proteins and degrading damaged proteins. Surf1-/- mice have an increase in the expression of mitochondrial specifi c chaperone (HSP60) and proteases (CLPP, Lon) that have been linked to the mtUPR. Over-expression of mitochondrial protease Lon in vitro increases fatty acid oxidation as well as glucose uptake. This suggests a novel role of mitochondrial matrix protease Lon, a mtUPR component involved in the maintenance of mitochondrial homeostasis, in insulin sensitivity. In sum-mary, our fi ndings suggest that targeted down regulation of COX activity do not cause insulin resistance, rather improves insulin sensitivity through up-regulation of compensatory pathway(s).
234-ORInsulin Concentration-Dependent Effect on Mitochondrial Capacity in Obese and Lean SubjectsESTHER PHIELIX, JULIA SZENDROEDI, GILLES SEQUARIS, TOMAS JELENIK, MARKUS ZEPPETZAUER, MICHAEL RODEN, Düsseldorf, Germany
Mitochondrial function has been suggested to be lower in insulin resis-tant humans. In vivo assessment of skeletal muscle ATP synthesis showed that impaired insulin stimulation of glucose uptake relates to blunted insulin stimulation of ATP synthetic fl ux rates. It is yet unclear if insulin stimulates mitochondrial function directly or via increased substrate fl ux. We examined if ex vivo insulin stimulation directly increases mitochondrial capacity in hu-man muscles. In total, 14 lean and 6 obese glucose tolerant volunteers were included (age: 27.3±6.2 and 26.2±5.4 years; BMI: 23.5±3.5 and 44.6±6.3 kg/m2, p<0.05, respectively). Muscle biopsies were taken from the m. vastus lateralis before a hyperinsulinemic-euglycemic clamp was performed and four muscle pieces were incubated with 0, 4, 40 or 100 nM insulin for 2.5 h. Mitochondrial capacity was measured in permeabilized fi bers using high-resolution respirometry in the presence of glycolytic and tricarboxylic acid cycle derived substrates (pyruvate 5 mM, glutamate 10 mM and succinate 10 mM). Obese humans were more insulin resistant than lean participants (M-value: 2.9±3.2 v.s. 10±3.3 mkg-1min-1, p<0.05). Ex vivo insulin stimula-tion increased mitochondrial capacity (+11% and +21%, p<0.05) as well as maximal uncoupled respiration (+11% and +18%, p<0.05) in a concentration-dependent manner between 4 and 40 nM compared with 0 nM of insulin. In contrast, myocellular mitochondrial capacity did not increase upon insu-lin stimulation in obese insulin resistant glucose tolerant humans. Insulin
Mean (SD) of Body Composition Measurements at Baseline and 24 Months by Treatment Group
Metforminalone
Metformin + Rosiglitazone
Metformin + Lifestyle
Measurement Baseline 24 Months Baseline 24 Months Baseline 24 MonthsBMI 35.8 (8.1) 36.7 (9.1) 35.0 (7.7) 38.3 (8.1) 34.1 (7.1) 35.4 (8.4)BMI z-score 2.3 (0.4) 2.2 (0.6) 2.2 (0.5) 2.3 (0.5) 2.2 (0.5) 2.1 (0.5)Waist circumference (cm) 110.4 (16.6) 110.8 (17.5) 109.0 (17.1) 114.8 (19.1) 106.6 (16.2) 108.3 (17.5)Abdominal height (cm) 24.9 (5.2) 25.0 (6.0) 24.3 (4.0) 25.9 (5.8) 24.8 (6.9) 24.5 (4.0)Total fat mass (kg) 33.7 (9.9) 36.1 (12.0) 33.5 (10.2) 39.7 (10.6) 32.6 (9.8) 32.2 (9.4)Total fat free mass (%) 62.7 (6.4) 61.6 (7.8) 62.4 (5.9) 60.0 (6.7) 62.2 (6.2) 63.8 (7.3)
In conclusion, all treatment groups had increases in almost all measures of body composition within the fi rst two years of the study, with most mea-sures worse in the M+R group compared to the other two groups.
Supported by: NIDDK/NIH
231-ORA Common Variant in the TRIB1 Gene is Associated With Triglycer-ides Levels, Lipoprotein Subclasses and ALT Levels in Obese Chil-dren and AdolescentsNICOLA SANTORO, BRIDGET PIERPONT, LEIF GROOP, SONIA CAPRIO, New Ha-ven, CT, Lund, Sweden
Recent genome wide association studies have identifi ed a single nucle-otide polymorphism, rs17321515, in a locus at chromosome 8q24 as having the G allele associated with lower levels of plasma triglycerides (TG). This locus contains only one annotated gene, tribbles homolog 1(TRIB1), which has been shown to be involved in lipoprotein metabolism in animal studies. We aimed to determine whether this gene variant might be associated with triglyceride, lipoprotein subclasses and ALT levels in a multiethnic cohort of obese children and adolescents. We studied a multiethnic group of 482 obese children and adolescents (200 Caucasians, 140 African Americans, 142 Hispanics, mean age 13.2+/-3.3 years, mean z-score BMI 2.16+/-0.74). Patients underwent an OGTT, lipoprotein subclasses measurement by pro-ton NMR and a subset of 170 children underwent a fast gradient MRI to measure the Hepatic fat content (HFF%). Genotyping was performed with the use of matrix-assisted laser desorption-ionization time-of-fl ight mass spectrometry on the MassARRAY platform (Sequenom). The prevalence of the A allele was 0.55 in Caucasians, 0.45 in African Americans and 0.55 in Hispanics. Subjects homozygote for the A allele (n=131) showed signifi cantly higher TG, (p=0.004), larger VLDL (p= 0.02), higher APO B100 levels (p= 0.004) and smaller LDL (p=0.02) than subjects carrying the other genotypes (AG n=267 and GG n=113) independent of age, gender, z-score BMI and ethnicity. Moreover, subjects carrying the AA genotype showed also higher ALT lev-els (p=0.004), while no difference in terms of HFF% was observed across the genotypes (p=0.20). The A allele of the rs17321515 SNP near the TRIB1 gene is associated with a proatherogenic profi le as well as with liver damage in obese children and adolescents, thus suggesting that the TRIB1 gene may be a link between hepatic fat metabolism and liver damage occurring in obese youths.
Supported by: NIH, AHA
232-ORInteractive Effect Between the PNPLA3 rs738409 and Dietary n6/n3 on Hepatic Fat Accumulation and ALT Levels in Obese YouthsGRACE KIM, MARY SAVOYE, SONIA CAPRIO, ELVIRA DURAN, JESSICA KUBAT, KATIE MAROTTO, MELISSA SHAW, NICOLA SANTORO, New Haven, CT
A common missense variant (rs738409) characterized by a C-to-G substi-tution encoding an isoleucine-to-methionine substitution at the amino acid position 148 , in the patatin like phospholipase 3 (PNPLA3) gene has been recently associated with increased hepatic fat deposition and ALT levels in adults and children. Previous studies describing the relationship between dietary intake and NASH have shown a higher intake of omega-6 to omega-3 fatty acids ratio (n6/n3) among NASH patients. We determined whether the infl uence of the PNPLA3 rs738409 variant on hepatic fat accumulation is modulated by an excess intake of omega-6 PUFA relative to omega-3 PUFA. We studied 124 obese children and adolescents (53% girls; 47% Caucasians; 25% African Americans and 28% Hispanics; mean age 14.9±3.2; mean BMI 30.7±7.2). A 3-day food record was obtained by all subjects and dietary com-position was assessed with the Nutrition Data System for Research (NDS-R 5.0_35). Subjects underwent an oral glucose tolerance test (OGTT) and a Magnetic Resonance Imaging study to assess the liver fat content (HFF%) and were genotyped by automatic sequencing for the rs738409 variant. Sixty eight subjects were CC, 38 were CG and 18 were GG. As previously

A63
For author disclosure information, see page 797.ADA-Funded Research
ORA
LS
INSULIN ACTION—METABOLISM
237-ORBrain Insulin Regulates Systemic Branch-Chain Amino Acid LevelsANDREW C. SHIN, MARTIN FASSHAUER, ELIZABETH ZIELINSKI, CLAUDIA LINDT-NER, THOMAS SCHERER, JAMES O’HARE, JIANYING ZHOU, WEI-JUN QIAN, CHRISTOPHER B. NEWGARD, CHRISTOPHER J. LYNCH, CHRISTOPH BUETTNER, New York, NY, Richland, WA, Durham, NC, Hershey, PA
Circulating branched-chain amino acid (BCAA) levels are markedly el-evated in obese and diabetic individuals, and they are the earliest predictor for the future risk of diabetes. Moreover, Roux-en-Y gastric bypass surgery that commonly improves metabolic control and often cures type 2 diabetes leads to reduced circulating BCAA levels. The cause of increased BCAA lev-els in obesity and diabetes is likely decreased utilization and/or catabolism and not increased BCAA intake, although the mechanisms are poorly un-derstood. Insulin acutely lowers circulating BCAA levels in normal healthy individuals, but less so in diabetic individuals, implicating insulin resistance as a major cause for the elevated BCAA levels in obesity and diabetes. We fi rst show through euglycemic clamp studies that insulin dose-dependently lowers plasma BCAA levels in rats. Insulin regulates nutrient partitioning through both direct effects on peripheral organs such as the liver, but also indirectly through changes in organ crosstalk. Insulin signaling within the mediobasal hypothalamus (MBH) orchestrates nutrient partitioning for ex-ample hepatic glucose production through the autonomic nervous system. Here we demonstrate that brain insulin signaling plays an important role in the regulation of systemic BCAA levels. Infusion of 2uU of insulin into the MBH acutely lowered circulating BCAA levels. Metabolomic analysis further demonstrated that circulating degradation products of BCAAs such as short chain acylcarnitines are also decreased. This lowering of BCAA is likely due to the induction of several enzymes participating in BCAA catabo-lism including branched-chain alpha keto-acid dehydrogenase (BCKDH), the rate-limiting enzyme in BCAA catabolism, as demonstrated through shot-gun proteomics. These fi ndings suggest that brain insulin controls circulating BCAA levels at least in part by regulating BCAA catabolism in liver. Elevated plasma BCAA levels in obesity and diabetes may be due to hypothalamic insulin resistance.
238-ORNicotinamide N-Methyltransferase (NNMT) is a Novel Regulator of Nuclear Factor Erythroid 2-Related Factor (Nrf2) Activity and Pro-duction of Reactive Oxygen Species (ROS) in AdipocytesQIN YANG, FENGYING GONG, YA-CHIN WANG, DANIEL KRAUS, ODILE D. PERO-NI, BRETT P. MONIA, SANJAY BHANOT, BARBARA B. KAHN, Boston, MA, Carls-bad, CA
Chronic elevation of ROS in adipocytes plays a causal role in insulin re-sistance. Nrf2 is a master transcriptional regulator of antioxidant defense genes such as Heme oxygenase-1 (HO-1) and NADPH quinine oxidoreduc-tas-1 (Nqo1). Responses of Nrf2 to ROS are critical for maintaining cellular ROS homeostasis. Our data show that despite increased ROS in adipocytes in obesity, the expression of Nrf2 targets HO-1 and Nqo1 are paradoxically reduced, suggesting failure of Nrf2 to respond to ROS. The aim of current study is to determine the mechanism by which Nrf2 fails to respond to ROS in adipocytes in insulin resistant states. Here we show NNMT is a novel inhibitor of Nrf2 activity. NNMT methylates nicotinamide using S-adenosyl-methionine as a methyl donor. Adipose NNMT protein is increased in white adipose tissue (WAT) of obese mice such as ob/ob, db/db, and high-fat diet fed mice compared to lean controls. NNMT knockdown in WAT and liver by antisense oligonucleotides (ASO) protects mice from diet-induced obesity and improves insulin sensitivity and glucose tolerance. NNMT knockdown in WAT in vivo increases HO-1 and Nqo1 expression, consistent with Nrf2 activation. The effect appears to be direct since NNMT knockdown in 3T3-L1 adipocytes similarly activates Nrf2. Regulation of Nrf2 by NNMT is further demonstrated with luciferase transcriptional assays. NNMT overexpression suppresses, while NNMT knockdown enhances Nrf2 transcriptional activ-ity. Finally, NNMT knockdown decreases ROS production in 3T3-L1 cells, which is abolished by Nrf2 siRNA treatment. These data indicate NNMT is a novel regulator of Nrf2 activity. Increased adipose NNMT in obesity may be responsible for suppressed Nrf2 activity, leading to chronic ROS elevation and insulin resistance. Thus, targeting NNMT could be a novel strategy for improving insulin sensitivity by regulating Nrf2 activity and ROS production in adipocytes.
directly stimulates muscular mitochondrial capacity in insulin sensitive humans. Insulin resistance at the mitochondrial level seems to be an early defect in insulin resistant glucose tolerant obese humans.
235-ORImportance of Pyruvate Dehydrogenase Kinases in the Regulation of Blood Levels of Glucose and the Metabolism of Ketone Bodies and Fatty AcidsYASMEEN RAHIMI, NAM HO JEOUNG, PEIGFEI WU, MARTHA KUNTZ, PAUL W. LEE, ROBERT A. HARRIS, Indianapolis, IN, Daegu, Republic of Korea, Torrance, CA
The importance of pyruvate dehydrogenase kinases (PDK) 2 and 4 in regu-lation of the pyruvate dehydrogenase complex (PDC) was assessed in single and double knockout (DKO) mice. PDK2 defi ciency caused higher PDC activity and lower blood glucose in the fed state. PDK4 defi ciency caused similar ef-fects in the fasting state. DKO intensifi ed these effects in both states. PDK2 defi ciency had no effect on glucose tolerance, PDK4 defi ciency produced a modest effect, but DKO caused a marked improvement, lowered insulin levels, and increased insulin sensitivity. However, the DKO mice were more sensitive than wild-type mice to long-term fasting, succumbing to hypogly-cemia, ketoacidosis, and hypothermia. Stable isotope fl ux analysis indicated that hypoglycemia was due to a reduced rate of gluconeogenesis and that acetyl-CoA derived from glucose contributed to ketone body synthesis in the DKO mice. DKO mice fed a high fat diet had improved glucose tolerance, decreased adiposity, and were euglycemic (107 ± 11 mg/dI compared to 197 ± 11 mg/dI in wild-type mice) due to reduction in the rate of gluconeogenesis (9.7 ± 0.3 mg/kg/min compared to 18.8 ± 0.8 mg/kg/min in wild-type mice; p<0.01). Like chow-fed DKO mice, high fat fed DKO mice are unusually sensi-tive to fasting because of ketoacidosis (pH 6.87 ± 0.08) and hypothermia (24.4 ± 0.9 °C). PDK defi ciency results in greater PDC activity which limits the availability of pyruvate for oxaloacetate synthesis. Low oxaloacetate results in overproduction of ketone bodies by the liver and inhibition of ketone body and fatty acid oxidation by peripheral tissues, culminating in ketoacidosis and hypothermia. The fi ndings establish that PDK2 is more important in the fed state, PDK4 is more important in the fasted state, survival during long-term fasting depends upon regulation of the PDC by both PDK2 and PDK4, and that the PDKs are important for the regulation of ketone body metabo-lism and fatty acid oxidation.
Supported by: T32 Diabetes and Obesity Predoctoral Fellowship (T32 DKO 64466)
236-ORTRIB3 Mediates Glucose-Induced Insulin Resistance and its In-duction by High Glucose Requires the Hexosamine Biosynthetic PathwayWEI ZHANG, JIARONG LIU, LING TIAN, QINGLAN LIU, YUCHANG FU, W. TIMO-THY GARVEY, Birmingham, AL
Our group has previously demonstrated that Tribbles homolog 3 (TRIB3), a negative regulator of Akt activity, is induced by glucose and mediates glu-cose-induced insulin resistance in cultured muscle cells. We also reported that TRIB3 expression in fat and muscle is altered during short-term nutri-ent excess and fasting, supporting its role as a nutrient sensor and regula-tor. In the current study, we endeavored to determine whether TRIB3 could mediate hyperglycemia-induced insulin resistance in vivo, and whether the induction of TRIB3 by glucose is dependent upon the nutrient-sensing hexosamine biosynthetic pathway (HBP). In STZ-induced diabetic rats, TRIB3 protein expression in skeletal muscle was increased by 92% (p<0.05) after 10 days of hyperglycemia when compared with controls, and both glycemia and muscle TRIB3 levels were restored towards normal by exogenous insulin therapy. The role of the HBP in the induction of TRIB3 by high glucose was examined in L6 muscle cells. First, the induction of TRIB3 expression by 25 mM glucose was prevented by azaserine, an inhibitor of GFAT which is the rate-limiting enzyme in the HBP pathway. Second, TRIB3 expression was also substantially stimulated (62.5%) by glucosamine (24 hr, 0.5 mM) which bypasses GFAT, accompanied by a 45% decrease in the insulin-stimulated glucose transport rate, and both responses were not affected by azaserine. Further, shRNA-mediated knockdown of TRIB3 inhibited the ability of both high glucose and glucosamine to induce insulin resistance when compared with scramble RNA control cells. In conclusion, our results indicate that TRIB3 is induced by high glucose, and this response is mediated by glucose metabolism via the HBP; 2) glucose-induced insulin resistance in muscle cells is dependent upon TRIB3. These data provide the fi rst mechanistic link between the HBP fl ux and insulin resistance, and point to TRIB3 as a novel target for treatment of glucose-induced insulin resistance.
Supported by: NIH (DK038746, DK083562), DRTC (P60 DK079626) and VA Merit Review Program

A64
For author disclosure information, see page 797. ADA-Funded Research
ORA
LSNEW PLAYERS IN ENERGY METABOLISM
NEW PLAYERS IN ENERGY METABOLISM
241-ORLymphocytes: Key Players in the Development of Diet Induced He-patic SteatosisELISAVET KODELA, STAMATIS THEOCHARIS, KIHWA KANG, MARIA MOISIDOU, CHRISTINA KOUSKOUTI, MARK SLEEMAN, KATIA KARALIS, Athens, Greece, Tar-rytown, NY, Melbourne, Victoria, Australia, Boston, MA
Obesity is a chronic, active infl ammatory disease. The signifi cance of activated macrophages in the pathogenesis of obesity-associated insulin resistance and the metabolic syndrome has been well described. Recent studies in diet-induced obese mice have demonstrated a critical role for lymphocytes in the development of insulin resistance and infl ammation in the adipose tissue. The aim of this study was to further elucidate the role of lymphocytes in the pathogenesis of obesity with an emphasis in the de-velopment of non-alcoholic fatty liver disease (NAFLD). We compared the responses of the lymphocyte-defi cient rag1-/- and wild-type (WT) mice to high-fat diet (HFD) - induced obesity with particular emphasis in liver pathol-ogy. Following 8-10 weeks of HFD we found similar body weight changes in both genotypes and comparable serum glucose levels, whereas rag1-/- mice exhibited increased insulin sensitivity, as assessed by the insulin tolerance test. Importantly, rag1-/- mice showed no histological signs of liver steatosis in contrast to the signifi cant infi ltration detected in the wild-type mice. Ge-nomic and proteomic analyses of liver and adipose tissues from both groups revealed signifi cant differences in the expression of genes involved in lipid synthesis and oxidation, in agreement with the histological picture. Prelimi-nary fi ndings from HFD-fed rag1-/- reconstituted with lymphocytes from WT mice, show signifi cantly improved liver histology. On-going in vitro studies are also in accordance. These fi ndings provide evidence for a critical role of lymphocytes in hepatic lipid metabolism and insulin sensitivity in hyperca-loric states. The exact molecular factors mediating the above effects and their potential use in the development of novel therapeutic approaches for NAFLD are under investigation.
Supported by: EASD
242-ORInsulin Activates Erk1/2 Signaling in the Dorsal Vagal Complex to Inhibit Glucose ProductionBEATRICE M. FILIPPI, CLAIR S. YANG, TONY K. LAM, Toronto, ON, Canada
Hypothalamic insulin signaling inhibits glucose production through the activation of hypothalamic PI3-Kinase in rodents. It is currently unknown whether extra-hypothalamic brain region(s) mediate insulin to regulate glu-cose homeostasis. We here fi rst report that insulin injection into the hy-pothalamus or dorsal vagal complex (DVC) of rats independently activated insulin receptors by 2- or 4-fold, respectively. Insulin activated PI3-kinase and AKT in the hypothalamus but not in the DVC. DVC insulin administration instead activated ERK1/2, and the activation was associated with an inhibi-tion of glucose production during the pancreatic (basal insulin)-euglycemic clamps (GP mg/kg/min; DVC Insulin 5.4±0.5 vs. saline 8.8±0.5, p<0.01). Fur-thermore, inhibition of DVC ERK negated the ability of DVC insulin infusion to lower glucose production (GP mg/kg/min; DVC ERK inhibitor 9.7±1). Impor-tantly, circulating hyperinsulinemia failed to inhibit glucose production when DVC ERK signaling was disrupted (GP mg/kg/min; DVC ERK inhibitor 5.6±0.4 vs. saline 0.6±0.4, p<0.01), while direct DVC insulin administration failed to activate ERK and lower glucose production (GP mg/kg/min; HFD-DVC Insulin 9.4±0.3 vs. saline 9.7±0.6) in high-fat fed rats. In summary, DVC is a novel site of insulin action in which insulin triggers a PI3-kinase independent but an ERK-dependent pathway to inhibit glucose production, and of insulin re-sistance in high-fat feeding.
243-ORReduction of HIF1 Expression With Antisense Oligonucleotide Lowered Adiposity and Improved Insulin Sensitivity in High-Fat Diet-Fed MiceXING XIAN YU, LYNNETTA M. WATTS, BRETT P. MONIA, SANJAY BHANOT, Carlsbad, CA
Obesity-associated hypoxia in fat tissue is postulated as a possible con-tributor to obesity-related insulin resistance (IR). HIF1 , a key mediator of hypoxic response, is highly expressed in fat and elevated in obese fat. How-ever, data regarding its role in metabolism remain controversial. To evaluate the role of HIF1 after pharmacological inhibition in target tissues, we used an antisense approach to reduce its expression in liver and fat tissues. Male C57BL/6 mice fed a high-fat (HF) diet for 4 wk were subsequently treated with a HIF1 -specifi c antisense oligonucleotide (ASO) or a control (Cnl) ASO
239-ORMyeloid Expression of ABCA1 Inhibits Macrophage Infl ammation and Protects Mice from Insulin ResistanceCHONGREN TANG, YUHUA LIU, TIM S. MCMILLEN, BARBARA A. HOUSTON, ALAN CHAIT, JAY W. HEINECKE, RENEE C. LEBOEUF, Seattle, WA
Cellular cholesterol balance induces changes in the infl ammatory status of macrophages, and low grade chronic infl ammation is now recognized as a key step in the pathogenesis of atherosclerosis as well as obesity-induced type 2 diabetes mellitus and insulin resistance. ATP-binding cassette trans-porter A1 (ABCA1), a cell- membrane protein, essential for reverse choles-terol transport and high density lipoprotein (HDL) synthesis, protects against macrophages infl ammation and atherosclerosis. In the present study, the effect of ABCA1 defi ciency in myeloid cells on diet-induced infl ammation and insulin resistance was tested in vivo by transplantation of bone mar-row from wild-type (WT) or ABCA1-/- mice into WT DBA/2 background mice. When challenged with high-fat, high-carbohydrate diabetogenic diet with added cholesterol, mice that received ABCA1-/- bone marrow displayed en-hanced liver and adipose tissue macrophage infl ammation as well as insulin resistance and glucose intolerance as compared with animals that received WT bone marrow. In vitro studies indicated that bone marrow derived mac-rophages (BMDMs) from ABCA1-/- mice had signifi cantly increased expres-sion of markers of the M1 states such as MCP-1, IL-6 and TNF- , while the expression of the markers of M2 activation, such as mannose receptor and arginase-1 decreased. Moreover, BMDMs or peritoneal macrophages from ABCA1-/- mice showed signifi cantly increased infl ammation when induced by mixed fatty acids. Taken together, these studies demonstrated that myeloid ABCA1 protects mouse liver and adipose tissue from macrophage infl amma-tion and overall insulin resistance in diet-induced obesity. Thus, increasing ABCA1 expression in myeloid cells may present a new therapeutic approach for the treatment of type 2 diabetes and insulin resistance.
Supported by: NIH
240-ORModerate Vitamin D Repletion Improves Insulin Action and Reduces Adipose Infl ammationSUDHA KOPPAKA, SYLVIA KEHLENBRINK, KEHAO ZHANG, WEIJIE LI, NORICA TOMUTA, ELIZABETH SANCHEZ, MEREDITH HAWKINS, PREETI KISHORE, Bronx, NY
We have previously shown that repletion of vitamin D (vitD) in obese, in-sulin resistant subjects (IR) improved hepatic insulin sensitivity (EGP). Since it is not known which vitD levels are ideal for metabolic benefi ts, we hy-pothesized that higher vitD levels (HiD, ~50 ng/ml) would be metabolically more advantageous than simply normalizing vitD (LoD, >30 ng/ml). Euglyce-mic, hyperinsulinemic pancreatic clamp studies were performed in 5 obese, IR subjects (4M/1F, age=38±3 yrs, BMI=33±2 kg/m2, HOMA-IR=5.5±1.2) at baseline, and following oral supplementation with vitamin D3 to LoD for fi rst 2 months and then to HiD for the next 2 months. 6-6D-glucose was utilized to examine EGP and peripheral insulin sensitivity (Rd) at insulin infusion rates of 30 and 80 mU/m2/min. The 25(OH)D levels of 15.6±1.4 ng/ml at base-line increased to 37.7±4.1 ng/ml over fi rst 2 months and 53.7±5.3 ng/ml over the subsequent 2 months (average weekly dose ~30,350 IU and ~40,300 IU respectively). EGP decreased by 29% with LoD and by 26% with HiD (base-line=1.48±0.30, LoD=1.05±0.22 and HiD=1.10±0.25 mg/kg/min, p<0.05). Rd remained unchanged at both HiD and LoD levels. We hypothesized that vitD defi ciency predisposes to adipose tissue infl ammation by activating Adipose Tissue Macrophages (ATMs) that are important in IR. The effects of vitD on infl ammation were studied in periumbilical subcutaneous adipose tis-sue biopsies. Following vitD repletion, the expression of TNF and PAI-1 in fat was signifi cantly reduced (0.54, and 0.71 fold change respectively; all p< 0.05) with a downward trend in iNOS and IL-6 expression. Additionally, pro-infl ammatory activation markers expressed in ATMs were signifi cantly reduced (IL6=0.44, iNOS=0.56, PAI-1=0.37; all p< 0.05) and TNF showed a downward trend. This suggests that correcting vitD defi ciency can improve hepatic insulin resistance in association with decreased adipose tissue in-fl ammation, with maximal metabolic effects observed by simply correcting the defi ciency to LoD levels.
Supported by: Diabetes Action, NIH

A65
For author disclosure information, see page 797.ADA-Funded Research
ORA
LS
NEW PLAYERS IN ENERGY METABOLISM
chow (ND) for 20 weeks. IEX-1-/- mice gained markedly less weight on a HFD than did WT mice (25±1 to 37±2 g vs 26±0.5 to 50±2 g, respectively, P<0.01). HFD-fed IEX-/- mice exhibited less infl ammation in adipose tissue and liver (TNF- , IL-6, & leptin mRNA levels), hepatic steatosis (H&E staining), and glucose intolerance than did HFD-fed WT mice. IEX-1-/- mice had greater food consumption and thermogenesis than did WT mice. Flow cytometry analysis of adipose tissue macrophages (ATM) revealed that HFD feeding increased the percentage of proinfl ammatory M1 macrophages (10±1 to 37±1%, p<0.001) while decreasing the percentage of anti-infl ammatory M2 cells (39±3 to 13±3%, p<0.001) in WT mice. In sharp contrast, the ratio of M1 to M2 cells in ATM did not differ in IEX-1-/- mice fed a HFD or ND. An-nexin staining revealed a similar percentage of M1 apoptotic cells in ATM of WT and IEX-1-/- mice, whereas there were signifi cantly fewer apoptotic M2 cells in IEX-1-/- than in WT mice (11±2 vs 23±3%, p<0.01). Taken together, these fi ndings suggest that IEX-1 defi ciency protects mice from HFD-induced glucose intolerance and obesity by maintaining an anti-infl ammatory ATM phenotype in adipose tissue.
Supported by: NIH (AI050822 and AI070785) and AHA (0855762D)
246-ORPerilipin 5, a Novel Regulator of Cardiac Lipid Droplet HydrolysisHONG WANG, DAWEI GONG, URMILLA SREENIVASAN, ANDREW SALADINO, BRIAN POLSTER, KELLY O’CONNELL, ERINNE DABKOWSKI, PETER HECKER, WIL-LIAM STANLEY, CAROLE SZTALRYD, Baltimore, MD
Maintaining cellular lipid homeostasis is crucial to heart function, and is compromised in diabetic and obesity-induced cardiomyopathies. Lipid drop-lets (LDs) play a central role in lipid homeostasis by mediating transient stor-age of fatty acids (FA) in the form of triglyceride (TAG), while preventing high levels of toxic lipid that mediate cellular lipotoxicity. LD and mitochondrial function are intimately related but mechanisms of interaction have not been uncovered, nor underlying genes. Perilipin 5 (Plin5) is the newest member of the perilipin protein family coating LD surfaces and is highly expressed in heart. We reported that Plin5 mediates physical and metabolic interac-tions between LDs and mitochondria in vitro. Plin5 recruits mitochondria at the LD surface, is a scaffolding protein for key lipolytic enzymes (adipose tissue triglyceride lipase (ATGL), CGI-58 its co-lipase and hormone sensi-tive lipase (HSL), inhibits LD hydrolysis and facilitate TAG storage These in vitro results suggest that Plin5 regulates cardiac LD hydrolysis and controls local FA fl ux to protect mitochondria against FA surge in physiological con-ditions. To investigate plin5 function in vivo, we obtained transgenic mice with heart-specifi c plin5 over-expression ( MHC-plin5). Results suggest that these mice have a strong cardiac LD phenotype. Hearts from MHC-plin5 mice expressed at least 20-fold higher levels of plin5 and exhibit a 3.5- fold increase in TAG content versus non-transgenic littermate. Cardiac Plin5 over-expression leads to decreased PPAR targeted gene expression, altered mitochondria morphology and function and altered heart function, phenotype similar to the ATGL ko mice. These studies support the conclu-sions that Plin5 is a negative regulator of ATGL-mediated LD hydrolysis in vivo and is a promising key gene in the pathways that couple the LD storage compartment to the mitochondria FA utilization compartment and will help unravel the underpinnings of cardiac cellular lipid homeostasis.
Supported by: NIH, AHA, GRECC VA
247-ORActivated T Cells Affect Adipose Tissue and Skeletal Muscle Function in ObesityILVIRA KHAN, XIAOYUAN PERRARD, JERRY PERRARD, AMIR MANSOORI, C.W. SMITH, HUAIZHU WU, CHRISTIE BALLANTYNE, Houston, TX
Obesity is accompanied by low-grade chronic infl ammation, which con-tributes to pathogenesis of insulin resistance. In addition to classically ac-tivated M1 macrophages, T cells are crucial mediators of adipose tissue infl ammation. We have observed that high fat diet (HFD)-fed TCRb-null mice defi cient in T cells have reduced adipose tissue (AT) infl ammation com-pared to obese wild-type (WT) controls. Our current studies show that of the T cells, CD4+ T helper cells are polarized to T helper I (TH1) cells, as indicated by higher percentage of TH1 cells in AT of obese mice (6.27+1.90% in obese vs 3.02+1.37% in lean AT). In fact, obese AT has TH1 polarizing environment with markedly increased IL-2 and IL-12 levels. To determine the functional consequence of increased TH1 cells in AT, we studied the effect of TH1 cell on preadipocyte/adipocyte functions and found that treatment of 3T3-L1 cells with TH1 supernatant inhibited adipogenesis and decreased lipid accumulation, but did not affect lipolysis in mature adipocytes. TH1 supernatant also increased expression of proinfl ammatory cytokines (TNF
at 50 mg/kg/wk, or with saline (Sal), for 9 wk. HIF1 ASO reduced HIF1mRNA levels by 85% in liver and 62% in white fat whereas Cnl ASO did not change its expression. Neither ASO changed food intake or HIF2 expres-sion. However, HIF1 ASO, but not Cnl ASO, time-dependently lowered BW and adiposity. At wk 9, HIF1 ASO group was 15.5% lower in BW, 57.5% lower in body fat content, and 53% less in epidydimal fat versus Sal Cnl. Decreased adiposity coupled with unchanged food intake indicates an in-creased metabolic rate in HIF1 ASO treated mice. In addition, the treat-ment caused marked down-regulation of several key lipogenic genes includ-ing LPL, FAS, SCD1, SCD2 and DGAT2 in white fat while it had no effect on the expression of AR 3, ATGL or HSL, suggesting decreased lipogenesis with unchanged lipolysis. The treatment also caused down-regulation of key hepatic lipogenic genes, including ACC1, ACC2, FAS, SCD1, SCD2, DGAT2 and SREBP1c. Furthermore, HIF1 ASO lowered plasma glucose (191 ± 6 vs 242 ± 9 mg/dl in Sal) and insulin levels (1.5 ± 0.2 vs 3.7 ± 0.8 ng/ml in Sal), indicating improved insulin sensitivity after the treatment. HIF1 ASO did not affect liver function. These data demonstrate that HIF1 plays a critical role in lipid metabolism and energy homeostasis and that antisense reduc-tion of HIF1 expression could be a novel approach for the treatment of obesity and IR.
244-ORHypothalamic Protein Kinase Ikkepsilon (IKK ) has a Key Role in Energy Balance and Hepatic Glucose Metabolism in Db/Db and DIO MiceLAIS WEISSMANN, PAULA GABRIELE FERNANDES QUARESMA, ANDRESSA C. SANTOS, VINÍCIUS D’ÁVILA BITENCOURT PASCOAL, CARLOS KIYOSHI KATASHI-MA, TAMIRES ZANOTTO, DIOZE GUADAGNINI, ISCIA LOPES CENDES, MARIO J. SAAD, PATRICIA O. PRADA, Campinas, Brazil
The I B kinase (IKK ) induces insulin (INS) resistance in liver and fat from DIO mice. IKK KO mice are protected from obesity and whole-body INS resistance. However, if IKK is activated in the hypothalamus (HY) and if it is involved in INS and leptin (LEP) resistance or affects hepatic glucose metabolism in obese mice were not yet investigate. Thus, the aim of the present study was to investigate (1) the expression and activation of IKK in the HY of db/db and DIO mice; the role of hypothalamic IKK in the regulation of (2) energy balance and, (3) hepatic glucose metabolism in liver. Herein, we observed higher activation of hypothalamic IKK in db/db and DIO mice compared to controls. Intraperitoneal (IP) siRNA with RVG-9dR which binds to microglial cells or intracerebroventricular (ICV) ASO (oligonucleotide an-tisense) or ICV CAY (CAY10576-pharmacological inhibitor) reduced 80-70% the activity of IKK and did not alter I B/IKK / pathway in HY. Inhibition of IKK with ICV ASO or siRNA in DIO and db/db mice reduced fat mass and food intake and enhanced energy expenditure and thermogenesis via higher O2 consumption and UCP1 expression. Pair-feeding obese mice treated with ICV CAY or siRNA improved the anorexigenic effects of LEP and INS. LEP induced LEPR/JAK2/STAT3 phosphorylation was increased in HY. INS induced IRS/Akt/Foxo1 phosphorylation was enhanced in HY. These mice also had lower fasting glycemia and hepatic glucose output, measured by an IP pyruvate tolerance test, which correlated with reduced gluconeogenic expression of Pepck in the liver. In summary, our data provide evidence in vivo that in db/db and DIO mice IKK is upregulated and a short time inhibi-tion improves INS and LEP action/signaling in the HY and reduces hepatic glucose output and gluconeogenesis independently of IKK . Thus, our re-sults suggest that hypothalamic IKK has a key role in energy balance and hepatic glucose metabolism in obese mice and may be a new target to treat obesity and diabetes.
Supported by: Fapesp (2008/55674-8) and CNPq (480131/2009-0)
245-ORIEX-1 Defi ciency Renders Mice Refractory to HFD-Induced Obesity and Insulin ResistanceMOHD SHAHID, AMMAR A. JAVED, WARREN M. ZAPOL, MEI X. WU, Boston, MA
Obesity is characterized by chronic infl ammation with recruitment and activation of resident macrophages in tissues. NF- B is activated upon high-fat diet (HFD) feeding leading to chronic infl ammation in liver and adipose tissue. Despite strong evidence for the involvement of infl ammation in the pathogenesis of obesity, the primary mediator(s) and the site(s) at which the infl ammatory response occurs have not yet been established. The immedi-ate early response gene X-1 (IEX-1) is a stress-inducible gene that is a direct downstream target of NF- B. IEX-1 is also highly expressed in macrophages. We hypothesized that IEX-1 is required for HFD feeding induced-infl ammation leading to insulin resistance and obesity. We fed IEX-1-defi cient mice (IEX-1-/-) and their wild-type (WT) littermates a HFD (45% kCal as fat) or normal

A66
For author disclosure information, see page 797. ADA-Funded Research
ORA
LSDEATH OF AN ISLET
cell apoptosis, compared with Akita mice. We also generated IRS2Tg Akita mice, and these mice depicted decreased cell apoptosis, compared to Akita mice. Taken together, GKA ameliorated ER stress-mediated apoptosis via both IRS-2-dependent pathway and IRS-2-independent regulation of the expressions of genes related to ER stress.
250-ORRole of Sphingosine Kinase 1 in Pancreatic -Cell Survival and Pre-vention of Diabetes in High Fat Diet-Fed MiceYANFEI QI, JINBIAO CHEN, PU XIA, Sydney, Australia
Pancreatic -cell death resulted from elevated circulating levels of free fatty acids (FFA) is a critical pathogenic event for the development of type 2 diabetes, especially in obese individuals. Attempting to prevent -cell death has been considered as a new strategy of prevention and treatment of dia-betes. In this study, we aimed to examine the role of sphingosine kinase 1 (SK1) in -cell survival under lipotoxic stress in vitro and in mice fed with high fat diet (HFD). Exposure to palmitate resulted in a dose-dependent in-crease in cell death in both MIN6 and INS-1 -cell lines. Lipotoxicity was signifi cantly reduced in the -cells overexpressing of SK1 or pre-treated with sphingosine 1-phosphate (S1P), the product of SK1. By blocking the enzyme activity, dominant negative form of SK1 markedly potentiated palmitate-induced -cell apoptosis. Moreover, primary islets isolated from SK1-/- mice exhibited more susceptible to FFA-induced apoptosis, compared with the wild-type (WT) controls in vitro. To further investigate the role of SK1 in
-cell survival under lipotoxic stress, we fed SK1-/- and WT mice with either HFD or normal chow diet. After 24 weeks feeding, HFD induced signifi cant body weight gain and enhanced circulating levels of FFA and lipids in both WT and SK1-/- animals to a similar degree. In strikingly contrast, while HFD feeding induced glucose intolerance and compensatory hyperinsulinemia in WT mice, SK1-/- littermates developed evident diabetes accompanied with a signifi cant reduction in insulin levels. Morphological analysis indicated a dramatic loss of -cell mass and increased apoptosis in pancreatic islets of HFD-fed SK1-/- mice. Collectively, these fi ndings for the fi rst time dem-onstrate a critical role of SK1 in maintaining -cell survival under obese or lipotoxic conditions.
Supported by: National Health and Medical Research Council of Australian Government
251-OROsteoprotegerin, a Novel Downstream Target of Lactogens, En-hances Human Beta Cell Proliferation Through RANKL Modulation and Improves Human Beta Cell SurvivalNAGESHA GUTHALU KONDEGOWDA, CONNIE CHIN, ANAIS MOZAR, RUPANGI C. VASAVADA, Pittsburgh, PA
Osteoprotegerin (OPG), a member of the tumor necrosis factor receptor superfamily, is expressed in beta cells, and its expression is increased in three models of rodent beta cell expansion. The current study shows that OPG expression is increased 22-fold in transgenic mouse islets expressing placental lactogen in the beta cell. OPG mRNA is also increased 6-fold in INS1 cells treateåd with prolactin, identifying OPG as a novel downstream target of lactogens in beta cells. Based on this increase in OPG expression, we hypothesized that OPG may directly enhance beta cell proliferation. To examine this, human islet cell cultures (n=3-5) were treated with 25-200ng of OPG in the presence of bromodeoxyuridine (BrdU) and human beta cell pro-liferation was assessed by insulin-BrdU co-staining. There was a signifi cant 2.5-3.0 fold increase in human beta cell proliferation with the higher OPG doses. OPG mediates its effects in bone is through inhibition of the receptor activator of nuclear factor kappa-B ligand (RANKL) pathway. To examine the importance of this pathway on human beta cell proliferation, we treated human islet cell cultures with Denosumab (1-200ng/ml), a human monoclo-nal RANKL antibody, which acts as a partial functional equivalent of OPG. Denosumab signifi cantly increased human beta cell proliferation by ~2-fold, demonstrating the importance of the RANKL pathway in human beta cell proliferation. We next examined if OPG had a direct effect on human beta cell survival against glucolipotoxicity (GLT) and cytokines. OPG signifi cantly ameliorated by ~45% and ~50%, the 3.5-fold increase in GLT and cytokine-induced human beta cell death, respectively, as measured by insulin and TUNEL co-staining (n=3), demonstrating a direct pro-survival effect of OPG on human beta cells. Our studies reveal OPG to be a novel downstream tar-get of lactogens, which can independently and directly enhance human beta cell proliferation and survival.
Supported by: DK078060, DK072264
and IL-6) and chemokines (MCP-1, RANTES) and reduced level of adiponectin in differentiated 3T3-L1 cells. Consistent with the in vitro data, the size of individual adipocytes in perigonadal AT of HFD-fed TCRb-null mice, which are also TH1 defi cient, was signifi cantly larger compared to obese WT con-trols, suggesting that the absence of TH1 cells could restore AT lipid storage. We found that accumulation of T cells also occurred in skeletal muscle of obese WT mice (23.23+1.39% of CD45+ cells in obese vs 13.79+3.07% in lean). Defi ciency of T cells in HFD-fed mice blunted skeletal muscle infl ammation with reduced levels of MCP-1, RANTES, IL-6, and IFN . Insulin sensitivity was also improved in skeletal muscle of obese TCRb-null mice. Thus T cells with TH1 polarization could affect not only AT, but also skel-etal muscle function in obesity resulting in insulin resistance.
248-ORHepatic Glucokinase Negatively Regulates BAT Thermogenesis via a Neural PathwaySOHEI TSUKITA, TETSUYA YAMADA, KENJI UNO, YOSHITOMO OKA, HIDEKI KATAGIRI, Sendai, Japan
We focused on systemic impacts, especially on energy metabolism, of alterations in hepatic glucose metabolism. Since glucokinase (GK) catalyzes the fi rst and rate-limiting step of glycolysis in hepatocytes, we fi rst examined the time course of GK expression levels in the livers of obesity-prone C57BL/6 mice during high-fat (HF) diet feeding. HF feeding markedly up-regulated he-patic GK within 1 week. Then, to examine whether hepatic GK expression actually affects energy metabolism, we overexpressed GK in the livers of chow-fed C57BL/6 mice, using the adenoviral gene transfer system. Hepatic GK expression increased adipocyte sizes in brown adipose tissue (BAT) and decreased expressions of thermogenesis-related genes, such as uncoupling protein-1 (UCP1), in BAT in a manner dependent on hepatic GK expression levels. In addition, hepatic GK expression suppressed c-fos expression in the raphe pallidus of the medulla, attenuated systemic thermogenic response to norepinephrine (NE), and promoted weight gain. Selective hepatic vagotomy abolished these anti-thermogenic effects induced by hepatic GK expression. These fi ndings indicate that hepatic GK expression negatively regulates BAT thermogenesis via a neural pathway, consisting of the vagal afferents from the liver and sympathetic efferents from the medulla. Furthermore, hepatic GK induction of obesity-prone mice during HF feeding was more enhanced than that of obesity-resistant mice, and the enhanced levels of hepatic GK expression were inversely associated with UCP1 expression levels in BAT. Knockdown of hepatic GK induction in obesity-prone mice increased BAT UCP1 expression, enhanced thermogenic response to NE, and suppressed HF diet-induced weight gain. Thus, this novel inter-tissue (liver-to-BAT) sys-tem may function as a systemic thrifty mechanism and trigger obesity devel-opment on an early stage of over-nutrition.
DEATH OF AN ISLET
249-ORGlucokinase Activator Ameliorates Cell ER Stress and Apoptosis by both IRS-2-Dependent and -Independent PathwaysJUN SHIRAKAWA, YASUO TERAUCHI, Yokohama-City, Japan
Endoplasmic reticulum (ER) stress is involved in cell apoptosis and the development of diabetes. Glucokinase (Gck) up-regulates IRS-2 expression in cell, but the role of Gck and IRS-2 in ER stress has been unclear. In this study, we investigated the impact of Gck activator (GKA) on ER stress. Ad-ministration of GKA signifi cantly decreased TUNEL-positive cells in Akita (Ins2) mouse, an animal model of ER stress-mediated diabetes. Based on the results of gene expression microarray analysis in islets after treatment with GKA, we validated that GKA signifi cantly increased the expressions of ER stress related genes, such as Sdf2l1, Stc2, Edem2, or Ero1 , and signifi cantly decreased the expressions of Chop in islets. In islets from db/db mice, GKA-induced up-regulation of IRS-2, Sdf2l1, or Stc2 was attenuated. Of note, the regulation of expressions of ER stress related genes by GKA were preserved in IRS-2-defi cient (IRS-2-/-) islets. MEK inhibitor (U0126), but not Akt inhibi-tor (Akti-1/2), prevented GKA-induced suppression of CHOP in islets. These results suggested that GKA regulated ER stress-related genes via IRS-2 independent manner. Gck-defi cient (Gck+/-) islets and IRS-2-/- islets demon-strated increased expressions of CHOP and Bax after treatment with thapsi-gargin, but GKA signifi cantly decreased the elevated expressions of CHOP and Bax. On the contrary, islets from transgenic mice overexpressing IRS-2
cell-specifi cally ( IRS2Tg) showed signifi cantly decreased expressions of Bax under ER stress. Furthermore, both Gck+/- Akita mice and IRS-2-/- Akita mice demonstrated severe hyperglycemia at early stage and increased

A67
For author disclosure information, see page 797.ADA-Funded Research
ORA
LS
DEATH OF AN ISLET
content, defective insulin secretion, and -cell death. However, the mecha-nisms involved in GLT-induced -cell death are not completely understood. p53 plays a critical role in responding to cellular stresses by regulating a myriad of cellular effects including growth arrest, DNA repair, mitochondrial function, energy metabolism and apoptosis. However, whether p53 is up-regulated in -cells exposed to GLT conditions and whether p53 has any role in GLT-mediated -cell death is unknown. INS-1 cells grown in 11mM glu-cose and exposed to 0.1-0.5mM palmitate (GLT conditions) for 24h displayed increased apoptosis in a dose dependent manner, as assessed by TUNEL staining and western blot analysis of caspase-3 activation. Interestingly, GLT also increased dose-dependently the expression levels of p53 and the p53-responsive genes p21 and the pro-apoptotic protein Bax. Moreover, GLT induced the phosphorylation of p53 on Ser15 and Ser20, known to promote both the accumulation and transactivation of p53. To analyze whether p53 transactivation could participate in GLT-induced -cell death, we tested the ability of the p53 transactivation inhibitor Pifi thrin- (PIF) to ameliorate INS-1 cell apoptosis induced by GLT. PIF (25μM) signifi cantly (p<0.05) diminished INS-1 cell apoptosis induced by GLT. Mouse islets exposed to GLT condi-tions also displayed a dramatic upregulation of p53 expression. Importantly, p53-null mouse -cells in culture were resistant to GLT-induced apoptosis compared to -cells from normal littermates. Preliminary studies suggest that GLT also upregulates p53 levels in human islets and that PIF treatment ameliorates human -cell apoptosis in this setting. Collectively, these stud-ies indicate that p53 plays an important role in GLT-induced -cell death and may contribute to the -cell failure observed in obesity-associated type 2 diabetes.
Supported by: NIH/NIDDK (DK067351) to A.G.O.
255-ORmt-ND2a Protects Human Cells from Immune-Mediated Destruc-tionYAIMA L. LIGHTFOOT, JING CHEN, CLAYTON E. MATHEWS, Gainesville, FL
Mitochondria play essential roles in both the function and death of pan-creatic cells. These organelles produce ATP required for optimal insulin se-cretion and participate in cell death induced by mechanisms linked to both Type 1 and Type 2 Diabetes. Accordingly, mutations in the mitochondrial DNA (mtDNA) have been linked to diabetes. A single nucleotide polymor-phism within the mitochondrially encoded gene for NADH dehydrogenase subunit 2 (mt-ND2 ) has been linked to Type 1 Diabetes resistance in both humans and mouse. In the mouse, this allele provides enhanced cell pro-tection from apoptosis. The goal of this report was to study the impact of the human alleles on cell death. For this study we developed cybrid human cell lines with equal nuclear genomes yet differing by the mtDNA haplotype, encoding either the diabetes-resistance allele, mt-ND2 a, or the mt-ND2 c al-lotype associated with diabetes susceptibility. Cybrid cell lines were devel-oped by fi rst depleting the human cell line, lox5, of mtDNA with low dose Ethidium Bromide, and then fusing the resulting cell line with human donor platelets with mt-ND2 a or mt-ND2 c. This process produced the lox5-ND2 a
and lox5-ND2 c cell lines. lox5-ND2 a and lox5-ND2 c cells were incubated with the cytokine combination of TNF and IFN , or the combination of IFNand -Fas for 48h before assaying cell death, mitochondrial ROS production, and changes in mitochondrial membrane potential (MMP). lox5-ND2 a cells showed increased resistance to cytokine and Fas killing compared to lox5-ND2 c. Resistance to apoptosis correlated with lower levels of ROS genera-tion and increased resistance to MMP changes. Our results indicate that, similar to fi ndings using mouse systems, mt-ND2 a protects human cells from insults associated with Type 1 Diabetes progression by suppressing ROS produced by mitochondria in response to pro-death signals.
Supported by: RO1 DK074656
256-ORPrevention of Human Islet Apoptosis Activation by Co-Culture With Bone Marrow (BM) CellsJUNPING WANG, JOHN ZQ LUO, LUGUANG LUO, Providence, RI
Apoptosis is one of major factors for human islet transplantation failure. The activation of infl ammatory factors such as interleukin (IL-1 ) is a signifi -cant factor in the apoptosis process. The present study specifi cally focuses on evaluating the anti-apoptotic effect of BM on human islet cells and the mechanisms. Two groups were used: 1) human islets cultured under normal conditions and 2) human islets co-cultured with bone marrow cells. BM cells co-cultured with human islets reduced apoptosis (percentage of apoptotic cells: 76% ± 6% normal culture VS 13% ± 2.1% co-culture for 7 hours; 97% ± 3% VS 21% ± 1.5% for 21 days culture respectively, p< 0.001). The measure-ment of IL-1 within the culture medium in both culture systems showed that
252-ORCXCL10 Antagonism Protects from High Fat Diet-Induced Hypergly-cemia and Improves Beta-Cell Function and MassKATHRIN MAEDLER, ERNA DOMSGEN, JENNIFER BERGEMANN, PIA JANSSEN, NADINE STAPPENBECK, PINA CARDARELLI, PAYAL SHAH, Bremen, Germany, Sunnyvale, CA
Sub-clinical infl ammation participates in the pathophysiology of type 2 diabetes (T2DM) and leads to -cell failure and impaired function. The pro-infl ammatory chemokine CXCL10 is expressed in islets in T1DM and T2DM and leads to -cell apoptosis and impaired function. In the present study we investigated whether CXCL10 antagonism improves glycemia, -cell func-tion and survival in vivo in mice and in vitro in human islets. A murine CXCL10 antibody prevented diabetes progression in C57BL/6J mice fed a high fat/high sucrose diet (HFD) for 16 weeks. Anti-CXCL10 improved glucose toler-ance and glucose stimulated insulin secretion. HFD feeding reduced stimula-tory index by 2.8-fold, but anti-CXCL10 treatment completely restored GSIS. While anti-CXCL10 treated mice showed a 1.8-fold increased -cell mass compared to normal diet (ND) controls, -cells were unable to compensate for the higher insulin demand in response to the HFD in vehicle treated mice. Analysis of -cell apoptosis showed an induction of TUNEL-positive -cells in the HFD mice compared to ND mice (0.2% vs. 0.05%; p<0.05) in HFD treat-ed mice, which was inhibited in anti-CXCL10 treated mice. CXCL10 mRNA was 5-fold up-regulated in epididymal fat and normalized by anti-CXCL10. In contrast, in the hypothalamus, neither CXCL10 nor IL-1 were changed in HFD or anti-CXCL10 treated mice. The protective effects of anti-CXCL10 were also confi rmed in human islets. The cytokine mixture IL-1 /IFN- highly induced IL-1 production and secretion of IL-1 , which was inhibited by anti-CXCL10, possibly through a negative feedback mechanism. In parallel, cy-tokine-induced apoptosis was also inhibited. Our results show that CXCL10 antagonism improved -cell survival and function and support a potential role for CXCL10 in the treatment of diabetes.
Supported by: JDRF
253-ORDeletion of ER Cochaperone P58IPK Causes ER Stress and Oxidative Stress in Pancreatic Beta Cells that is Rescued by Either Antioxi-dant Treatment or Chop DeletionJAESEOK HAN, BENBO SONG, SUNG HOON BACK, JUSTIN R. HASSLER, VAMSI KODALI, SHIYU WANG, RANDAL J. KAUFMAN, Ann Arbor, MI, La Jolla, CA, Ulsan, Republic of Korea, San Diego, CA
Improper protein folding results in accumulation of misfolded or unfolded protein in the ER, which is detrimental to cell survival. Given that molecu-lar chaperones are required for proper protein folding, we investigated the requirement for the ER cochaperone P58IPK in ER homeostasis and insulin production in pancreatic cells. P58IPK-/- mice displayed a diabetic phenotype including elevated blood glucose levels with reduced insulin and proinsulin levels in the serum. In parallel, islets from P58IPK-/- mice showed impaired Glucose-stimulated insulin secretion (GSIS), likely due to a decreased num-ber of insulin containing granules as measured by electron microscopy (EM) and reduced expression levels of cell-specifi c genes compared to wild-type islets. In addition, there was increased cell death in P58IPK-/- islets and in established P58IPK-/- cell lines under ER stress, that was associated with induction of the unfolded protein response (UPR) including the pro-apoptotic gene Chop compared to wild-type islets and cell lines. We also found that there were elevated levels of oxidative stress in P58IPK-/- islets. Signifi cantly, feeding mice a chow diet supplemented with the antioxidant butylated hy-droxyanisole (BHA) restored blood glucose levels and serum insulin levels in P58IPK-/- mice within one week. GSIS of BHA-treated P58IPK-/- islets was signifi cantly improved with increased pancreatic insulin content and insulin containing secretory granules. Furthermore, treatment with phenylbutyric acid (PBA), a chemical chaperone that relieves ER stress, as well as deletion of Chop, rescued diabetic phenotype with improved cell function and sur-vival of P58IPK-/- mice. These results suggest that the ER cochaperone P58IPK
is essential to maintain the secretory capacity of the cell. Signifi cantly, impaired protein folding in the ER of the cell causes oxidative stress that results in cell failure and apoptosis.
254-ORp53 Plays an Essential Role in Glucolipotoxicity-Induced -Cell DeathJUAN C. ALVAREZ-PEREZ, LAURA C. ALONSO, GABRIELLA P. CASINELLI, TAYLOR C. ROSA, ADOLFO GARCIA-OCANA, Pittsburgh, PA
High concentrations of free fatty acids and glucose (gluco-lipotoxicity, GLT) are detrimental for pancreatic -cells, resulting in reduced insulin

A68
For author disclosure information, see page 797. ADA-Funded Research
ORA
LSDIABETIC RETINOPATHY—PATHOGENESIS AND NEW APPROACHES TO TREATMENT
258-ORTherapeutic Effects of Fenofi brate Eye Drops in Diabetic RetinopathyYING CHEN, Oklahoma City, OK
Recent FIELD studies showed that oral administration of fenofi brate, a safe and low-cost drug that lowers VLDL, has displayed impressive effi cacy in slowing the progression of diabetic retinopathy (DR) in type 2 diabetic pa-tients. The purpose of this study was to explore whether fenofi brate topical administration has therapeutic effect on DR in type 1 diabetes. Fenofi brate eye drops delivery capacity to retina was detected by HPLC/MS/MS. Adult BN rats were given a single intraperitoneal injection of streptozotocin (STZ) to induce diabetes. Newborn Brown Norway rats at postnatal day 7 were exposed to hyperoxia (75% O2) for 5 days and then returned to normoxia to induce oxygen-induced retinopathy (OIR). Vascular permeability was quanti-fi ed by measuring leakage of Evans blue dye-albumin complex from the blood vessels into the retina. Full-fi eld electroretinogram (ERG) was recorded using the Espion E2 ERG system. Fenofi brate eye drops can effi ciently delivery to the retina. Fenofi brate eye drops reduced retinal vascular leakage in both the OIR and STZ-diabetes models. Fenofi brate eye drops have signifi cantly po-tent effects on retinal neovascularization in OIR rats. Fenofi brate eye drops down-regulated the expression of VEGF and ICAM-1 in the retina. ERG and histological analysis after the eye drops administration showed that Feno-fi brate eye drops did not cause detectable functional and morphological abnormalities in ocular tissues. Fenofi brate eye drops demonstrate a novel administration method of fenofi brate and have therapeutic potential on DR in type 1 diabetes.
259-ORFenofi brate: Prevention and Treatment of LDL-Enhanced Diabetic Retinopathy in STZ-Induced Diabetic MiceJING ZHANG, SHIHE YANG, DONGXU FU, MINGYUAN WU, MEI DU, KENNETH WILSON, TIMOTHY LYONS, Oklahoma City, OK
Fenofi brate, a PPAR- agonist, is used to treat hypertriglyceridemia. Benefi -cial effects of fenofi brate on diabetic retinopathy (DR) have been described in two recent large prospective studies, but mechanisms are unknown. To evalu-ate fenofi brate action on modifi ed LDL-enhanced DR in a STZ-diabetic rodent model, diabetic and control mice (C57BL/6J, 8 weeks old) were given a single, unilateral, intra-vitreal injection of fenofi brate (125 μM, 1 μl/eye), then main-tained for 2 months on a diet supplemented with fenofi brate (0, 100, 300mg/kg·d). Then, to enhance DR, some animals received an intra-vitreal injection of “highly oxidized glycated” (HOG-) LDL (5 μg/μl, 1 μl/eye), with native LDL (N-LDL) or PBS injections as controls. Seven days later, ERG, H&E staining, fl at mounts, and retinal vascular permeability assays were performed, and markers of infl ammation, apoptosis, and ER stress were determined (western blot). In non-diabetic mice, neither LDL injection nor fenofi brate had any effect on normal retinal structure and function. In contrast, in diabetic mice, seven days after intra-vitreal injection, HOG-LDL (but not N-LDL) disrupted retinal histology, impaired retinal function (ERG), and increased blood-retinal barrier breakdown. High- but not low-dose dietary fenofi brate protected both struc-ture and function; signifi cantly attenuating vascular leakage and infl ammation, and blocking apoptosis and ER stress. Interestingly, the early, single, intra-vitreal injection of fenofi brate also robustly protected retinal structure and function 9 weeks later in the diabetic mice treated with intra-vitreal HOG-LDL. In conclusion, both dietary and intra-vitreal fenofi brate countered the stress imposed by intra-vitreal injection of LDL in diabetic animals. The data suggest the protective effect of fenofi brate operates directly within the retina, inde-pendent of systemic effects.
260-ORAcetylation of Retinal Histones in Diabetes Increases Infl ammatory Proteins: Effects of Minocycline, HAT and HDACTIMOTHY S. KERN, CHANDRA S. KADIYALA, YUNPENG DU, MASARU MIYAGI, Cleveland, OH
Evidence accumulates that infl ammatory changes contribute to the de-velopment of diabetic retinopathy. We investigated the effect of diabetes on acetylation of retinal histones, and the relation of this acetylation to the increased expression of pro-infl ammatory proteins in diabetes/elevated glu-cose. Studies were conducted in vivo (2 mos diabetes) and in vitro (retinal Muller cell line, rMC-1). Sites and extent of acetylation on lysines were deter-mined by mass spectrometric methods and western blots. Minocycline was administered in vivo and in vitro, and HAT inhibitors and HDAC activators and inhibitors were administered to the rMC-1 cells. To inhibit expression of the HAT p300, siRNA against p300 was administered to rMC-1 cells. Dia-betes or 25mM glucose increased acetylation of retinal histones on specifi c lysines, and this increase was signifi cantly inhibited by minocycline. Mino-
BM co-culture signifi cantly decreased IL- levels (0.022 ± 0.001 for normal culture, 0.026 ± 0.002 for co-culture at day 8; 2.266 ± 0.054, 0.048 ± 0.011 ng/ml at day 63, p<0.001). Reduction in infl ammatory factor levels in co-culture may be related to a decrease in external cellular ATP levels, which has been reported as a major cause in inducing IL-1 production and release. Reduced ATP accumulation (111.49 ± 5.99 normal culture VS 100.68 ± 5.99 co-culture on day 8; 25382.43 ± 2617.60 normal culture VS 1673.65 ± 111.42 co-culture on day 63, p <0.001) was detected and correlated with a reduction in ATP receptor (P2X7) expression. This study demonstrated that human islet
-cells undergo apoptosis spontaneously upon isolation. Co-culturing islets with BM cells postpones islet deterioration and apoptosis by reducing extra-cellular ATP levels, infl ammatory factor production, and -cell apoptosis.
Supported by: JDRF
DIABETIC RETINOPATHY—PATHOGENESIS AND NEW APPROACHES TO TREATMENT
257-ORSlow Progression of Diabetic Retinopathy (DR) in Patients With 50 or More Years of Type 1 DiabetesABUMERE AKINWALE, JENNIFER K. SUN, HILLARY A. KEENAN, LLOYD P. AIELLO, GEORGE L. KING, Boston, MA
Over 40% of patients with type 1 diabetes (DM) for >50 years (Medalists) have no-mild nonproliferative DR (NPDR) even after fi ve or more decades of hyperglycemia. An important question with mechanistic implications is whether this long term protection from advanced DR is due to slowed DR progression or regression from more severe DR levels. We evaluated 158 Medalists (316 eyes) with longitudinal follow-up at Joslin Diabetes Center (mean+SD follow-up: 16±13 yrs; 27±33 total visits) by retrospective chart review. Evaluation of all available standard care ETDRS protocol fundus pho-tographs was performed for eyes with moderate or severe NPDR that did not progress to PDR (N = 43) to document DR regression or progression. The Medalists had a mean age of 10±6yrs at diagnosis, 58±6yrs DM duration and current hemoglobin A1c (A1c) of 7.2±0.9%. In eyes with PDR, worse current renal function (p=0.003), older current age (p=0.0002), shorter DM duration (p < 0.0001) and higher current A1c (p=0.03) were signifi cantly related to faster progression to PDR, but of these, only worse current renal function (p=0.003) was related to PDR as an outcome in the whole group. Eyes with-out baseline DR that did not progress to PDR (N=152) had a slower rate of DR worsening than eyes that progressed to PDR (N=61, p<0.001), and once a patient reached 20yrs of DM, only 2 eyes worsened from baseline thereaf-ter. In eyes with moderate or severe NPDR that did not progress to PDR, re-gression of some DR lesions (hemorrhages, microaneurysms, hard exudates and cotton wool spots) was evident over time, but there was not substantial (>2 steps on the clinical ETDRS scale) regression of DR severity in any eye. These results suggest that Medalists protected from PDR have slow DR on-set and/or progression rather than increased DR regression and are unlikely to experience DR worsening after 20 years of DM. Thus, protective factors may exist in some Medalists that ameliorate hyperglycemia-induced retinal pathology and prevent progression to neovascular DR.
Supported by: JDRF, R24 DK083957-01, P30DK036836-2, Brehm, Beatson, Eli Lilly

A69
For author disclosure information, see page 797.ADA-Funded Research
ORA
LS
DIABETIC RETINOPATHY—PATHOGENESIS AND NEW APPROACHES TO TREATMENT
263-ORThe Potential Regulation of C/EBP- by AMPK and their Involve-ment in ER Stress and Infl ammationJOSE M. CACICEDO, BENOIT VIOLLET, NEIL B. RUDERMAN, YASUO IDO, Boston, MA, Paris, France
The C/EBP family of transcription factors plays a critical role in ER stress-induced pancreatic beta cell apoptosis and the activation of infl ammatory genes including many that are increased with diabetes and atherosclero-sis. Of its six members, C/EBP- is thought to be the most critical since it accumulates in the -cells of diabetic animals in which it activates ER stress. Also, its genetic ablation prevents both damage to the -cells and the development of diabetes. In the present study, we investigated the role of C/EBP- in ER stress and infl ammation in retinal pericytes (PCs). PCs are sensitive to both ER stress and infl ammation and are among the fi rst cells to die during the course of diabetic retinopathy. In addition, we examined the regulation of C/EBP- by AMP-activated protein kinase (AMPK). Incubation of cultured bovine retinal pericytes with the saturated fatty acid palmitate, but not the monounsaturated fatty acid oleate, induced the upregulation of C/EBP- while simultaneously activating ER stress and apoptosis. Activa-tion of AMPK with AICAR prevented all of these changes. Subsequent stud-ies performed in wild-type mouse embryonic fi broblasts (MEFS) treated with thapsigargin (to release ER Ca2+ stores and induce ER stress) also demon-strated an increase in C/EBP- as did the infl ammatory cytokine TNF-alpha. Activation of AMPK not only decreased the ER stress response and infl am-mation in these cells, it also prevented the increase in C/EBP- levels. Use of double AMPK alpha-1 and -2 knockout MEFs revealed that the decrease in C/EBP- levels was dependent on the presence of AMPK and that AMPK leads to a shuttling of C/EBP- into the cytosol when stimulated with TNF-alpha. It is unclear, at this time, whether AMPK leads to the active export of C/EBP- from the nucleus to the cytosol or tags it for degradation. The specifi c interactions between AMPK and C/EBP- , as well as the importance of C/EBP- in ER stress and infl ammation remain to be determined.
264-ORDecreased Bone Marrow Neuronal Support in Type 1 Diabetes Shifts Normal Hematopoiesis Towards the Generation of (C-C Motif) Receptor 2 (CCR2) MonocytesASHAY D. BHATWADEKAR, PING HU, SUGATA HAZRA, SERGIO CABALLERO, SU-SANNE MOHR, STEVEN F. ABCOUWER, DANIEL R. SABAN, TAILOI CHAN-LING, JULIA V. BUSIK, MARIA B. GRANT, Gainesville, FL, Camperdown, Australia, East Lansing, MI, Ann Arbor, MI, Boston, MA
Dynamic control of hematopoietic stem cell (HSC) release is regulated by the neurotransmitters in bone marrow (BM). Previously, we showed that in both Type 1 diabetes (T1D) and Type 2 diabetes (T2D), reduced levels of norepinephrine lead to abnormal release of HSCs from BM into the circula-tion. In the present study, we examined the role of key neurotransmitters/neuropeptides (NT/NP) in T1D in the support, differentiation and the fate of HSCs. Immunohistochemical analysis of NT/NP in T1D long bones was con-ducted. Quantifi cation of the side population (SP) of the bone marrow cells was performed using colony forming assays and fl ow cytometry. Chimeric mice (transplanted with gfp-expressing HSC) were made T1D and their reti-nas were evaluated for contribution and characterization of BM derived cell using fl at-mounts and by fl ow cytometry of enzymatically-dissociated retinal cells. In T1D mice, immunodetection of calcitonin gene related peptide was reduced by 65% (p<0.05), neuropeptide Y by 67% (p<0.05), acetylcholine by 51% (p<0.05), and somatostatin by 50% (p<0.05). BM cells isolated T1D mice showed depletion of SP-HSCs but increased numbers of monocyte/macrophage colony forming units. BM supernatant of T1D mice showed in-creased levels (2.5-fold, p<0.002) of macrophage-colony stimulating factor (M-CSF/CSF-1, a stimulator of monocyte generation) and increased levels IL-1 (2-fold, p<0.05) and IL-27 (3-fold, p<0.01). Retinas of T1D mice showed a 10-fold increase in CD11b+ /CD45hi/ (C-C motif) receptor 2 (CCR2+) popula-tions while lba+ microglia exhibited a ramifi ed morphology suggesting an infl ammatory activation. Our data suggests that loss of BM neurotransmit-ter regulation may shift hematopoiesis towards the generation of excessive numbers of CCR2 monocytes. This infl ammatory retinal phenotype combined with the loss of key reparative cells contributes towards retinal pathology in diabetes.
Supported by: Thomas H. Maren Junior Investigator Award (A.B.), EY007739, EY012601 (M.B.G.)
cycline also inhibited ICAM expression in vivo. In vitro, minocycline as well as inhibitors of HAT (including antisense against p300) or activators of HDAC inhibited both histone acetylation and expression of the pro-infl ammatory proteins, ICAM and iNOS. Hyperglycemia-induced acetylation of histones or other proteins contribute to the diabetes-induced upregulation of at least some pro-infl ammatory proteins in retina, and thereby likely contribute to the development of diabetic retinopathy.
261-ORHigh Glucose-Induced Mitochondrial Dysfunction and its Role in the Metabolic Memory PhenomenonTHOMAS TIEN, SAYON ROY, Boston, MA
Currently it is unknown whether changes in mitochondrial morphology and subsequent functional alterations participate in the development of the metabolic memory phenomenon. Our recent studies indicate high glu-cose (HG)-induced mitochondrial fragmentation promotes retinal vascu-lar changes seen in diabetic retinopathy. In this study, we have examined whether HG-induced mitochondrial dysfunction, in particular, mitochondrial morphology changes, results in irreversible mitochondrial function that can promote the metabolic memory phenomenon. To determine if HG-induced mitochondrial changes are retained, rat retinal endothelial cells (RRECs) grown in HG (30mM) medium for 4 days were shifted to normal (N, 5mM) medium for 3 days; in parallel, RRECs were grown as control in N medium and HG medium for 7 days. Cells were stained with MitoTracker Red, a mi-tochondrial specifi c dye, and examined live under confocal microscope. Im-ages were analyzed for mitochondrial morphology using Form Factor (FF) and Aspect Ratio (AR) values. Oxygen consumption rate (OCR) of the cells was also measured by XF24 bioenergetic assay. Cells exposed to HG showed sig-nifi cantly increased mitochondrial fragmentation compared to cells grown in N medium (FF = 2.3±0.3 vs 1.7±0.2, p < 0.001; AR = 2.3±0.2 vs 2.0±0.1, p < 0.001). Cells grown in HG medium for 4 days followed by N medium for 3 days (FF = 1.8±0.3; AR = 2.1±0.2) retained the HG-induced increased mitochondrial fragmentation (p < 0.005, p < 0.05, respectively). No signifi cant differences in FF and AR values were observed between cells grown in HG medium and those grown in HG medium and shifted to N medium. Furthermore, XF24 bioenergetic assay showed that cells grown in HG and shifted to N medium maintained HG-induced decrease in OCR. Findings from this study indicate that HG-induced mitochondrial fragmentation and altered OCR are irrevers-ible changes that may contribute to the development and progression of the metabolic memory phenomenon.
262-ORActivating Transcription Factor 4 Regulates Endothelial Infl amma-tory Signaling in Diabetic RetinopathyJOSHUA J. WANG, GUANGJUN JING, MICHAEL DANESHFAR, SARAH X. ZHANG, Oklahoma City, OK
We previously reported that endoplasmic reticulum (ER) stress is a key player in retinal infl ammation and vascular leakage in diabetes. However, the cellular mechanisms and signaling pathways of ER stress in diabetic retinopathy remain unclear. Activating transcription factor-4 (ATF4) is a tran-scriptional factor induced by various cellular stresses. The objective of this study is to delineate the role of ATF4 in endothelial infl ammatory response and vascular dysfunction. Immortalized rat retinal endothelial (TRi-BRB) and primary mouse brain endothelial cells were exposed to high glucose (25 mM), TNF- (10 ng/ml), or LPS (250 ng/ml) to induce ER stress and infl am-mation. ATF4 activity was manipulated by adenoviruses expressing wildtype (WT) or a dominant negative mutant (DN) of ATF4. Mouse models of diabe-tes were induced in ATF4 knockout mice. Infl ammatory gene expression and signaling pathways, including JNK, STAT3, and NF- B, were analyzed. Our results showed that ER stress was induced, followed by ATF4 activation, in retinal and brain endothelial cells exposed to high glucose, TNF- or LPS. Inhibiting ATF4 activity by Ad-ATF4DN, or deletion of ATF4 gene signifi cantly attenuates high glucose- or LPS-induced ICAM-1, TNF- and VEGF expres-sion, and MCP-1 secretion. Conversely, over-expressing ATF4 was suffi cient to upregulate infl ammatory genes in retinal endothelial cells in vitro and in vivo. This was in part through activation of the JNK and STAT3 pathways. Downregulation of ATF4 remarkably reduced retinal adhesion molecule (ICAM-1) and infl ammatory cytokine (MCP-1, IL-1 and VEGF) expression, and mitigated retinal vascular permeability induced by diabetes or introvitreal injection of LPS. Taken together, our data indicate that ATF4 mediates ER stress-associated infl ammation in vascular endothelial cells. Inhibition of ATF4 activation may provide a new therapeutic target in diabetic retinopathy and other diabetic complications.
Supported by: NIH EY019949, AHAF, OCAST

A70
For author disclosure information, see page 797. ADA-Funded Research
ORA
LSCLINICAL NUTRITION
267-ORProtein-Rich Meal Replacement Signifi cantly Reduces Insulin De-mand, HbA1c and Weight Long-Term in Type 2 Diabetes Mellitus Patients With >100 U Insulin/DayKERSTIN KEMPF, NANETTE C. SCHLOOT, BABETTE GÄRTNER, RUDOLF KEIL, PETER SCHADEWALDT, STEPHAN MARTIN, Düsseldorf, Germany, Köln, Germany, Bad Homburg, Germany, Grevenbroich, Germany
Despite application of high insulin doses good glycaemic control is often lacking in type 2 diabetes mellitus (T2DM) patients and new therapeutic op-tions are needed. We analyzed if a protein-rich meal replacement (PRMR) could be successful in reducing insulin demand, HbA1c and body weight. During the 1st week obese T2DM patients (n=22) with insulin doses >100 U/day replaced 3 main meals by 50 g PRMR (Almased-Vitalkost) each (=1100 kcal/day). In 2nd-4th week 2 meals were replaced and a protein-rich lunch was allowed. In 5th-12th week only dinner was replaced. Clinical parameters were determined at baseline, after 4, 8 and 12 weeks as well as after 1.5 years of follow up. Wilcoxon signed rank test was used for the intention-to-treat analysis and Mann-Whitney test for subgroup analyses. The 12 week program was completed by 15 participants (68%). Already after 1 week mean insulin dose could be reduced from 147 ± 75 U to 91 ± 55 U/day (-56 U; p=0.0001) and further decreased to 65 ± 32 U (-82 U; p<0.0001) after 12 weeks of study. During the study HbA1c decreased from 8.8 ± 1.4 % to 8.1 ± 1.6 % (-0.8 ± 1.4 %; p=0.048) and weight from 118.0 ± 19.7 kg to 107.4 ± 19.2 kg (-7.9 ± 3.5 kg; p<0.0001). Signifi cant improvements were also seen for body mass index (-2.6 ± 1.3 kg/m2; p<0.0001), waist (-7.1 ± 6.6 cm; p=0.0003) and hip circumference (-3.3 ± 6.2 cm; p=0.035), fasting blood glucose (27.6 ± 39.6; p=0.027), triglycerides (-70.3 ± 85.1 mg/dl; p=0.0001) and HDL choles-terol (2.2 ± 3.8 mg/dl; p=0.049). After 1.5 years insulin demand and weight remained signifi cantly lower than baseline. Participants who continued PRMR further reduced their HbA1c, weight and insulin dose. Two patients could stop insulin therapy. In sum, PRMR was effective in reducing insulin demand of T2DM patients with intensifi ed insulin therapy accompanied by reduction of HbA1c, weight and other cardiometabolic risk factors. With con-tinuous use of PRMR glycaemic control might be improved long-term.
Supported by: Almased Wellness GmbH
268-OREating Vegetables Before Carbohydrates for Test Meals Improves Postprandial Glucose Excursions Assessed by Continuous Glucose Monitoring System Both in Patients With Type 2 Diabetes and in Subjects With Normal Glucose ToleranceSAEKO IMAI, MICHIAKI FUKUI, NEIKO OZASA, ONKOO RHEE, SHIZUO KAJIYA-MA, Osaka, Japan, Kyoto, Japan, Nagoya, Japan
We evaluated whether eating test meals of vegetables before carbohy-drates could reduce the postprandial glucose excursions assessed by con-tinuous glucose monitoring system (CGMS) in Japanese patients with type 2 diabetes mellitus (DM) and subjects with normal glucose tolerance (NGT). Seventeen patients with DM (65.7 ± 9.6 yrs, HbA1c 7.2 ± 1.0%) and 16 sub-jects with NGT (28.6 ± 12.0 yrs) were assigned to use CGMS (Medtronic Minimed Gold) for 4 days (72 hours) of either eating test meals of vegetables before carbohydrates or carbohydrates before vegetables in a randomized
CLINICAL NUTRITION
265-ORA High-Fiber Diet Improves M1/M2 Phenotype as well as the Vascu-lar Function in the Patients With Type 2 Diabetes MellitusKEIKO KONDO, YOSHIHIKO NISHIO, ATSUSHI ISHIKADO, MOTOYUKI KONDO, KEIKO NAKAO, KATSUTARO MORINO, TAKESHI YOSHIZAKI, OSAMU SEKINE, SATOSHI UGI, ATSUNORI KASHIWAGI, HIROSHI MAEGAWA, Otsu, Japan, Ka-goshima, Japan
The monocyte/macrophage system has mainly two distinct phenotypes of differentiation: proinfl ammatory (M1) and anti-infl ammatory (M2). We re-ported that a high-fi ber diet improved the vascular dysfunction in the patients with type 2 diabetes mellitus (T2DM). In this study, we investigated whether a high-fi ber diet affects M1/M2 phenotype of peripheral blood monocytes (PBM) as well as the vascular function in the patients with T2DM. We evalu-ated the mRNA expression of CD11c/CD163 ratio as a marker of M1/M2 phenotype of PBM and the vascular function in 10 patients with T2DM (59.2 years, M/F = 3/7, diet/OHA = 8/2) and age-matched 8 subjects with normal glucose tolerance (NGT) (58.0 years, M/F = 4/4). In addition, the diabetic patients were followed for 16 weeks assigned to two periods of 8 weeks of either a high-fi ber diet or control diet in a randomized crossover design. Be-fore and after each period, vascular function and CD11c/CD163 ratio in PBM were evaluated. The vascular function assessed with either peak forearm blood fl ow (FBF) (417 ± 209 vs. 800 ± 458%, p = 0.026) or fl ow debt repayment (FDR) (48 ± 18 vs. 104 ± 68%, p = 0.015) was signifi cantly low in the diabetic patients as compared with NGT. The ratio of CD11c/CD163 expression levels was higher in the diabetes patients as compared with NGT. The intervention with a high-fi ber diet for 8 weeks improved 39.2% of peak FBF (p = 0.075), and 63.5% of FDR (p = 0.006), but not with a control diet. Total energy intake was unchanged throughout the study periods. The intake of dietary fi ber in the high-fi ber diet period was higher than that in the baseline or control period (23.9 ± 4.3 vs. 12.8 ± 3.0 vs. 12.4 ± 2.8 g/day, p < 0.0001). Body weight (69.7 ± 12.9 vs. 68.5 ± 13.2 kg, p = 0.007) and HbA1c (7.0 ± 0.6 vs. 6.8 ± 0.6%, p = 0.036) levels were decreased, and CD11c/CD163 ratio showed a 20% re-duction (p = 0.022) after the high-fi ber diet period. A high-fi ber diet improved the vascular function, and might alter the gene expression of PBM in the patients with T2DM.
266-ORDietary Fat Acutely Increases Glucose Levels and Insulin Require-ments in Type 1 DiabetesHOWARD A. WOLPERT, ASTRID ATAKOV-CASTILLO, STEPHANIE A. SMITH, GAR-RY M. STEIL, Boston, MA
Current guidelines for intensive treatment of type 1 diabetes (T1D) base the meal-time insulin bolus calculations exclusively on carbohydrate count-ing. There is strong evidence that free fatty acids impair insulin sensitivity, and we hypothesized that patients with T1D would require more insulin cov-erage for higher fat meals than lower fat meals with identical carbohydrate content. We used a cross-over design comparing two 18-hour periods (6 PM to 12 noon) of closed loop (CL) glucose control following high fat (HFD) vs. low fat dinners (LFD; 6 PM). Each dinner had identical carbohydrate and protein content, but different fat content (60 vs. 10 grams, respectively). Breakfast meals (8 AM) were identical. The CL system utilized the external Physiologic Insulin Delivery (PID) algorithm. Seven T1D subjects (age 55±12 years, A1c 7.2±0.8%) successfully completed the protocol. The HFD required more insulin (15.2±7.5 vs. 10.3±4.7 U; p = 0.01), and despite the additional insulin caused more hyperglycemia (Figure, AUC above 180 mg/dL = 55.8±8.2 vs. 33.3±4.8 g/dL·min; p = 0.0003). Calculated carbohydrate-to-insulin ratio increased from 9±2 to 13±3 grams/U (HFD vs. LFD, respectively; p = 0.01). There were marked inter-individual differences in fat sensitivity, with one subject requiring a more than two-fold (108%) increase in insulin dose to cover the HFD. These fi ndings: 1) Highlight the limitations of the current car-bohydrate counting-based approach to bolus insulin dose calculation, and 2) Suggest that dietary fat intake is an important nutritional consideration for glycemic control in individuals with type 1 diabetes.

A71
For author disclosure information, see page 797.ADA-Funded Research
ORA
LS
CLINICAL NUTRITION
271-ORAn Isocaloric High Fat Diet Induces an Infl ammatory Cytokine Re-sponse in Healthy Humans Without Increasing Body WeightANNE-CATHRIN SELTMANN, MICHAEL KRUSE, SILKE HORNEMANN, DANIELA HOFFMANN, MARTIN OSTERHOFF, ANDREAS BUSJAHN, ANDREAS F. PFEIFFER, Nuthetal, Germany, Berlin, Germany
Consuming hypercaloric high fat diets leads to obesity and cytokine re-lease from adipocytes, which is a risk factor for diabetes and cardiovas-cular diseases. It is unclear whether the infl ammatory response relates to weight gain or to the dietary fat itself. This study analysed the effect of a nutritional switch from a low fat to a high fat diet under isocaloric condi-tions on body weight (BW), fat mass (FM), CRP and gene expression of cy-tokines in subcutaneous adipose tissue (SAT) in healthy humans. 46 healthy individuals, age 18-70 years, were investigated for 12 weeks. An isocaloric diet rich in carbohydrates (55% carbohydrates, 15% protein, 30% fat, LF) was applied for 6 weeks followed by an isocaloric diet rich in saturated fat (40% carbohydrates, 15% protein, 45% fat, HF) for another 6 weeks. Serum concentration of CRP, interleukin-6 (IL-6), visfatin (VS) and chemerin (CM) were measured after the LF period, after one week of HF (HF1wk) and at the end of the HF period (HF6wk). Gene expression of IL-6, CM and VS was assessed in biopsies from SAT. Body composition was determined using a DEXA scan. BW and DEXA FM were constant over the time of interven-tion: BW: LF 69.44±1.94kg, HF1wk 69.45±1.91kg, HF6wk 69.92±1.96kg, FM: LF 23.56±1.04%, HF6wk 23.77±1.01%. CRP was increased after 6 wk on HF (1.90±0.43mg/dl) compared to LF and HF1wk (0.97±0.19 and 1.04±0.21mg/dl, both p<0.05). Serum VS was increased in HF6wk (0.71±0.13ng/ml) compared to LF (0.48±0.08ng/ml, p<0.05), but not in HF1wk. Serum CM was increased in HF1wk (143.22±4.40ng/ml) and HF6wk (139.65±3.63ng/ml) compared to LF (133.62±4.52ng/ml), both p<0.05. There was no difference in serum IL-6. In SAT, gene expression of VS was increased 2.06-fold in HF1wk and 2.08-fold in HF6wk (both p<0.05) and gene expression of CM was 1.25fold increased in HF1wk and 1.28fold increased in HF6wk compared to LF (both p<0.01). Despite constant BW an isocaloric HF diet leads to an infl ammatory cytokine response in SAT in normal weight healthy humans.
Supported by: Federal Ministry of Education and Research, Germany
272-ORGrape Polyphenols Prevent High-Fructose Diet-Induced Insulin Re-sistance in Obese 1st-Degree Relatives of T2 Diabetic Patients by Modulating Mitochondrial Function and Oxidative StressANTOINE AVIGNON, MARIE HOKAYEM, EMILIE BLOND, JEAN-FRÉDÉRIC BRUN, CHRISTINE FEDOU, JENNIFER RIUSSET, HUBERT VIDAL, JACQUES MERCIER, CHRISTINE FEILLET-COUDRAY, CHARLES COUDRAY, JEAN-PAUL CRISTOL, ANNE-MARIE DUPUY, MARTINE LAVILLE, Montpellier, France, Lyon, France
Recent evidence supports that grape polyphenols (GPP) improve insulin resistance (IR) in high-fructose-fed rats. There is no equivalent data in hu-mans. We treated 35 healthy, obese 1st degree relatives of T2 diabetics with placebo (P) or 2g/day GPP in a randomized double-blind study for 9 wk. During the last wk, both groups received a 3g/kg lean body mass fructose load (FL)/day. Very few clinical and metabolic changes were noted after the fi rst 8 wk of GPP. After the FL, the glucose infusion rate (GIR) measured using the hyperinsulinemic euglycemic clamp (7.38±0.57 vs 6.57±0.55, p=0.026) and fasting hepatic insulin sensitivity index (11.94±1.52 vs 9.57±0.88, p=0.025) decreased in the P group and muscle PAkt/Akt tended to decrease (13.13±1.49 vs 6.16±0.7, p=0.068). Such alterations were not noted in the GPP group. The FL signifi cantly increased protein muscle carbonylation, muscle TBARS and urinary F2isoprostanes in the P group, leaving the GPP group spared. Considering the global population, urinary F2isoprostanes were
crossover design. The participants consumed each test meal at a fi xed time on the 2nd and 3rd day. The subjects ate the fi rst dish of vegetables for 5 min, then the main dishes, and consumed rice or bread with a 10-min interval between the vegetables and carbohydrates in each test meal, or eating vice versa. The glucose fl uctuations were assessed by the following parameters obtained from CGMS and compared between two different days: the mean blood glucose (MBG), standard deviation (SD), mean amplitude of glyce-mic excursions (MAGE), and the largest amplitude of glycemic excursions (LAGE). The levels of SD, MAGE, and LAGE were signifi cantly reduced when the subjects ate the test meals of eating vegetables before carbohydrates compared to the reverse regimen. These results suggest that the eating or-der of vegetables before carbohydrates reduces the postprandial glucose excursions both in patients with DM and in subjects with NGT.
Characteristics of glycemic excursions in patietns with DM and subjects with NGT
DM (n=17) (n=17) NGT (n=16) (n=16)Vegetables
beforecarbohy-drates
Carbohy-dratesbefore
vegetables
p Vegetables before
carbohydrate
Carbohy-dratesbefore
vegetables
p
MBG (mg/dl) 141 ± 29 144 ± 29 n.s. 91 ± 7 96 ± 9 p < 0.05SD (mg/dl) 31 ± 13 42 ± 21 p < 0.01 12 ± 4 15 ± 6 p < 0.01MAGE (mg/dl) 78 ± 35 114 ± 58 p < 0.01 28 ± 11 42 ± 19 p < 0.01LAGE (mg/dl) 125 ± 42 164 ± 67 p < 0.01 57 ± 17 78 ± 30 p < 0.01
Supported by: Scientific Research Grants from Japan and Osaka Prefecture University
269-OREffects of Brown Rice Diet on Metabolic Parameters and Infl amma-tory Markers in Chinese American With PrediabetesBIN WANG, RAJ MEDAPALLI, JIN XU, WEIJING CAI, XUE CHEN, JOHN C. HE, JAIME URIBARRI, New York, NY
Epidemiological studies have shown an association between consump-tion of white rice and prevalence of insulin resistance. We wanted to test the effect of substituting brown rice for white rice on insulin resistance and expression of infl ammatory markers in pre-diabetic Chinese patients with a usual high intake of white rice. 100 Chinese American with diagnosis of pre-diabetes in the area of Flushing, New York City, were randomized to either continue their usual white rice intake or change to same amount of brown rice for 3 months. Fasting blood was obtained at baseline and end of study in both groups for measurement of circulating and cellular (peripheral mononuclear cells) metabolic and infl ammatory markers. Only 57 patients fi nished the study. The brown rice group experienced signifi cant weight loss (64.9 + 8 kg to 63.4 + 8 kg; mean + SD) and fall of both systolic and diastolic blood pressure (123 + 10 mmHg to 114 + 13 mmHg and 75 + 6 mmHg to 72 + 6 mmHg, respectively). Insulin (6.3 + 5 U/ml to 5.5 + 5 U/ml), HOMA (1.5 + 1.2 to 1.3 + 1.2) serum Advanced Glycation Endproducts (CML 6.6 + 2 U/ml to 5.4 + 1 U/ml and MG 0.89 + 0.16 nmol/ml to 0.73 + 0.20 nmol/ml), 8-isoprostane (102 + 32 pg/ml to 87 + 24 pg/ml) and TNF protein (71 + 36 pg/mg to 55 + 24 pg/mg) decreased, while SIRT1 mRNA increased in the brown rice group as compared to the white rice group. In conclusion, substituting brown rice for white rice in a population with high daily consumption of rice for a period of 3 months has a signifi cant benefi cial effect in improving their metabolic risk factors. Elucidation of the mechanisms of these effects will require further studies.
270-OR
WITHDRAWN

A72
For author disclosure information, see page 797. ADA-Funded Research
ORA
LSMATERNAL DIABETES—EXPOSURE, EPIGENETICS, AND EMBRYOPATHY
of DNA methylation patterns of trophoblasts from lean, obese and GDM women generated 25 million 36bp reads. Within the 1,000 most differential-ly methylated regions, 670 were signifi cantly overmethylated in obese and GDM vs lean (p<0.05). The overmethylated genes were located close (<2kb away) to genes regulating nutrient transporters (GO0031323, p=2.96x10⁻⁸)and Wnt receptor signaling pathway (GO0016055, p=7x10⁻³). Conclusion: The human trophoblast harbors a cell type specifi c methylome distinct from whole placental tissue. Obesity and GDM modify trophoblast epigenetic marks and delineate the canonical Wnt signaling pathway, as a novel regu-latory candidate.
Supported by: RO1 HD-22965
275-ORPaternal Prenatal Undernutrition Alters Fetal Liver Development in F2 OffspringYUSUKE ADACHI, ELVIRA ISGANAITIS, ARISTIDES LYTRAS, VICENCIA SALES, MICHAEL CHEN, MARY-ELIZABETH PATTI, Boston, MA
Prenatal exposure to nutritional and metabolic stress increases risk of diabetes, obesity and cardiovascular disease in offspring in both humans and animal models. We have previously shown in mice that prenatal under-nutrition (UN) during pregnancy results in glucose intolerance and obesity in fi rst-generation (F1-UN) offspring. Moreover, second-generation (F2) off-spring of F1-UN males and normal females have glucose intolerance and increased adiposity, despite normal nutrition during the second-generation pregnancy. To evaluate mechanisms contributing to early-life metabolic phe-notypes in F2 offspring of F1-UN males, we analyzed liver from E16.5 F2 fe-tuses generated from breeding: (1) control females with F1-UN males (F2-CU) and (2) control females with control males (F2-CC). There were no signifi cant differences in liver weight; however, examination of H&E-stained sections demonstrated that erythrocyte islands, prominent components of fetal liver at this stage, were substantially reduced in F2-CU mice as compared with F2-CC controls. Immounohistochemistry demonstrated reductions in CD34+ cells in F2-CU, confi rming abnormal development of hematopoietic cells in F2-CU liver. In addition, the number of cells positive for the cell proliferation marker Ki67 and the mitosis marker phospho-histone H3 were decreased in F2-CU mice, indicating potential downregulation of the cell cycle in F2-CU mice. To assess this possibility, we examined gene expression patterns (qRT-PCR) in fetal liver, observing marked downregulation of genes related to regulation of the cell cycle, such as AurkA and AurkB (24-51% decrease, p<0.01). Interestingly, similar gene expression patterns were also observed in fetal liver of F1 mice. Taken together, these results suggest that paternal nutritional exposures may regulate cell cycle patterns in offspring, poten-tially via durable epigenetic marks.
276-ORMaternal Insulin Resistance Impacts Endocrine and Metabolic Pro-gramming in the OffspringSEVIM KAHRAMAN, ERCUMENT DIRICE, DARIO F. DE JESUS, JIANG HU, ROHIT N. KULKARNI, Boston, MA
Studies in humans and rodents suggest maternal diabetes during fetal life leads to a higher risk of impaired glucose tolerance and obesity dur-ing adulthood. However, the impact of insulin resistance (IR) in the mother on glucose homeostasis in the offspring is not fully explored. We aimed to determine the consequences of IR in the mother on fetal growth and fetal endocrine pancreas in the female liver-specifi c insulin receptor knockout (LIRKO) mouse model of maternal IR. Female LIRKO mice were hyperinsu-linemic (LIRKO 8.1±1.1 vs controls 1.4±0.1 ng/mL, n=3, p<0.01) and developed spontaneous gestational diabetes (LIRKO 196.3±55.3 vs controls 109.4±9 mg/dL, n=3, p<0.05). We examined control offspring of LIRKO mothers (CL), LIRKO offspring of LIRKO mothers (LL), and control offspring of control moth-ers (CC) at embryonic (E) days 13.5, 15.5, 17.5, and postpartum (P) days 0, 4, 10, 21 (n=3-10). Although, all embryos of LIRKO mothers exhibited low body weights at E17.5 (CL, 0.7±0.03; LL, 0.65±0.02 vs CC, 0.8±0.05 g; p<0.05 each), they rapidly gained weight after birth compared to CC at P4 (CL, 2.68±0.08; LL, 2.28±0.15 vs CC, 1.94±0.14 g; p<0.01, p<0.05 respectively). At P4, the CL but not LL embryos were hyperinsulinemic (CL, 2.5±0.5; LL, 1.5±0.5 vs CC, 0.6±0.3; CL vs CC, p<0.01) and mildly hyperglycemic (CL, 85.3±2.0; LL, 81.0±6.5 vs CC, 67.4±5.5; CL vs CC, p<0.05). Analyses of the endocrine pan-creas at P4 revealed signifi cantly reduced islets per mm2 of pancreas in CL but not in LL compared to CC (CL, 7.7±0.5 LL, 9.6±1.6 vs CC, 9.8±0.6; CL vs CC, p<0.01). While there was no change in beta cell size, the beta cell content was increased in all offspring of LIRKO mothers compared to CC, and tended to be higher in LL (CL, 80.4%; LL, 82.7% vs CC, 75.3%; n=4). Together these data indicate that maternal IR is important in determining fetal beta cell
inversely correlated with GIR before the FL (r=-0.46, p<0.005) and urinary F2-isoprostanes fl uctuations during FL were negatively correlated with the variation of GIR (r=-0.38, p=0.02). Muscle mitochondrial fonction tended to decrease in the P group after FL but signifi cantly increased in the GPP group. In the P group, mitochondrial function after FL was associated with urinary F2isoprostanes (r=0.79, p<0.05) and negatively with GIR (r=-0.97, p<0.001). Moreover, we noted a downward trend in UCP3 protein in the P group after FL (59% decrease, p=0.08) and an increase in mitochondrial biogenesis in the GPP group as evidenced by a signifi cant rise in PGC-1a mRNA and a higher citrate synthase activity compared to the P. In conclusion, we demonstrate that GPP protect against fructose induced IR by modulating mitochondrial function and oxidative stress.
Supported by: ANR - Agence Nationale de la Recherche
MATERNAL DIABETES—EXPOSURE, EPIGENETICS, AND EMBRYOPATHY
273-OROxidative Stress Inhibits Differentiation-Associated DNA Methyla-tion Patterns that are Necessary for Embryo Gene ExpressionDAN WEI, MARY R. LOEKEN, Boston, MA
Neural tube defects (NTD) are among the most common malformations caused by diabetic pregnancy in humans and animal models. We have previ-ously shown that maternal hyperglycemia-induced oxidative stress inhibits expression of Pax3, a gene that is expressed in neuroepithelium and re-quired for neural tube closure, and is suffi cient to explain these NTD. The precise mechanisms by which oxidative stress inhibits Pax3 expression are not known. We hypothesize that induction of Pax3 during differentiation re-quires epigenetic modifi cation of transcription regulatory elements, and that oxidative stress inhibits these changes. We tested the involvement of Pax3 CpG island methylation using murine embryonic stem cells (mESC). mESC can differentiate into Pax3-expressing neuronal precursors, and antimycin A (AA), a chemical inducer of oxidative stress, inhibits Pax3 expression mESC. We report here that a DNA methyltransferase inhibitor, AzaC, induced Pax3 expression in undifferentiated (UD) mESC. Upon differentiation, methylation of a promoter-proximal Pax3 CpG island decreased, and AA blocked this de-crease. Of the 3 DNA methyltransferases (DNMTs), DNMT1, DNMt3a, and DNMT3b, only expression of DNMT3b changed (decreased) with differen-tiation. However, AA did not affect DNMT3b expression. Using inducible shRNA vectors to knock down expression of the DNMTs, we found that only DNMT3b regulates Pax3 expression and CpG island methylation. Moreover, expression of DNMT3b was required for AA to inhibit Pax3 expression. These results indicate that Pax3 expression is silenced in UD early embryo cells by CpG island methylation caused by DMT3b. Upon differentiation, induction of Pax3 expression requires loss of CpG methylation caused by decreased DN-MT3b expression. Oxidative stress appears to block differentiation-induced Pax3 expression by increasing activity of DNMT3b, thereby maintaining an UD pattern of Pax3 CpG island methylation.
Supported by: RO1 DK58300 to M.R.L.
274-ORDiabetes and Obesity Modify the DNA Methylation Pattern of Hu-man Trophoblast GenesDAVID SERRE, MARICELA HAGHIAC, MATTHEW CANNON, HADLEY MILLER, SYLVIE HAUGUEL-DE MOUZON, Cleveland, OH
Background: Epigenetic marks are subjected to variation in response to changes in metabolic homeostasis. This study tested the hypothesis that obesity and gestational diabetes (GDM) alter the genome-wide DNA methy-lation patterns of the human placenta. Methods: Placentas were obtained at term elective C-section of 15 pregnancies with GDM (BMI 38.0+0.6) and healthy lean (BMI 22.0+2.0) or obese (BMI 38.4+0.6) women. The genome wide patterns of DNA methylation was assessed in isolated trophoblasts and whole placenta. Two complementary approaches were used: 1) precipi-tation of densely methylated DNA using recombinant Methyl-CpG Binding Domain protein 2 followed by massively parallel sequencing and 2) reduced representation bisulfi te sequencing (RRBS). Results : Over 500,000 genomic 100bp regions were differentially methylated (FDR<5%) between placenta and trophoblast cells. 1,329 windows were methylated only in placenta while 6,987 were methylated only in trophoblasts. This translated into 67 gene promoters being solely methylated in placenta and 304 in tropho-blasts. Trophoblast-specifi c DNA methylation marks included genes encod-ing known cytokines, growth factors and transcriptional regulators (LEP, RELT, TGFB1, APBB2, GDF6, NR2F2, FOXC1, WNT3A, WNT7). RRBS analysis
A73
For author disclosure information, see page 797.ADA-Funded Research
ORA
LS
SOURCE OF BETA CELLS IMPROVING ISLET FUNCTION
SOURCE OF BETA CELLS IMPROVING ISLET FUNCTION
279-ORFunctional In Vivo -Cell Differentiation of Expanded Human Pan-creatic Duct Cells DPHILIPPE A. LYSY, FRANCISCO CABALLERO, TAKATSUGU YAMADA, AMEDEO VETERE, RYOSUKE MISAWA, PIOTR WITKOWSKI, JI LEI, JAMES MARKMANN, SUSAN BONNER-WEIR, Boston, MA, Chicago, IL
A major goal for -cell replacement therapy is to fi nd an adequate supply of functional -cells. Pancreatic duct cells have -cell differentiation po-tential but their role as candidates for transplantation has been uncertain. Our aim was to extensively expand human pancreatic duct cells and then evaluate their potential for in vitro and in vivo -cell differentiation. Human pancreatic CA19-9+ duct cells from 5 donors achieved up to 18 population doublings after monolayer culture in growth medium EGM-2-MV. In this medium, the cells became spindle-shaped and most duct cell markers were down-regulated. These human pancreatic duct-derived cells (HDDCs) had features of partial epithelial-mesenchymal transition but differed from bona fi de mesenchymal stromal cells or fi broblasts. In vitro differentiation proto-cols reprogrammed these HDDCs towards a -cell-like phenotype, with up to 3.1% of the cells stained for insulin but without glucose-responsive insulin secretion. After this differentiation protocol, 106 HDDCs were transplanted under the kidney capsule of STZ-induced diabetic (570 ± 30 mg/dl) NOD-SCID mice. By 33 days the fed blood glucose levels of 4 of 6 mice were below 200 mg/dL while similar transplantation of undifferentiated HDDCs (n=8) did not lower blood glucoses. During IPGTTs, the 4 “cured” mice had basal hu-man insulin values of 2.2 ± 0.3 μU/mL that increased to 4.6 ± 0.5 and 11.9 ± 2.7 μU/mL, respectively, at 15 and 30 min after glucose injection. Grafts from these mice consisted mainly of insulin positive cells (78.1 ± 7.3%) co-expressing c-peptide, synaptophysin, and chromogranin A with no glucagon, somatostatin, or pancreatic polypeptide expression observed. In conclusion, HDDCs are potential candidates for -cell replacement therapy since they have great capacity for expansion, acquire glucose-responsiveness in vivo and lower blood sugars of diabetic animals to near-physiological levels.
280-ORStimulating Beta Cell Replication and Improves Islet Graft Function by a GPR40 and GPR120 Dual AgonistJIE GAO, GUOBIN WENG, TIMOTHY D. O’BRIEN, ANSARULLAH, YAN LU, MAR-THA KOENIG, BRITTANY DERUYTER, ZHIGUANG GUO, Beijing, China, Ningbo, China, Minneapolis, MN, Sioux Falls, SD
GPR40 is abundantly expressed in cells. GPR40 and GPR120 are ex-pressed on the intestinal L cells. In this study, we investigated whether GW9508 (GW), a GPR40 and GPR120 dual agonist, can directly stimulate
-cell replication in vitro and in vivo and improve islet graft function in dia-betic mice. To determine -cell proliferation in vitro, C57BL/6 mouse islets were cultured for 4 days, with and without GW. BrdU was added on day 3 for overnight. Insulin and BrdU immunofl uorescence staining was performed on intact islets and BrdU+ cells were accounted using confocal microscope. To determine islet graft function, 100 C57BL/6 mouse islets were transplant-ed under the left kidney of each streptozotocin induced-diabetic C57BL/6 mouse. These recipient mice were given BrdU and with or without GW at 10 mg/kg/day, starting from the day of transplantation. Islet graft function was monitored by measuring blood glucose level. At 4 weeks, Islet grafts were collected to determine -cell replication. Plasma GLP-1 was measured. Insulin+ and BrdU+ cells in each cultured islet were 13.6±1.2 cells with 0.1 μM GW; 18.3±1.5 cells with 1 μM GW; and 27.4±2.4 cells with 10 μM GW (P<0.01, vs. 10.5±0.6 cells in each untreated islet). After islet transplanta-tion, vehicle treated mice achieved normoglycemia in 14.4 ±2.9 days (N=10), while GW treated mice only required 6.4±2.9 days (N=10, P<0.01). The per-centage of insulin+ and BrdU+ cells in islet grafts were signifi cantly higher in GW treated mice than in vehicle treated mice. The mean percentage of insulin+ and BrdU+ cells in islet grafts was 23.6±6.4% in GW treated mice and 6.7±3.4% in vehicle treated mice (P<0.01). At 30 minutes treatment, plasma GLP-1 was 9.3±2.6 pM/L in vehicle treated mice and 14.7±4.7 pM/L in GW treated mice (P<0.05). Our data demonstrated that GW can stimulate
-cell replication and improve islet graft function. Targeting GPR40 and/or GPR120 is a novel therapeutic approach to stimulate -cell replication and to improve islet graft function.
mass. The relatively greater islets and beta cells in the LL compared to CL embryos suggest cell autonomous epigenetic mechanisms in the regulation of islet growth and development.
277-ORHyperglycemia Induces Embryopathy In Vivo, Even in the Absence of Systemic Maternal DiabetesANDREW W. NORRIS, MICHELLE L. BAACK, CHUNLIN WANG, Iowa City, IA
The Petersen-Freinkel hypothesis proposes that excesses of glucose and perhaps other fuels produce the embryopathy of maternal diabetes. In vitro, hyperglycemia is suffi cient to induce embryopathy and teratogenesis in cultured embryos, but corresponding in vivo tests have been elusive. Thus we exposed developing embryos in vivo to hyperglycemia, but not systemic maternal diabetes, by infusing 4 mg/min glucose into the left uterine ar-tery on gestation days 7-9 in healthy pregnant rats. Maternal, and thus right uterine horn, euglycemia was maintained despite pathologic hyperglyce-mia in the left uterine horn. Embryopathy prevalence and severity per an established 0-10 embryopathy score were determined on gestational day 13. Embryopathy was more prevalent among hyperglycemia exposed (i.e. left sided) than control (right sided) fetuses, at 43±16% versus 6.9±3.6% (p<0.0001, n=7 mothers, 88 fetuses). Likewise, the mean embryopathy score was higher in the left (4.0±1.6) versus right fetuses (0.63±0.36, p<0.00005). For comparison, additional mothers received the teratogen retinoic acid (25 mg/kg) systemically on gestational day 7.5. These mothers exhibited identi-cal embryopathy prevalence (19%) and severity (1.3-1.7, p=0.7, n=6 moth-ers, 93 fetuses) between uterine horns. Among a third set of mothers, dual exposure to retinoic acid and hyperglycemia produced embryopathy rates (48±16%) and scores (4.5±1.8) (n=6 mothers, 40 fetuses) not signifi cantly dif-ferent than hyperglycemia alone. Embryopathy produced by either retinoic acid or hyperglycemia was manifest by a range of malformations and varied degrees of embryo resorption. We conclude that hyperglycemia alone, even in the absence of systemic maternal diabetes, is suffi cient to produce in vivo embryopathy during organogenesis, as predicted by the Petersen-Freinkel hypothesis.
Supported by: NIH R01 DK081548
278-ORPGC1 Overexpression in Transgenic Mice Reduces Maternal Dia-betes-Induced Neural Tube DefectsCHENG XU, XUEZHENG LI, FANG WANG, E. ALBERT REECE, PEIXIN YANG, Bal-timore, MD
Maternal diabetes increases the risk of neural tube defects (NTD). Hyper-glycemia-induced metabolic stress and apoptosis cause NTD; however, the molecular intermediates that lead to these adverse events have not been well characterized. The peroxisome proliferator-activated receptor (PPAR)-transcriptional coactivator PGC-1 is an important regulator of mitochon-drial biogenesis and function. PGC-1 is abundantly present in the central nervous system. Furthermore, overexpression of PGC-1 suppresses apop-tosis, whereas reduced levels of PGC-1 sensitize cells to apoptosis. Be-cause mitochondrial dysfunction and apoptosis are two interdependent and causative events in diabetic embryopathy, we aimed to determine whether PGC-1 plays a role in this disease process. Levels of all three PGC-1 fam-ily members, PGC-1 , PGC-1 and PRC, were determined. PGC-1 and PRC were signifi cantly reduced by maternal diabetes at embryonic day 8.5 (E8.5), while PGC-1 levels remained unchanged. To determine the function role of PGC-1 reduction, rat nestin promoter driven PGC-1 transgenic (Tg) mice were generated. PGC-1 overexpression occurred at E8 onwards, and specifi cally in the neural tube. Wildtype (WT) diabetic female mice were mated with male PGC1 -Tg mice to generate WT and PGC-1 overexpressed embryos. Under diabetic conditions, the NTD rate of PGC1 overexpressed embryos was only 2.3%, which was signifi cantly lower than that of WT em-bryos (25%). Under non-diabetic conditions, the NTD rates in both WT and PGC1 overexpressed embryos were 0.0 %. To delineate the mechanism underlying maternal diabetes-reduced PGC-1 and PRC expression, we used targeted deletion of Protein Kinase C alpha gene (PKC ), whose activation mediates the teratogenicity of diabetes. Targeted deletion of PKC abrogat-ed diabetes-reduced PGC-1 and PRC expression. We conclude that PGC-1reduction, which is likely downstream of PKC , is a causative event leading to NTD in diabetic embryopathy.
Supported by: NIH R01 DK083243 to P.Y. and R01 DK083770 to E.A.R.

A74
For author disclosure information, see page 797. ADA-Funded Research
ORA
LSSOURCE OF BETA CELLS IMPROVING ISLET FUNCTION
in the NOD mice model. Prevention of diabetes was evaluated after trans-plantation with culture expanded MSCs ( 1 × 10⁶ per mouse ) in 9-week-old female NOD mice by lateral tail vein injection. Three months later, the incidence of type 1 diabetes was observed .And the frequency of reactive CD4+,CD8+T cells and CD4+CD25+ regulatory T cells in the blood of male NOD recipients were also quantifi ed by fl ow cytometry. In addition, Cytokine pro-duction like IL-2, IL-10 and TNF- were assessed by ELISA.We also observe lymphocyte infi ltration and / cell levels of islets. At the end of 12 weeks after transplantation, we found that the incedence of type 1 diabetes was 75% for the control group and 30% for the treatment group. The CD4+ cell levels and CD4+/CD8+ ratio were more in the stem cell therapy group than in the disease group(P <0.05),whereas less than in the normal group (P <0.05).Accordingly the CD4+CD25+ cell levels were higher in the stem cell therapy group than in the disease group(P <0.01),whereas lower than in the normal group (P <0.01) .IL-10 was up-regulated(P <0.01) ,and TNF- was down-regulated (P <0.01) in the murine transplantation model.Importantly immu-nochemistry confi rmed that a more complete structure of islet cell where lymphocyte infi ltration was signifi cantly reduced and / cells were con-sistently increased in the treatment group.This study suggests that MSCs reverse hyperglycemia and reduce the use of insulin which may thus offer a novel cell-based approach for the prevention of autoimmune diabetes and for islet cell transplantation.
284-ORUpregulation of MafA Promotes Maturation of Mouse Embryonic Progenitor-Derived Insulin-Producing Cells and Improves their In Vivo FunctionSHIYING SHAO, WATARU NISHIMURA, YONG MONG BEE, ARUN SHARMA, GUODONG LI, Singapore, Singapore, Boston, MA
Shortage of pancreas donors has impeded transplantation therapy for curing type 1 diabetes. We have generated a dozen of glucose-responsive insulin-producing cell lines (e.g. MEPI and ERoSHK) by differentiating mouse embryonic stem or progenitor cells. Transplantation of these cells into dia-betic animals could correct hyperglycemia, but they displayed features of immaturity such as induction of moderate hypoglycaemia and continuous proliferation in vivo. We found the expression of MafA, a master transcrip-tion factor implicated in controlling islet -cell development and glucose responsiveness, was signifi cantly lower in these cells than that in mouse islets. Thus we transfected mouse embryonic progenitor-derived insulin-producing (MEPI)-1 cells with vectors expressing MafA to upregulate its levels close to that in islets. MafA restoration signifi cantly improved glu-cose responsiveness of MEPI-1 cells, e.g. metabolism, membrane potential depolarization, cytosolic Ca2+ rise and insulin secretion. MafA upregulation signifi cantly slowed MEPI-1 cell growth by prolonging the doubling time by 20% and increasing the cells at G1 phase. Accordingly, the expression of p27, an inhibitor of CDKs controlling cell cycle, was enhanced by 1.5 fold. The in vivo function of MafA-restored MEPI-1 cells was assessed by peritoneal implantation in immune-competent diabetic mice following alginate encap-sulation. The growth of encapsulated MafA-restored MEPI-1 cells reached a peak at 90 days after implantation, markedly slower than the encapsulated control cells at 30 days. Importantly, the period of normoglycemia after implantation of MafA-restored MEPI-1 cells was signifi cantly longer than that by control cells (105±5 vs. 69±3 days; n=8; p<0.01) before relapse of hyperglycemia. These data indicate that MafA can promote embryonic stem cell-derived insulin-producing cells toward maturation and enhance their in vivo function.
Supported by: National Medical Research Council of Singapore
285-ORLong-Term Function of Marginal Mass of Encapsulated Islet Al-lografts in the Omentum of Immune-Competent Diabetic RatsRAJESH A. PARETA, JOHN P. MCQUILLING, JUAN ARENAS-HERRERA, SITTAD-JODY SIVANANDANE, NATHANIEL T. MARSHALL, ALAN C. FARNEY, EMMANU-EL C. OPARA, Winston-Salem, NC
Immunoisolation is a strategy to overcome barriers to routine islet trans-plantation. However, the ideal site for engraftment of encapsulated islets has not been established. Microencapsulated islets have been transplanted into the general peritoneal cavity, but with variable success and an inability to recover islet grafts for analysis. Our study aim was to determine the viabil-ity of encapsulated islet allografts in an alternative site, the omentum pouch, made in immune-competent diabetic rats. Islets isolated from Wistar-Furth rats were encapsulated in microcapsules (300 - 400 μm in diameter) made with 1.5 wt% ultrapurifi ed high M alginate (LVM). Following perm-selective coating with 0.1 wt% Poly-L-Ornithine, they were fi nally coated with high
281-ORHuman Hair Follicle Cells Induce Localized Immune Privilege Against Allogeneic Islet Responses In VitroXIAOJIE WANG, JIANQIANG HAO, I-FANG LEE, ZILIANG AO, BRUCE VERCHERE, GARTH WARNOCK, JERRY SHAPIRO, KEVIN MCELWEE, Vancouver, BC, Canada
Type 1 diabetes is one of the most common chronic diseases. Islet trans-plantation offers a potential cure, but its widespread use is challenged by the increased tumor risk and opportunistic infections from long-term usage of immunosuppressive drugs. Therefore, reduced-risk, localized immuno-modulatory therapy is urgently needed. Hair follicle derived mesenchymal dermal sheath cells (DSCs) exhibit natural immune privilege due to the se-cretion of immuno-regulatory factors and a lack of MHC class I and II ex-pression. The objective of this study is to test whether non-histocompatible islets, in close association with DSCs, will escape immuno-surveillance. We fi rst showed that cultured DSCs retained immune privilege properties. Com-pared to fi broblasts, an upregulation of immune privilege associated genes (activin A, MSH, and TGF- 2 showed a 3.0-, 12.6-, and 3.2-fold increase, respectively) and downregulation of MHC class I molecules (HLA-A, B, and C showed a 4.6-, 2-, 4.8-fold decrease, respectively by quantitative PCR) were observed on DSCs. Furthermore, in allogeneic responses co-cultured with human peripheral blood mononuclear cells (PBMCs, as responders) and purifi ed human islets (as stimulators), the secretion of IFNg from PB-MCs was signifi cantly reduced in the presence of DSCs (23.0 vs. 5.7 pg/ml, p<0.01) or DSC-conditioned medium (18.5 vs. 2.15 pg/ml, p<0.04). The function of T-effector- (CD8+IFNg+, 64.2% vs. 42.8%, p<0.01) and T-helper 1-cells (Th1, CD4+IFNg+, 29.8% vs. 20.4%, p<0.03) was inhibited by 36% and 32%, respectively, indicating a hyporesponsiveness to alloantigen stimula-tion. This study demonstrates that human islet/hair follicle dermal sheath cell constructs exhibit localized immunosuppressive properties, suggesting that transplanted islets may be benefi ted from the immune privilege status. Using naturally immune privileged cells may reduce the need for chronic sys-temic immunosuppression in clinical islet transplantation.
282-OREffect of Organ Transplantation on Cellular Senescence in Type 1 Diabetic PatientsROBERTO LUPI, SILVIA DEL GUERRA, MORENA GABRIELE, PIERO MARCHETTI, STEFANO DEL PRATO, Pisa, Italy
Measurement of the length of telomeres could provide a marker for chang-es in cell senescence after transplantation procedures. We have determined telomere length (TL) and telomerase activity (TA) in diabetic patients before and after pancreas transplantation. We have recruited 19 non-diabetics (ND), 19 type 1 diabetes (T1DM) and 27 T1DM from the waiting list for trans-plantation (L-TX) and 15 transplanted T1DM (TX). TL, telomerase subunits HTERT and HTERC, and CCR2 gene expression was determined by Real-Time qPCR. In the study population as a whole, TL was inversely associated with age (r=0.240, p=0.035), BMI (r=0.258, p=0.041), total cholesterol (r=0.290, p=0.021), LDL (r=0.281, p=0.025), and C-peptide (r=0.315, p=0.007) (all p<0.05 or less), while the correlation was positive with HDL (r=0.610, p<0.001), and DD (r=0.421, p=0.004) (both p<0.05 or less). By multiple regression analysis, DD and HDL remained independently associated with telomere length. TL was higher in L-TX (0.217±0.028) than in ND (0.153±0.015; p<0.05). Moreover, HTERT expression was higher (0.0354±0.0009 and 0.164±0.029, respective-ly) in T1DM and L-TX than in ND (0.010±0.002; all p<0.05 or less). Upon nor-malization of TL by TA (T/T), a signifi cant telomere shortening became appar-ent in T1DM and L-TX (8.07±1.48 and 12.57±0.49, respectively) as compared to ND (248.9±44.6; both p<0.05). TX patients had TL and T/T similar to ND. Finally, CCR2 gene expression was greater in L-TX (+549±100%; p<0.001) as compared to ND, while there was no difference in TX. CCR2 expression cor-related with T/T values (r=0.458, p=0,047) and HTERT component (r=0.896, p<0.001). Our data demonstrate an apparent effect of T1DM on markers of cellular senescence with TL being affected by duration of diabetes and HDL levels. TX may reduce infl ammatory status and the telomere shortening pro-cess. Assessment of TL may improve risk stratifi cation in T1DM and provide a marker of outcomes of pancreas transplantation.
Supported by: Cari Lucca Foundation
283-ORUmbilical Cord-Derived Mesenchymal Stem Cell for Treatment of Newly-Onset Type 1 Diabetes Mellitus in NOD MiceYANGANG WANG, WENLONG YU, WEI XU, Qingdao, China
The aim of this study was to examine the ability of umbilical cord-derived mesenchymal stem cells(UC-MSCs) to prevent and treat type 1 diabetes

A75
For author disclosure information, see page 797.ADA-Funded Research
ORA
LS
NOVEL AGENTS FOR DIABETES MANAGEMENT
educated lymphocytes (but not the CB-SCs) to the patient’s circulation. In an open-label, phase1/phase 2 study, patients (n = 25) with T2D received one treatment with the Stem Cell Educator. Median age was 50 years (range, 29 to 66), and median diabetic history was 9 years (range, 1 to 25). Notably, we found that T2D patients achieve improved metabolic control and reduced in-fl ammation. Median glycated hemoglobin (HbA1C) was signifi cantly reduced from 8.47% ± 0.99 at baseline to 7.87% ± 1.07 at 4 weeks post treatment (p = 0.022), and to 7.1% ± 0.6 at 12 weeks post treatment (p = 1.6E-05). More than 80% of subjects achieved the <7% standard recommended by the ADA. Ho-meostasis model assessment of insulin resistance (HOMA-IR) and HOMA-pancreatic islet beta-cell function (HOMA-B) demonstrate that insulin sensi-tivity have been improved post treatment. Mechanistic studies revealed this therapy can correct the immune dysfunction, as demonstrated by balancing the Th1/Th2/Th3 cytokine productions. Thus, Stem Cell Educator therapy is safe, and in individuals with moderate or severe T2D, a single treatment produces lasting improvement in metabolic control, without the safety and ethical concerns related to conventional stem cell-based therapies.
Supported by: JDRF, UIC CCTS Grant, Chinese Government Funding
288-ORFGF21-Adnectin-Pharmacokinetic Enhancer (FGF21-AdPKE): A Novel Protein Candidate With Uniquely Extended Pharmacokinetic Pro-fi le for the Treatment of Diabetes and DyslipidemiaRANJAN MUKHERJEE, PAUL MORIN, JOSEPH TAYLOR, DENNIS FARRELLY, DEBORAH HAGAN, BIN HE, DANIEL COHEN, JOHN KRUPINSKI, MARK KIRBY, MICHAEL GOSSELIN, HONG SHEN, CHRISTINE HUANG, BRADLEY ZINKER, Pen-nington, NJ
FGF21 treatment has been shown to improve the diabetic, insulin resis-tant and dyslipidemic state in several animal models of diabetes and obesity without inducing hypoglycemia, mitogenesis or edema. Its short half life (30 minutes in mice) would require multiple, daily injections to be used as a ther-apeutic agent. We hypothesized that extending the half life of FGF21 would lead to improved effi cacy and require less frequent dosing. Adnectins are a new family of proteins based on the 10th type III domain of human fi bronec-tin that can be designed to bind to targets of interest with high affi nity and specifi city. We have created a novel protein by fusing human FGF21 to an adnectin pharmacokinetic enhancer (FGF21-adPKE) which binds to human and monkey but not mouse serum albumin. This novel FGF21-adPKE retains the property of inducing ERK phosphorylation in -klotho-expressing cells and glucose uptake in adipocytes. In ob/ob mice injected q.d., s.c., for 7 days with FGF21-adPKE (1 mg/kg) or native FGF21 (0.3 mg/kg), non-fasting glucose was lowered by 29% and 34% respectively. When the FGF21-adPKE was co-injected with human albumin, glucose lowering was 41% and the increased effi cacy was associated with prolonged exposure. After 14 days of q.d. co-dosing of FGF21-adPKE with human albumin, vehicle subtracted HbA1c was lowered by 0.94%. In cynomolgus monkeys where FGF21-adPKE bound to endogenous monkey serum albumin, the half life was 97 hours, signifi cantly greater than native human FGF21 (4 hours). FGF21-adPKE is produced in E.coli, has low viscosity and displays preclinical pharmacokinetic properties that would support convenient dosing regimens (including once weekly) in humans. In conclusion, FGF21-adPKE represents a promising candidate for the treatment of diabetes and attendant dyslipidemic disorders.
289-ORSRT3025, a Novel SIRT1 Activator, Reverses Metabolic Dysfunction Induced by a High Fat Diet through Transcriptional and Post Tran-scriptional Modulation of Multiple Metabolic PathwaysVIPIN SURI, YONG QI, MEGHAN L. DAVIS, QING NIE, MARC O. JOHNSON, AN-GELA M. COTE, ELDEN LAINEZ, GEORGE P. VLASUK, JAMES L. ELLIS, Cambridge, MA
Activation of the protein deacetylase SIRT1 through transgenic overex-pression in mice confers resistance to body weight gain, insulin resistance, dyslipidemia and hepatic steatosis induced by a high fat diet. We report here the discovery of SRT3025, a novel small molecule activator of SIRT1, which reverses several aspects of metabolic dysfunction induced by a high fat diet. SRT3025 enhanced the deacetylase activity of SIRT1 by 4-fold, with half maximal activation at 200 nM. Diet Induced Obese (DIO) mice treated with 100 mg/kg SRT3025 for 7 weeks weighed 13% less than vehicle treated mice and showed signifi cant reductions in fed glucose (-17%) and insulin (-77%), fasted glucose (-23%) and insulin (-62%), and serum (-41%) and hepatic lipids (-37%). Indirect calorimetry indicated that SRT3025 reduced body weight by increasing energy expenditure through stimulation of both carbohydrate and lipid oxidation. Euglycemic-Hyperinsulinemic clamp studies showed that SRT3025 increased hepatic insulin sensitivity as well as insulin-stimulated
G alginate (1.25 wt% LVG). The inner LVM core of the microcapsules was chelated with 55mM of sodium citrate for 2 min. A marginal mass of the encapsulated islets (~2000 islets/kg) was transplanted in an omentum pouch made in each of 5 STZ-diabetic Lewis rats whose blood glucose, plasma C-peptide, and body weights were monitored for 90 days along with those of a control group (n=5) which received empty capsules (no islets). The control group received daily insulin injections to keep blood glucose <500 mg/dL dur-ing follow-up. Although normoglycemia was not achieved with the marginal mass, the islet recipients had a 12% reduction in their mean blood sugar levels compared to controls (p<0.001), and increased their body weight from the diabetic baseline in contrast to the control group. Also, C-Peptide (Mer-codia ELISA kit) increased from a non-detectable level to a range of 200-600 pmol/L in the islet recipients, but not in the control group during the 3-month period. These data show for the fi rst time that a marginal mass of encapsu-lated islet transplants have long-term function in an omentum pouch making it a possible alternative site for encapsulated islet transplantation in large animals and humans with abundant omental tissue.
Supported by: RO1DK080897
286-ORIslet Allograft Rejection Recognizes a P2X7R-Mediated Mecha-nismANDREA VERGANI, CARMEN FOTINO, SARA TEZZA, RUTH MOLANO, MICHELE PODETTA, ANTONIO SOLETI, FABIO GRASSI, CAMILLO RICORDI, MOHAMED SAYEGH, ANTONELLO PILEGGI, PAOLO FIORINA, Boston, MA, Milan, Italy, Miami, FL, Torino, Italy, Bellinzona, Switzerland
ATP, released during cell damage/activation, is sensed by P2X7 recep-tor (P2X7R) on lymphocytes and promotes T-cell activation. Novel P2X7R inhibitors are available (e.g. periodate-oxidized ATP [oATP]), rendering P2X7R target a potential therapy. We demonstrated that P2X7R is induced in mu-rine islet allograft-infi ltrating lymphocytes. P2X7R targeting on murine CD4+ T-cells by oATP inhibited Th1 and Th17 differentiation and anti-CD3- anti-CD28-Ig-induced IFN production (number of spots, ELISPOT: oATP=164±14 vs. Control=401±12, n=5; p=0.0002); oATP was not effective on P2X7R-/- cells, confi rming drug specifi city. WB analysis revealed inhibition of STAT3 phosphorylation; the use of Colivelin restored STAT3 phosphorylation, thus mitigating oATP effects. Short-term oATP treatment (250 μg day 0 to day 15 i.p.) in allogeneic islet transplantation (BALB/c into hyperglycemic C57BL/6 mice), reduced the frequency of peripheral and intra-graft Th1/Th17 cells, reduced T-cell STAT3 phosphorylation, inhibited alloantigen-specifi c T-cell activation, thus prolonging graft survival (Mean Survival Time [MST]: oATP treated=22 days vs. Untreated=14 days, n=10; p=0.0001) with indefi nite graft survival achieved in 3 mice out of 10. Treated mice were immunocom-petent (as assessed by Ovalbumin rechallenge). Graft survival prolongation was observed in P2X7R-/- recipient, although compensatory P2X1R/P2X4R expression limited the benefi t of P2X7R genetic targeting. Tor-inhibitors increased P2X7R expression on murine and human T-cells and the use of Rapamycin synergized with oATP preventing murine CD4+ T-cells activation (IFN , number of spots: Rapamycin(-)/oATP(-)=348±29, Rapamycin(+)/oATP(-)=111±16; Rapamycin(+)/oATP(+)=49±2, n=3; p<0.01 vs. all) and promoting in-defi nite graft survival in 5 out of 7 recipients (p<0.01 vs. Rapamycin). These data demonstrate the central role of purinergic system in priming Th1/Th17 response during islet rejection possibly through STAT3 phosphorylation.
NOVEL AGENTS FOR DIABETES MANAGEMENT
287-ORTargeting Insulin Resistance via the Immune Modulation of Cord Blood-Derived Multipotent Stem Cells by the Stem Cell Educator TherapyYONG ZHAO, ZHAOSHUN JIANG, MINGLIANG YE, ZHAOHUI YIN, HENG LI, YA-LIN DIAO, MARK HOLTERMAN, THEODORE MAZZONE, Chicago, IL, Jinan, China, Peoria, IL
The prevalence of type 2 diabetes (T2D) is increasing worldwide, high-lighting the need for a better understanding of the pathogenesis of the disease and the development of innovative therapeutic approaches for the prevention and cure of the condition. Mounting evidence points to the in-volvement of immune dysfunction in insulin resistance in T2D, suggesting that immune modulation may be a useful tool in treating the disease. We de-veloped an innovative procedure for Stem Cell Educator therapy in which a patient’s blood is circulated through a closed-loop system that separate lym-phocytes from the whole blood and briefl y co-cultures them with adherent human cord blood-derived multipotent stem cells (CB-SCs), and returns the

A76
For author disclosure information, see page 797. ADA-Funded Research
ORA
LSNOVEL AGENTS FOR DIABETES MANAGEMENT
summary, JNJ-38431055 is a dual secretagogue for both insulin and GLP-1 release in rodents and in non-human primates. GPR119 agonists therefore show promise as novel pharmaceutical anti-hyperglycemic agents to treat patients with type 2 diabetes.
292-ORRecent Data from DIA-AID 1, a Global Phase III Clinical Study in Newly Diagnosed Type 1 Diabetes PatientsSHLOMO DAGAN, ANETTE G. ZIEGLER, PAOLO POZZILLI, THOMAS LINN, GUN-TRAM SCHERNTHANER, FRANÇOIS BONNICI, DANA ELIAS, RACHEL EREN, IRUN R. COHEN, ITAMAR RAZ, 901 STUDY GROUP, Yavne, Israel, München, Germany, Rome, Italy, Giessen, Germany, Vienna, Austria, Cape Town, South Africa, Rehovot, Israel, Jerusalem, Israel
DIA-AID 1 is a randomized, double-blind, placebo-controlled phase III study to evaluate safety and effi cacy of DiaPep277® in newly diagnosed type 1 diabetes (T1D) patients. Major inclusion criteria: age 16-45, not more than 3 months after diagnosis of T1D, fasting C-peptide > 0.2 nmol/L, and positive islet autoantibodies. Subjects received 1 mg DiaPep277® or placebo at 0, 1, 3, 6, 9, 12, 15, 18, 21 months. Effi cacy primary endpoint was defi ned as change from baseline to end of study in stimulated C-peptide area under curve (AUC) secretion measured by the glucagon stimulated test. Key secondary endpoints include change from baseline to end of study in Mixed-Meal-stimulated C-peptide AUC secretion; proportion of subjects who maintain HbA1c treat-to-target of 7% at end of study and change from baseline to endpoint in basal fasting C-peptide. Four hundred and fi fty seven patients were randomized. The target population for effi cacy included subjects who entered the study accord-ing to the major inclusion / exclusion criteria and received at least 1 dose of study medication (MITT population, n = 422). Results from patients treated with DiaPep277® show signifi cant preservation of C-peptide levels compared to placebo (23.4 % relative change, p=0.037). This preservation is even more signifi cant in patients who completed two years of therapy in full compliance with the study protocol (29% relative change, p=0.011). Furthermore, the percentage of patients who maintained HbA1c levels 7% at study end was signifi cantly higher in the DiaPep277® treated group as compared to placebo (56% vs 44%, p= 0.035). These initial results indicate that the study has met its primary endpoint. Additional data are currently being evaluated. DiaPep277®
was well tolerated. No signifi cant differences in drug-related adverse events were reported between the treatment and placebo groups. A second confi r-matory phase III clinical study, DIA-AID 2 is being conducted worldwide in newly diagnosed adult T1D patients.
293-ORGKM-001, a Liver-Directed/Pancreas-Sparing Glucokinase Modu-lator (GKM), Lowers Fasting and Post-Prandial Glucose Without Hypoglycemia in Type 2 Diabetic (T2D) PatientsVIKRAM RAMANATHAN, NIMISH VACHHARAJANI, RAKESH PATEL, RASHMI BARBHAIYA, Bangalore, India, Ahmedabad, India
Glucokinase (GK) is involved in glucose homeostasis through control of insulin secretion in pancreas and glucose disposal in liver. Although GKAs have shown antihyperglycemic effects, hypoglycemia (HG) due to their dual action of insulin release and hepatic glucose disposal remains a concern. GKM-001 is designed to selectively target liver GK and spare pancreatic GK, and thereby eliminate the risk of HG. GKM-001 has shown robust glucose lowering both acutely and chronically in animal models of diabetes. Safety, pharmacodynamics, and pharmacokinetics (PK) of GKM-001 were investi-gated in single (SAD) and multiple ascending dose (MAD) studies in healthy and T2D subjects. In SAD study, GKM-001 50-2000 mg QD doses in healthy (n=30) and 50-600 mg QD doses in T2D (n=16) were investigated. GKM-001 was safe (no HG), well tolerated, and exhibited dose-proportional PK with ~20 h half-life. About 30% dose was excreted unchanged in urine. In MAD study, GKM-001 25-1000 mg was administered QD for 14 days to T2D (n=60). Mean HbA1c, FPG and BMI at screening were 9.0%, 176 mg/dL and 26 kg/m2,respectively. Plasma glucose, insulin, and C-peptide were measured after OGTT and mixed meal tolerance tests (MMTT) at baseline, Day 1 and Day 14. Fasting plasma glucose (PG) was determined on multiple days and PK on Days 1 - 14. No HG or clinically relevant changes in laboratory tests (includ-ing lipids) and vital signs were observed. GKM-001 provided dose dependent reduction in fasting PG, glucose excursions to MMTT and 24 h glucose. The reduction in mean PG ranged from 23 to 46 mg/dL. Even at the highest 1000 mg dose, there was no meaningful increase in insulin level. Reduction in glu-cose across doses was not attributable to increased insulin. Overall, GKM-001 represents a novel mechanism to enhance glucose disposal specifi cally via liver with potential benefi cial pancreas -cell sparing action. A Phase IIb study of GKM-001 will soon be initiated.
glucose uptake in skeletal muscle and adipose tissue. Transcriptional profi l-ing of tissues from SRT3025 treated mice revealed striking suppression of hepatic gluconeogenic and lipogenic pathways as well as alterations in mi-tochondrial pathways in muscle and kidney. Metabolomic profi ling confi rmed the changes in activity of gluconeogenic and lipogenic pathways, and also revealed effi cient fatty acid oxidation in SRT3025 treated DIO mice. Our data provides mechanistic insight into how pharmacological activation of SIRT1 impacts metabolic regulation in the setting of DIO. Small molecule activa-tors of SIRT1 may have unique therapeutic potential in metabolic dysfunc-tion through their ability to positively impact body weight, insulin sensitivity and lipid metabolism.
290-ORAnti-Diabetic Potential of Novel, Small Molecule GPR119 AgonistsDHANAPALAN NAGARATHNAM, KANTHIKIRAN VARANASI, KASIVISWANATH ROUTHU, MEYYAPPAN MUTHUPPALANIAPPAN, GAYATRISWAROOP MERIKA-PUDI, SRIDHAR VEERARAGHAVAN, PRASANNA R, SRIKANT VISWANADHA, SWAROOP VAKKALANKA, Hamden, CT, Hyderabad, India, La Chaux de Fonds, Switzerland
Insulin release via GLP1 and cAMP induction by GPR119 agonists repre-sents a novel strategy for achieving optimal glycemic control. Herein, we describe the biological and pharmacokinetic properties of RP9056, a novel and small molecule GPR119 agonist with scope to be further developed as a clinical candidate for Type-2 diabetes. Induction of cAMP in hGPR119 transfected HEK-293 cells was determined by a Homogenous Time Resolved Fluorescence assay (Cisbio, MA). Potency of the compound was further corroborated in a cAMP assay using the high GPR119 expressing HIT-T15 insulinoma cells. Ability of the compound to induce insulin secretion in HIT-T15 cells was determined. Pre-clinical effi cacy of the molecule (10 mg/kg) was corroborated in an oral glucose tolerance test (OGTT) in C57BL/6J mice. Metabolic stability of the compound was evaluated in microsomes obtained from mouse, rat, dog, monkey, and human. Pharmacokinetic behaviour of compounds in plasma after single dose oral administration was determined in female Balb/c mice and Wistar rat. RP9056 induced cAMP concentrations in hGPR119 transfected HEK-293 as well as HIT-T15 cells with EC50 of 12.2 and 23.5 nM respectively. Half-maximal induction of insulin release from HIT-T15 cells was achieved at a concentration of 34.5 nM. Treatment of mice with 10 mg/kg RP9056 resulted in an overall improvement of glucose toler-ance by 50% when compared to the control group. Pharmacokinetic studies indicated good oral bioavailability of RP9056 with a favourable half-life in mouse and rat. Further, RP9056 was metabolically stable across the spe-cies studied besides showing no signifi cant CYP inhibition in human liver microsomes. Results demonstrate the potential of RP9056 as an effective treatment for symptoms associated with diabetes. Additional in vivo stud-ies in models relevant to diabetes and insulin resistance are currently in progress.
291-ORThe GPR119 Agonist JNJ-38431055/APD597 Improves Blood Glu-cose Control in Rats and Cynomologous MonkeysFUYONG DU, CHRIS CARROLL, ZHI-LIANG CHU, JUERG LEHMANN, ROBERT M. JONES, JUNE XU, JAMES LEONARD, TROY SARICH, PATRICIA ANDRADE-GOR-DON, KEITH DEMAREST, YIN LIANG, Spring House, PA, San Diego, CA
GPR119 acts directly on pancreatic -cells and enteroendocrine L- and K-cells to increase insulin and incretin release, respectively. GPR119 ago-nists are therefore potentially novel therapeutics for the treatment of type 2 diabetes. JNJ-38431055 (also termed APD597) is a potent GPR119 agonist with superior pharmaceutical properties. The present study characterized the effi cacy of JNJ-38431055 in normal and diabetic animal models. JNJ-38431055 induced cAMP production in CHO-hGPR119 and CHO-rGPR119 cells with an EC50 of 24 nM and 380 nM, respectively. In isolated human pancreatic islets, this compound stimulated insulin release in a glucose-de-pendent manner; control and JNJ-38431055-treated islets secreted 8.6 and 16.9 uU/hr/5 islets, respectively, when incubated in culture media supple-mented with 8 mM glucose. JNJ-38431055 also enhanced GLP-1 release from GLUTag cells and signifi cantly increased plasma GLP-1 levels in C57/B6 mice. In ob/ob mice and ZDF rats, JNJ-38431055 signifi cantly improved oral glucose tolerance. Four-week treatment of ZDF rats with JNJ-38431055 re-duced fed blood glucose levels and HbA1c at all doses tested, but decreased body weight gain only at higher doses. In cynomolgus monkeys, JNJ-38431055 markedly reduced blood glucose AUC by 17 % (P<0.05), and in-creased plasma GLP-1 AUC by 212 % (P<0.01). The Insulin (uU/mL*100)/Blood Glucose (mg/dL) Index at 30 min after glucose challenge was increased from 28.0±8.8 in the vehicle group to 44.3±11.3 in the compound-treated group. In

A77
For author disclosure information, see page 797.ADA-Funded Research
ORA
LS
DIABETES COMPLICATIONS AND MORTALITY—RISK FACTORS, TRENDS, AND SEX/RACE DISPARITIES
hazards models. All-cause mortality was increased in LADA compared to subjects without diabetes (HR 1.63, 95% CI 1.30-2.04) as was cardiovascular mortality (1.92, 1.44-2.56) (Table 1). The excess risk was seen in both men and women, was not explained by BMI or lifestyle factors and was primar-ily seen in cases with HbA1C 6.5%. Compared to type 2 diabetes, LADA was associated with higher all-cause mortality (1.21, 0.95-1.54). Adjustment for HbA1C attenuated this excess mortality (1.15, 0.90-1.47) (relative excess risk 29%). Adjustment for titer of anti-GAD did not signifi cantly affect risk estimates. All-cause and cardiovascular mortality is increased in LADA com-pared not only to subjects without diabetes but also to subjects with type 2 diabetes. Increased risk is associated with worse glucose control but not with degree of autoimmune activity. To diagnose LADA will be clinically im-portant for assessing correct prognosis and therapy.
Table 1. Risk of mortality in LADA and type 2 diabetes compared to subjects without diabetes
Men1 Women1 All subjects2
No.deaths
HR 95% CI
No.deaths
HR 95% CI
No.deaths
HR 95% CI
All-cause mortalityNo diabetes 4676 1 4016 1 8692 1LADA 42 1.50 1.10-2.03 34 1.85 1.32-2.59 76 1.63 1.30-2.04Type 2 diabetes 371 1.27 1.14-1.41 401 1.48 1.34-1.64 772 1.38 1.28-1.48Cardiovascular mortalityNo diabetes 2318 1 1949 1 4267 1LADA 27 1.83 1.25-2.69 21 2.24 1.45-3.44 48 1.92 1.44-2.56Type 2 diabetes 225 1.48 1.29-1.70 253 1.80 1.56-2.03 478 1.63 1.49-1.80Mortality from ischemic heart diseaseNo diabetes 1163 1 695 1 1858 1LADA 12 2.72 1.54-4.81 10 4.26 2.28-7.96 22 3.29 2.16-5.02Type 2 diabetes 134 1.79 1.49-2.14 116 2.61 2.14-3.18 250 2.10 1.84-2.401Adjusted for age. 2 Adjusted for age and sex.
296-ORMicro-Vascular Disease Among Chinese With Newly Diagnosed Diabetes: A 23-Year Follow-Up of the Da Qing Diabetes StudyQIUHONG GONG, PING ZHANG, JINPING WANG, YALI AN, EDWARD GREGG, GOJKA ROGLIC, WENYING YANG, BO ZHANG, YANYAN CHEN, YINGHUA HU, PE-TER BENNETT, GUANGWEI LI, Beijing, China, Atlanta, GA, Daqing, China, Geneva, Switzerland, Phoenix, AZ
Among the estimated 100 million persons with diabetes in China, little is known about the occurrence of micro-vascular complications and their natu-ral history. We sought to document the incidence of micro-vascular disease (retinopathy, nephropathy and neuropathy) in the 630 persons with newly diagnosed diabetes (NDMs), and in a sample of 519 with normal glucose tolerance (NGT), who had been identifi ed initially in 1986 by screening 50% of the Da Qing population aged 25 years and over. In 2009 among those with NDM, 593 (94%), and 491 (95%) with NGT, were traced. Clinically signifi cant micro-vascular disease was ascertained by direct or proxy interviews and review of medical records up to the time of death, loss to follow-up or De-cember 31st, 2009, and among the survivors 252/260 (97%) of the NDMs and 374/392 (95%) of the NGTs were examined. Among the NDMs over the 23-year follow-up period, severe retinopathy, defi ned as proliferative retinopa-thy, having received retinal photocoagulation, or blindness, was identifi ed in 24.9% (95%CI 21.4-28.4), and severe nephropathy, defi ned as receiving re-nal replacement therapy or with urinary albumin/creatinine ratio(ACR) 300 mg/g at the follow-up examination, had developed in 24.8% (95%CI 19.3-30.3). Both the severe retinopathy and nephropathy developed mainly after 10 years or more duration of diabetes. Among the NDM survivors, 22.7% had ACR 300 mg/g, and 27.3% (95%CI 21.4-33.2) had evidence of neuropathy (10g monofi lament test) at the follow-up examination. In the NGT group, only 3.9% (95%CI 2.2-5.6) had severe retinopathy, 3.1% (95%CI 1.2-4.0) severe nephropathy, and 11.2% (95%CI 7.7-14.7) had neuropathy at the 2009 follow-up examination. Severe diabetic retinopathy and nephropathy are common long-term complications of type 2 diabetes in China, which, given the huge numbers of persons with recent onset diabetes, will lead to major medical and economic challenges to the country in the future.
Supported by: CDC, WHO, China-Japan Friendship Hospital
DIABETES COMPLICATIONS AND MORTALITY—RISK FACTORS, TRENDS, AND SEX/RACE DISPARITIES
294-ORFruit Intake and Incident Retinopathy in Japanese Patients With Type 2 Diabetes—Nutritional Analysis in the Japan Diabetes Com-plications Study (JDCS)SHIRO TANAKA, YUKIO YOSHIMURA, RYO KAWASAKI, CHIEMI KAMADA, SA-CHIKO TANAKA, CHIKA HORIKAWA, YASUO OHASHI, ATSUSHI ARAKI, HIDEKI ITO, YASUO AKANUMA, NOBUHIRO YAMADA, HIDETOSHI YAMASHITA, HIRO-HITO SONE, THE JAPAN DIABETES COMPLICATIONS STUDY GROUP, Kyoto, Ja-pan, Tokushima, Japan, Yamagata, Japan, Ibaraki, Japan, Tokyo, Japan
Antioxidants and dietary fi ber are postulated to have preventive effects on diabetic retinopathy (DR), but evidence for encouraging fruit intake to prevent DR is lacking. We aimed to investigate this association in a cohort with type 2 diabetes. After excluding non-responders to a dietary survey or patients who had DR or a major ocular disease at baseline, 978 patients were included for analysis. Baseline dietary intake was assessed by the Food Frequency Questionnaire based on food groups and 24-hour dietary records. Primary outcome was time to incident DR following international DR severity scales. Hazard ratios (HRs) for dietary intake were estimated by quartile Cox regression adjusted for HbA1C, BMI, energy intake and other confounders. Mean fruit intake in quartiles ranged from 22·3 to 253·0 g per day, with similar increasing trends for vitamin C, vitamin E, carotene, retinol equivalent, dietary fi ber, potassium, and sodium. HbA1C, BMI, TG and SBP were well controlled. During the median follow-up of 8.0 years, incident DR occurred most frequently in the 4th quartile (Figure 1). The HRs for 2nd, 3rd,and 4th quartiles compared to the 1st quartile were 0·66 (95% confi dence interval, 0·48 to 0·93), 0·60 (0·42 to 0·84), and 0·50 (0·34 to 0·74), respectively (trend p<0·01). Signifi cant decreasing trends were noted for vitamin C and carotene. There was no signifi cant effect modifi cation in subgroup analysis. In conclusion, increase in fruit intake in a range commonly consumed is as-sociated with reduced incident DR within a low-fat energy-restricted diet.
Supported by: The Ministry of Health, Labor and Welfare, Japan
295-ORRisk of Mortality in LADA May Be Higher than in Type 2 DiabetesLISA OLSSON, ANDERS AHLBOM, TOMAS ANDERSSON, VALDEMAR GRILL, KRISTIAN MIDTHJELL, SOFIA CARLSSON, Stockholm, Sweden, Trondheim, Norway
Knowledge on mortality in latent autoimmune diabetes in adults (LADA) is limited. We analyzed the risk of all-cause and cardiovascular mortality in LADA and compared the risk to that of subjects without diabetes and with type 2 diabetes. The study cohort (n=46,304) emerges from the Norwegian HUNT Study and includes 2,699 cases of diabetes. Subjects diagnosed at
35 years were classifi ed with LADA if they were anti-GAD positive (n=150) and type 2 diabetes if anti-GAD negative (n=2,073). Information on mortality from all-cause, cardiovascular disease and ischemic heart disease during follow-up 1995-2008 was obtained by linkage to the cause of death regis-try. Hazard ratios (HR) with 95% CI were calculated using Cox proportional

A78
For author disclosure information, see page 797. ADA-Funded Research
ORA
LSDIABETES COMPLICATIONS AND MORTALITY—RISK FACTORS, TRENDS, AND SEX/RACE DISPARITIES
83%; 95% CI, 69-91%; p<0.001). After exclusion of one study involving par-ticipants with type 1 diabetes and another study reporting an inverse asso-ciation between HbA1C and CHF, the heterogeneity was no longer signifi cant (I2: 49%, 0-79%; p=0.08). Among these remaining eight studies involving 149,484 predominantly type 2 diabetic participants and 12,891 incident CHF cases, the pooled adjusted RR for CHF was 1.15 (1.11-1.19). The correspond-ing RR for the single study comprising participants with type 1 diabetes was 1.30 (1.21-1.40). Conclusions: In observational studies of individuals with diabetes, a higher HbA1c level was associated with a signifi cantly increased risk of CHF.
299-OR
300-OREffects of Sex and Race on Risk of Congestive Heart Failure, Coro-nary Heart Disease, and Mortality in Older Adults With DiabetesVARSHA G. VIMALANANDA, MARY LOU BIGGS, JAMES L. ROSENZWEIG, MER-CEDES R. CARNETHON, JAMES B. MEIGS, EVAN L. THACKER, DAVID S. SIS-COVICK, KENNETH J. MUKAMAL, Boston, MA, Seattle, WA, Chicago, IL
The relative and absolute risks of coronary heart disease (CHD) incidence and mortality associated with diabetes are greater in women as compared with men. We evaluated whether these sex differences extend to older adults, to risk of congestive heart failure (CHF), and are present in black and white individuals. We followed participants in the Cardiovascular Health Study, a cohort study of community-dwelling adults aged 65 from 4 US communities. We used Cox proportional-hazards models to assess the asso-ciation of diabetes with incident CHF, CHD, and total mortality among 2923 women (16% black) and 1894 men (15% black). We tested whether any inter-action by sex was present within black and white race groups, adjusting for age and clinic site. Over a median follow-up of 12.5 years, diabetes was simi-larly associated with CHF among white women (adjusted hazard ratio [aHR] 2.10;95% confi dence interval [CI] 1.68-2.63) and white men (aHR 2.07;95% CI 1.67-2.56, p for interaction = 0.91). Findings were similar for CHD and mortal-ity. Among blacks, diabetes was associated with CHF among women (aHR 2.42;95% CI 1.70-3.43) but not among men (aHR 1.39; 95%CI 0.83-2.34, pinteraction = 0.08). This also held for CHD (p interaction 0.17). In competing risk analyses of a composite endpoint (CHF + CHD), the sex interaction was unchanged. We conclude that older black women have markedly higher rela-tive risks of CHF and CHD associated with diabetes than do older black men, but that this sex disparity is absent in older white adults.
297-ORDeclining Rates of Hospitalization for Acute Myocardial Infarction and Stroke Among Adults Aged 45 Years With Diagnosed Diabetes, United States, 1988–2009NILKA R. BURROWS, YANFENG LI, EDWARD W. GREGG, LINDA S. GEISS, Atlanta, GA
Diabetes is a major cause of heart disease and stroke. We examined trends in rates of hospitalization for diabetes-related acute myocardial in-farction (AMI) and stroke among U.S. adults. Using data from the National Hospital Discharge Survey, we estimated the number of discharges having AMI (ICD-9 410) or stroke (ICD-9 430-434, 436-438) as fi rst-listed diagnosis among those having diabetes (ICD-9 250) as a secondary diagnosis. Hospi-talization rates for adults aged 45 years by sex and by race (whites, blacks) were calculated using estimates of the population with diagnosed diabetes and age-adjusted to the 2000 U.S. standard population. Joinpoint regres-sion was used to analyze trends and calculate an average annual percentage change (AAPC). The age-adjusted rates for AMI and for stroke changed little from 1988 to 1996 and then declined signifi cantly from 1996 to 2009 (Figure). From 1988 to 2009, the age-adjusted hospitalization rate per 1000 diabetic population declined from 24.7 to 7.7 (AAPC: -5.3% per year) for AMI, and from 18.9 to 9.2 (AAPC: -3.9% per year) for stroke. Similarly, the age-specifi c rates and the age-adjusted rates by sex and by race for AMI and for stroke showed signifi cant declines throughout the period. Hospitalization rates for AMI and stroke in the diabetic population have declined. This decline may be due to a number of factors, including a reduction in prevalence of risk fac-tors, new and or more aggressive treatment of cardiovascular risk factors, or other factors.
298-ORAssociation between Glycated Haemoglobin and the Risk of Con-gestive Heart Failure in Diabetes Mellitus—Systematic Review and Meta-AnalysisSEBHAT ERQOU, CHEE-TIN CHRISTINE LEE, MATHEW SUFFOLETTO, JUSTIN B. ECHOUFFO-TCHEUGUI, RUDOLF A. DE BOER, JOOST P. VAN MELLE, AMANDA I. ADLER, Pittsburgh, PA, Toronto, ON, Canada, Atlanta, GA, Groningen, The Nether-lands, Cambridge, United Kingdom
Background: Although emerging evidence suggests that the degree of gly-cemia is associated with the risk of congestive heart failure (CHF), the mag-nitude of the risk has not been adequately quantifi ed, and clinical trials to date have not provided defi nitive evidence regarding the effects of glucose lowering on CHF risk. We synthesized the available prospective epidemio-logical data on the association between glycemia measured by hemoglobin A1c (HbA1c) and the risk of CHF in individuals with diabetes. Methods: We searched electronic databases and reference lists of relevant articles for prospective epidemiological studies that measured HbA1c level at baseline and assessed incident CHF as an outcome. We abstracted data from rel-evant studies using standardized forms and obtained additional data from investigators when required. Study-specifi c relative risk estimates were pooled using random-effects model meta-analysis. Results: Of the 1044 ci-tations identifi ed, we included 10 studies comprising 178,929 participants with diabetes and 14,176 incident CHF cases. The overall adjusted risk ratio (RR) for CHF was 1.15 (95% CI, 1.10-1.21) for each percentage point increase in HbA1c. There was substantial heterogeneity across the ten studies (I2:
WITHDRAWN

A79
For author disclosure information, see page 797.ADA-Funded Research
ORA
LS
PREDICTORS AND CONSEQUENCES OF DIABETIC KIDNEY DISEASE
were adjusted for DCCT treatment group, baseline retinopathy cohort, age, gender, and baseline measures of AER, LDL, HDL, and HbA1c %. A 1 unit increase in the log transformed measure of CRP was associated with an 32 % increase in the odds to develop macroalbuminuria and a 1 unit increase in the measure of E-selectin lead to a nearly 59 % increase in the odds to de-velop macroalbuminuria (Table). Additionally, increased levels of ICAM I and TNFR 2 at baseline were indicative of increased odds to develop abnormal albuminuria during DCCT/EDIC. Higher levels of CRP, E-selectin, ICAM I, and TNFR 2 were associated with increased odds to develop abnormal albuminu-ria. Our study indicates that high levels of infl ammatory markers including CRP, E-selectin, ICAM I, and TNFR II are important predictors of abnormal albuminuria in patients with type 1 diabetes.
Supported by: DHHS/NIH/NIDDK R01 DK081352-02
303-ORSOD2 Polymorphisms and Risk of Kidney Complications in Subjects With Type 1 DiabetesKAMEL MOHAMMEDI, SULIYA MAIMAITIMING, NATHALIE EMERY, NAIMA BELLILI-MUÑOZ, RONAN ROUSSEL, FRÉDÉRIC FUMERON, SAMY HADJADJ, MI-CHEL MARRE, GILBERTO VELHO, Paris, France, Poitiers, France
Manganese superoxide dismutase (SOD2) catalyzes the dismutation of su-peroxide, regulates reactive oxygen species metabolism in the mitochondria and is highly expressed in the kidney. We investigated associations of allelic variations of SOD2 with diabetic nephropathy in type 1 diabetic subjects. Eight SNPs in the SOD2 region were analyzed in 1285 Caucasian type 1 dia-betic patients from the SURGENE prospective study (n=340; 10-year follow-up), Genesis France-Belgium (n=501) and GENEDIAB (n=444) cross-sectional studies. Proliferative retinopathy was present in 10%, 44% and 82% of the participants of the three cohorts, respectively. Cox proportional hazards and logistic regression analyses were used to estimate hazard ratios (HR) or odds ratios (OR) for incidence and prevalence of nephropathy. All analyses were adjusted or stratifi ed by retinopathy stages. p 0.01 was signifi cant. In the SURGENE study, the risk allele of a functional variant (rs4880, V16A) was associated with the prevalence of established/advanced nephropathy at baseline (OR 9.81, 95% CI 1.51 - 76.21, p=0.01), with the incidence of mi-croalbuminuria (HR 1.54, 95% CI 1.11 - 2.11, p=0.01), with the incidence of renal events (defi ned as progression to a more severe stage of nephropathy; HR 1.42, 95% CI 1.12 - 1.77, p=0.004) and with glomerular fi ltration rate de-cline during follow-up (TT: -3.96 ± 0.89, CT: -1.57 ± 1.05, CC: -0.64 ± 1.12 ml/min/year, p=0.003). Similar results were observed for rs2758329 and rs8031. After stratifi cation for retinopathy stages, these variants were similarly as-sociated with established/advanced nephropathy in participants of Genesis and GENEDIAB studies without proliferative retinopathy. In summary, SOD2 allelic variations were associated with the prevalence and incidence of al-buminuria and with a faster decline in GFR in type 1 diabetic subjects. These results are consistent with a major role for SOD2 in the protection against oxidative stress and kidney disease in type 1 diabetic patients.
Supported by: Association L’Aide Aux Jeunes Diabétiques
304-ORAdvanced Glycation End Products May Predict Progression of Dia-betic NephropathyPAUL J. BEISSWENGER, SCOTT HOWELL, MICHAEL MAUER, GREG RUSSELL, MIKE MILLER, STEPHEN RICH, Lebanon, NH, Hanover, NH, Minneapolis, MN, Winston-Salem, NC, Charlottesville, VA
Increased advanced glycation end products (AGEs) and oxidation products (OPs) are proposed to lead to diabetic nephropathy (DN). We investigated the relationship between AGEs, OPs and progression of DN in 103 subjects
Association of diabetes with CHF, CHD and mortality by sex and race
White women White menNo diabetes
(n=2196)Diabetes(n=251)
No diabetes (n=1368)
Diabetes(n=247)
CHF* 18.6 36.0 26.0 49.7CHD* 15.3 30.1 28.1 47.9Total mortality* 42.8 69.6 58.2 88.9
Black women Black menNo diabetes
(n=365)Diabetes(n=111)
No diabetes (n=207)
Diabetes(n=72)
CHF* 20.8 46.3 24.2 31.9CHD* 14.7 31.9 25.8 38.5Total mortality* 42.7 64.6 63.5 85.8
*rate per 1000 person-yearsSupported by: R01HL094555
301-ORAll-Cause and Cause-Specifi c Mortality by Race in Low Income Blacks and Whites With Type 2 DiabetesBAQIYYAH N. CONWAY, MICHAEL E. MAY, LISA B. SIGNORELLO, WILLIAM J. BLOT, Nashville, TN
Our objective was to estimate overall and cause-specifi c mortality by race in a low SES population of Blacks and Whites with type 2 diabetes. We conducted a mortality follow up of a cohort of low income Blacks and White participants aged 40-79 with type 2 diabetes (defi ned as diagnosed with dia-betes at/after age 30; n=12,498) and without diabetes (n=49,914) at cohort entry. Multivariable Cox models were used to compute HRs and 95% CI for cause-specifi c mortality based on both underlying and contributing causes of death from death certifi cates. During follow-up (mean 5.9 years), 13.5% of those with and 7.3% of those without diabetes died. Blacks and Whites with diabetes were at a similarly increased all-cause mortality risk compared to those without diabetes (HR=1.81 95% CI=1.64-2.00 in Blacks; HR=1.82 95% CI=1.53-2.15 in Whites). Of the common diabetes-related causes of death, coronary artery disease (CAD) was the leading cause of death in both Blacks and Whites, followed by renal failure and then heart failure in Blacks and sepsis and respiratory failure in Whites. Compared to Whites, Blacks with diabetes were at lower all-cause (HR=0.85, 95% CI=0.72-0.99) and CAD mortality (HR=0.64, 95% CI=0.47-0.86), but had higher or similar HRs (CIs) for mortality from heart failure (1.67 [1.01-2.76]), stroke (1.66 [0.87-3.19]), re-nal failure (1.60 [0.95-2.71]), respiratory failure (1.09 [0.68-1.74]), and sepsis (1.03 [0.64-1.67]). Risk factors were similar by race, with the exception of a signifi cantly greater impact of baseline CAD on all-cause (interaction p-val-ue=0.009) and CAD mortality (interaction p-value=0.03) in Blacks compared to Whites. In this population with a similarly low SES and access to health care, Blacks and Whites with type 2 diabetes are at a similarly increased all-cause mortality risk, while Blacks with type 2 diabetes are a moderately but signifi cantly lower mortality risk compared to Whites due mainly to the lower CAD mortality, the leading cause of death in both populations.
Supported by: RO1 CA 092447 from the National Cancer Institute
PREDICTORS AND CONSEQUENCES OF DIABETIC KIDNEY DISEASE
302-ORMarkers of Infl ammation are Associated With Development of Ab-normal Albuminuria in Type 1 DiabeticsMARIA F. LOPES-VIRELLA, NATHANIEL L. BAKER, KELLY J. HUNT, PATRICIA A. CLEARY, GABE VIRELLA, THE DCCT/EDIC GROUP OF RESEARCHERS, Charleston, SC, Washington, DC
We measured infl ammatory markers in 641 type 1 diabetics at baseline of DCCT and studied their association with abnormal albuminuria during 14-20 years of follow-up in DCCT/EDIC. Of these, 426 (67%) patients had albumin excretion rates (AER) <40 mg/24 h at baseline and during follow-up (persistent normal albuminuria); 155 (24%) had AER <40 mg/24 h at baseline and progressed to 40 mg/24 h but remained less than 299 mg/24 h during follow-up (microalbuminuria); and 60 (9%) progressed to AER >299 mg/24 h (macroalbuminuria). To test the association of log transformed biomarkers, sample weighted multinomial logistic regression models were use where normal, micro and macro albuminuria were the outcomes of interest. Models

A80
For author disclosure information, see page 797. ADA-Funded Research
ORA
LSPREDICTORS AND CONSEQUENCES OF DIABETIC KIDNEY DISEASE
(IGT, N=10) and 11 healthy control subjects (CTRL)) were investigated using 75 g OGTT and isoglycemic intravenous glucose infusion (IIGI) on separate days. Plasma glucose, insulin, glucagon and total GLP-1 were measured re-peatedly and GIGD, based on glucose amounts utilized (100% × (glucoseOGTT - glucoseIIGI) / glucoseOGTT) and incretin effect, based on insulin responses (area under curve (AUC)) (100% × (AUCOGTT - AUCIIGI) / AUCOGTT) were calculat-ed. GIGD was signifi cantly (P<0.02) diminished in both ESRD groups (38±7% (NGT) and 31±3% (IGT), P=0.4) compared to the CTRL group (59±3%). Incre-tin effects amounted to 64±16% (CTRL), 54±15% (NGT) and 38±26% (IGT), with signifi cant difference between CTRLs and IGTs (P=0.01). Fasting GLP-1 and glucagon levels were signifi cantly higher in ESRD patients compared to CTRLs (P=0.007 and P<0.0001, respectively). Furthermore, maximal glucagon suppression (% of basal) was signifi cantly (P<0.0001) impaired in ESRD pa-tients (NGT: 75±4% (OGTT) and 76±3% (IIGI), P=0.8; IGT: 77±5% (OGTT) and 61±5% (IIGI), P=0.04) compared to CTRLs (19±4% (OGTT) and 16±1% (IIGI), P=0.4). ESRD patients are characterized by 1) reduced GIGD, 2) decreased incretin effect (IGT patients), 3) elevated fasting GLP-1 and 4) severe fast-ing hyperglucagonemia that seems irrepressible in response to oral and iv glucose stimuli. These perturbations may constitute important mechanisms underlying the disturbed glucose metabolism in ESRD.
307-ORGlycemia and Death in Dialysis PatientsAMANDA ADLER, ANNA CASULA, MARTIN WILKIE, DAMIAN FOGARTY, CHAR-LIE TOMSON, Cambridge, United Kingdom, Bristol, United Kingdom, Sheffi eld, United Kingdom, Belfast, United Kingdom
The National Kidney Foundation advocates that HbA1c “be < 7.0% (53 mmol/mol) irrespective of the presence or absence of CKD ”. Regarding dialysis, the Renal Association (UK) advises an HbA1c between 6.5% and 7.5%. Yet, glucose-lowering trials on which the guidance is based excluded patients with end stage renal disease (ESRD), who tend to have complica-tions including hypo-unawareness. Using national UK Renal Registry data, we tested whether glycemia (HbA1c) is associated with death in adults with diabetes on hemo- or peritoneal dialysis for ESRD of any cause. We included patients starting dialysis 1 Jan 1997 to 31 Dec 2006, and followed for at least 6 months. From a cohort of 7814, we excluded those who within the fi rst 6 months died (n=797), were transplanted (n=228), were lost/recovered (n=57) and who had no measure of HbA1c (n=3386), ethnicity (n=172) or he-moglobin (Hb) (n=17). We categorized HbA1c measured +/- 6 months of start-ing dialysis as <6.5%, 6.5% to 7.4% (reference), 7.5 - 8.4%, and 8.5%. We adjusted in proportional hazards models for age, sex, ethnicity, deprivation, year, dialysis mode and Hb. We could not adjust for weight, cardiovascular disease, or diabetes type, duration or treatment. Of 3157 patients with a mean age of 60 yrs followed a median of 2.7 yrs, 1688 died. For patients aged 60 yrs, we found no association between HbA1c and death; for those <60 yrs, relative to patients with HbA1c values 6.5-7.4%, the hazard ratio was 1.2 (95% CI 0.9 to 1.5) for HbA1c 7.5-8.4%, and 1.5 (1.2 to 1.9) for HbA1c >8.5%. In the absence of trials and confounding notwithstanding, these ob-servational data support tighter glycemic control in younger patients prior to and following dialysis.
with type 1 diabetes participating in the Natural History of Diabetic Neph-ropathy Study. The subjects were 16.8±6.2 years old, had diabetes duration of 8.1±4.3 years, and most were normoalbuminuric. Change in glomerular basement membrane (GBM) width from baseline to 5 years, measured in electron micrographs of renal biopsies, was our primary endpoint, since it is the best early structural predictor of DN clinical progression. Mesangial fractional volume was also measured. Fast progressors (FP) were defi ned as the upper quartile (n=24) of GBM thickening and others as slow progres-sors (SP). AGEs [3-deoxyglucosone and methylglyoxal hydroimidazolones (DG3H1, MGH1)] and carboxymethyl and ethyl lysine (CML, CEL), and oxi-dation products [methionine sulfoxide and 2-Aminoadipic Acid] were mea-sured by liquid chromatography, triple quadruple mass spectroscopy on 10 K plasma fi ltrates at year 5. We found that MGHI, CEL, and CML levels were signifi cantly higher in GBM-defi ned FP relative to SP. No AGE or OP predicted mesangial expansion. HbA1c at year 5 accounted for 4.7% of the variation in GBM width (r2). The proportion of variation in GBM width was increased to 11.6% when MGHI, CEL, and CML were added to the model (7.9% increase), and MGHI was a signifi cant independent predictor of GBM increase. These results suggest that these three major AGEs, in addition to HbA1c, may be early indicators of progression of important DN lesions.
Biomarker(All nM ) FPMean ± SD SPMean ± SD P- Value (Wilcoxon)CML 0.088±0.022 0.075±0.023 0.003MGHI 0.200±0.099 0.165±0.127 0.040CEL 0.058±0.015 0.049±0.015 0.026
Supported by: JDRF
305-ORCorrelation of Renal Physiology and Pathology in Deceased Donor Kidneys Following 50-Years of Type 1 Diabetes (T1DM): 50-Year Medalist StudyHILLARY A. KEENAN, ISAAC E. STILLMAN, STEPHANIE HASTINGS, SARA TUREK, ROBERT STANTON, JENNIFER K. SUN, GEORGE L. KING, Boston, MA
The 50-Year Medalist Study has characterized renal function and pathol-ogy of 22 Medalist donors to document the extent of glomerulopathy after 50+ y of T1DM. This study examines individuals (n=685, male=48.7%, dura-tion=58.6±6.6 y age=69.7±8.5 y) with 50+ y of T1DM by clinical exam and extensive medical history and has found low rates of microvascular com-plications including microalbuminuria (11.8%; ACR >30 mcg/mg) and chronic kidney disease (4.28%; CKD >4: CKD-EPI). Whole kidneys were procured post-mortem from 22 Medalists and classifi ed by an experienced nephro-pathologist into diabetic nephropathy (DN) class using the method of Ter-vaert et al (JASN 2010) by degree of mesangial expansion (0+I, IIa+b) and presence of Kimmelstiel-Wilson lesions (III) (n=6, class 0+I; 8, class IIa; 3, class IIb; 5, class III). Surprisingly, 28% of these longstanding T1DM patients had no to only mild, nonspecifi c changes by light and electron microscopy (Class 0+I) even though 33% of these had co-existing proliferative diabetic retinopathy (PDR). There were no differences in sex, A1c, age, duration, age at diagnosis, BMI, lipids or c-peptide across DN classes (p>0.05). Mean eGFRs declined across class, 0+I: 58.5±27.2; IIa: 53.8 ±13.0, IIb: 47.7 ±6.5, III: 35.0±18.2 mL/min/1.73m2. However, ACR did not consistently increase across the classes: 0+I: 18.0 ±10.9, IIa: 17.8 ±16.2, IIb: 142.4±179.3, III: 1016.4 ±1743.6 mcg/mg. Two of the 22 cases were positive for IgA; 10 had score 1 tubulo-interstitial scarring, 11 had score 2 and 1 had score 3. Medalists’ kidneys classifi ed in class 0+1 demonstrate that it is possible to have normal glomerular morphology even after 50+ y of T1DM. The presence of PDR in the Class 0+1 group indicates protective factors for diabetic kidney disease may differ from those of the retina. Finally, greater use of the kidney biopsy in diabetic patients with normal ACR and low GFR might provide unexpected diagnoses and new pathophysiologic insights.
306-ORGastrointestinal-Mediated Glucose Disposal, Incretin Effect and Glucagon Responses in Patients With End-Stage Renal DiseaseTHOMAS IDORN, FILIP K. KNOP, JENS J. HOLST, MADS HORNUM, BO FELDT-RASMUSSEN, Copenhagen, Denmark, Hellerup, Denmark
Non-diabetic patients with end-stage renal disease (ESRD) depending on dialysis treatment exhibit disturbed glucose metabolism. The underly-ing pathophysiological mechanisms remain elusive. We aimed to evaluate gastrointestinal-mediated glucose disposal (GIGD), incretin effect and glu-cagon- and glucagon-like peptide-1 (GLP-1) secretory responses in patients with ESRD. Three groups matched by age, gender and BMI (ESRD patients with normal glucose tolerance (NGT, N=10) or impaired glucose tolerance

A81
For author disclosure information, see page 797.ADA-Funded Research
ORA
LS
IMPROVING HEALTH CARE DELIVERY AND HEALTH OUTCOMES FOR DIABETES
310-ORTrend in Racial Disparity of Diabetes Monitoring Among the U.S. Non-Institutionalized Population in the Last Decade (2000-2009)YINGNAN ZHAO, QIAN SHI, LIZHENG SHI, Hartford, CT, New Orleans, LA
The aim of this study was to examine the racial disparity of diabetes monitoring over years 2000 to 2009 among individuals with diabetes in the United States (US). We analyzed the national representative samples of the US non-institutionalized population from the Medical Expenditure Panel Survey (MEPS) 2000-2009. “Good monitoring” was defi ned as >=2 A1c tests along with >=1 eye or foot exam annually, according to the ADA guidelines. A1c test, foot and eye exam, and overall “good monitoring” were assessed among the whole US population with diabetes, and compared between non-Hispanic whites and minority populations. From 2002 to 2009, the overall rate of “good monitoring” decreased from 71% to 66%. Specifi cally, the percentage of individuals with >=2 A1c tests annually declined in general over the last 10 years, at the level of 73% in both 2008 and 2009 compared to 78% in 2000. Foot exam varied between 65-72%, with a continuous de-crease from 2002 to 2008. Eye exam maintained at level of 61-63%. Among non-Hispanic whites, the percentages of good monitoring and specifi c items were consistently higher than that of minority populations in years 2000 to 2009. The racial gap did not show improvement till 2006 or 2007, and yet deteriorated especially in 2008 and 2009. Over the past decade, the racial gap of 5% in good monitoring was in 2002 and 15% in 2009; 5% in A1c test in 2000 and 12% in 2009; 4% in foot exam in 2000 and 7% in 2009; 6% in eye exam in 2002 and 11% in 2009. Our analyses have identifi ed the racial disparity in the last decade in the US, which has not been improved, but deteriorated in recent years.
IMPROVING HEALTH CARE DELIVERY AND HEALTH OUTCOMES FOR DIABETES
308-ORNew Risk Score for Predicting 5-Year Incidence of Type 2 Diabetes in Japan: The Toranomon Hospital Health Management Center StudyYORIKO HEIANZA, YASUJI ARASE, HIROSHI TSUJI, SAKIKO YOSHIZAWA, KA-ZUMI SAITO, SHIUN DONG HSIEH, SATORU KODAMA, NOBUHIRO YAMADA, SHIGEKO HARA, HIROHITO SONE, Mito, Japan, Tokyo, Japan
Whether adding information on HbA1c into a prediction model that in-cludes plasma glucose and other potential predictors would lead more accu-rate prediction of subsequent diabetes has not been clarifi ed. We assessed the clinical signifi cance of introducing HbA1c into a prediction rule for diabe-tes and developed a scoring system to predict the incidence of diabetes in Japanese individuals. Studied were 10250 non-diabetic individuals aged 24-80 years who underwent a baseline health examination and a reexamination 5 years later. Diabetes was indicated by fasting plasma glucose (FPG) 7.0 mmol/L, HbA1c 6.5%, or self-reported clinician-diagnosed diabetes. We assessed the predictive ability of conventional predictors of diabetes and whether adding FPG, HbA1c, or both FPG and HbA1c would improve risk pre-diction. The conventional predictive model included age, male sex, parental history of diabetes, current smoking, body mass index, hypertension, resting heart rate and triglycerides (area under the receiver-operating characteristic curve (AROC) 0.734). The addition of FPG signifi cantly improved discrimina-tion (AROC 0.875) and then adding HbA1c further improved discrimination (AROC 0.917). After multivariate logistic analysis, we developed a risk scor-ing system based on points (P) that consisted of parental history of diabetes (2P), smoking (1P), obesity (1P), FPG 5.3-5.5 mmol/L (2P) or 5.6-6.9 mmol/L (7P) and HbA1c 5.3-5.4% (4P) or 5.5-6.4% (8P) (AROC 0.888). At an optimal cut-off of 11 points, sensitivity and specifi city were high at 82.5% and 80.2%. We validated the diabetes risk score in a separate group of 1856 non-diabetic individuals (AROC 0.909, sensitivity 95.3% and specifi city 77.2%). By add-ing information on HbA1c into the prediction model, we developed a simple, sensitive and specifi c algorithm to predict the 5-year risk of diabetes. Our algorithm would be useful in identifying individuals likely to benefi t from early interventions.
309-ORHospitalization Patterns in Type 1 Diabetes (T1DM) for First 20 Years after DiagnosisVASUDEV MAGAJI, THOMAS J. SONGER, TREVOR J. ORCHARD, Pittsburgh, PA
Health care utilization experiences are important for clinicians, policy planners and researchers to characterize T1DM prognosis and resource need. We thus examined the natural history of hospitalization, post diag-nosis in a subgroup (n=73; males=38; females=35) of the Pittsburgh Epide-miology of Diabetes Complications (EDC) study, a prospective follow up of childhood onset T1DM. Cases were diagnosed with T1DM, or seen within 1 year of diagnosis, at Children’s Hospital of Pittsburgh from January 1978 to May 1980 and were <17 years and on insulin at diagnosis. At EDC enroll-ment, these subjects had T1DM for <10 years without complications. Hos-pitalization data, from diagnosis were obtained by self report from subjects by biennial surveys. There were 258 admissions (Females 68% (pregnancy related 20%) vs Males 32%) after 20 years of T1DM diagnosis. Overall, the cumulative incidence at 20 years duration was 77% (73.6% in males vs. 80% in females). Figure 1 details the cumulative incidence of hospitalization by duration and reason for admission. Hospitalization for acute complica-tions increased linearly and stabilized at 15 years of T1DM diagnosis. Acute admissions were higher in females (60% vs 39%, p=0.03). Admissions for infection progressively increased whereas for chronic conditions were low and began at 10 years duration. Hospitalization for acute complications and infection account for 64 % of all admissions by 20 year duration. This analy-sis highlights the need for improvement in clinical care required to prevent hospitalizations and provides insight for resource allocation to prevent and control T1DM complications.

A82
For author disclosure information, see page 797. ADA-Funded Research
ORA
LSIMPROVING HEALTH CARE DELIVERY AND HEALTH OUTCOMES FOR DIABETES
313-ORMinimizing Risks of Hypoglycemia in High Risk Patients: A Proposal for a Glycemic Overtreatment IndicatorCHIN-LIN TSENG, ORYSYA SOROKA, MIRIAM MANEY, DAVID C. ARON, LEON-ARD M. POGACH, East Orange, NJ, Newark, NJ, Cleveland, OH
Diabetes measurement has focused upon undertreatment, however, hy-poglycemia is a common and potentially serious yet avoidable risk of ther-apy. Insulin (I) and sulfonyurea (SU) have been associated with increased hospitalizations in the elderly. Known risk factors include decreased renal function, cognitive impairment (CI) and dementia, and tight glycemic control. Although the National Committee for Quality Assurance has excluded some high risk individuals from meeting an A1c threshold <7%, there is no surveil-lance of A1c <7% in vulnerable persons. Our objective was to evaluate the prevalence of possible overtreatment among veterans receiving care in the Veterans Administration in 2009. Our study population was veterans receiv-ing I or SU in 2009 with one of the following: age >70 years, serum crea-tinine >1.7 mg/dl, or ICD-9CM diagnosis of CI/dementia in 2009. Potential overtreatment was assessed using A1c thresholds of <7%, <6.5%, and <6% based on the last A1c value in FY 2009. Of the identifi ed 286,904 high risk in-dividuals (26% of all veterans with diabetes), 98.7% were male, 82.7% were older than 70 years old, 26.2 % had a serum cretainine >1.7 mg/dl, and 14.8% had CI or dementia. Slightly less than half (47.4%) were on insulin and the rest were on SU but not insulin. Overall, 48.4%, 27.2%, and 10.5% of patients had the last A1c value in FY 2009 lower than 7%, 6.5%, and 6%, respectively. The rates were higher among patients treated with SU but not on insulin: 57.9%, 33.0%, and 12.3%, while lower among patients treated with I: 37.9%, 20.7%, and 8.6%. The difference in rates between I and SU groups were signifi cant (p<0.001) across three A1c thresholds. Additionally, we evaluated a small subgroup of patients (n=62,055) who were older than 70 years old and had either CI/dementia or a serum creatinine >1.7 mg/dl. The rates for the three different thresholds were 51.4% (<7%), 30.2 5 (<6.5%), and 12.3 % (<6%). In sum, the rates of potential overtreatment were markedly elevated among high risk patients.
Supported by: VAHSRD IIR08-355-2
314-ORA Randomized Study to Evaluate Peer Support in Type 2 Diabetic Pa-tients Receiving Structured CareJULIANA CHAN, YI SUI, HARRIET CHUNG, REBECCA WONG, SAMSONLY W. CHAN, MAGGIE S. LAU, GRACE L. LIN, JENNY ZHANG, NICOLA BROWN, BRIAN OLDENBURG, ED FISHER, GARY KO, Hong Kong, China, Melbourne, Australia, Cha-pel Hill, NC
In a multicentre randomized study, we examined the effects of peer support on physical-psychological health in Type 2 diabetic (T2D) patients receiving structured care through a web-based program (JADE: Joint Asia Diabetes Evaluation Program). The latter incorporates a validated risk en-gine and protocols for comprehensive assessment to generate reports to doctors and patients with risk prediction, treatment targets and decision support. The peer support group (PEARL: Peer Support Empowerment And Remote Communication Linked by Information Technology) received 6-10 phone calls from trained mentors in a 10:1 ratio for practical tips and social support. Outcome measures included risk factor control and psychometric scales. In 2009-2010, 628 Chinese T2D patients [mean±SD age:54.5±9.9 years, 59% men, disease duration:9.2±7.8 years, A1c:8.2±1.7%; systolic BP:136±19 mmHg, LDL-C:2.90±0.81mmol/l, insulin-treated (40.2%), cardio-vascular-renal complications (17.4%)] were randomized to PEARL (P; n=312) or control group (C; n=316). All patients received 4-monthly JADE reports by mail showing trends of A1c, BP, LDL-C and body weight (BW). At one year, both groups had signifi cant reduction in risk factors compared to baseline: A1c 0.5%: (P:35%, C:34%); systolic BP 10mmHg (P:36% C:34%); LDL-C 30% (P:17% C:20%); BW 3% (P:22% C:18%). Depression (PHQ9), distress (DSS17), anxiety-stress (DASS21) scales improved similarly in both groups. In this in-tegrated program, regular communication of personalized risk with decision support improved risk factor control and psychological well-being.
311-ORPrimary Care Physician Impact on Treatment of Patients With DiabetesFRITHA MORRISON, MARIA SHUBINA, ALEXANDER TURCHIN, Boston, MA
It is known that patients whose primary care is provided by multiple physicians have worse outcomes, but the reasons are not well understood. This study compares critical process measures between PCPs and covering providers during encounters with patients with uncontrolled diabetes. We conducted a retrospective cohort study to determine if PCPs are more likely than covering providers to intensify medications, provide lifestyle counsel-ing, and have shorter intervals to next encounter for patients with elevated A1c, LDL, or blood pressure. The study included 27,225 patients with 601,330 face-to-face and remote encounters in primary care settings. Patients had at least two years of follow-up with primary care practices affi liated with two teaching hospitals between 1/1/2000 and 1/1/2010. In multivariable analy-sis, the odds of medication intensifi cation were 52% (p<0.0001) and 27% (p=0.0004) higher for PCPs than covering physicians and mid-level provid-ers, respectively (Table 4). Odds of lifestyle counseling were 89% (p<0.0001) higher for PCPs than covering physicians and 23% (p=0.0021) higher than mid-level providers. Compared to PCPs, the hazard ratios for time to next en-counter after a visit without acute complaints were 1.09 and 1.18 for cover-ing physicians and mid-level providers, respectively (p<.0001 for both). PCPs perform better than other providers on several process measures tightly linked to diabetes outcomes. These fi ndings suggest a mechanism for the observed effect of continuity of care on outcomes in diabetes and point to critical gaps that should be addressed in the settings where exclusive care by PCPs is not feasible.
Effects of Provider Type on Key Process Measures in Treatment of DiabetesEncounter Type Provider Category Medication
Intensifi cation (odds ratios)
Lifestyle Counseling (odds ratios)
Time to Next Encounter
(hazard ratios)No acute complaints PCP 1.00 1.00 1.00
Non-PCP MD 0.66 0.53 1.09Mid-level provider 0.79 0.82 1.18
With acute complaints PCP 1.00 1.00 1.00Non-PCP MD 0.72 0.92 0.99Mid-level provider 0.79 0.75 0.97
Supported by: 1R18HS017030, 1RC1LM010460 and DAREF
312-ORComparison of Tele-Health With Usual Case Management in Patients With DiabetesNACIDE ERCAN-FANG, KIRANJOT GUJRAL, STEPHEN K. FIRESTONE, EMILY HA-GEL, BRENT TAYLOR, AREEF ISHANI, Minneapolis, MN, St. Cloud, MN
In patients with diabetes, compared to usual care, nurse case manage-ment (CM) demonstrated signifi cant improvement in Hba1c, blood pressure, lipids, patient satisfaction and perceived quality of care. In other chronic diseases, CM using Tele-health system (CMTH) further improved patient ac-cessibility and timeliness of intervention, with lesser hospitalizations and death. There have been no direct comparison studies between CMTH and CM programs for management of diabetes. The aim of our study is to com-pare the outcomes of the two management programs on Hba1c. A two cen-ter randomized controlled trial of CMTH (n =94) versus CM (n =93) in patients with Hba1c >9.0%, who were followed for a 9 month period. The primary outcome was mean decrease in Hba1c at 9 months. Secondary outcomes included percentage of patients achieving Hba1c <8.0%, percentage of patients achieving goal BP<130/80 mmHg, total number of successful con-tacts and mean duration of each contact. Differences between groups were analyzed using t tests and Pearson [chi square] tests. The mean decrease in Hba1c was similar between the groups (1.25% vs. 1.43% in the CMTH vs. CM groups, respectively; p=0.47). The number of patients who attained goal Hba1c <8% was 33 vs.30, in the CMTH vs. CM groups, respectively; p=0.68. The number of patients achieving goal BP <130/80 mmHg was similar (34 vs. 36 in the CMTH vs. CM groups, respectively; p=0.72). The total number of successful contacts per person was higher in the CMTH group (17 vs. 10 in the CMTH vs. CM groups, respectively; p=<0.0001). The mean duration of contact was shorter in the CMTH (8.6 min vs. 10.2 min in the CMTH vs. CM groups, respectively; p=0.01). Our results suggest that CMTH is not superior to CM program in management of hyperglycemia. While CMTH increased the number of successful contacts and reduced the mean contact duration, the total contact time was increased. Addition of Tele-health system for hy-perglycemia management does not offer improvements over standard CM.
Supported by: Veterans Integrated Service Network 23

A83
For author disclosure information, see page 797.ADA-Funded Research
ORA
LS
IMMUNOMETABOLISM
317-ORT Cell Activation and Proliferation in Adipose Tissue of Obese MiceERLIE JIANG, XIAOYUAN DAI PERRARD, JERRY L. PERRARD, C.W. SMITH, CHRIS-TIE M. BALLANTYNE, HUAIZHU WU, Houston, TX, Tianjin, China
Increased accumulation of T cells, particularly CD8+ T cells, in adipose tissue (AT) is a hallmark of obesity-linked AT infl ammation. T cells are tradi-tionally thought to become activated and to proliferate when they encounter antigens presented by antigen-presenting cells (APCs) in lymphoid organs. By using Edu labeling techniques in mice and cell culture, we studied the po-tential for activation and proliferation of CD8+ T cells in mouse AT. C57BL/6 mice fed high-fat diet for 3 months were used as an obesity model, with mice on normal diet as lean controls. CD8+ T cells and related cytokines were examined in AT by fl ow cytometry or quantitative RT-PCR. Compared to lean mice, obese mice had increased CD8+ T cell numbers in AT, with even higher relative ratios of CD44+/CD62L- effector memory T cells and CD44+/CD69+
effector T cells and increased mRNA levels of granzyme B and IFN- , imply-ing activation of CD8+ T cells in AT of obese mice. At 3 hours after intrap-eritoneal injection of Edu, no Edu+ T cells appeared in blood but we found CD8+/Edu+ T cells in AT, indicating that AT CD8+ T cells proliferated with Edu incorporation. Compared to lean mice, obese mice had increased percentage of proliferating CD8+ T cells (Edu+) in AT (2.1±0.1% in obese vs. 1.4±0.1% in leans, P<0.01). IL-2, IL-12 and IL-18 were all increased in AT of obese mice. To examine the potential of these cytokines to activate T cells in AT, we treated CD8+ T cells isolated from AT with IL-2, IL-12 and IL-18 in vitro (in the absence of antigens and APCs) and found that these cytokines induced proliferation and increased expression of IFN- and CD69 in AT CD8+ T cells. Compared to those from lean mice, CD8+ T cells from AT of obese mice showed increased response to cytokine stimulation with more cells expressing IFN- (11.3±1.1% in obese vs. 3.5±0.2% in leans, P<0.01). In conclusion, we demonstrated that the combined action of infl ammatory cytokines led to local activation and proliferation of CD8+ T cells in AT, which may contribute signifi cantly to AT infl ammation observed in obesity.
Supported by: R01HL098839 (H.W.) and R01DK078847 (C.M.B.)
318-ORB Lymphocytes are Master Regulators of a Pro-Infl ammatory T Cell Balance in Obesity and Glucose IntoleranceBARBARA NIKOLAJCZYK, ANNA C. BELKINA, JENNIFER SNYDER-CAPPIONE, MADHUMITA JAGANNATHAN-BOGDAN, JORDAN CARR, JASON DEFURIA, DOUGLAS MARKHAM, JESSICA ALLEN, JACQUELINE BOUCHARD, YANINA NERSESOVA, AMANDA WATKINS, GERALD DENIS, MARIE MCDONNELL, CARO-LINE APOVIAN, Boston, MA
Lymphocytes play key roles in the chronic infl ammation critical for T2D pathogenesis. We have shown T2D patients have an elevated ratio of pro- to anti-infl ammatory T cells, and that B cells from T2D patients fail to produce anti-infl ammatory IL-10 but produce elevated levels of IL-8. New data show that B cells from the diet-induced obesity (DIO) mouse model of T2D secrete a pro-infl ammatory balance of cytokines, including relatively high MIP-2 (an IL-8 ortholog) and low IL-10, which mirrors our fi ndings in T2D patients. Al-though recent work indications that T2D has an auto-immune component, DIO B cells do not to secrete auto-antibodies, as shown by anti-nuclear an-tigen staining. Complementary metabolic studies show that B cell-null mice resist the development of glucose intolerance in response to DIO, despite weight, fasting serum glucose, RER and whole body percentage of adipose tissue that are indistinguishable from WT mice. Increased glucose tolerance is likely explained by elevated insulin secretion in B cell-null mice responding to a glucose bolus. Taken together, these data support the conclusion that a pro-infl ammatory B cell cytokine balance, rather than antibodies, promotes T2D. To further defi ne roles for B cells in T2D, we immunophenotyped DIO B cell-null splenocytes. Although B cell-null and WT mice on low fat diet have similar percentages of regulatory T cells (Tregs), Tregs expand in DIO B cell-null, while Tregs fail to expand in DIO WT mice. These data are consistent with new human studies showing B cells from T2D (but not healthy) subjects support pro-infl ammatory T cell function, and indicate clinical relevance of published studies showing decreased Th1 function in DIO B cell-null vs. WT mice. We conclude B cells are critical regulators of infl ammation in T2D due to 1. Secretion of a pro-infl ammatory cytokine balance; and 2. An ability to promote pro-infl ammatory T cell function. Thus B cell depletion may repre-sent a valuable tool in the T2D clinic.
Supported by: NIH/NIDDK, BADERC
Structured care (JADE) and peer support (PEARL) in type 2 diabetes (*p<0.05,#<0.01)
PEARL+JADE JADE onlyBaseline 1 year Baseline 1 year
A1c<7% 24.7% 30.4%* 25.0% 32.8%*BP<130/80 mmHg 31.7% 41.9%* 32.9% 43.4%*LDL-C<2.6mmol/L 41.3% 56.1%* 40.2% 56.9%*DASS21<median 50.2% 40.5%# 53.0% 42.9%#
DSS17<median 53.4% 45.1%# 51.3% 41.9%#
PHQ9<median 56.6% 45.7%# 58.1% 48.6%#
Supported by: Peers for Progress
315-ORReducing Glycaemic Burden Through Improved Access to Community Based Specialist Services: A Review of a Tier 2 Clinical ServiceABDUL Z. MOHAMED, REBECCA F. PARKER, SYLVIA MILES, SALMAN HASSOUN, DEVAKA J. FERNANDO, Sutton in Ashfi eld, United Kingdom
The value of managing people with Type 2 diabetes through an early goal-orientated strategy with intention to treat to target through frequent visits with a health care provider based in the community, who has specialist com-petencies are known to lead to reductions in HbA1c levels. Implementing this strategy remains a challenge due to economic restrictions making special-ist care scarce in community settings. We report a 12 month experience of moving from hospital to a community based specialist diabetes service where glycaemic burden was used to asses long term glycaemic control in 100 patients with type 2 diabetes (mean age60.4 SD 13.8 years, 51 males) with type 2 Diabetes all having HbA1C> 7.5 referred to the service. Gly-caemic control was prospectively monitored, three monthly, using HbA1c. Glycaemic burden (Current HBA1c-7.5) was calculated for each patient and plotted against time giving a graphical representation of risk potential end organ damage. HBA1c targets were assessed at baseline 6 months and 12 months. HBA1c fell from 9.5 SD 1.4% at baseline to 8.9 SD 1.5% at 6 months (p=0.004, 95% CI 0.18-0.94) and 8.6 SD 1.4% at 12 months (p=0.001, 95% CI 0.5-1.2). Glycaemic Burden fell from 1.95 SD 1.4 at baseline to 1.4 SD 1.5 at 6 months (p= 0.04 95 % CI 0.18-0.94) and 1.07 SD 1.4 at 12 months (p=0.001, 95% CI 0.5-1.2). Targets of <7.5 HbA1C were achieved in 6 months in 16 (16%) and 22(22%) in one year. The intermediate care clinic achieved reductions in glycaemic burden equivalent to a 1% reduction in HBa1c giving an expected reductions of in mortality (21%) and a legacy effect in a cost effective man-ner through reorientation of existing health services, if results of the United Kingdom Prospective Diabetes Study are extrapolated to this population.
IMMUNOMETABOLISM
316-ORLipid-Sensing NKT Cells in Adipose Tissue Promote M2 Macrophage Polarization and Glucose Homeostasis via IL-4/STAT6 in ObesityYEWEI JI, LING QI, Ithaca, NY
Infl ammation in adipose tissue plays an important role in the pathogenesis of obesity-associated complications. However, the underlying mechanism by which infl ammation develops during obesity remains largely unknown. Here we show that adipose tissues of both mice and humans contain a unique and previously unidentifi ed population of lipid-sensing type-1 natural killer T (NKT) cells, whose abundance decreases with increased adiposity. Remark-ably, in response to 4 day high-fat-diet (HFD) feeding, NKT cells are activated and promote an IL-4-mediated TH2 response in adipose tissue. Using several gain- and loss-of-function mouse models, our data demonstrate that NKT cells in adipose tissue play a key role in modulating the TH1/TH2 response and macrophage polarization in adipose tissue as well as systemic glucose homeostasis, in part via the IL-4/STAT6 signaling axis at both the onset and late stages of obesity. Thus, our data identify NKT cells in adipose tissue as a key regulatory hub linking excess lipids to infl ammation and glucose homeostasis in obesity, suggesting a novel therapeutic target for the treat-ment of obesity-associated infl ammation and type-2 diabetes.
Supported by: NIH

A84
For author disclosure information, see page 797. ADA-Funded Research
ORA
LSIMMUNOMETABOLISM
321-ORSelective PI3K Inhibitors as Anti-NASH AgentsSWAROOP VAKKALANKA, MEYYAPPAN MUTHUPPALANIAPPAN, BABU G, KAN-THIKIRAN VARANASI, KASIVISWANATH ROUTHU, SEETA NYAYAPATHY, SRID-HAR VEERARAGHAVAN, SRIKANT VISWANADHA, DHANAPALAN NAGARATH-NAM, La Chaux de Fonds, Switzerland, Hyderabad, India, Hamden, CT
Non-alcoholic steatohepatitis (NASH) represents a stage of advanced he-patic injury associated with metabolic disorders such as obesity, Type-2 dia-betes, and dyslipidemia. The objective of this study was to explore the thera-peutic potential of RP5090, a novel, selective, small molecule PI3K inhibitor in the pathogenesis of NASH. Activity of RP5090 on individual PI3K isoforms was determined by a Homogenous Time Resolved Fluorescence assay (Milli-pore, Billerica, MA) with modifi cations. Potency of the compound on the delta isoform was further corroborated in Fc R1 induced CD63 expression studies using human whole blood and anti-IgM induced human B-cell proliferation assays. Ability of the compound to suppress LPS induced pro-infl ammatory cytokines such as TNF and IL-1 in THP-1 cells was determined. Pre-clinical effi cacy of the molecule (20 mg/kg/bid) was studied in a methionine-choline defi cient diet induced NASH model in C57BL/6J mice. Pharmacokinetic be-haviour of compounds in plasma after single dose oral administration was determined in Balb/c mice and Wistar rat. RP5090 demonstrated signifi cant potency against PI3K (18.3 nM) with several fold selectivity over the (>485), (>60), and (>50) isoforms. Additionally, the compound inhibited B-cell proliferation (63.5 nM) and Fc R1 induced CD63 expression in human whole blood basophils (94.7 nM) indicating specifi city towards the delta iso-form. Half-maximal inhibition of LPS-induced TNF and IL-1 by RP5090 was achieved at 132.2 and 103.1 nM respectively. RP5090 displayed excellent effi cacy in inhibiting MCD-induced NASH in mice manifested by a signifi cant reduction in liver weight ratio (88%) and liver hydroxyproline content (100%). Pharmacokinetic studies indicated good oral bioavailability of RP5090 with a favourable half-life in mouse and rat. Results demonstrate the therapeutic potential of selective PI3K blockade by small molecule inhibitors in NASH. Additional in vivo studies in other NASH models are in progress prior to ini-tiation of clinical trials.
322-ORActivation-Induced Cytidine Deaminase Defi ciency Exacerbates Diet-Induced Obesity in MiceHEYUAN DING, CHANGYUN HU, JIAN PENG, XIAOJUN ZHANG, F. SUSAN WONG, LI WEN, New Haven, CT, Cardiff, United Kingdom
Activation-induced cytidine deaminase (AID) is a B lymphocyte specifi c DNA deaminase and plays an important role in antibody class switch and the formation of the secondary antibody repertoire of B cells. AID, therefore, is critical for immune responses and immune diseases. However, little is known the role of AID and obesity and its associated metabolic dysfunc-tion. We hypothesize that B cell repertoire is associated with infl ammation and may be important in obesity and its associated metabolic dysfunction. To test our hypothesis, we evaluated metabolic and infl ammatory pheno-types of high-fat diet induced obesity (DIO) in AID-/- and control wild type (WT) mice. Interestingly, we found that AID-/- mice are more susceptible to DIO. AID defi ciency promotes insulin resistance, glucose intolerance and obesity-induced hepatic steatosis. The AUC for ITT was 1650.8±101.2 mg/dL · h in DIO AID-/- mice compared with 1198.5±112 mg/dL · h in DIO WT mice (P<0.05). The AUC for IPGTT was 9971.7±922.8 mg/dL · h in AID-/- mice com-pared with 6142.4±850.1 mg/dL · h in WT mice (P<0.05). AID defi ciency in-creases the level of IgM antibody and immune cell activation. In high-fat diet (HFD)-treated AID-/-mice, the serum IgM concentrations were signifi cantly higher than those in WT mice, and as expected, serum IgA, IgG1, IgG2a, IgG2b and IgG3 levels were almost absent in AID-/-mice. Interestingly, we found the similar Ig profi les in the intestinal contents. Furthermore, AID-/-mice had a more infl ammatory phenotype than WT mice, which included higher levels of macrophage (CD11b+CD11c+F4/80+) infi ltration in white adi-pose tissue (WAT); higher number of CD103+CD11c+ DCs in Payer’s patches (PPs); higher levels of IFN- + T cells (both CD4+ and CD8+) in both lymphoid tissue and WAT and higher levels of circulating infl ammatory cytokines. In summary, our study demonstrates that the repertoire of class switched im-munoglobulins play an important role in obesity-induced infl ammation and metabolic dysfunction.
Supported by: NIH and JDRF
319-ORToll-Like Receptor 4 Defi ciency Impairs Insulin Sensitivity During the Progression of Autoimmune-Mediated Diabetes in Non-Obese Diabetic MiceANNA L. REINBECK, GILLES SÉQUARIS, HANS-JOACHIM PARTKE, PETER NO-WOTNY, JÖRG KOTZKA, BIRGIT KNEBEL, VOLKER BURKART, MICHAEL RODEN, Düsseldorf, Germany
Recent studies on the pathogenesis of type 1 diabetes implicate that mechanisms controlling energy metabolism are involved in disease devel-opment. Certain aspects of carbohydrate and lipid metabolism are under control of the toll-like receptor 4 (TLR4), initially identifi ed as receptor for lipopolysaccharide on innate immune cells. We hypothesized that TLR4 determines a diabetes-modulating metabolic phenotype in non-obese dia-betic (NOD) mice. We monitored the age of diabetes onset and whole-body metabolism using metabolic chambers and indirect calorimetry in female TLR4-expressing (TLR4+) and TLR4-defi cient (TLR4-) NOD mice. Glucose tol-erance was assessed in 6h fasted mice by intraperitoneal glucose tolerance tests (ipGTT). Mitochondrial function was determined by high-resolution respirometry. TLR4-NOD mice developed diabetes earlier in life (152±25d) than TLR4+NOD mice (208±40d, p<0.001). Prediabetic TLR4- animals had a lower respiratory quotient (TLR4- 0.89±0.3; TLR4+ 0.98±0.05, p<0.001) than TLR4+mice in periods of activity. Moreover, TLR4-mice had a lower glucose tolerance (area under the glucose curve: TLR4- 587±152, TLR4+
233±102mmol/L h-1, p<0.001). Upon ipGTT, insulin concentrations were dou-bled in TLR4- compared to TLR4+mice. Fasting serum free fatty acids were 40% higher in TLR4- than in TLR4+mice. In TLR4-NOD mice, hepatic but not myocellular mitochondria showed increased O2 fl ux through complex I and II (TLR4- 54±14, TLR4+ 29±7(pmol mg-1 s-1)/mtDNA copy number, p<0.05) and higher maximal respiratory capacity (TLR4- 87±18, TLR4+ 56±23(pmol mg-1
s-1)/mtDNA copy number, p<0.01) compared to TLR4+NOD mice. Taken to-gether, TLR4 defi ciency decreases insulin sensitivity resulting in increased substrate availability and subsequently enhanced O2-fl ux in liver mitochon-dria. This indicates that TLR4 controls the progression of immune-mediated diabetes in NOD mice by impairing insulin sensitivity.
320-ORThe Important Role of MyD88 in Dendritic Cells in Obesity and Met-abolic SyndromeYUFEI XIANG, XIAOYAN XIAO, CHEN CHAO, JIAN PENG, YIPENG WANG, ZHIGUANG ZHOU, ROBERT SHERWIN, RUSLAN MEDZHITOV, F. SUSAN WONG, LI WEN, New Haven, CT, Changsha, China, Cardiff, United Kingdom
To study innate immunity and dendritic cells in obesity and metabolic syn-drome, we generated transgenic mice expressing MyD88 only in CD11c+ cells, designated as CD11cMyD88+/+MyD88-/- mice. We used a standard high fat diet induced obesity (HFDIO) model. Young male CD11cMyD88+/+MyD88-/- mice (n=18), control MyD88-/- mice (n=18) and wild type B6 mice (n=24) were fed with HF diet for 16 weeks. A further 3 groups of age and gender matched mice were fed with conventional diet (CD, n=13-17/group). We found that the body weight (BW) of MyD88-/- mice was signifi cantly lower than B6 mice after HFD for 6 weeks (P<0.05), whereas there was no obvious difference in BW between B6 and MyD88-/- mice on CD. CD11cMyD88+/+MyD88-/- mice and B6 mice gained a similar amount of weight on HFD and they were signifi cantly heavier than MyD88-/- mice (P<0.05) after 6 wks on HFD. We further investigated metabolic function after HFDIO. Glucose (IPGTT) and insulin tolerance tests (ITT) showed that MyD88-/- mice were sensitive to insulin regulation, whereas WT B6 and CD11cMyD88+/+MyD88-/- mice showed more insulin resistance and there was no difference between B6 and CD11cMyD88+/+MyD88-/- mice. Similarly, serum levels of triglycer-ide, total cholesterol, HDL-ch, LDL-ch, adiponectin, leptin, frbrinogen and insulin, were signifi cantly different in MyD88-/- mice compared to B6 or CD11cMyD88+/+MyD88-/- mice but there was no difference between B6 and CD11cMyD88+/+MyD88-/- mice. Furthermore, we found that primary epididymal adipose stromal cells from B6 and CD11cMyD88+/+MyD88-/- dif-ferentiated into more mature adipoctyes than cells from MyD88-/- mice. B cell response from B6 and CD11cMyD88 +/+MyD88-/- mice were also stron-ger compared to MyD88-/- mice but the number of Treg cells were lower in B6 or CD11cMyD88 +/+MyD88-/- mice than that from MyD88-/-B6 mice. Our study suggests that expression of MyD88 only in DCs affects the phenotype of HFDIO and metabolic syndrome. Further functional studies will determine the mechanism by which this occurs.
Supported by: NIH and JDRF

A85
For author disclosure information, see page 797.ADA-Funded Research
ORA
LS
ADIPOCYTE BIOLOGY
325-ORRBP4 Inhibits Insulin Signaling in Adipocytes by Inducing Pro-In-fl ammatory Cytokines in Macrophages through a JNK- and TLR4-Dependent and Retinol-Independent MechanismJULIE NORSEEN, TETSUYA HOSOOKA, ANN HAMMARSTEDT, MARK M. YORE, SHASHI KANT, PRATIK ARYAL, HIROSHI MARUYAMA, BETTINA J. KRAUS, ANNY USHEVA, ROGER J. DAVIS, ULF SMITH, BARBARA B. KAHN, Boston, MA, Gothenburg, Sweden, Worcester, MA
Retinol-binding protein 4 (RBP4) is secreted from adipocytes and liver. Se-rum RBP4 levels correlate highly with insulin resistance and cardiovascular risk factors. Elevated serum RBP4 levels cause insulin resistance. Our aim was to determine the molecular mechanisms for this. We show that RBP4 induces pro-infl ammatory cytokines (TNF , IL6, MCP1) in mouse and human macrophages and this causes insulin resistance in co-cultured adipocytes. Incubation of adipocytes alone with RBP4 does not alter insulin-stimulated Akt phosphorylation but RBP4 incubation of adipocytes co-cultured with macrophages inhibits insulin signaling in adipocytes. Blocking antibodies or soluble receptors against TNF , IL6 and MCP1 block RBP4-induced in-sulin resistance in adipocytes co-cultured with macrophages. This effect occurs partially by activation of the JNK and Toll Like Receptor 4 (TLR4) pathways since RBP4-induced cytokine production is markedly attenuated by JNK inhibitors and in both JNK1-/-/JNK2-/- macrophages and TLR4-/- macrophages. In preliminary studies, chronic RBP4 treatment in normal mice increases cytokine expression and macrophage infi ltration in perigonadal fat and causes systemic insulin resistance. Since retinol metabolites are sig-naling molecules, we investigated if these effects are retinol-dependent. Unexpectedly, retinol-free RBP4 (apo) induces pro-infl ammatory cytokines as potently as retinol-bound RBP4 (holo) in human and mouse macrophages. These effects are not mediated by the RBP4 receptor, STRA6, since STRA6 is not expressed in mouse or human macrophages. Our results show that RBP4 may cause insulin resistance by contributing to the development of an infl ammatory state in adipose tissue through activation of pro-infl ammatory cytokines in macrophages. This process reveals a novel JNK- and TLR4-de-pendent and retinol-independent mechanism of action for RBP4.
Supported by: NIDDK F32 DK091041 (to J.N.) and NIDDK R37 DK43051 (to B.B.K)
326-OR3-Phosphoinositide-Dependent Protein Kinase 1 (Pdk1) Regulates Macrophage Migration, Polarization, and Insulin SensitivityYOSHINAGA KAWANO, JUN NAKAE, HIROSHI ITOH, Tokyo, Japan
The 3-phosphoinositide-dependent protein kinase 1 (Pdk1) plays important roles in the regulation of glucose and energy homeostasis. However, little is known about Pdk1 in adipose tissue macrophage (ATM) and resident Kupffer cell in liver. We have reported that Foxo1, which is downstream of and inhib-ited by Pdk1, in ATM induces C-C motif chemokine receptor 2 (Ccr2) expression and insulin resistance. To investigate the role of the Pdk1/Foxo1 pathway in macrophages, we generated macrophage/granulocyte-specifi c Pdk1 knock-out (LysMPdk1-/-) and/or transactivation-defective Foxo1 ( 256Foxo1) trans-genic ( 256LysMPdk1-/-) mice. LysMPdk1-/- exhibit glucose intolerance and insulin resistance under normal chow diet. Insulin-stimulated IRS1 or IRS2 and Akt phosphorylation were signifi cantly decreased in epididymal fat and liver of LysMPdk1-/- compared to control mice. F4/80+CD11c+CD206- cells in epididymal fat of LysMPdk1-/- were signifi cantly increased compared to con-trol mice. However, F4/80+ Kupffer cells in liver were signifi cantly decreased. Furthermore, expression levels of Il4 and Il10 were signifi cantly decreased and bone marrow derived Cd11b+ cells were signifi cantly increased in liver of LysMPdk1-/-. LysMPdk1-/- exhibit increased Ccr2 expression in stromal vas-cular fraction (SVF) and peritoneal macrophage. Transwell migration assays revealed that Pdk1-defi cient bone marrow derived macrophages (BMDM) exhibited signifi cantly increased capacity of migration compared to BMDM from control. Moreover, deletion of Pdk1 or activation of Foxo1 in BMDM abolished insulin- or IL-4-stimulated induction of genes for alternative ac-tivation. Overexpression of transactivation-defective Foxo1 rescues these phenotypes. These data suggested that Pdk1-Foxo1 pathway regulates mi-gration and polarization of macrophage and plays an important role in the regulation of insulin sensitivity in vivo.
323-ORVaccination Against FABP4 for Preventing High-Fat-Induced Insulin Resistance and Atherosclerosis in MiceXINYE JIN, DAJIN ZOU, Shanghai, China
Adipocyte fatty-acid-binding protein(FABP4) is expressed in adipocytes and macrophages. Studies have shown that inhibiting its function can improve metabolic syndrome.Here we constructed vaccines against FABP4. Two car-riers were selected, which were Virus-like particles formation by modifi ed Hepatitis B virus core (HBc) and keyhole limpet hemocyanin(KLH),and 3 types of vaccines were constructed: FABP4,HBc-FABP4 and FABP4-KLH. C57 mice were immunized respectively,and produced antibody in all groups,among which antibody titer in FABP4-immunized group was the highest. FABP4-immunized mice with high-fat diet (treating group) were compared with ad-juvant-injected mice with high-fat diet(control group) and mice with normal diet(normal group) in the 20th week after fi rst immunization. Weight,food-intake,triglyceride,total cholesterol , fasting insulin,HOMA-IR,120’ blood-glucose and insulin levels in treating group were lower than those in control group(P<0.05),while had no difference with those in normal group (P>0.05).There was no difference in fasting blood-glucose levels between treating and control group (P>0.05),which were higher than that in normal group(P<0.05) but still within the normal limit. There was no difference in free fatty-acid levels among the groups. After executing mice,we made pathological sections with their livers,pancreases and thoracic aortas,which showed that in treating group,the areas of fat deposition in liver and arterial plaque in aortas were smaller than those in control group(P<0.05). But such difference was not found in pancreas. In conclusion,we successfully con-structed vaccines against FABP4 which could induce specifi c humoral immu-nity and protect mice against the development of obesity, hyperlipoidemia, hyperinsulinemia,fatty liver and atherosclerosis induced by high-fat diet.Our study has offered theoretical and experimental basis for a brand-new im-munologic intervention targetting to FABP4.
Supported by: CMA
ADIPOCYTE BIOLOGY
324-ORAdipose Tissue-Specifi c Deletion of BMP-Receptor Type 1A Results in a Reduced Macrophage Infi ltration Profi le and Improved System-ic Insulin SensitivityTIM J. SCHULZ, LINDSAY E. MCDOUGALL, TIAN LIAN HUANG, YUJI MISHINA, YU-HUA TSENG, Boston, MA, Ann Arbor, MI
Adipose tissue infl ammation is a hallmark process during obesity that is thought to contribute to insulin resistance and the development of diabetes. Recent fi ndings have implicated signaling through type 1A BMP-receptor (BMPR1A) in adipose tissue development and indicated its potential impact on human obesity. To investigate the function of BMPR1A in adipose tis-sue physiology and whole body energy metabolism, we generated a mouse model with conditional deletion of BMPR1A using the Cre/loxP system: Two mouse strains with adipocyte-specifi c expression of Cre-recombinase, under the control of either the adiponectin- or the fatty acid binding protein (FABP)-4-promoter, were intercrossed with a mouse strain carrying a fl oxed allele of the Bmpr1A gene. The resultant knock-out mice displayed signifi cantly im-proved insulin sensitivity and reduced expression of infl ammatory cytokines, such as interleukins and interferon- . A concomitant reduction of macrophage marker expression, such as F4/80 and CD68, and macrophage infi ltration in adipose tissue was observed during high fat diet feeding. Moreover, lower levels of adipose expression of leptin and reduced circulating levels of lep-tin and insulin were observed in knock-out mice. Aside from its central role in appetite regulation, leptin is known to act as a pro-infl ammatory factor. We therefore propose that reduced leptin production in BMPR1A-defi cient adipocytes leads to reduced macrophage infi ltration which counteracts the onset of insulin resistance in diet-induced obesity. This effect in turn is as-sociated with enhanced systemic insulin sensitivity during high fat feeding in mice with impaired BMP signaling. Taken together, these fi ndings reveal a novel role for BMP signaling in the regulation of systemic glucose homeosta-sis by regulating the endocrine function of adipocytes and the infl ammatory response during metabolic challenges such as obesity.

A86
For author disclosure information, see page 797. ADA-Funded Research
ORA
LSADIPOCYTE BIOLOGY
identifi ed and named based on activation by chemicals promoting peroxi-somal proliferation. PPAR is critical for normal adipose tissue function and is activated by glitazones, diabetes drugs with side effects that include in-creased adiposity and heart failure. Endogenous pathways of PPAR activa-tion are unclear. We demonstrate that a lipogenic pathway encompassing the multifunctional enzyme fatty acid synthase (FAS) and an enzyme encod-ed by a cDNA not previously cloned in mammals, PexRAP (for Peroxisomal Reductase Activating PPAR ), modulates endogenous PPAR activation. Mice lacking FAS in adult adipose tissue resisted diet-induced adipocyte hypertrophy and obesity through mechanisms that did not involve altered food intake. There was no effect on hypothalamic FAS in these animals. FAS knockdown in embryonic fi broblasts decreased PPAR transcriptional activity and adipogenesis. FAS-dependent alkyl ether phosphatidylcholine species were associated with PPAR protein in mass spectrometry experi-ments, and treatment of 3T3-L1 cells with one such ether lipid increased PPAR -dependent transcriptional activity. PexRAP, a protein required for alkyl ether lipid synthesis, was physically associated with peroxisomes and its abundance was induced during adipogenesis. PexRAP knockdown in cells decreased PPAR transcriptional activity and adipogenesis. In mice fed a high fat diet, antisense oligonucleotide-mediated knockdown of PexRAP decreased expression of PPAR −dependent genes, reduced adiposity, in-creased leanness, and improved insulin sensitivity as compared to control mice. These fi ndings suggest that inhibiting PexRAP or related lipogenic en-zymes could treat obesity and diabetes.
330-ORAdipose Tissue Specifi c Deletion of the Mitochondrial Transcrip-tion Factor A (TFAM) Causes Lipodystrophy and HepatosteatosisCECILE VERNOCHET, C.R. KAHN, Boston, MA
Mitochondrial dysfunction in adipose tissue has been reported in obesity, type 2 diabetes and metabolic syndrome, but whether this dysfunction par-ticipates in the development or is a result of these disorders remains an open question. Mitochondrial transcription factor A (Tfam) plays a key role in mi-tochondrial function by controlling both mtDNA stability and transcription. To investigate the physiological consequences of mitochondrial impairment in adipose tissue, we generated a mouse defi cient for Tfam specifi cally in adipocytes (Ad-TFKO) using Adiponectin-Cre and Tfam fl oxed allele. Ad-TFKO mice are leaner than control mice on normal chow diet (CD) by 16% and 28% less after 6 weeks upon HFD. In the CD, Ad-TFKO mice brown adipose tissue was almost inexistent and completely overtaken by white adipose tissue, whereas subcutaneous white fat was reduced by 61% and perigonadal fat by 52%. Ad-TFKO mice also had 14% decreased in basal energy expenditure with no signifi cant change in spontaneous activity. Interestingly, fed glucose levels in Ad-TFKO mice were elevated by 35% compared to controls but fast-ing glucoses were similar. Ad-TFKO also exhibited a similar glucose clearance during an insulin tolerance test but remained hyperglycemic compared to control throughout. Ad-TFKO has a 2 fold increase in liver mass and histology revealed marked triglycerides accumulation. Thus TFAM KO in fat impaired white and brown adipose tissue expansion and provoked lipid localization to the liver leading to hepatosteatosis and systemic insulin resistance. These results thus suggest that mitochondria dysfunction in adipose tissue could indeed participate and accelerate development of metabolic syndrome.
331-OREffect of a Point Mutation in the c-fos Gene Promoter in a Patient With Congenital Generalized LipodystrophyBIRGIT KNEBEL, JÖRG KOTZKA, STEFAN LEHR, SYLVIA JACOB, ULRIKE NITZGEN, DIRK MÜLLER-WIELAND, Düsseldorf, Germany, Hamburg, Germany
Congenital generalized lipodystrophy (CGL) are rare genetic syndromes characterized by the absence of adipose tissue. CGL patients’ show patho-logical systemic lipid levels, lipid accumulation in non-adipose tissues main-ly the liver and most complications of the metabolic syndrome. Therefore genetic defects associated to CGL resemble candidate genes also for the metabolic syndrome. We examined hormone activated signal transduction pathways in isolated fi broblasts of a CGL patient and identifi ed a postrecep-tor defect altering expression of the immediate early gene c-fos. This sig-naling defect can be reconstituted by transfecting a wtc-fos promoter thus focusing on a genetic defect and excluding further upstream signaling alter-ations. Sequence analyses revealed a single homozygous point mutation in the patient’s c-fos promoter. Functional analyses of this promoter revealed a by 90% reduced basal transcription activity Furthermore, stimulatory ef-fects of growth factors and insulin were abolished. The point mutation was located upstream of the well characterized promoter elements in a region with no homology to any known cis-elements. In gel retardation experiments
327-ORTargeting Neutrophils in Adipose Tissue Infl ammation and Type 2 DiabetesNOZOMU KAMEI, YASUHIKO YAMAMOTO, TAKESHI SHIMADA, HYUEK JONG LEE, JONGSOON LEE, STEVEN E. SHOELSON, Boston, MA, Tokyo, Japan, Kanaza-wa, Japan, Wakayama, Japan
Elevated WBC counts predict incident T2D and CVD and poor outcomes. More recent studies focused on leukocytes in adipose tissue (AT). Mac-rophages (ATMs) predominate, but T and B cells also increase with obesity in rodents. These fi ndings suggest that obesity-induced infl ammation is more similar to ‘classical’ infl ammation - the response to infections and sterile ne-crosis - than previously recognized. In acute infl ammation, neutrophils (Neu) are recruited in hours, and macrophages are called in later. Despite a rela-tive paucity in AT, we hypothesized that Neu play important roles in insulin resistance and T2D and that macrophage accumulation in AT depends on the earlier recruitment of Neu. Using fl ow cytometry we found that Neu increase 4-5 fold during the induction of obesity at earlier times than ATMs. To test if Neu are important for insulin resistance and T2D, we used 6 distinct manipu-lations: Ab neutralization, 2 knockout models, and 3 different drugs. None affected body weight or feeding under study conditions but all improved glycemia and lowered insulin levels. Ly6G Ab is often used to selectively deplete Neu; numbers in the circulation and spleen were reduced 50-75%. There was no affect in chow fed mice but in HFD mice both glucose (71 vs 82 mg/dl, Ly6G vs Ctrl Ab) and insulin (0.37 vs. 0.72 ng/ml) levels were reduced (P<0.05). The leukotriene LTB4 is a potent Neu chemoattractant. LTA4H cata-lyzes its formations, and BLT1 is its receptor. Ltb4-/- and -/+ HFD mice and Blt1-/- and -/+ HFD mice had dramatically lower glucose and insulin levels than littermate wt mice. Drugs also target LTB4: zileuton and bestatin inhibit biosynthetic enzymes 5-LO (5-lipoxigenase) and LTA4H, whereas CP105696 inhibits the receptor BLT1. Each drug reduced AT Neu number and blood glu-cose and insulin levels (P<0.05). These fi ndings suggest that AT neutrophils have previously unrecognized local roles in AT infl ammation and T2D and provide potential new therapeutic avenues for treatment.
328-OREpigenetic Regulation of Macrophage Polarization by DNA Methy-lation in ObesityBINGZHONG XUE, XIANFENG WANG, HANG SHI, Winston-Salem, NC
Obesity is associated with increased classically activated M1 adipose tissue macrophages (ATMs) and reduced alternatively activated M2 ATMs, which contributes to insulin resistance. However, the underlying mechanism is unclear. Epigenetic mechanisms play important roles in complex diseases including obesity and insulin resistance. However, little is known whether and how epigenetic mechanisms regulate macrophage polarization and in-fl ammation in obesity. Here we fi nd that inhibiting DNA methylation phar-macologically by 5-aza-2’-deoxycytidine (5-azadC) or genetically using mac-rophages from myeloid-specifi c DNA methyltransferase 1 (DNMT1) knockout mice (MD1KO) results in M2 macrophage polarization, evidenced by up-reg-ulation of M2 marker, such as arginase I (ARG1), mannose receptor, Dec-tin-1, programmed cell death 1 ligand 2, interleukin 1 receptor antagonist, interleukin 10, and the nuclear receptor peroxisome proliferator-activated receptor g1 (PPARg1), key regulator of M2 macrophage activation; whereas over-expressing DNMT1 profoundly suppresses interleukin 4-induced ARG1 and PPARg1 expression. PPARg1 promoter is enriched with CpG sites. Inhib-iting DNA methylation by 5-azadC signifi cantly decreases, whereas satu-rated fatty acids (SFAs) and pro-infl ammatory cytokines, levels of which are usually elevated in obesity, signifi cantly increase PPARg1 promoter DNA methylation. Finally, MD1KO mice have signifi cantly improved insulin sensi-tivity without altering body weight. In summary, DNA methylation plays an important role in regulating macrophage polarization. Inhibiting DNA methy-lation at PPARg1 promoter promotes M2 macrophage polarization; whereas in obesity, elevated SFAs and pro-infl ammatory cytokines enhance PPARg1 promoter DNA methylation, which contributes to deregulated ATM polariza-tion, infl ammation and insulin resistance in obesity.
Supported by: AHA
329-ORPeroxisomal Lipid Biosynthesis Regulates Adiposity and Metabo-lism through PPAR SignalingIRFAN J. LODHI, LI YIN, ANNE P. JENSEN-URSTAD, TREY COLEMAN, CLAY F. SEMENKOVICH, St. Louis, MO
Options for treating obesity and diabetes are limited. Peroxisome prolif-erator-activated receptors (PPARs) are ligand-activated transcription factors involved in metabolism and infl ammation. This receptor family was originally

A87
For author disclosure information, see page 797.ADA-Funded Research
ORA
LS
DIABETES AND MACROVASCULAR DISEASE—FROM BIOMARKERS TO THERAPEUTICS
(7-37) increased atherosclerotic lesion formation in mice. This was at least partially attributable to elevation of non-HDL serum cholesterol concen-trations in GLP (9-37) treated animals. The GLP-1 metabolite (9-37) causes atherosclerosis in mice and is associated with atherosclerosis in humans. These initial observations should prompt further investigations to clarify the relevance of the GLP-1 metabolite in cardiovascular disease.
Supported by: EFSD and the DFG
334-ORRelationship Between Pericardial, Mediastinal Fat and Whole Body Band Myocardial Glucose UptakeMARJORIE MOLINA-WILKINS, GEOFFREY D. CLARKE, SANDRA MARTINEZ, JOHN R. KINCADE, FENG DONG, JESUS GARDUNO-GARCIA, SAMIA B. GEEVAR-GHESE, VERNA MENDEZ, ADRIANA MONROY, RUCHA J. MEHTA, CAROLINA SOLIS-HERRERA, MUSTAFA KANAT, AURORA MEROVCI, STEVEN R. BAILEY, ROBERT J. CHILTON, PATRICIA IOZZO, MUHAMMAD ABDUL-GHANI, RALPH A. DEFRONZO, San Antonio, TX, Pomona, CA, Pisa, Italy
Previous studies have demonstrated a strong relationship between mes-enteric fat and whole body insulin resistance. No previous study has exam-ined the relationship of thoracic and pericardial fat to insulin resistance. In the present study, we measured whole body insulin sensitivity, myocardial glucose uptake, pericardial fat and mediastinal fat in 25 healthy NGT indi-viduals (age = 45±10 year, BMI = 26.6±3.8 kg/m2, HbA1c = 5.4±0.3%) and 25 type 2 diabetic individuals (52 ±9 years, BMI 31.5±4.3 kg/m2, HbA1c = 7.1±1.6 %) and examined the relationship between pericardial fat content and whole body insulin sensitivity and myocardial glucose uptake. As ex-pected, glucose infusion rate during the euglycemic insulin clamp was sig-nifi cantly decreased in T2DM compared to NGT subjects (3.9±1.6 vs. 7.6 ±2.8 mg/kg/min, <0.005). Myocardial glucose uptake measured with FDG and PET scan also was signifi cantly decreased in T2DM compared to healthy in-dividuals (0.27±0.13 vs 0.40±0.16 mmol/min/mL tissue, =0.01). Conversely, pericardial and mediastinal content measured with MRI were signifi cantly greater in T2DM compared to healthy individuals (14.4±3.5 and 32.4 ±11.9 vs. 8.8±2.8 and 17.6± 7.6 cm2, respectively, both <0.005). Whole body insulin sensitivity was strongly and inversely correlated with both pericardial (r=-0.69) and mediastinal fat (r=-0.72), ( < 0.001 for both). However, surpris-ingly, myocardial glucose uptake did not have signifi cant correlation either with pericardial or mediastinal fat content. These results demonstrated that pericardial and mediastinal fat exert differential effect on myocardial and whole body glucose uptake.
Supported by: Takeda Pharmaceuticals
335-ORIncreased Arterial Stiffness is Independently Associated With Ce-rebral Infarctions and White Matter Lesions in Patients With Type 2 Diabetes Despite Good Blood Pressure and Lipid ControlESBEN LAUGESEN, PERNILLE HØYEM, BRIAN S. GRØN, ANDERS MIKKELSEN, WON Y. KIM, SAMUEL THRYSØE, MOGENS ERLANDSEN, JENS S. CHRIS-TIANSEN, SØREN T. KNUDSEN, KLAVS W. HANSEN, TROELS K. HANSEN, PER L. POULSEN, Aarhus, Denmark
Patients with type 2 diabetes (T2DM) have increased risk of cardiovascu-lar disease (CVD) including stroke. The risk of CVD is traditionally assessed using offi ce blood pressure (BP) and lipid profi le. Increased arterial stiffness predicts cardiovascular events in the general population. We investigated if arterial stiffness was associated with cerebrovascular disease in patients with T2DM and sex- and age-matched controls. 90 patients with newly diagnosed T2DM and 90 sex- and age- matched controls were examined. Arterial stiffness was assessed by aortic pulse wave velocity (PWV), and cerebrovascular disease by cerebral infarctions and severity of white matter lesions (WMLs) on MRI scans of cerebrum. A blinded reviewer rated WMLs a.m. Breteler (no/slight changes=0, moderate=1, severe=2). Antihyperten-sive treatment and lipid lowering treatment was more frequent in diabetic patients, who consequently had lower offi ce BP (126+/- 12 vs 131+/-14 mmHg systolic, p=0.01) and lower lipid levels. Despite this, diabetic patients had signifi cantly higher PWV compared to controls, (9.2+/-2.0 vs 8.0+/-1.6 m/s, p<0.0001). PWV was higher in patients with cerebral infarctions (9.9 vs 8.5 m/s, p=0.002) and PWV increased across Breteler categories (8.2+/- 1.7 vs 9.3+/-2.0 vs 9.4+/-2.1 m/s, p<0.001 for trend). PWV remained independently associated with severity of WMLs (p<0.01) and cerebral infarctions, (p<0.02) after adjustment for the following covariates: age, sex, diabetes, mean arte-rial pressure, smoking, statins and BMI in multivariate regression. Thus, in conclusion, despite good BP and lipid control, PWV was substantially higher in T2DM patients. PWV is independently associated with WMLs and cere-bral infarctions. PWV may represent a clinically relevant parameter in the evaluation of CVD risk in T2DM.
the mutation facilitates the formation of a novel and specifi c protein/DNA complex. Using a mass spectrometry we have identifi ed proteins of this nov-el complex which belong to the glucose regulated protein family (Grp 78, Grp 90), heterogeneous nuclear ribonucleoproteins hNRNP families and 14-3-3 protein. The results indicate that a genetic defect infl uencing the regulation of a ubiquitous transcription factor can be valuable to dissect novel mecha-nisms and candidate genes involved in metabolic syndrome.
DIABETES AND MACROVASCULAR DISEASE— FROM BIOMARKERS TO THERAPEUTICS
332-ORInsulin Sensitizers May Reduce the Risk of Peripheral Arterial Disease in Type 2 Diabetes: Results from the Bypass Angioplasty Revascularization Investigation 2 Diabetes (BARI 2D) TrialANDREW D. ALTHOUSE, MARIA M. BROOKS, J. DAWN ABBOTT, ALAN FORKER, LUISA V. BUITRON, JEAN-CLAUDE TARDIF, KIM SUTTON TYRRELL, THE BARI 2D STUDY GROUP, Pittsburgh, PA, Providence, RI, Kansas City, MO, Mexico City, Mexico, Montreal, QC, Canada
Patients with type 2 diabetes mellitus (T2DM) have a high risk of develop-ing peripheral arterial disease (PAD). It is thought that insulin sensitizing medications may confer an advantage over insulin providing medications for prevention of PAD, but this has never been proven in a randomized controlled trial. The BARI 2D trial randomly assigned T2DM patients to insulin sensitiz-ing (IS) or insulin providing (IP) glycemic control strategy. We hypothesized that patients assigned to IS therapy would experience fewer incident cases of PAD than patients assigned to IP therapy. PAD status was assessed an-nually using the ankle-brachial index (ABI). Patients with abnormal ABI at study entry were excluded from this analysis. Incident PAD was defi ned as a new low ABI (<0.9) during follow-up. Secondary endpoints include lower extremity revascularization and amputation. We analyzed the incidence of PAD in 1,389 BARI 2D patients that had normal ABI (0.9<ABI<1.3) at study entry and at least one follow-up ABI measurement. 293 of these patients (21.1%) were diagnosed with incident PAD during an average of 4.6 years of follow-up. The incidence of PAD was signifi cantly lower among patients assigned to IS therapy than those assigned to IP therapy (17.6% vs. 24.6%, p=0.001). The difference was statistically signifi cant with stratifi cation for baseline insulin use (IS vs. IP difference for patients on insulin at baseline: 21.7% vs. 33.5%, p=0.013; IS vs. IP difference for those not on insulin at baseline: 16.2% vs. 21.6%, p=0.026). Patients assigned to IS therapy also required fewer amputations (0.1% vs. 1.9%, p=0.001) and fewer lower ex-tremity revascularizations (1.2% vs. 2.4%, p=0.069) than patients assigned to IP therapy. In summary, a glycemic control strategy of IS therapy resulted in a signifi cantly lower incidence of PAD and related clinical outcomes than a strategy of IP therapy in this cohort of patients with T2DM.
Supported by: NHLBI with support from NIDDK, GSK, and other pharmaceutical companies
333-ORThe GLP-1 Metabolite GLP 9-37 Increases Atherosclerotic Lesions In Mice and is Associated With Coronary Atherosclerosis in HumansKATJA PIOTROWSKI, MELANIE BECKER, JULIA ZUGWURST, INGEBORG BILLER-FRIEDMANN, GERALD SPÖTTL, JULIA MÖLLMANN, MARTIN GREIF, ALEXAN-DER W. LEBER, ALEXANDER BECKER, ANNE TAILLEUX, RÜDIGER P. LAUBENDER, CORINNA LEBHERZ, BART STAELS, BURKHARD GÖKE, NIKOLAUS MARX, KLAUS G. PARHOFER, ULI C. BRÖDL, MICHAEL LEHRKE, Munich, Germany, Aachen, Ger-many, Lille, France
GLP-1 (7-36 amide or 7-37) is a gastrointestinal hormone which improves glucose metabolism by augmenting glucose dependent insulin secretion from the pancreatic beta cell. In addition, a variety of extra-pancreatic effects have been described for GLP-1 which include vasoprotective and anti-infl ammatory actions. GLP-1 is rapidly inactivated in a DPP-4 dependent manner. The thereby created GLP-1 metabolite (GLP 9-36 amide or 9-37) is unable to activate the GLP-1 receptor but still has overlapping cardiovas-cular effects, suggesting the presence of an additional receptor system. The cardiovascular relevance of the GLP-1 metabolite in human biology is unknown. Total circulating GLP-1, mainly consisting of the GLP-1 metabolite (9-36 amide or 9-37), was assessed in a cohort of 303 patients receiving CT angiography due to typical or atypical chest pain. GLP-1 levels were sig-nifi cantly associated with total atherosclerotic plaque burden in simple (OR: 1.22; 95 % CI: 1.03-1.48; p=0.03): and fully adjusted models (OR of 1.30 (95 % CI: 1.06-1.65; p=0.02). To determine whether GLP-1 or its metabolite play a role in atherogenesis we overexpressed both, GLP-1 (7-37) and GLP (9-37) in atherosclerosis-prone LDL receptor defi cient mice. GLP (9-37) but not GLP-1

A88
For author disclosure information, see page 797. ADA-Funded Research
ORA
LSBEHAVIORAL DIABETES INTERVENTIONS—RESULTS FROM THE LATEST CONTROLLED TRIALS
development also improve endothelial dysfunction. We have previously re-ported that baseline levels of sE-selectin and sICAM, circulating markers of endothelial dysfunction, are strongly associated with incident diabetes in the placebo group. Here we assessed whether 1-year changes in sE-selectin and sICAM induced by lifestyle and metformin interventions, are associated with diabetes incidence over 3.2 years of follow-up, compared to the placebo group. Baseline sE-selectin (46 ng/mL) and sICAM (251 ng/mL) concentrations were not different across the 3 groups. At 1 year, sE-selectin fell by 8% in the lifestyle group (demographic adjusted p<0.05 vs placebo and metformin groups), and sICAM fell by 6% in the lifestyle group (p<0.05 vs placebo and metformin groups) and by 4% in the metformin group (p<0.05 vs placebo). In separate Cox models for each treatment group with adjust-ment for baseline levels and demographic factors, change in sICAM was not associated with diabetes development, but a decrease of 11 ng/ml (~1 sd) in sE-selectin was associated with a reduction in diabetes risk of 14% to 28% in the 3 groups. The association between sE-selectin and diabetes develop-ment was however no longer signifi cant after adjustment for 1 year changes in insulin sensitivity (1/FI) or BMI in all 3 treatment groups, with greater at-tenuation of the association with BMI. Thus sE-selectin is not only a signifi -cant predictor of incident diabetes at baseline, but its reduction by both life-style and metformin is associated with the intervention-driven decreases in diabetes incidence and is explained principally by weight change.
Supported by: NIDDK (U01-DK048489)
BEHAVIORAL DIABETES INTERVENTIONS—RESULTS FROM THE LATEST CONTROLLED TRIALS
338-ORCommunicating Cardiovascular Risk to Latinos With Type 2 Diabe-tes Using a Spanish Language-Based Multimedia ProgramPARIS ROACH, CHANDAN SAHA, DAVID G. MARRERO, Indianapolis, IN
Cardiovascular disease (CVD) is the leading cause of mortality in Latinos with type 2 diabetes (T2DM), yet CVD risk factors (RF) are under-treated in this population. This may result from low awareness of CVD and low literacy among patients and from linguistic barriers, limited encounter time, and “clinical inertia” among providers. To address these barriers, we developed a Spanish-language, tablet computer-based multimedia CVD risk communica-tion intervention consisting of a series of video presentations that patients viewed just prior to outpatient encounters. Each presentation uniquely in-corporated individual CVDRF data and 10-year CVD risk based on UKPDS Risk Engine estimates. The program also generated color graphic 1-page printouts showing updated CVDRF status for use during the encounter. The hypothesis that this intervention would stimulate therapeutic intervention (TI), i.e. the discussion of CVD risk during the visit (determined via exit in-terviews) or a change in medication directed toward CVDRFs (determined via chart audit) was tested in a randomized controlled comparison of the intervention vs usual care in four urban primary care clinics providing care to the local Spanish-speaking Latino population. Participants (n=144) had a mean age of 47 years, 69% had less than a high school education, and 87% had annual income less than $40K. Patients in the intervention group (n=86) were exposed to the intervention one to three times during the 12-month follow-up period, and compared to control patients (n=58), had an overall TI rate that was 87% higher, based on a Poisson regression model: 19.6 vs. 10.5 TI per patient per 12 months, p=0.023. 94-100% of intervention group patients felt that it facilitated interactions with their providers. This multi-media CVD risk communication intervention resulted in a signifi cant increase in TI aimed at reducing CVDRFs in a Spanish-speaking population with T2DM and was used successfully within the primary care environment.
Supported by: Robert Wood Johnson Foundation
339-ORImpact of Communicating Genetic and Phenotypic Risk of Type 2 Diabetes (T2D) on Objectively-Measured Physical Activity (PA): The Diabetes Risk Communication TrialJOB G. GODINO, ESTHER VAN SLUIJS, THERESA M. MARTEAU, STEPHEN SUT-TON, STEPHEN J. SHARP, SIMON J. GRIFFIN, Cambridge, United Kingdom
Information about risk of T2D is widely available, yet effects are uncertain and regulation of providers has been proposed. We aimed to assess effects of providing such information on risk reducing health behaviors, anxiety, and cognitive and emotional antecedents of behavior change. We recruited 569 adults aged 39 to 61 years from a population-based observational study in Cambridgeshire, UK. Participants underwent clinical, anthropometric, and
336-ORLong Term Complications and Mortality in Youth Onset Diabetes: Type 2 Diabetes is More Lethal than Type 1MARIA CONSTANTINO, LYNDA MOLYNEAUX, FRANZISKA H. GISLER, ABDUL-GHANI AL SAEED, CONNIE LUO, TED WU, DENNIS K. YUE, JENCIA WONG, Syd-ney, Australia
Despite an increasing prevalence of youth onset type 2 diabetes (T2DM), few data exist on the long term complications or mortality in this group. We examined both outcomes in 138 patients with T2DM of onset between 15 and 30 years and duration of diabetes >15 years (T230) and in 208 patients with T1DM selected by identical criteria (T130). Subjects had all attended for a complications assessment. Mortality data were extracted from the Na-tional Death Index. Retinopathy was not different between groups but T230
had higher neuropathy scores and albuminuria (p<0.0001 for both). Despite a greater use of statins and antihypertensives (both p<0.0001), T230 show an excess of IHD (p<0.0001), stroke (p<0.008) with reduced survival (Fig 1, p=0.002) and a shorter duration before death. Risk factors HbA1c, systolic BP, Tg, HDL and BMI were all worse in T230 (Table). By using the same age range for diabetes onset, this study has been able to compare the detri-mental long term effects of youth onset T2DM and T1DM, minimizing the otherwise unavoidable confounding effects of age and diabetes duration. These data are evidence for the greater metabolic derangement and long term detrimental effect of youth onset T2DM, highlighting this group for ag-gressive intervention.
Table 1. Clinical characteristics of T230 and T130 groupsn=346 Type 2 Diabetes
n=138 % males =54.3Type 1 Diabetes
n=208 % males = 61.1Statistics
Duration of Diabetes (yrs) 24.1[19-30] 22.9[19-30] Z=1.4;p=0.2Age of Onset (yrs) 25.6±3.8 21.3±4.2 t=9.9;p<0.0001Age (yrs) 51.7±9.0 46.1±8.6 t=5.9;p<0.0001HbA1c % 8.9±2.0 8.3±1.6 t=2.8;p=0.006BMI kg/m2 31.7±8.0 25.8±4.0 t=7.8;p=<0.0001Systolic BP (mm/Hg) 134±20 128.19 t=2.4;p=0.02Triglycerides mmol/L HDL mmol/L
1.8[1.2-3.0] 1.2±0.3 1.1[0.8-1.5] 1.5±0.5 Z=6.7;p<0.0001 t=-6.0;p<0.0001
337-ORLifestyle and Metformin-Induced Changes in Markers of Endotheli-al Dysfunction are Associated With Reduction in Incident Diabetes in the Diabetes Prevention ProgramELLA TEMPROSA, KIEREN J. MATHER, TREVOR J. ORCHARD, GEORGE A. BRAY, ABBAS E. KITABCHI, SANTICA M. MARCOVINA, LEIGH PERREAULT, ROBERT E. RATNER, RONALD B. GOLDBERG, DPP RESEARCH GROUP, Rockville, MD, India-napolis, IN, Pittsburgh, PA, Baton Rouge, LA, Memphis, TN, Seattle, WA, Aurora, CO, Hyattsville, MD, Miami, FL
Endothelial dysfunction is present early in the course of type 2 diabetes, where it may be a forerunner of diabetic vascular complications. The rela-tionship of endothelial dysfunction with diabetes development is not well understood. It is also unknown whether interventions that slow diabetes

A89
For author disclosure information, see page 797.ADA-Funded Research
ORA
LS
BEHAVIORAL DIABETES INTERVENTIONS—RESULTS FROM THE LATEST CONTROLLED TRIALS
(without diabetes) with mean weight 107.5 kg, BMI 39.3 kg/m2, waist cir-cumference 118.4 cm, fasting glucose 99.6 mg/dl, blood pressure 128.8/75.6 mm Hg, triglycerides 145.3 mg/dl, HDL-chol 42.4 mg/dl, LDL-chol 108.1 mg/dl. Intention-to-treat mixed linear model regression using repeated measures was performed. At 6 and 12 months solo treatment participants adjusted mean weight (waist circumference) decreased by 4.1 kg (3.4cm) and 4.6 kg (5.1 cm), and in group treatment decreased by 4.8 kg (2.7 cm) and 6.0 kg (6.0 cm); all adj p<.01. At 1 year, mean % weight loss from baseline was 4.6% in both treatments; 40.3%/46.6% lost at least 5% weight; 26.9%/37.7% lost at least 7% weight and 17.9%/26% lost at least 10% weight in the solo/group treatments respectively. There were no signifi cant differences in weight loss between treatment groups. Glucose, lipid and blood pressure levels did not signifi cantly improve. In conclusion, primary care staff can be trained to deliver a DPP translation by telephone that is effective for achieving signifi -cant weight loss in both individual and group formats.
Supported by: NIDDK (R18 DK078553)
342-ORReducing Diabetes Distress: First Results From The REDEEM TrialLAWRENCE FISHER, DANIELLE HESSLER, JOSEPH MULLAN, RUSSELL GLAS-GOW, PATRICIA AREAN, UMESH MASHARANI, San Francisco, CA, Bethesda, MD
Diabetes distress (DD) refers to the emotional burdens that are part of the spectrum of patient diabetes experience. DD is common, is distinct from de-pression and has been associated with a variety of glycemic and behavioral markers. Reducing Distress and Enhancing Effective Management (REDEEM) was a 3-arm clinical trial to reduce DD among patients with type 2 diabetes. Following baseline assessment, patients were randomized to one of three interventions: a Computer Automated Self-Management program (CASM) that helps establish behavioral goals, address barriers and monitor progress; CASM plus problem-solving therapy (CAPS), a CBT program to address DD directly; and Leap Ahead (LA), an attention control health risk screening. Patients then received 4 live support calls at 2, 4, 6 and 8 weeks, followed by a 4-month assessment, a booster at 5 months, 4 more live support calls at weeks 24, 28, 36, 44, and fi nal assessment at 12 months. Inclusion criteria were T2DM >12 months, moderate DD (>1.5 DDS score), age >21, read and speak English, screen out for clinical depression (PHQ8 <15). Using MLM, ITT analyses analyzed changes in DD at 0-4, and 4-12 months on the Regimen Distress (RD) and Emotional Burden (EB) subscales of the Diabetes Distress Scale. With 0-12 month attrition at 8.4% and controlling for demographics, signifi cant decreases in both RD and EB occurred for the entire sample at 0-4 and 4-12 months (p< .002), but no signifi cant between-group differences in reductions in RD or EB occurred for either time period. However, a signifi cant Group By Baseline RD interaction at 0-4 months (p=.009) indicated that those with high DD at baseline achieved greater reductions in RD in CAPS than in CASM (p = .01) or LA (p=.007). These reductions were uniformly maintained between 4-12 months. There was no signifi cant Group By Baseline EB inter-action. Findings indicate that management support alone does not decrease DD, but that a combination of management support and focused DD problem solving signifi cantly reduces DD, with maintenance over time.
Supported by: NIH (DK061937)
343-ORDiabetes Nurse Case Management and Motivational Interviewing for Change (DYNAMIC Study): Results of a 2-Year RCTRAQUEL M. ANEL-TIANGCO, ALAN ADELMAN, CHERYL DELLASEGA, ROBERT A. GABBAY, Hershey, PA
Nurse case management (NCM) and motivational interviewing (MI) are two approaches that have been used in the management of chronic medical conditions like diabetes. NCM is a collaborative process that provides and coordinates health care to decrease fragmentation. MI is a teachable meth-od to counsel patients on behavior change by enhancing the intrinsic motiva-tion to change. The data thus far on their effects on clinical outcomes have been inconclusive. The aim of this study was to determine if the addition of nurse case management and motivational interviewing to usual primary care would result in improved outcomes over two years in high risk patients with type 2 diabetes. A 2-year randomized controlled trial was conducted in diabetes patients from 12 primary care clinics. Patients were randomized to usual care control (n=313) or the intervention (n= 232) who received addi-tional NCM care, including self-management education, MI-guided behavior change counseling and prompting PCPs to implement diabetes guidelines. All nurse case managers received intensive training in MI with an ongoing assessment of fi delity. At the end of 2 years, systolic BP was better in the intervention group than the control group (131±15.9 vs. 135±18.2, p < 0.05). HbA1c, LDL, and diastolic BP improved in both groups: HbA1c (control group
psychosocial measurements, were genotyped for 23 SNPs associated with T2D, and wore a combined heart rate and movement sensor (Actiheart) con-tinuously for 6 days and nights to assess PA. They were randomized to receive either standard lifestyle advice alone (control group, n=190), or in combina-tion with a genetic (n=189) or phenotypic (n=190) risk estimate for T2D. PA (energy expenditure in kJ/kg/day), fruit and vegetable (FV) consumption (g/day), self-reported weight (kg), intention to increase PA and FV consumption (5-point scale), anxiety (State-Trait Anxiety Inventory), and diabetes related worry (24-point scale) were remeasured 8 weeks after randomization. We assessed intervention effects by regression analysis, adjusted for baseline values. 557 (98%) participants completed the trial. Comparing the combined intervention groups with the control group, no effect was observed on PA ( =1.15, 95% CI:-1.34 to 3.65, p=0.37), FV consumption ( =-4.08, 95% CI:-37.3 to 29.1), self-reported weight ( =-0.06, 95% CI:-0.63 to 0.51), intentions (PA: =0.01, 95% CI: -0.09 to 0.11; FV consumption: =0.02, 95% CI:-0.07 to 0.11), anxiety ( =-0.29, 95% CI:-1.77 to 1.19), and diabetes related worry ( =0.16, 95% CI:-0.12 to 0.45). There was no difference in outcomes between intervention groups. Information about genetic or phenotypic risk of T2D is not associated with changes in behavior or anxiety in the short term, and it is unlikely to enhance T2D prevention strategies.
340-ORThe Effect of Community-Based Peer Support in Achieving and Maintaining Weight Loss Following Lifestyle InterventionGRETCHEN A. PIATT, MIM C. SEIDEL, ROBERT POWELL, JANICE C. ZGIBOR, Ann Arbor, MI, Pittsburgh, PA
The obesity epidemic continues to rise worldwide, putting the health of communities in jeopardy. Effective, sustainable models should be identifi ed and implemented at the community level to address this burden. We aimed to determine the effectiveness of a community-based peer support (CBPS) model in achieving and maintaining weight loss following a lifestyle inter-vention in 8 rural communities in southwestern, Pennsylvania. Communities and their eligible participants (n=493; mean age: 51 yrs, 87.6% female, 94.1% Caucasian, 86.8% BMI 30 kg/m2) were assigned to 4 lifestyle groups: Face to Face (n=119), DVD (n=113), internet (n=101), and self-selection (n=101). Self selection participants were empowered to select the modality (60% chose face to face, 40% chose internet, 0% chose DVD). CBPS was defi ned as sup-port provided within the context of the community, not within a healthcare organization. Each of the 8 communities had one peer leader (PL) to support participants. Three of the 8 PL were community-based. Data were collected at baseline, 3, 6, and 12 months. At 3 months, CBPS participants lost an average of 1.6 lbs more than non-CBPS participants (p=0.12). As support continued over time, CBPS participants lost an average of 2.2 lbs more at 6-months (p=0.09) and an average of 2.8 lbs more at 12-months (p=0.02). Af-ter controlling for baseline weight, age, CBPS, SF12 scores, exercise and life-style group, CBPS participants were 3.6 times (p=0.03) more likely to achieve signifi cantly more weight loss at 3-months, 4.6 times (p=0.04) at 6-months, and 4.5 times (p=0.04) at 12-months compared to non-CBPS participants. Despite the lifestyle group, participants who received CBPS achieved and maintained signifi cantly greater weight loss compared to non-CBPS partici-pants. As programs that include PLs are implemented worldwide, increased attention should be placed on the importance of the PL within the context of the community, not just the health system.
Supported by: The Air Force Surgeon General
341-ORWeight Loss for Metabolic Syndrome in Primary Care: Results from the SHINE Telephone Translation of the Diabetes Prevention Pro-gram (DPP)RUTH S. WEINSTOCK, PAULA M. TRIEF, DONALD CIBULA, LINDA DELAHANTY, PHILIP MORIN, Syracuse, NY, Boston, MA
SHINE (Support, Health Information, Nutrition and Exercise) is a random-ized weight loss trial (n=257) of 2 telephone interventions, based on the DPP, delivered through 5 primary care sites. Telephone delivery was used to increase reach. Participants were randomized to receive the DPP life-style change program, participating individually by phone (solo; n=129; 114 received intervention) or in a group by conference call (n=128; 123 received intervention). The 16 session DPP curriculum was delivered over 1 year by trained primary care staff, with continued contact in year 2. Six and 12 month data are presented. Participants’ data were: mean age 51.8 yrs, 74.3% fe-male, 85.6% white, 12.8% African American, 1.2% Hispanic, 44.1% em-ployed, 22.4% retired, 53.2% married, 46.3% high school graduates, 36.9% annual income <$30,000. At baseline, participants had metabolic syndrome

A90
For author disclosure information, see page 797. ADA-Funded Research
ORA
LSINSULIN ANALOGS
the SKYPE group. ANCOVA identifi ed no signifi cant between-group differ-ences for parent or youth-reported DSMP scores. Findings suggest no sta-tistically signifi cant differences between SKYPE and CLINIC based delivery of BFST-D for youths with poorly controlled T1DM, supporting either delivery method as effective.
INSULIN ANALOGS
346-ORThe Novel Long-Acting Insulin LY2605541 is Superior to Insulin Glargine in Lowering Intra-Day Glucose Variability and Hypoglyce-mia Event Rate from Continuous Glucose Monitoring (CGM) in Pa-tients With Type 2 DiabetesEDWARD J. BASTYR, RICHARD M. BERGENSTAL, JULIO ROSENSTOCK, MELVIN J. PRINCE, YONGMING QU, SCOTT J. JACOBER, Indianapolis, IN, Minneapolis, MN, Dallas, TX
The basal insulin analog LY2605541 (LY) is PEGylated insulin lispro de-signed to have a large hydrodynamic size which delays insulin absorption and reduces clearance, resulting in prolonged duration of action. Hypoglyce-mia and glucose variability were assessed with CGM of interstitial glucose (IG) in a subset of patients from a Phase 2, randomized, open-label, parallel study of LY (n=51) or insulin glargine (GL, n=25). CGM was conducted on 3 consecutive days (72-84 hrs) during the week before Week 0, 6, and 12 study visits. IG intra-patient intra- and inter-day standard deviations (SD) during nocturnal (2400-0600 hrs) and diurnal (0600-2400 hrs) periods were calcu-lated to assess glucose variability. A hypoglycemia episode was defi ned as IG 70 mg/dL and continued until IG > 70 mg/dL for 15 min (or 3 time points). All statistical comparisons were tested at 2-sided alpha = 0.1. At 12 weeks, LY-treated patients spent less time with IG below 70 mg/dL than GL-treated patients during the nocturnal period (11 ± 5 v 38 ± 13 min, p=.024) and during the 24-hr period (25 ± 6 v 83 ± 16 min, p<.001). Signifi cantly fewer LY- than GL-treated patients experienced any hypoglycemia (50.0% v 78.3%, p=.036), including nocturnal hypoglycemia (20.5% v 47.8%, p=.027), based on CGM. At 12 weeks, both treatments resulted in similar mean glucose values, as indicated by the area under the IG curve, during the 24-hr period (LY: 11601 mmol/L · min; GL: 11286 mmol/L · min). LY-treated patients had signifi cantly lower intra-day glucose SD at 12 weeks compared to GL-treated patients for both nocturnal (1.00 ± 0.07 v 1.35 ± 0.16 mmol/L, p=.061) and diurnal (2.03 ± 0.10 v 2.50 ± 0.18 mmol/L, p=.039) periods. In conclusion, by CGM, LY treat-ment compared to GL resulted in: less time spent in hypoglycemia, fewer pa-tients experiencing hypoglycemia, and lower intra-day glucose variability.
347-ORReduced Nocturnal Hypoglycemia and Weight Loss With Novel Long-Acting Basal Insulin LY2605541 Compared With Insulin Glargine in Patients With Type 2 DiabetesRICHARD M. BERGENSTAL, JULIO ROSENSTOCK, RICHARD F. ARAKAKI, MELVIN J. PRINCE, YONGMING QU, VIKRAM P. SINHA, DANIEL C. HOWEY, SCOTT J. JA-COBER, Minneapolis, MN, Dallas, TX, Honolulu, HI, Indianapolis, IN
The basal insulin analog LY2605541 (LY) is PEGylated insulin lispro de-signed to have a large hydrodynamic size which delays insulin absorption and reduces clearance, resulting in prolonged duration of action. This 12-wk, Phase 2, randomized, open-label, parallel study evaluated whether self-monitored FBG was lower with once-daily LY than insulin glargine (GL). Pa-tients (pts) converted to AM insulin administration during lead-in and were randomized 2:1 to AM administration of LY (n=195) or GL (n=93) from basal insulin (GL: n=248, NPH: n=39). At baseline, for LY v GL, mean ± SE FBG was 147 ± 3 v 140 ± 4 mg/dL, A1C was 7.7 ± 0.1 v 7.8 ± 0.1%, and weight was 90.7 ± 1.4 v 89.7 ± 2.1 kg. At wk 12, LY v GL resulted in similar mean FBG (118 ± 2 v 117 ± 3 mg/dL, p=.433), and mean A1C (7.0 ± 0.06 v 7.2 ± 0.09%, p=.279). Intra-day BG variability, as measured by 8-point self-monitored BG standard deviation, was reduced with LY (34 ± 1 v 39 ± 2 mg/dL, p=.031). LY pts had signifi cant mean weight loss (-0.58 ± 0.16 kg, p=.007), while GL pts gained weight (0.31 ± 0.18 kg, p=.66; LS mean difference: -0.84 kg, p=.001). Mean hypoglycemia rate (#/30d) with LY was not different compared to GL (total: 1.34 v 1.52; p=.80; nocturnal: 0.25 v 0.39, p=.18). After adjusting for base-line nocturnal hypoglycemia, LY pts had a 48% rate reduction in nocturnal hypoglycemia events compared to GL (p=.021). Adverse events were similar across treatments. Mean increases in ALT and AST were higher with LY v GL (p<.01), but remained in normal range. Triglyceride (TG) change from baseline was not signifi cant for either group, but endpoint TGs were higher with LY v GL (p<.01). There was no difference in LDL-C or HDL-C between treatments. In conclusion, LY provided similar glycemic control, with reduced intra-day
9.1% to 8.0%, intervention group 8.8% to 7.8%), LDL (control group 127 to 100 mg/dL, intervention group 128 to 102 mg/dL), diastolic BP (control group 78 to 74 mm Hg, intervention group 80 to 74 mm Hg). Screening for com-plications improved signifi cantly in the intervention group compared to the control group: foot exam, ophthalmologic exam, and nephropathy screening.NCM and MI improved systolic BP and complications screening. The large decrease in HbA1C and LDL in the control group may have obscured any fur-ther intervention effect. Although nurses prompted providers for medication titration, strategies to reduce provider clinical inertia might also be needed.
Supported by: NIDDK (R18-DK067495)
344-ORInternet Programs for Youth With Type 1 Diabetes (T1D) Improve OutcomesMARGARET GREY, ROBIN WHITTEMORE, SANGCHOON JEON, SARAH JASER, KATHRYN MURPHY, MELISSA FAULKNER, ALAN DELAMATER, New Haven, CT, Philadelphia, PA, Tucson, AZ, Miami, FL
The purpose of this trial was to compare the effectiveness of TEENCOPE™
(internet coping skills training) with MANAGING DIABETES (internet educa-tion program) for youth with T1D on A1C, self-management, self-effi cacy, stress, coping, quality of life (QOL), & family confl ict over 12 month follow-up. Mediators of improved outcomes were also explored. Teens with T1D (n=320, 11-14 years) from 4 sites were randomly assigned to one of the pro-grams & completed baseline, 3, 6, and 12 month data via the internet. A1C was obtained from clinic records. Teens were 12.3 +1.1 yrs old, with T1D duration 6.1 + 3.5 yrs, A1C 8.3 +1.5%, 60% on pump therapy, 55% female & 62% non-Hispanic White. Groups were comparable at baseline. Participa-tion (78% completed 4 of 5 sessions) & satisfaction were high. Data were analyzed with mixed models. Teens in both groups reported a signifi cant increase in diabetes problem-solving (p<.01), goal setting (p<.01), self-effi cacy (p<.001), and QOL (p<.001) along with a decrease in collaboration with parents (p<.001) and stress (p<.01) after controlling for race, income, gender, age, duration, therapy type, and site. Teens participating in MAN-AGING DIABETES reported a signifi cant improvement in social acceptance over time (p<.001) and less family confl ict (p<.05) than those in TEENCOPE. Teens participating in TEENCOPE reported better communication (p<.05) and coping (p<.01) over time. A1C did not deteriorate in either group. Improve-ments in self-management, self-effi cacy, perceived stress, and coping medi-ated the effect of TEENCOPE on QOL. Improvements in self-effi cacy, social competence, and family confl ict mediated the effect of MANAGING DIABE-TES on QOL. Participation in both internet programs was excellent & led to improved psychosocial outcomes after 12 months in ethnically diverse youth with T1D. Thus, young teens may benefi t from both diabetes-specifi c coping and educational internet programs. Results of the mediation analysis begin to identify the mechanisms by which programs improve QOL.
Supported by: NINR #R01NR004009
345-ORCan You Hear (and See) Me Now? Skype-Based Intervention for Teens With Poorly Controlled DiabetesMICHAEL A. HARRIS, KURT A. FREEMAN, DANNY C. DUKE, BETH HIRSCHFIELD, BRUCE BOSTON, Portland, OR
This study examined the relative effectiveness of a behavioral-based family therapy intervention for diabetes (BFST-D) delivered via tele-health (SKYPE) or face-to-face (CLINIC) for youth with poorly controlled diabetes (< 9.0%) and their families. Seventy three youth (M age 15.1 years, SD=1.8) and their parents participated. Of youth in the study, 85% of were Caucasian, 44% were female, and 36% resided in single-parent homes. They had mean duration of DM of 6.8 years (SD=3.7) and a mean baseline HbA1c of 11.2% (SD=1.7%). At baseline and post-treatment, youth and parents completed the Diabetes Self Management Profi le (DSMP), an assessment of diabetes treatment adherence, and HbA1c values were collected. Results showed no difference in the number of BFST-D treatment sessions completed across SKYPE (9.9) vs CLINIC (6.9). Three separate ANCOVAs were performed with treatment condition serving as the independent variable and baseline HbA1c value and youth and parent-reported DSMP total scores serving as the co-variates. From baseline to post-treatment, HbA1c declined by an average of 0.76% for the CLINIC group and an average of 0.40% for the SKYPE group. ANCOVA yielded no signifi cant between-group differences. From baseline to end of treatment, youth-reported DSMP scores increased by an average of 5.8 points for the CLINIC group and by an average of 2.9 points for the SKYPE group. ANCOVA identifi ed no signifi cant between-group difference. From baseline to end of treatment, parent-reported DSMP scores increased by an average of 28 points for the CLINIC group and by an average of 21 points for

A91
For author disclosure information, see page 797.ADA-Funded Research
ORA
LS
INSULIN ANALOGS
Supported by: Novo Nordisk A/S
350-OREvaluations of Modifi ed Ultra-Rapid Acting LinjetaTM Formulations BIOD-105 and BIOD-107 in Patients With Type 1 DiabetesJESSICA R. CASTLE, LINDA MORROW, AMY PITTS, JOSEPH EL YOUSSEF, LORI BLANCHFIELD, PHILIP PICHOTTA, MARCUS HOMPESCH, W. KENNETH WARD, ALAN KRASNER, Portland, OR, Chula Vista, CA, Danbury, CT
Human insulin formulations containing citrate and EDTA (Linjeta) are more rapidly absorbed but cause increased injection site discomfort compared to insulin lispro (IL). BIOD-105 and BIOD-107 are formulations similar to Linjeta but with the addition of calcium to lessen subcutaneous EDTA-calcium bind-ing post-injection, which we hypothesized as the cause of discomfort. These formulations were compared to IL in two single-center, randomized, double-blind, three-period crossover euglycemic glucose clamp trials. Study 1 was completed in 18 and Study 2 in 8 subjects with type 1 diabetes. In Study 1, 0.15 u/kg of each insulin was administered by SC injection and in Study 2, the same dose was given via insulin pump. Insulin profi les in Study 1 showed more rapid initial absorption of BIOD-105 and -107 relative to IL (t1/2-early = 15.3, 16.6, and 23.7 min, respectively, p<0.001). BIOD-105 and -107 exhibited lower peak metabolic effects relative to IL (GIRmax = 5.8, 6.4, and 7.2 mg/kg/min, p<0.05) and slower declines in metabolic action (t1/2 GIR-late= 279, 281, and 211min, p<0.001). When given via pump, BIOD-105 also showed faster absorption and lower peak effect relative to IL. The BIOD-107 peak was similar in magnitude but longer in duration vs. IL. In Study 1, there were no signifi cant differences in injection site tolerability as assessed by visual analog scores between BIOD-105, BIOD-107 and IL (LS means 4.8 ± 1.5, 2.5 ± 1.5, and 2.2 ± 1.5 mm). Study 2 showed no signifi cant differences in bolus or basal infusion discomfort. In summary, BIOD-105 and BIOD-107 resulted in local injection discomfort com-parable to that of IL. While these formulations exhibited more rapid initial ab-sorption, lower peaks and longer durations of effect compared to IL were seen. We conclude that the choice or concentration of the cation associated with the chelating agent EDTA can affect the PK/PD and tolerability of human insulin. Alternative formulation variants are currently being explored.
351-ORLiver Preferential Effects of an Insulin Analog Demonstrated by In-sulin Receptor Phosphorylation and Glucose Dynamics in Insulin Target Tissues In VivoCHRISTIAN L. BRAND, STEPHAN D. BOUMAN, JONAS KILDEGAARD, THOMAS KJELDSEN, PETER MADSEN, HELLE NAVER, CLAUS B. JEPPESEN, JOHANNES J. FELS, JEPPE STURIS, ERICA NISHIMURA, Maaloev, Denmark
Compared to the distribution of endogenously secreted insulin throughout the body, subcutaneous (sc) insulin is distributed in a non-physiological man-ner to the insulin target tissues with the peripheral tissues being relatively overexposed to insulin compared to the liver, resulting in increased risk of hypoglycemia. The present study investigates a novel insulin analog (insulin 327) and its potential liver preferential effects compared to human insulin (HI) in rodents. Insulin receptor phosphorylation (pIR) was measured in liver, muscle and fat tissues at 0, 5, 15, 60, 120 and 180 min after intravenous (iv) injection of either HI or insulin 327 in conscious male NMRI mice. For similar glucose lowering, insulin 327 exerted a liver preferential pIR pattern as the response in liver accounted for 71% of the combined pIR response (AUC) in all tissues compared to 43% for HI. The dynamic rates of glucose uptake (GU) and hepatic glucose production (HGP) were determined by 3H-glucose techniques during 5 hrs of three different constant iv infusion rates of either HI or insulin 327 and variable glucose infusion rates (GIR) to maintain euglycemic clamp in conscious male Sprague Dawley rats. The potency of insulin 327 relative to HI was calculated as the ratio between their ED50 values calculated by fi tting
variability and lower nocturnal hypoglycemic events compared to GL in pts with T2D. While improving glycemic control, LY resulted in weight loss.
348-ORAltering the Time of Day of Once-Daily Dosing of Insulin Degludec Achieves Similar Glycemic Control and Safety Compared to Dosing the Same Time of Day in People With Type 1 DiabetesDAVID L. RUSSELL-JONES, PRISCILLA HOLLANDER, BRESTA MIRANDA-PALMA, JOHN G. COOPER, EDWARD FRANEK, STEPHEN BAIN, CHRISTIAN B. DJURHUUS, SØREN C. TAMER, CHANTAL MATHIEU, Guildford, Surrey, United Kingdom, Dallas, TX, Miami, FL, Stavanger, Norway, Warsaw, Poland, Swansea, United Kingdom, Bagsvaerd, Denmark, Leuven, Belgium
To date, consistent timing of basal insulin injection is needed to ensure stable day to day glycemic control. Insulin degludec (IDeg) provides an ultra-long, fl at action profi le, enabling fl exible dosing to accommodate an indi-vidual patient’s lifestyle. In this 26-week, open-label, treat-to-target trial in people with type 1 diabetes (T1DM), once-daily (OD) IDeg (N=165), admin-istered with the evening meal, was compared to a forced-fl exible dosing regimen of IDeg (Flex) (N=164) where subjects alternated insulin administra-tion timing between morning and evening to create intervals of 8 to 40 hrs between insulin doses. Mean baseline values for HbA1c (both groups 7.7%), FPG (172.7 vs 179.4 mg/dL), disease duration (17.3 vs 20.0 yrs), age (42.6 vs 44.5 yrs), and BMI (27.0 vs 26.4 kg/m2) were comparable between IDeg Flex and IDeg OD groups, respectively. At 26 weeks, 84% of individuals in both groups completed the trial. Both IDeg Flex and IDeg OD reduced HbA1c by 0.4% (estimated treatment difference [ETD] Flex-OD: 0.01% [95% CI: -0.13; 0.14]). FPG reductions were greater with IDeg OD (-23.0 and -45.7 mg/dL, respectively (ETD: 17.1 [2.6; 31.6]; p=0.0207). Overall hypoglycemia rates (PG <56 mg/dL or severe hypoglycemia) were similar (82.4 vs 88.3 events/patient-yr; estimated rate ratio (ERR) Flex/OD: 0.92 [0.76; 1.12]). Nocturnal hypoglycemia rates (6.2 vs 9.6) were signifi cantly lower with IDeg Flex (ERR: 0.63 [0.46; 0.86]; p=0.0031). Severe hypoglycemia rates were similar for both groups, as were adverse event rates. Final IDeg doses were 0.42 (Flex) and 0.38 (OD) U/kg/day. IDeg can be administered in a once-daily regimen but at a different time from day to day with no difference in glycemic control or safety compared to standard OD dosing. Greater dosing fl exibility may represent a major improvement in patient convenience by allowing injection times to be changed daily according to needs of the individual.
349-ORInsulin Degludec 200 U/ml is Ultra-Long-Acting and has a Flat and Stable Glucose-Lowering EffectTIM HEISE, LESZEK NOSEK, ULRIKE HÖVELMANN, SUSANNE G. BØTTCHER, HANNE HASTRUP, HANNE L. HAAHR, Neuss, Germany, Søborg, Denmark
Insulin degludec (IDeg) is a new-generation, ultra-long-acting basal insu-lin, which is developed as both 100 U/ml and 200 U/ml in order to accommo-date the wide range of insulin dose requirements characteristic of diabetes mellitus, especially type 2 diabetes. With IDeg 200 U/ml, up to 160 U of IDeg can be administered in a single injection using a newly developed prefi lled pen. We investigated the pharmacodynamic and pharmacokinetic proper-ties of 0.6 U/kg IDeg 200 U/ml in subjects with type 2 diabetes (n=16, mean: BMI, 30 kg/m²; A1C, 7.3%) who received IDeg 200 U/ml once daily over 6 days. On Day 6 while at steady state, a 26-h euglycemic glucose clamp was conducted (Biostator; clamp blood glucose level: 90 mg/dl). As previously shown for IDeg 100 U/ml (Nosek et al. Diabetologia 2011;54, Suppl.1:S429), the mean glucose infusion rate (GIR) profi le for IDeg 200 U/ml was fl at and stable over the dosing interval (Fig. 1). The glucose-lowering effect of IDeg was evenly distributed over the dosing interval, with AUCGIR for each of the two 12-h intervals being approximately 50% of the total AUC (AUCGIR, ,SS).The effect of IDeg extended beyond 26 h in all subjects, as blood glucose stayed close to the target level throughout the clamp. The terminal half-life at steady state was 26.2 h. IDeg 200 U/ml was well tolerated and safe, with no injection site reactions. In conclusion, IDeg 200 U/ml has a fl at and stable glucose-lowering effect with a duration of action beyond 26 h in people with type 2 diabetes.

A92
For author disclosure information, see page 797. ADA-Funded Research
ORA
LSGENOTYPE-PHENOTYPE CORRELATIONS
Adverse events were comparable between treatments and Analog-PH20 was well tolerated.
GENOTYPE-PHENOTYPE CORRELATIONS
354-ORMeta-Analysis of Type 2 Diabetes Genome-Wide Association Stud-ies in African Americans: The MEDIA ConsortiumMAGGIE C. NG, DANIEL SHRINER, PING AN, LOREN L. ARMSTRONG, LAWRENCE F. BIELAK, SUZETTE J. BIELINSKI, INGRID BORECKI, BRIAN H. CHEN, YII-DER I. CHEN, WEI-MIN CHEN, STEVEN R. CUMMINGS, DANIEL S. EVANS, XIUQING GUO, GEOFFREY HAYES, RICHARD A. JENSEN, EDMOND K. KABAGAMBE, CARL D. LANGEFELD, JIANKANG LIU, SIMIN LIU, JIRONG LONG, MICHAEL A. NALLS, NICHOLETTE D. PALMER, SANJAY R. PATEL, LESLIE J. RAFFEL, MICHELE SALE, YAN V. SUN, LAURA J. RASMUSSEN-TORVIK, LISA R. YANEK, LINGYAO YANG, THE MEDIA CONSORTIUM, Winston-Salem, NC, Bethesda, MD, St. Louis, MO, Chi-cago, IL, Ann Arbor, MI, Rochester, MN, Los Angeles, CA, Charlottesville, VA, San Francisco, CA, Seattle, WA, Birmingham, AL, Jackson, MS, Nashville, TN, Cleve-land, OH, Atlanta, GA, Baltimore, MD
The prevalence of type 2 diabetes (T2D) in African American (AfA) adults is almost twice that of European Americans (18.7% vs. 10.2%). Despite this dis-parity, efforts to identify T2D genes in AfA have been restricted partly due to available sample sizes. We formed the “Meta-analysis of Type 2 Diabetes in African Americans (MEDIA) Consortium” to perform meta-analysis of 17 ge-nome-wide association studies (GWAS) for T2D in a large well phenotyped and comprehensively genotyped AfA sample. Discovery analysis included 8,272 T2D cases diagnosed by the ADA 2004 criteria and 16,079 controls. In each study, up to 1M SNPs were genotyped. To increase genomic coverage and account for admixture in AfA, we performed imputation with combined HapMap Phase II+III CEU and YRI reference data and carried out principal components analysis. Using up to 2.9M genotyped and imputed SNPs, we tested for association with T2D under the additive genetic model, adjusting for age, sex, study site, population structure, and with or without BMI. Each study was corrected for genomic control ( = 1.01-1.10) before association results were combined using an inverse variance-weighted fi xed effect mod-el. Combined results were corrected for residual population stratifi cation by a second genomic control ( = 1.06). We identifi ed 30 loci associated with T2D at p 1×10⁻⁵, of which 26 were novel. Genome-wide signifi cant SNPs (p < 5×10⁻⁸) were observed at the known T2D loci TCF7L2 (rs7903146) and KCNQ1 (rs2283228), with odds ratios (ORs) of 1.36 (p = 2.2×10⁻²⁶) and 1.24 (p = 4.3×10⁻⁸), respectively. SNPs at the known loci INS-IGF2 (rs3842770) and HMGA2 (rs343092) also showed strong associations, with ORs of 1.18 (p = 7.8×10⁻⁸) and 1.18 (p = 7.3×10⁻⁷), respectively. Replication studies are under-way. These fi ndings provide insight into the genetic architecture of T2D in AfA, demonstrating the potential for new discovery from genetic association studies in populations with predominantly African ancestry.
355-ORMeta-Analysis of 211,221 Individuals Identifi es Novel Waist-Hip Ratio Loci Including Those Involved In Adipogenesis and Type 2 DiabetesDMITRY SHUNGIN, TERESA FERREIRA, DAMIEN C. CROTEAU-CHONKA, THOM-AS W. WINKLER, REEDIK MAGI, JOSEPH WU, RONA J. STRAWBRIDGE, ADAM E. LOCKE, KRISTA FISCHER, TSEGASELASSIE WORKALEMAHU, PAULA J. GRIF-FIN, CHARLES C. WHITE, ANNE U. JACKSON, FELIX DAY, M. CAROLA ZILLIKENS, CAROLINE S. FOX, ERIK INGELSSON, MARK I. MCCARTHY, KARI E. NORTH, ELIZ-ABETH K. SPELIOTES, PAUL W. FRANKS, ADRIENNE L. CUPPLES, LU QI, IRIS M. HEID, RUTH J. LOOS, INES BARROSO, KAREN L. MOHLKE, CECILIA M. LINDGREN, GIANT CONSORTIUM THE GENETIC INVESTIGATION OF ANTHROPOMETRIC TRAITS, Malmo, Sweden, Umea, Sweden, Oxford, United Kingdom, Chapel Hill, NC, Regensburg, Germany, Boston, MA, Stockholm, Sweden, Ann Arbor, MI, Tartu, Es-tonia, Cambridge, United Kingdom, Rotterdam, The Netherlands, Framingham, MA, Cambridge, MA, Hinxton, United Kingdom
Waist-hip ratio (WHR), a measure of adipose tissue distribution, is associ-ated with risk of type 2 diabetes (T2D) and other metabolic and cardiovascular
the insulin infusion rates and the corresponding response values to Sigmoidal curves. The potency of insulin 327 on GIR during the last hr of the clamp was 59% relative to HI. The potency of insulin 327 relative to HI on AUCs for HGP and GU was 77% and 37%, respectively, indicating a more potent suppression of HGP than stimulation of GU. These data demonstrate that insulin 327 exerts liver preferential pIR and glucose dynamic patterns compared to HI in rodents, and may therefore represent a novel basal insulin regimen with with a poten-tial for improving the hypoglycemia safety margin.
352-OREffect of Peripheral Delivery of a Liver Preferential Insulin Analog on Glucose and Fat MetabolismDALE S. EDGERTON, MELANIE SCOTT, JOSHUA ROOP, DOSS NEAL, PHILLIP WILLIAMS, THOMAS KJELDSEN, PETER MADSEN, HELLE NAVER, CLAUS B. JEPPESEN, ERICA NISHIMURA, CHRISTIAN L. BRAND, ALAN D. CHERRINGTON, Nashville, TN, Copenhagen, Denmark
Endogenous insulin secretion exposes the liver to concentrations of insulin which are ~2.5-fold greater than at non-hepatic tissues. Subcutaneous insu-lin delivery eliminates this gradient and is associated with metabolic abnor-malities. Thus, restoring the physiologic gradient may provide a therapeutic benefi t. The hepato-selectivity of a novel insulin analog (insulin 327) was tested. Dogs with arterial, portal vein and hepatic vein catheters were stud-ied after an 18h fast. 3H-glucose was infused from -140 min. After a basal period (-40 to 0 min) somatostatin and basal portal glucagon were infused (0 to 300 min). At the same time insulin 327 or human insulin (HI) was infused into a peripheral vein (7.2 or 1.8 pmol/kg/min, respectively; n=5/group) and euglycemia was maintained by glucose infusion. Arterial insulin 327 and HI levels increased to 10870±2543 and 95±8 pmol/l, respectively. Although the glucose infusion rates were similar in insulin 327 and HI (3.1±0.3 vs 3.1±1.6 mg/kg/min, respectively, last 3h), insulin 327 had a greater effect on the liver and a lesser effect on non-hepatic tissues compared to HI. Relative to the basal period, insulin 327 suppressed net hepatic glucose balance and glucose Ra (mg/kg/min; last 3h) by 1.9±0.1 and 1.7±0.1, respectively, while HI reduced these by only 0.5±0.6 and 1.1±0.3. On the other hand, insulin 327 only increased non-hepatic glucose uptake and glucose Rd (mg/kg/min; last 3h) by 1.0±0.4 and 1.5±0.3, respectively, while HI increased these by 2.4±1.2 and 2.5±1.1. Suppression of lipolysis was delayed with insulin 327 compared to HI: during the 1st hour plasma NEFA levels (μmol/l) decreased by 91±37 vs 419±42, respectively, and blood glycerol levels (μmol/l) fell by 0±7 vs 39±5, respectively. During the last 3h, however, there were no differences in the suppression of lipolysis by insulin 327 compared to HI. These results dem-onstrate the effi cacy of a peripherally delivered insulin analog designed to preferentially target liver glucose metabolism.
353-ORHuman Hyaluronidase + Rapid Analog Insulin (RAI) Improves Post-prandial Glycemic Control in Type 1 Diabetes (T1DM) Compared to Insulin Lispro AloneIRL B. HIRSCH, JAY S. SKYLER, SATISH GARG, THOMAS BLEVINS, DANIEL E. VAUGHN, DOUGLAS B. MUCHMORE, Seattle, WA, Miami, FL, Aurora, CO, Austin, TX, San Diego, CA
Recombinant human hyaluronidase (rHuPH20) accelerates absorption & ac-tion of prandial insulins. We compared control in T1DM using prandial lispro or RAI+rHuPH20 (Analog-PH20). After a 4-6 week run-in using prandial glulisine + bid glargine, 117 subjects (age 43±14 years, BMI 27.3±4.7, A1C 7.0±.5) were randomized (double blind crossover) to lispro+rHuPH20 or aspart+rHuPH20 vs lispro alone for two 12 wk intensive management periods; prandial doses were immediately before meals. Primary endpoint of A1C noninferiority (.4% margin) was achieved with no treatment difference (95% CI -.05, +.15). Mean postmeal (90 min) excursions were reduced by 82% (p=.0044) over the 12 week period with more subjects consistently (at least 2/3 of meals) achieving goals:
(% of Subjects at Goal)90 min Postprandial Goal (mg/dL) Analog-PH20 Lispro p-value<180 Breakfast 70.5 54.0 .003<180 All Meals 70.8 59.3 .016<140 Breakfast 21.4 10.6 .007<140 All Meals 15.0 8.8 .089
Continuous monitoring over 3 days at the end of treatment showed improved excursion profi les (Fig.). Overall hypoglycemic rates ( 70 mg/dL or symptoms) were reduced 5% (p=.035) and events <56 mg/dL reduced 7% (p=.045). Total daily insulin dose (54±27 for Analog-PH20 vs 56±27 U for lispro, p=.057) and weight gain difference (-.57 lb, p=.27) showed favorable trends.

A93
For author disclosure information, see page 797.ADA-Funded Research
ORA
LS
GENOTYPE-PHENOTYPE CORRELATIONS
regions containing many transcripts and potential functional variants. In this study, we combined “Metabochip” and GWAS data from 34,840 cases and 114,981 controls (European descent, except 1,178 cases and 2,472 controls of Pakistani descent) to fi ne-map causal variants across 35 T2D susceptibility loci. We detected two loci with independent association signals (r 2<0.05) at genome-wide signifi cance (p<5x10⁻⁸) that lie outside the recombination in-terval containing the lead SNP. Both signals at KCNQ1 (rs163184, p=1.2x10⁻¹¹;rs231361, p=1.2x10⁻⁹; r 2=0.01) have been previously reported, but at CDKN2A/B(rs10811661, p=3.7x10⁻²⁷; rs944801, p=2.4x10⁻⁹; r 2=0.01), the secondary signal is novel. We also observed independent association signals (p<10-5) at two further loci: DGKB (rs17168486, p=5.9x10⁻¹¹; rs6960043, p=3.4x10⁻⁷; r 2=0.01) and MC4R (rs12970134, p=1.2x10⁻⁸; rs11873305, p=3.8x10⁻⁷; r 2=0.02). Ap-proximate conditional analyses also provided evidence of additional associa-tion signals in the same recombination interval as the lead SNP at KCNQ1(rs74046911, p=3.7x10⁻⁹, r 2=0.06) and CDKN2A/B (rs10757283, p=4.7x10⁻³⁰,r 2=0.36). Across the 35 susceptibility loci, we found no evidence that lead Metabochip SNPs were characterised by substantially lower allele frequency and higher odds ratio than previously reported GWAS SNPs. At 24 loci, the GWAS SNP was the same, or highly correlated (r 2>0.8), with the lead Me-tabochip SNP (of which 17 have r 2>0.95). Of the remaining 11 loci, the lead Metabochip and GWAS SNPs were uncorrelated at just two, DGKB (r 2=0.00) and KCNQ1 (r 2=0.03), because they map to the independent association sig-nals described above. Our fi ne-mapping analyses suggest that multiple in-dependent association signals are widespread at T2D susceptibility loci and indicate that the underlying causal variants are common.
358-ORFine-Mapping of Type 2 Diabetes Susceptibility Loci via Trans-Eth-nic Meta-AnalysisMOMOKO HORIKOSHI, STEVEN WILTSHIRE, TERESA FERREIRA, NORIHIRO KATO, JEROEN HUYGHE, ANUBHA MAHAJAN, FUMIHIKO TAKEUCHI, YIK YING TEO, ELEFTHERIA ZEGGINI, ANDREW P. MORRIS, MARK I. MCCARTHY, T2D-GENES CONSORTIUM, Oxford, United Kingdom, Tokyo, Japan, Ann Arbor, MI, Singapore, Singapore, Cambridge, United Kingdom
Over 60 type 2 diabetes (T2D) susceptibility loci have been identifi ed: however, the causal variant(s) been characterized at very few of these. One approach to refi ne the localisation of causal variants shared across major ethnic groups is to combine genome-wide association data across popula-tions to leverage differences in linkage disequilibrium. We examined 20,058 T2D cases and 38,789 controls from fi ve ethnic groups (30% European, 34% South Asian, 29% East Asian, 2% Hispanic, 5% African American), focusing on fi ve T2D loci: CDKAL1, CDKN2A/B, FTO, IGF2BP2 and KCNQ1. We combined GWAS data (imputed to a “cosmopolitan” reference panel incorporating variants from the 1000 Genomes August 2010 release) using both fi xed-ef-fects and Bayesian (MANTRA) methods. Fine-mapping resolution was most obviously improved at CDKAL1, highlighting two SNPs that jointly account for 98.8% of the posterior probability of association: rs9368222 (fi xed-effects p=2.4x10⁻²²) and rs2206734 (p=9.8x10⁻¹⁶). At KCNQ1, there are two distinct signals. One of these (lead SNP rs234864) showed marked heterogeneity in effect size with a stronger effect in E Asian (OR=1.27 [1.20-1.35]) than European, S Asian and Hispanic descent populations (combined, OR=1.11 [1.06-1.15]) (fi xed-effects phet=0.002, MANTRA log10 Bayes’ factor 2.67). The second locus (lead SNP rs2237892) featured homogeneous effect sizes (OR = 1.21 [1.16-1.26]), but differences in risk-allele frequency led to marked re-duction in the strength of the association signal in European and S Asian samples (minor allele frequency 2-7%, p=2.5x10⁻⁶) compared to E Asians (mi-nor allele frequency 29-44%, p=2.9x10⁻¹⁶). At the other three loci, there was much more modest improvement in localisation. Our results highlight the potential advantages of trans-ethnic meta-analysis for fi ne-mapping causal variants, and show promise for localizing potential targets for further func-tional investigation.
359-ORGenotype-Phenotype Correlation in 440 Children With Congenital Hyperinsulinism (HI)KARA SNIDER, ARUPA GANGULY, SUSAN BECKER, LINDA BOYAJIAN, SHOW-LING SHYNG, COURTNEY MACMULLEN, NKECHA HUGHES, KARTHIK GANAPA-THY, TRICIA BHATTI, AMANDA LEE, CHARLES STANLEY, Philadelphia, PA, Port-land, OR
Congenital hyperinsulinism (HI) is associated with 8 genetic disorders of insulin secretion. These include recessive, loss of function mutations of the genes encoding the KATP channel (ABCC8 and KCNJ11), resulting in either focal or diffuse diazoxide-unresponsive HI. Dominant, loss of function KATP channel mutations may cause either diazoxide -responsive or -unresponsive
disease traits independent of total adiposity. We genotyped 67,163 individuals from 28 studies using the Metabochip, a targeted genotyping array comprising SNPs pre-selected for cardiometabolic traits. Each SNP was tested for addi-tive association with WHR, adjusted for body mass index. All 14 previously established WHR loci replicated with directionally consistent effects (13 at P<5.0×10⁻⁸). SNPs selected to follow up suggestive WHR signals from the discovery meta-analysis by Heid et al., 2010, showed more directional consis-tency than expected by chance (1,409 of 2,377 independent SNPs (r2< 0.1) com-pared to 1,189 expected, P=2.01×10⁻¹⁹). We than performed fi xed-effects meta-analysis of the Metabochip studies together with genome-wide association studies (GWAS) from the published discovery meta-analysis (n=72,919), and a further 24 new GWAS (n=71,139). We identifi ed 28 novel WHR loci (P<5.0×10⁻⁸), including SNPs near PPARG (P=8.2×10⁻⁹) and CEBPA (P=2.0×10⁻⁹). The CEBPAsignal is located near two subunits of the transcription factor C/EBP, which is essential for adipocyte differentiation. C/EBP also binds promoters of adi-ponectin and leptin, suggesting a range of effects on downstream pathways. Variants in PPARG have previously been associated with T2D. We identifi ed two new WHR index SNPs, one 5’ and the other 3’ of PPARG, which are in low linkage disequilibrium with each other (r2=0.18) and with the Pro12Ala variant, an established T2D locus (r2=0.11 and 0.07 respectively); this is of interest, as PPARG binds the thiazolidinedione insulin sensitizing class of drugs commonly used to treat T2D and that induce weight gain. This meta-analysis from the GI-ANT consortium of 211,221 GWAS and Metabochip samples further elucidates the genetic architecture of adipose distribution and T2D.
356-ORNovel Loci Associated With Birth Weight Provide Biological Links Between Intrauterine Growth, Postnatal Growth and Metabolic TraitsDENNIS O. MOOK-KANAMORI, HANIEH YAGHOOTKAR, MOMOKO HORIKOSHI, ULLA SOVIO, NICOLAS TIMPSON, M. KAAKINEN, DIANE BERRY, JONATHAN BRADFIELD, DIANE COUSMINER, M. KERKHOF, M. KIRIN, E. KREINER-MØLLER, V. LAGOU, E. THIERING, NICOLE WARRINGTON, J. ZHAO, H. TAAL, MARK MC-CARTHY, M.R. JARVELIN, RACHEL FREATHY, INGA PROKOPENKO, VINCENT JAD-DOE, GEORGE DAVEY SMITH, THE EGG CONSORTIUM INVESTIGATORS, Doha, Qatar, Rotterdam, The Netherlands, Exeter, United Kingdom, Oxford, United King-dom, London, United Kingdom, Bristol, United Kingdom, Oulu, Finland, Philadelphia, PA, Helsinki, Finland, Groningen, The Netherlands, Edinburgh, United Kingdom, Co-penhagen, Denmark, Neuherberg, Germany, Perth, Australia
The genetic loci infl uencing birth weight (BW) and their relationship to postnatal growth and adult disease are poorly characterized. Two loci have been reported, CCNL1 and ADCY5, which contain variants associated with BW. To identify additional loci associated with BW we performed a genome wide association study (GWAS) in 26,836 European descent individuals from 18 studies and followed up 20 loci in up to 42,472 individuals. We identifi ed fi ve novel and confi rmed two loci containing variants associated with BW at p<5x10⁻⁸. These loci fell into 4 broad categories. First, two loci represented the same signals as known type 2 diabetes (T2D) signals - in or near ADCY5 (p=5.5 x10⁻²⁰) and CDKAL1 (p=1.5 x10⁻¹⁸). In both loci, the BW-lowering al-lele is also associated with greater T2D risk. This is consistent with the fetal insulin hypothesis, which proposes that common genetic variation infl uenc-ing insulin secretion is a key link between lower BW and later life T2D risk. Second, two associations shared loci with known adult height signals, in or near HMGA2 (p=1.4 x10⁻¹⁹) and LCORL (p= 5.9x10⁻¹¹) genes. For both loci, the height-increasing allele also was the BW-increasing allele. Third, one association represented the same signal as that known between variation at ADRB1 and blood pressure (p= 3.6x10⁻⁸). The effect of this signal on fetal BW appears to be mediated through maternal genotype. Finally, the previ-ously reported association near the CCNL1 gene (p= 3.6 x10-38), represents the strongest association with BW. The effect on BW seems to be through neonatal adiposity and this locus has no known overlap with adult metabolic traits. Separate to these groups, the association at 5q11.2, (p= 4.6 x10⁻⁸) has no recognized associations with other traits. Our analysis of the genetic component contributing to BW highlights genetic loci contributing to growth processes and to metabolic trait regulation.
357-ORFine-Mapping of Type 2 Diabetes Susceptibility Loci With “Metabo-chip”ANDREW P. MORRIS, TERESA FERREIRA, TANYA M. TESLOVICH, MICHAEL BOEHNKE, MARK I. MCCARTHY, DIAGRAM CONSORTIUM, Oxford, United King-dom, Ann Arbor, MI
Despite the success of genome-wide association studies (GWAS) in identi-fying susceptibility loci for type 2 diabetes (T2D), most of these signals map to
A94
For author disclosure information, see page 797. ADA-Funded Research
ORA
LSMETABOLISM IN VIVO (HUMANS)
361-ORT-Cell Receptor Alpha and Beta Chain Skewing in the Islets of Pre-Diabetic MAD Rats: Germline-Encoded TCR Repertoire as a Deter-minant of Type 1 Diabetes SusceptibilityRYAN A. EBERWINE, LAURA CORT, FRANK BEAROFF, ZHIJUN LIU, MICHAEL HABIB, JOHN MORDES, ELIZABETH BLANKENHORN, Philadelphia, PA, Worces-ter, MA
Autoimmune type 1 diabetes (T1D) is common among inbred rat strains with a high-risk MHC-II. Prior genetic studies have mapped a robust diabetes susceptibility locus (Iddm14) using fi ve T1D susceptible (including the MAD strain) and three resistant rat strains (e.g. WF). We then identifi ed a T-cell receptor (TCR) beta chain variable region gene, Tcrb-V13, as the probable Iddm14 gene. We have shown that deletion of V 13+ T cells prevents T1D (Diabetes, In press), suggesting that TCR-V 13+ T-cells recognize a critical is-let autoantigen. If true, we should detect clonal expansion of V 13+ T cells in prediabetic islets. We sequenced V 13+ CDR3 regions from T cells isolated from spleen and islets, and T cells cultured ex vivo from islets of pre-diabetic MAD rats. We observed signifi cant skewing of the TCR repertoire, with pauciclonal expansion of V 13-CDR3 sequences from islet T-cells compared to a high diversity of V 13-CDR3 regions in spleen. These data indicate that an oligoclonal V 13 response to pancreatic beta cells exists early in pro-gression to autoimmune diabetes. In NOD/LtJ mice, TCR-V 5.4 is frequently used in the T-cell response to islet antigen and recognizes insulin B:9-23 in combination with multiple TCR chains. We analyzed rat V 5.4+ CDR3 se-quences from pre-diabetic islets, T cell exfi ltrates from cultured pre-diabetic islets , and V 13+ and V 13- sorted exfi ltrates. We observed signifi cant TCR skewing among islet homing V 5.4+ T-cells, suggesting an autoimmune re-sponse to insulin occurs early in rat T1D pathogenesis. Additionally we show the presence of TCR-V 5 repertoire skewing among islet homing TCR- V 13+ cells. We conclude that the TCR genotype is a critical genetic determinant of T1D susceptibility.
METABOLISM IN VIVO (HUMANS)
362-ORThe Size of the Incretin Effect is Dependent on the Small Intestinal Glucose LoadCHINMAY S. MARATHE, CHRISTOPHER K. RAYNER, KAREN L. JONES, MICHAEL HOROWITZ, Adelaide, Australia
The incretin effect, mediated by GLP-1 and GIP, accounts for ~50% of post-prandial insulin secretion in health, and is defi cient in type 2 diabetes. Previ-ous studies have not assessed the potential impact of gastric emptying (GE), for which there is low intra-individual but substantial inter-individual varia-tion (range 1-4 kcal/min). When GE is relatively more rapid, the postprandial rise in glucose is greater. We hypothesized that the incretin effect would be greater at higher rates of intraduodenal (ID) glucose delivery. 10 healthy men (age 47 ± 3 years, BMI 29.3 ± 1.0) were each studied on four days. They received ID glucose infusions at 2 or 4 kcal/min for 120 min in random order, and corresponding isoglycemic intravenous (IV) glucose infusions. Blood glucose and serum insulin were measured to 240 min and incremental area under the curves (iAUC) calculated. Data are mean ± SEM. The insulin iAUC (mU/L.min) was substantially greater in response to 4 kcal/min than 2 kcal/min ID glucose (5390 ± 1338 v 1836 ± 528, P<0.005), so that the blood glucose iAUC (mmol/L.min) was not signifi cantly different between the two (238 ± 34 v 200 ± 20). As expected, the insulin iAUC was greater after ID than IV glucose for the 2 kcal/min (1836 ± 528 v 779 ± 213, P<0.01) and 4 kcal/min (5390 ± 1338 v 1289 ± 554, P<0.005) studies, but the size of this incretin ef-fect (%insulin response attributable to the gut) was substantially greater for 4 kcal/min than 2 kcal/min (80 ± 4% v 51 ± 5%, P<0.005). Our results suggest that in healthy subjects, the rate of glucose entry into the small intestine, within the physiological range of GE, has a major impact on the size of the incretin effect.
HI. We evaluated the correlations between genotype and phenotype as a guide for clinical management of in a large series of 440 HI cases. Muta-tion analysis was completed in all cases for the genes commonly associated with HI (ABCC8, KCNJ11, GLUD1 and GCK). Additional genes were screened in children negative for mutations in the above genes (HNF4a, UCP2 and SCHAD). Mutations could be identifi ed in 272 diazoxide-unresponsive probands (91%); 265 had KATP channel mutations (145 focal HI, 109 diffuse HI, 11 did not have surgery). GCK mutations were identifi ed in 6 diazoxide-unresponsive children, 2 of whom had surgery for diffuse disease. In 119 diazoxide-responsive probands, mutations were found in 45%: 24 GLUD1 mutations, 23 dominant KATP mutations, 2 SCHAD mutations, 2 UCP2 mu-tations, and 2 HNF4a mutations. Interpretation of the signifi cance of KATP mutations was complicated by the fact that 70% of the defects identifi ed were novel variants. Inheritance of 2 recessive KATP mutations predicted diffuse-HI with 100% sensitivity and specifi city. Inheritance of a single, paternal recessive KATP mutation predicted focal-HI with 100% sensitivity and 92% specifi city. These correlations between genotype to phenotype in children with HI indicate that mutation analysis can be especially useful in children unresponsive to diazoxide in distinguishing focal versus diffuse HI and selecting patients who are potentially curable by surgery.
Supported by: R37-DK-056268 and R01-DK-066485
360-ORThe HLA-DR2, DQB1*0602 Haplotype is Associated With Lack of Disease Progression and Lower Autoantibody Prevalence in the TrialNet Natural History StudyALBERTO PUGLIESE, DAVID BOULWARE, SUNANDA BABU, ANDREA STECK, CRAIG BEAM, DOROTHY BECKER, GEORGE S. EISENBARTH, CARLA GREEN-BAUM, AND THE TYPE 1 DIABETES TRIALNET STUDY GROUP, Miami, FL, Tampa, FL, Denver, CO, Pittsburgh, PA, Seattle, WA
The TrialNet NHS has screened >99,000 relatives of T1D patients for au-toantibodies (AAb, to GAD65, ICA-512, insulin, and islet cell antibodies, ICA); 2,147 relatives (1,179 females, 954 males, 14 unknown gender, mean age 18.1 + SD 13.7 years) were HLA-typed because they had 1 AAb confi rmed or >2 AAb, at screening or on follow-up. ZnT8 AAb were measured in 1,031 HLA-typed relatives. We analyzed the association of the T1D-protective HLA-DR2, DQB1*0602 haplotype with disease progression and AAb status in AAb-positive relatives. There was a negative association with T1D: 16% (343/2,147) of relatives developed T1D, but only 0.5% (2/343) carried this haplotype compared to 6.9% (128/1859) of nondiabetic relatives (p<0.0001); 35 (27%) relatives with DR2, DQB1*0602 had DR4 (17 had DRB1*0401) and only 1 (with DRB1*0402) developed T1D. Table 1 shows the frequency of individual AAb and AAb number in 1,031 relatives also tested for ZnT8 AAb in relation to DR2, DQB1*0602.
Table 1 HLA DR2,DQB1*0602 negative
HLA DR2,DQB1*0602 positive
p-value
ZnT8 318/967 (32.9%) 6/64 (9.4%) <0.0001GAD65 739/967 (76.4%) 47/64 (73.4%) 0.59ICA512 328/967 (33.9%) 11/64 (17.2%) 0.006Insulin 399/967 (41.3%) 15/64 (23.4%) 0.005ICA 359/959 (37.4%) 16/64 (25.0%) 0.041 AAb 406/961 (42.2%) 46/64 (71.9%) 0.0000022 AAb 210/961 (21.8%) 12/64 (18.8%) 0.123 AAb 148/961 (15.4%) 1/64 (1.6%) 0.00034 AAb 113/961 (11.8%) 3/64 (4.7%) 0.035 AAb 84/961 (8.7%) 2/64 (3.1%) 0.05
The frequency of GAD65 AAb was similar, while other AAb were less frequent, with ZnT8 AAb being the least frequent, in relatives with DR2, DQB1*0602. They more often had 1 AAb and rarely >3 AAb (p=0.0001). Among relatives with DR2, DQB1*0602 who also had DR4, 11/14 (78%) had 1 autoantibody, 1 had 2, none had 3, 2 had 4 and none had 5. Thus, in NHS autoantibody-positive relatives, DR2, DQB1*0602 is associated with strong protection from T1D, which appears dominant over DR4 susceptibility, and the presence of fewer AAb, even in the presence of DR4; ZnT8 AAb are the least frequent AAb in relatives with this protective haplotype.
Supported by: NIH and JDRF

A95
For author disclosure information, see page 797.ADA-Funded Research
ORA
LS
METABOLISM IN VIVO (HUMANS)
etaminophen): 38±7 and 33±7 vs. 77±8 min, P<0.002) in vagotomized sub-jects after OGTT compared to controls. Control subjects suppressed plasma glucagon concentrations similarly irrespectively of the route of glucose ad-ministration (total area under the curve (tAUC): 1184±147 (IIGI) vs. 1292±180 4h×pM (OGTT), P=NS) whereas vagotomised subjects suppressed glucagon during IIGI and exhibited hyperglucagonemic responses following OGTT (duodenal ulcer: 1374±174 vs. 1891±276 4h×pM, P<0.05; cardia resection: 1125±139 vs. 1608±237 4h×pM, P<0.05). The incretin effect (calculated using the incremental AUC for C-peptide) was reduced in the vagotomized groups (48±7% (duodenal ulcer), 45±5% (cardia resection, P=NS) compared to the controls (64±6%, P<0.05). The incretin effect was diminished in vagotomized subjects despite 5-fold higher OGTT-induced GLP-1 levels. Futhermore, the vagotomized subjects had an inappropriate glucagon response after an oral glucose load. These fi ndings may indicate that an intact vagal innervation is important for the effect of GLP-1 and thereby maintenance of normal glucose homeostasis.
Supported by: EFSD/Novo Nordisk Grant
365-ORMechanisms of Impaired Incretin Effects in Type 2 DiabetesANDREA MARI, JONATAN I. BAGGER, ELE FERRANNINI, JENS J. HOLST, FILIP K. KNOP, TINA VILSBØLL, Padova, Italy, Hellerup, Denmark, Pisa, Italy, Copenhagen, Denmark
To characterize the incretin effects (IE) on insulin secretion (ISR), we used 25, 75, and 125 g OGTTs and isoglycemic intravenous glucose infusions (IIGI) in 8 type 2 diabetic (T2D) and 8 matched nondiabetic (C) subjects (3 males; age 57±1 years; BMI 29±0.3 kg/m2), and a -cell mathematical model em-bedding a dose-response (slope=glucose sensitivity, GS), an early response (rate sensitivity, RS), and potentiation (POT, time-related response increase relative to basal). During IIGI in C, both GS (42±4, 46±6, 43±7 pmol min-1 m-2 Lmmol-1; 25, 75, 125 g dose, respectively) and RS (441±118, 446±109, 481±115 pmol m-2 L mmol-1) were dose-independent, while POT increased (0.99±0.07 to 1.35±0.12, 25 vs 125 g, P<0.01). In T2D, GS and RS were also dose-inde-pendent (GS: 16±2, 17±2, 17±2; RS: 28±16, 12±10, 7±7), but severely impaired vs C (both P<0.0001). In C, IE (as the OGTT/IIGI total ISR ratio) increased with the glucose dose (1.3±0.1, 1.7±0.2, 2.2±0.2, P<0.02 vs 1 for all doses); this effect was mediated by a dose-dependent GS increase (1.9±0.4, 2.4±0.4, 3.1±0.4 fold of IIGI), and a dose-independent RS enhancement (1091±293, 510±157, 1112±415 pmol m-2 L mmol-1 absolute increase vs IIGI). POT also in-creased at the highest doses (0.97±0.06, 1.45±0.20, 1.24±0.16 fold of IIGI). In T2D, IE was signifi cantly increased only at 125 g (1.0±0.1, 1.1±0.1, 1.3±0.1), and impaired vs C across doses (P<0.0001). GS showed the same pattern (1.2±0.2, 1.3±0.2, 2.0±0.2 fold of IIGI), while RS increased already at 25 g (369±136, 338±84, 260±100 pmol m-2 L mmol-1 increase vs IIGI). However, OGTT did not stimulate POT above IIGI (0.94±0.04, 0.89±0.06, 1.06±0.09 fold of IIGI; P<0.01 vs C). On the OGTT, total GIP and GLP-1 levels increased dose-dependently, and similarly in C and T2D. In conclusion, 1) In nondiabetic subjects, dose-dependent IE increase results mainly from GS and POT; 2) In T2D, IE is blunted vs C at all glucose doses and signifi cant at 125 g only, but enhanced early ISR is detectable at all doses; 3) the IE differences cannot be explained by GLP-1/GIP responses.
366-OREarlier Glucose and Insulin Peaks and Postprandial Hyperglycemia after Gastric Bypass (GBP) in Patients With and Without Diabetes: Results from the Longitudinal Assessment of Bariatric Surgery (LABS) StudyJONATHAN Q. PURNELL, MYRLENE STATEN, BRUCE WOLFE, ANITA P. COURCOU-LAS, DAVID R. FLUM, DAVID E. CUMMINGS, KAREN FOSTER-SCHUBERT, BRET SHEPPARD, Portland, OR, Bethesda, MD, Pittsburgh, PA, Seattle, WA
Patients with type 2 diabetes (T2DM) have impaired islet secretory capac-ity compared to those without. Hypothesizing that insulin secretion during a mixed meal would improve in patients with T2DM undergoing GBP (indi-cating improved insulin secretory capacity) but decrease in those without T2DM (as insulin sensitivity improved with weight loss), we studied 41 sub-jects with and 20 subjects without T2DM (similar in age, sex, BMI) before and 6 mo after GBP. Each subject drank 360 Kcal (BoostPlus) with timed sampling over 240 min. Fasting glucose and insulin levels, and AUC glucose, signifi cantly decreased by 6 mo in both groups (fi gure). However, at 6 mo the average postprandial (PP) peak glucose levels remained unchanged in T2DM, increased in controls (+19 mg/dL, P=0.001), and occurred a median of 30-min sooner in both groups (P<0.001). Insulin responses mirrored the glucose re-sponses in both timing and peak, resulting in a more rapid late PP decline in glucose levels at 6 mo. The average AUC insulin decreased in patients with
Supported by: NHMRC, Australia
363-ORDefective Insulin Secretion in Humans With Type 2 Diabetes Melli-tus (T2DM) May Refl ect an Impaired Response to Cholinergic Rather than GIP InputSARA CHOWDHURY, SONGYAN WANG, ERIN LACINY, BRUCE W. PATTERSON, DOMINIC N. REEDS, BURTON M. WICE, St. Louis, MO
Impaired insulin secretion is a hallmark feature of T2DM. Glucagon-like peptide-1 (GLP1) and glucose-dependent insulinotropic polypeptide (GIP) are intestinal peptides secreted with meal ingestion and amplify insulin secre-tion rates (ISRs). In contrast to GLP-1, it is thought that beta cells in T2DM are resistant to GIP precluding its use as a therapeutic target. Xenin-25 (Xen) is a 25-amino acid neurotensin related peptide. We previously showed that Xen amplifi es GIP-mediated insulin release in mice via a cholinergic relay in the periphery. We now explore this relay in humans with normal (NGT) or impaired (IGT) glucose tolerance and T2DM.Each subject underwent 4 separate graded glucose infusions (GGIs) with continuous infusion of albu-min, GIP, Xen, or GIP plus Xen. Based on published work, plasma pancre-atic polypeptide (PP) levels refl ect Xen-mediated cholinergic input to islets. Fasting PP levels were similar in all groups. During the fi rst 40 min of the GGIs, GIP rapidly and transiently increased ISR incremental area under the curve (iAUCs) in humans with NGT (4.6X) and IGT (6.1X). Contrary to dogma, GIP also increased the iAUC for ISR 8.7X in humans with T2DM. Increased ISR occurred without signifi cant changes in plasma glucose and PP levels. In contrast, Xen had no effect on ISR or plasma glucose in any group but increased PP levels >10X in humans with NGT, IGT, and T2DM (iAUCs = 4.6, 5.8, and 6.3 ng/mL/40 min, respectively). During GGIs with GIP plus Xen, ISRs were further increased in NGT (1.3X) and IGT (1.5X), but not T2DM compared to GIP alone. However, with GIP plus Xen, PP levels similarly increased in subjects with NGT, IGT, and T2DM (iAUCs = 11.8, 13.2, and 12.8 ng/mL/40 min, respectively). Thus, increased cholinergic input alone is not suffi cient to augment ISRs in humans but can amplify GIP-mediated ISRs in humans with NGT and IGT, but not T2DM. Thus, beta cells in T2DM may exhibit an impaired response to cholinergic rather than GIP input.
Supported by: NIH/NIDDK (RC1DK086163 and R01DK088126), The Blum Kovler Foundation
364-ORReduced Incretin Effect in Truncal Vagotomized SubjectsASTRID PLAMBOECK, SIMON VEEDFALD, CAROLYN DEACON, ANDRÈ WETTER-GREN, LARS SVENDSEN, SØREN MEISNER, CLAUS HOVENDAHL, JENS HOLST, FILIP KNOP, TINA VILSBØLL, Hellerup, Denmark, Copenhagen, Denmark, Odense, Denmark
Rapid degradation of glucagon-like peptide-1 (GLP-1) by dipeptidyl pepti-dase 4 (DPP-4) suggests that GLP-1 may act locally (through vagal afferents) before being degraded. We aimed to clarify the role of vagal innervation on the incretin effect. Ten truncally vagotomized subjects (due to duodenal ulcer) with pyloroplasty (68±2 years; fasting plasma glucose (FPG): 6.0±0.2 mM), 10 subjects treated for oesophageal cancer with cardia resection including truncal vagotomy/pyloroplasty (65±2 years; FPG: 5.8±0.3 mM) and 10 control subjects (67±1 years; FPG: 5.3±0.1 mM) underwent 4h 50 g-OGTT±concomitant DPP-4 inhibition (DPP-4i) and isoglycemic glucose in-fusion (IIGI). Isoglycemia during the oral and iv glucose administration was obtained. Peak plasma levels of GLP-1 were about 5-fold higher (109±19 and 140±40 vs. 24±3 pM, P<0.02) and gastric emptying faster (time to peak (ac-
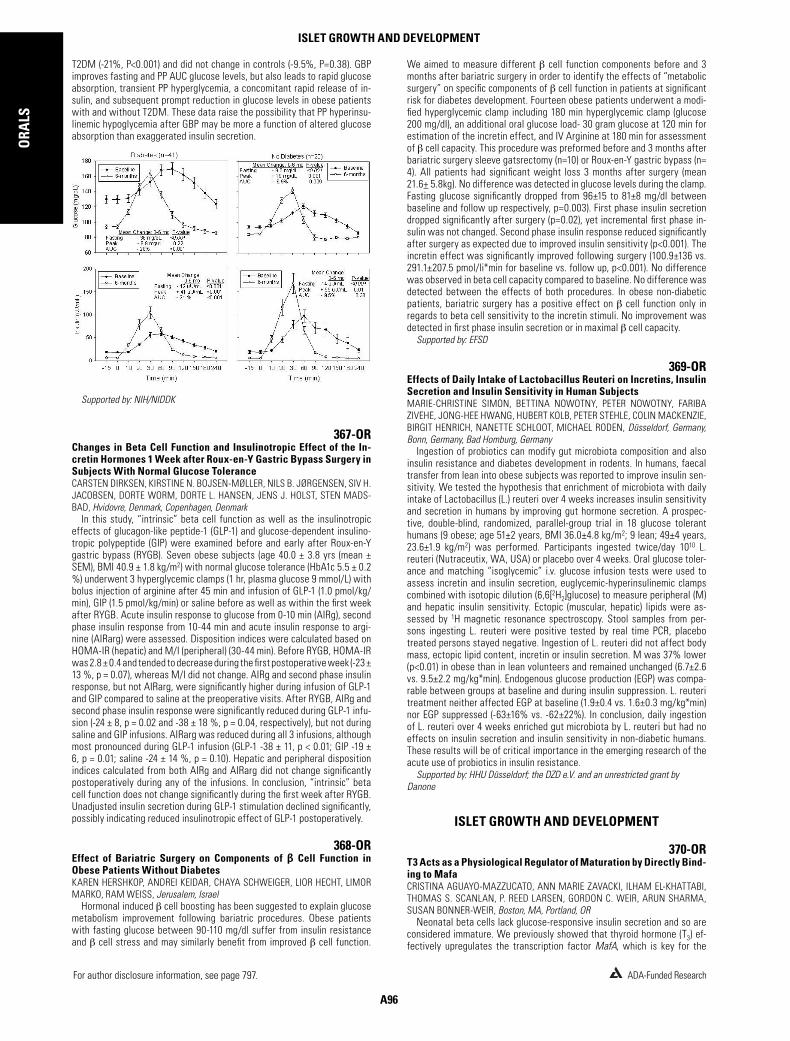
A96
For author disclosure information, see page 797. ADA-Funded Research
ORA
LSISLET GROWTH AND DEVELOPMENT
We aimed to measure different cell function components before and 3 months after bariatric surgery in order to identify the effects of “metabolic surgery” on specifi c components of cell function in patients at signifi cant risk for diabetes development. Fourteen obese patients underwent a modi-fi ed hyperglycemic clamp including 180 min hyperglycemic clamp (glucose 200 mg/dl), an additional oral glucose load- 30 gram glucose at 120 min for estimation of the incretin effect, and IV Arginine at 180 min for assessment of cell capacity. This procedure was preformed before and 3 months after bariatric surgery sleeve gatsrectomy (n=10) or Roux-en-Y gastric bypass (n= 4). All patients had signifi cant weight loss 3 months after surgery (mean 21.6+ 5.8kg). No difference was detected in glucose levels during the clamp. Fasting glucose signifi cantly dropped from 96±15 to 81±8 mg/dl between baseline and follow up respectively, p=0.003). First phase insulin secretion dropped signifi cantly after surgery (p=0.02), yet incremental fi rst phase in-sulin was not changed. Second phase insulin response reduced signifi cantly after surgery as expected due to improved insulin sensitivity (p<0.001). The incretin effect was signifi cantly improved following surgery (100.9±136 vs. 291.1±207.5 pmol/li*min for baseline vs. follow up, p<0.001). No difference was observed in beta cell capacity compared to baseline. No difference was detected between the effects of both procedures. In obese non-diabetic patients, bariatric surgery has a positive effect on cell function only in regards to beta cell sensitivity to the incretin stimuli. No improvement was detected in fi rst phase insulin secretion or in maximal cell capacity.
Supported by: EFSD
369-OREffects of Daily Intake of Lactobacillus Reuteri on Incretins, Insulin Secretion and Insulin Sensitivity in Human SubjectsMARIE-CHRISTINE SIMON, BETTINA NOWOTNY, PETER NOWOTNY, FARIBA ZIVEHE, JONG-HEE HWANG, HUBERT KOLB, PETER STEHLE, COLIN MACKENZIE, BIRGIT HENRICH, NANETTE SCHLOOT, MICHAEL RODEN, Düsseldorf, Germany, Bonn, Germany, Bad Homburg, Germany
Ingestion of probiotics can modify gut microbiota composition and also insulin resistance and diabetes development in rodents. In humans, faecal transfer from lean into obese subjects was reported to improve insulin sen-sitivity. We tested the hypothesis that enrichment of microbiota with daily intake of Lactobacillus (L.) reuteri over 4 weeks increases insulin sensitivity and secretion in humans by improving gut hormone secretion. A prospec-tive, double-blind, randomized, parallel-group trial in 18 glucose tolerant humans (9 obese; age 51±2 years, BMI 36.0±4.8 kg/m2; 9 lean; 49±4 years, 23.6±1.9 kg/m2) was performed. Participants ingested twice/day 1010 L. reuteri (Nutraceutix, WA, USA) or placebo over 4 weeks. Oral glucose toler-ance and matching “isoglycemic” i.v. glucose infusion tests were used to assess incretin and insulin secretion, euglycemic-hyperinsulinemic clamps combined with isotopic dilution (6,6[2H2]glucose) to measure peripheral (M) and hepatic insulin sensitivity. Ectopic (muscular, hepatic) lipids were as-sessed by 1H magnetic resonance spectroscopy. Stool samples from per-sons ingesting L. reuteri were positive tested by real time PCR, placebo treated persons stayed negative. Ingestion of L. reuteri did not affect body mass, ectopic lipid content, incretin or insulin secretion. M was 37% lower (p<0.01) in obese than in lean volunteers and remained unchanged (6.7±2.6 vs. 9.5±2.2 mg/kg*min). Endogenous glucose production (EGP) was compa-rable between groups at baseline and during insulin suppression. L. reuteri treatment neither affected EGP at baseline (1.9±0.4 vs. 1.6±0.3 mg/kg*min) nor EGP suppressed (-63±16% vs. -62±22%). In conclusion, daily ingestion of L. reuteri over 4 weeks enriched gut microbiota by L. reuteri but had no effects on insulin secretion and insulin sensitivity in non-diabetic humans. These results will be of critical importance in the emerging research of the acute use of probiotics in insulin resistance.
Supported by: HHU Düsseldorf; the DZD e.V. and an unrestricted grant by Danone
ISLET GROWTH AND DEVELOPMENT
370-ORT3 Acts as a Physiological Regulator of Maturation by Directly Bind-ing to MafaCRISTINA AGUAYO-MAZZUCATO, ANN MARIE ZAVACKI, ILHAM EL-KHATTABI, THOMAS S. SCANLAN, P. REED LARSEN, GORDON C. WEIR, ARUN SHARMA, SUSAN BONNER-WEIR, Boston, MA, Portland, OR
Neonatal beta cells lack glucose-responsive insulin secretion and so are considered immature. We previously showed that thyroid hormone (T3) ef-fectively upregulates the transcription factor MafA, which is key for the
T2DM (-21%, P<0.001) and did not change in controls (-9.5%, P=0.38). GBP improves fasting and PP AUC glucose levels, but also leads to rapid glucose absorption, transient PP hyperglycemia, a concomitant rapid release of in-sulin, and subsequent prompt reduction in glucose levels in obese patients with and without T2DM. These data raise the possibility that PP hyperinsu-linemic hypoglycemia after GBP may be more a function of altered glucose absorption than exaggerated insulin secretion.
Supported by: NIH/NIDDK
367-ORChanges in Beta Cell Function and Insulinotropic Effect of the In-cretin Hormones 1 Week after Roux-en-Y Gastric Bypass Surgery in Subjects With Normal Glucose ToleranceCARSTEN DIRKSEN, KIRSTINE N. BOJSEN-MØLLER, NILS B. JØRGENSEN, SIV H. JACOBSEN, DORTE WORM, DORTE L. HANSEN, JENS J. HOLST, STEN MADS-BAD, Hvidovre, Denmark, Copenhagen, Denmark
In this study, “intrinsic” beta cell function as well as the insulinotropic effects of glucagon-like peptide-1 (GLP-1) and glucose-dependent insulino-tropic polypeptide (GIP) were examined before and early after Roux-en-Y gastric bypass (RYGB). Seven obese subjects (age 40.0 ± 3.8 yrs (mean ± SEM), BMI 40.9 ± 1.8 kg/m2) with normal glucose tolerance (HbA1c 5.5 ± 0.2 %) underwent 3 hyperglycemic clamps (1 hr, plasma glucose 9 mmol/L) with bolus injection of arginine after 45 min and infusion of GLP-1 (1.0 pmol/kg/min), GIP (1.5 pmol/kg/min) or saline before as well as within the fi rst week after RYGB. Acute insulin response to glucose from 0-10 min (AIRg), second phase insulin response from 10-44 min and acute insulin response to argi-nine (AIRarg) were assessed. Disposition indices were calculated based on HOMA-IR (hepatic) and M/I (peripheral) (30-44 min). Before RYGB, HOMA-IR was 2.8 ± 0.4 and tended to decrease during the fi rst postoperative week (-23 ± 13 %, p = 0.07), whereas M/I did not change. AIRg and second phase insulin response, but not AIRarg, were signifi cantly higher during infusion of GLP-1 and GIP compared to saline at the preoperative visits. After RYGB, AIRg and second phase insulin response were signifi cantly reduced during GLP-1 infu-sion (-24 ± 8, p = 0.02 and -38 ± 18 %, p = 0.04, respectively), but not during saline and GIP infusions. AIRarg was reduced during all 3 infusions, although most pronounced during GLP-1 infusion (GLP-1 -38 ± 11, p < 0.01; GIP -19 ± 6, p = 0.01; saline -24 ± 14 %, p = 0.10). Hepatic and peripheral disposition indices calculated from both AIRg and AIRarg did not change signifi cantly postoperatively during any of the infusions. In conclusion, “intrinsic” beta cell function does not change signifi cantly during the fi rst week after RYGB. Unadjusted insulin secretion during GLP-1 stimulation declined signifi cantly, possibly indicating reduced insulinotropic effect of GLP-1 postoperatively.
368-OREffect of Bariatric Surgery on Components of Cell Function in Obese Patients Without DiabetesKAREN HERSHKOP, ANDREI KEIDAR, CHAYA SCHWEIGER, LIOR HECHT, LIMOR MARKO, RAM WEISS, Jerusalem, Israel
Hormonal induced cell boosting has been suggested to explain glucose metabolism improvement following bariatric procedures. Obese patients with fasting glucose between 90-110 mg/dl suffer from insulin resistance and cell stress and may similarly benefi t from improved cell function.

A97
For author disclosure information, see page 797.ADA-Funded Research
ORA
LS
ISLET GROWTH AND DEVELOPMENT
While we recently showed that MafA over expression in isolated neonatal islets enhanced their glucose responsiveness and functional maturation, the question of whether MafA is suffi cient to enhance beta cell function in vivo remains unresolved. Therefore we tested whether enhancing MafA expression in vivo in a model of beta cell dysfunction (Pdx1 haplo-insuffi -cient mice) would improve beta cell function. Pdx1tTA/+ and tetOMafA mice were crossed and doxycycline (DOX) was given in drinking water through-out gestation. Then DOX was stopped at birth to trigger induction of MafA transgene in Pdx1tTA/+; tetOMafA (bigenic) offspring. Bigenic pups were born at the expected Mendelian ratio with normal pancreatic morphology. At P0 both bigenic and Pdx1 haplo-insuffi cient mice had reduced Pdx1 and MafA expression compared to controls, and they did not express trans-gene. By one-month transgene expression was only seen in beta cells of bigenic mice. These mice had signifi cantly improved glucose tolerance, and increased MafA, GLUT2, insulin and even Pdx1 levels compared to Pdx1tTA/+ littermates. These results indicate that enhancing MafA expression in vivo is suffi cient to overcome beta-cell dysfunction and the associated changes in gene expression in Pdx1 haplo-insuffi cient mice. Thus, MafA should be considered as a master regulator of beta-cell function.
Supported by: NIH/NIDDK, JDRF, Herbert Graetz Fund, Shirley and William Fleis-cher family
373-ORFate Mapping of the Murine Pancreas Precursors Reveals a Multi-potent Ventral Foregut ProgenitorJESSE ANGELO, MAR-ISEL GUERRERO-ZAYAS, JESSE MAGER, KIMBERLY D. TREMBLAY, Amherst, MA
The defi nitive endoderm is the germ layer that gives rise to the endoder-mal organs including the thyroid, lung, liver and pancreas. The endodermal origin of the dorsal and ventral pancreas buds remains enigmatic, yet under-standing how these tissue buds are induced and formed is an essential step in understanding normal pancreas development. We have used physical fate mapping combined with whole embryo culture to uncover the endodermal origin of both pancreas buds uncovering remarkable differences between the origins of each. The dorsal bud progenitors are located in a single medial endodermal position from the 2 somite (S) stage through 11S. The endoderm forming the 9.5dpc ventral pancreas bud is found in 2 distinct domains: the predominant contribution from the domain on the left and right lateral endo-derm caudal to the ventral lip by 6S, while a second domain located in the ventral midline of the endoderm lip (VMEL) contributes to a small population in the midline of the 9.5dpc ventral pancreas bud. Finally we fi nd that the VMEL population contributes in a defi ned temporal manner to the thyroid bud, rostral cap and ventral midline of the liver bud as well as the midline of the ventral pancreas bud. These results are the fi rst to discern the endoder-mal origins of the dorsal and ventral pancreas buds as well as those of the thyroid in the pre-specifi ed endodermal sheet. Furthermore, these data sug-gest that the early ventral foregut tissue buds are at least in part, descended from the same progenitor population.
374-ORThe Diabetes-Associated Gene Glis3 Regulates Beta Cell Differ-entiation in Utero via Neurog3 Transactivation but Modulates Beta Cell Function in Adults via Non-Neurog3-Mediated Control of Insu-lin ProductionYISHENG YANG, BENNY CHANG, LAWRENCE CHAN, Houston, TX
Glis3, a member of the Krüppel-like family of transcription factors, is highly expressed in pancreatic beta cells. GLIS3 mutations were found to cause sporadic neonatal diabetes. Recent genome-wide association stud-ies (GWAS) in adult populations identifi ed GLIS3 also as a candidate gene for type 1 diabetes, and as a gene that is associated with type 2 diabetes. Moreover, the GLIS3 locus is linked to altered fasting glucose level in healthy children and adolescents. To gain insight into the functional roles of Glis3,we generated Glis3−/− mice, which died neonatally with severe hyperglyce-mia and ketoacidosis. Using in vivo and in vitro analyses, we show that Glis3is involved in the differentiation of endocrine progenitor cells through direct and indirect transcriptional control of Neurog3 expression, which is essen-tial to islet formation. To determine if sustained Glis3 expression is required for the normal functioning of beta cells in adult animals, we generated condi-tional Glis3 knockout (Glis3fl /fl /Pdx1CreERT+) mice and used tamoxifen to induce Glis3 deletion in adult mice. Tamoxifen-mediated beta cell-specifi c inactiva-tion of Glis3 induces diabetes acutely by downregulating insulin expression, leading to hyperglycemia and subsequently enhanced beta cell apoptosis, an effect that appears to be largely independent of Glis3’s Neurog3 transacti-vating function. We conclude that [1] Glis3 controls fetal islet differentiation
functional maturation of beta cells. Here we tested the hypothesis that T3regulates MafA transcription through direct interaction of its receptor with the MafA promoter region. INS1 cells cultured in the presence of T3 for 14hshowed a signifi cant increase in MafA mRNA, which was sensitive to ac-tinomycin D-dependent inhibition of RNA polymerase. These results suggest that MafA may be a direct target of thyroid hormone. Agonists for the dif-ferent isoform thyroid receptors, either CO 23 (THRA agonist) or GC1 (THRB agonist), were added to P7 rat islets cultured for 4 days in RPMI (11.1 mM glucose) containing 10% Charcoal Stripped-FBS. GC1 effectively increased MafA mRNA levels while CO23 failed to, suggesting that at this postnatal period T3 activates THRB to enhance MafA transcription. Potential thyroid response elements (TRE) in a 20kb fragment of the MafA mouse gene were identifi ed. Two regions, one upstream and one downstream of the MafA cod-ing region were identifi ed as having greater than 75 % conservation across mouse, rat and human MafA gene. Eight potential binding sites, including the two conserved sites, were further characterized for their ability to bind THRB by chromatin immunoprecipitation followed by site-specifi c PCR am-plifi cation. Cross-linked chromatin from untreated or T3 (10nM) treated MIN6 cells was immunoprecipitated using anti-THRB antibodies. PCR analysis con-fi rmed the binding of THRB to at least one putative TRE in the MafA promoter. Overall, these results indicate that MafA transcription can be regulated by T3 via THRB directly bound to a MafA TRE. Thus, thyroid hormone can func-tion as a direct physiological regulator of MafA expression and subsequently drive the functional maturation of beta cells.
371-ORKRAS Inhibition of Beta-Cell Growth Occurs Through a MENIN-RASSF1 Regulatory NetworkCHESTER E. CHAMBERLAIN, MICHAEL S. GERMAN, San Francisco, CA
KRAS is a regulated GDP/GTP molecular switch that controls several sig-naling networks. Although activating missense mutations in the KRAS gene are a major cause of accelerated growth in many epithelial cancers, KRAS signaling can elicit diverse, cell-type specifi c responses, and its function in the normal growth and physiology of the pancreatic beta-cell remains un-known. We discovered that mice heterozygous for a null allele of the KRAS gene have an expanded beta-cell population at birth and improved glucose tolerance as adults. We showed that the additional beta-cells come from two sources: increased numbers of Neurogenin3-expressing endocrine progenitors during embryogenesis and increased beta-cell proliferation during the perinatal period. Increased KRAS signaling directly suppressed both sources of new beta-cells (neogenesis from non-beta-cell progeni-tors, and proliferation of pre-existing beta-cells) and activated the opposing MAPK and RASSF1 downstream effector pathways in beta-cells. The block of beta-cell growth caused by KRAS activity depends on the expression of the endocrine tumor suppressor MENIN. In support of this conclusion, en-docrine cells from the parathyroid and pituitary glands, two tissues known to develop tumors in patients carrying heterozygous mutations in MENIN (Multiple Endocrine Neoplasia Type 1, MEN1), similarly showed increased proliferation in KRAS heterozygous null mutants. Our data suggest a model in which KRAS activates both the pro-proliferative MAPK pathway, and the anti-proliferative RASSF1 pathway. In the tissues susceptible to the MENIN gene mutation, MENIN prevents the MAPK effector pathway from driving beta-cell proliferation while leaving the inhibitory RASSF1 effector pathway intact. In this model, loss of MENIN causes proliferation due to removal of the block in the proliferative drive mediated by MAPK signaling, while loss of KRAS signaling increases proliferation by decreasing the unopposed RASSF1 activity in susceptible cells.
Supported by: Larry L. Hillblom Foundation, Nora Eccles Treadwell Foundation, JDRF, NIH/NIDDK
372-ORMafA Can Reverse Beta-Cell Dysfunction Resulting from Pdx1 Hap-lo-Insuffi ciencyARCHANA KAPOOR, WANZHU JIN, MICHAEL KARADIMOS, CONNOR FITZPAT-RICK, WATARU NISHIMURA, SUSAN BONNER-WEIR, ARUN SHARMA, Boston, MA
Although MafA was identifi ed as a glucose-responsive insulin gene tran-scription factor, during pancreatic development its expression follows that of insulin in newly formed beta cells. This observation suggests that MafA regulates function, but not the specifi cation, of insulin-producing cells. Con-sistent with this, MafA-null mice have normal looking islets with insulin-expressing cells at birth and only develop hyperglycemia with age. Addition-ally, several animal models with beta cell dysfunction had reduced MafA expression suggesting that MafA is essential for normal beta cell function.
A98
For author disclosure information, see page 797. ADA-Funded Research
ORA
LSISLET GROWTH AND DEVELOPMENT
377-ORPancreatic Parasympathectomy Impacts Hypothalamic and -Cell Adaptation to a High Fat DietMINA PESHAVARIA, AIDA HABIBOVIC, KYLA LAROCK, BASANTHI SATISH, THOMAS JETTON, Colchester, VT
The vagus nerves mediate homeostatic processes such as glucose tol-erance, compensatory -cell proliferation, and the regulation of visceral infl ammation. However, their potential roles in adaptive -cell and hypo-thalamic responses to diet-induced obesity (DIO) have not been adequately explored. In B6 mice, weight gain, mild hyperglycemia, and hyperinsulinemia are apparent by one week on a high-fat diet (HFD). Recent mouse DIO stud-ies demonstrate that hypothalamic infl ammation (HI) precedes weight gain suggesting the primacy of the hypothalamus in early adaptive processes in response to nutrient stress. To examine whether -cell adaptation and HI in response to a HFD are dependent on intact vagus nerves to the celiac plexus and pancreas, we subjected mice to a bilateral celiac vagus transec-tion (CVX) or sham surgery, followed by either a HFD or control chow one week later through 5 weeks. At week 1 in CVX-chow mice, hypothalamic tnf-a expression was increased, whereas islet infl ammatory markers did not change. By 2 weeks, tnf-a expression was markedly decreased in the CVX-chow group that normalized to that of the sham-chow group by 5 weeks. Although CVX surgery did not signifi cantly alter weight gain or worsen glu-cose or insulin tolerance, both fed and fasting glucose concentrations were elevated in CVX-HFD mice compared to the other groups. Interestingly, the CVX-HFD group exhibited a 2-fold increase over sham-HFD mice in tnf-a ex-pression at 2 weeks, though no further increase was observed at 5 weeks. Thus CVX appears to have led to a premature enhancement of HI. Although early -cell functional compensation due to a high-energy diet is moderately impacted by a selective parasympathectomy, CVX signifi cantly affects HI differentially depending on diet. These data collectively point to a complex integration of the hypothalamus and vagus nerves of the autonomic nervous system with several tissues to maintain energy homeostasis in the context of nutrient overabundance and obesity development.
via Neurog3 which perturbation causes neonatal diabetes, and [2] Glis3 ex-pression is required for normal pancreatic beta cell function in adults, which impairment leads to defective insulin production and diabetes.
Supported by: NIH (DK-68037)
375-ORPostnatal Duct-Specifi c Pdx1 Deletion Results in Formation of Pdx1 Negative Insulin Positive Immature Beta CellsLILI GUO, AKARI INADA, CRISTINA AGUAYO-MAZZUCATO, JENNIFER HOLLIS-TER-LOCK, YOSHIO FUJITANI, CHRISTOPHER V. WRIGHT, ARUN SHARMA, SU-SAN BONNER-WEIR, Boston, MA, Fukuoka, Japan, Tokyo, Japan, Nashville, TN
Pancreatic duodenal homeobox -1 (Pdx1) is a transcription factor required for pancreatic development and maintenance of beta-cell function. Our goal was to test whether Pdx1 expression in pancreatic ducts is necessary for the islet neogenesis seen during the fi rst postnatal month. With crossing CAIICre and Pdx1fl /fl mice, Pdx1 was effi ciently excised postnatally from pan-creatic duct cells starting around birth. While in the fi rst 2 days after birth bigenic mice had normal fed blood glucose values, they were moderately hyperglycemic (4 wk: 271±11 vs control 176±6 mg/dl) until 8-10 weeks. At 10 weeks, CAIICre;Pdx1fl /fl mice had near normal morning fed blood glucose (181±10 mg/dl vs 152±4 mg/dl). However, upon acute glucose challenge these mice had severely impaired glucose tolerance and reduced plasma insulin levels; insulin tolerance did not differ from control littermates. At 4 and 10 weeks, neither islet nor beta cell mass differed from littermate controls. Within the same duct-specifi c Pdx1 defi cient pancreas, there was a mixed population of islets with Pdx1 and MafA protein expression being normal in some and severely diminished in others. Many insulinpositive cells coexpressed PP/PYY/NPY, which is characteristic of embryonic and neona-tal pancreas and not seen in adult islets even from chronic hyperglycemic animals. There were even MafBpositiveGlucagonnegative cells, also refl ecting an early stage of beta cell development. Insulin secretion of isolated islets from 10 wk old duct-specifi c Pdx1 defi cient mice was severely impaired in response to glucose. This lack of glucose responsiveness is consistent with the observed impaired glucose tolerance seen in these mice and is charac-teristic of immature beta cells. In conclusion, Pdx1 is not required for the formation of new beta cells by neogenesis from ducts in the postnatal pe-riod, but the resultant Pdx1negative insulinpositive cells have the functional and morphological characteristics of immature beta cells.
Supported by: JDRF
376-ORIslet Endothelial Cells Secrete Factors that Enhance Beta Cell Glu-cose-Stimulated Insulin SecretionAMY W. LIU, REBECCA L. HULL, Seattle, WA
Islet endothelial cells secrete growth factors that are important for islet endocrine cell development and can stimulate adult beta-cell proliferation. We hypothesize that islet endothelial cells also release paracrine factors that are important for beta-cell secretory function. To test this, conditioned media were generated from immortalized murine islet endothelial cells (MS-1) following 48 hours of culture in 5.5 mM glucose. Glucose levels in con-ditioned media were determined and matched to that of non-conditioned media (not previously exposed to cells) prior to the performance of subse-quent studies, so as to avoid the potential confounding effect of different glucose concentrations. Islets from C57BL/6J mice were then cultured for 48 hours in conditioned or non-conditioned media. Glucose-stimulated insulin release, insulin content and mRNA levels of insulin and Pdx1 were measured (n=2-4 per condition). Culture of islets in media previously exposed to MS-1 cells resulted in no change in basal insulin release (24.8±4.0 vs. 25.6±3.0 pM/5 islets), but a signifi cant increase in glucose-stimulated insulin release compared to non-conditioned media (88.2±11.7 vs. 135.7±11.5 pM/5 islets, p<0.05). Insulin content tended to increase (7.9±2.5 vs. 16.0±2.8 nM/5 is-lets), as did insulin and Pdx1 mRNA levels (1.2±0.04 and 1.3±0.1 fold increase above non-conditioned media, p=0.06 and p=0.10 respectively). Our data suggest that islet endothelial cells secrete factors that enhance glucose-stimulated insulin release and may also upregulate key beta-cell genes such as insulin and Pdx1. The mechanism(s) by which this occurs, and whether this benefi cial effect is diminished under conditions of endothelial dysfunction as seen in diabetes, needs to be determined.
Supported by: NIH (R01DK088082)