Embed Size (px)
Citation preview
Heart rate (fH) has long been recognized as a general, easilymeasured indicator of cardiovascular performance, asdemonstrated in a recent special issue of ComparativeBiochemistry and Physiology devoted to the topic of fH and theinformation derived from it (Tazawa et al., 1999a). Beat-to-beat fH (i.e. instantaneous fH) fluctuations have been subject toconsiderable attention in relation to autonomic nervousfunction and cardiovascular status in mammalian adults andfoetuses (Akselrod et al., 1981; Ferrazzi et al., 1989; Fleisher,1996; Groome et al., 1994; Lindecrantz et al., 1993; Moser etal., 1994; Pagani et al., 1986). The patterns of fH fluctuationshave also been studied in foetuses to evaluate theirrelationships with foetal movements and with conditions
during pregnancy (Aladjem et al., 1977; Brubaker and Garite,1988; Hammacher et al., 1968; Pillai and James, 1990; Sorokinet al., 1982; Wheeler and Murrills, 1978). The prominentfluctuations in fH are substantial phenomena not only inmammalian foetuses but also in avian embryos. Avian embryosdevelop within the confines of an eggshell independently of thematernal body, and their physiological functions are notinfluenced by maternal functions. The patterns of fluctuationin fH recorded from embryos originate in their own cardiacpacing activities uninfluenced by maternal conditions and arecharacteristic of developing embryos. We have measuredinstantaneous fH in avian embryos, while maintaining adequategas exchange through the eggshell, and also in hatchlings
895The Journal of Experimental Biology 203, 895–903 (2000)Printed in Great Britain © The Company of Biologists Limited 2000JEB2445
There has been considerable interest in heart rate (fH)fluctuations in relation to cardiovascular control systemsand foetal conditions during pregnancy in mammals.Prominent fluctuations in fH also occur in avian embryos,which are an important experimental model for studyingdevelopmental physiology. The present study determinedthe instantaneous fH of seven chick embryos continuouslyfrom the last stage of prenatal development (day 18),throughout the pipping (perinatal) period (days 19–21)until hatching and, subsequently, of newly hatched chicks(up to day 2).
The distinctive patterns of instantaneous fH fluctuationstook the form of specific changes within a broad mean fH
baseline. Cyclic oscillations (ultradian rhythm) occurreduntil an early stage of the perinatal period, when the fH
baseline started rising. Subsequently, the baseline droppedand respiratory arrhythmia began to appear concomitantwith external pipping. During the final stage of externalpipping, when the fH baseline rose again prior to hatching,three unique patterns of instantaneous fH fluctuations wereevident: relatively long-lasting cyclic small accelerations,irregular intermittent large accelerations and short-termrepeated large accelerations. Furthermore, repeated
alternate occurrences of the latter two types of accelerationformed an additional oscillating pattern with a period of10–15 min.
During the early period after hatching, when the fH
baseline reached its maximum, instantaneous fH changedrelatively slowly accompanied by transient rapiddecelerations, probably due to augmented vagal tone.Subsequently, the mean fH baseline dropped to itsminimum, and a circadian rhythm and three types ofpreviously reported fH fluctuations (types I–III) appeared.
Developmental patterns of mean fH and the appearanceof distinctive patterns of instantaneous fluctuations in fH
and circadian rhythms were not influenced by an ultimatefailure of hatching after a normal development.
The demonstration of complex, repeatable patterns of fH
fluctuation that change during development suggests thatthe avian embryo model should be useful in studying thephenomenon of fH fluctuation and its underlying causes.
Key words: circadian rhythm, developmental pattern, heart ratefluctuation, instantaneous heart rate, mean heart rate, prenatalembryo, perinatal embryo, postnatal chick, ultradian rhythm, Gallusgallus domesticus.
Summary
Introduction
CONTINUOUS MEASUREMENTS OF INSTANTANEOUS HEART RATE AND ITSFLUCTUATIONS BEFORE AND AFTER HATCHING IN CHICKENS
K. MORIYA1, J. T. PEARSON1, W. W. BURGGREN2, A. AR3 AND H. TAZAWA1,*1Department of Electrical and Electronic Engineering, Muroran Institute of Technology, Muroran 050-8585, Japan,
2Department of Biology, College of Arts and Sciences, University of North Texas, PO Box 305189, Denton, TX76203-5189, USA and 3Department of Zoology, Faculty of Life Sciences, Tel Aviv University, PO Box 39040, Ramat-
Aviv, Tel Aviv 69978, Israel*Author for correspondence (e-mail: [email protected])
Accepted 30 December 1999; published on WWW 10 February 2000

896
(Akiyama et al., 1997, 1999; Höchel et al., 1998; Pearson etal., 1998; Pearson and Tazawa, 1999; Moriya et al., 1999;Tazawa et al., 1999b). Among eggs of altricial and precocialbirds in which fH fluctuations have been measured, those of thechicken (Gallus gallus var. domesticus) have been the mostfrequently used for experimentation because of their easyavailability and relatively large size. In addition, a thoroughinvestigation of chicken eggs and hatchlings is needed toelucidate the development and origins of fluctuations in fHbecause they provide an experimental model for understandingfH fluctuations in other avian species and in mammalianfoetuses.
In chickens, instantaneous fH has been determined both byacoustocardiography (Akiyama et al., 1997, 1999; Rahn etal., 1990; Wang et al., 1990) and using a catheterizationmethod (Höchel et al., 1998; Tazawa, 1981; Tazawa et al.,1980) for prenatal embryos during the last half of incubationand by electrocardiography for postnatal chicks (Moriya etal., 1999). For continuity of investigation of fH fluctuationsfrom prenatal embryos to postnatal chicks, the instantaneousfH of perinatal (pipped) embryos during the internal andexternal pipping period (perinatal period) was measured byelectrocardiography using wire electrodes inserted into theegg (Tazawa et al., 1999b). Three unique accelerationpatterns of instantaneous fH were found during the externalpipping period. Respiratory arrhythmia with a period of 1–1.5s was also observed during the external pipping period, andadditional oscillating patterns with a period of 10–15 minwere found in some perinatal embryos (Tazawa et al., 1999b).Generally, the electrocardiogram (ECG) was disturbedfrequently by embryonic activity, rendering impossiblecontinuous measurements of instantaneous fH for a period ofhours or a few days (Akiyama et al., 1997; Tazawa et al.,1999b). In the experiments described above with perinatalembryos, the electrodes were pushed into the egg contentsthrough the eggshell and chorioallantoic membrane so as totouch the embryonic body and therefore to measure the ECGdirectly from the body and thus minimize disturbance. Thismethod made it possible to measure additional patterns of fHfluctuations (Tazawa et al., 1999b). However, it was stilldifficult to measure instantaneous fH continuously throughoutthe hatching period, because the embryo moved in the eggduring hatching and the electrodes thus became detachedfrom the body or pierced it. The present study was designedto cope with these difficulties and to elucidate developmentalpatterns of fH and changes in instantaneous fH fluctuationsfrom the last stages of prenatal incubation to the postnatalperiod. The resulting data were used to elucidate theunexplored perinatal period and the patterns of fH fluctuationthat typify it.
Materials and methodsEggs and their incubation
Fertile eggs of broiler chickens (Gallus gallus) werepurchased from the local hatchery that had provided us with
the broiler eggs used in our previous experiments (Akiyama etal., 1997, 1999; Höchel et al., 1998; Moriya et al., 1999;Tazawa et al., 1999b). The eggs were incubated in a forceddraught incubator at 38 °C and at a relative humidity ofapproximately 60 %. The first day of incubation wasdesignated day 0. Eggs were turned automatically every hourfor 16 days to avoid the known adverse effects of lack ofturning on embryonic oxygen consumption, growth and fH(New, 1957; Tazawa, 1980; Deeming, 1989a,b; Pearson et al.,1996).
Electrode preparation and experimental protocol
Eggs were candled on day 17 of incubation to confirmnormal development of the embryo and to mark the air cell.ECG electrodes formed from three silver wires, 3 cm long and0.6 mm in diameter, were then implanted. One end of the wirewas wound round a rod (3 mm in diameter) to make a one-turnspiral, and the tip of the wire was bent into a ‘fish hook barb’.The distance between the tip and end of the spiral wasapproximately 1–2 mm. Three locations were marked on theeggshell, forming a triangle around the egg. Two sites were onthe under side of the egg between the air cell and the equatorof the egg and made up the bottom of a triangle when the eggwas placed in the horizontal position. The third site wasmarked on the top of the egg. A tiny piece of eggshell (<2 mmacross) was removed by a sharp blow with the tip of a 20 gaugehypodermic needle, which pierced the shell membranes and thechorioallantoic membrane. The tip of the spiral electrode wasinserted into the hole, and the electrode was rotated by 360 °so that the spiral part was screwed in and embedded in the egg.The electrodes were then fixed onto the eggshell using epoxyglue.
The egg with implanted electrodes was placed in a still-airincubator at 38 °C, and the electrodes were connected to shieldwires passing through a small hole in the incubator to apolygraph amplifier. The ECG was recorded continuously fromday 18 until hatching in the still-air incubator at 38 °C. Toavoid external disturbances affecting measurements, the eggwas not touched and the incubator doors were not opened. Theegg in the incubator was viewed through glass windows (10 cmwide and 30 cm long) in the doors.
When a chick hatched, it was removed briefly (for less than20 min) from the incubator for the connection of newelectrodes. Three flexible Ag/AgCl electrodes were attached tothe skin of the chick using adhesive gel on the lateral thoracicwall under both wings and on the ventral abdomen caudal tothe sternum (Moriya et al., 1999). The chick was then returnedto the incubator, which was reset at 35 °C. The first day afterhatching was designated day 0. Measurements of the ECGwere continued for three more days after hatching in the sameincubator at 35 °C. Throughout the period of measurementfrom day 18 of incubation to day 2 of postnatal life, onlynatural light was allowed to enter the incubator.
Signal processing
Instantaneous fH was determined from the amplified and
K. MORIYA AND OTHERS
897Continuous heart rate measurements in chicks
bandpass-filtered ECG signals with the aid of a computer(Moriya et al., 1999). In brief, ECG signals were sampled at4000 Hz by an analog-to-digital converter. The sampled signalswere compared with a threshold level set on the computerabove background noise levels to detect the rising deflectionof the QRS complex. The times at which the magnitude ofsampled QRS waves exceeded the threshold for the first timewere stored in sequential order in data files. Instantaneous fH(beats min−1) was then calculated from the time betweenadjacent QRS complexes.
To determine the oscillatory period of cyclic fH fluctuations,power spectrum analysis of instantaneous fH was made usinga fast Fourier transform (FFT; Moriya et al., 1999). When thecyclic fH fluctuations contained discrete changes, theoscillatory period could not always be calculated using FFT.In these instances, the number of cyclic changes (n beats) wascounted during the period when they appeared (T min), and theapproximate period of the cyclic change was then calculatedas 60T/n. To present the developmental patterns of fH from day18 of incubation to day 2 of postnatal life, mean fH over a 1 minperiod (referred to as fH–1min) was calculated from instantaneousfH data every 1 min and plotted in sequence in a single graph.
ResultsDevelopmental patterns of heart rate in eggs that hatchedContinuous measurements of instantaneous fH were made in
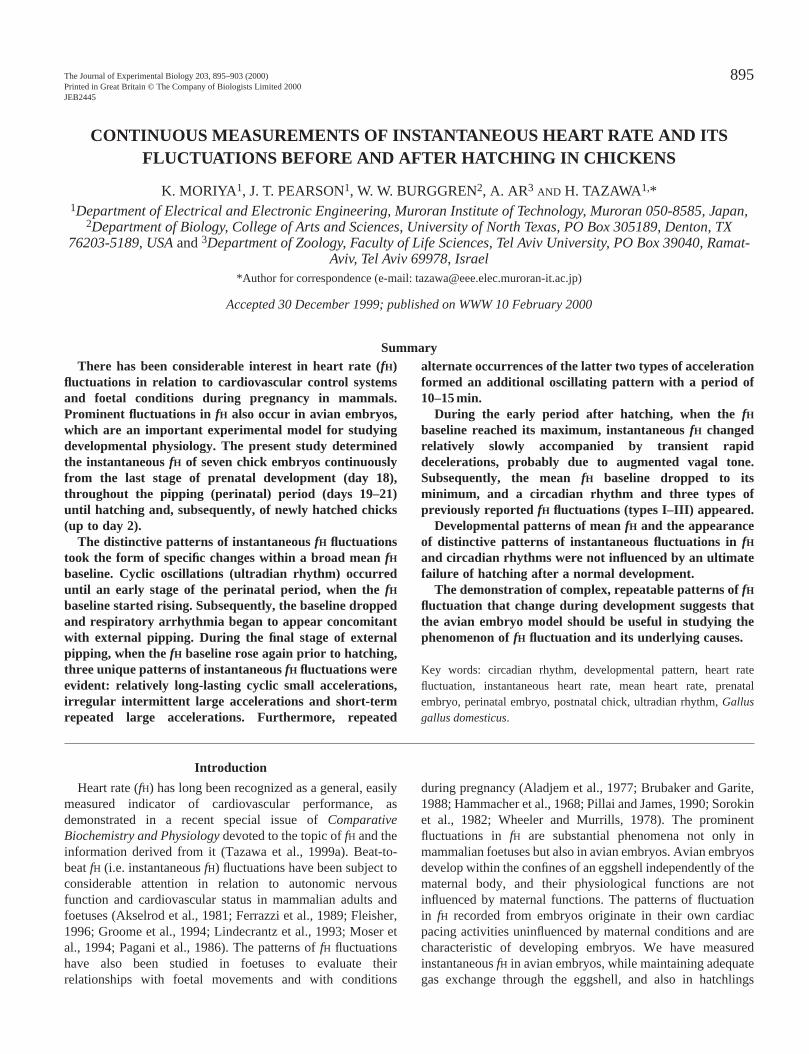
seven chicken eggs, but one failed to escape from the egg evenon day 24 of incubation. The developmental patterns of fH andchanges in instantaneous fH fluctuations with time were similaramong the six eggs that hatched, although the time andduration of individual changes in the developmental patternsand the hatching time were different. Fig. 1 presents thedevelopmental pattern of fH–1min, before and after hatching, ofa single representative individual. Measurements were startedat 12:00 h on day 18 of incubation. fH–1min fluctuated with time,producing a wide baseline (i.e. a wide fluctuation in fH). ThefH–1min baseline tended to fall towards the end of prenataldevelopment and then rose during the second half of day 19(12:00–00:00 h, marked as segment B), with a subsequent fall.Following the fall, which lasted for approximately the first halfof day 20, the fH–1min baseline rose sharply at around 12:00 h,and an elevated fH–1min baseline was maintained until hatching.
The embryo depicted in Fig. 1 hatched at approximately18:00 h on day 20. The fH–1min baseline of the newly hatchedchick, which was initially low after the electrodes had been
200
250
300
350
400
Time of incubation (days)
Mea
n he
art r
ate
(bea
ts m
in-1
)
24:0018 19 20
Time of day (h)
0
Time after hatching (days)
Hatched
1 212:00
D
A B
12:00 24:00 24:0012:00 12:00 24:00 24:0012:00 12:00 24:00
E F1 2F G H I J KC
Fig. 1. Developmental pattern of mean heart rate (fH) of a single chick before and after hatching; this example is typical of the chicks observed.Each point indicates the mean fH over a 1 min period determined from the continuous recording of instantaneous fH. The time between 06:00and 18:00 h is conventionally termed the daytime phase and is shown by open rectangles, and that from 18:00 to 06:00 h of the following day istermed the night-time phase (filled rectangles). Actual daytime was from approximately 04:50 to 18:20 h in this experiment. The downward-pointing arrow indicates the time of hatching. The upward-pointing arrows labelled with letters show the time of 10 min recordings ofinstantaneous fH presented in the following figures.
898
positioned, rose to a peak that was similar to the maximalperinatal level. Although the fH–1min baseline then dropped tosome extent, the high level of the baseline was maintained forthe first half of the following daytime phase (06:00–12:00 hon day 0), with a subsequent fall during the remaining daytimephase (12:00–18:00 h). The fH–1min baseline dropped furtherduring the next night phase (18:00–06:00 h). The fH–1min
baseline during the first half of the daytime phase(06:00–12:00 h) on day 1 dropped after transiently rising inthe early morning. It then exhibited a prominent rise duringthe remaining half of the daytime phase (12:00–18:00 h on day1), dropped during the following night phase (18:00–06:00 h)and subsequently rose during the daytime phase(06:00–18:00 h) on day 2. A prominent circadian rhythm of fHbegan to occur.
Changes in heart rate fluctuations over time in eggs thathatched
The baseline of the developmental pattern of fH–1min wasvery wide as a result of various types of fH fluctuations.Fig. 2 presents two 12 h recordings of fH–1min. Fig. 2A andFig. 2B correspond to segments A and B in Fig. 1 and cover24 consecutive hours of recording on day 19. fH–1min
fluctuated cyclically during the first 12 h (Fig. 2A) and overthe next 5 h period (Fig. 2B) and was independent of diurnalphase. Spectral analysis of instantaneous fH datacorresponding to Fig. 2A indicated that the fluctuation wascyclic with an oscillatory period of 42 min, i.e. that there wasan ultradian rhythm that oscillated with a period of less than24 h.
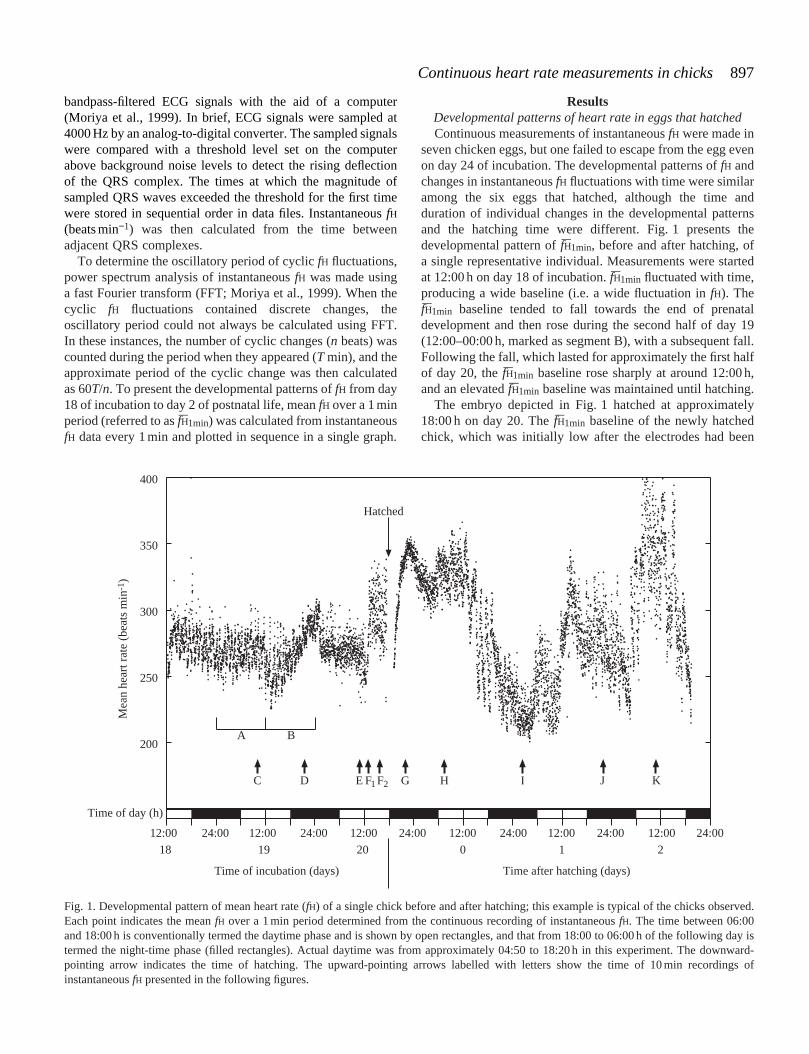
Instantaneous fH fluctuations consisted of variousdistinctive patterns before and after hatching. Fig. 3 presentsexamples of instantaneous fH fluctuations recorded for the10 min period before hatching. Fig. 3A–E corresponds to theperiods indicated by C, D, E, F1 and F2, respectively, in Fig. 1.During the ultradian rhythm and the following increase in
fH shown in Fig. 2, rapid transient decelerations andaccelerations occurred frequently (Fig. 3A,B). When fHdecreased prior to the final increase during the last stage ofthe perinatal period, the instantaneous fH baseline occasionallybecame wide (Fig. 3C). After this, the instantaneous fH beganto oscillate, and the fH baseline rose again to the final maximallevel (Fig. 3D). Because fH accelerations occurred rapidly,and thus discretely, the oscillatory period could not bedetermined by spectrum analysis, and it was thereforeapproximated by counting the oscillations. The peaks ofoscillation appeared 37 times during the 10 min period,corresponding to an oscillatory period of approximately 16 s.During the last stage of the perinatal period when fH peaked,the distinctive acceleration patterns of fH appeared (Fig. 3E);the pattern consisted of intermittent irregular accelerationsand large accelerations that were repeated for short periods nolonger than 5 min. These distinct acceleration patternssignalled imminent hatching not only in this embryo but alsoin the other five embryos that hatched.
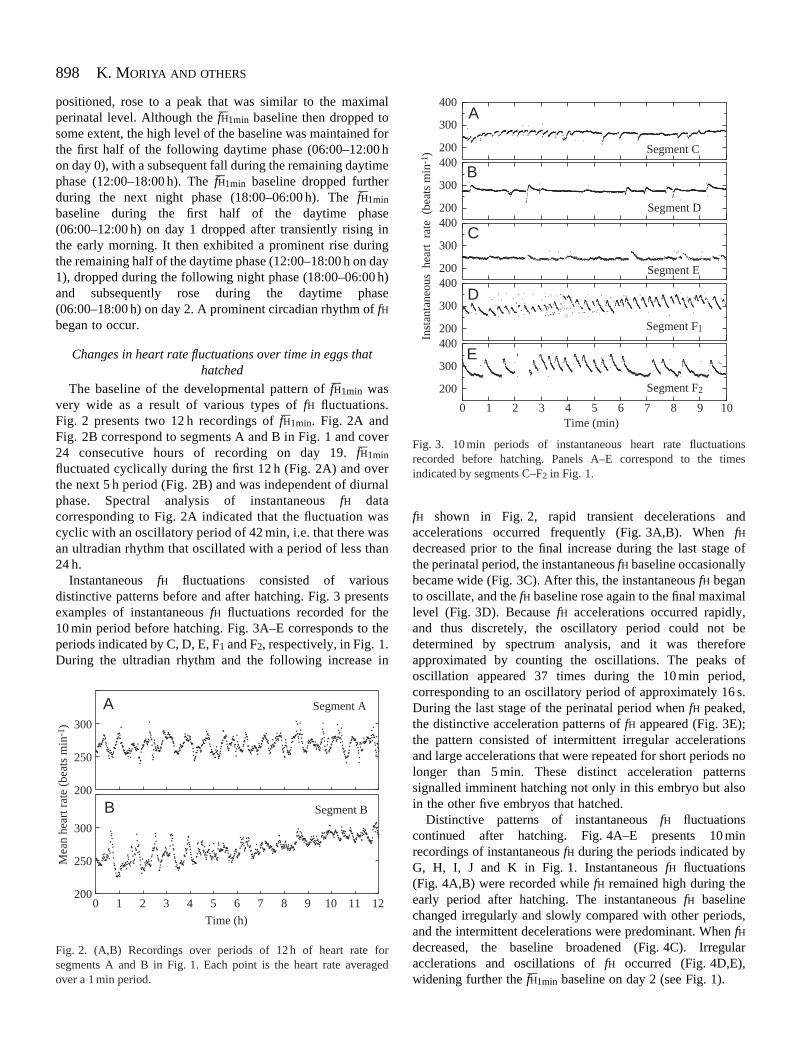
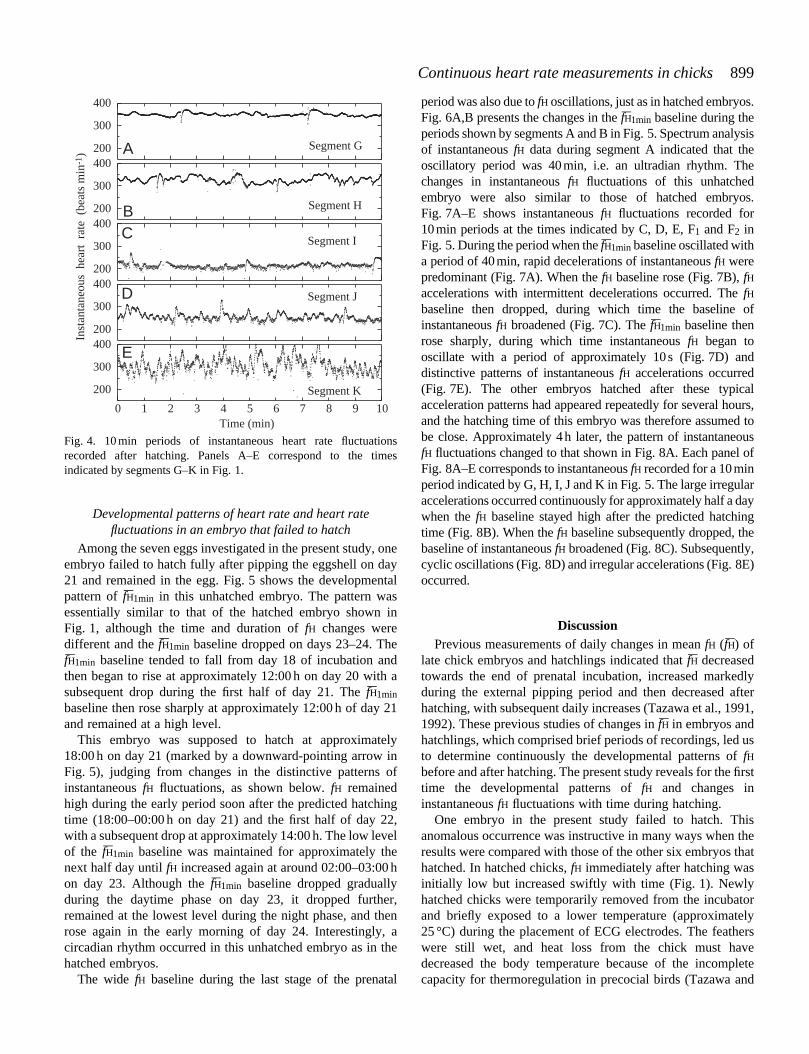
Distinctive patterns of instantaneous fH fluctuationscontinued after hatching. Fig. 4A–E presents 10 minrecordings of instantaneous fH during the periods indicated byG, H, I, J and K in Fig. 1. Instantaneous fH fluctuations(Fig. 4A,B) were recorded while fH remained high during theearly period after hatching. The instantaneous fH baselinechanged irregularly and slowly compared with other periods,and the intermittent decelerations were predominant. When fHdecreased, the baseline broadened (Fig. 4C). Irregularacclerations and oscillations of fH occurred (Fig. 4D,E),widening further the fH–1min baseline on day 2 (see Fig. 1).
K. MORIYA AND OTHERS
200
250
300
0 1 2 3 4 5 6 7 8 9 10 11 12200
250
300
Mea
n he
art r
ate
(bea
ts m
in-1
)
Time (h)
A
B
Segment A
Segment B
Fig. 2. (A,B) Recordings over periods of 12 h of heart rate forsegments A and B in Fig. 1. Each point is the heart rate averagedover a 1 min period.
200
300
400
200
300
400
200
300
400
200
300
400
0 1 2 3 4 5 6 7 8 9 10
200
300
400
Time (min)In
stan
tane
ous
hea
rt r
ate
(be
ats
min
-1)
A
B
C
D
E
Segment F2
Segment F1
Segment E
Segment D
Segment C
Fig. 3. 10 min periods of instantaneous heart rate fluctuationsrecorded before hatching. Panels A–E correspond to the timesindicated by segments C–F2 in Fig. 1.
899Continuous heart rate measurements in chicks
Developmental patterns of heart rate and heart ratefluctuations in an embryo that failed to hatch
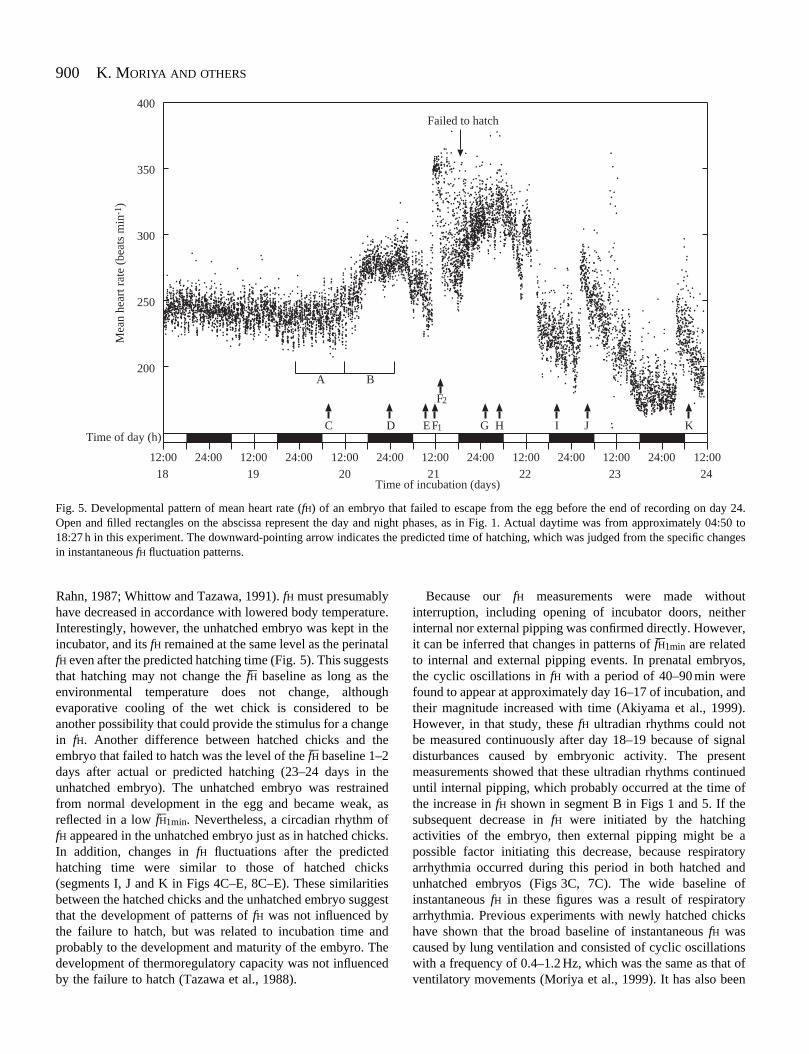
Among the seven eggs investigated in the present study, oneembryo failed to hatch fully after pipping the eggshell on day21 and remained in the egg. Fig. 5 shows the developmentalpattern of fH–1min in this unhatched embryo. The pattern wasessentially similar to that of the hatched embryo shown inFig. 1, although the time and duration of fH changes weredifferent and the fH–1min baseline dropped on days 23–24. ThefH–1min baseline tended to fall from day 18 of incubation andthen began to rise at approximately 12:00 h on day 20 with asubsequent drop during the first half of day 21. The fH–1min
baseline then rose sharply at approximately 12:00 h of day 21and remained at a high level.
This embryo was supposed to hatch at approximately18:00 h on day 21 (marked by a downward-pointing arrow inFig. 5), judging from changes in the distinctive patterns ofinstantaneous fH fluctuations, as shown below. fH remainedhigh during the early period soon after the predicted hatchingtime (18:00–00:00 h on day 21) and the first half of day 22,with a subsequent drop at approximately 14:00 h. The low levelof the fH–1min baseline was maintained for approximately thenext half day until fH increased again at around 02:00–03:00 hon day 23. Although the fH–1min baseline dropped graduallyduring the daytime phase on day 23, it dropped further,remained at the lowest level during the night phase, and thenrose again in the early morning of day 24. Interestingly, acircadian rhythm occurred in this unhatched embryo as in thehatched embryos.
The wide fH baseline during the last stage of the prenatal
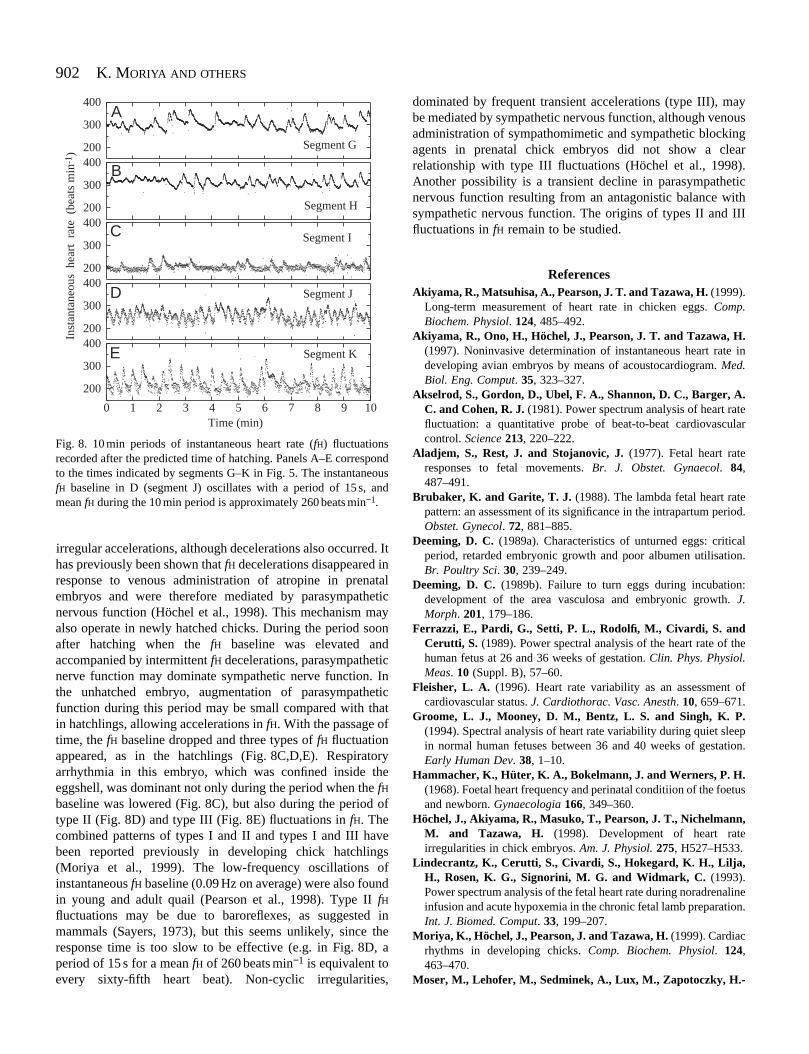
period was also due to fH oscillations, just as in hatched embryos.Fig. 6A,B presents the changes in the fH–1min baseline during theperiods shown by segments A and B in Fig. 5. Spectrum analysisof instantaneous fH data during segment A indicated that theoscillatory period was 40 min, i.e. an ultradian rhythm. Thechanges in instantaneous fH fluctuations of this unhatchedembryo were also similar to those of hatched embryos.Fig. 7A–E shows instantaneous fH fluctuations recorded for10 min periods at the times indicated by C, D, E, F1 and F2 inFig. 5. During the period when the fH–1min baseline oscillated witha period of 40 min, rapid decelerations of instantaneous fH werepredominant (Fig. 7A). When the fH baseline rose (Fig. 7B), fHaccelerations with intermittent decelerations occurred. The fHbaseline then dropped, during which time the baseline ofinstantaneous fH broadened (Fig. 7C). The fH–1min baseline thenrose sharply, during which time instantaneous fH began tooscillate with a period of approximately 10 s (Fig. 7D) anddistinctive patterns of instantaneous fH accelerations occurred(Fig. 7E). The other embryos hatched after these typicalacceleration patterns had appeared repeatedly for several hours,and the hatching time of this embryo was therefore assumed tobe close. Approximately 4 h later, the pattern of instantaneousfH fluctuations changed to that shown in Fig. 8A. Each panel ofFig. 8A–E corresponds to instantaneous fH recorded for a 10 minperiod indicated by G, H, I, J and K in Fig. 5. The large irregularaccelerations occurred continuously for approximately half a daywhen the fH baseline stayed high after the predicted hatchingtime (Fig. 8B). When the fH baseline subsequently dropped, thebaseline of instantaneous fH broadened (Fig. 8C). Subsequently,cyclic oscillations (Fig. 8D) and irregular accelerations (Fig. 8E)occurred.
DiscussionPrevious measurements of daily changes in mean fH (fH–) of
late chick embryos and hatchlings indicated that fH– decreasedtowards the end of prenatal incubation, increased markedlyduring the external pipping period and then decreased afterhatching, with subsequent daily increases (Tazawa et al., 1991,1992). These previous studies of changes in fH– in embryos andhatchlings, which comprised brief periods of recordings, led usto determine continuously the developmental patterns of fHbefore and after hatching. The present study reveals for the firsttime the developmental patterns of fH and changes ininstantaneous fH fluctuations with time during hatching.
One embryo in the present study failed to hatch. Thisanomalous occurrence was instructive in many ways when theresults were compared with those of the other six embryos thathatched. In hatched chicks, fH immediately after hatching wasinitially low but increased swiftly with time (Fig. 1). Newlyhatched chicks were temporarily removed from the incubatorand briefly exposed to a lower temperature (approximately25 °C) during the placement of ECG electrodes. The featherswere still wet, and heat loss from the chick must havedecreased the body temperature because of the incompletecapacity for thermoregulation in precocial birds (Tazawa and
200
300
400
200
300
400
200
300
400
200
300
400
0 1 2 3 4 5 6 7 8 9 10
200
300
400
Time (min)
Inst
anta
neou
s h
eart
rat
e (
beat
s m
in-1
) A
BC
D
E
Segment G
Segment H
Segment I
Segment J
Segment K
Fig. 4. 10 min periods of instantaneous heart rate fluctuationsrecorded after hatching. Panels A–E correspond to the timesindicated by segments G–K in Fig. 1.
900
Rahn, 1987; Whittow and Tazawa, 1991). fH must presumablyhave decreased in accordance with lowered body temperature.Interestingly, however, the unhatched embryo was kept in theincubator, and its fH remained at the same level as the perinatalfH even after the predicted hatching time (Fig. 5). This suggeststhat hatching may not change the fH– baseline as long as theenvironmental temperature does not change, althoughevaporative cooling of the wet chick is considered to beanother possibility that could provide the stimulus for a changein fH. Another difference between hatched chicks and theembryo that failed to hatch was the level of the fH– baseline 1–2days after actual or predicted hatching (23–24 days in theunhatched embryo). The unhatched embryo was restrainedfrom normal development in the egg and became weak, asreflected in a low fH–1min. Nevertheless, a circadian rhythm offH appeared in the unhatched embryo just as in hatched chicks.In addition, changes in fH fluctuations after the predictedhatching time were similar to those of hatched chicks(segments I, J and K in Figs 4C–E, 8C–E). These similaritiesbetween the hatched chicks and the unhatched embryo suggestthat the development of patterns of fH was not influenced bythe failure to hatch, but was related to incubation time andprobably to the development and maturity of the embyro. Thedevelopment of thermoregulatory capacity was not influencedby the failure to hatch (Tazawa et al., 1988).
Because our fH measurements were made withoutinterruption, including opening of incubator doors, neitherinternal nor external pipping was confirmed directly. However,it can be inferred that changes in patterns of fH–1min are relatedto internal and external pipping events. In prenatal embryos,the cyclic oscillations in fH with a period of 40–90 min werefound to appear at approximately day 16–17 of incubation, andtheir magnitude increased with time (Akiyama et al., 1999).However, in that study, these fH ultradian rhythms could notbe measured continuously after day 18–19 because of signaldisturbances caused by embryonic activity. The presentmeasurements showed that these ultradian rhythms continueduntil internal pipping, which probably occurred at the time ofthe increase in fH shown in segment B in Figs 1 and 5. If thesubsequent decrease in fH were initiated by the hatchingactivities of the embryo, then external pipping might be apossible factor initiating this decrease, because respiratoryarrhythmia occurred during this period in both hatched andunhatched embryos (Figs 3C, 7C). The wide baseline ofinstantaneous fH in these figures was a result of respiratoryarrhythmia. Previous experiments with newly hatched chickshave shown that the broad baseline of instantaneous fH wascaused by lung ventilation and consisted of cyclic oscillationswith a frequency of 0.4–1.2 Hz, which was the same as that ofventilatory movements (Moriya et al., 1999). It has also been
K. MORIYA AND OTHERS
200
250
300
350
400
Time of incubation (days)
Mea
n he
art r
ate
(bea
ts m
in-1
)
24:0018 19 20
Time of day (h)
21 22 2312:00
A B
C D EF
F
I J K
12:00 24:00 24:0012:0012:00 24:00 24:0012:00 12:00 24:00 12:0024
Failed to hatch
1
2
G H
Fig. 5. Developmental pattern of mean heart rate (fH) of an embryo that failed to escape from the egg before the end of recording on day 24.Open and filled rectangles on the abscissa represent the day and night phases, as in Fig. 1. Actual daytime was from approximately 04:50 to18:27 h in this experiment. The downward-pointing arrow indicates the predicted time of hatching, which was judged from the specific changesin instantaneous fH fluctuation patterns.

901Continuous heart rate measurements in chicks
confirmed previously that the wide baseline of instantaneousfH, signalling respiratory arrhythmia, occurred in externalpipping embryos (Tazawa et al., 1999b). Thus, the externalpipping period seemed to consist of two phases; the first wasthe period when the fH–1min baseline dropped, and this wasfollowed by the second phase which began with a sharp rise inthe fH–1min baseline.
During the second phase of external pipping, instantaneousfH began to accelerate cyclically with a period ofapproximately 16 s in the hatched embryo (Fig. 3D) and ofapproximately 10 s in the unhatched embryo (Fig. 7D). Theincrease in fH was approximately 50 beats min−1 in the formerand 30 beats min−1 in the latter. In other hatched embryos, theincrease was also no more than 50 beats min−1, and the periodof these cyclic acceleration patterns ranged from 10 to 24 s.The cyclic accelerations lasted for several tens of minutes witha rise of fH baseline and subsequent plateau. The instantaneousfH baseline then dropped, and irregular intermittent largeaccelerations occurred. With time, irregular intermittent largeaccelerations occasionally turned into repeated accelerationpatterns lasting for a short period, no longer than 5 min(referred to as short-term repeated large accelerations; Figs 3E,7E). When the irregular intermittent large accelerationsoccurred, the baseline tended to fall for several minutes.During the period of short-term repeated large accelerations,the baseline tended to rise. Thus, the repeated occurrences ofirregular accelerations and repeated accelerations formedadditional oscillatory patterns with a period of 10–15 min (toppanel in Fig. 5 of Tazawa et al., 1999b). As a result, threepatterns of instantaneous fH accelerations characterized the lastphase of external pipping period: relatively long-lasting cyclicsmall accelerations, which appeared first (Figs 3D, 7D),irregular intermittent large accelerations and short-termrepeated large accelerations (Figs 3E, 7E). The appearance ofthe latter two patterns was an indication of imminent hatching.
The fH–1min baseline widened further after hatching becauseof augmented fluctuations in fH. During the period when the
fH–1min baseline reached a peak soon after hatching, theinstantaneous fH baseline changed relatively slowly, andintermittent fH decelerations dominated (Fig. 4A). With thepassage of time, the changes in instantaneous fH baselinebecame fast and augmented, but fH decelerations were stilldominant (Fig. 4B). These fH fluctuations with markedintermittent decelerations were similar in all chicks. When thefH–1min baseline reached a minimum, respiratory arrhythmiabecame apparent (Fig. 4C). Subsequently, the instantaneous fHfluctuations were increasingly augmented by irregularaccelerations (Fig. 4D) and cyclic accelerations (Fig. 4E). Thefluctuations in fH shown in Fig. 4C, D and E correspond tothose grouped into three types (types I, III and II, respectively)categorized in the previous report (Moriya et al., 1999): type Iis categorized as a widespread baseline fH (20–50 beats min−1)due to respiratory arrhythmia with a mean oscillatoryfrequency of 0.74 Hz (range 0.4–1.2 Hz); type III is categorizedas non-cyclic irregularities, dominated by frequent transientaccelerations; and type II is categorized as low-frequencyoscillations of the instantaneous fH baseline at a meanfrequency of 0.07 Hz (range 0.04–0.1 Hz).
The development of instantaneous fluctuations in fH after thepredicted hatching time in the unhatched embryo wassubstantially the same as that in hatched eggs except for theperiod soon after the predicted hatching time (segments G andH in Figs 1, 5). During this period, while the intermittentdecelerations were dominant and instantaneous fH baselinechanges were relatively slow and small in hatchlings (segmentsG and H in Fig. 1), in the unhatched embryo the fH baselinechanged swiftly and frequently, forming large and wide
200
250
300
0 1 2 3 4 5 6 7 8 9 10 11 12200
250
300
Mea
n he
art r
ate
(bea
ts m
in-1
)
Time (h)
A
B
Segment A
Segment B
Fig. 6. (A,B) Recordings over periods of 12 h of mean heart ratesaveraged over 1 min periods, corresponding to segments A and B inFig. 5.
200
300
400
200
300
400
200
300
400
200
300
400
0 1 2 3 4 5 6 7 8 9 10
200
300
400
Time (min)In
stan
tane
ous
hea
rt r
ate
(be
ats
min
-1)
A
B
C
D
E
Segment C
Segment D
Segment E
Segment F1
Segment F2
Fig. 7. 10 min periods of instantaneous heart rate fluctuationsrecorded before the predicted time of hatching. Panels A–Ecorrespond to the times indicated by segments C–F2 in Fig. 5.
902
irregular accelerations, although decelerations also occurred. Ithas previously been shown that fH decelerations disappeared inresponse to venous administration of atropine in prenatalembryos and were therefore mediated by parasympatheticnervous function (Höchel et al., 1998). This mechanism mayalso operate in newly hatched chicks. During the period soonafter hatching when the fH baseline was elevated andaccompanied by intermittent fH decelerations, parasympatheticnerve function may dominate sympathetic nerve function. Inthe unhatched embryo, augmentation of parasympatheticfunction during this period may be small compared with thatin hatchlings, allowing accelerations in fH. With the passage oftime, the fH baseline dropped and three types of fH fluctuationappeared, as in the hatchlings (Fig. 8C,D,E). Respiratoryarrhythmia in this embryo, which was confined inside theeggshell, was dominant not only during the period when the fHbaseline was lowered (Fig. 8C), but also during the period oftype II (Fig. 8D) and type III (Fig. 8E) fluctuations in fH. Thecombined patterns of types I and II and types I and III havebeen reported previously in developing chick hatchlings(Moriya et al., 1999). The low-frequency oscillations ofinstantaneous fH baseline (0.09 Hz on average) were also foundin young and adult quail (Pearson et al., 1998). Type II fHfluctuations may be due to baroreflexes, as suggested inmammals (Sayers, 1973), but this seems unlikely, since theresponse time is too slow to be effective (e.g. in Fig. 8D, aperiod of 15 s for a mean fH of 260 beats min−1 is equivalent toevery sixty-fifth heart beat). Non-cyclic irregularities,
dominated by frequent transient accelerations (type III), maybe mediated by sympathetic nervous function, although venousadministration of sympathomimetic and sympathetic blockingagents in prenatal chick embryos did not show a clearrelationship with type III fluctuations (Höchel et al., 1998).Another possibility is a transient decline in parasympatheticnervous function resulting from an antagonistic balance withsympathetic nervous function. The origins of types II and IIIfluctuations in fH remain to be studied.
ReferencesAkiyama, R., Matsuhisa, A., Pearson, J. T. and Tazawa, H. (1999).
Long-term measurement of heart rate in chicken eggs. Comp.Biochem. Physiol. 124, 485–492.
Akiyama, R., Ono, H., Höchel, J., Pearson, J. T. and Tazawa, H.(1997). Noninvasive determination of instantaneous heart rate indeveloping avian embryos by means of acoustocardiogram. Med.Biol. Eng. Comput. 35, 323–327.
Akselrod, S., Gordon, D., Ubel, F. A., Shannon, D. C., Barger, A.C. and Cohen, R. J. (1981). Power spectrum analysis of heart ratefluctuation: a quantitative probe of beat-to-beat cardiovascularcontrol. Science 213, 220–222.
Aladjem, S., Rest, J. and Stojanovic, J. (1977). Fetal heart rateresponses to fetal movements. Br. J. Obstet. Gynaecol. 84,487–491.
Brubaker, K. and Garite, T. J. (1988). The lambda fetal heart ratepattern: an assessment of its significance in the intrapartum period.Obstet. Gynecol. 72, 881–885.
Deeming, D. C. (1989a). Characteristics of unturned eggs: criticalperiod, retarded embryonic growth and poor albumen utilisation.Br. Poultry Sci. 30, 239–249.
Deeming, D. C. (1989b). Failure to turn eggs during incubation:development of the area vasculosa and embryonic growth. J.Morph. 201, 179–186.
Ferrazzi, E., Pardi, G., Setti, P. L., Rodolfi, M., Civardi, S. andCerutti, S. (1989). Power spectral analysis of the heart rate of thehuman fetus at 26 and 36 weeks of gestation. Clin. Phys. Physiol.Meas. 10 (Suppl. B), 57–60.
Fleisher, L. A. (1996). Heart rate variability as an assessment ofcardiovascular status. J. Cardiothorac. Vasc. Anesth. 10, 659–671.
Groome, L. J., Mooney, D. M., Bentz, L. S. and Singh, K. P.(1994). Spectral analysis of heart rate variability during quiet sleepin normal human fetuses between 36 and 40 weeks of gestation.Early Human Dev. 38, 1–10.
Hammacher, K., Hüter, K. A., Bokelmann, J. and Werners, P. H.(1968). Foetal heart frequency and perinatal conditiion of the foetusand newborn. Gynaecologia 166, 349–360.
Höchel, J., Akiyama, R., Masuko, T., Pearson, J. T., Nichelmann,M. and Tazawa, H. (1998). Development of heart rateirregularities in chick embryos. Am. J. Physiol. 275, H527–H533.
Lindecrantz, K., Cerutti, S., Civardi, S., Hokegard, K. H., Lilja,H., Rosen, K. G., Signorini, M. G. and Widmark, C. (1993).Power spectrum analysis of the fetal heart rate during noradrenalineinfusion and acute hypoxemia in the chronic fetal lamb preparation.Int. J. Biomed. Comput. 33, 199–207.
Moriya, K., Höchel, J., Pearson, J. and Tazawa, H. (1999). Cardiacrhythms in developing chicks. Comp. Biochem. Physiol. 124,463–470.
Moser, M., Lehofer, M., Sedminek, A., Lux, M., Zapotoczky, H.-
K. MORIYA AND OTHERS
200
300
400
200
300
400
200
300
400
200
300
400
0 1 2 3 4 5 6 7 8 9 10
200
300
400
Time (min)
Inst
anta
neou
s h
eart
rat
e (
beat
s m
in-1
)
A
B
C
D
E
Segment G
Segment H
Segment I
Segment J
Segment K
Fig. 8. 10 min periods of instantaneous heart rate (fH) fluctuationsrecorded after the predicted time of hatching. Panels A–E correspondto the times indicated by segments G–K in Fig. 5. The instantaneousfH baseline in D (segment J) oscillates with a period of 15 s, andmean fH during the 10 min period is approximately 260 beats min−1.
903Continuous heart rate measurements in chicks
G., Kenner, T. and Noordergraaf, A. (1994). Heart ratevariability as a prognostic tool in cardiology: a contribution to theproblem from a theoretical point of view. Circulation 90,1078–1082.
New, D. A. T. (1957). A critical period for the turning of hens’ eggs.J. Embryol. Exp. Morph. 5, 293–299.
Pagani, M., Lombardi, F., Guzzetti, S., Furlan, R., Pizzinelli, P.,Rimoldi, S., Sandrone, G., Malfatto, G., Dall’Orto, S., Picaluga,E., Turiel, M., Baselli, G., Cerutti, S. and Malliani, A. (1986).Power spectral analysis of a beat-to-beat heart and blood pressurevariabilities as a marker of sympathovagal interaction in man andconscious dog. Circ. Res. 59, 178–193.
Pearson, J. T., Haque, M. A., Hou, P.-C. L. and Tazawa, H. (1996).Developmental patterns of O2 consumption, heart rate and O2 pulsein unturned eggs. Respir. Physiol. 103, 83–87.
Pearson, J. T. and Tazawa, H. (1999). Ontogeny of heart rate inembryonic and nestling crows (Corvus corone and Corvusmacrorhynchos). J. Comp. Physiol. B 169, 256–262.
Pearson, J. T., Tsuzuki, M., Nakane, Y., Akiyama, R. and Tazawa,H. (1998). Development of heart rate in the precocial king quailCoturnix chinensis. J. Exp. Biol. 201, 931–941.
Pillai, M. and James, D. (1990). The development of fetal heart ratepatterns during normal pregnancy. Obstet. Gynecol. 76, 812–816.
Rahn, H., Poturalski, S. A. and Paganelli, C. V. (1990). Theacoustocardiogram: a noninvasive method for measuring heart rateof avian embryos in ovo. J. Appl. Physiol. 69, 1546–1548.
Sayers, B. McA. (1973). Analysis of heart rate variability.Ergonomics 6, 17–32.
Sorokin, Y., Dierker, L. J., Pillay, S. K., Zador, I. E., Schreiner,M. L. and Rosen, M. G. (1982). The association between fetalheart rate patterns and fetal movements in pregnancies between 20and 30 week’s gestation. Am. J. Obstet. Gynecol. 143, 243–249.
Tazawa, H. (1980). Adverse effect of failure to turn the avian egg onembryo oxygen exchange. Respir. Physiol. 41, 137–142.
Tazawa, H. (1981). Measurement of blood pressure of chick embryowith an implanted needle catheter. J. Appl. Physiol. 51, 1023–1026.
Tazawa, H., Ar, A., Rahn, H. and Piiper, J. (1980). Repetitive andsimultaneous sampling from the air cell and blood vessels in thechick embryo. Respir. Physiol. 39, 265–272.
Tazawa, H., Burggren, W. W. and Ar, A. (1999a). Introduction: onthe significance of cardiac rhythms. Comp. Biochem. Physiol. 124,367–368.
Tazawa, H., Hiraguchi, T., Kuroda, O., Tullett, S. G. andDeeming, O. C. (1991). Embryonic heart rate during developmentof domesticated birds. Physiol. Zool. 64, 1002–1022.
Tazawa, H., Mitsubayashi, H., Hirata, M., Höchel, J. and Pearson,J. T. (1999b). Cardiac rhythms in chick embryos during hatching.Comp. Biochem. Physiol. 124, 513–523.
Tazawa, H. and Rahn, H. (1986). Tolerance of chick embryos tolow temperatures in reference to the heart rate. Comp. Biochem.Physiol. 85A, 531–534.
Tazawa, H., Takami, M., Kobayashi, K., Hasegawa, J. and Ar, A.(1992). Non-invasive determination of heart rate in newly hatchedchicks. Br. Poultry Sci. 33, 1111–1118.
Tazawa, H., Wakayama, H., Turner, J. S. and Paganelli, C. V.(1988). Metabolic compensation for gradual cooling in developingchick embryos. Comp. Biochem. Physiol. 89A, 125–129.
Wang, N., Butler, J. P. and Banzett, R. B. (1990). Gas exchangeacross avian eggshells oscillates in phase with heartbeat. J. Appl.Physiol. 69, 1546–1552.
Wheeler, T. and Murrills, A. (1978). Patterns of fetal heart rateduring normal pregnacy. Br. J. Obstet. Gynaecol. 85, 18–27.
Whittow, G. C. and Tazawa, H. (1991). The early development ofthermoregulation in birds. Physiol. Zool. 64, 1371–1390.