Embed Size (px)
Citation preview
Continuous Improvement Planning
2014
A three-hour training for experienced school-based decision making members
Session Overview
This session will provide the basics needed to understand the school’s continuous improvement planning process.
These SBDM training materials were developed by the Kentucky Department of Education for use in training experienced school council members in implementing school-based decision making.
Student Achievement
The school council’s mission is to improve student achievement. Each school council must create an environment in their own school that will result in students achieving at high levels. All policies and decisions by the school council must contribute to achievement of the overall school mission.
Objectives:
• The WHY, The WHAT, and The HOW• ASSIST Basics• What makes a good plan?• The School Report Card• From Data to Improvement Planning
What do you already know about planning?1. Is the school responsible for developing a school
improvement plan annually?
2. Does the school need to include survey data as part of a needs assessment?
3. Does the school improvement plan necessarily need to be done electronically?
4. Must the school look at achievement gap data?
5. Is the school required to post their improvement plan on their school’s website?

YES
Question 1
Is the school responsible for developing a school improvement plan annually?
Subsection (1): Each school or district shall annually develop, review, and revise a comprehensive school or district improvement plan.
Question 2
Does the school need to include survey data as part of a needs assessment?
Subsection (2)(b)3: Perception data gathered from the administration of a valid and reliable measure of teaching and learning conditions
Question 3
Does the school improvement plan necessarily need to be done electronically?
Subsection (4): Other required components in the process shall include:
e) Electronic submission of all elements of the plan.
Question 4
Must the school look at achievement gap data?
Subsection (5): A CSIP shall also include the elements required of schools by KRS 158.649(5).
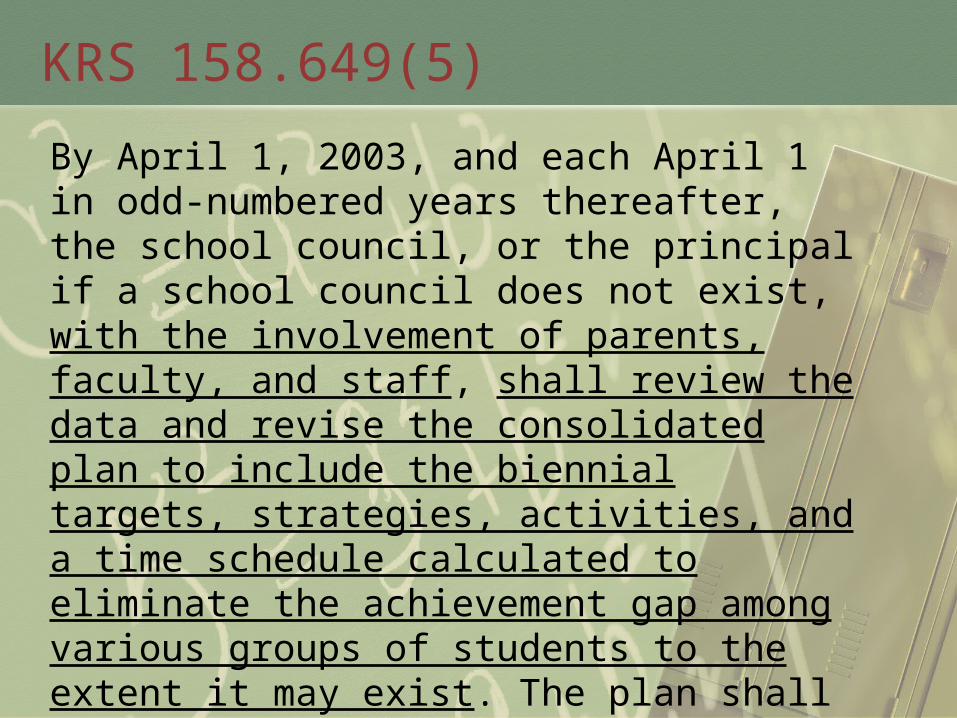
KRS 158.649(5)
By April 1, 2003, and each April 1 in odd-numbered years thereafter, the school council, or the principal if a school council does not exist, with the involvement of parents, faculty, and staff, shall review the data and revise the consolidated plan to include the biennial targets, strategies, activities, and a time schedule calculated to eliminate the achievement gap among various groups of students to the extent it may exist. The plan shall include but not be limited to activities designed to address the following areas:
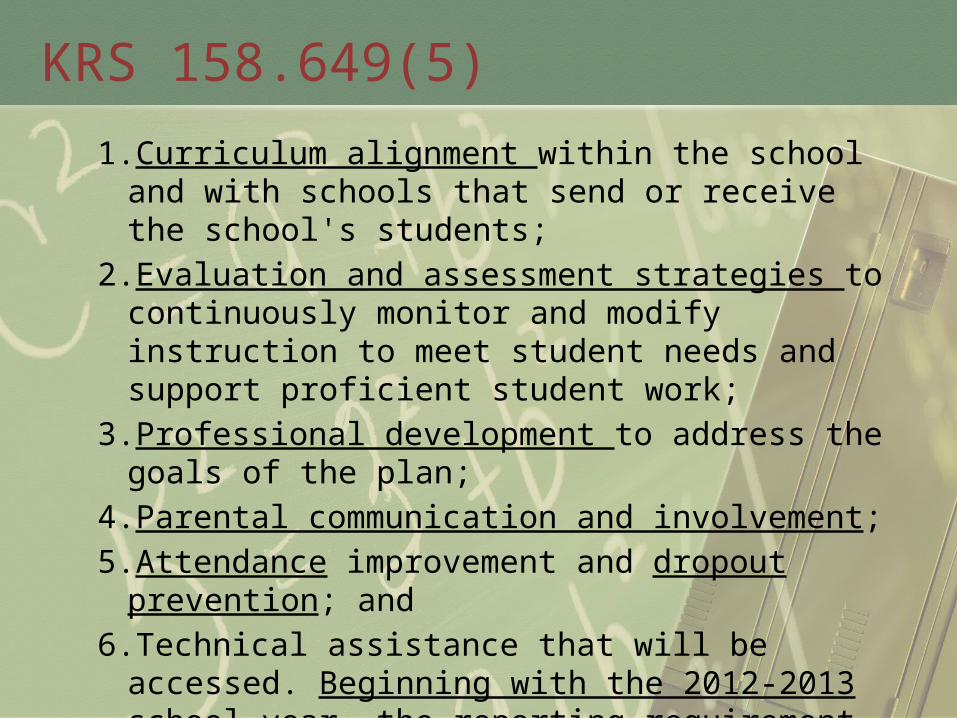
KRS 158.649(5)
1.Curriculum alignment within the school and with schools that send or receive the school's students;
2.Evaluation and assessment strategies to continuously monitor and modify instruction to meet student needs and support proficient student work;
3.Professional development to address the goals of the plan;
4.Parental communication and involvement;
5.Attendance improvement and dropout prevention; and
6.Technical assistance that will be accessed. Beginning with the 2012-2013 school year, the reporting requirement in this subsection shall be October 1 of each year.
Question 5
Is the school required to post their improvement plan on their school’s website?
Subsection (11): The CDIP for each district shall be posted to the district’s Web site. The CSIP for each school shall be posted to the school’s Web site.

THE WHY, THE
WHAT, AND
THE HOW
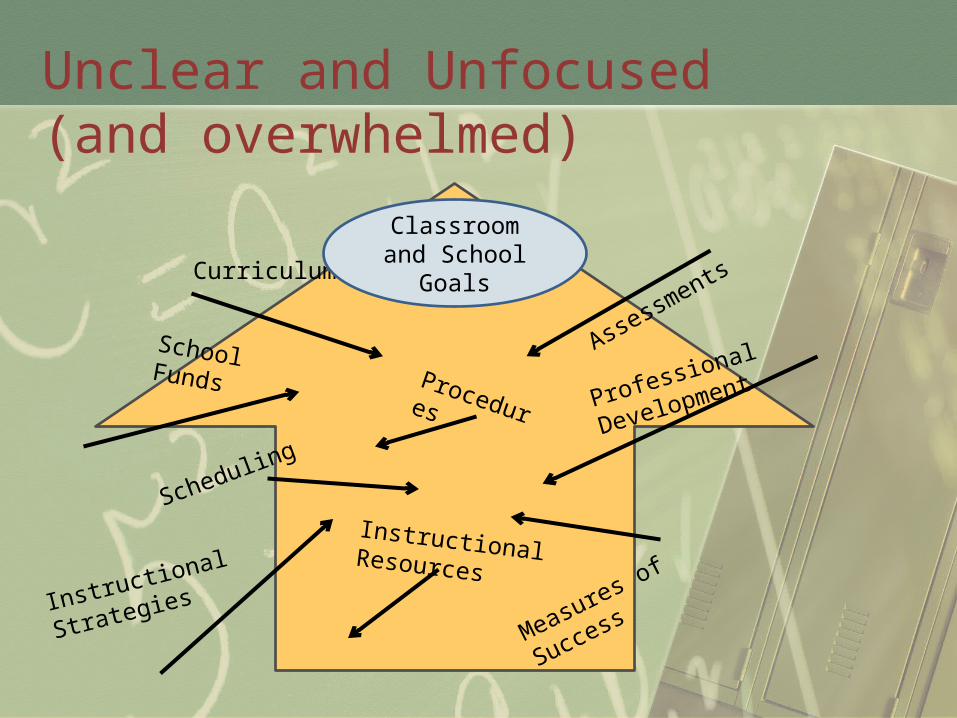
Unclear and Unfocused (and overwhelmed)
Curriculum
Assessments
Scheduling
Procedures
Measures of Success
School FundsProfessional Development
Instructional Resources
Instructional Strategies
Classroom and School Goals
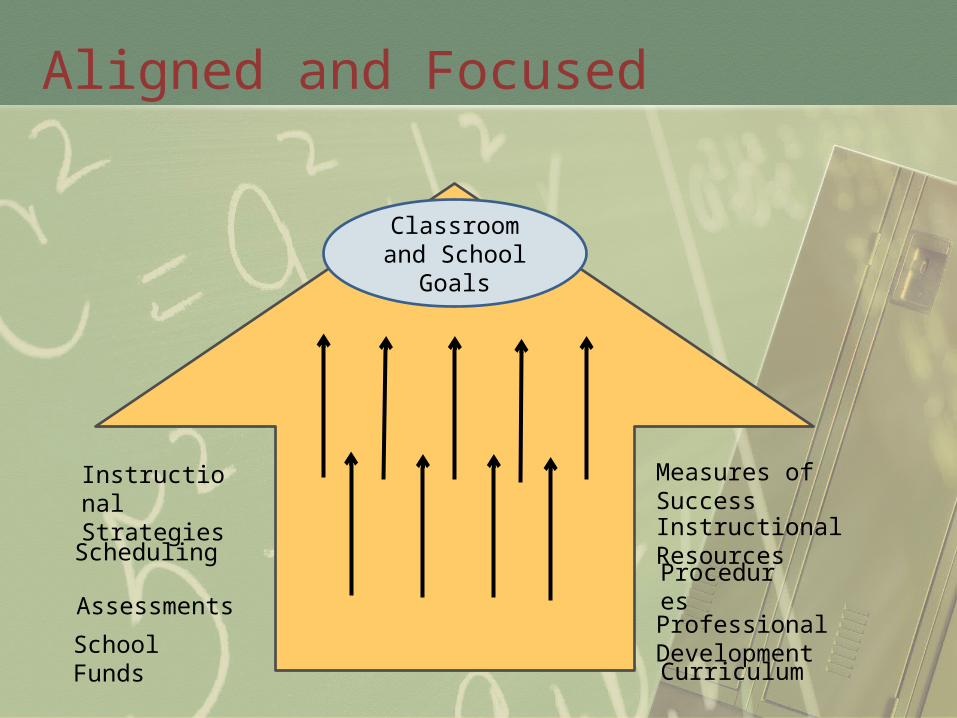
Aligned and Focused
Curriculum
Assessments
SchedulingProcedures
Measures of Success
School FundsProfessional Development
Instructional Resources
Instructional Strategies
Classroom and School Goals
The WHY, the WHAT and the HOWUnbridled Learning (SB 1 – 2009)
The WHY…..
The WHY – Every child proficient and prepared for success (College/Career Ready)
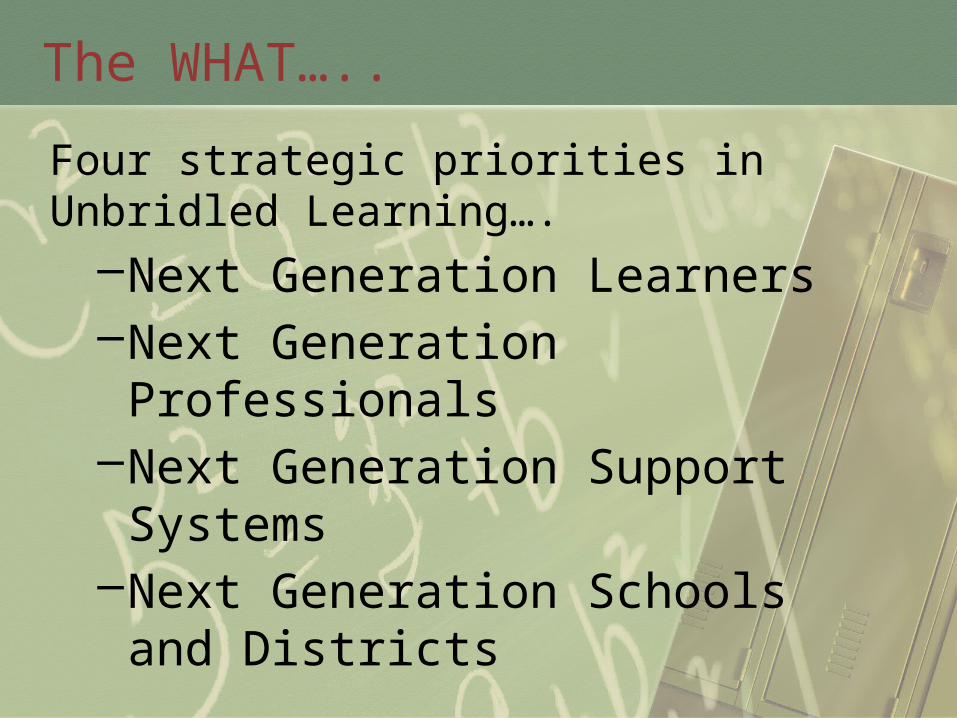
The WHAT…..
Four strategic priorities in Unbridled Learning….
–Next Generation Learners–Next Generation Professionals–Next Generation Support Systems–Next Generation Schools and
Districts
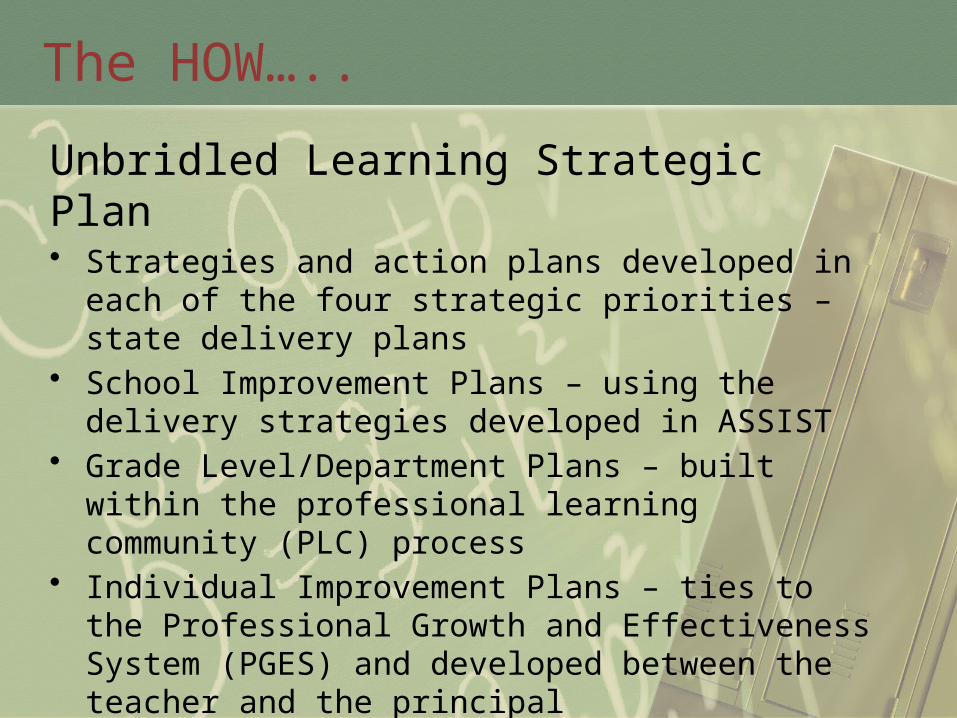
The HOW…..
Unbridled Learning Strategic Plan• Strategies and action plans developed in each of the
four strategic priorities – state delivery plans• School Improvement Plans – using the delivery
strategies developed in ASSIST• Grade Level/Department Plans – built within the
professional learning community (PLC) process• Individual Improvement Plans – ties to the Professional
Growth and Effectiveness System (PGES) and developed between the teacher and the principal
• Student Individual Learning Plan (ILP)
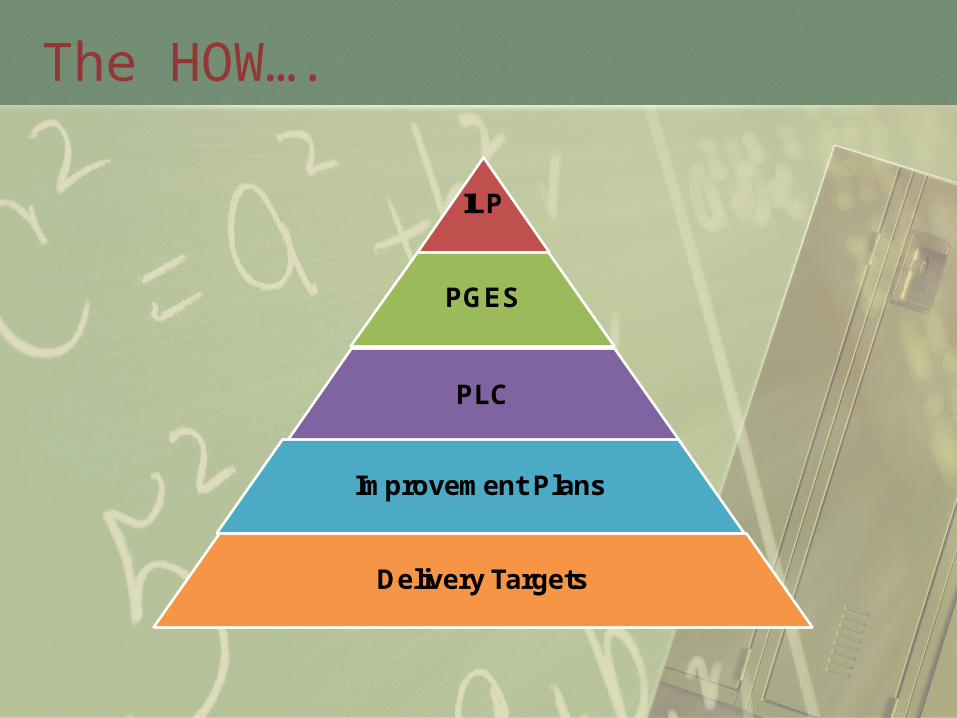
The HOW….
ILP
PGES
PLC
Improvement Plans
Delivery Targets
WHAT IS ASSIST?
ASSIST
ASSIST (Adaptive System of School Improvement Support Tools) is an interactive web-based platform that uses technology to guide school and district administrators through the continuous improvement process, support disciplined thought and data-based decision making and ensure that compliance and improvement activities are effectively monitored and implemented. ASSIST allows Kentucky schools and districts to create unique data profiles, build high quality goals and plans, document and track the implementation process and evaluate the effectiveness of program and planning initiatives in a single system.
ASSIST
Who uses this system? Administrators in all Kentucky schools and districts (Superintendents, Principals and collaborative planning groups responsible for District and School Improvement Plans).
What data are collected? Comprehensive School Improvement Plans (CSIP) are developed within the ASSIST system. Districts use data available in the School Report Card to guide the improvement planning process through the creation of goals and plans to improve student achievement. School and district administrators monitor and evaluate school progress through this tool.
ASSIST Navigation
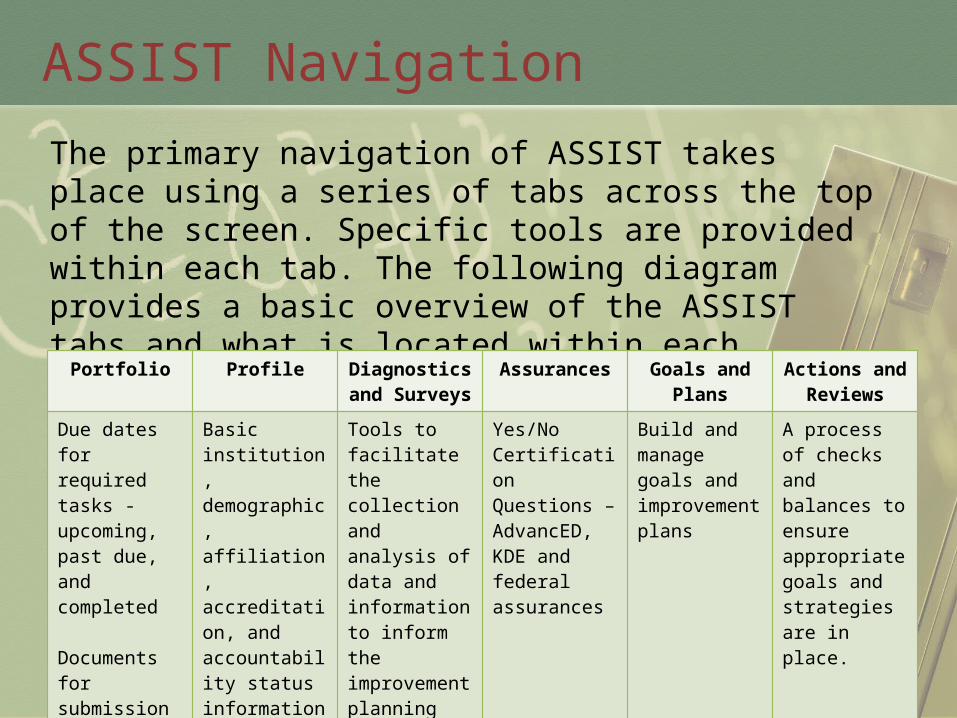
The primary navigation of ASSIST takes place using a series of tabs across the top of the screen. Specific tools are provided within each tab. The following diagram provides a basic overview of the ASSIST tabs and what is located within each.
Portfolio Profile Diagnostics and Surveys
Assurances Goals and Plans
Actions and Reviews
Due dates for required tasks - upcoming, past due, and completed
Documents for submission (CSIP/CDIP)
Basic institution, demographic, affiliation, accreditation, and accountability status information (e.g., Priority, Focus, Title I)
Tools to facilitate the collection and analysis of data and information to inform the improvement planning process
Yes/No Certification Questions – AdvancED, KDE and federal assurances
Build and manage goals and improvement plans
A process of checks and balances to ensure appropriate goals and strategies are in place.

WHAT MAKES A GOOD PLAN?
What makes a good plan?
• The RIGHT data……
• The RIGHT people……
• The RIGHT goals, objectives, strategies and activities in ASSIST
• The RIGHT format and construction……
• The RIGHT monitoring……..
The RIGHT data……
• Student Performance• Customer and Stakeholder Surveys• The Missing Piece of the Proficiency
Puzzle• Behavior and Finance Data• Non-Academic Data
The RIGHT people……
• Who is that at each grade level?• What about teachers that do not have
homeroom students?• How many do I need?• Who will be doing what? How does it all
fit into the plan?• How will the work be communicated back
to the staff?
The RIGHT goals, objectives, strategies and activities in ASSIST……KBE Goals
1. Increase the averaged combined reading and math K-PREP scores for elementary and middle school students from 44% to 72% in 2017. (proficiency)
2. Increase the average freshman graduation rate from 76% to 90% by 2015. (graduation)
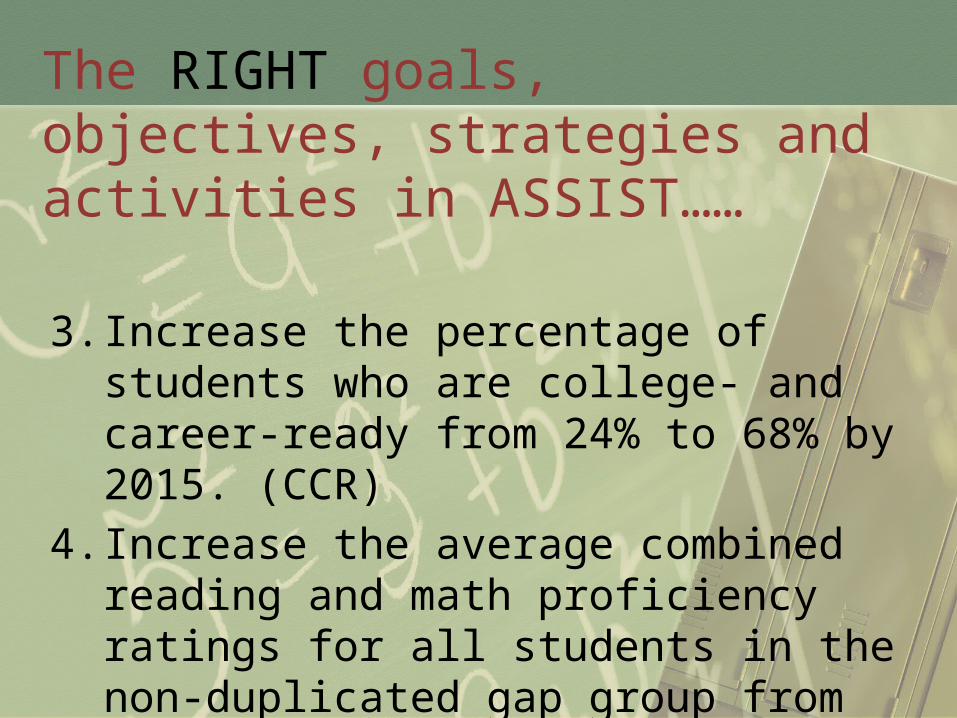
The RIGHT goals, objectives, strategies and activities in ASSIST……
3. Increase the percentage of students who are college- and career-ready from 24% to 68% by 2015. (CCR)
4. Increase the average combined reading and math proficiency ratings for all students in the non-duplicated gap group from 33% in 2012 to 66.5% in 2017. (gap)
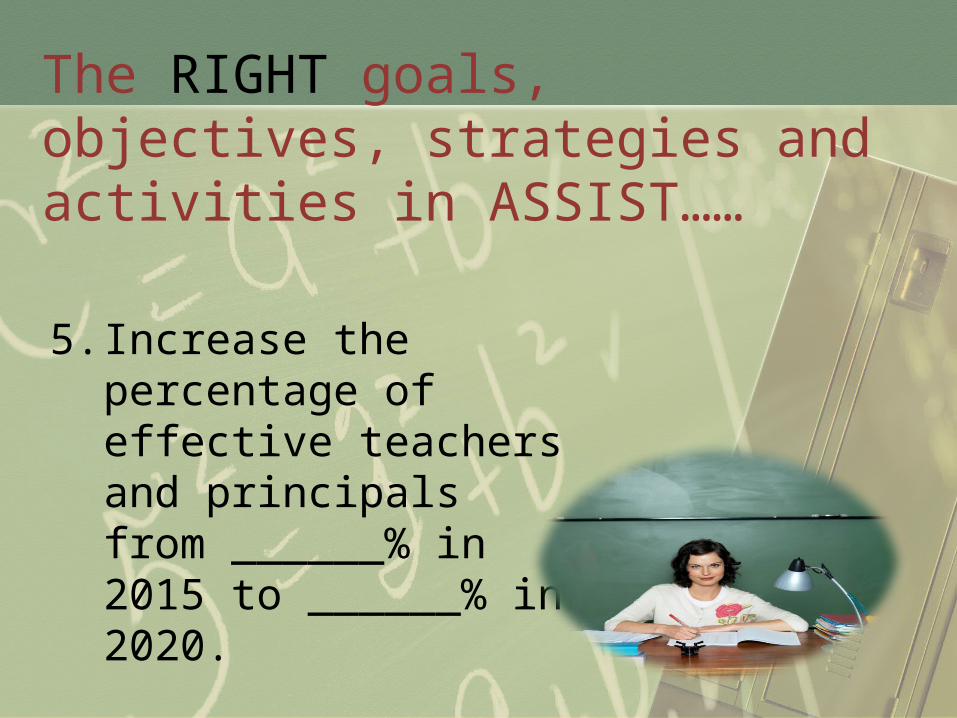
The RIGHT goals, objectives, strategies and activities in ASSIST……
5. Increase the percentage of effective teachers and principals from ______% in 2015 to ______% in 2020.
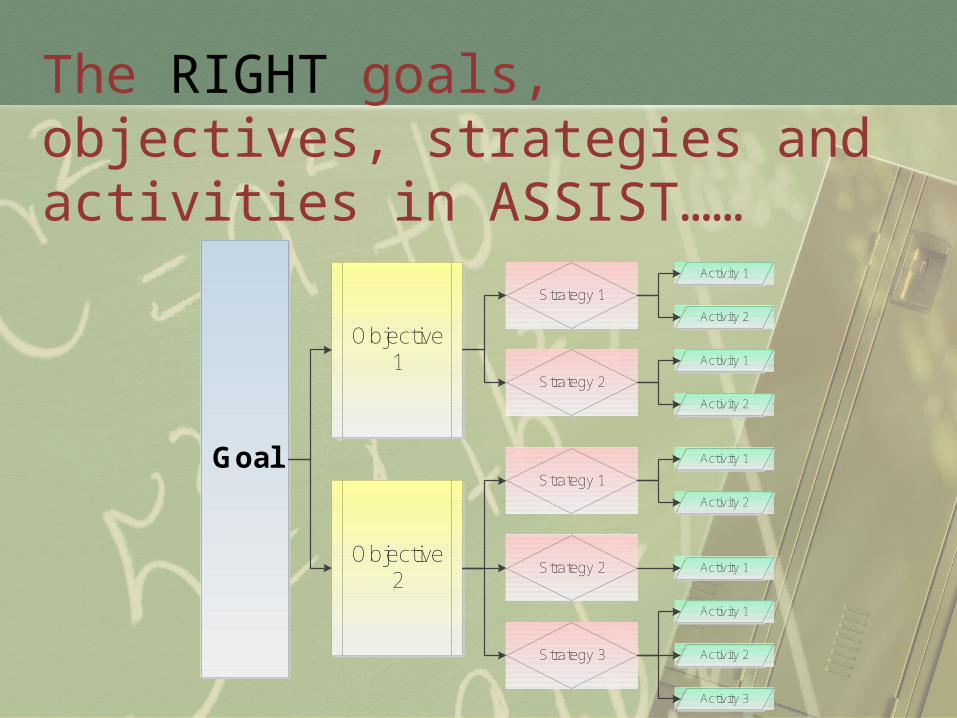
The RIGHT goals, objectives, strategies and activities in ASSIST……
Goal
Objective 1
Objective 2
Strategy 1
Strategy 2
Activity 1
Activity 2
Strategy 1
Strategy 2
Strategy 3
Activity 1
Activity 2
Activity 1
Activity 2
Activity 1
Activity 1
Activity 2
Activity 3
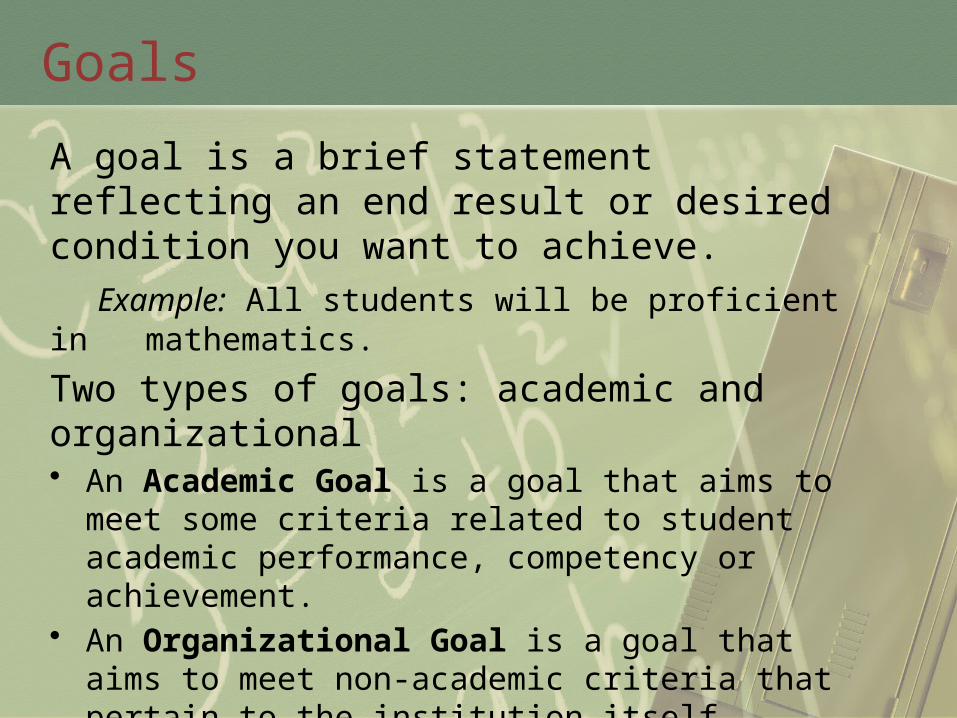
Goals
A goal is a brief statement reflecting an end result or desired condition you want to achieve.
Example: All students will be proficient in mathematics.
Two types of goals: academic and organizational• An Academic Goal is a goal that aims to meet some
criteria related to student academic performance, competency or achievement.
• An Organizational Goal is a goal that aims to meet non-academic criteria that pertain to the institution itself.
Objectives
The construction of a measurable objective in ASSIST is done systematically using a series of prompting questions with a wizard-like tool. The questions (or prompts) will vary depending on the type of goal selected (whether an Academic Goal or Organizational Goal).
Objectives
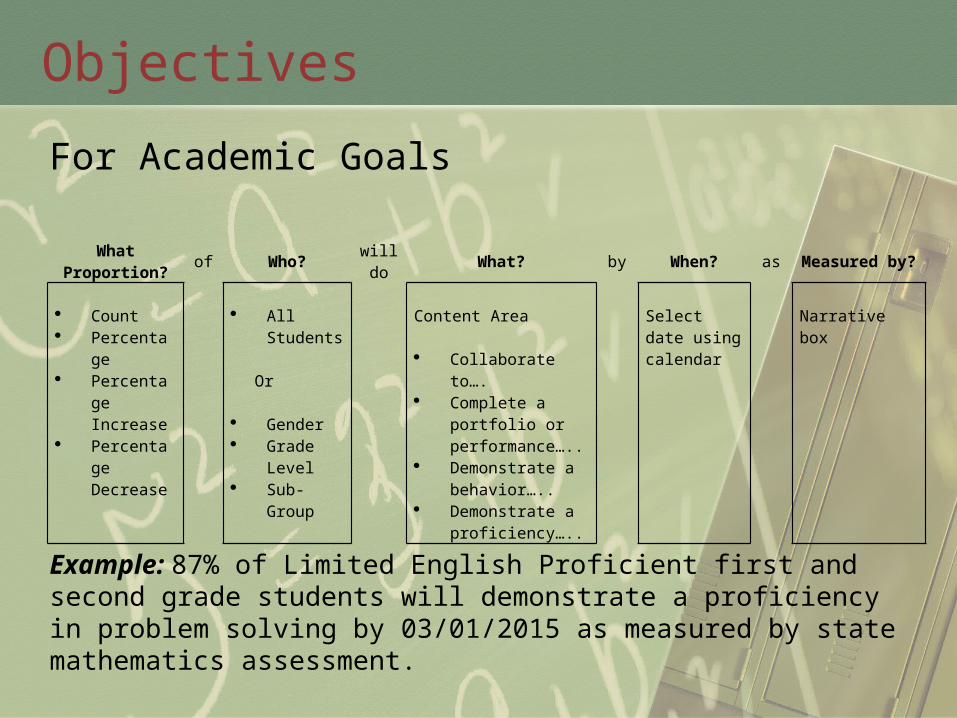
For Academic Goals
Example: 87% of Limited English Proficient first and second grade students will demonstrate a proficiency in problem solving by 03/01/2015 as measured by state mathematics assessment.
What Proportion?
of Who?will do
What? by When? as Measured by?
Count Percentage Percentage
Increase Percentage
Decrease
All
Students Or
Gender Grade
Level Sub-
Group
Content Area
Collaborate to…. Complete a
portfolio or performance…..
Demonstrate a behavior…..
Demonstrate a proficiency…..
Select date using calendar
Narrative box
Objectives
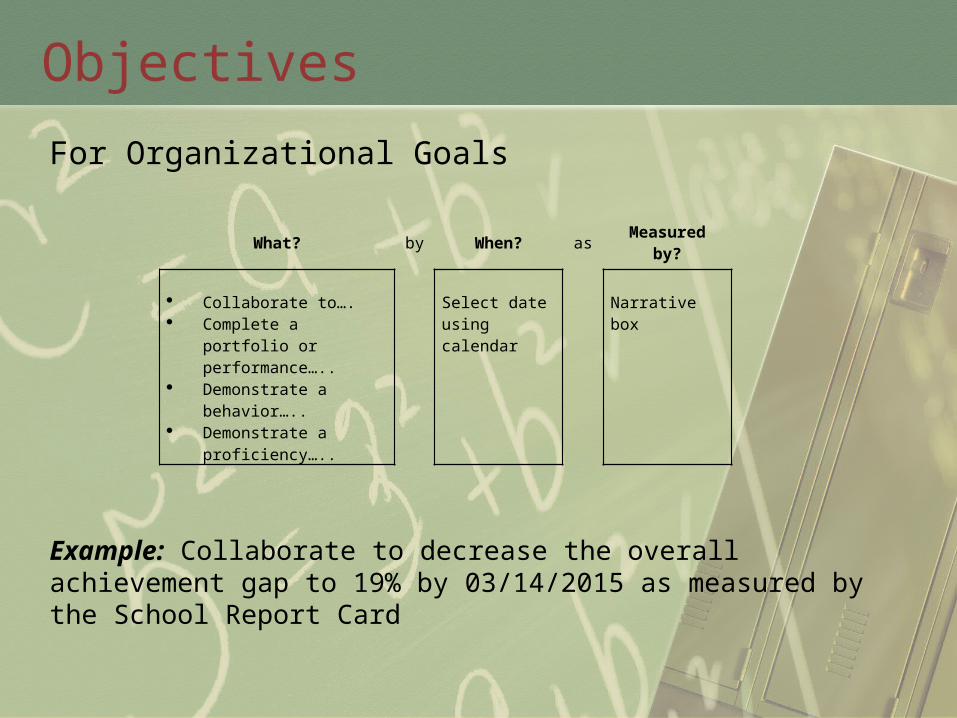
For Organizational Goals
Example: Collaborate to decrease the overall achievement gap to 19% by 03/14/2015 as measured by the School Report Card
What? by When? as Measured by?
Collaborate to…. Complete a portfolio or
performance….. Demonstrate a
behavior….. Demonstrate a
proficiency…..
Select date using calendar
Narrative box
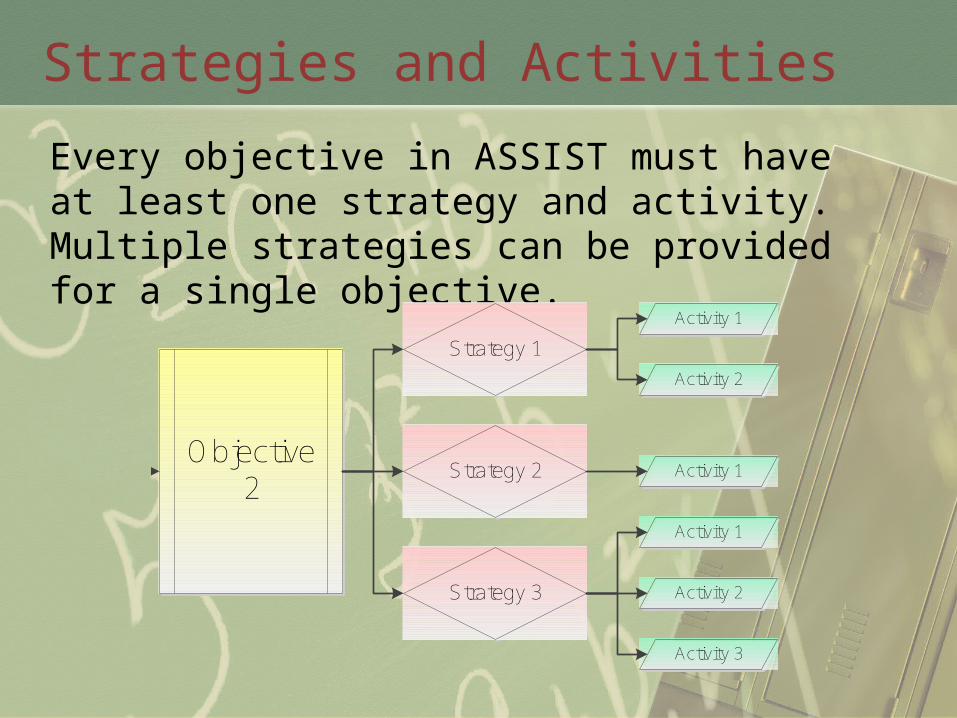
Strategies and Activities
Every objective in ASSIST must have at least one strategy and activity. Multiple strategies can be provided for a single objective.
Goal
Objective 1
Objective 2
Strategy 1
Strategy 2
Activity 1
Activity 2
Strategy 1
Strategy 2
Strategy 3
Activity 1
Activity 2
Activity 1
Activity 2
Activity 1
Activity 1
Activity 2
Activity 3
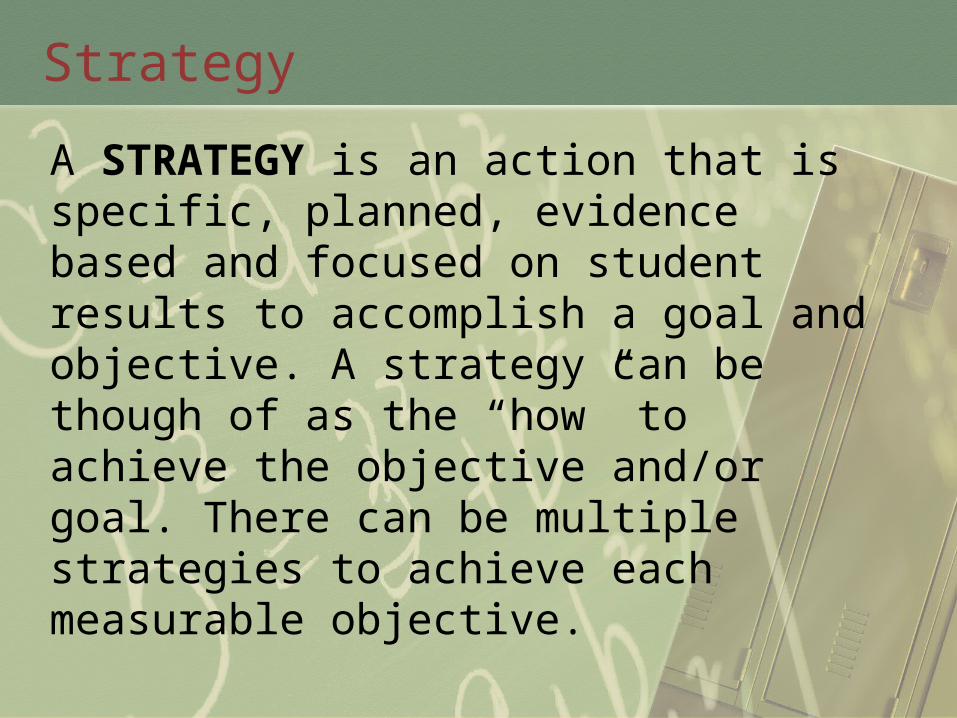
Strategy
A STRATEGY is an action that is specific, planned, evidence based and focused on student results to accomplish a goal and objective. A strategy can be though of as the “how” to achieve the objective and/or goal. There can be multiple strategies to achieve each measurable objective.
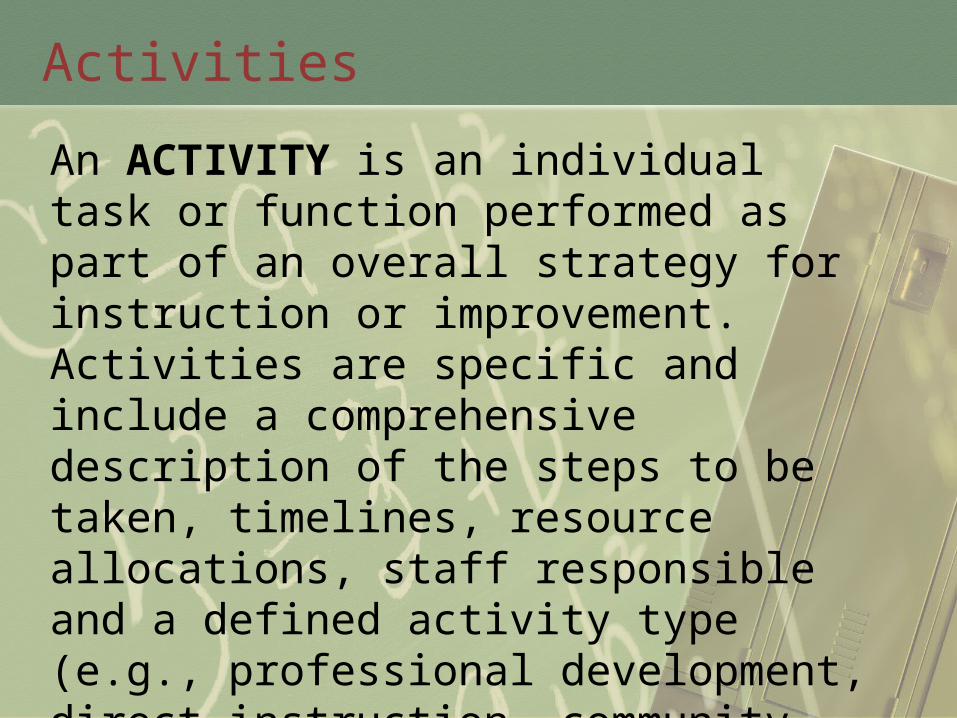
Activities
An ACTIVITY is an individual task or function performed as part of an overall strategy for instruction or improvement. Activities are specific and include a comprehensive description of the steps to be taken, timelines, resource allocations, staff responsible and a defined activity type (e.g., professional development, direct instruction, community engagement). Multiple activities may be required to address each strategy.

The RIGHT format and construction……The 4 C’s• Construction – understanding the ASSIST
platform to construct a stronger plan• Communicating with stakeholders – be careful to
define acronyms and educational strategies and concepts; use plain English in the plan
• Capacity – organize who will do what, by when (roles and responsibilities)
• Continuous Improvement – design the plan with progress monitoring in mind
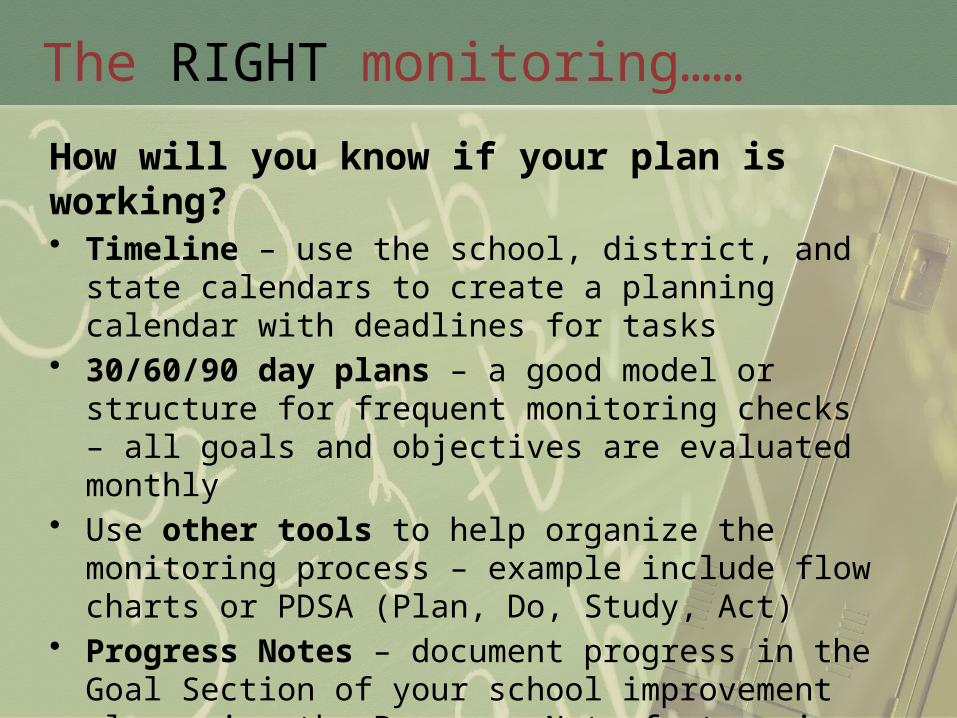
The RIGHT monitoring……
How will you know if your plan is working?• Timeline – use the school, district, and state calendars
to create a planning calendar with deadlines for tasks• 30/60/90 day plans – a good model or structure for
frequent monitoring checks – all goals and objectives are evaluated monthly
• Use other tools to help organize the monitoring process – example include flow charts or PDSA (Plan, Do, Study, Act)
• Progress Notes – document progress in the Goal Section of your school improvement plan using the Progress Note feature in ASSIST

BREAK

THE SCHOOL REPORT
CARD
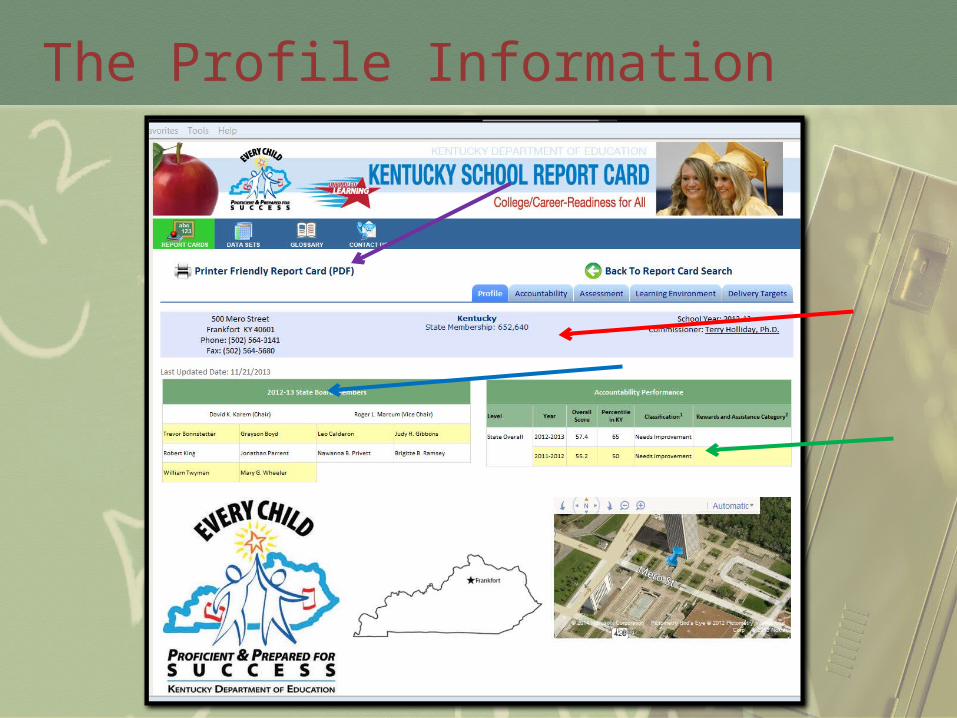
The Profile Information
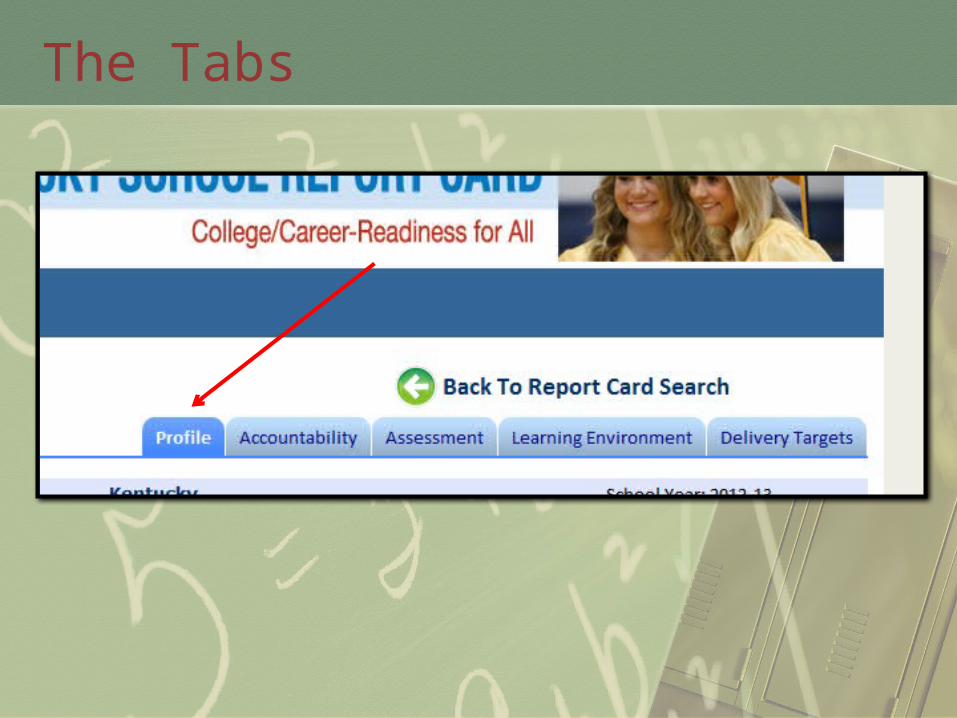
The Tabs
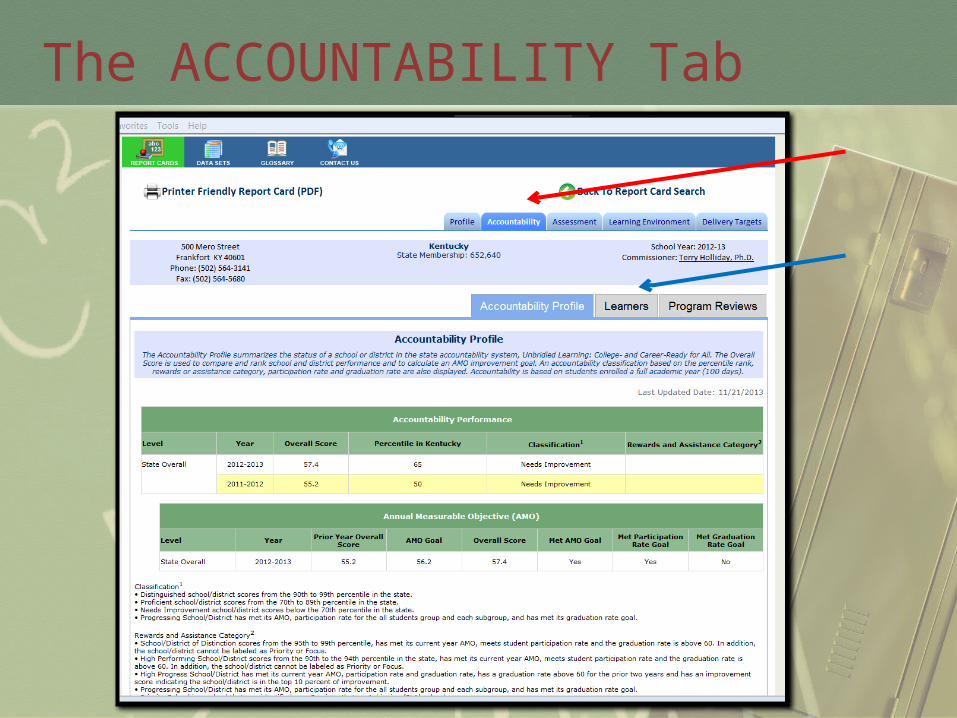
The ACCOUNTABILITY Tab
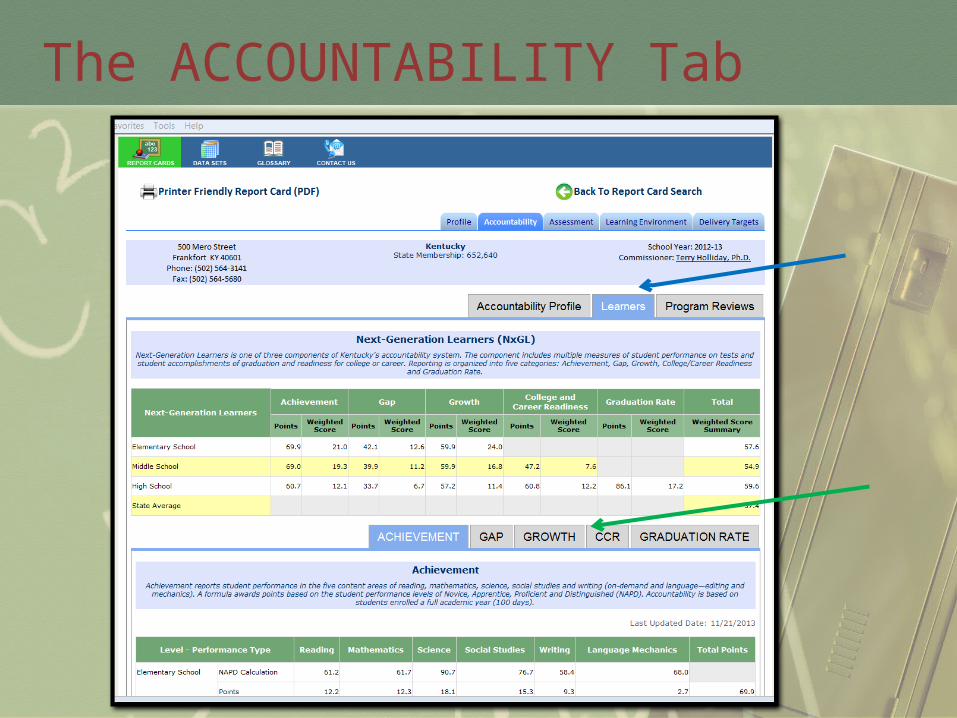
The ACCOUNTABILITY Tab
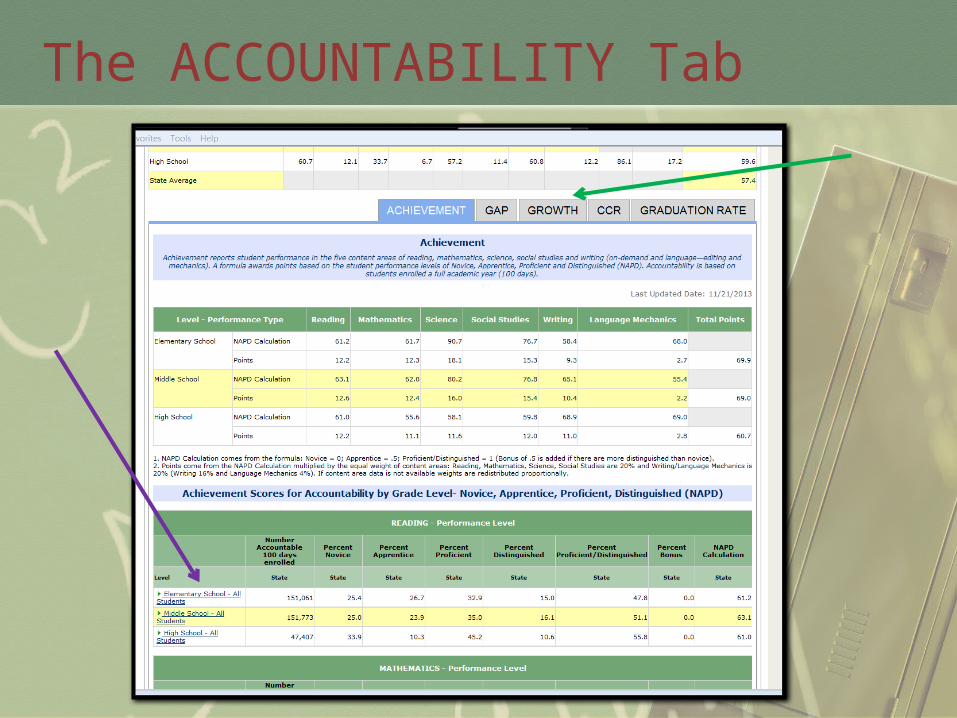
The ACCOUNTABILITY Tab
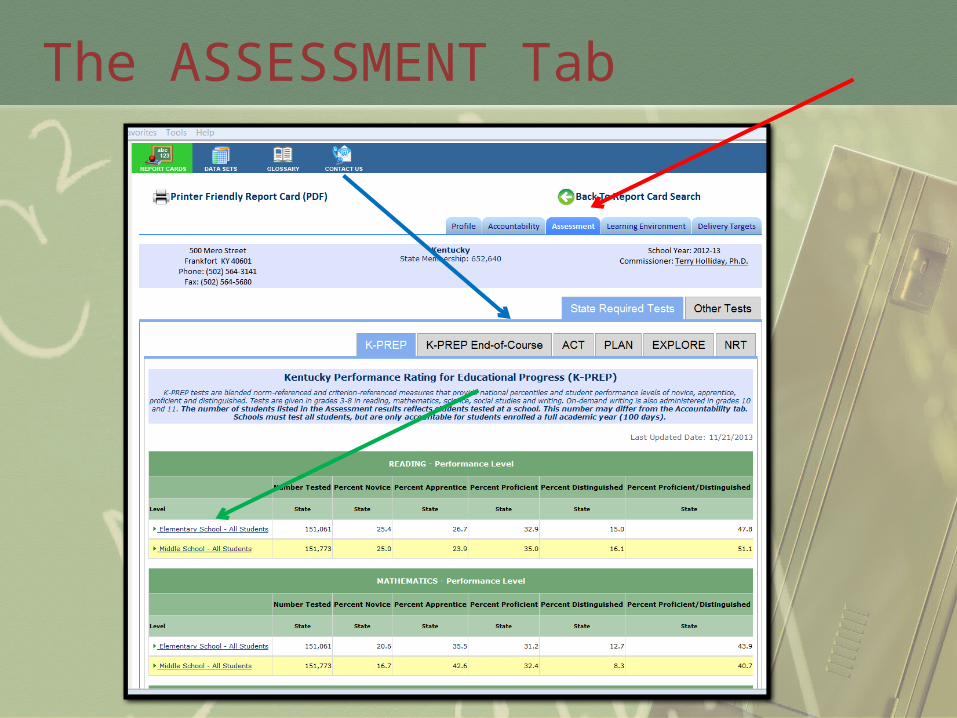
The ASSESSMENT Tab
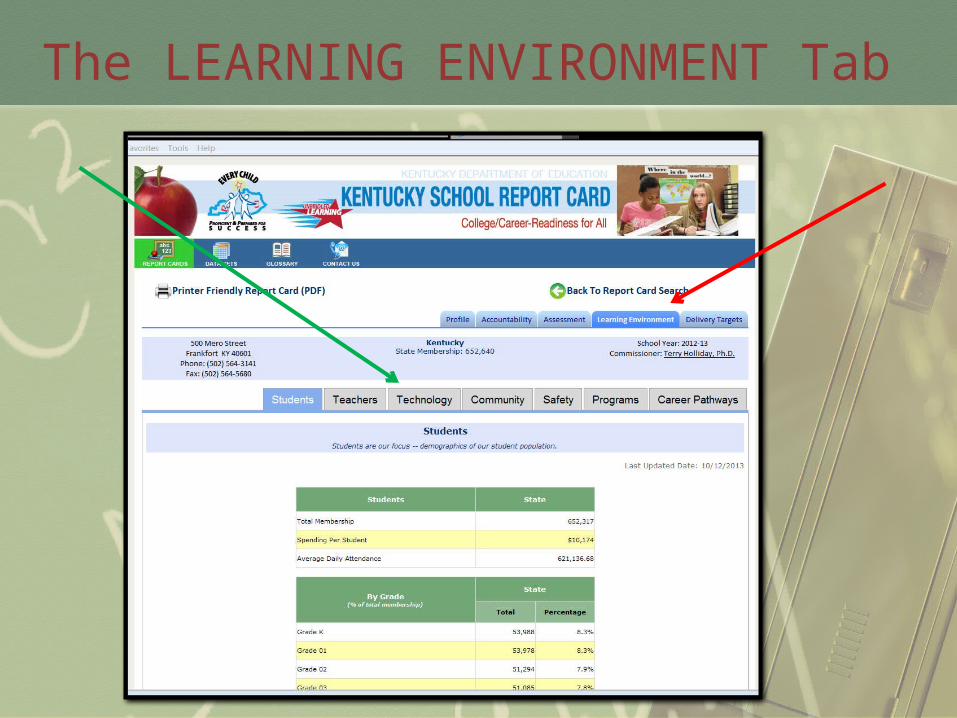
The LEARNING ENVIRONMENT Tab
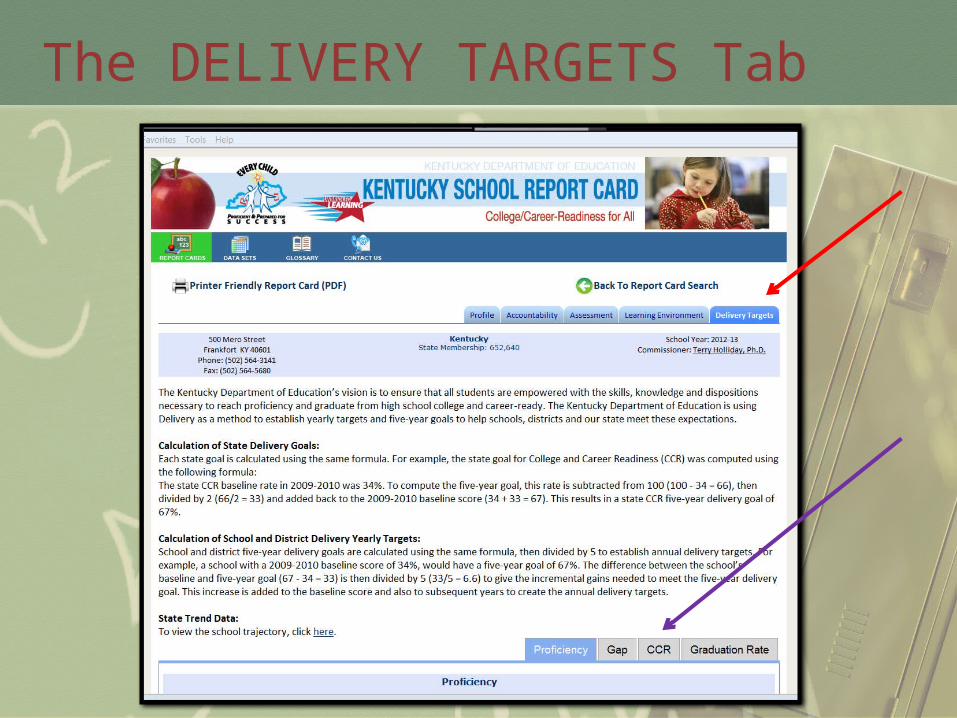
The DELIVERY TARGETS Tab
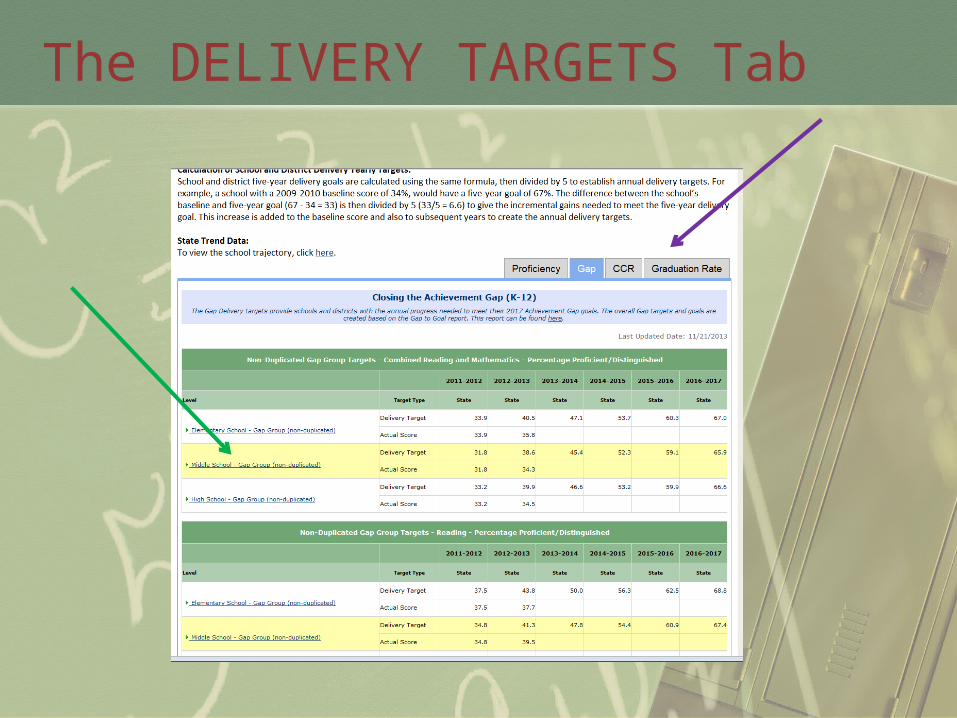
The DELIVERY TARGETS Tab
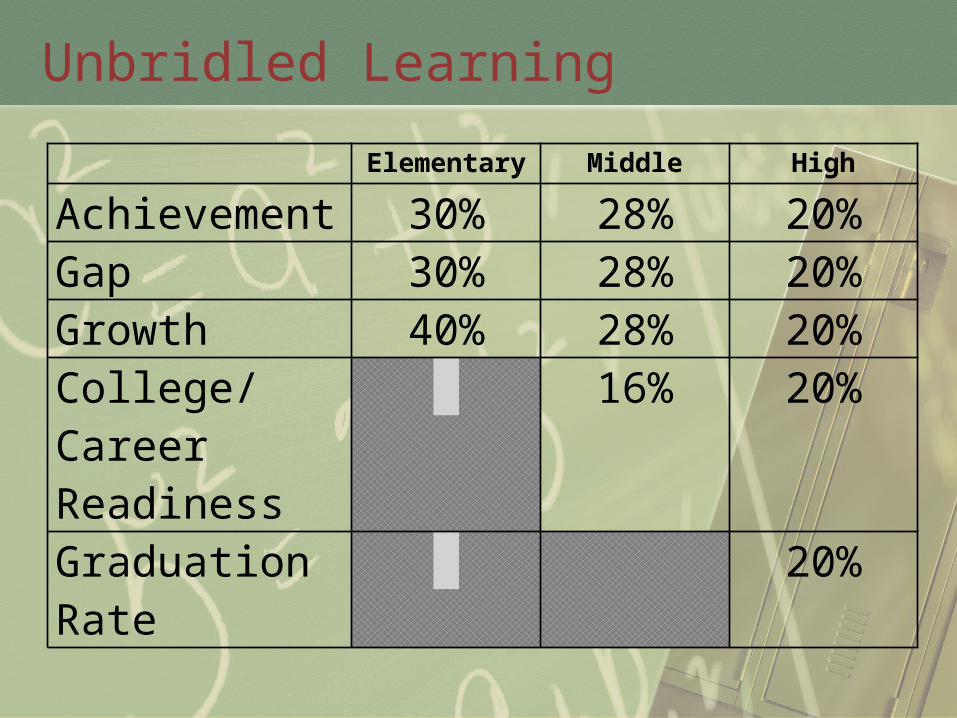
Unbridled Learning Elementary Middle High
Achievement 30% 28% 20%Gap 30% 28% 20%Growth 40% 28% 20%College/Career Readiness
16% 20%
Graduation Rate
20%
Achievement Bingo
• In your booklet is Achievement Bingo. Your goal is to use your School Report Card data (or the State data included in your booklet) to locate the information. If you are using your own School Report Card data, you may not have an answer for each box. For those, mark N/A and note why.
FROM DATA TO IMPROVEMENT PLANNING
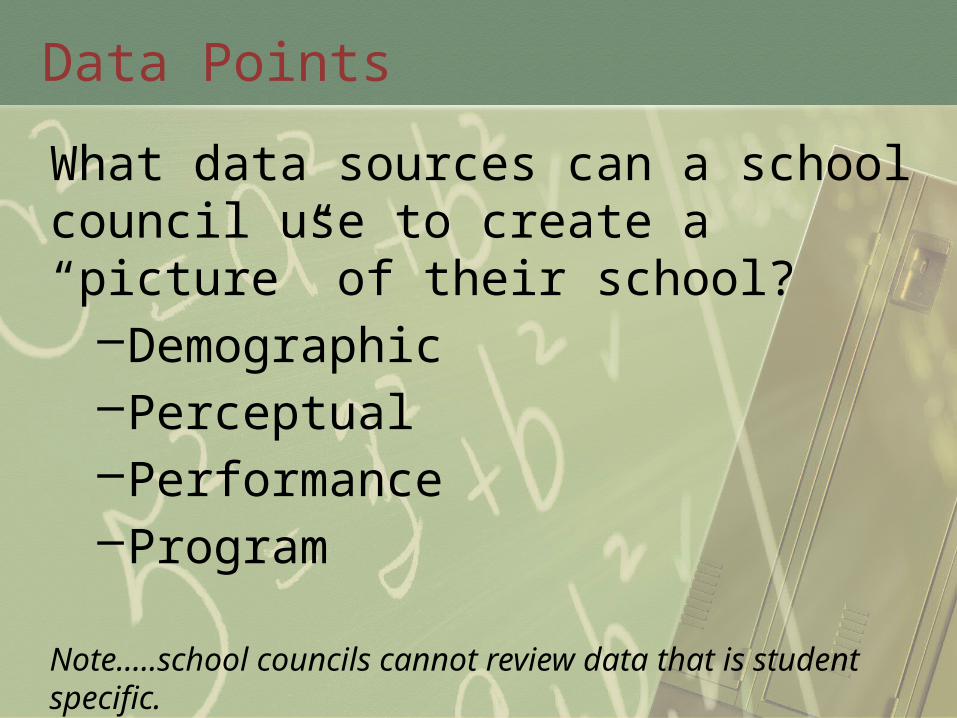
Data Points
What data sources can a school council use to create a “picture” of their school?
–Demographic–Perceptual–Performance–Program
Note…..school councils cannot review data that is student specific.
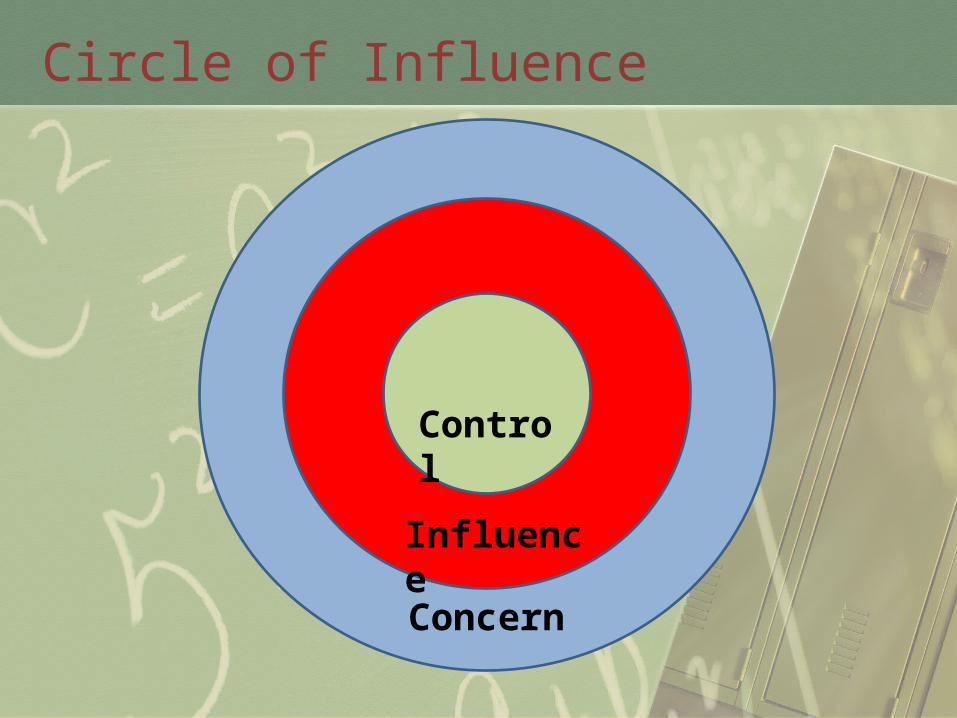
Circle of Influence
Concern
Influence
Control
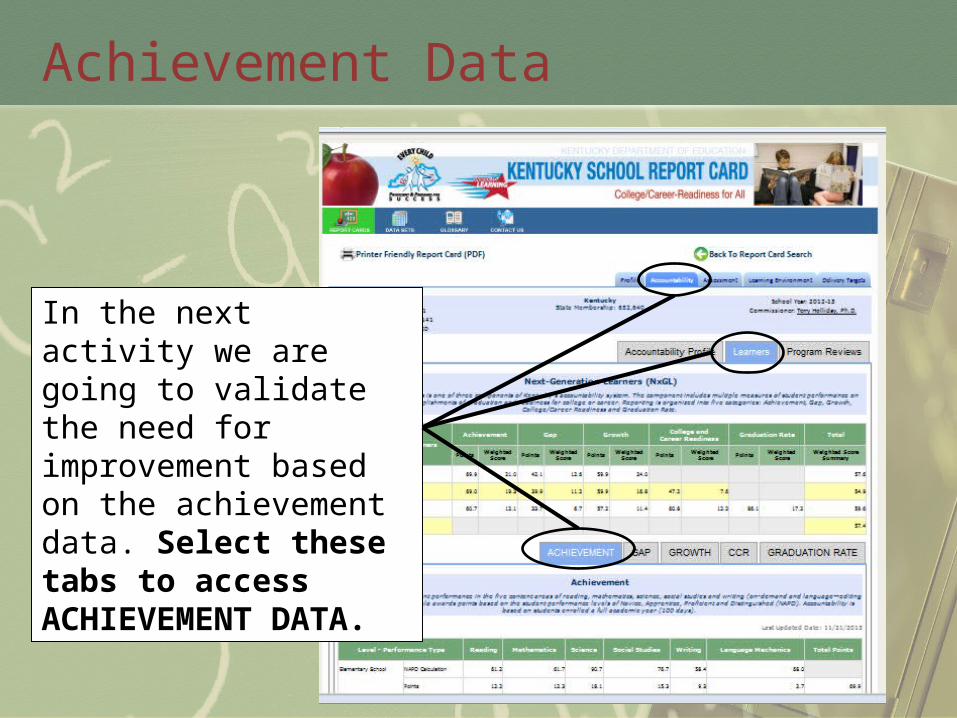
Achievement Data
In the next activity we are going to validate the need for improvement based on the achievement data. Select these tabs to access ACHIEVEMENT DATA.
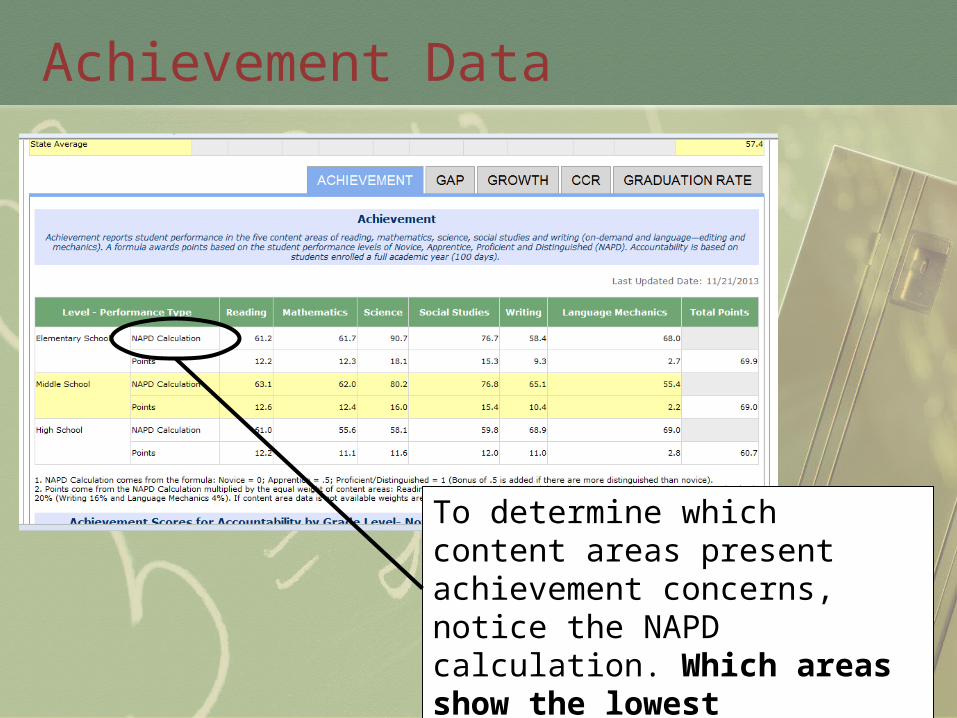
Achievement Data
To determine which content areas present achievement concerns, notice the NAPD calculation. Which areas show the lowest performance?
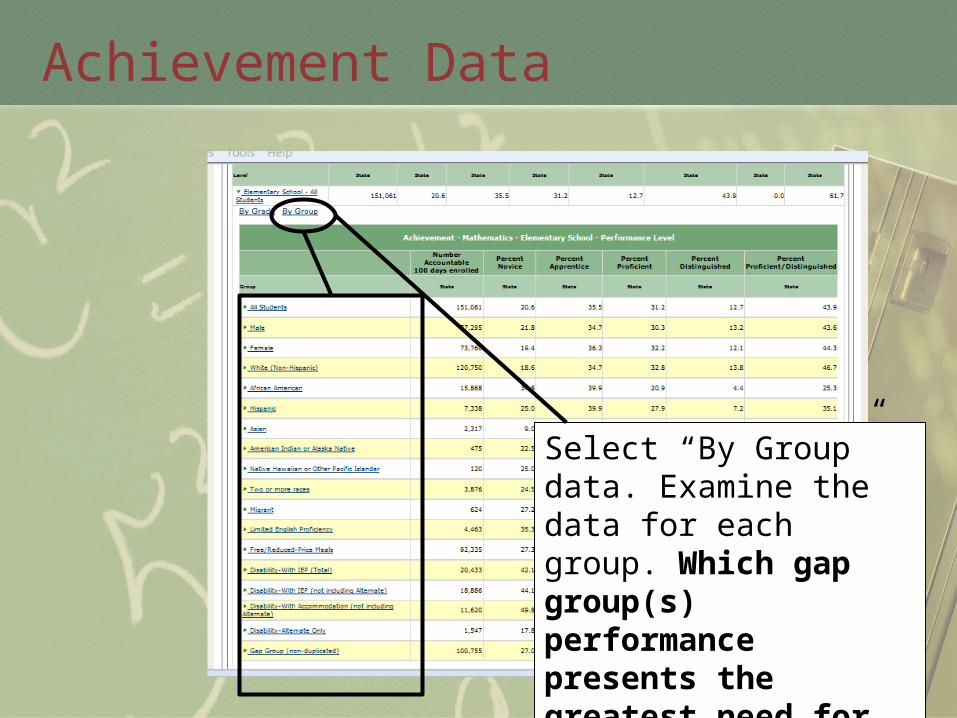
Achievement Data
Select “By Group” data. Examine the data for each group. Which gap group(s) performance presents the greatest need for improvement?
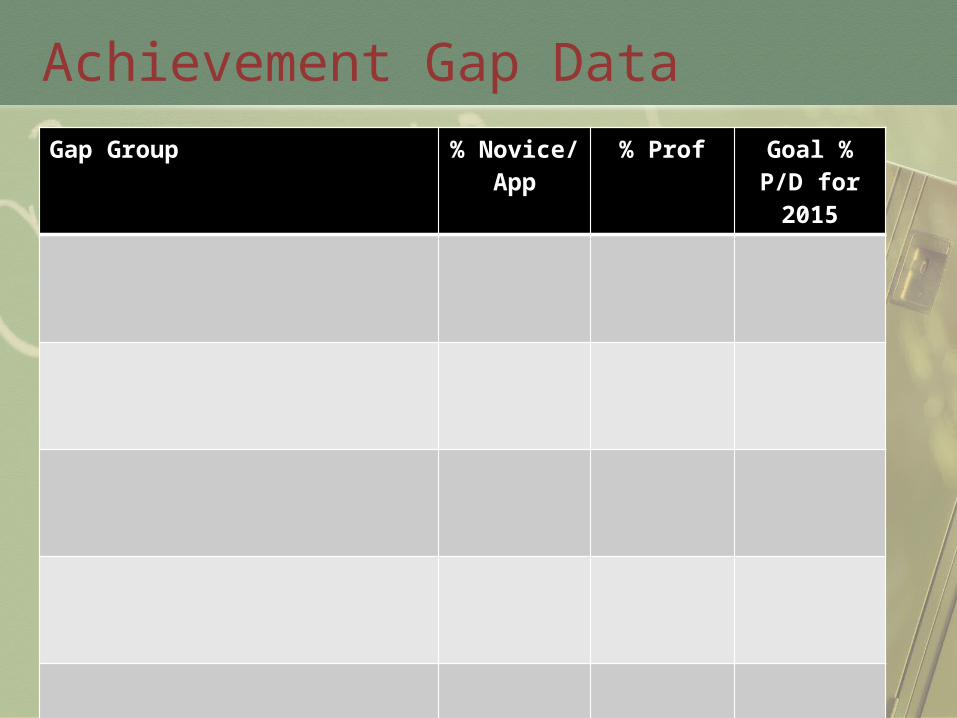
Achievement Gap DataGap Group % Novice/
App% Prof Goal % P/D
for 2015
Data Questions
1. What does the data tell us?
2. What does the data not tell us?
3. What are causes for celebration?
4. What are opportunities for improvement?
5. What are our next steps?
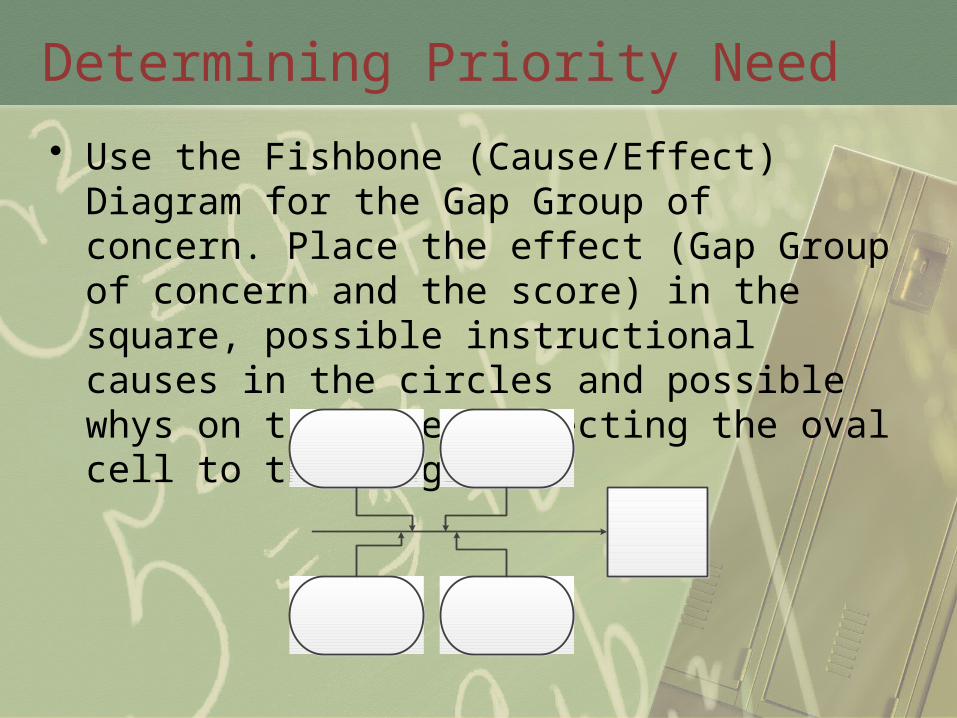
Determining Priority Need
• Use the Fishbone (Cause/Effect) Diagram for the Gap Group of concern. Place the effect (Gap Group of concern and the score) in the square, possible instructional causes in the circles and possible whys on the line connecting the oval cell to the diagram.
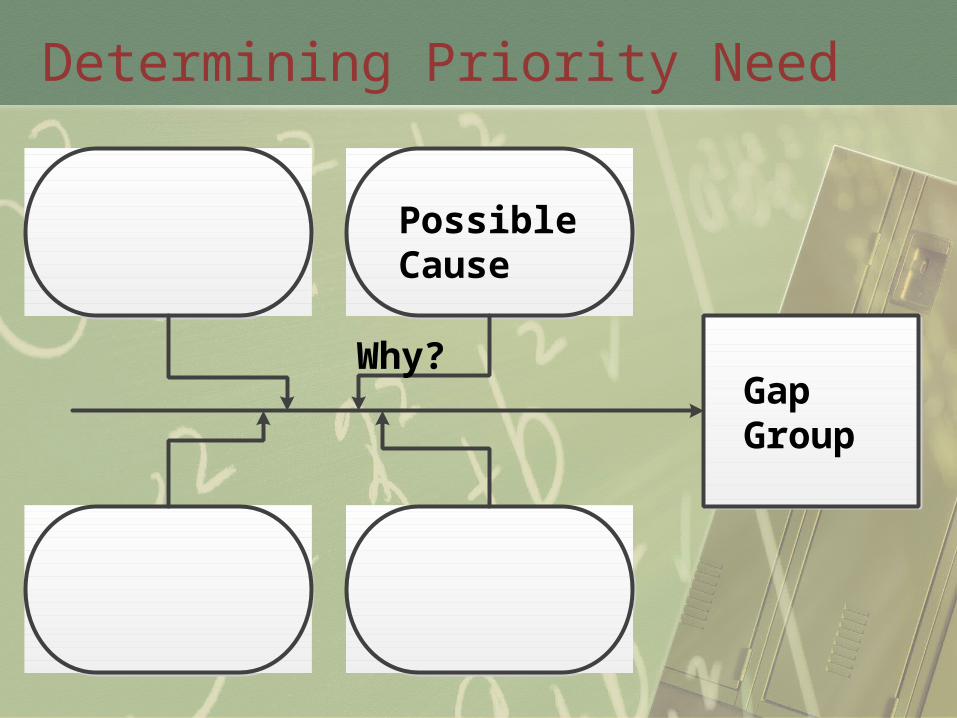
Determining Priority Need
Gap Group
Possible Cause
Why?
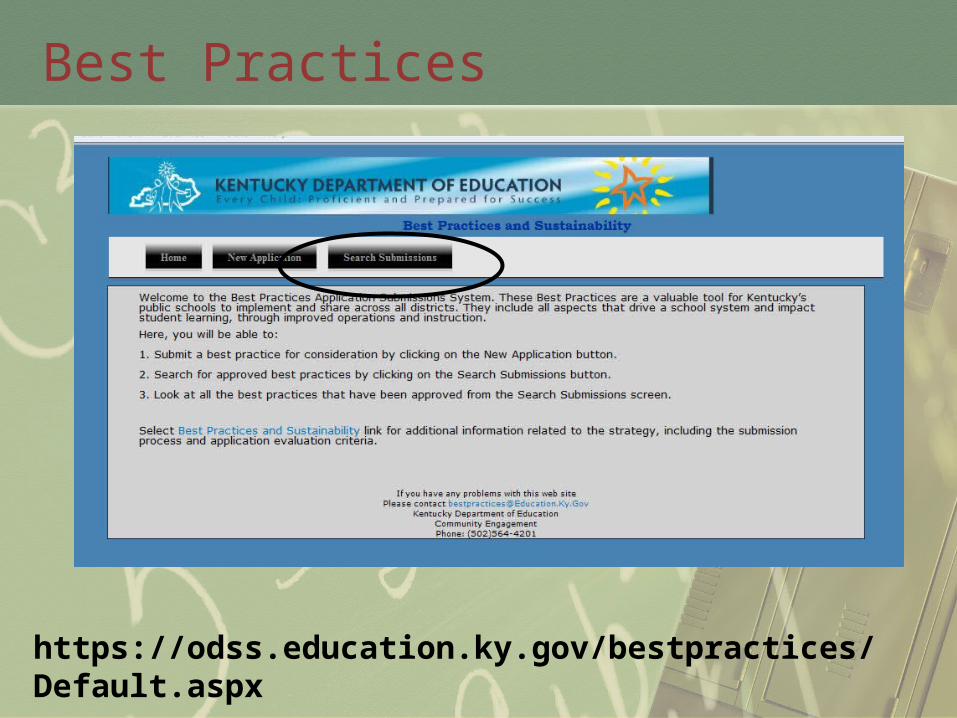
Best Practices
https://odss.education.ky.gov/bestpractices/Default.aspx
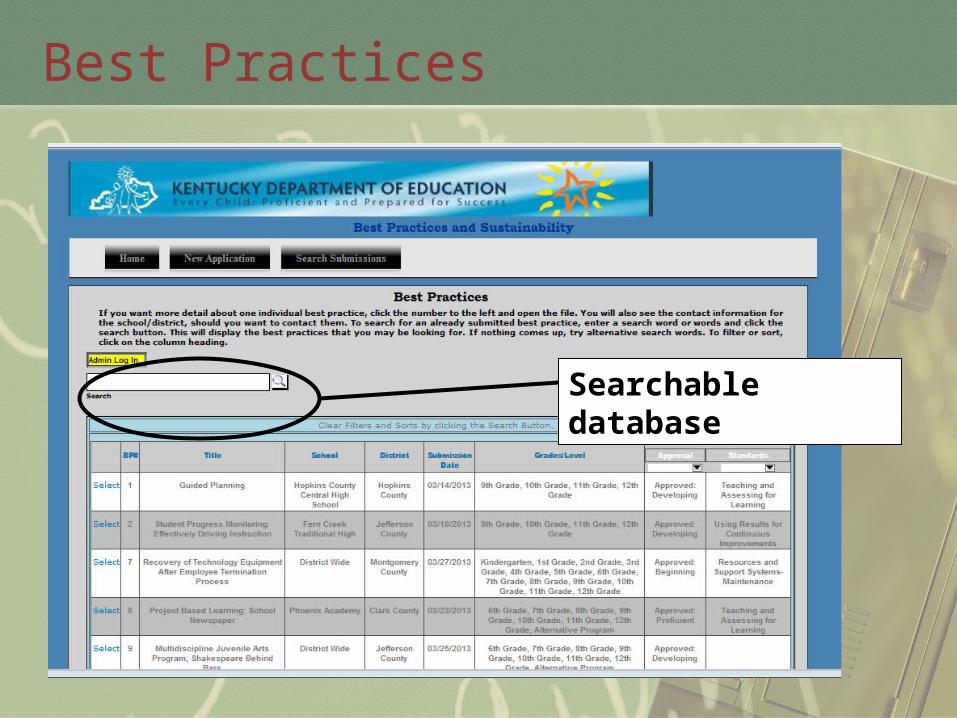
Best Practices
Searchable database
QUESTIONS?KDE SBDM Web Page: http://education.ky.gov/districts/SBDM/Pages/default.aspx
School Improvement Web Page: http://education.ky.gov/school/csip/Pages/default.aspx
School Report Card Link: http://applications.education.ky.gov/SRC/