Embed Size (px)
Citation preview
INTERNATIONAL COUNCIL FOR HARMONISATION OF TECHNICAL REQUIREMENTS FOR PHARMACEUTICALS FOR HUMAN USE
ICH HARMONISED GUIDELINE
CONTINUOUS MANUFACTURING OF
DRUG SUBSTANCES AND DRUG PRODUCTS
Q13
Draft version
Endorsed on 27 July 2021
Currently under public consultation
At Step 2 of the ICH Process, a consensus draft text or guideline, agreed by the appropriate ICH Expert Working Group, is transmitted by the ICH Assembly to the regulatory authorities of the ICH regions for internal and external consultation, according to national or regional procedures.
Q13
Document History
Code History Date
Q13 Endorsement by the Members of the ICH
Assembly under Step 2 and release for public
consultation.
27 July 2021
Legal notice: This document is protected by copyright and may, with the exception of the ICH logo, be
used, reproduced, incorporated into other works, adapted, modified, translated or distributed under a
public license provided that ICH's copyright in the document is acknowledged at all times. In case of any
adaption, modification or translation of the document, reasonable steps must be taken to clearly label,
demarcate or otherwise identify that changes were made to or based on the original document. Any
impression that the adaption, modification or translation of the original document is endorsed or sponsored
by the ICH must be avoided.
The document is provided "as is" without warranty of any kind. In no event shall the ICH or the authors of
the original document be liable for any claim, damages or other liability arising from the use of the
document.
The above-mentioned permissions do not apply to content supplied by third parties. Therefore, for
documents where the copyright vests in a third party, permission for reproduction must be obtained from
this copyright holder.
i
ICH HARMONISED GUIDELINE
CONTINUOUS MANUFACTURING OF DRUG SUBSTANCES AND
DRUG PRODUCTS
Q13
ICH Consensus Guideline
TABLE OF CONTENTS
PART I: CONTINUOUS MANUFACTURING OF DRUG SUBSTANCES AND DRUG
PRODUCTS................................................................................................................................... 1
1. INTRODUCTION ................................................................................................................. 1
1.1. Objective .................................................................................................................................. 1
1.2. Scope ....................................................................................................................................... 1
2. CM CONCEPTS .................................................................................................................... 1
2.1. Different Modes of CM ........................................................................................................... 1
2.2. Batch definition ....................................................................................................................... 2
3. SCIENTIFIC APPROACHES ............................................................................................. 2
3.1. Control Strategy ...................................................................................................................... 2
3.2. Changes in Production Output ................................................................................................ 6
3.3. Continuous Process Verification ............................................................................................. 7
4. REGULATORY CONSIDERATIONS ............................................................................... 7
4.1. Process Description ................................................................................................................. 7
4.2. Control Strategy ...................................................................................................................... 8
4.3. Batch Description .................................................................................................................... 9
4.4. Process Models ...................................................................................................................... 10
4.5. Drug Substance and Drug Product Stability ......................................................................... 10
4.6. Conversion of a Batch Process to CM .................................................................................. 10
4.7. Process Validation ................................................................................................................. 11
4.8. Pharmaceutical Quality System ............................................................................................ 11
4.9. Lifecycle Management ......................................................................................................... 11
4.10. Submission of CM-Specific Information in the CTD .......................................................... 11
5. GLOSSARY ......................................................................................................................... 13
6. REFERENCES .................................................................................................................... 14
ii
PART II: ANNEXES .................................................................................................................. 16
ANNEX I: CONTINUOUS MANUFACTURING OF DRUG SUBSTANCES FOR
CHEMICAL ENTITIES ............................................................................................................ 16
1. INTRODUCTION AND EXAMPLE SYSTEM OVERVIEW ....................................... 16
2. CONTROL STRATEGY AND OTHER TECHNICAL CONSIDERATIONS ............ 17
2.1. Equipment Design and Integration ........................................................................................ 17
2.2. Process Control and Monitoring ........................................................................................... 17
2.3. Consideration of Other Controls ........................................................................................... 19
2.4. Process Validation ................................................................................................................. 19
3. REGULATORY CONSIDERATIONS ............................................................................. 20
ANNEX II: CONTINUOUS MANUFACTURING FOR DRUG PRODUCTS .................... 21
1. INTRODUCTION AND EXAMPLE SYSTEM OVERVIEW ....................................... 21
2. CONTROL STRATEGY AND OTHER TECHNICAL CONSIDERATIONS ............ 21
2.1. Material Characterisation and Control .................................................................................. 22
2.2. Equipment Design and Integration ....................................................................................... 22
2.3. Process Controls and Monitoring.......................................................................................... 23
2.4. Process Validation ................................................................................................................. 23
3. REGULATORY CONSIDERATIONS ............................................................................. 24
ANNEX III: CONTINUOUS MANUFACTURING OF THERAPEUTIC PROTEIN DRUG
SUBSTANCES ............................................................................................................................ 25
1. INTRODUCTION AND EXAMPLE SYSTEM OVERVIEW ....................................... 25
2. CONTROL STRATEGY .................................................................................................... 26
2.1. Adventitious Agent Control .................................................................................................. 26
2.2. Equipment Design and System Integration ........................................................................... 26
2.3. Process Monitoring and Real-Time Release Testing ............................................................ 26
3. PROCESS VALIDATION .................................................................................................. 27
3.1. Approaches to Process Validation ......................................................................................... 27
3.2. Run Time Considerations ...................................................................................................... 27
3.3. Viral Clearance Validation .................................................................................................... 28
ANNEX IV: INTEGRATED DRUG SUBSTANCE AND DRUG PRODUCT
CONTINUOUS MANFACTURING ......................................................................................... 29
1. INTRODUCTION ............................................................................................................... 29
2. INTEGRATED SMALL MOLECULE DRUG SUBSTANCE/DRUG PRODUCT
PROCESSES ............................................................................................................................... 29
iii
2.1. Characteristics of Drug Substance and Drug Product Process Steps .................................... 29
2.2. Example of an Integrated Process ......................................................................................... 29
2.3. Process Design, Monitoring and Control .............................................................................. 30
2.4. Start-up and Shutdown .......................................................................................................... 31
2.5. RTD Characterisation for System Dynamics and Material Traceability .............................. 31
3. SPECIFICATION AND BATCH DATA .......................................................................... 31
3.1. Drug Substance Specification ............................................................................................... 31
3.2. Drug Product Specification ................................................................................................... 32
3.3. Batch Data ............................................................................................................................. 33
4. STABILITY REQUIREMENTS........................................................................................ 33
4.1. Drug Substance Stability ....................................................................................................... 33
4.2. Drug Product Stability ........................................................................................................... 34
5. LOCATION OF DRUG SUBSTANCE AND DRUG PRODUCT INFORMATION IN
THE CTD ..................................................................................................................................... 34
ANNEX V: PERSPECTIVES ON MANAGING DISTURBANCES .................................... 35
1. INTRODUCTION ............................................................................................................... 35
2. BACKGROUND .................................................................................................................. 35
3. MANAGEMENT OF DISTURBANCES .......................................................................... 36
3.1. Disturbance Example 1 ......................................................................................................... 36
3.2. Disturbance Example 2 ......................................................................................................... 37
3.3. Disturbance Example 3 ......................................................................................................... 38
3.4. Summary ............................................................................................................................... 39
ICH Q13 Guideline
1
PART I: CONTINUOUS MANUFACTURING OF DRUG SUBSTANCES AND DRUG 1
PRODUCTS 2
3
1. INTRODUCTION 4
1.1. Objective 5
This guideline describes scientific and regulatory considerations for the development, 6
implementation, operation, and lifecycle management of continuous manufacturing (CM). 7
Building on existing ICH Quality guidelines, this guideline provides clarification on CM concepts, 8
describes scientific approaches, and presents regulatory considerations specific to CM of drug 9
substances and drug products. 10
1.2. Scope 11
This guideline applies to CM of drug substances and drug products for chemical entities and 12
therapeutic proteins. It is applicable to CM for new products (e.g., new drugs, generic drugs, 13
biosimilars) and the conversion of batch manufacturing to CM for existing products. The principles 14
described in this guideline may also apply to other biological/biotechnological entities. 15
16
CM involves the continuous feeding of input materials into, the transformation of in-process 17
materials within, and the concomitant removal of output materials from a manufacturing process. 18
While this description may apply to an individual unit operation (e.g., tableting, perfusion 19
bioreactors), this guideline focuses on the integrated aspects of a CM system in which two or more 20
unit operations are directly connected. In this context, any changes made in a unit operation of CM 21
may have a direct and often immediate impact on downstream and upstream (e.g., via a feedback 22
control) unit operations. 23
24
Fundamental aspects of CM that are generally not specific to technology, dosage form, or molecule 25
type are described within the main body of this guideline. Annexes are provided to augment the 26
main guideline by providing illustrative examples and considerations specific to certain modalities 27
(e.g., chemical entities, therapeutic proteins), technologies, and production methods (e.g., 28
integration of drug substance and drug product manufacturing). The examples and approaches 29
described in these annexes are not exhaustive, and alternative approaches can be used. Topics that 30
are broadly applicable to both CM and batch manufacturing are not in the scope of this guideline, 31
and other existing ICH guidelines should be used as appropriate. 32
2. CM CONCEPTS 33
2.1. Different Modes of CM 34
CM can be applied to some or all unit operations in a manufacturing process. Examples of CM 35
modes include: 36
37
A combination of manufacturing approaches in which some unit operations operate in a 38
batch mode while others are integrated and operate in a continuous mode 39
40
A manufacturing approach in which all unit operations of a drug substance or drug product 41
manufacturing process are integrated and operate in a continuous mode 42
ICH Q13 Guideline
2
43
A manufacturing approach in which drug substance and drug product unit operations are 44
integrated across the boundary between drug substance and drug product to form a single 45
CM process (i.e., the drug substance is continuously formed and processed through 46
integrated unit operations to result in the final drug product) 47
48
A manufacturing approach may incorporate surge lines or tanks to maintain a constant flow of 49
material inputs and outputs in any mode of CM described above. 50
2.2. Batch definition 51
The ICH Q7 definition of a batch is applicable to all modes of CM, for both drug substances and 52
drug products. Based on this definition, the size of a batch produced by CM can be defined in 53
terms of one of the following: 54
55
Quantity of output material 56
Quantity of input material 57
Run time at a defined mass flow rate 58
59
Other approaches to define batch size can also be considered, if scientifically justified based on 60
the characteristics of the CM process. 61
62
A batch size can also be defined as a range. For example, a batch size range can be established by 63
defining a minimum and maximum run time. 64
3. SCIENTIFIC APPROACHES 65
3.1. Control Strategy 66
The development of a successful control strategy for CM is enabled by a holistic approach, 67
considering aspects specific to CM (discussed below) and the principles described in ICH Q8–68
Q11. 69
3.1.1. State of Control 70
A state of control (ICH Q10) is a condition that provides assurance of continued process 71
performance and product quality. The condition may vary, depending on the mode of CM and the 72
specific process steps. For example, a state of control can be demonstrated for some CM processes 73
when a set of parameters (e.g., process parameters, quality attributes) are within specified ranges, 74
but the processes are not necessarily in a steady state condition. Elements of the control strategy 75
monitor a state of control and, when necessary, take appropriate actions to maintain control of the 76
process. It is important to have mechanisms in place to evaluate the consistency of operation and 77
to identify situations in which parameters are within the specified range yet outside historical 78
operating ranges, or they are showing drifts or trends. The latter situation may indicate that the 79
process is at risk of operating outside the specified operating range and warrants evaluation and, 80
when necessary, corrective action. 81
3.1.2. Process Dynamics 82
Knowledge of process dynamics is important to maintaining state of control in CM. Specifically, 83
understanding how transient events propagate helps to identify risks to product quality and to 84
ICH Q13 Guideline
3
develop an appropriate control strategy (see Section 3.1.5 for process monitoring and control 85
considerations). Transient events that occur during CM operation may be planned (e.g., process 86
start-up, shutdown and pause) or unplanned (e.g., disturbances). 87
88
Characterisation of the residence time distribution (RTD) can be used to help understand process 89
dynamics. RTD characterises the time available for material transport and transformation, and it 90
is specific to the process, composition/formulation, material properties, equipment design and 91
configuration, etc. Understanding process dynamics (e.g., through the RTD) enables the tracking 92
of material and supports the development of sampling and diversion strategies, where applicable. 93
In addition, such understanding is of importance from a process performance perspective. For 94
example, process dynamics may impact process characteristics, such as selectivity in the 95
manufacture of chemical entity drug substances and viral safety in the manufacture of therapeutic 96
protein drug substances. 97
98
Process dynamics should be characterised over the planned operating ranges and anticipated input 99
material variability using scientifically justified approaches. Appropriate methodologies (e.g., 100
RTD studies, in silico modeling with experimental confirmation) should be used to understand the 101
impact of process dynamics and its variation on material transport and transformation. These 102
methodologies should not interfere with the process dynamics of the system, and the 103
characterisation should be relevant to the commercial process. For example, when conducting 104
RTD studies, the tracer used to replace a constituent of the solid or liquid stream should have 105
highly similar flow properties as those of the constituent replaced. A tracer should also be inert to 106
the other components of the process and should not alter how processed materials interact with 107
equipment surfaces. Step testing by making small changes to the quantitative composition of the 108
process stream (e.g., small increments of a constituent) is another useful technique to determine 109
the RTD and avoid the addition of an external tracer to the process. Other approaches can be used; 110
the approach taken should be justified. 111
3.1.3. Material Characterisation and Control 112
Material attributes can impact various aspects of CM operation and performance, such as material 113
feeding, process dynamics, and output material quality. Understanding the impact of material 114
attributes and their variability on process performance and product quality is important for the 115
development of the control strategy. Input materials may require evaluation and control of 116
attributes beyond those typically considered for a material specification used in batch 117
manufacturing. For example: 118
119
For a solid dosage form process, particle size, cohesiveness, hygroscopicity, or specific 120
surface area of drug substances and excipients may impact the feeding of powders and 121
material flow through the system. 122
123
For a chemically synthesised drug substance process, viscosity, concentration, or the 124
multiphase nature (e.g., presence of solids) of the feeding solution may impact flow 125
properties or conversion. 126
127
For a therapeutic protein (e.g., monoclonal antibodies) process, the higher variability of 128
feed stocks such as metal salts, vitamins, and other trace components may adversely impact 129
ICH Q13 Guideline
4
cell culture performance. Prolonged run times may require different lots of media, buffers, 130
or other starting materials for the downstream CM process, potentially introducing more 131
variabilities to the process. 132
3.1.4. Equipment Design and System Integration 133
The design of equipment and their integration to form a CM system impacts process dynamics, 134
material transport and transformation, output material quality, etc. When developing a CM process 135
and its control strategy, it is important to consider the characteristics of individual equipment as 136
well as those of the integrated system that can affect process performance. These include the 137
system’s ability to maintain a continuous flow of input and output materials, manage potential 138
disruption to CM operations (e.g., filter changes), and complete the intended transformation of the 139
material stream within the respective planned operational ranges of the equipment. Examples of 140
design considerations are given below: 141
142
Design and configuration of equipment (e.g., compatibility and integrity of equipment 143
components for the maximum run time or cycles; geometry of constituent parts to promote 144
the desired transformation; spatial arrangement of equipment to facilitate material flow and 145
avoid build-up or fouling) 146
147
Connections between equipment (e.g., use of a surge tank between two unit operations to 148
mitigate differences in mass flow rates) 149
150
Locations of material diversion and sampling points (e.g., selection of locations for a 151
diverter valve and sampling probe without interrupting material flow and transformation) 152
153
Furthermore, appropriate design or selection of equipment for a CM process may enable process 154
simplification, facilitate process monitoring and material diversion, and improve process 155
capability and performance. For example, in a drug substance process, reactor design can 156
effectively reduce formation and build-up of impurities, resulting in fewer purification steps. 157
Similarly, for therapeutic protein drug substance manufacturing, system design can enable process 158
intensification and reduce cycle times. 159
3.1.5. Process Monitoring and Control 160
Process monitoring and control support the maintenance of a state of control during production 161
and allow real-time evaluation of system performance. Common approaches to process monitoring 162
and control—including establishment of target setpoints and control limits, design space, and 163
specifications for attributes being measured—are applicable to CM. 164
165
Process analytical technology (PAT) (ICH Q8) is well-suited for CM. Example applications 166
include in-line UV flow cells to monitor therapeutic protein concentration information, in-line 167
near-infrared spectroscopy to assess blend uniformity, and in-line particle size analysis to monitor 168
the output of a crystalliser. The use of PAT enables disturbances to be detected in real time. 169
Therefore, CM is readily amenable to automated process control strategies based on, for example, 170
active control such as feedforward or feedback control. Principles of control strategy as described 171
in ICH Q8 and ICH Q11 can be applied to CM processes. 172
173
ICH Q13 Guideline
5
An appropriate sampling strategy is an important aspect of process monitoring and control. The 174
variables monitored, monitoring method and frequency, amount of material sampled (either 175
physical sampling or data sampling using in-line measurement), sampling location, statistical 176
method, and acceptance criteria depend on the intended use of the data (e.g., detection of rapid 177
changes such as disturbances, assessment of quality of a batch when real-time release testing 178
(RTRT) (ICH Q8) is used, analysis of process trends or drifts) and process dynamics. Another 179
important consideration is the avoidance of measurement interference with the process. 180
Assessment of risks associated with data gaps (e.g., PAT recalibration, refill of a feeding system, 181
failure of system components) should inform whether contingency methods are required. 182
3.1.6. Material Traceability and Diversion 183
CM processes may include periods when non-conforming materials are produced, for example, 184
during system start-up and shutdown and when disturbances are not appropriately managed and 185
mitigated. The ability to divert potential non-conforming material from the product stream during 186
production is an important characteristic of CM and should be considered in developing the control 187
strategy. 188
189
Understanding the process dynamics of individual unit operations and integrated systems over 190
planned operating conditions enables tracking of the distribution of materials over time. This 191
allows input materials to be traced throughout production. Material traceability, understanding 192
how upstream disturbances affect downstream material quality, and the use of appropriate 193
measurements (e.g., PAT) allow for real-time determination of when to start and stop material 194
collection or diversion. The amount of material diverted can be influenced by several factors, such 195
as process dynamics, control strategy, severity (e.g., magnitude, duration, frequency) of the 196
disturbances, and location of the sampling and diversion points. Additionally, it is important that 197
the diversion strategy accounts for the impact on material flow and process dynamics when 198
material is diverted. Criteria should be established to trigger the start and end of the diversion 199
period and restart of product collection. 200
3.1.7. Process Models 201
Process models can be used for development of a CM process or as part of a control strategy for 202
commercial production, including the diversion strategy. Process models may also be used to 203
predict quality attributes in real time, enabling timely process adjustments to maintain a state of 204
control. During development, process models can support the establishment of a design space by 205
explaining how inputs (e.g., process parameters, material attributes) and outputs (e.g., product 206
quality attributes) are related. Through use of in silico experimentation, process models also 207
enhance process understanding and can reduce the number of experimental studies. 208
209
For general considerations regarding models (including implications of model impact to validation 210
requirements), refer to Points to Consider: ICH-Endorsed Guide for ICH Q8/Q9/Q10 211
Implementation. For CM applications, additional considerations are discussed below. 212
213
A process model is specific to system design and configuration and relevant material 214
properties. 215
216
Model development requires an understanding of the underlying model assumptions (e.g., 217
plug flow versus mixed flow systems) and when these assumptions remain valid. Risk 218
ICH Q13 Guideline
6
assessments, sound scientific rationales, and relevant data are needed to select model inputs 219
and model-governing equations. It is important to determine the relevant inputs that affect 220
the model performance, based on appropriate approaches such as sensitivity analysis. 221
222
Model performance depends on factors such as mathematical constructs and the quality of 223
model inputs (e.g., noise, variability of data). When setting acceptance criteria for model 224
performance, the model’s intended use and the statistical approaches that account for 225
uncertainty in the experimental measurement and model prediction should be considered. 226
227
Model validation assesses the fitness of the model for its intended use based on 228
predetermined acceptance criteria. Model validation activities are primarily concerned with 229
demonstrating the appropriateness of the underlying model assumptions and the degree to 230
which sensitivity and uncertainty of the model and the reference methods are understood. 231
232
Monitoring of model performance should occur on a routine ongoing basis and when a 233
process change (e.g., input material, process parameter change) is implemented. A risk-234
based approach to assess the impact of a model change (e.g., optimisation of model 235
performance, change of the model’s intended use, change of underlying model 236
assumptions), scope of model development, and model validation criteria enables effective 237
and efficient lifecycle management of models. Depending on the extent of a change and its 238
impact on model performance, a model may need to be redeveloped and validated. 239
3.2. Changes in Production Output 240
Several considerations associated with some common approaches to production changes are 241
discussed below, and variations to these approaches are also possible. For already approved 242
products, it is important to justify the selected approach, understand its impact on the overall 243
control strategy and process performance, and, as needed, update the control strategy. Some 244
changes may require process modification and process validation. 245
246
Change in run time with no change to mass flow rates and equipment: Issues not 247
observed over shorter run times may become visible as run time increases. Additional risks 248
and constraints should be considered and may include, for example, process drift, increased 249
heat, material build-up, exceeding the performance limit of components (e.g., validated in 250
vitro cell age, resin cycle number, measurement system calibration status), material 251
degradation, membrane or sensor fouling, and microbial contamination. Decreasing 252
production output (below the longest run time previously validated) should not imply 253
additional risks, given the same equipment, process and control strategy are used. 254
255
Increase mass flow rates with no change to overall run time and equipment: The risks 256
associated with this approach may impact output material quality and are related to changes 257
in process dynamics and system capability to handle increased mass flow rates. Therefore, 258
this approach may require re-evaluation and modification of the control strategy, including 259
process parameters and controls, material traceability, RTD, sampling, and diversion 260
strategies. 261
262
ICH Q13 Guideline
7
Increase output through duplication of equipment (i.e., scale-out): Considerations for 263
two commonly used scale-out approaches are provided below. 264
265
o Replication of production lines (like-for-like): Replicating the integrated CM 266
production line (i.e., same equipment and setup as the original CM system) can be 267
used to increase production output. The replicate production lines follow the same 268
control strategy. 269
270
o Parallel unit operations on the same production line: When only some unit 271
operations are replicated on the same line, risks are associated with maintaining 272
control across parallel unit operations. Aspects to consider are maintenance of 273
uniform flow distribution among the parallel operations, re-integration of parallel 274
flow streams, changes to process dynamics, and material traceability. 275
276
Scale up by increasing equipment size/capacity: Depending on the process and 277
equipment design, increasing production by increasing equipment size may be possible. 278
General principles of equipment scale-up as in the case of batch manufacturing apply. As 279
elements such as RTD, process dynamics, and system integration may change, various 280
aspects of the control strategy may be impacted. The applicability of the original control 281
strategy should be assessed at each scale and modified where needed. 282
3.3. Continuous Process Verification 283
In CM, frequent process monitoring and control can be achieved through use of PAT tools, such 284
as in-line/online/at-line monitoring and control, soft sensors and models. These tools allow real-285
time data collection for parameters relevant to process dynamics and material quality, and hence 286
ensure the state of control for every batch. Additionally, since CM can facilitate changes to 287
production output without increasing equipment size, there is an opportunity to generate 288
development knowledge at the same scale intended for commercial manufacturing. These tools, 289
together with the system design and the control strategy, facilitate early execution of process 290
validation activities and the adoption of continuous process verification (ICH Q8) as an alternative 291
to traditional process validation. 292
4. REGULATORY CONSIDERATIONS 293
4.1. Process Description 294
In line with ICH M4Q, a sequential narrative description of the manufacturing process should be 295
included in sections 3.2.S.2.2 and 3.2.P.3.2 of the Common Technical Document (CTD) and 296
supported by pharmaceutical development data provided in CTD sections 3.2.S.2.6 or 3.2.P.2.3. 297
In the case of CM, the process description should be supplemented by: 298
299
A description of the CM operational strategy indicating the operating conditions (e.g., mass 300
flow rates, setpoints, ranges), in-process controls or tests, criteria that should be met for 301
product collection during routine manufacturing, and strategy for material collection and, 302
when applicable, diversion 303
304
ICH Q13 Guideline
8
When appropriate, a description of how the material is transported from one piece of 305
equipment to another (e.g., vertical, horizontal or pneumatic conveying system) 306
307
A flow diagram outlining the direction of material movement through each process step, 308
with the following aspects identified, when applicable: 309
310 o Locations where materials enter and leave the process (including material diversion 311
and collection points) 312
313
o Locations of unit operations and surge lines or tanks 314
315
o Clear indication of the continuous and batch process steps 316
317
o Critical steps and points at which process monitoring and controls (e.g., PAT 318
measurement, feedforward or feedback control), intermediate tests, or final product 319
controls are conducted 320
321
A suitably detailed description of any aspects of equipment design or configuration and 322
system integration that were shown during development to be critical to process control or 323
to impact product quality 324
4.2. Control Strategy 325
The control strategy of a CM process is designed to ensure that output materials made over the run 326
time are of the desired quality. The control strategy should consider the elements discussed in 327
Section 3 of this guideline. It should describe the relevant controls and approaches used during 328
manufacturing and the operational aspects of the CM process. Some aspects of the control strategy 329
are discussed below. 330
331
Input material attributes: Impact of input material attributes and their variability (e.g., 332
intra-batch, inter-batch, different suppliers) on continuous processing should be assessed 333
and proposed material attribute acceptable ranges should be justified when establishing the 334
material specification. For input materials for which pharmacopoeial requirements exist, 335
characterisation and control may extend beyond those requirements. 336
337
Process monitoring and control: An appropriate description should be provided in the 338
dossier to show a robust approach to monitoring and maintaining a state of control. 339
Approaches on how the control system uses process parameters and in-process material 340
attribute measurements to make process- and quality-related decisions (e.g., to pause the 341
process or divert material) should be described. Other important aspects should be defined, 342
such as the sampling strategy (e.g., location, sample size, frequency, statistical approach 343
and criteria, and their relevance to the intended use), summary of the models if used (e.g., 344
multivariate statistical process control), and the use of data in making in-process control 345
decisions (e.g., to trigger material diversion). Fluctuations or variability that may occur 346
during the CM process should not be masked by the data analysis method used. For 347
ICH Q13 Guideline
9
example, when data averaging is used, averaging across appropriate time-based intervals 348
should be considered rather than data averaging across the time for an entire CM run. 349
Therefore, statistical sampling plans and data analysis should be described and justified. 350
351
System operation: Procedures should be established and maintained on site for managing 352
system start-up, shutdown, and pauses and for handling disturbances (see Annex V). 353
Relevant approaches for these operations (e.g., handling disturbances) should be described 354
at an adequate level of detail in the dossier. The disposition of material impacted by 355
transient and pause events should be justified, considering potential risks to output material 356
quality (e.g., the impact of a disturbance as it propagates downstream). 357
358
Material diversion and collection: The material diversion and collection strategy should 359
be described and justified. The strategy described should include the criteria for triggering 360
material diversion, the basis for determining the amount of diverted materials, the 361
conditions for resuming material collection, etc. Factors such as sampling frequency, RTD, 362
and amplitude, duration and propagation of disturbances should be considered in 363
developing the diversion strategy. The amount of diverted material should appropriately 364
incorporate justified safety margins, considering the uncertainty of RTD and other 365
measurements. Procedures for managing material collection, diversion, and disposition 366
(e.g., quarantine, offline testing, investigations) do not need to be included in the dossier 367
but should be maintained within the pharmaceutical quality system (PQS) (ICH Q10). 368
369
RTRT: RTRT may be applied to some or all of the output material quality attributes. RTRT 370
is not a regulatory requirement for CM implementation. When RTRT is proposed, the 371
associated reference test method should be described. Development of the data collection 372
approach for RTRT implementation should include a risk assessment of how any lapses in 373
data collection (e.g., recalibrating a near infrared (NIR) probe) may affect decisions 374
relating to product quality. The proposed control strategy should include alternative or 375
additional quality controls to mitigate the risks to product quality posed by these scenarios. 376
If the results from RTRT fail or are trending towards failure, appropriate investigations 377
should be conducted. Refer to Points to Consider: ICH-Endorsed Guide for ICH 378
Q8/Q9/Q10 Implementation for models used as surrogates for traditional release testing 379
methods. 380
381
Equipment and system integration: Aspects of equipment design and system integration 382
that are shown to be critical to output material quality and its control should be described 383
and justified in the context of the overall control strategy. 384
385
A summary of the control strategy should be provided in CTD section 3.2.S.2.6 or 3.2.P.2.3 with 386
links to the CTD sections that contain the detailed information to enable the understanding and 387
evaluation of the manufacturing process and how it is controlled. 388
4.3. Batch Description 389
The approach to define batch size (see examples in Section 2.2) and the proposed commercial 390
batch size or range should be described in the dossier. 391
392
ICH Q13 Guideline
10
If a range is proposed, it should be justified, and the approach for achieving the range should be 393
described (Section 2.2). Changes in batch size within the proposed batch size range can be 394
managed within the PQS. Any post-approval change to the production output beyond the approved 395
range should be supported by data (Section 3.2) and appropriately managed (i.e., prior approval or 396
notification). 397
398
A suitable quantitative metric should be defined to establish batch-to-batch consistency and system 399
robustness. For example, when a batch size is defined by the amount of collected material, the 400
amount of diverted materials relative to that of collected materials for each batch should be 401
considered. 402
403
The actual intended size of a given batch should be defined before manufacturing begins and 404
should be managed under the PQS. 405
4.4. Process Models 406
The scope of model development, validation, and maintenance and the details provided in the 407
dossier should be commensurate with the model type and impact category. The process model 408
should be specific for the defined system (e.g., equipment, layout, connections). All information 409
for models used as part of commercial manufacturing should be maintained at the manufacturing 410
site. Refer to Points to Consider: ICH-Endorsed Guide for ICH Q8/Q9/Q10 Implementation for 411
regulatory expectations on process models. 412
4.5. Drug Substance and Drug Product Stability 413
Regulatory expectations for the stability data package generally do not differ between CM and 414
batch (see, e.g., ICH Q1A, ICH Q5C). The concept of using a pilot scale batch (e.g., at a minimum, 415
one-tenth of a full production scale) for stability studies, as defined in other guidelines (e.g., ICH 416
Q1A), may not be applicable to CM. See Section 3.2 for considerations that should be taken into 417
account if production output between stability and commercial batches is different. 418
419
Batches used to generate primary stability data should be manufactured using a manufacturing 420
process and equipment representative of the commercial process. Primary stability batches should 421
incorporate the variability described in the ICH stability guidelines (e.g., different drug substance 422
batches or different cell bank vials). Multiple stability batches may be produced from shorter 423
manufacturing runs at the same mass flow rate, provided it is demonstrated that a state of control 424
is established and maintained when the process operates over the longer commercial run times. 425
Alternatively, for chemical entities, a single CM run with a single start-up/shutdown sequence 426
could be used to obtain the stability batches when the aforementioned variability is incorporated 427
into the batches (e.g., by introducing different batches of drug substances in a sequential manner). 428
4.6. Conversion of a Batch Process to CM 429
Changing the manufacturing mode from batch to continuous necessitates the development of an 430
appropriate control strategy, considering factors identified in Section 3. The output materials from 431
the batch and continuous processes should have comparable quality. A science and risk-based 432
approach should be used for establishing product comparability and assessing the need for 433
additional bioequivalence, non-clinical or clinical studies, and stability data. Additional details 434
regarding how to establish product comparability for therapeutic proteins can be found in ICH 435
ICH Q13 Guideline
11
Q5E. Manufacturers should seek regulatory approval before the conversion of an approved batch 436
process to a CM process. Manufacturers can seek advice from the regulatory authority to gain 437
clarification on the regulatory expectations and acceptability of their strategy and data package for 438
the proposed changes (e.g., potential changes in formulation required to enable conversion to CM 439
and the impact of these changes on product registration). 440
4.7. Process Validation 441
The requirements for process validation as established in regional regulations and guidance are 442
similar for batch and continuous processes. In addition to a traditional process validation approach 443
that uses a fixed number of validation batches, a continuous process verification approach may be 444
used. The use of a continuous process verification approach should be justified based on the 445
product and process understanding, system design, and overall control strategy. 446
447
When continuous process verification is used, the CM system performance and material quality 448
should be continuously monitored, such that the real-time data collected demonstrate the 449
maintenance of a state of control and production of output material with the desired quality for the 450
run time duration. The dossier should contain justifications to support the adequacy of a proposed 451
control strategy for continuous process verification. 452
453
When a continuous process verification approach is used to support initial product launch, 454
applicants should define when validation activities are considered sufficient to provide confidence 455
in the commercial manufacturing process. 456
4.8. Pharmaceutical Quality System 457
PQS expectations are the same for batch and CM processes and should follow pertinent ICH 458
guidelines. One important operational aspect of CM is that non-conforming materials can be 459
diverted from the rest of the batch when material traceability, process monitoring, and material 460
diversion strategies are well established. Procedures for material diversion, when required, should 461
be established under the PQS (see Section 4.2). Diverted materials resulting from planned events 462
(e.g., system start-up and shutdown) generally do not require investigation when the events meet 463
established process performance criteria. Examples of approaches for managing disturbances are 464
provided in Annex V. As described therein, when unexpected disturbances occur, appropriate 465
investigation, root cause analysis, and corrective action and preventive action (CAPA) should be 466
instituted. An overarching plan or decision tree that describes how disturbances are managed for 467
various categories of material diversion should be maintained under the PQS. 468
4.9. Lifecycle Management 469
The principles and approaches described in ICH Q12 are applicable to the lifecycle management 470
of CM. Additional lifecycle management aspects related to conversion of a batch to a CM process 471
for existing products can be found in Section 4.6. 472
4.10. Submission of CM-Specific Information in the CTD 473
The dossier should include information as outlined in ICH M4Q. Additional elements relevant to 474
CM should also be provided in the dossier when applicable; some of these elements are listed in 475
Table 1. In the case of integrated drug substance and drug product CM processes, some information 476
ICH Q13 Guideline
12
and data, such as an integrated flow diagram, may be presented in CTD section 3.2.P with a cross 477
reference in 3.2.S (see Annex IV for additional details). 478
479
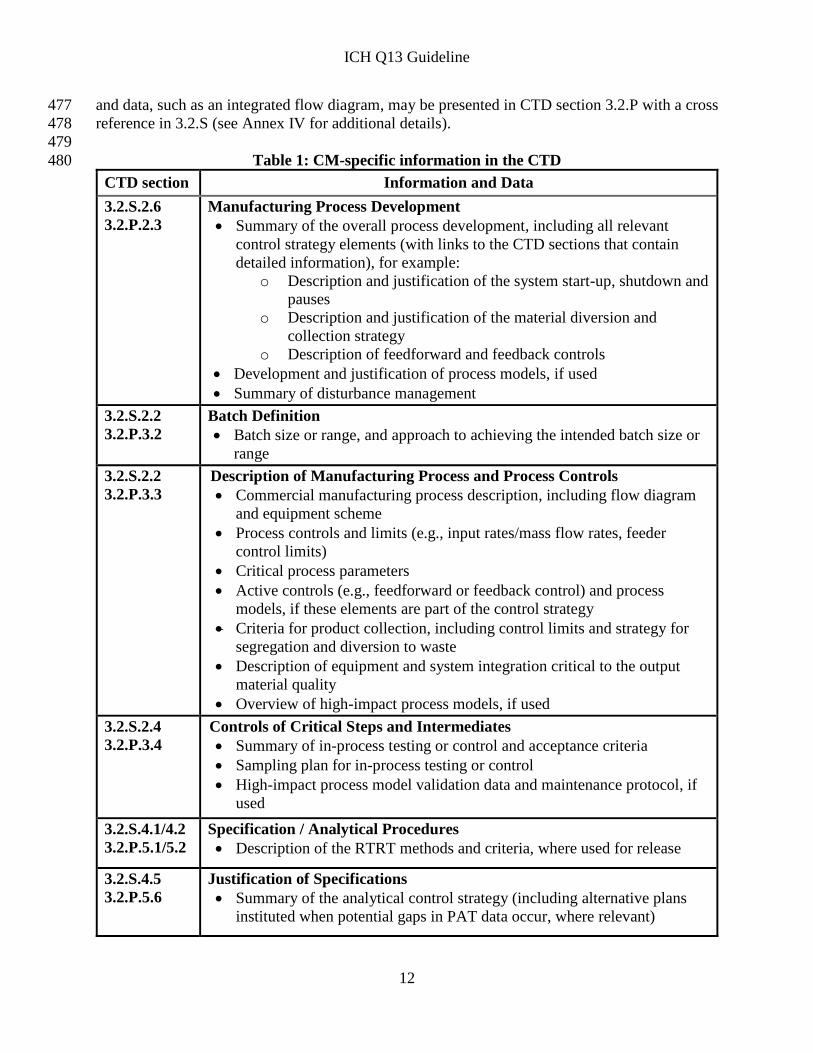
Table 1: CM-specific information in the CTD 480
CTD section Information and Data
3.2.S.2.6
3.2.P.2.3
Manufacturing Process Development
Summary of the overall process development, including all relevant
control strategy elements (with links to the CTD sections that contain
detailed information), for example:
o Description and justification of the system start-up, shutdown and
pauses
o Description and justification of the material diversion and
collection strategy
o Description of feedforward and feedback controls
Development and justification of process models, if used
Summary of disturbance management
3.2.S.2.2
3.2.P.3.2
Batch Definition
Batch size or range, and approach to achieving the intended batch size or
range
3.2.S.2.2
3.2.P.3.3
Description of Manufacturing Process and Process Controls
Commercial manufacturing process description, including flow diagram
and equipment scheme
Process controls and limits (e.g., input rates/mass flow rates, feeder
control limits) Critical process parameters
Active controls (e.g., feedforward or feedback control) and process
models, if these elements are part of the control strategy
Criteria for product collection, including control limits and strategy for
segregation and diversion to waste
Description of equipment and system integration critical to the output
material quality
Overview of high-impact process models, if used
3.2.S.2.4
3.2.P.3.4
Controls of Critical Steps and Intermediates
Summary of in-process testing or control and acceptance criteria
Sampling plan for in-process testing or control
High-impact process model validation data and maintenance protocol, if
used
3.2.S.4.1/4.2
3.2.P.5.1/5.2
Specification / Analytical Procedures
Description of the RTRT methods and criteria, where used for release
3.2.S.4.5
3.2.P.5.6
Justification of Specifications
Summary of the analytical control strategy (including alternative plans
instituted when potential gaps in PAT data occur, where relevant)
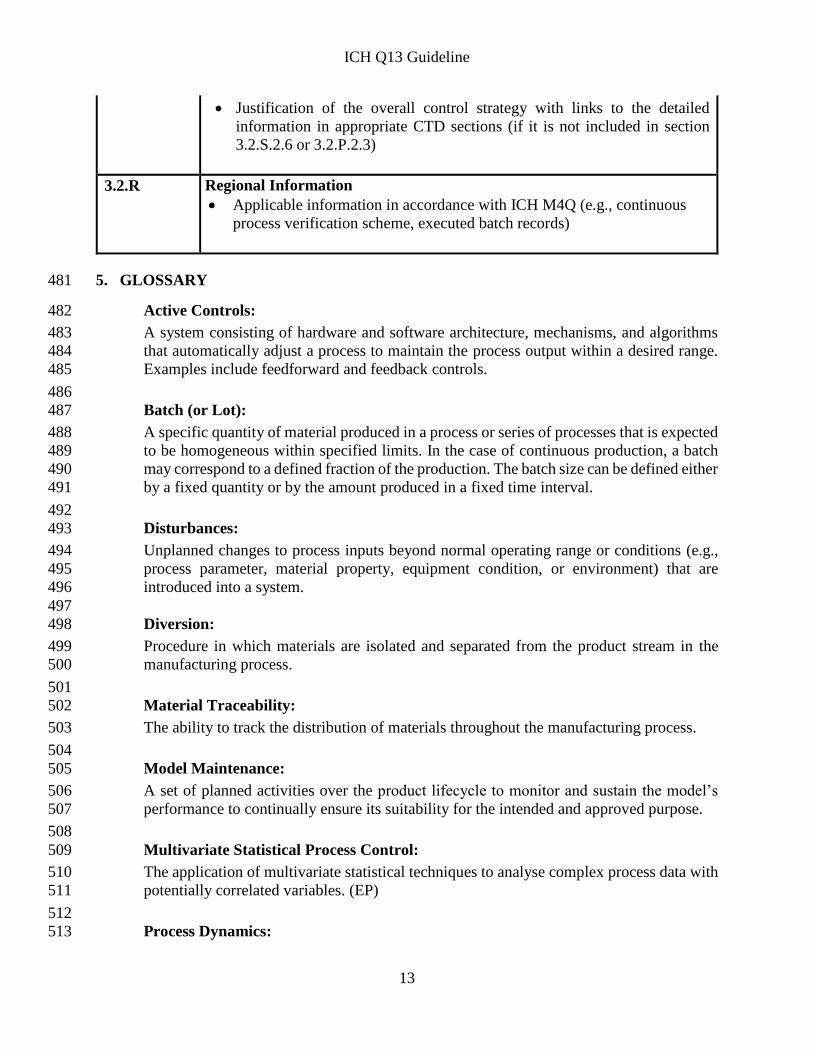
ICH Q13 Guideline
13
Justification of the overall control strategy with links to the detailed
information in appropriate CTD sections (if it is not included in section
3.2.S.2.6 or 3.2.P.2.3)
3.2.R Regional Information
Applicable information in accordance with ICH M4Q (e.g., continuous
process verification scheme, executed batch records)
5. GLOSSARY 481
Active Controls: 482
A system consisting of hardware and software architecture, mechanisms, and algorithms 483
that automatically adjust a process to maintain the process output within a desired range. 484
Examples include feedforward and feedback controls. 485
486
Batch (or Lot): 487
A specific quantity of material produced in a process or series of processes that is expected 488
to be homogeneous within specified limits. In the case of continuous production, a batch 489
may correspond to a defined fraction of the production. The batch size can be defined either 490
by a fixed quantity or by the amount produced in a fixed time interval. 491
492
Disturbances: 493
Unplanned changes to process inputs beyond normal operating range or conditions (e.g., 494
process parameter, material property, equipment condition, or environment) that are 495
introduced into a system. 496
497
Diversion: 498
Procedure in which materials are isolated and separated from the product stream in the 499
manufacturing process. 500
501
Material Traceability: 502
The ability to track the distribution of materials throughout the manufacturing process. 503
504
Model Maintenance: 505
A set of planned activities over the product lifecycle to monitor and sustain the model’s 506
performance to continually ensure its suitability for the intended and approved purpose. 507
508
Multivariate Statistical Process Control: 509
The application of multivariate statistical techniques to analyse complex process data with 510
potentially correlated variables. (EP) 511
512
Process Dynamics: 513
ICH Q13 Guideline
14
The response of a manufacturing process to changing conditions or transient events. 514
515
Residence Time Distribution (RTD): 516
A measure of the range of residence times experienced by material passing through a 517
specific process environment/vessel/unit operation. (ASTM E2968-14) 518
519
Run Time: 520
The time interval used to produce a quantity of output material. 521
522
Soft Sensors: 523
A model that is used in lieu of physical measurement to estimate a variable or attribute 524
(e.g., a quality attribute of material) based on measured data (e.g., process data). The model 525
development, including selection of such data variables, is driven by comprehensive 526
product and process understanding. 527
528
Steady State: 529
A stable condition that does not change over time. 530
531
System: 532
A manufacturing architecture that, in the context of CM, consists of individual pieces of 533
equipment, their connections to one another and monitoring and control systems, and 534
spatial layout. 535
536
Transient Events: 537
A temporary condition in which a process goes through a dynamic change. This change 538
may be due to a disturbance or an intentional alteration in the selected operating conditions 539
(e.g., start-up, shutdown, changes from one operating condition to another). 540
541
Unit Operation: 542
A basic step in a process. Unit operations involve a physical or chemical transformation 543
such as a reaction, crystallisation, blending, purification, granulation, filtration, and virus 544
inactivation. 545
6. REFERENCES 546
ASTM E2968-14: Standard Guide for Application of Continuous Processing in the Pharmaceutical 547
Industry 548
549
EP: European Pharmacopoeia 550
551
ICH Q1A: Stability Testing of New Drug Substances and Products 552
553
ICH Q5C: Quality of Biotechnological Products: Stability Testing of Biotechnological/Biological 554
Products 555
ICH Q13 Guideline
15
556
ICH Q5E: Comparability of Biotechnological/Biological Products Subject to Changes in Their 557
Manufacturing Process 558
559
ICH Q6A: Specifications: Test Procedures and Acceptance Criteria for New Drug Substances and 560
New Drug Products: Chemical Substances 561
562
ICH Q7: Good Manufacturing Practice Guide for Active Pharmaceutical Ingredients 563
564
ICH Q8: Pharmaceutical Development 565
566
ICH Q9: Quality Risk Management 567
568
ICH Q10: Pharmaceutical Quality System 569
570
ICH Q11: Development and Manufacture of Drug Substances (Chemical Entities and 571
Biotechnological/Biological Entities) 572
573
ICH Q12: Technical and Regulatory Considerations for Pharmaceutical Product Lifecycle 574
Management 575
576
ICH M4Q: The Common Technical Document for The Registration of Pharmaceuticals for Human 577
Use: Quality 578
579
Points to Consider: ICH-Endorsed Guide for ICH Q8/Q9/Q10 Implementation 580
ICH Q13 Guideline
16
PART II: ANNEXES 581
582
ANNEX I: CONTINUOUS MANUFACTURING OF DRUG SUBSTANCES FOR 583
CHEMICAL ENTITIES 584
585
1. INTRODUCTION AND EXAMPLE SYSTEM OVERVIEW 586
This annex exemplifies one approach to implement CM of drug substances for chemical entities 587
based on the scientific principles described in the main guideline. The discussion points presented 588
here are not exhaustive for drug substance CM systems. Alternative approaches can be used. 589
590
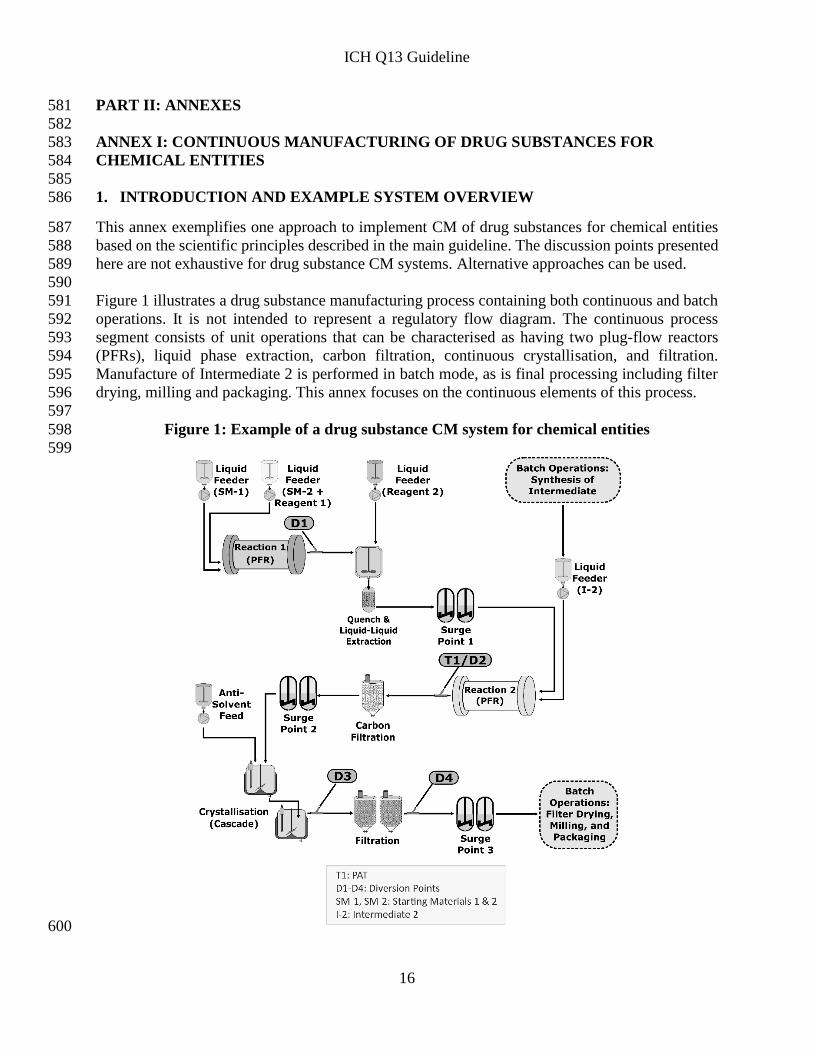
Figure 1 illustrates a drug substance manufacturing process containing both continuous and batch 591
operations. It is not intended to represent a regulatory flow diagram. The continuous process 592
segment consists of unit operations that can be characterised as having two plug-flow reactors 593
(PFRs), liquid phase extraction, carbon filtration, continuous crystallisation, and filtration. 594
Manufacture of Intermediate 2 is performed in batch mode, as is final processing including filter 595
drying, milling and packaging. This annex focuses on the continuous elements of this process. 596
597
Figure 1: Example of a drug substance CM system for chemical entities 598
599
600
ICH Q13 Guideline
17
2. CONTROL STRATEGY AND OTHER TECHNICAL CONSIDERATIONS 601
The CM system and its control strategy were designed to control parameters that impact the 602
manufacture and quality of the drug substance, including impurity profile and physicochemical 603
properties. The overall control strategy was developed in accordance with the main guideline and 604
ICH Q7–Q11. 605
2.1. Equipment Design and Integration 606
Within the continuous process segment in Figure 1 (Section 1 of this annex), the following 607
processes occur: 608
609
Reaction 1: Starting materials 1 and 2 are coupled in a PFR to produce Intermediate 1. 610
Diversion Point D1 is located after the PFR to permit material diversion when PFR 611
conditions are outside predefined acceptance criteria. The reaction is quenched as an 612
integrated operation after the PFR, and unwanted by-products are removed by liquid-liquid 613
extraction. The resultant solution (Intermediate 1) is used as an input for the second 614
reaction without isolation. 615
616
Reaction 2: Intermediate 1 and Intermediate 2 (prepared upstream through separate batch 617
unit operations) are coupled in a second PFR to form the crude drug substance. The online 618
PAT near the reactor exit (T1) monitors conversion of Intermediate 1 to the crude drug 619
substance. Diversion Point D2 located after PAT is used to divert non-conforming material. 620
621
Drug Substance Isolation: The crude drug substance is purified by carbon filtration and 622
continuous two-stage crystallisation. The crystal slurry is filtered by using two identical 623
filtration units running in an alternating fashion. This setup enables continuous processing 624
of the drug substance after crystallisation by allowing the collection of crystallised products 625
on one filter unit at the same time product isolated on the second filter is discharged. 626
Diversion Points D3 and D4 allow for material diversion at the crystalliser and just before 627
batch operations, respectively. A batch dry milling operation is used to achieve the desired 628
particle size distribution of the crystallised drug substance. 629
630
Three surge points (each containing multiple surge tanks) are used: one before Reaction 2, another 631
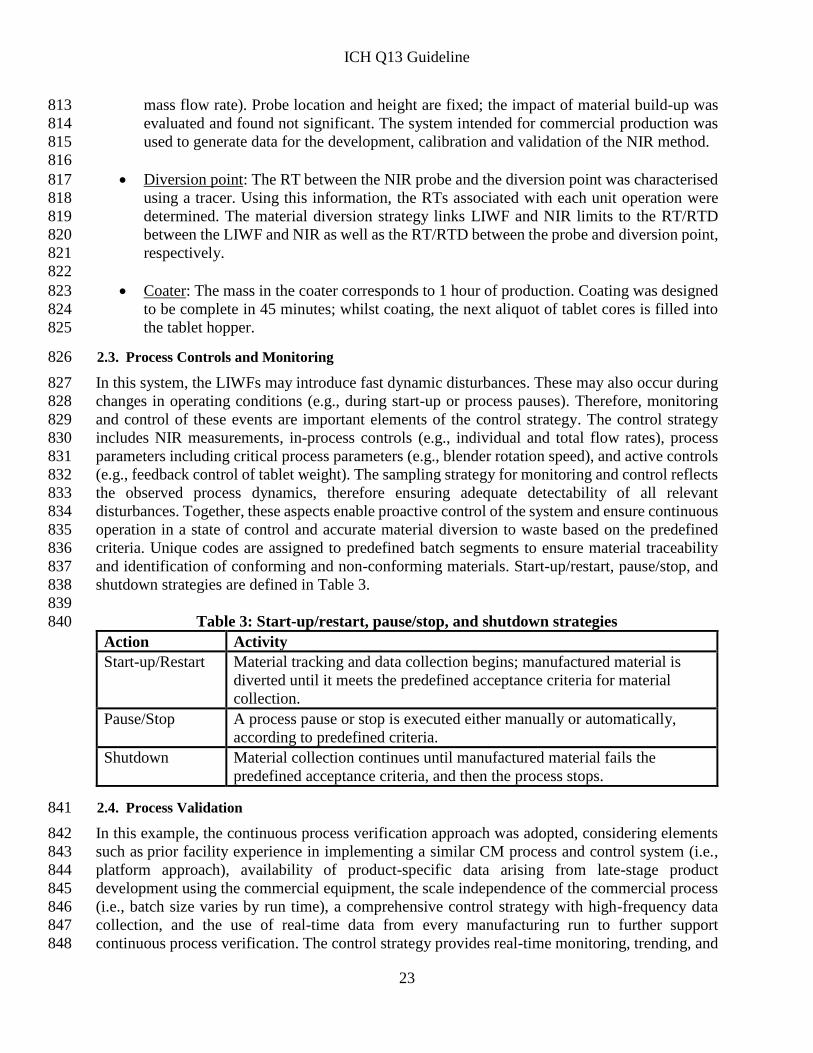
before the two-stage continuous crystallisation, and one just before final batch operations. These 632
are important components of the system design and control strategy, as they improve process 633
robustness and mitigate temporary differences in mass flow rates by decoupling upstream and 634
downstream operations. 635
636
The design of the overall system and each unit operation, along with the control strategy, optimise 637
material quality. For example, PFR design elements (i.e., dimension and configuration) allow 638
precise control of temperature, mixing and reactant flows. These parameters were shown during 639
development to be important to the drug substance impurity profile. 640
2.2. Process Control and Monitoring 641
Holistic controls used across Reactions 1 and 2 ensure consistent operations and quality of the 642
resulting crude drug substance. The stoichiometry of Reaction 1 is controlled precisely via control 643
of concentrations and flow rates of the feeds. Conversion of starting materials to Intermediate 1 644
ICH Q13 Guideline
18
with minimal impurity formation is ensured through control of the reaction temperature. Reaction 645
2 is controlled through feedback control of the addition rate of Intermediate 2 based on the PAT 646
measurement of Intermediate 1 levels. This ensures correct stoichiometry for that reaction and 647
minimises the impact of variability of the Intermediate 1 feed solution on drug substance purity. 648
The PAT also measures levels of crude drug substance and process impurities, which confirm 649
successful operation of all preceding steps and consistent product quality. 650
651
RTD was used to develop a suitable strategy for disturbance detection, corrective actions, and 652
material diversion. RTD characterisation was based on mathematical modeling of all unit 653
operations and surge points across the entire CM process over planned mass flow rates. The RTD 654
was then confirmed through experimental tracer studies for appropriate segments of the 655
commercial equipment. Decisions for triggering material diversion are based on comparing 656
process parameters and PAT measurements to predefined acceptance criteria with timing and 657
duration of diversion informed by the RTD. Importantly, the RTD is also used for material 658
traceability purposes. 659
660
Understanding of process dynamics and its impact on quality attributes of material produced 661
throughout the entire process was also used to guide start-up and shutdown strategies. For example, 662
during start-up of Reactions 1 and 2, a small amount of Intermediate 1 or crude drug substance is 663
diverted at Diversion Points 1 or 2, respectively, to allow those materials to reach the target 664
concentrations before processing into subsequent operations. The criteria for diversion were 665
established based on time considering the RTD. This approach was supported by development 666
studies and confirmed in commercial process equipment. PAT monitoring after Reaction 2 667
provides additional verification that appropriate criteria have been met during start-up. Collection 668
of material proceeds to the end of the process as subsequently described. 669
670
Sampling and process measurement needs were evaluated, considering relevant factors such as 671
residence times (RTs)/RTD, surge points, process dynamics, and the type and purpose of the 672
measurement. The measurement frequency of the PAT at Reaction 2 is sufficient to detect 673
disturbances, inform process adjustments, and ensure timely diversion of material based on 674
predefined criteria. The criteria for material diversion are based on the magnitude and duration of 675
the disturbance, an understanding of process dynamics and RTD for downstream unit operations 676
and surge points, and the impurity purging capability of the crystallisation operation. As a result 677
of this control strategy, all crude drug substance solution that enters continuous crystallisation 678
meets acceptable quality criteria and can be forward processed through the crystalliser. 679
680
Appropriate controls and monitoring requirements for the continuous crystallisation were 681
extensively investigated during development in similar, but smaller scale equipment and verified 682
using commercial equipment. Process development included spiking studies using impurity-683
enriched feed solutions and intentional perturbations in process parameters (i.e., feed flow rates, 684
their ratios, and temperatures). An evaluation of the encrusted solids in the crystalliser over 685
extended run times demonstrated the solids were the same form and purity as the free-flowing drug 686
substance slurry. The set of process parameters and ranges identified by these studies were 687
appropriately scaled up. Implementation of these controls along with post-crystallisation material 688
tests (e.g., crystal form, purity) ensure consistent quality of the resulting drug substance throughout 689
continuous crystallisation and filtration. 690
ICH Q13 Guideline
19
691
The resulting material is collected at Surge Point 3 and is dried and milled using batch operations 692
to provide a drug substance of the appropriate particle size for use in drug product 693
manufacturing. Procedures were developed to allow diversion of material at Diversion Points D3 694
or D4 in the event desired process conditions or material attributes are not met. However, diversion 695
of the drug substance from the crystalliser was found to be unnecessary either during start-up or 696
shutdown. 697
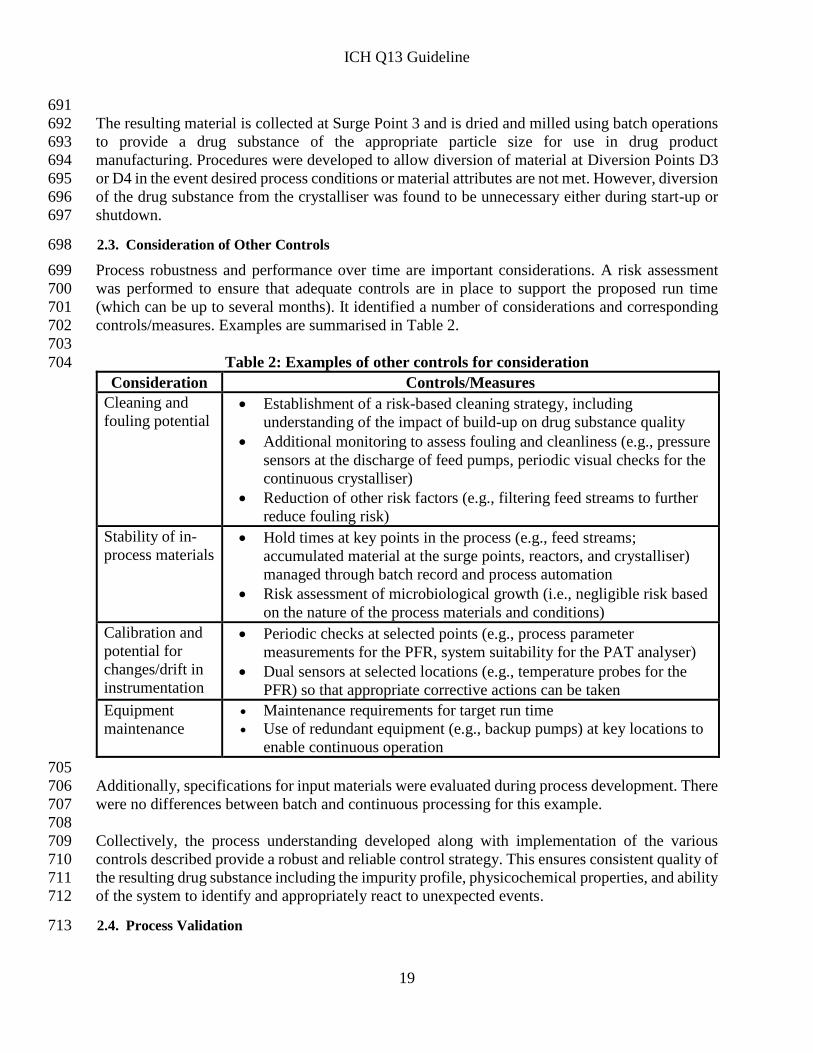
2.3. Consideration of Other Controls 698
Process robustness and performance over time are important considerations. A risk assessment 699
was performed to ensure that adequate controls are in place to support the proposed run time 700
(which can be up to several months). It identified a number of considerations and corresponding 701
controls/measures. Examples are summarised in Table 2. 702
703
Table 2: Examples of other controls for consideration 704
Consideration Controls/Measures
Cleaning and
fouling potential Establishment of a risk-based cleaning strategy, including
understanding of the impact of build-up on drug substance quality
Additional monitoring to assess fouling and cleanliness (e.g., pressure
sensors at the discharge of feed pumps, periodic visual checks for the
continuous crystalliser)
Reduction of other risk factors (e.g., filtering feed streams to further
reduce fouling risk)
Stability of in-
process materials Hold times at key points in the process (e.g., feed streams;
accumulated material at the surge points, reactors, and crystalliser)
managed through batch record and process automation
Risk assessment of microbiological growth (i.e., negligible risk based
on the nature of the process materials and conditions)
Calibration and
potential for
changes/drift in
instrumentation
Periodic checks at selected points (e.g., process parameter
measurements for the PFR, system suitability for the PAT analyser)
Dual sensors at selected locations (e.g., temperature probes for the
PFR) so that appropriate corrective actions can be taken
Equipment
maintenance
Maintenance requirements for target run time
Use of redundant equipment (e.g., backup pumps) at key locations to
enable continuous operation
705
Additionally, specifications for input materials were evaluated during process development. There 706
were no differences between batch and continuous processing for this example. 707
708
Collectively, the process understanding developed along with implementation of the various 709
controls described provide a robust and reliable control strategy. This ensures consistent quality of 710
the resulting drug substance including the impurity profile, physicochemical properties, and ability 711
of the system to identify and appropriately react to unexpected events. 712
2.4. Process Validation 713
ICH Q13 Guideline
20
The combination of process controls, online PAT measurements, comprehensive monitoring of 714
process parameters and material attributes, and end-product testing results in a data-rich 715
environment for this process. Together with system understanding generated during development, 716
this enabled the use of a traditional process validation for commercial product launch and 717
continuous process verification to validate process changes over the product lifecycle. 718
719
A range of batch sizes was initially established based on material demands and the quantities of 720
material necessary to match input needs of the final batch unit operations. The process was 721
validated using a fixed number of batches. A single planned start-up and shutdown of the 722
commercial CM system was used to manufacture the process validation batches. This approach 723
was supported by the totality of evidence demonstrating the start-up and shutdown capabilities of 724
the system. This included development work on similar equipment, commercial equipment and 725
system qualification data, results of a prevalidation demonstration run, and extensive process 726
monitoring of the CM system that can verify success of each start-up and shutdown in real time. 727
728
Subsequently, a continuous process verification approach was adopted after product approval to 729
support increases in batch size with extension of run time. This approach used a risk assessment 730
for the longer run time, which concluded that process performance and material quality would not 731
be impacted. Under the continuous process verification approach, data generated during the 732
manufacture of each batch was used to support successful validation of that batch with the 733
extended run time. This included information such as system performance monitoring and data 734
logs along with other controls that ensure material quality with appropriate detection and corrective 735
action. Additionally, appropriate regulatory actions were taken to communicate this manufacturing 736
change and use of the continuous process verification approach. 737
3. REGULATORY CONSIDERATIONS 738
Refer to Section 4 of the main guideline. In consideration of the specific CM process design, 739
additional elements may need to be included in a dossier. For instance, in this example, the 740
influence of surge points on the material diversion and collection strategy, including the fate of 741
materials, was described. 742
ICH Q13 Guideline
21
ANNEX II: CONTINUOUS MANUFACTURING FOR DRUG PRODUCTS 743
744
1. INTRODUCTION AND EXAMPLE SYSTEM OVERVIEW 745
This annex exemplifies one approach to implement CM for a solid dose drug product based on the 746
scientific principles described in the main guideline. The discussion points presented here are not 747
exhaustive for solid dose drug product CM systems. Alternative approaches can be used. Specific 748
considerations relating to the implementation of a continuous direct compression process for a 749
chemical entity are presented. 750
751
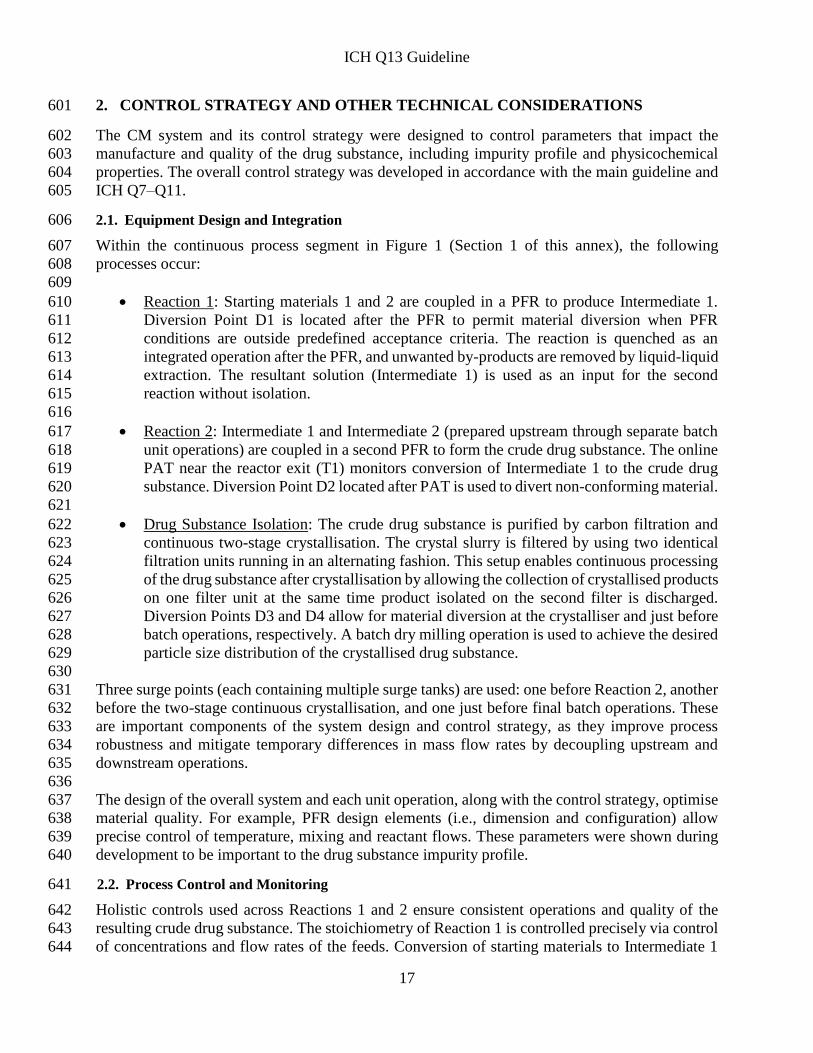
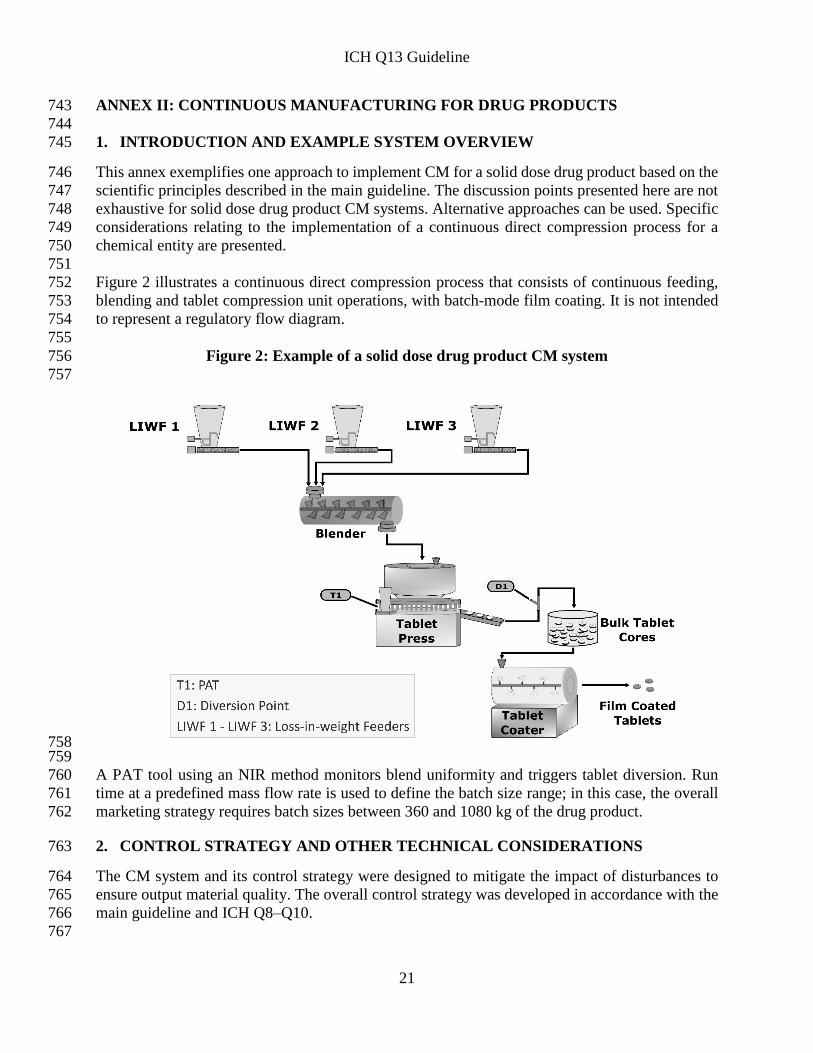
Figure 2 illustrates a continuous direct compression process that consists of continuous feeding, 752
blending and tablet compression unit operations, with batch-mode film coating. It is not intended 753
to represent a regulatory flow diagram. 754
755
Figure 2: Example of a solid dose drug product CM system 756
757
758 759
A PAT tool using an NIR method monitors blend uniformity and triggers tablet diversion. Run 760
time at a predefined mass flow rate is used to define the batch size range; in this case, the overall 761
marketing strategy requires batch sizes between 360 and 1080 kg of the drug product. 762
2. CONTROL STRATEGY AND OTHER TECHNICAL CONSIDERATIONS 763
The CM system and its control strategy were designed to mitigate the impact of disturbances to 764
ensure output material quality. The overall control strategy was developed in accordance with the 765
main guideline and ICH Q8–Q10. 766
767
ICH Q13 Guideline
22
2.1. Material Characterisation and Control 768
During process development and design, a quality-by-design approach was adopted that identified 769
equipment and process parameters critical to control of the process. Furthermore, the relationships 770
between material quality attributes and their impact on unit operations (particularly the loss-in-771
weight feeders (LIWFs) and blender) and product critical quality attributes (CQAs) were 772
evaluated. Bulk density of the primary excipient and particle size distribution (PSD) of the drug 773
substance were identified as critical to blend and content uniformity. A defined bulk density range 774
and three-tier (d10, d50, d90) PSD specification were implemented for the excipient and drug 775
substance, respectively. 776
2.2. Equipment Design and Integration 777
Unit operations and system components (e.g., NIR probe) were designed or selected to mitigate 778
the impact of disturbances on final product quality. The overall design principle is, where possible, 779
to use gravity to move material. During system integration, the material flow was coordinated 780
across all unit operations to avoid material accumulation or emptying. System mass balance was 781
obtained through understanding of material flow (i.e., RT and RTD) at the intended operating 782
conditions of each unit operation. The impact of equipment design and operation on process 783
dynamics was characterised by the RTD of individual unit operations, as well as the RTD of 784
process segments between individual unit operations and the diversion point. The RTDs were 785
determined by replacing the drug substance in the formulation with a tracer that has highly similar 786
flow properties to those of the drug substance. 787
788
The following aspects of equipment design and integration were emphasised: 789
790
LIWF: Feeder mass flow rates and their variability were characterised. LIWFs are 791
controlled to deliver the theoretical amount of each input material per the formulation; it 792
was demonstrated that the risks of minor variations to product composition were mitigated 793
by blender mixing capability. Feeder mass flow rates were evaluated using design of 794
experiment (DOE) studies and the proven acceptable ranges of target flow rates were 795
defined. Modelling and statistical approaches (e.g., funnel plots) were used to help 796
determine the limits for the magnitude and duration of disturbances in mass flow rates, for 797
which material diversion, operator investigation, or process stop are needed. LIWFs 798
operate in gravimetric mode unless they are refilling (volumetric mode). Refill aspects 799
(e.g., duration and mass of refill) were evaluated to minimise the impact on feeding. 800
801
Blender: A horizontal blender was selected for the CM system and the blender design was 802
evaluated (e.g., paddle versus ribbon, number and orientation of paddles in the blender, 803
rotation speed). It was determined that a paddle blender is critical to ensure desired blend 804
uniformity. Rotation speed, number and orientation of the paddles were evaluated for their 805
impact on blend uniformity over the ranges studied, and the corresponding design space 806
for the blending process was defined. RTD characterisation provided information on the 807
degree of forward and back mixing and disturbance propagation, and the RTD was used to 808
define the material traceability and diversion strategy. 809
810
NIR probe: The NIR probe was placed in the tablet press feed frame. The chosen NIR 811
equipment met the PAT application requirements (e.g., analysis speed, sampling method, 812
ICH Q13 Guideline
23
mass flow rate). Probe location and height are fixed; the impact of material build-up was 813
evaluated and found not significant. The system intended for commercial production was 814
used to generate data for the development, calibration and validation of the NIR method. 815
816
Diversion point: The RT between the NIR probe and the diversion point was characterised 817
using a tracer. Using this information, the RTs associated with each unit operation were 818
determined. The material diversion strategy links LIWF and NIR limits to the RT/RTD 819
between the LIWF and NIR as well as the RT/RTD between the probe and diversion point, 820
respectively. 821
822
Coater: The mass in the coater corresponds to 1 hour of production. Coating was designed 823
to be complete in 45 minutes; whilst coating, the next aliquot of tablet cores is filled into 824
the tablet hopper. 825
2.3. Process Controls and Monitoring 826
In this system, the LIWFs may introduce fast dynamic disturbances. These may also occur during 827
changes in operating conditions (e.g., during start-up or process pauses). Therefore, monitoring 828
and control of these events are important elements of the control strategy. The control strategy 829
includes NIR measurements, in-process controls (e.g., individual and total flow rates), process 830
parameters including critical process parameters (e.g., blender rotation speed), and active controls 831
(e.g., feedback control of tablet weight). The sampling strategy for monitoring and control reflects 832
the observed process dynamics, therefore ensuring adequate detectability of all relevant 833
disturbances. Together, these aspects enable proactive control of the system and ensure continuous 834
operation in a state of control and accurate material diversion to waste based on the predefined 835
criteria. Unique codes are assigned to predefined batch segments to ensure material traceability 836
and identification of conforming and non-conforming materials. Start-up/restart, pause/stop, and 837
shutdown strategies are defined in Table 3. 838
839
Table 3: Start-up/restart, pause/stop, and shutdown strategies 840
Action Activity
Start-up/Restart Material tracking and data collection begins; manufactured material is
diverted until it meets the predefined acceptance criteria for material
collection.
Pause/Stop A process pause or stop is executed either manually or automatically,
according to predefined criteria.
Shutdown Material collection continues until manufactured material fails the
predefined acceptance criteria, and then the process stops.
2.4. Process Validation 841
In this example, the continuous process verification approach was adopted, considering elements 842
such as prior facility experience in implementing a similar CM process and control system (i.e., 843
platform approach), availability of product-specific data arising from late-stage product 844
development using the commercial equipment, the scale independence of the commercial process 845
(i.e., batch size varies by run time), a comprehensive control strategy with high-frequency data 846
collection, and the use of real-time data from every manufacturing run to further support 847
continuous process verification. The control strategy provides real-time monitoring, trending, and 848
ICH Q13 Guideline
24
prediction analysis through the use of NIR measurements, LIWF data, and other data sources 849
arising from monitoring process parameters (e.g., blender torque), thus providing a high degree of 850
assurance of real-time CM system stability and performance and output material quality. The 851
continuous process verification approach, coupled with appropriate regulatory action for reporting 852
manufacturing changes, was used to validate run time extensions beyond current experience. 853
3. REGULATORY CONSIDERATIONS 854
Refer to Section 4 of the main guideline. In consideration of the specific CM process design, 855
additional elements may need to be included in a dossier. For instance, in this example, elements 856
that can significantly impact process dynamics and homogeneity (e.g., design space, number of 857
paddles and their orientation in the horizontal paddle blender) were described. 858
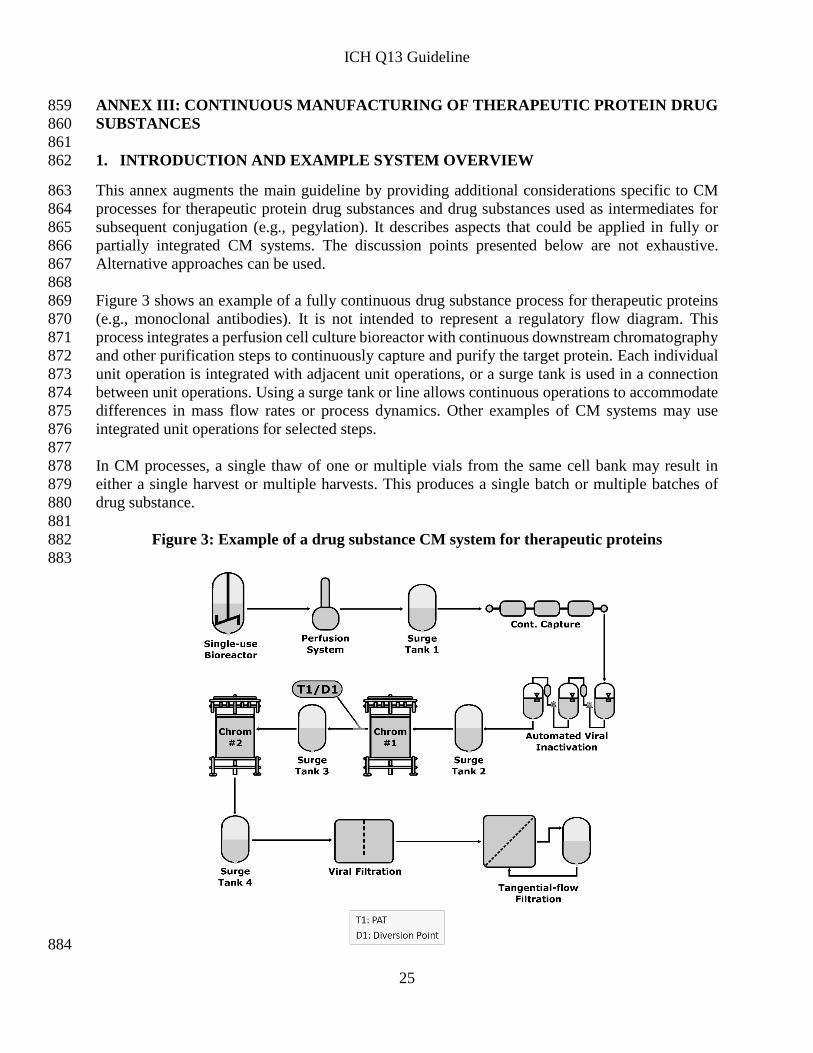
ICH Q13 Guideline
25
ANNEX III: CONTINUOUS MANUFACTURING OF THERAPEUTIC PROTEIN DRUG 859
SUBSTANCES 860
861
1. INTRODUCTION AND EXAMPLE SYSTEM OVERVIEW 862
This annex augments the main guideline by providing additional considerations specific to CM 863
processes for therapeutic protein drug substances and drug substances used as intermediates for 864
subsequent conjugation (e.g., pegylation). It describes aspects that could be applied in fully or 865
partially integrated CM systems. The discussion points presented below are not exhaustive. 866
Alternative approaches can be used. 867
868
Figure 3 shows an example of a fully continuous drug substance process for therapeutic proteins 869
(e.g., monoclonal antibodies). It is not intended to represent a regulatory flow diagram. This 870
process integrates a perfusion cell culture bioreactor with continuous downstream chromatography 871
and other purification steps to continuously capture and purify the target protein. Each individual 872
unit operation is integrated with adjacent unit operations, or a surge tank is used in a connection 873
between unit operations. Using a surge tank or line allows continuous operations to accommodate 874
differences in mass flow rates or process dynamics. Other examples of CM systems may use 875
integrated unit operations for selected steps. 876
877
In CM processes, a single thaw of one or multiple vials from the same cell bank may result in 878
either a single harvest or multiple harvests. This produces a single batch or multiple batches of 879
drug substance. 880
881
Figure 3: Example of a drug substance CM system for therapeutic proteins 882
883
884
ICH Q13 Guideline
26
2. CONTROL STRATEGY 885
2.1. Adventitious Agent Control 886
In general, all principles used to ensure safety in batch manufacturing are applicable to CM. Safety 887
is demonstrated by a threefold approach based on the principles outlined in ICH Q5A. Control of 888
adventitious agents (e.g., bacteria, viruses, fungi, mycoplasma) should be based on a risk 889
assessment of all potential sources of contamination (e.g., starting and raw materials, 890
manufacturing operations), the ability of the process to remove and inactivate adventitious agents, 891
and the testing capability to ensure the absence of adventitious agents. Based on this assessment, 892
a strategy should be developed to include the type and frequency of adventitious agent testing 893
undertaken to demonstrate that the process remains free of contamination during cell culture and 894
other downstream steps. An aspect unique to CM is extended cell culture duration and continuous 895
processing of harvested cell culture material to obtain drug substances. This means that measures 896
should be in place to demonstrate the acceptability of all cell culture material used to generate a 897
given drug substance batch. Rapid testing for adventitious agents, when possible, may enable real-898
time decision-making to mitigate the impact of contamination events during continuous operation. 899
2.2. Equipment Design and System Integration 900
While the use of closed processing equipment may decrease the risk of contamination from 901
adventitious agents, the integrity of single-use equipment during use should be ensured to prevent 902
contamination. The potential weak points (e.g., welds, connectors) and typical locations where 903
single-use systems require changing out over a potentially extended time frame or at a higher 904
frequency for a CM process should be evaluated for potential contamination risks. Filtration steps 905
in CM may be subject to longer filtration periods and potentially increased throughput per unit 906
area or a greater number of filter changes than those under batch manufacturing. Given these 907
factors, a control strategy and a clearly defined scheme should be put in place to allow for filter 908
changes and post-use integrity testing, as appropriate, without interrupting the process. In the event 909
of a filter failure, a clear strategy for material diversion and refiltration (reprocessing) should be 910
defined. 911
912
The CM system should contain appropriate sampling locations based on risk assessment to enable 913
detection of inadvertent contamination, while avoiding unnecessary contamination risk introduced 914
through the sampling procedure. The sampling locations and frequency may be adjusted based on 915
improved product and process understanding. 916
917
Integrated systems may use surge tanks for flow rate adjustments or other purposes between steps 918
such as virus inactivation. When surge tanks are used, the relevant RTD, uniformity and microbial 919
risks to the product in these surge tanks should be evaluated and defined in advance. 920
921
When considering the facility design for a CM process, either closed systems in an open 922
architecture (ballroom) layout or open systems with physical segregation of post-viral filtration 923
material could be used with appropriate justification. 924
2.3. Process Monitoring and Real-Time Release Testing 925
CM lends itself to various monitoring schemes with different levels of automation. Examples 926
include in-line sensors placed directly in a process vessel or flowing material stream and online 927
ICH Q13 Guideline
27
analysers that conduct automatic sampling. Regardless of the approach used, appropriate 928
monitoring at suitable stages of the CM process enables timely data analysis to ensure operations 929
are in a state of control. In certain cases, relevant process parameters may be adjusted to ensure 930
the quality of in-process or output materials. Enhancing in-line/online PAT capabilities and 931
development of automation systems for process monitoring enables a continuous monitoring 932
scheme in support of a release testing strategy that may include RTRT for some quality attributes. 933
Conventional offline testing for product release is necessary for quality attributes for which 934
analytical technologies are not available for online or in-line measurements (e.g., potency). 935
Likewise, conventional tests for monitoring and control (e.g., microbiological analytical methods 936
and other tests that require long processing times) might also be needed. 937
3. PROCESS VALIDATION 938
3.1. Approaches to Process Validation 939
Process validation approaches used for processes run in batch mode are also applicable to CM 940
processes. Therefore, the scope of validation continues to be to demonstrate the ability to 941
consistently manufacture a product with the desired quality attributes. 942
943
For therapeutic protein CM, any approach chosen to demonstrate the consistency of process 944
performance and product quality should consider all potential sources of variability. This may 945
include variability between batches purified from harvest materials collected up to the limit of in 946
vitro cell age from a single cell bank thaw, as well as the potential variability between different 947
batches purified from harvests of multiple cell bank thaws. Variability may be evaluated either as 948
part of process qualification or through alternative studies, if justified. For some unit operations, 949
the use of scale-down models remains an alternative approach to validation (e.g., viral clearance), 950
if justified. 951
952
Alternatives to the process validation approaches (e.g., continuous process verification) may be 953
considered when justified. Refer to Sections 3.3 and 4.7 of the main guideline for more details 954
regarding continuous process verification. Additionally, elements such as risk assessment, the 955
applicability of small-scale development data, process models, and experience with molecules that 956
are sufficiently alike with respect to their CM process may be considered in determining the 957
suitability of a continuous process verification approach. 958
3.2. Run Time Considerations 959
Bioreactors for CM may operate for significantly longer periods of time than bioreactors for batch 960
manufacturing. The approach to establish a limit of in vitro cell age for production cells does not 961
differ, regardless of the mode of bioreactor operation. Previously established limits of in vitro cell 962
age for a bioreactor operating in a batch mode run may not be applicable to a bioreactor operating 963
in a continuous mode under different culture conditions. The limit of in vitro cell age used for 964
production should be based on data derived from production cells expanded under pilot-plant scale 965
or commercial-scale conditions to the proposed in vitro cell age or beyond as outlined in ICH Q5A. 966
967
Run time considerations should include factors such as the control of all adventitious agents (e.g., 968
viruses, bacteria, fungi, mycoplasma) and the impact of resin and membrane lifetimes. Viral testing 969
should be conducted as outlined by ICH Q5A, and an appropriate microbial control strategy should 970
be established. 971
ICH Q13 Guideline
28
3.3. Viral Clearance Validation 972
The general recommendations outlined in ICH Q5A for viral safety and clearance remain 973
applicable for CM. Where recommendations may not be applicable to a CM system, scientifically 974
justified alternatives may be proposed. 975
976
Considerations specific to CM in aspects such as qualification of small-scale models are addressed 977
in ICH Q5A. 978
ICH Q13 Guideline
29
ANNEX IV: INTEGRATED DRUG SUBSTANCE AND DRUG PRODUCT 979
CONTINUOUS MANFACTURING 980
981
1. INTRODUCTION 982
This annex augments the main guideline by providing additional considerations for the 983
development and implementation of an integrated drug substance and drug product CM process 984
(referred to as integrated process hereafter). An integrated process for a small molecule tablet 985
dosage form is used for illustration. The illustrative example and approaches described in this 986
annex are not exhaustive. Alternative approaches can be used. 987
2. INTEGRATED SMALL MOLECULE DRUG SUBSTANCE/DRUG PRODUCT 988
PROCESSES 989
2.1. Characteristics of Drug Substance and Drug Product Process Steps 990
Considering the differences between the drug substance and drug product process steps enables 991
appropriate design of an integrated process. For example, process steps for drug substance and 992
drug product manufacturing may have different RTs, and a prevalence for liquid or solid input 993
material addition can lead to a different frequency of in-process measurements. These differences 994
may influence the selection of equipment, equipment connections, surge lines or tanks, and the 995
locations of in-process measurements and material diversion. 996
2.2. Example of an Integrated Process 997
Figure 4, which is not intended to represent a regulatory flow diagram, illustrates a fully continuous 998
integrated drug substance and drug product process. It shows the following elements: 999
1000
Material addition points for liquids and solids 1001
1002
Each process step used for drug substance and drug product manufacturing 1003
1004
Process design for the interface between the drug substance and drug product 1005
1006
Sampling locations for all in-line/at-line/offline measurements, including PAT (shown by 1007
T1–T5) 1008
1009
All diversion points (shown by D1–D4) 1010
1011
In this example, chemical reaction using flow reactors, continuous crystallisation and crossflow 1012
filtration are used to obtain the drug substance as a highly concentrated crystal slurry. The selection 1013
of a wet granulation process for the manufacture of tablet drug products permits the drug substance 1014
and drug product processes to be integrated through the continuous filtration line. The concentrated 1015
crystal slurry functions as both the drug substance source and the granulation fluid. No surge lines 1016
or tanks are used. 1017
1018
Other process schemes—including, for example, different purification methods, surge tanks, mix 1019
of batch and continuous unit operations—could also be used in the design of an integrated process. 1020
If the process design does not involve isolation of crystals, then details should be provided on how 1021
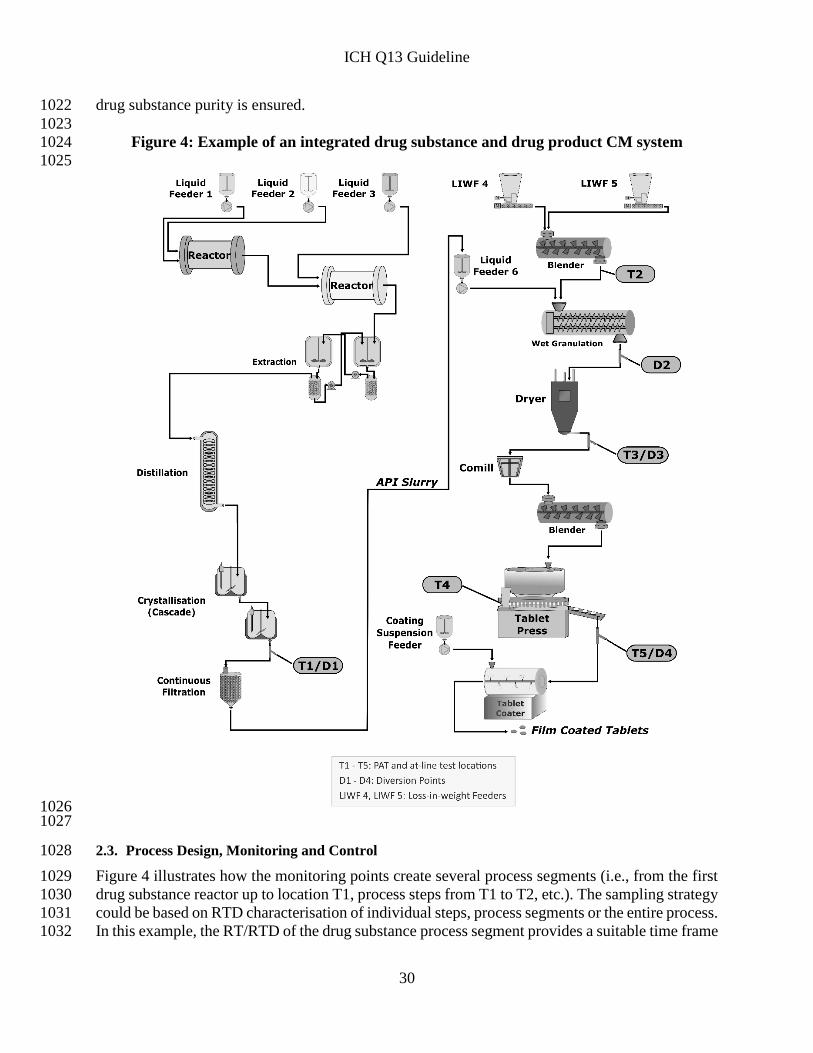
ICH Q13 Guideline
30
drug substance purity is ensured. 1022
1023
Figure 4: Example of an integrated drug substance and drug product CM system 1024
1025
1026 1027
2.3. Process Design, Monitoring and Control 1028
Figure 4 illustrates how the monitoring points create several process segments (i.e., from the first 1029
drug substance reactor up to location T1, process steps from T1 to T2, etc.). The sampling strategy 1030
could be based on RTD characterisation of individual steps, process segments or the entire process. 1031
In this example, the RT/RTD of the drug substance process segment provides a suitable time frame 1032
ICH Q13 Guideline
31
to monitor drug substance quality in real time, considering an appropriate sampling frequency, test 1033
method, time needed for measurement, and instrument capability. Location T1/D1 is used for 1034
sampling drug substance for offline testing or for diversion of drug substance, as necessary. 1035
Diversion of material impacts mass flow and may require a compensation strategy in the 1036
downstream operations considering the RTD. 1037
1038
Allowable variations (including minor disturbances) identified through DOE or other suitable 1039
studies are incorporated into the process control strategy. For example, the process parameter 1040
ranges for material additions and reactors, as well as the magnitude and duration of an allowable 1041
disturbance, could be based on the variations shown to be within the purification capability of the 1042
crystallisation step, so there would be no adverse impact on the drug substance purity and impurity 1043
profile. An additional risk-based safety margin is included in the established thresholds to ensure 1044
all non-conforming material is diverted. Variations outside these thresholds result in material 1045
diversion using a suitable method for material traceability (e.g., RTD model). 1046
1047
Ongoing assessment of equipment performance helps predict and prevent potential problems and 1048
ensures the ability of a CM process to operate as intended over time. Two such examples are: (1) 1049
during continuous filtration, monitoring filter back pressure to evaluate filter saturation (maximum 1050
pressure) and prevent filter failure; and (2) during material feeding using LIWFs, monitoring the 1051
feeder screw speed in relation to its maximum capacity to inform low feeder fill-level. Monitoring 1052
of equipment performance could be used to support how process control will be ensured, especially 1053
during long run times. 1054
2.4. Start-up and Shutdown 1055
Individual unit operations of an integrated drug substance and drug product process could achieve 1056
its desired operating conditions at different times due to differences in the type of transformation 1057
(e.g., chemical versus physical transformation) and the RT in the equipment. When such 1058
differences occur, careful planning of start-up and shutdown sequences enables faster product 1059
collection and reduces waste. 1060
2.5. RTD Characterisation for System Dynamics and Material Traceability 1061
Refer to the main guideline for RTD characterisation. An integrated process may use different 1062
approaches or tracers to characterise various process segments considering aspects such as liquid 1063
and solid flow streams. 1064
3. SPECIFICATION AND BATCH DATA 1065
3.1. Drug Substance Specification 1066
Even though the drug substance is not isolated in an integrated drug substance and drug product 1067
process, a drug substance specification should be defined and justified in accordance with ICH 1068
Q6A and other relevant ICH guidelines. Institution of a drug substance specification defines the 1069
quality of the drug substance, as well as facilitates the management of lifecycle activities (e.g., 1070
facility changes), investigation of adverse events and product recalls, and development of 1071
pharmacopeial monographs. 1072
1073
ICH Q13 Guideline
32
Although a drug substance specification is instituted, drug substance testing may not be required 1074
on a routine basis when the integrated process is appropriately controlled. A set of process 1075
performance criteria can be defined such that the drug substance could be considered “conforms 1076
to specification, if tested” when those process performance criteria are met. To ensure there is a 1077
comprehensive monitoring of the quality of the drug substance during the lifecycle of the product, 1078
conformance to the drug substance specification should be verified on a periodic and event-driven 1079
basis by testing the purified drug substance at an appropriate location using a relevant sampling 1080
plan. The frequency of the periodic verification should be defined and justified. Drug substance 1081
periodic verification can be based on the frequency of drug product production and time. Event-1082
based verifications could be triggered by a change in supplier, starting material, synthesis 1083
conditions, or other factors considering risk. Refer to ICH Q6A for additional details on periodic 1084
testing. 1085
1086
Appropriate sampling locations should be incorporated into the process design to enable testing of 1087
the drug substance (e.g., location T1 in Figure 4). Any modifications made to the sample to enable 1088
the test (e.g., drying of the crystal slurry for testing crystalline form) may be incorporated into the 1089
test methodology. Sampling locations should be identified in the drug substance specification. 1090
1091
Although the drug substance is not isolated, a discussion of the origin and fate of potential 1092
impurities (e.g., related substances, residual solvents, catalysts), robustness of impurity clearance, 1093
and impurity carryover from the drug substance into the drug product should be provided in the 1094
dossier. The control of impurities formation and clearance should be integrated into the overall 1095
control strategy. 1096
3.2. Drug Product Specification 1097
In integrated processes, attributes typically associated with the drug substance quality are generally 1098
included in the drug product specification unless justified per ICH Q6A. Therefore, the drug 1099
product specification in an integrated process is more extensive than that of a batch process and 1100
may include drug substance related substances, residual solvents (used in drug substance 1101
synthesis), elemental impurities, etc., when appropriate. The specified impurities in the drug 1102
product specification may differ from the specified impurities in the drug substance specification 1103
(e.g., mutagenic impurity). 1104
1105
Sampling location should be appropriately identified in the drug product specification table, as 1106
some testing (e.g., testing for drug substance periodic verification as described above) may need 1107
to be performed following the drug substance purification step (before drug product formation). 1108
1109
An example of a drug substance and drug product testing approach for an integrated process is 1110
shown in Table 4. The test attributes listed are considered relevant for this example. The specific 1111
details of each integrated process should be considered in the selection of the appropriate test 1112
attributes and testing plan. 1113
1114
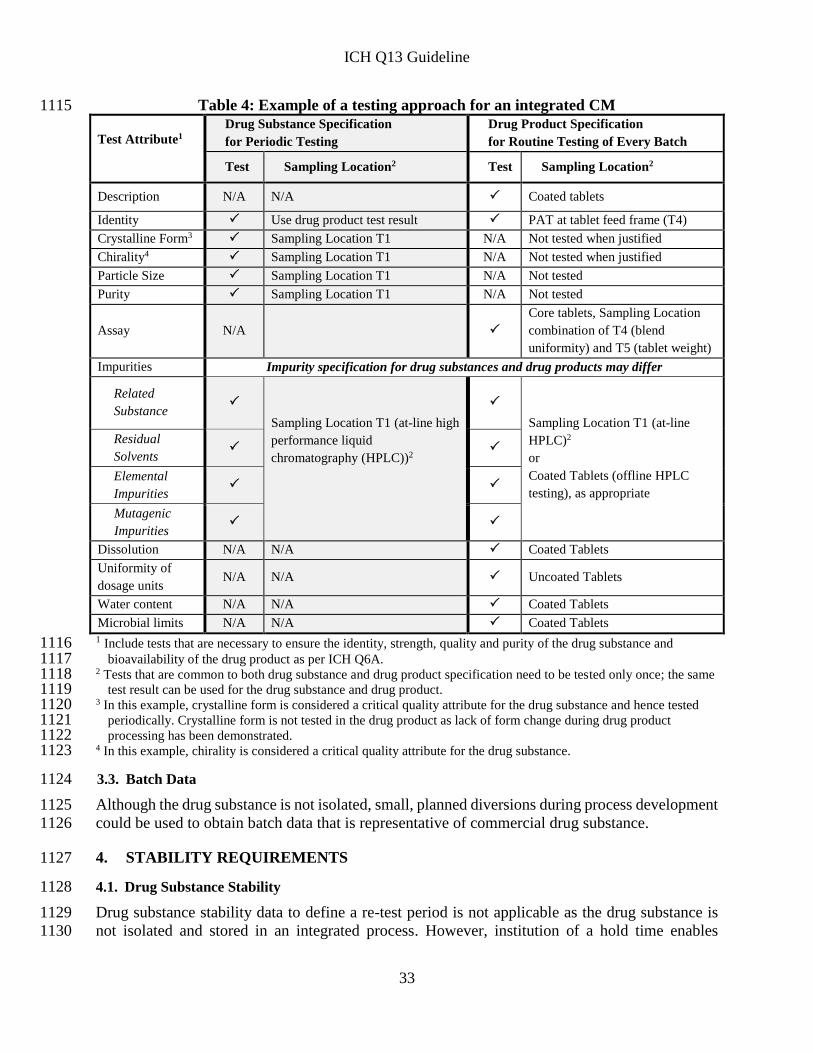
ICH Q13 Guideline
33
Table 4: Example of a testing approach for an integrated CM 1115
Test Attribute1
Drug Substance Specification
for Periodic Testing
Drug Product Specification
for Routine Testing of Every Batch
Test Sampling Location2 Test Sampling Location2
Description N/A N/A Coated tablets
Identity Use drug product test result PAT at tablet feed frame (T4)
Crystalline Form3 Sampling Location T1 N/A Not tested when justified
Chirality4 Sampling Location T1 N/A Not tested when justified
Particle Size Sampling Location T1 N/A Not tested
Purity Sampling Location T1 N/A Not tested
Assay N/A
Core tablets, Sampling Location
combination of T4 (blend
uniformity) and T5 (tablet weight)
Impurities Impurity specification for drug substances and drug products may differ
Related
Substance
Sampling Location T1 (at-line high
performance liquid
chromatography (HPLC))2
Sampling Location T1 (at-line
HPLC)2
or
Coated Tablets (offline HPLC
testing), as appropriate
Residual
Solvents
Elemental
Impurities
Mutagenic
Impurities
Dissolution N/A N/A Coated Tablets
Uniformity of
dosage units N/A N/A Uncoated Tablets
Water content N/A N/A Coated Tablets
Microbial limits N/A N/A Coated Tablets
1 Include tests that are necessary to ensure the identity, strength, quality and purity of the drug substance and 1116 bioavailability of the drug product as per ICH Q6A. 1117
2 Tests that are common to both drug substance and drug product specification need to be tested only once; the same 1118 test result can be used for the drug substance and drug product. 1119
3 In this example, crystalline form is considered a critical quality attribute for the drug substance and hence tested 1120 periodically. Crystalline form is not tested in the drug product as lack of form change during drug product 1121 processing has been demonstrated. 1122
4 In this example, chirality is considered a critical quality attribute for the drug substance. 1123
3.3. Batch Data 1124
Although the drug substance is not isolated, small, planned diversions during process development 1125
could be used to obtain batch data that is representative of commercial drug substance. 1126
4. STABILITY REQUIREMENTS 1127
4.1. Drug Substance Stability 1128
Drug substance stability data to define a re-test period is not applicable as the drug substance is 1129
not isolated and stored in an integrated process. However, institution of a hold time enables 1130
ICH Q13 Guideline
34
temporary storage of drug substance during an interruption in production. In the absence of data 1131
to support a hold time, drug substance formed during a process interruption should be discarded. 1132
Drug substance stability data may be appropriate for other aspects, such as to support the storage 1133
of in-house reference standards and to gain an understanding of product stability profiles. 1134
4.2. Drug Product Stability 1135
The ICH stability guidelines and Section 4.5 of the main guideline are applicable. 1136
5. LOCATION OF DRUG SUBSTANCE AND DRUG PRODUCT INFORMATION IN 1137
THE CTD 1138
Drug substance and drug product information could be provided in the respective CTD sections 1139
3.2.S and 3.2.P of the dossier as per ICH M4Q. A description of the process step that integrates 1140
the drug substance and drug product could be based on its relevancy to the respective section. For 1141
example, in the process example provided in this annex, the continuous filtration process could be 1142
described in CTD section 3.2.S as it is related to concentration of the drug substance. The 1143
integrated flow diagram can be provided in CTD section 3.2.P and referenced in section 3.2.S. 1144
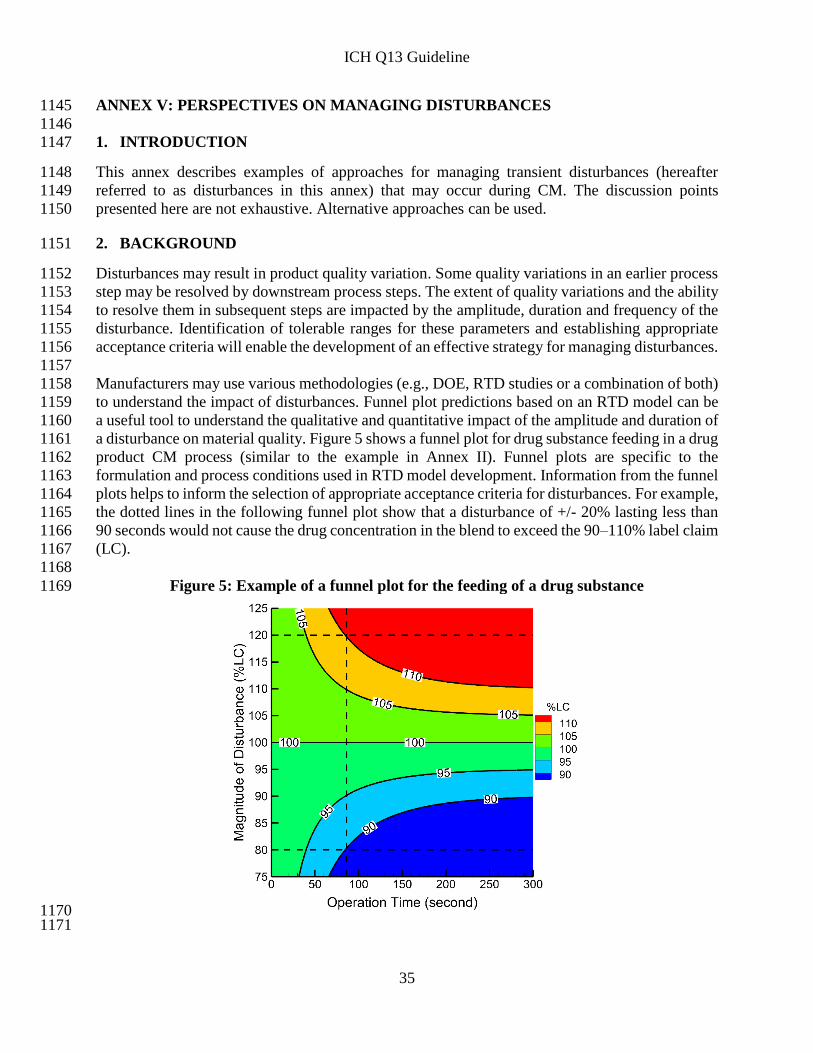
ICH Q13 Guideline
35
ANNEX V: PERSPECTIVES ON MANAGING DISTURBANCES 1145
1146
1. INTRODUCTION 1147
This annex describes examples of approaches for managing transient disturbances (hereafter 1148
referred to as disturbances in this annex) that may occur during CM. The discussion points 1149
presented here are not exhaustive. Alternative approaches can be used. 1150
2. BACKGROUND 1151
Disturbances may result in product quality variation. Some quality variations in an earlier process 1152
step may be resolved by downstream process steps. The extent of quality variations and the ability 1153
to resolve them in subsequent steps are impacted by the amplitude, duration and frequency of the 1154
disturbance. Identification of tolerable ranges for these parameters and establishing appropriate 1155
acceptance criteria will enable the development of an effective strategy for managing disturbances. 1156
1157
Manufacturers may use various methodologies (e.g., DOE, RTD studies or a combination of both) 1158
to understand the impact of disturbances. Funnel plot predictions based on an RTD model can be 1159
a useful tool to understand the qualitative and quantitative impact of the amplitude and duration of 1160
a disturbance on material quality. Figure 5 shows a funnel plot for drug substance feeding in a drug 1161
product CM process (similar to the example in Annex II). Funnel plots are specific to the 1162
formulation and process conditions used in RTD model development. Information from the funnel 1163
plots helps to inform the selection of appropriate acceptance criteria for disturbances. For example, 1164
the dotted lines in the following funnel plot show that a disturbance of +/- 20% lasting less than 1165
90 seconds would not cause the drug concentration in the blend to exceed the 90–110% label claim 1166
(LC). 1167
1168
Figure 5: Example of a funnel plot for the feeding of a drug substance 1169
1170 1171
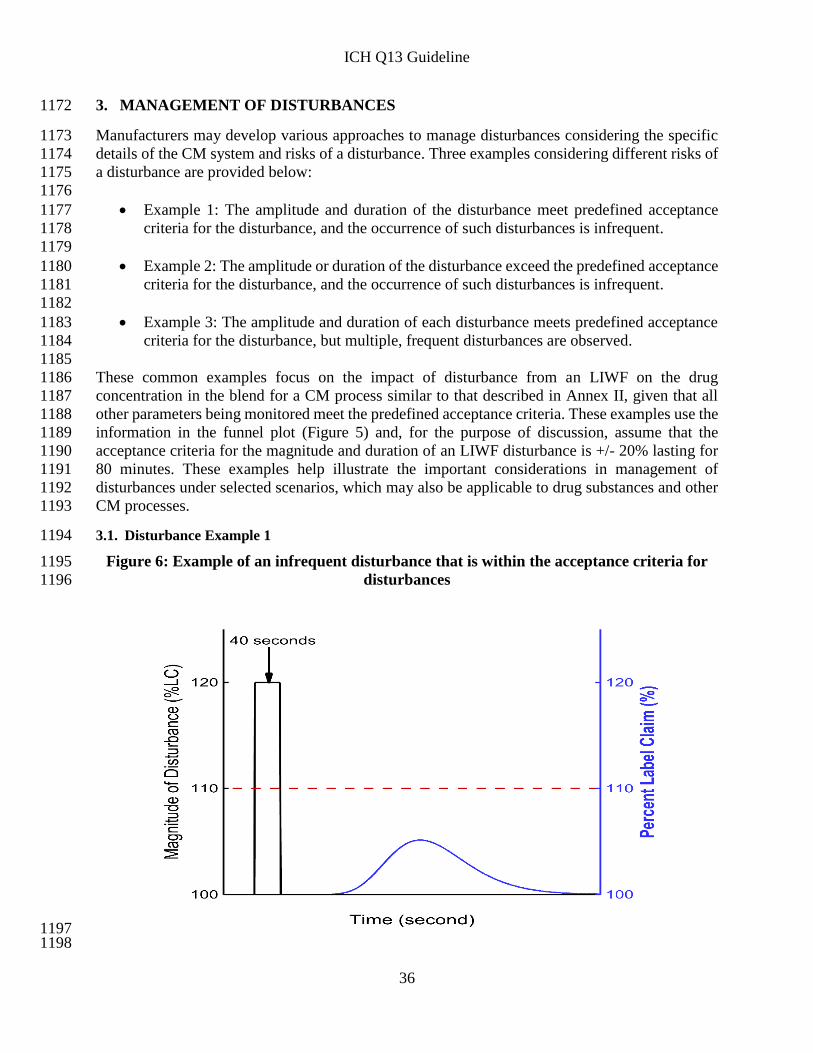
ICH Q13 Guideline
36
3. MANAGEMENT OF DISTURBANCES 1172
Manufacturers may develop various approaches to manage disturbances considering the specific 1173
details of the CM system and risks of a disturbance. Three examples considering different risks of 1174
a disturbance are provided below: 1175
1176
Example 1: The amplitude and duration of the disturbance meet predefined acceptance 1177
criteria for the disturbance, and the occurrence of such disturbances is infrequent. 1178
1179
Example 2: The amplitude or duration of the disturbance exceed the predefined acceptance 1180
criteria for the disturbance, and the occurrence of such disturbances is infrequent. 1181
1182
Example 3: The amplitude and duration of each disturbance meets predefined acceptance 1183
criteria for the disturbance, but multiple, frequent disturbances are observed. 1184
1185
These common examples focus on the impact of disturbance from an LIWF on the drug 1186
concentration in the blend for a CM process similar to that described in Annex II, given that all 1187
other parameters being monitored meet the predefined acceptance criteria. These examples use the 1188
information in the funnel plot (Figure 5) and, for the purpose of discussion, assume that the 1189
acceptance criteria for the magnitude and duration of an LIWF disturbance is +/- 20% lasting for 1190
80 minutes. These examples help illustrate the important considerations in management of 1191
disturbances under selected scenarios, which may also be applicable to drug substances and other 1192
CM processes. 1193
3.1. Disturbance Example 1 1194
Figure 6: Example of an infrequent disturbance that is within the acceptance criteria for 1195
disturbances 1196
1197 1198
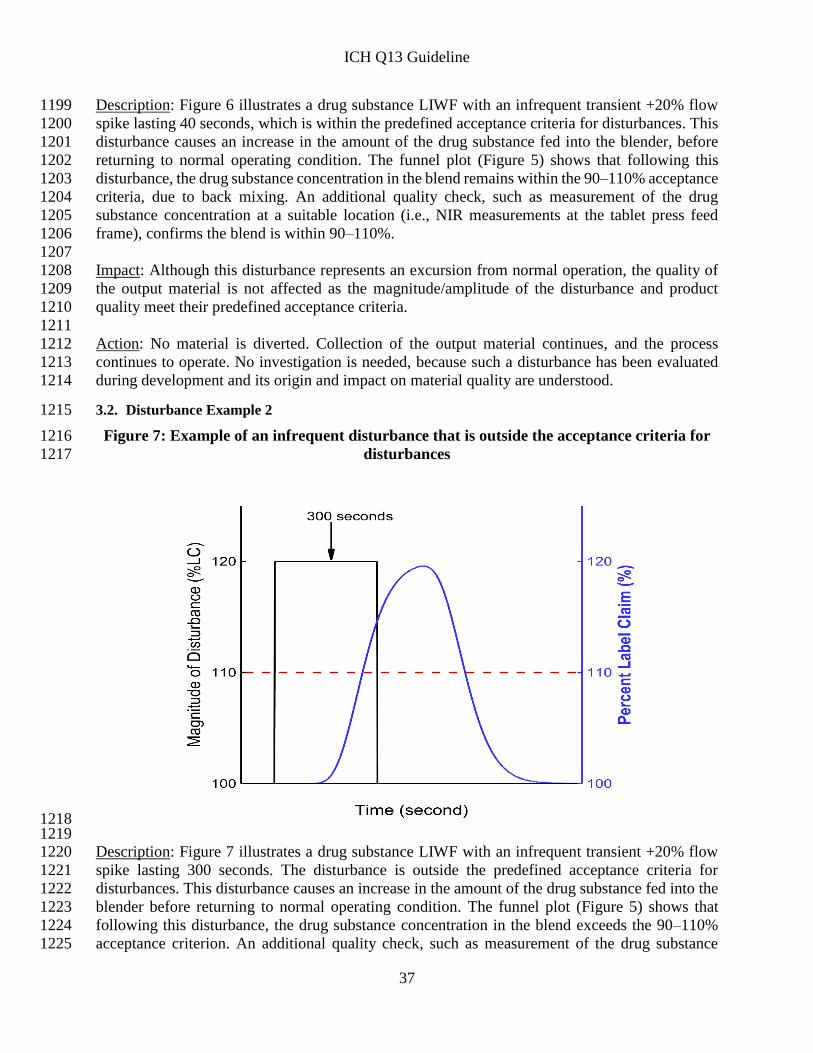
ICH Q13 Guideline
37
Description: Figure 6 illustrates a drug substance LIWF with an infrequent transient +20% flow 1199
spike lasting 40 seconds, which is within the predefined acceptance criteria for disturbances. This 1200
disturbance causes an increase in the amount of the drug substance fed into the blender, before 1201
returning to normal operating condition. The funnel plot (Figure 5) shows that following this 1202
disturbance, the drug substance concentration in the blend remains within the 90–110% acceptance 1203
criteria, due to back mixing. An additional quality check, such as measurement of the drug 1204
substance concentration at a suitable location (i.e., NIR measurements at the tablet press feed 1205
frame), confirms the blend is within 90–110%. 1206
1207
Impact: Although this disturbance represents an excursion from normal operation, the quality of 1208
the output material is not affected as the magnitude/amplitude of the disturbance and product 1209
quality meet their predefined acceptance criteria. 1210
1211
Action: No material is diverted. Collection of the output material continues, and the process 1212
continues to operate. No investigation is needed, because such a disturbance has been evaluated 1213
during development and its origin and impact on material quality are understood. 1214
3.2. Disturbance Example 2 1215
Figure 7: Example of an infrequent disturbance that is outside the acceptance criteria for 1216
disturbances 1217
1218 1219 Description: Figure 7 illustrates a drug substance LIWF with an infrequent transient +20% flow 1220
spike lasting 300 seconds. The disturbance is outside the predefined acceptance criteria for 1221
disturbances. This disturbance causes an increase in the amount of the drug substance fed into the 1222
blender before returning to normal operating condition. The funnel plot (Figure 5) shows that 1223
following this disturbance, the drug substance concentration in the blend exceeds the 90–110% 1224
acceptance criterion. An additional quality check, such as measurement of the drug substance 1225
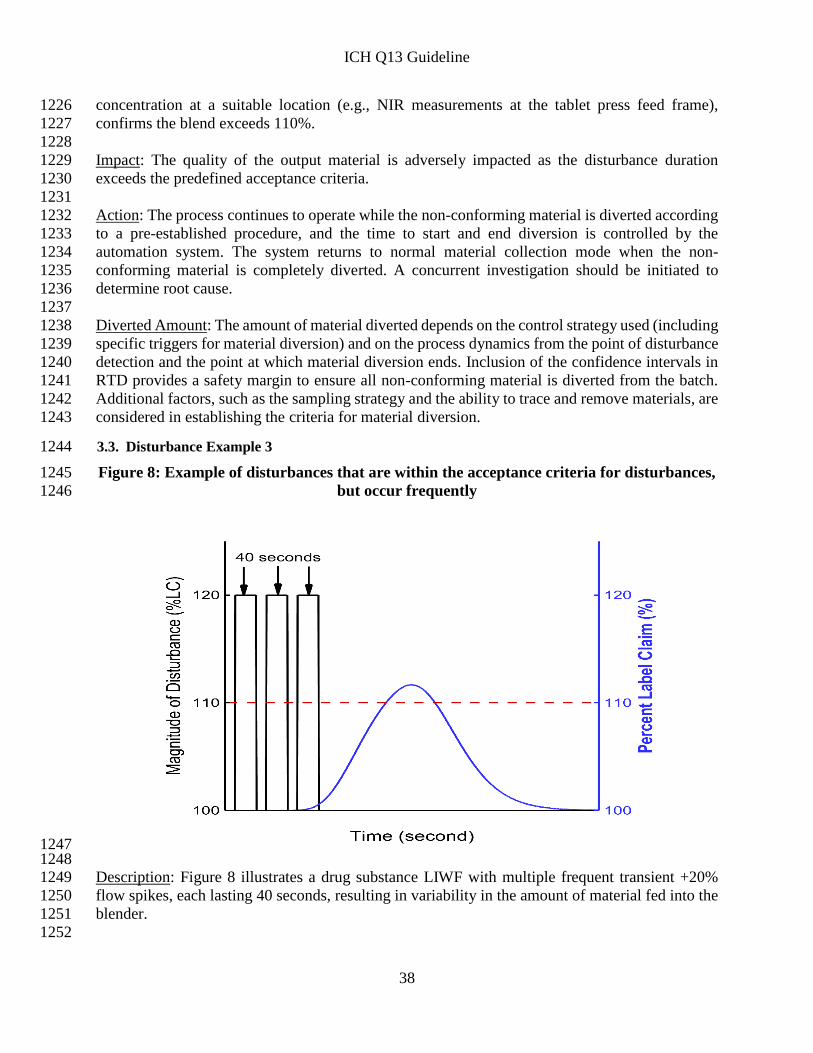
ICH Q13 Guideline
38
concentration at a suitable location (e.g., NIR measurements at the tablet press feed frame), 1226
confirms the blend exceeds 110%. 1227
1228
Impact: The quality of the output material is adversely impacted as the disturbance duration 1229
exceeds the predefined acceptance criteria. 1230
1231
Action: The process continues to operate while the non-conforming material is diverted according 1232
to a pre-established procedure, and the time to start and end diversion is controlled by the 1233
automation system. The system returns to normal material collection mode when the non-1234
conforming material is completely diverted. A concurrent investigation should be initiated to 1235
determine root cause. 1236
1237
Diverted Amount: The amount of material diverted depends on the control strategy used (including 1238
specific triggers for material diversion) and on the process dynamics from the point of disturbance 1239
detection and the point at which material diversion ends. Inclusion of the confidence intervals in 1240
RTD provides a safety margin to ensure all non-conforming material is diverted from the batch. 1241
Additional factors, such as the sampling strategy and the ability to trace and remove materials, are 1242
considered in establishing the criteria for material diversion. 1243
3.3. Disturbance Example 3 1244
Figure 8: Example of disturbances that are within the acceptance criteria for disturbances, 1245
but occur frequently 1246
1247 1248 Description: Figure 8 illustrates a drug substance LIWF with multiple frequent transient +20% 1249
flow spikes, each lasting 40 seconds, resulting in variability in the amount of material fed into the 1250
blender. 1251
1252
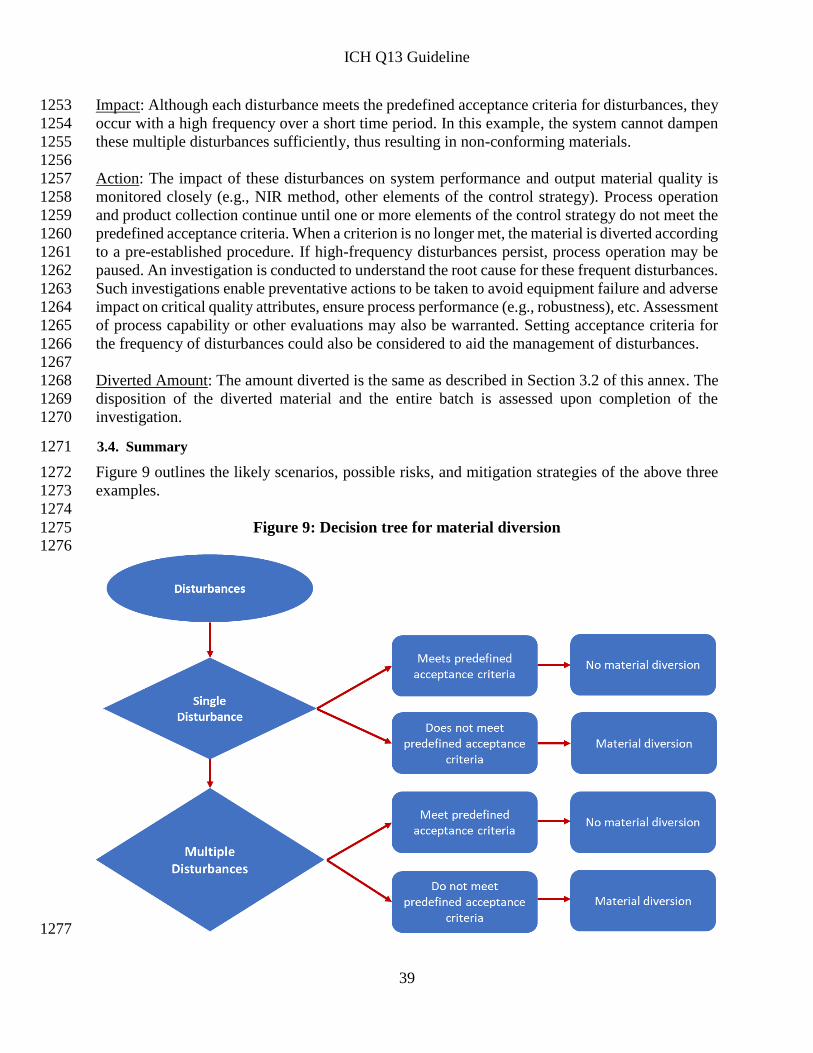
ICH Q13 Guideline
39
Impact: Although each disturbance meets the predefined acceptance criteria for disturbances, they 1253
occur with a high frequency over a short time period. In this example, the system cannot dampen 1254
these multiple disturbances sufficiently, thus resulting in non-conforming materials. 1255
1256
Action: The impact of these disturbances on system performance and output material quality is 1257
monitored closely (e.g., NIR method, other elements of the control strategy). Process operation 1258
and product collection continue until one or more elements of the control strategy do not meet the 1259
predefined acceptance criteria. When a criterion is no longer met, the material is diverted according 1260
to a pre-established procedure. If high-frequency disturbances persist, process operation may be 1261
paused. An investigation is conducted to understand the root cause for these frequent disturbances. 1262
Such investigations enable preventative actions to be taken to avoid equipment failure and adverse 1263
impact on critical quality attributes, ensure process performance (e.g., robustness), etc. Assessment 1264
of process capability or other evaluations may also be warranted. Setting acceptance criteria for 1265
the frequency of disturbances could also be considered to aid the management of disturbances. 1266
1267
Diverted Amount: The amount diverted is the same as described in Section 3.2 of this annex. The 1268
disposition of the diverted material and the entire batch is assessed upon completion of the 1269
investigation. 1270
3.4. Summary 1271
Figure 9 outlines the likely scenarios, possible risks, and mitigation strategies of the above three 1272
examples. 1273
1274
Figure 9: Decision tree for material diversion 1275 1276
1277