Embed Size (px)
Citation preview

FS 4D – Landslide and Subsidence Monitoring II Steven Garlinge Continuous Monitoring of Longwall Undermining FIG Congress 2010 Facing the Challenges – Building the Capacity Sydney, Australia, 11-16 April 2010
1/12
Continuous Monitoring of Longwall Undermining
Steven GARLINGE, Australia
Key words: monitoring, real-time, longwall, sensors, web-based, rail SUMMARY Lynton Surveys was appointed to install, commission and manage a suitable deformation monitoring system during longwall underming of a railway. The system incorporates multiple sensor types, web-based technologies and custom hardware to form a complete system for collection and presentation of real-time monitoring data. The importance of collecting this data is two-fold. Firstly, collection of data on the effects of mining related subsidence on railways is critical to the management of future undermining exercises. Secondly, rapid, reliable data collection is essential to maintaining the safety and operational standards of the rail loop during undermining.

FS 4D – Landslide and Subsidence Monitoring II Steven Garlinge Continuous Monitoring of Longwall Undermining FIG Congress 2010 Facing the Challenges – Building the Capacity Sydney, Australia, 11-16 April 2010
2/12
Continuous Monitoring of Longwall Undermining
Steven GARLINGE, Australia
1. INTRODUCTION Another cycle of longwall undermining beneath the Mt Owen Mine Rail Loop, NSW, Australia was completed in September 2009. This signifies the end of the first phase of managing this process in which there is a broad objective of “understanding the influence of longwall mining subsidence to rail, in particular its ability to impart stress and geometric change to the structure”. To facilitate this, Lynton Surveys was appointed to install, commission and manage a suitable deformation monitoring system. The system incorporates multiple sensor types, web-based technologies and custom hardware to form a complete system for collection and presentation of real-time monitoring data. The importance of collecting this data is two-fold. Firstly, collection of data on the effects of mining related subsidence on railways is critical to the management of future undermining exercises. The management process developed for undermining is cyclical in nature, with information gathered in one cycle being used to refine the prediction and management processes of the next. Secondly, rapid, reliable data collection is essential to maintaining the safety and operational standards of the rail loop during undermining. Methods for data collection, data processing, data presentation, resource scheduling and survey traversing are very important, are being continuously refined during this project. Early on, during the Risk Assessment phase, Lynton Surveys were also involved with the re-interpretation of subsidence modelling data into a form which was more relevant to stakeholders in the process who were not normally familiar with such activities. Ground subsidence models in the area of the rail loop were interpreted in terms of track geometry parameters, which were more easily digested and understood by the rail stakeholders. This paper summarises the techniques, solutions and challenges faced during this project. Particular attention is paid to illustrating the importance of spatial data, and spatial data professionals in projects such as this. 2. LONGWALL MINING AND ITS EFFECTS
2.1 Longwall Mining Longwall mining is the process of extracting underground coal seams (typically 2 to 3m in height) in a systematic, mechanised manner. Mining commences by the establishment of parallel ‘gate roads’ – separated by the width of a panel (250 – 400m), and of varying length, typically > 1km long. The extraction phase involves excavation of the longwall panel, by

FS 4D – Landslide and Subsidence Monitoring II Steven Garlinge Continuous Monitoring of Longwall Undermining FIG Congress 2010 Facing the Challenges – Building the Capacity Sydney, Australia, 11-16 April 2010
3/12
retreating the longwall hardware (consisting of roof supports and excavation equipment) back towards the source of the gate end roads. The area behind the retreating machinery is called the goaf, and it collapses steadily as mining advances. It is this controlled collapse which causes subsidence. 2.2 Effects of Longwall Mining
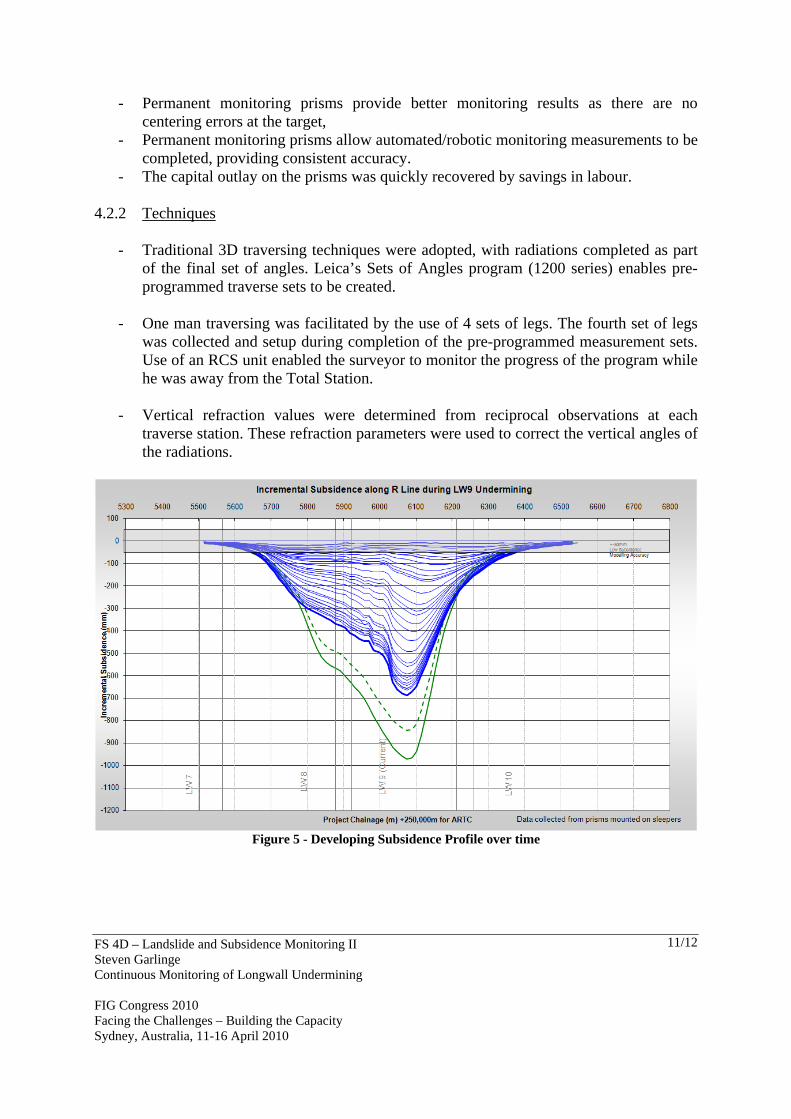
2.2.1 General In this instance, 300m wide panels, excavated at a depth of approximately 300m create a subsidence bowl of approximately 1km width for the entire length of the longwall, with a maximum subsidence of 900mm. Typically three measures are used to quantify the effects of Longwall Mining:
- Subsidence: The amount by which the ground is lower than the pre-mining state, - Ground Strain: The change in length of the ground between adjacent survey marks,
relative to the original length of the line, - Tilt (Curvature): The change in shape of the vertical profile. Comparison of adjacent
tilts allows interpretation of Curvatures. 2.2.2 Effect on Railways The effects of longwall mining have the ability to have an influence on structures. In this project the longwall passes beneath a rail loop which services a nearby mine. All railways are subject to strict maintenance criteria. In general terms railway ‘condition’ is defined by geometric properties and structural properties. Geometric properties define the shape and nature of the rail running surface, and are summarised by the following measures:
- Superelevation: Height difference between two rails at the same location - synonymous with superelevation on roads,
- Twist: Both long (14m baseline) and short twist (2m baseline) parameters are considered. In each instance twist relates to the rate of change of superelevation along the railway,
- Line: The horizontal curvature of a section of track, defined by an arc to chord measurement in the horizontal plane over a 8m baseline,
- Top: The vertical curvature of a section of track, defined by an arc to chord measurement in the vertical plane over a 4m baseline.
Structural properties of a railway are many and varied, however the most applicable here are those related to rail stress. Under normal conditions, rail is tied to the sleepers using ‘resilient’ fastenings. Rail is constrained and movement of the rail is minimised. During the normal temperature cycle of each day the rail attempts to expand and contract. The inability of the rail to do so creates stress. The highs and lows of stress accumulation are balanced by setting the rail’s ‘Stress Free Temperature’ (SFT) (temperature at which there is no stress in the rail) to a

FS 4D – Landslide and Subsidence Monitoring II Steven Garlinge Continuous Monitoring of Longwall Undermining FIG Congress 2010 Facing the Challenges – Building the Capacity Sydney, Australia, 11-16 April 2010
4/12
mid-range temperature value for the geographic area in which the track is located. In this instance the SFT of the rail is set at 35ºC. On a hot day (40ºC air temperature) the track can reach temperatures of 68ºC. At high temperatures like this, a 1km section of unconstrained rail would expand to be ~360mm longer. As the rail is constrained, significant compressive forces are developed in the rail instead. If unmanaged, excessive buildup of compressive forces outside the design limits of the structure can cause rail buckling. 2.2.3 Summary
- Subsidence and Tilt caused by longwall mining has the ability to change the geometric properties of the railway.
- Ground strain developed by longwall mining has the ability to change the SFT of the
railway to the point where daily temperature cycles could affect the stability of the structure.
3. PROJECT OBJECTIVES Many project objectives were established – many requiring Spatial and Structural data to be collected and presented in clear and innovative ways. 3.1 Safe Passage of Trains/Minimal Interruptions to Service It was critical that the monitoring system collected and analysed appropriate information to ensure safe passage of trains. Additionally, minimal interruptions to services ensured that longwall undermining did not affect the operations of the mines involved. Safe passage was provided by monitoring in real-time the stress contained within the rail. Trigger values were set which provided multiple levels of protection before the status of the track reached critical levels. In critical circumstances the capability existed to stop trains running on the rail loop should the track not be of suitable condition. Predictive tools were developed to allow maintenance staff to program track maintenance/adjustment to suit the activities of the mine. 3.2 Model Validation During Undermining Justification of the ability to undermine the railway was based upon sophisticated subsidence modelling. For stakeholders to be confident that mining was proceeding in a manner consistent with the modelling it was necessary to collect information to this end. Section 2.2.1 outlines three key effects of longwall mining. By monitoring and assessing these effects it is possible to compare modelled vs. actual data. Subsidence modelling is performed by understanding the movement of a finite number of points along the railway as mining

FS 4D – Landslide and Subsidence Monitoring II Steven Garlinge Continuous Monitoring of Longwall Undermining FIG Congress 2010 Facing the Challenges – Building the Capacity Sydney, Australia, 11-16 April 2010
5/12
progresses underneath. Monitoring pegs are placed in suitable locations and observations are made which allow Subsidence, Ground Strain and Tilt (Curvature) to be measured. 3.3 Collection of Appropriate Data for Feedback into Modelling for Subsequent
Longwalls In addition to Section 3.2, monitoring data is used to feedback into the modelling for subsequent longwalls. 3.4 Rate of Transfer of Ground Stress through Ballast A crucial objective to this project was the determination of the rate at which ground strain is transferred through the ballast to the rail. The hypothesis suggested that if some percentage of the total ground strain was lost through the ballast then this would represent a reduction in the modelled effect of subsidence on the rail. By observing a reduction in the effects of ground strain on the rail it would be possible to consider reducing the size and scope of the monitoring system. To this end a set of ground strain monitoring points was placed as close as possible to the rail formation, but in the natural ground surface. Another array of monitoring points was placed at sleeper level of the rail formation. The Stress sensors (whose results can be easily converted to Strain) measured the total strain imparted to the rail. By comparing the Ground, Sleeper and Rail strain it was possible to determine the magnitude of the loss and categorise where the loss was found. Data from the previous two longwalls shows that 100% of ground strain is transferred to the rail through the ballast. 4. MEASURING THE EFFECTS OF LONGWALL MINING A Safety Management Plan (SMP) was created to ensure the safe, continuous operation of the railway during undermining. A significant number of tasks, roles and requirements were generated, but we will focus only on those with application to this paper. 4.1 Real-Time Monitoring System
The most significant undertaking of this project was the development and installation of a real-time structural monitoring system. The system comprises of a number of sensor types, communications, alarming systems and data interpretation mechanisms. 4.1.1 Stress Sensors Rail stress is measured by the installation of Vibrating Wire Stress gauges. These gauges are placed in the web of the rail along the neutral axis. Placement of the sensor on the neutral axis

FS 4D – Landslide and Subsidence Monitoring II Steven Garlinge Continuous Monitoring of Longwall Undermining FIG Congress 2010 Facing the Challenges – Building the Capacity Sydney, Australia, 11-16 April 2010
6/12
ensures that the device measures only longitudinal forces, and not bending or shearing forces which are far less relevant to track stability. Figure 1 illustrates the placement of the Stress Sensors on the track (A section of unconstrained ‘reference rail’ is also shown in Figure 1). Such sensors are able to detect the stress associated with changes in length of 1mm over 1km. Sensors are installed every 50m along each rail, with the sensors on adjacent rails staggered by 25m.
Figure 1 - Stress Sensors
4.1.2 Temperature Sensors Rail temperature is measured by the installation of thermistor-based temperature lugs. These sensors are placed in the web of the rail along the neutral axis. Figure 2 illustrates the placement of the Temperature sensors on the rail. Inclusion of temperature sensing is important for the understanding of the stress in the rail. By knowing the temperature we are able to remove the temperature induced stresses from the raw data, leaving only mining induced stresses.

FS 4D – Landslide and Subsidence Monitoring II Steven Garlinge Continuous Monitoring of Longwall Undermining FIG Congress 2010 Facing the Challenges – Building the Capacity Sydney, Australia, 11-16 April 2010
7/12
Figure 2 - Temperature Lugs
4.1.3 Superelevation Sensors During the risk assessment phase it was determined that the greatest risk to the railway geometry arose from changes in superelevation along the railway. The expected magnitudes of Superelevation were modelled to a maximum of 5mm/m – well below the operational limits of the railway. Superelevation sensors (tilt sensors) were integrated into each sensor node. Attachment of the sensor node to sleepers provided direct measurement of the tilt of the railway while mining progressed. 4.1.4 Sensing Hardware By placing the temperature sensors between each stress sensor an arrangement was created where a sensor of some type was found every 13m along the railway (80 locations in total). A ‘sensor node’ was installed at each location to enable measurements to be collected and transmitted. The sensor node provided a digital interface to the analogue sensor (either vibrating wire, or thermistor) at each location.

FS 4D – Landslide and Subsidence Monitoring II Steven Garlinge Continuous Monitoring of Longwall Undermining FIG Congress 2010 Facing the Challenges – Building the Capacity Sydney, Australia, 11-16 April 2010
8/12
The sensor nodes are connected up in a single ‘bus’ comprising of many 13m segments. Each sensor node is uniquely addressable by the monitoring computer. Figure 3 illustrates the typical arrangement of sensor node, bus and sensors along the railway.
Figure 3 - Sensor installation along railway
4.1.5 Communications and Control The complete real-time monitoring system comprises of several communications and control systems. Broadly, the system comprises of:

FS 4D – Landslide and Subsidence Monitoring II Steven Garlinge Continuous Monitoring of Longwall Undermining FIG Congress 2010 Facing the Challenges – Building the Capacity Sydney, Australia, 11-16 April 2010
9/12
- Main PC: Contains custom program for collection, processing and forwarding of data to web-site. Monitors system health, including power, temperature and connectivity.
- NextG Communications: IP Modem connection allowing remote IP control of system at better than ADSL speeds,
- Solar Power system: 2000W solar power system for provision of power to central PC, communications devices, security cameras, sensors and auxiliary systems.
4.1.6 Notification Systems On site, monitoring data is collected every 5 minutes. Monitoring data can be collected as frequently as every 20 seconds if required. At completion of a single epoch, measurements are processed and compared to trigger values. A detailed set of criteria were developed to manage any risks. Exceedances of triggers resulted in SMS messages being sent to appropriate stakeholder groups. 4.1.7 Web Based Data During monitoring it was essential for project stakeholders to be able to obtain near real-time monitoring data over the Internet as required. Stakeholders were able to log in and view data and reports at their leisure. More crucially, the web-based data system allowed groups to access up to the minute data when trigger values were exceeded. The Web-Based Data system comprises of an Apache web server, PHP site and MS SQL database. Over 250 measurements are added to the database every 5 minutes from this one project alone, equating to approximately 1 million measurements every two weeks! Figure 5 shows the Web Based Data system interface. The interface comprises of a cascading navigation menu on the left, where users can quickly navigate to relevant charts. Data is arranged in clusters as the project requires i.e. by sensor type, location or relevance. Sensors can feature in multiple locations as required. Graphs are viewed in the main panel. Date range selection and data export options are available once a valid sensor has been selected.

FS 4D – Landslide and Subsidence Monitoring II Steven Garlinge Continuous Monitoring of Longwall Undermining FIG Congress 2010 Facing the Challenges – Building the Capacity Sydney, Australia, 11-16 April 2010
10/12
Figure 4 - Web Based Data Access 4.2 Survey Monitoring In addition to Real-time Monitoring, several other monitoring tasks were required, but at frequencies no more regularly than daily - depending on the relative location of the longwall to the railway. Despite being more familiar to our staff, the survey monitoring role presented unique challenges to the surveyors on the project. During Longwall 8 undermining, daily measurements to over 250 monitoring points along 3km of survey lines were required. This required traversing from/to baselines outside the subsidence area. Significant effort was put towards minimising the time and number of resources required for the traversing. 4.2.1 Hardware Leica 1200 Series instruments were used for collection of survey measurements. The robotic measurement capabilities of such instruments were crucial to being able to complete the repetitive work efficiently and accurately. Where possible (approximately 70% of monitoring points) the investment was made into placement of semi-permanent monitoring prisms. This provided several benefits to the project:
FS 4D – Landslide and Subsidence Monitoring II Steven Garlinge Continuous Monitoring of Longwall Undermining FIG Congress 2010 Facing the Challenges – Building the Capacity Sydney, Australia, 11-16 April 2010
11/12
- Permanent monitoring prisms provide better monitoring results as there are no centering errors at the target,
- Permanent monitoring prisms allow automated/robotic monitoring measurements to be completed, providing consistent accuracy.
- The capital outlay on the prisms was quickly recovered by savings in labour. 4.2.2 Techniques
- Traditional 3D traversing techniques were adopted, with radiations completed as part of the final set of angles. Leica’s Sets of Angles program (1200 series) enables pre-programmed traverse sets to be created.
- One man traversing was facilitated by the use of 4 sets of legs. The fourth set of legs
was collected and setup during completion of the pre-programmed measurement sets. Use of an RCS unit enabled the surveyor to monitor the progress of the program while he was away from the Total Station.
- Vertical refraction values were determined from reciprocal observations at each
traverse station. These refraction parameters were used to correct the vertical angles of the radiations.
Figure 5 - Developing Subsidence Profile over time
FS 4D – Landslide and Subsidence Monitoring II Steven Garlinge Continuous Monitoring of Longwall Undermining FIG Congress 2010 Facing the Challenges – Building the Capacity Sydney, Australia, 11-16 April 2010
12/12
5. CONCLUSION This project is illustrative of the diverse (and divergent) roles being undertaken by Spatial Professionals. The ability of Spatial Professionals to collect, store, categorise and report on various data types sets us apart from other engineering disciplines. The techniques and ideas outlined in this paper are applicable to other structures (roads, pipelines etc), in environments containing other sources of deformation. BIOGRAPHICAL NOTES
- Graduated in 2000 from the University of New South Wales with Bachelor of Engineering (Geomatic Engineering) Honours Class 1
- Awarded Young Surveyor of the Year 2003
- 10 year professional career with Lynton Surveys, Australia, with roles as Engineering
Surveyor, Survey Manager, and more recently as Monitoring and Automation Manager where role includes development and implementation of Monitoring and Automation systems for the Engineering and Mining Industry
- Currently studying MBA at Australian Graduate School of Management (AGSM)
CONTACTS Mr. Steven John GARLINGE Lynton Surveys P/L 14/56 O’Riordan St Alexandria AUSTRALIA Tel. + 61 2 8338 8788 Fax + 61 2 8338 8600 Email: [email protected] Web site: www.lyntonsurveys.com.au


![Seismic Monitoring Strategies for Deep Longwall Coal … · Seismic Monitoring Strategies for Deep Longwall Coal ... [2016]. Seismic monitoring strategies for deep longwall coal](https://img.pdfslide.net/doc/110x75/5b40c06e7f8b9a2f138d8854/seismic-monitoring-strategies-for-deep-longwall-coal-seismic-monitoring-strategies.jpg)

![Seismic Monitoring Strategies for Deep Longwall Coal Mines · NIOSH [2016]. Seismic monitoring strategies for deep longwall coal mines. By Swanson P, Boltz MS, and Chambers D. Spokane](https://img.pdfslide.net/doc/110x75/5fd9f6dc1564d80dbc6374bb/seismic-monitoring-strategies-for-deep-longwall-coal-mines-niosh-2016-seismic.jpg)