Embed Size (px)
Citation preview
Continuous monitoring of the high and persistentchlorine activation during the Arctic winter1999/2000 by the GOME instrument on ERS-2
T. Wagner,1 F. Wittrock,2 A. Richter,2 M. Wenig,3
J. P. Burrows,2 and U. Platt1
Received 7 February 2001; revised 16 June 2001; accepted 17 June 2001; published 21 September 2002.
[1] Measurements of OClO total column amounts during the cold Arctic winter 1999/2000 retrieved from observations by the satellite instrument Global Ozone MonitoringExperiment (GOME) are presented. OClO is formed as a minor product of the reactionof BrO 1 ClO and thus serves as an indicator for a stratospheric chlorine activation. As aresult of the good spatial and temporal coverage of GOME, it is possible to follow thetemporal development of the stratospheric chlorine activation during the winter and springon a daily basis. An initial weak chlorine activation was observed during mid November,shortly after stratospheric temperatures were sufficiently low that formation of polarstratospheric clouds resulted. Strong chlorine activation started around 22 December,when PSC formation was possible over a large altitude range. Chlorine activation wassignificant and large until the beginning of March, peaking mid February. In the middle ofMarch the chlorine activation steeply decreased and ended around 20 March, when thepolar vortex broke up. The duration and the magnitude of the chlorine activation in theArctic winter 1999/2000 were higher than during all previous Arctic winters since thelaunch of the GOME instrument in April 1995. INDEX TERMS: 0340 Atmospheric Compositionand Structure: Middle atmosphere-composition and chemistry; 0341 Atmospheric Compostion and Structure:Middle atmosphere-constituent transport and chemistry (3334); 0305 Atmospheric Compostion and Structure:Aerosols and particles (0345, 4801) KEYWORDS: ozone hole, polar stratospheric ozone, satellite observations,GOME, chlorine activation, polar stratospheric clouds
Citation: Wagner T., F. Wittrock, A. Richter, M. Wenig, J. P. Burrows, and U. Platt, Continuous monitoring of the high and persistentchlorine activation during the Arctic winter 1999/2000 by the GOME instrument on ERS-2, J. Geophys. Res., 107(D20), 8267, doi:10.1029/2001JD000466, 2002.
1. Introduction
[2] Solomon et al. [1986] first proposed that activation ofstratospheric inorganic chlorine, namely, the conversion of theozone-inert reservoir species HCl and ClONO2 into ozone-destroying chlorine oxides (ClO, Cl2O2), is responsible for thedramatic ozone destruction observed since the beginning ofthe 1980s over Antarctica during late winter and spring[Farman et al., 1985, see also Chubachi, 1984] (reviews of thehistorical research progress are given by Solomon[1988,1990,1999]). In the cold stratosphere of the polar night,inorganic reservoir species are converted into activated chlo-rine species by heterogeneous reactions, which occur on polarstratospheric clouds (PSCs) formed at the low stratospherictemperatures prevailing during polar night [Solomon et al.,1986; Toon et al., 1986, 1990; Carslaw et al., 1998a, 1998b;Schreiner et al., 1999; Voigt et al., 2000a, 2000b].
[3] One commonly used remote sensing technique for the
monitoring of the stratospheric chlorine activation is the spec-troscopic measurement of OClO [see, e.g., Solomon et al.,1987a; Fiedler et al., 1993; Pommereau and Piquard, 1994; Re-nard et al., 1997; Otten et al., 1998; Frieb et al., 1998; Wagner etal., 1999; Hild et al., 1999; Wittrock et al., 1999; Miller et al.,1999; Hendrick et al., 2000]. The most important stratosphericsource of OClO is the reaction of BrO and ClO. In the sunlitstratosphere, inorganic bromine primarily resides in BrO. BrOconcentrations vary only slightly, and the availability of ClOoften limits the formation of OClO. It has been shown bySchiller and Wahner [1996] that OClO (at SZA , 928) canserve as an indicator for the amount of stratospheric ClO, i.e.,the chlorine activation [see also Solomon et al., 1987a].
[4] In this study we present OClO data derived from spec-tra measured by the Global Ozone Monitoring Experiment(GOME) on board the European research satellite ERS-2,which was launched in April 1995. These data allow to monitorthe stratospheric chlorine activation on a daily basis. This workcomplements the OClO data sets of earlier Arctic and Antarc-tic winters presented in a previous study [Wagner et al., 2001].
2. Instrument and Data Analysis[5] In this section we give a short overview over the instru-
ment and data analysis; more detailed description is foundelsewhere [Wagner et al., 2001; Leue et al., 2001; Richter and
1Institut fur Umweltphysik, University of Heidelberg, Heidelberg,Germany.2Institute of Environmental Physics, University of Bremen, Bremen,Germany.3Goodard Space Flight Center, Greenbelt, Maryland, USA.
Copyright 2002 by the American Geophysical Union.0148-0227/02/2001JD000466$09.00
JOURNAL OF GEOPHYSICAL RESEARCH, VOL. 107, NO. D20, 8267, doi:10.1029/2001JD000466, 2002
SOL 20 - 1
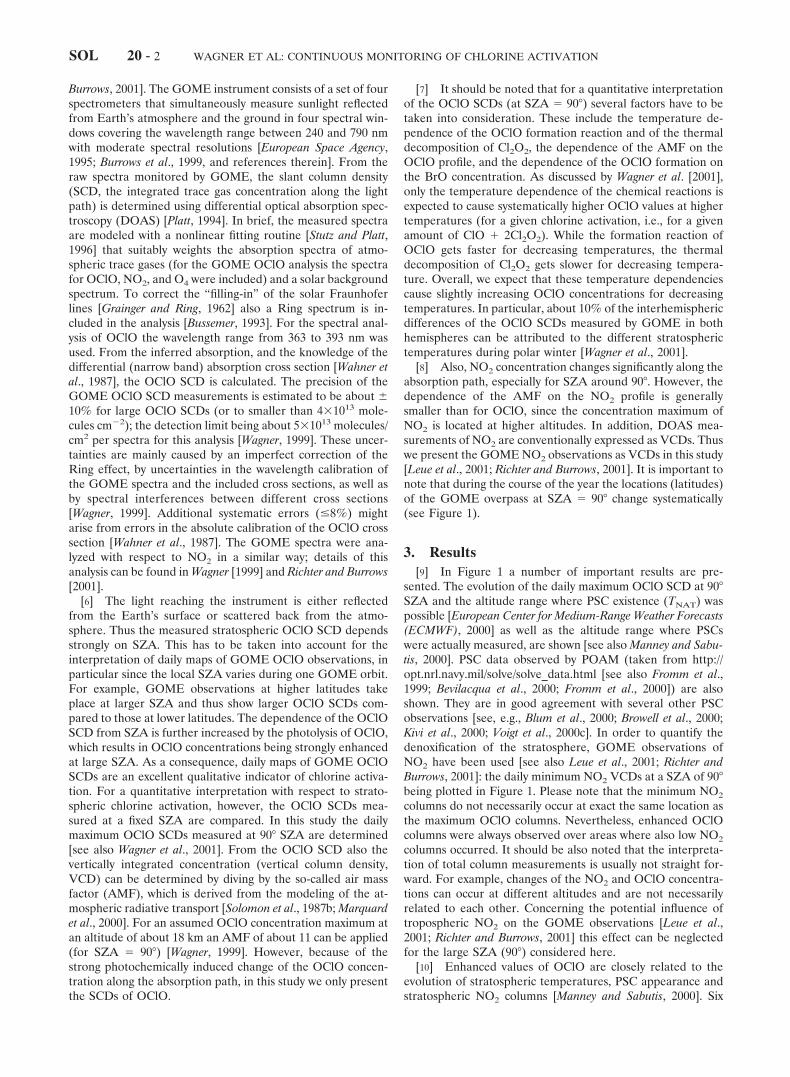
Burrows, 2001]. The GOME instrument consists of a set of fourspectrometers that simultaneously measure sunlight reflectedfrom Earth’s atmosphere and the ground in four spectral win-dows covering the wavelength range between 240 and 790 nmwith moderate spectral resolutions [European Space Agency,1995; Burrows et al., 1999, and references therein]. From theraw spectra monitored by GOME, the slant column density(SCD, the integrated trace gas concentration along the lightpath) is determined using differential optical absorption spec-troscopy (DOAS) [Platt, 1994]. In brief, the measured spectraare modeled with a nonlinear fitting routine [Stutz and Platt,1996] that suitably weights the absorption spectra of atmo-spheric trace gases (for the GOME OClO analysis the spectrafor OClO, NO2, and O4 were included) and a solar backgroundspectrum. To correct the “filling-in” of the solar Fraunhoferlines [Grainger and Ring, 1962] also a Ring spectrum is in-cluded in the analysis [Bussemer, 1993]. For the spectral anal-ysis of OClO the wavelength range from 363 to 393 nm wasused. From the inferred absorption, and the knowledge of thedifferential (narrow band) absorption cross section [Wahner etal., 1987], the OClO SCD is calculated. The precision of theGOME OClO SCD measurements is estimated to be about 610% for large OClO SCDs (or to smaller than 431013 mole-cules cm22); the detection limit being about 531013 molecules/cm2 per spectra for this analysis [Wagner, 1999]. These uncer-tainties are mainly caused by an imperfect correction of theRing effect, by uncertainties in the wavelength calibration ofthe GOME spectra and the included cross sections, as well asby spectral interferences between different cross sections[Wagner, 1999]. Additional systematic errors (#8%) mightarise from errors in the absolute calibration of the OClO crosssection [Wahner et al., 1987]. The GOME spectra were ana-lyzed with respect to NO2 in a similar way; details of thisanalysis can be found in Wagner [1999] and Richter and Burrows[2001].
[6] The light reaching the instrument is either reflectedfrom the Earth’s surface or scattered back from the atmo-sphere. Thus the measured stratospheric OClO SCD dependsstrongly on SZA. This has to be taken into account for theinterpretation of daily maps of GOME OClO observations, inparticular since the local SZA varies during one GOME orbit.For example, GOME observations at higher latitudes takeplace at larger SZA and thus show larger OClO SCDs com-pared to those at lower latitudes. The dependence of the OClOSCD from SZA is further increased by the photolysis of OClO,which results in OClO concentrations being strongly enhancedat large SZA. As a consequence, daily maps of GOME OClOSCDs are an excellent qualitative indicator of chlorine activa-tion. For a quantitative interpretation with respect to strato-spheric chlorine activation, however, the OClO SCDs mea-sured at a fixed SZA are compared. In this study the dailymaximum OClO SCDs measured at 908 SZA are determined[see also Wagner et al., 2001]. From the OClO SCD also thevertically integrated concentration (vertical column density,VCD) can be determined by diving by the so-called air massfactor (AMF), which is derived from the modeling of the at-mospheric radiative transport [Solomon et al., 1987b; Marquardet al., 2000]. For an assumed OClO concentration maximum atan altitude of about 18 km an AMF of about 11 can be applied(for SZA 5 908) [Wagner, 1999]. However, because of thestrong photochemically induced change of the OClO concen-tration along the absorption path, in this study we only presentthe SCDs of OClO.
[7] It should be noted that for a quantitative interpretationof the OClO SCDs (at SZA 5 908) several factors have to betaken into consideration. These include the temperature de-pendence of the OClO formation reaction and of the thermaldecomposition of Cl2O2, the dependence of the AMF on theOClO profile, and the dependence of the OClO formation onthe BrO concentration. As discussed by Wagner et al. [2001],only the temperature dependence of the chemical reactions isexpected to cause systematically higher OClO values at highertemperatures (for a given chlorine activation, i.e., for a givenamount of ClO 1 2Cl2O2). While the formation reaction ofOClO gets faster for decreasing temperatures, the thermaldecomposition of Cl2O2 gets slower for decreasing tempera-ture. Overall, we expect that these temperature dependenciescause slightly increasing OClO concentrations for decreasingtemperatures. In particular, about 10% of the interhemisphericdifferences of the OClO SCDs measured by GOME in bothhemispheres can be attributed to the different stratospherictemperatures during polar winter [Wagner et al., 2001].
[8] Also, NO2 concentration changes significantly along theabsorption path, especially for SZA around 908. However, thedependence of the AMF on the NO2 profile is generallysmaller than for OClO, since the concentration maximum ofNO2 is located at higher altitudes. In addition, DOAS mea-surements of NO2 are conventionally expressed as VCDs. Thuswe present the GOME NO2 observations as VCDs in this study[Leue et al., 2001; Richter and Burrows, 2001]. It is important tonote that during the course of the year the locations (latitudes)of the GOME overpass at SZA 5 908 change systematically(see Figure 1).
3. Results[9] In Figure 1 a number of important results are pre-
sented. The evolution of the daily maximum OClO SCD at 908SZA and the altitude range where PSC existence (TNAT) waspossible [European Center for Medium-Range Weather Forecasts(ECMWF), 2000] as well as the altitude range where PSCswere actually measured, are shown [see also Manney and Sabu-tis, 2000]. PSC data observed by POAM (taken from http://opt.nrl.navy.mil/solve/solve_data.html [see also Fromm et al.,1999; Bevilacqua et al., 2000; Fromm et al., 2000]) are alsoshown. They are in good agreement with several other PSCobservations [see, e.g., Blum et al., 2000; Browell et al., 2000;Kivi et al., 2000; Voigt et al., 2000c]. In order to quantify thedenoxification of the stratosphere, GOME observations ofNO2 have been used [see also Leue et al., 2001; Richter andBurrows, 2001]: the daily minimum NO2 VCDs at a SZA of 908being plotted in Figure 1. Please note that the minimum NO2
columns do not necessarily occur at exact the same location asthe maximum OClO columns. Nevertheless, enhanced OClOcolumns were always observed over areas where also low NO2
columns occurred. It should be also noted that the interpreta-tion of total column measurements is usually not straight for-ward. For example, changes of the NO2 and OClO concentra-tions can occur at different altitudes and are not necessarilyrelated to each other. Concerning the potential influence oftropospheric NO2 on the GOME observations [Leue et al.,2001; Richter and Burrows, 2001] this effect can be neglectedfor the large SZA (908) considered here.
[10] Enhanced values of OClO are closely related to theevolution of stratospheric temperatures, PSC appearance andstratospheric NO2 columns [Manney and Sabutis, 2000]. Six
WAGNER ET AL: CONTINUOUS MONITORING OF CHLORINE ACTIVATIONSOL 20 - 2

Figure 1. Time series during the winter of 1999/2000 of (a) the stratospheric altitudes where PSC existencewas possible, (b) PSC sightings by POAM, (c) the latitude of the GOME observations for SZA 5 908, (d)minimum GOME NO2 VCDs measured at 908 SZA, and (d) maximum GOME OClO SCDs measured at 908SZA. After 10 March GOME observations for SZA 5 908 are possible at two latitude bands.
WAGNER ET AL: CONTINUOUS MONITORING OF CHLORINE ACTIVATION SOL 20 - 3
periods can be characterised and are discussed below. For eachperiod, selected maps of GOME OClO together with thestratospheric temperature and potential vorticity are presented[European Center for Medium-Range Weather Forecasts(ECMWF), 2000].
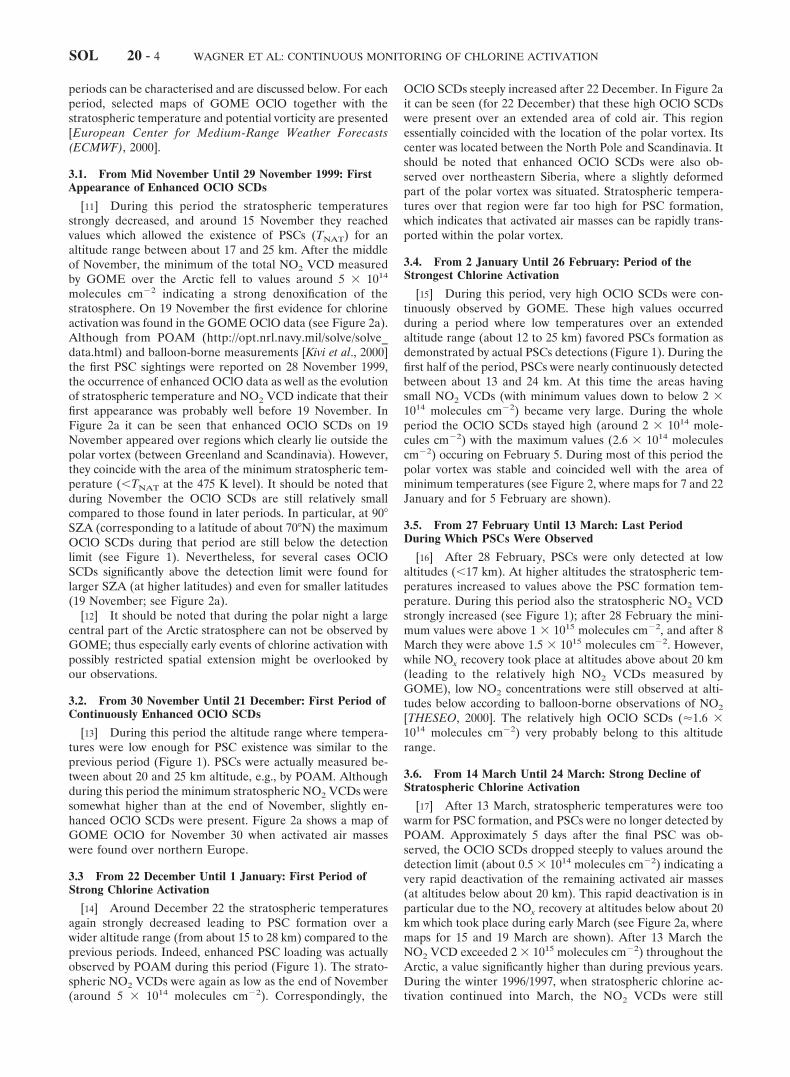
3.1. From Mid November Until 29 November 1999: FirstAppearance of Enhanced OClO SCDs
[11] During this period the stratospheric temperaturesstrongly decreased, and around 15 November they reachedvalues which allowed the existence of PSCs (TNAT) for analtitude range between about 17 and 25 km. After the middleof November, the minimum of the total NO2 VCD measuredby GOME over the Arctic fell to values around 5 3 1014
molecules cm22 indicating a strong denoxification of thestratosphere. On 19 November the first evidence for chlorineactivation was found in the GOME OClO data (see Figure 2a).Although from POAM (http://opt.nrl.navy.mil/solve/solve_data.html) and balloon-borne measurements [Kivi et al., 2000]the first PSC sightings were reported on 28 November 1999,the occurrence of enhanced OClO data as well as the evolutionof stratospheric temperature and NO2 VCD indicate that theirfirst appearance was probably well before 19 November. InFigure 2a it can be seen that enhanced OClO SCDs on 19November appeared over regions which clearly lie outside thepolar vortex (between Greenland and Scandinavia). However,they coincide with the area of the minimum stratospheric tem-perature (,TNAT at the 475 K level). It should be noted thatduring November the OClO SCDs are still relatively smallcompared to those found in later periods. In particular, at 908SZA (corresponding to a latitude of about 708N) the maximumOClO SCDs during that period are still below the detectionlimit (see Figure 1). Nevertheless, for several cases OClOSCDs significantly above the detection limit were found forlarger SZA (at higher latitudes) and even for smaller latitudes(19 November; see Figure 2a).
[12] It should be noted that during the polar night a largecentral part of the Arctic stratosphere can not be observed byGOME; thus especially early events of chlorine activation withpossibly restricted spatial extension might be overlooked byour observations.
3.2. From 30 November Until 21 December: First Period ofContinuously Enhanced OClO SCDs
[13] During this period the altitude range where tempera-tures were low enough for PSC existence was similar to theprevious period (Figure 1). PSCs were actually measured be-tween about 20 and 25 km altitude, e.g., by POAM. Althoughduring this period the minimum stratospheric NO2 VCDs weresomewhat higher than at the end of November, slightly en-hanced OClO SCDs were present. Figure 2a shows a map ofGOME OClO for November 30 when activated air masseswere found over northern Europe.
3.3 From 22 December Until 1 January: First Period ofStrong Chlorine Activation
[14] Around December 22 the stratospheric temperaturesagain strongly decreased leading to PSC formation over awider altitude range (from about 15 to 28 km) compared to theprevious periods. Indeed, enhanced PSC loading was actuallyobserved by POAM during this period (Figure 1). The strato-spheric NO2 VCDs were again as low as the end of November(around 5 3 1014 molecules cm22). Correspondingly, the
OClO SCDs steeply increased after 22 December. In Figure 2ait can be seen (for 22 December) that these high OClO SCDswere present over an extended area of cold air. This regionessentially coincided with the location of the polar vortex. Itscenter was located between the North Pole and Scandinavia. Itshould be noted that enhanced OClO SCDs were also ob-served over northeastern Siberia, where a slightly deformedpart of the polar vortex was situated. Stratospheric tempera-tures over that region were far too high for PSC formation,which indicates that activated air masses can be rapidly trans-ported within the polar vortex.
3.4. From 2 January Until 26 February: Period of theStrongest Chlorine Activation
[15] During this period, very high OClO SCDs were con-tinuously observed by GOME. These high values occurredduring a period where low temperatures over an extendedaltitude range (about 12 to 25 km) favored PSCs formation asdemonstrated by actual PSCs detections (Figure 1). During thefirst half of the period, PSCs were nearly continuously detectedbetween about 13 and 24 km. At this time the areas havingsmall NO2 VCDs (with minimum values down to below 2 31014 molecules cm22) became very large. During the wholeperiod the OClO SCDs stayed high (around 2 3 1014 mole-cules cm22) with the maximum values (2.6 3 1014 moleculescm22) occuring on February 5. During most of this period thepolar vortex was stable and coincided well with the area ofminimum temperatures (see Figure 2, where maps for 7 and 22January and for 5 February are shown).
3.5. From 27 February Until 13 March: Last PeriodDuring Which PSCs Were Observed
[16] After 28 February, PSCs were only detected at lowaltitudes (,17 km). At higher altitudes the stratospheric tem-peratures increased to values above the PSC formation tem-perature. During this period also the stratospheric NO2 VCDstrongly increased (see Figure 1); after 28 February the mini-mum values were above 1 3 1015 molecules cm22, and after 8March they were above 1.5 3 1015 molecules cm22. However,while NOx recovery took place at altitudes above about 20 km(leading to the relatively high NO2 VCDs measured byGOME), low NO2 concentrations were still observed at alti-tudes below according to balloon-borne observations of NO2
[THESEO, 2000]. The relatively high OClO SCDs ('1.6 31014 molecules cm22) very probably belong to this altituderange.
3.6. From 14 March Until 24 March: Strong Decline ofStratospheric Chlorine Activation
[17] After 13 March, stratospheric temperatures were toowarm for PSC formation, and PSCs were no longer detected byPOAM. Approximately 5 days after the final PSC was ob-served, the OClO SCDs dropped steeply to values around thedetection limit (about 0.5 3 1014 molecules cm22) indicating avery rapid deactivation of the remaining activated air masses(at altitudes below about 20 km). This rapid deactivation is inparticular due to the NOx recovery at altitudes below about 20km which took place during early March (see Figure 2a, wheremaps for 15 and 19 March are shown). After 13 March theNO2 VCD exceeded 2 3 1015 molecules cm22) throughout theArctic, a value significantly higher than during previous years.During the winter 1996/1997, when stratospheric chlorine ac-tivation continued into March, the NO2 VCDs were still
WAGNER ET AL: CONTINUOUS MONITORING OF CHLORINE ACTIVATIONSOL 20 - 4
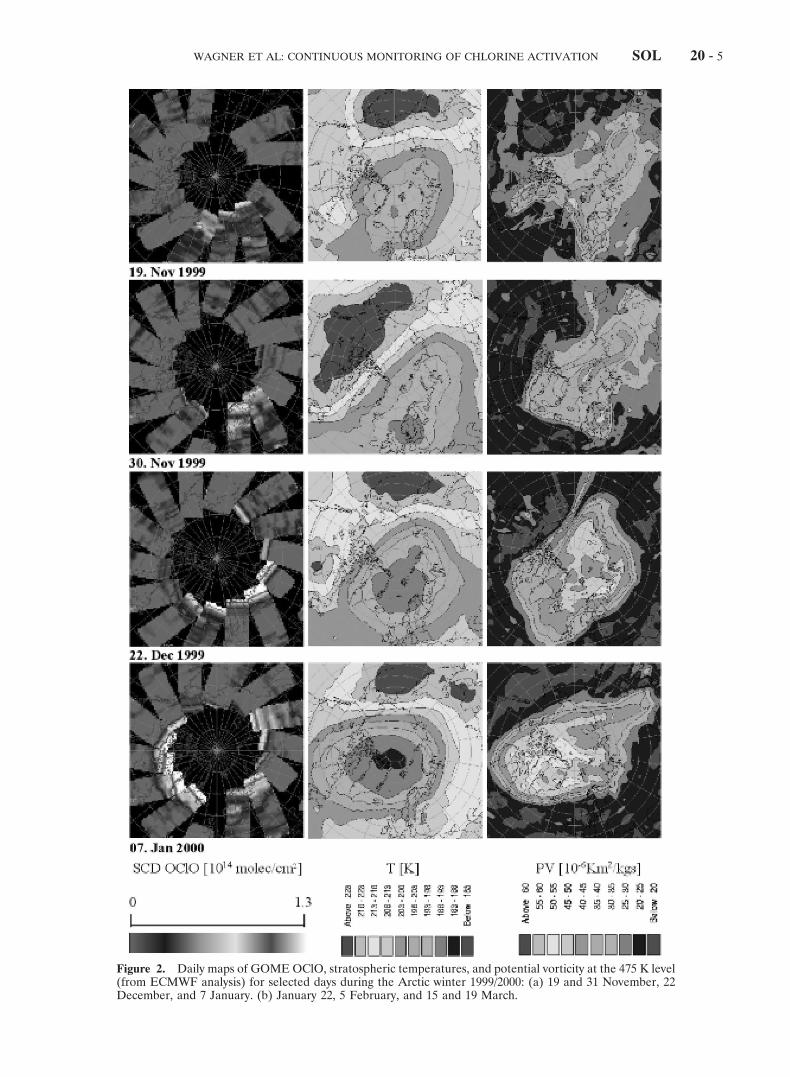
Figure 2. Daily maps of GOME OClO, stratospheric temperatures, and potential vorticity at the 475 K level(from ECMWF analysis) for selected days during the Arctic winter 1999/2000: (a) 19 and 31 November, 22December, and 7 January. (b) January 22, 5 February, and 15 and 19 March.
WAGNER ET AL: CONTINUOUS MONITORING OF CHLORINE ACTIVATION SOL 20 - 5
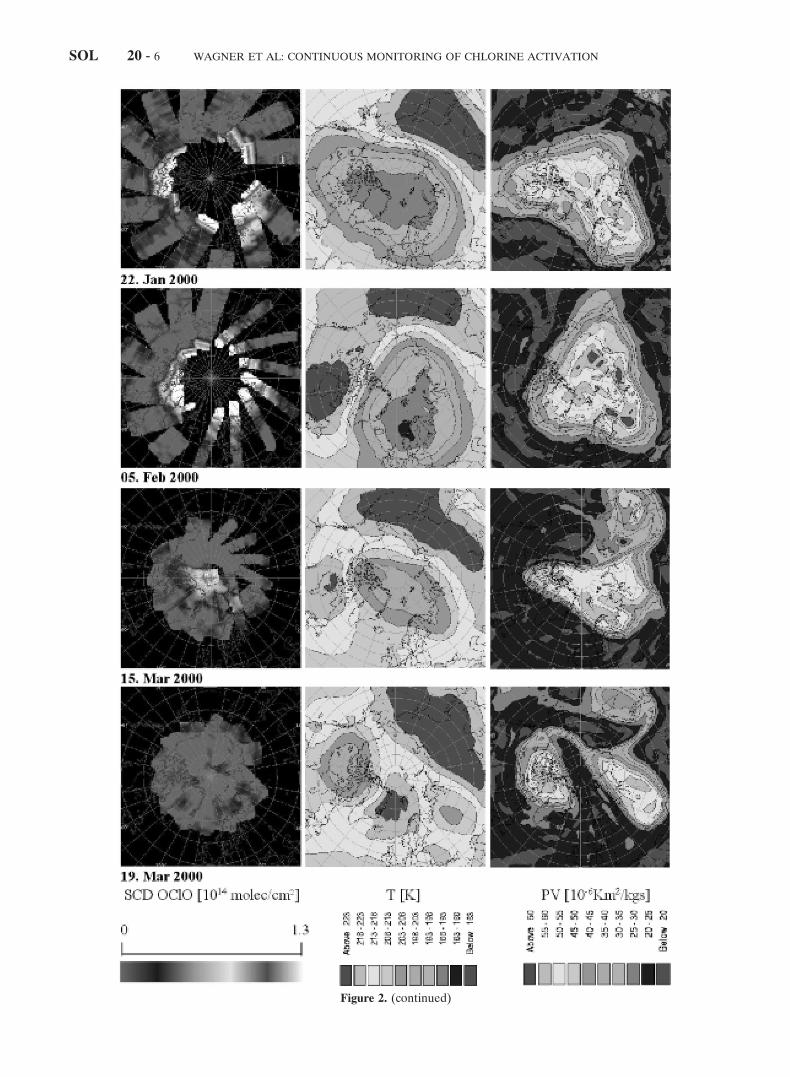
Figure 2. (continued)
WAGNER ET AL: CONTINUOUS MONITORING OF CHLORINE ACTIVATIONSOL 20 - 6
around 1015 molecules cm22 in mid March. In that winter thechlorine activation lasted until about 3 weeks after the lastPSCs had appeared [Wagner et al., 2001]. It should be notedthat some remaining air masses having chlorine activated airmight not be detected by GOME at this time of year. This isbecause of the limited areas observed having large SZAs dur-ing this part of the year. Nevertheless, after the small peak on21 March, no significant indication of chlorine activation wasidentified in the GOME OClO data. The rapid decline of thechlorine activation during the middle of March (see Figure 2b)was probably also favored by the split up of the polar vortexand the mixing of vortex air with air from outside (see Figure2b). In this way, even air masses for which denitrification dueto sedimentation of PSCs had occurred [Santee et al., 2000] canbe enriched with NOy again.
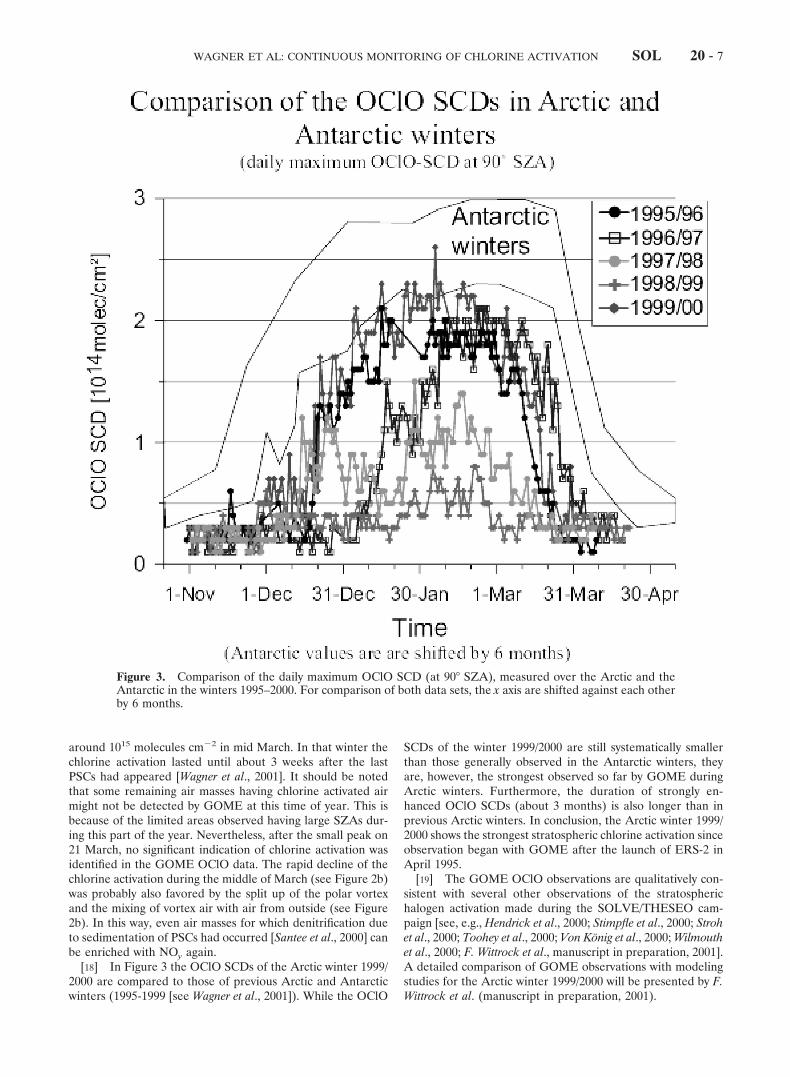
[18] In Figure 3 the OClO SCDs of the Arctic winter 1999/2000 are compared to those of previous Arctic and Antarcticwinters (1995-1999 [see Wagner et al., 2001]). While the OClO
SCDs of the winter 1999/2000 are still systematically smallerthan those generally observed in the Antarctic winters, theyare, however, the strongest observed so far by GOME duringArctic winters. Furthermore, the duration of strongly en-hanced OClO SCDs (about 3 months) is also longer than inprevious Arctic winters. In conclusion, the Arctic winter 1999/2000 shows the strongest stratospheric chlorine activation sinceobservation began with GOME after the launch of ERS-2 inApril 1995.
[19] The GOME OClO observations are qualitatively con-sistent with several other observations of the stratospherichalogen activation made during the SOLVE/THESEO cam-paign [see, e.g., Hendrick et al., 2000; Stimpfle et al., 2000; Strohet al., 2000; Toohey et al., 2000; Von Konig et al., 2000; Wilmouthet al., 2000; F. Wittrock et al., manuscript in preparation, 2001].A detailed comparison of GOME observations with modelingstudies for the Arctic winter 1999/2000 will be presented by F.Wittrock et al. (manuscript in preparation, 2001).
Figure 3. Comparison of the daily maximum OClO SCD (at 908 SZA), measured over the Arctic and theAntarctic in the winters 1995–2000. For comparison of both data sets, the x axis are shifted against each otherby 6 months.
WAGNER ET AL: CONTINUOUS MONITORING OF CHLORINE ACTIVATION SOL 20 - 7
4. Conclusions[20] Retrievals of OClO amounts from the GOME mea-
surements have enabled the stratospheric chlorine activationto be studied on a daily basis during the Arctic winter 1999/2000. These data allow us to characterise the evolution ofstratospheric chemistry with respect to ozone destruction. Itwas possible to investigate the different phases of chlorineactivation and deactivation and to relate them to the strato-spheric temperatures, PSC appearance, denoxification, andrenoxification. Compared to previous Arctic winters since thelaunch of ERS-2 (April 1995), the winter 1999/2000 showedthe strongest and most persistent chlorine activation. Contin-uously high levels of OClO were observed over 3 months, frommid December to mid March. The first sporadic events ofchlorine activation appeared in mid November, after thestratospheric temperatures dropped below the PSC formationtemperature. During that period, also small NO2 VCDs(around 5 3 1014 molecules cm22) indicated the beginning ofa strong stratospheric denoxification. During the period withthe highest OClO SCDs, PSCs were present over a large alti-tude range (between about 13 and 24 km) indicating thatchlorine activation took part over a large altitude range. Thelarge vertical extension of activated air masses is the mostprobable reason for the higher OClO SCDs compared to pre-vious Arctic winters [see, e.g., Von der Gathen et al., 2000].However, during the later part of the winter (late February toearly March), PSCs were only present within a smaller altituderange (Figure 1 [see also Manney and Sabutis, 2000]).
[21] Shortly after the last PSC sighting (by POAM) on 13March the stratospheric chlorine activation sharply decreased;the OClO SCDs dropped to levels around or below the detec-tion limit on 20 March. This rapid conversion into the reservoirspecies was much faster than in previous winters (since 1995)[Wagner et al., 2001] when the drop of the GOME OClO SCDsdown to the detection limit occurred typically about 2 to 3weeks after the stratospheric temperatures increased above thePSC formation threshold. The most likely explanation for thissudden ending of the chlorine activation during the winter1999/2000 is that the conversion of ClO into the reservoirspecies ClONO2 is favored by the relatively high values of NO2
('2 3 1015 molecules cm22) measured by GOME during thatperiod. NOx-rich air masses could have transported from out-side the vortex after 15 March, when the polar vortex split upinto separate pieces. In comparison, during the winter 1996/1996 the NO2 VCDs were around 1015 molecules cm22 duringmid March, and the chlorine activation lasted until about 3weeks after the latest PSC occurrence. The rapid decline dur-ing mid March is probably one important reason for the factthat the ozone destruction during the winter 1999/2000 was notsubstantially higher than those in previous Arctic winters inspite of the significantly stronger chlorine activation [Goutail etal., 2000]. Another, probably even more important reason isthat during the later period of chlorine activation (late Febru-ary to early March) when photolytic ozone destruction is mosteffective, the chlorine-activated air masses were restricted toan altitude range below about 20 km [THESEO, 2000; Manneyand Sabutis, 2000]. In contrast, during previous winters ozonedestruction took place over a more extensive altitude range[Goutail et al., 2000].
[22] Although the OClO SCDs during the Arctic winter1999/2000 are higher than those during previous Arctic win-ters, they still are systematically smaller (by about 25%) com-
pared to those appearing during the Antarctic winters. Thisdifference might be only partly be explained by the tempera-ture dependence of the OClO formation reaction [Wagner etal., 2001]. Since in both hemispheres similar maximum valuesof the stratospheric ClO concentration were measured by theMLS instrument [Waters et al., 1993a, 1993b; Santee et al., 1995,1996, 1997], the difference in the column is most probablycaused by a larger altitude range of activated air masses in theAntarctic [Wagner et al., 2001].
[23] Also the duration of the strong chlorine activation in1999/2000 (about 3 months) was longer than those of previousArctic winters but was still shorter than in the Antarctic (whereit typically lasts about 4 months). The strong chlorine activa-tion during the Arctic winter 1999/2000 as measured byGOME is in good agreement with several other studies relatedto stratospheric chlorine activation.
[24] Acknowledgments. The financial support of the DeutschesZentrum fur Luft- und Raumfahrt e.V. (DLR), Bonn (formerlyDARA), and the Bundesministerium fur Bildung, Wissenschaft, For-schung und Technologie (BMBF), contract 50 EE 9515, the EuropeanUnion, and the States of Baden Wurttenberg and Bremen are ac-knowledged. We also want to thank the ESA operation center inFrascati (Italy) and the DLR, department Wissenschaftlich-technischeBetriebseinrichtungen in Wessling (Germany) for providing the ERS-2satellite data. We have used stratospheric maps of potential vorticityand temperature provided by the European Centre for Medium-RangeWeather Forecasts (ECMWF) and the Norwegian Institute for AirResearch (NILU); special thanks go to Bjorn Knudsen and Bojan R.Bojkov. We also like to thank the POAM team for making their dataavailable via the internet.
ReferencesBevilacqua, R. M., K. Hoppel, J. Lumpe, M. Fromm, C. Deniel, and C.
Randall, POAM observations during the SOLVE winter: PSCs andozone loss, paper presented at the SOLVE-THESEO Science TeamMeeting, Palermo, Italy, Sept. 25–29, 2000.
Blum, U., K. H. Fricke, and K. Stebel, Synoptically and leewave-induced PSCs above the ESRANGE - LIDAR measurements dur-ing the four winters 1996/1997 - 1999/2000, paper presented at theSOLVE-THESEO Science Team Meeting, Palermo, Italy, Sept. 25–29, 2000.
Browell, E. V., C. F. Butler, W. B. Grant, V. G. Bracket, S. A. Kooi,O. B. Toon, J. Burris, T. McGee, M. Schoeberl, and M. J. Mahoney,Polar stratospheric cloud characteristics observed during theSOLVE campaign, paper presented at the SOLVE-THESEO Sci-ence Team Meeting, Palermo, Italy, Sept. 25–29, 2000.
Burrows, J. P., et al., The Global Ozone Monitoring Experiment(GOME): Mission concept and first scientific results, J. Atmos. Sci.56, 151–175, 1999.
Bussemer, M., Der Ring-Effekt: Ursachen und Einfluß auf die spe-ktroskopische Messung stratospharischer Spurenstoffe, diplomathesis, Univ. of Heidelberg, Heidelberg, Germany, 1993.
Carslaw, K. S., et al., Particle microphysics and chemistry in remotelyobserved mountain polar stratospheric clouds, J. Geophys. Res., 103,5785–5796, 1998a.
Carslaw, K. S., et al., Increased stratospheric ozone depletion due tomountain-induced atmospheric waves, Nature, 391, 675–678, 1998b.
Chubachi, S., Preliminary results of ozone observations at Syowa Sta-tion from February, 1982 to January, 1983, Mem. Natl. Inst. PolarRes. Spec. Issue Jpn., 34, 13–19, 1984.
European Centre for Medium-Range Weather Forecasts (ECMWF),Temperature and potential vorticity analyses, Dan. Meteorol. Inst.,Copenhagen, 2000.
European Space Agency (ESA), GOME, Global Ozone MonitoringExperiment, users manual, edited by F. Bednarz, Spec. Publ. SP-1182, Publ. Div. Eur. Space Res. and Technol. Cent. (ESTEC),Frascati, Italy, 1995.
Farman, J. C., B. G. Gardiner, and J. D. Shanklin, Large losses of totalozone in Antarctic reveal seasonal CIOx/Nox interaction, Nature,315, 207–210, 1985.
WAGNER ET AL: CONTINUOUS MONITORING OF CHLORINE ACTIVATIONSOL 20 - 8
Fiedler, M., H. Frank, T. Gomer, M. Hausmann, K. Pfeilsticker, andU. Platt, Ground-based spectroscopic measurements of strato-spheric NO2 and OClO in the arctic winter 1989/90, Geophys. Res.Lett., 20, 963–966, 1993.
Flentje, H., A. Dornbrack, A. Fix, and A. Meister, Airborne Lidarmeasurements of polar stratospheric clouds above northern Scandi-navia, paper presented at the SOLVE-THESEO Science TeamMeeting, Palermo, Italy, Sept. 25–29, 2000.
Frieß, U., F. Erle, T. Wagner, K. Pfeilsticker, and U. Platt, Spectro-scopic measurements of O3, NO2, OClO and BrO at Neumayer-Station, Antarctica during 1995, in Polar Stratospheric Ozone 1997,Proceedings of the Fourth European Symposium, 22 to 26 Sep., Schlier-see, Germany, Air Pollut. Rep. 66, pp. 443–446, Eur. Communities,Brussels, Belgium, 1998.
Fromm, M. D., R. M. Bevilacqua, J. Hornstein, E. Shettle, K. Hoppel,and J. D. Lumpe, An analysis of Polar Ozone and Aerosol Mea-surement (POAM) II Arctic polar stratospheric cloud observations,1993-1996, J. Geophys. Res., 104, 24, 341–24, 357, 1999.
Fromm, M. D., R. M. Bevilacqua, K. Hoppel, and J. D. Lumpe, PSCsduring the SOLVE/THESEO winter: POAM III observations andanalysis of formation mechanisms, paper presented at the SOLVE-THESEO Science Team Meeting, Palermo, Italy, Sept. 25–29, 2000.
Goutail, F., C. Deniel, F. Lefevre, J. P. Pommereau, A. Sarkissian, andL. Denis, Ozone loss in the Arctic and mid-latitudes stratospherefrom 1993 to 2000, in Atmospheric Ozone, Proceedings of the Qua-drenial Ozone Symposium, Sapporo, 3–8 July, Japan, edited by R.Bojkov and S. Kazuo, pp. 255–256, Internal Ozone Comm. Int.Assoc. for Meteorol. and Atmos. Sci. Geneva, 2000.
Grainger, J. F., and J. Ring, Anomalous Fraunhofer line profiles,Nature, 193, 762, 1962.
Hendrick, F., M. van Roozendael, C. Fayt, D. Fonteyn, C. Hermans,M. De Maziere, B. -M. Sinnhuber, and M. P. Chipperfield, Year-long ground based observations and model calculations of columnOClO and BrO seasonal variations at 608N: Evidence for erroneousCIy partitioning at twilight in photochemical models?, paper pre-sented at the SOLVE-THESEO Science Team Meeting, Palermo,Italy, Sept. 25–29, 2000.
Hild, L., A. Richter, F. Wittrock, M. Weber, A. Ladstatter-Weißenmayer, R. Spang, K. U. Grossmann, and J.P. Burrows, Astudy of PSC activation of chlorine during the Austral winter 1997,in Proceedings of the European Symposium on Atmospheric Measure-ments From Space (ESAMS 99), Jan. 18–22, ESTEC, Noordwijk,Netherlands, WPP-161, pp. 343–346, Eur. Space Agency, Noordwijk,Netherlands, 1999.
Kivi, R., E. Kyro, and A. Dornbrack, PSC, stratospheric temperature,and ozone observations in northern Finland in the winter of 1999/2000, paper presented at the SOLVE-THESEO Science TeamMeeting, Palermo, Italy, Sept. 25–29, 2000.
Leue, C., M. Wenig, T. Wagner, U. Platt, and B. Jahne, Quantitativeanalysis of NOx emissions from GOME satellite image sequences, J.Geophys. Res., 106, 5493–5505, 2001.
Manney, G. L., and J. L. Sabutis, Development of the polar vortex inthe 1999-2000 Arctic winter stratosphere, Geophys. Res. Lett., 27,2589–2592, 2000.
Marquard, L. C., T. Wagner, and U. Platt, Improved air mass factorconcepts for scattered radiation differential optical absorption spec-troscopy of atmospheric species, J. Geophys. Res., 105, 1315–1327,2000.
Miller, H. L., R. W. Sanders, and S. Solomon, Observation and inter-pretation of column OClO seasonal cycles at polar sites, J. Geophys.Res., 104, 18,769–18,783, 1999.
Otten, C., F. Ferlemann, U. Platt, T. Wagner, and K. Pfeilsticker,Ground-based DOAS UV/visible measurements at Kiruna (Swe-den) during the SESAME winters 1993/94 and 1994/95, J. Atmos.Chem., 30, 141–162, 1998.
Platt, U., Differential optical absorption spectroscopy (DOAS), in AirMonitoring by Spectroscopic Techniques, Chem. Anal. Ser., vol. 127,edited by M. W. Sigrist, pp. 27–84, John Wiley, New York, 1994.
Pommereau, J. P., and J. Piquard, Observations of the vertical distri-bution of stratospheric OClO, Geophys. Res. Lett., 21, 1231–1234,1994.
Renard, J. B., F. Levevre, M. Pirre, C. Robert, and D. Huguenin,Vertical profile of night-time stratospheric OClO, J. Atmos. Chem.,26, 65–76, 1997.
Richter, A., and J. P. Burrows, Retrieval of tropospheric NO2 fromGOME measurements, Adv. Space Res., 29(11), 1673–1683, 2002.
Santee, M. L., W. G. Read, J. W. Waters, L. Froidevaux, G. L. Man-ney, D. A. Flower, R. F. Jarnot, R. S. Harwood, and G. E. Peckham,Interhemispheric differences in polar stratospheric HNO3, ClO, andO3, Science, 267, 849–852, 1995.
Santee, M. L., G. L. Manney, W. G. Read, L. Froidevaux, and J. W.Waters, Polar vortex conditions during the 1995-96 Arctic winter:MLS ClO and HNO3, Geophys. Res. Lett., 23, 3207–3210, 1996.
Santee, M. L., G. L. Manney, L. Froidevaux, R. W. Zurek, and J. W.Waters, MLS observations of ClO and HNO3 in the 1996-97 Arcticpolar vortex, Geophys. Res. Lett., 24, 2713–2716, 1997.
Santee, M. L., G. L. Manney, N. J. Livesey, and J. W. Waters, UARSMicrowave Limb Sounder Observations of Denitrification andOzone Loss in the 2000 Arctic Winter, Geophys. Res. Lett., 27,3213–3216, 2000.
Schiller, C., and A. Wahner, Comment on “Stratospheric OC1O mea-surements as a poor quantitative indicator of chlorine activation” byJ. Sessler, M. P. Chipperfield, J. A. Pyle, and R. Tuomi, Geophys.Res. Lett., 23, 1053–1054, 1996.
Schreiner, J., C. Voigt, A. Kohlmann, F. Arnold, K. Mauersberger, andN. Larsen, Chemical analysis of polar stratospheric cloud particles,Science, 283, 968–970, 1999.
Solomon, S., The mystery of the Antarctic ozone “hole,” Rev. Geo-phys., 26, 131–148, 1988.
Solomon, S., Progress towards a quantitative understanding of Ant-arctic ozone depletion, Nature, 347, 347–354, 1990.
Solomon, S., Stratospheric Ozone Depletion: A review of concepts andhistory, Rev. Geophys., 37, 275–316, 1999.
Solomon, S., R. R. Garcia, F. S. Rowland, and D. J. Wuebbles, On thedepletion of Antarctic ozone, Nature, 321, 755–758, 1986.
Solomon, S., A. L. Schmeltekopf, and R. W. Sanders, On the inter-pretation of zenith sky absorption measurements, J. Geophys. Res.,92, 8311–8319, 1987a.
Solomon, S., G. H. Mount, R. W. Sanders, and A. L. Schmeltekopf,Visible spectrospcopy at McMurdo Station, Antarctica, 2, Observa-tions of OC1O, J. Geophys. Res., 92, 8329–8338, 1987b.
Stimpfle, R. M., D. M. Willmouth, G. P. Bonne, P. B. Voss, K. K.Perkins, E. J. Lanzendorf, and J. G. Anderson, In situ measurementsof ClO, ClOOCl, and ClONO2: The ER-2 borne thermal-dossociation/resonance-fluorescence instrument, paper presented atthe SOLVE-THESEO Science Team Meeting, Palermo, Italy, Sept.25–29, 2000.
Stroh, F., et al. Balloon borne measurements of ClO, ozone, andtracers: Observed and modeled ClO and chemical ozone loss in thepolar vortex during THESEO 2000, paper presented at the SOLVE-THESEO Science Team Meeting, Palermo, Italy, Sept 25–29, 2000.
Stutz, J., and U. Platt, Numerical analysis and error estimation ofDifferential Optical Absorption Spectroscopy measurements least-squares methods, Appl. Opt., 35, 6041–6053, 1996.
THESEO, The Northern Hemisphere stratosphere in the winter andspring of 1999/2000, report, p. 26, Eur. Ozone Res. Coord. Unit,Cambridge UK, 2000.
Toohey, D., et al., In situ measurements of ClO, BrO, CFC-11, ozone,and particles in the Arctic polar vortex: An overview of the HALOZ2000 balloon campaign, paper presented at the SOLVE-THESEOScience Team Meeting, Palermo, Italy, Sept. 25–29, 2000.
Toon, O. B., P. Hamill, R. P. Turco, and J. Pinto, Condensation ofHNO3 and HCl in the winter polar stratosphere, Geophys. Res. Lett.,13, 1284–1287, 1986.
Toon, O. B., E. V. Browell, S. Kinne, and J. Jordan, An analysis ofLIDAR observations of polar stratospheric clouds, Geophys. Res.Lett., 17, 393–396, 1990.
Voigt, C., et al., Balloon-borne measurements of chemical, physical,and optical properties of polar stratospheric cloud, part III, Particlesat temperatures near TNAT, paper presented at the SOLVE-THESEO Science Team Meeting, Palermo, Italy, Sept. 25–29,2000a.
Voigt, C., et al., Nitric acid trihydrate (NAT) in polar stratosphericcloud particles, Science, 290, 1673, 2000b.
Voigt, C., A. Tsias, A. Dornbrack, S. Meilinger, B. Luo, J. Schreiner,N. Larsen, K. Mauersberger, and T. Peter, Non-equilibrium com-positions of liquid polar stratospheric clouds in gravity waves, Geo-phys. Res. Lett., 27, 3873–3876, 2000c.
Von der Gathen, P., M. Rex, and P. Herrmann, Synoptic PSC exis-tence temperatures above the Arctic from 1979 onwards, in Strato-spheric Ozone 1999, Proceedings of the Fifth European Symposium, 27
WAGNER ET AL: CONTINUOUS MONITORING OF CHLORINE ACTIVATION SOL 20 - 9
Sep. to 1 Oct., Saint Jean de Luz, France, Air Pollut. Rep. 73, pp.79–82, Eur. Communities, Brussels, Belgium, 2000.
Von Konig, M., H. Bremer, A. Kleinbohl, H. Kullmann, and K. Kunzi,Evolution of chlorine activation during Arctic winter 1999/2000 asmeasured by the airborne submillimeter radiometer ASUR, paperpresented at the SOLVE-THESEO Science Team Meeting, Pal-ermo, Italy, Sept. 25–29, 2000.
Wagner, T., Satellite observations of atmospheric halogen oxides,Ph.D. thesis, Univ. of Heidelberg, Heidelberg, Germany, 1999.
Wagner, T., C. Leue, K. Pfeilsticker, and U. Platt, Measurement ofatmospheric BrO and OClO by GOME, in Proceedings of the Euro-pean Symposium on Atmospheric Measurements from Space (ESAMS99), Jan. 18–22, ESTEC, Noordwijk, Netherlands, WPP-161, pp. 415–419, Eur. Space Agency, Noordwijk, Netherlands, 1999.
Wagner, T., C. Leue, K. Pfeilsticker, and U. Platt, Monitoring of thestratospheric chlorine activation by Global Ozone MonitoringExperiment (GOME) OClO measurements in the austral andboreal winters 1995 through 1999, J. Geophys. Res., 106, 4971–4986, 2001.
Wahner, A., G. Tyndall, and A. Ravishankara, Absorption cross sec-tions for OClO as a function of temperature in the wavelength rangefrom 240–490 nm, J. Phys. Chem., 91, 2735–2738, 1987.
Waters, J. W., L. Froidevaux, W. G. Read, G. L. Manney, L. S. Elson,D. A. Flower, R. F. Jarnot, and R. S. Harwood, Stratospheric ClOand ozone form the Microwave Limb Sounder on the Upper Atmo-spheric Research Satellite, Nature, 362, 597–602, 1993a.
Waters, J. W., L. Froidevaux, G. L. Manney, W. G. Read, and L. S.Elson, MLS observations of lower stratospheric ClO and O3 in the1992 southern hemisphere winter, Geophys. Res. Lett., 20, 1219–1222, 1993b.
Wilmouth, D. M., R. M. Stimpfle, J. G. Anderson, J. W. Elkins, D. F.Hurst, P. A. Romahskin, and G. S. Dutton, Chlorine partitioning inthe Arctic vortex: Clx/Cly determined from in situ measurements inthe stratosphere, paper presented at the SOLVE-THESEO ScienceTeam Meeting, Palermo, Italy, Sept. 25–29, 2000.
Wittrock, F., A. Richter, and J. P. Burrows, Validation of GOME BrOand OClO observations in the northern hemisphere, in Proceedingsof the European Symposium on Atmospheric Measurements fromSpace (ESAMS 99), Jan. 18–22, ESTEC, Noordwijk, Netherlands,WPP-161, pp. 735–738, Eur. Space Agency, Noordwijk, Netherlands,1999.
J. P. Burrows, A. Richter, and F. Wittrock, Institute of Environmen-tal Physics, University of Bremen, P.O. Box 33 04 40, D-28334 Bremen,Germany. ([email protected];[email protected]; [email protected])
U. Platt and T. Wagner, Institut fur Umweltphysik, University ofHeidelberg, Heidelberg D-69120, Germany. ([email protected]; [email protected])
M. Wenig, Goddard Space Flight Center, Code 130, Greenbelt, MD20771, USA ([email protected])
WAGNER ET AL: CONTINUOUS MONITORING OF CHLORINE ACTIVATIONSOL 20 - 10