Embed Size (px)
Citation preview
CONTINUOUS PROBABILITY DISTRIBUTIONS
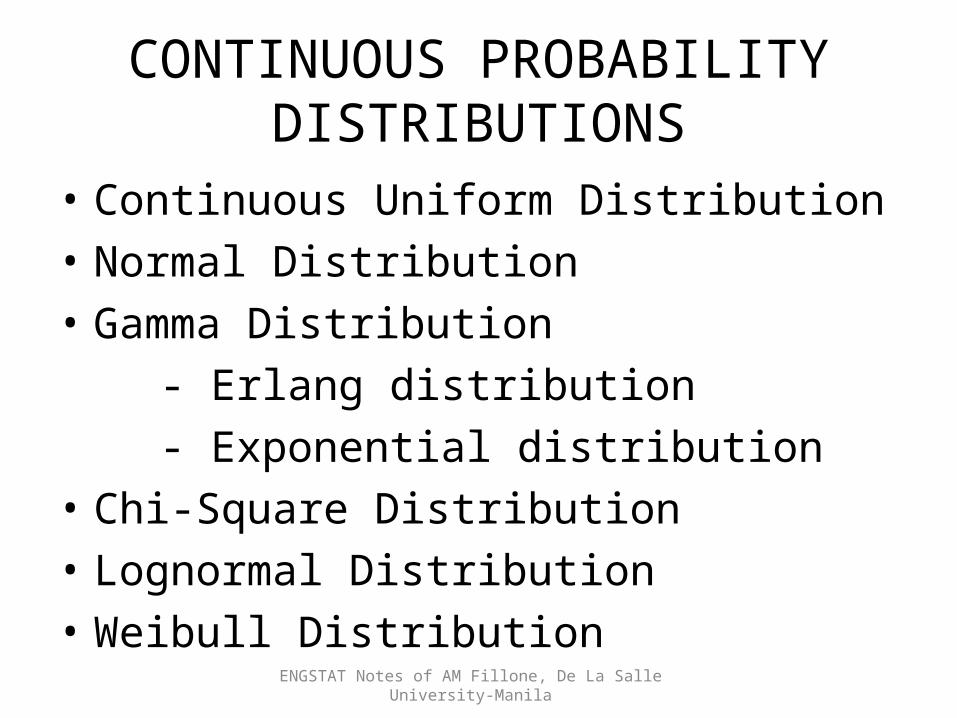
• Continuous Uniform Distribution• Normal Distribution• Gamma Distribution - Erlang distribution - Exponential distribution• Chi-Square Distribution• Lognormal Distribution• Weibull Distribution
ENGSTAT Notes of AM Fillone, De La Salle University-Manila
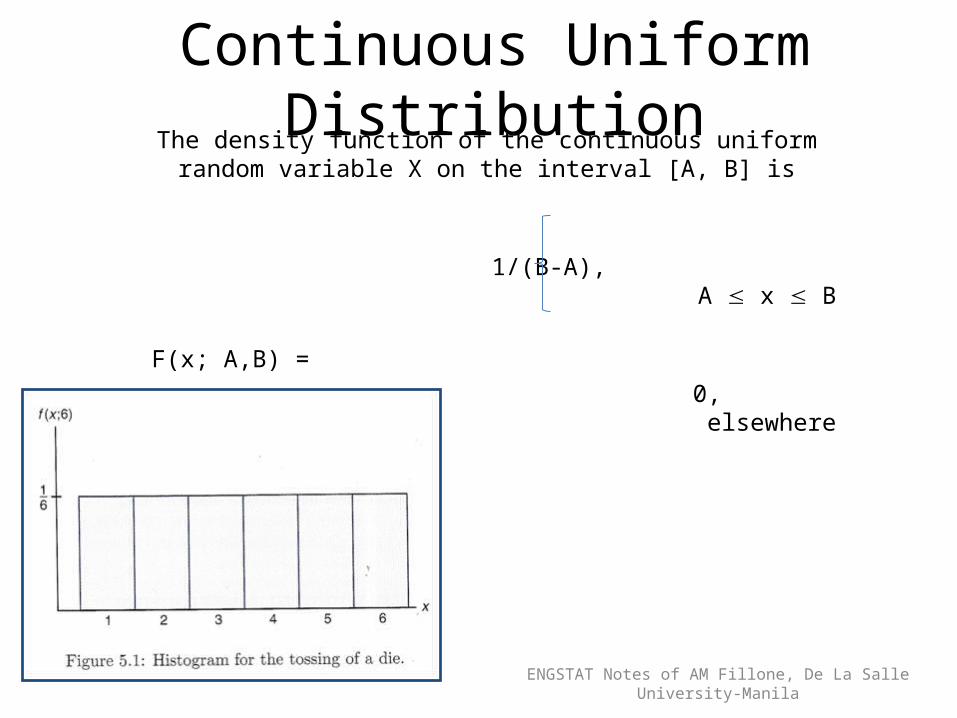
Continuous Uniform DistributionThe density function of the continuous uniform random variable X on
the interval [A, B] is
1/(B-A), A x B F(x; A,B) =
0, elsewhere
ENGSTAT Notes of AM Fillone, De La Salle University-Manila
Normal Distribution
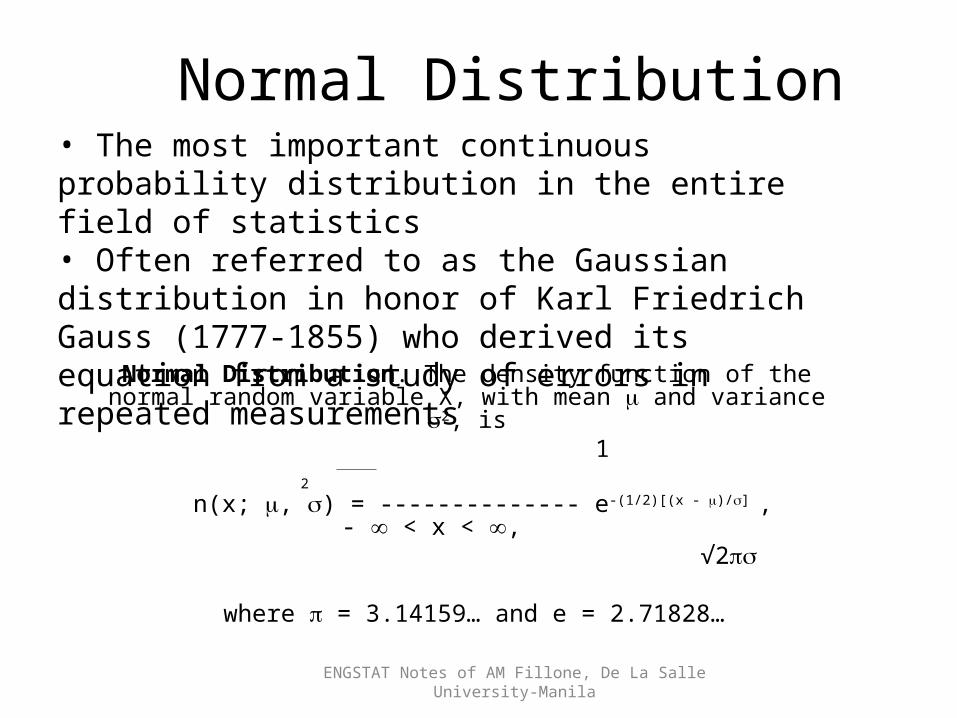
Normal Distribution. The density function of the normal random variable X, with mean and variance 2, is
1 2
n(x; , ) = -------------- e-(1/2)[(x - )/] , - < x < , √2
where = 3.14159… and e = 2.71828…
• The most important continuous probability distribution in the entire field of statistics• Often referred to as the Gaussian distribution in honor of Karl Friedrich Gauss (1777-1855) who derived its equation from a study of errors in repeated measurements
ENGSTAT Notes of AM Fillone, De La Salle University-Manila
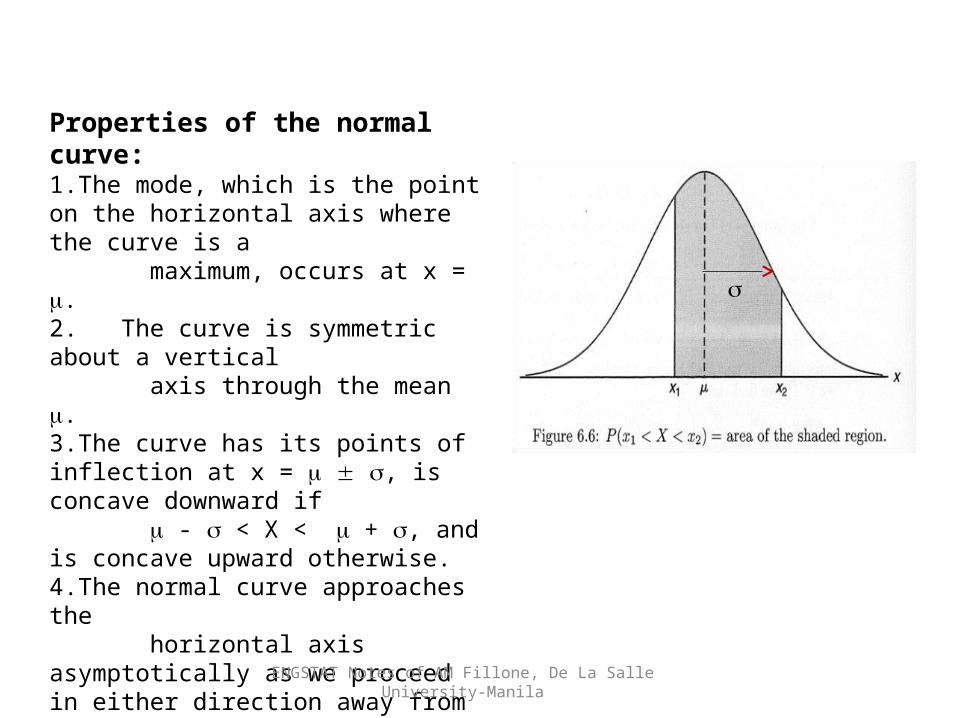
Properties of the normal curve:1.The mode, which is the point on the horizontal axis where the curve is a maximum, occurs at x = .2. The curve is symmetric about a vertical axis through the mean .3.The curve has its points of inflection at x = , is concave downward if - < X < + , and is concave upward otherwise.4.The normal curve approaches the horizontal axis asymptotically as we proceed in either direction away from the mean.5.The total area under the curve and above the horizontal axis is equal to 1.
ENGSTAT Notes of AM Fillone, De La Salle University-Manila
ENGSTAT Notes of AM Fillone, De La Salle University-Manila
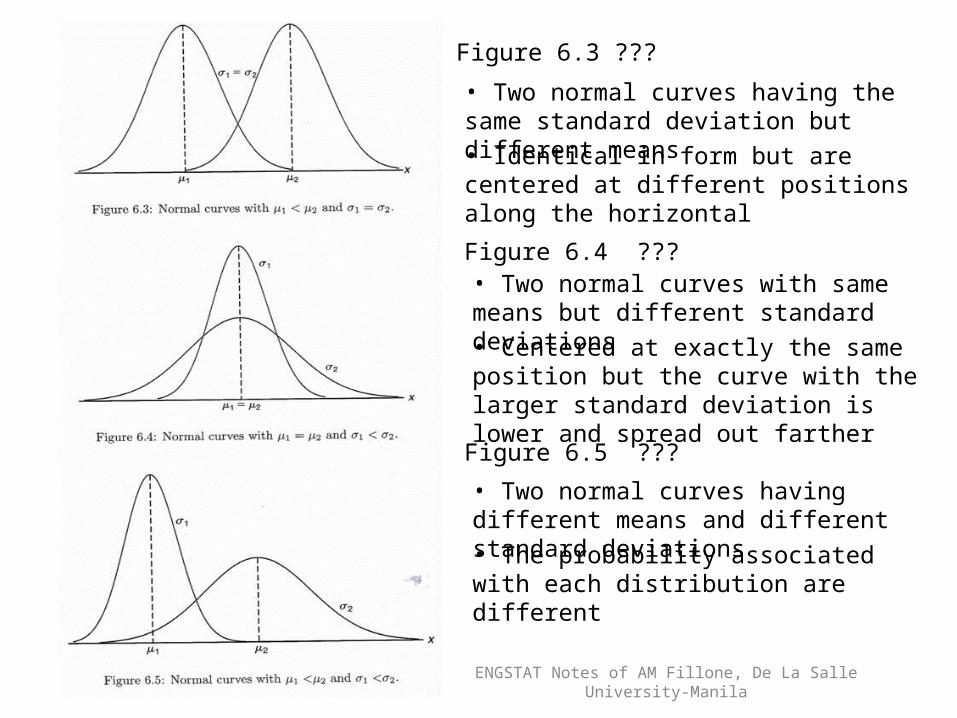
Figure 6.3 ???
• Two normal curves having the same standard deviation but different means• Identical in form but are centered at different positions along the horizontal
• Two normal curves with same means but different standard deviations
Figure 6.4 ???
• Centered at exactly the same position but the curve with the larger standard deviation is lower and spread out farther
Figure 6.5 ???
• Two normal curves having different means and different standard deviations• The probability associated with each distribution are different
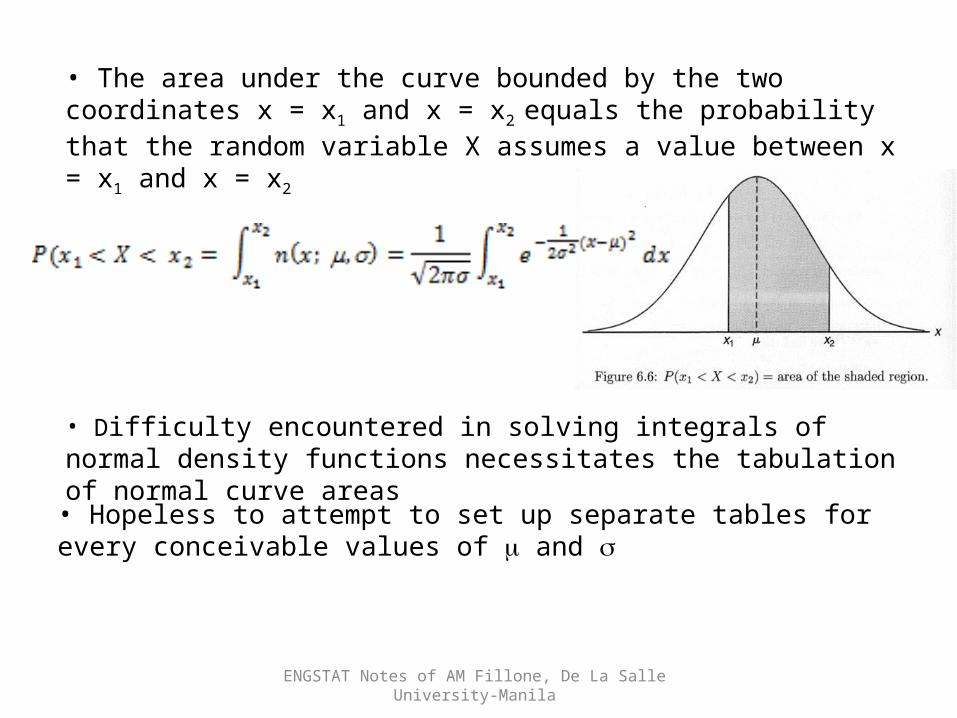
• The area under the curve bounded by the two coordinates x = x1 and x = x2
equals the probability that the random variable X assumes a value between x = x1 and x = x2
• Hopeless to attempt to set up separate tables for every conceivable values of and
ENGSTAT Notes of AM Fillone, De La Salle University-Manila
• Difficulty encountered in solving integrals of normal density functions necessitates the tabulation of normal curve areas
ENGSTAT Notes of AM Fillone, De La Salle University-Manila
• The distribution of a normal random variable with mean 0 and variance 1 is called a standard normal distribution.
• This can be done by means of the transformation
Z = (x - )/
ENGSTAT Notes of AM Fillone, De La Salle University-Manila
ENGSTAT Notes of AM Fillone, De La Salle University-Manila
ENGSTAT Notes of AM Fillone, De La Salle University-Manila
ENGSTAT Notes of AM Fillone, De La Salle University-Manila
ENGSTAT Notes of AM Fillone, De La Salle University-Manila
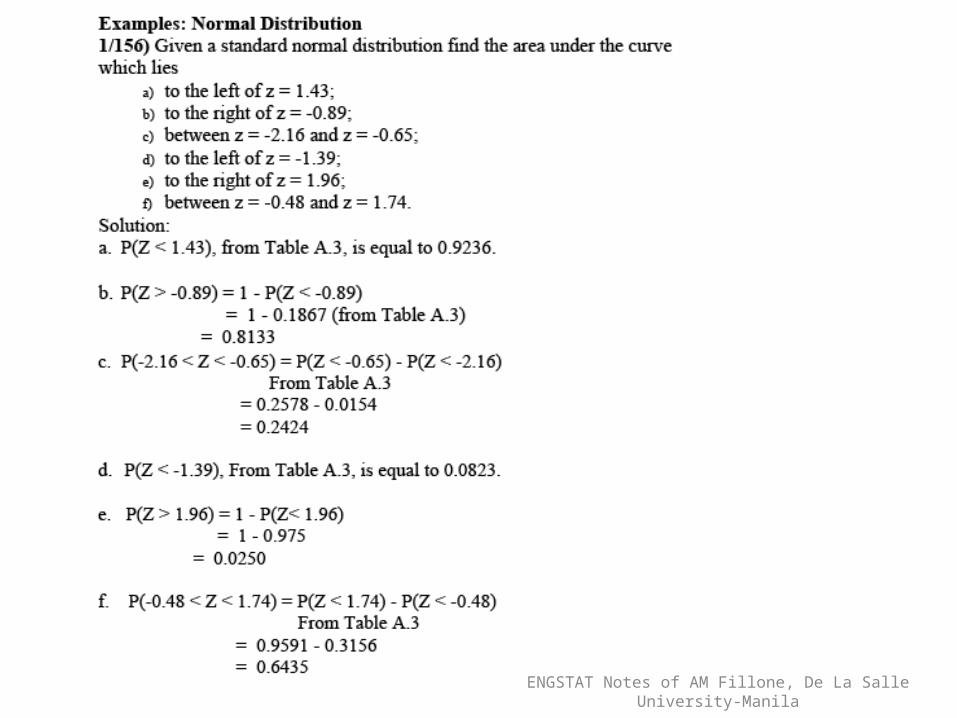
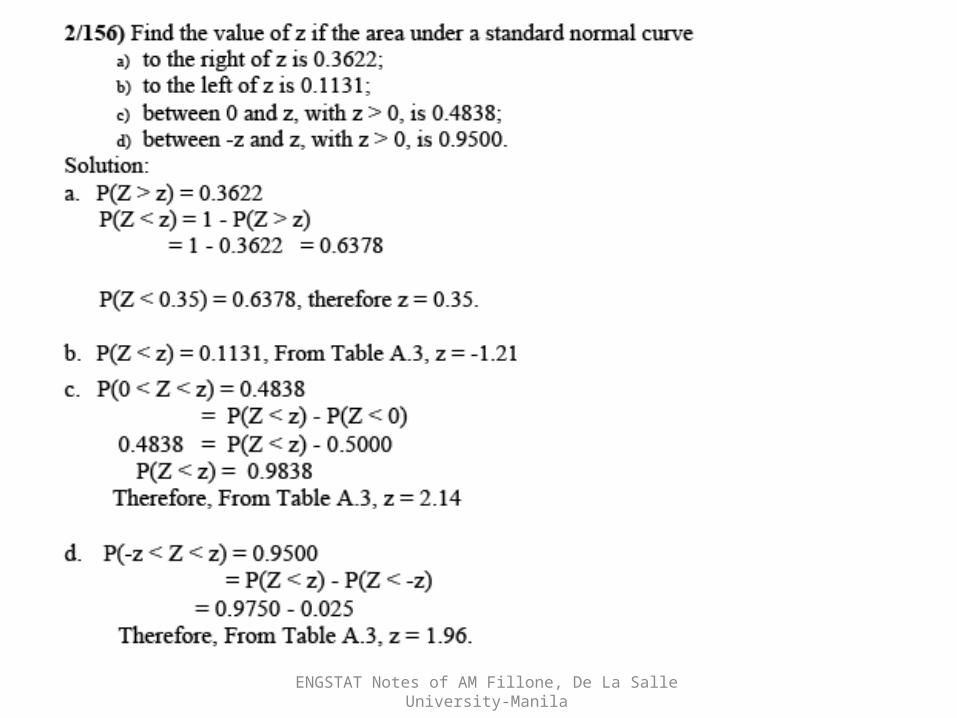
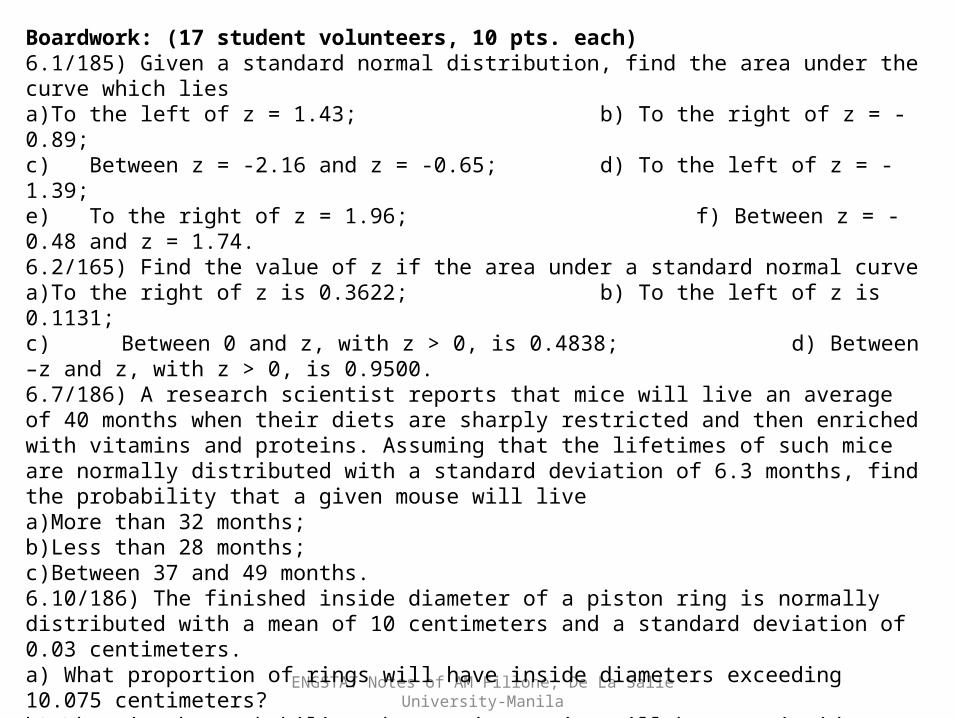
Boardwork: (17 student volunteers, 10 pts. each)6.1/185) Given a standard normal distribution, find the area under the curve which liesa)To the left of z = 1.43; b) To the right of z = -0.89;c) Between z = -2.16 and z = -0.65; d) To the left of z = -1.39;e) To the right of z = 1.96; f) Between z = -0.48 and z = 1.74.6.2/165) Find the value of z if the area under a standard normal curvea)To the right of z is 0.3622; b) To the left of z is 0.1131;c) Between 0 and z, with z > 0, is 0.4838; d) Between –z and z, with z > 0, is 0.9500.6.7/186) A research scientist reports that mice will live an average of 40 months when their diets are sharply restricted and then enriched with vitamins and proteins. Assuming that the lifetimes of such mice are normally distributed with a standard deviation of 6.3 months, find the probability that a given mouse will livea)More than 32 months;b)Less than 28 months;c)Between 37 and 49 months.6.10/186) The finished inside diameter of a piston ring is normally distributed with a mean of 10 centimeters and a standard deviation of 0.03 centimeters.a) What proportion of rings will have inside diameters exceeding 10.075 centimeters?b) What is the probability that a piston ring will have an inside diameter between 9.97 and 10.03 centimeters?c) Below what value of inside diameter will 15% of the piston rings fall?6.13/186) The average life of a certain type of small motor is 10 years with a standard deviation of 2 years. The manufacturer replaces free all motors that fail while under guarantee. If he is willing to replace only 3% of the motors that fail, how long a guarantee should he offer? Assume that the lifetime of a motor follows a normal distribution.
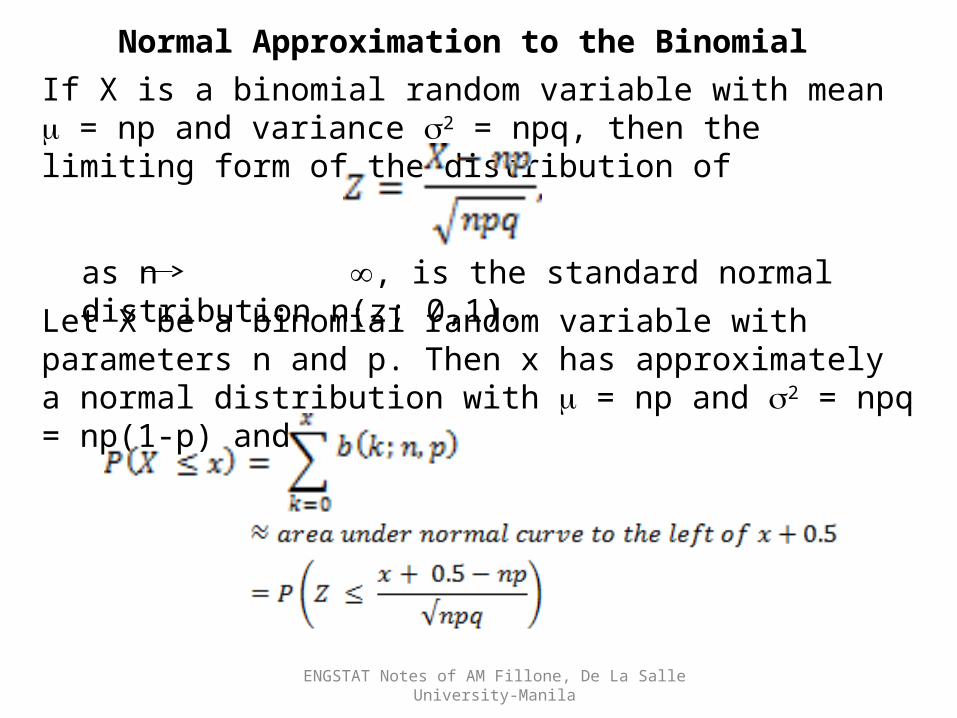
Normal Approximation to the BinomialIf X is a binomial random variable with mean = np and variance 2 = npq, then the limiting form of the distribution of
as n , is the standard normal distribution n(z; 0,1).
ENGSTAT Notes of AM Fillone, De La Salle University-Manila
Let X be a binomial random variable with parameters n and p. Then x has approximately a normal distribution with = np and 2 = npq = np(1-p) and
ENGSTAT Notes of AM Fillone, De La Salle University-Manila
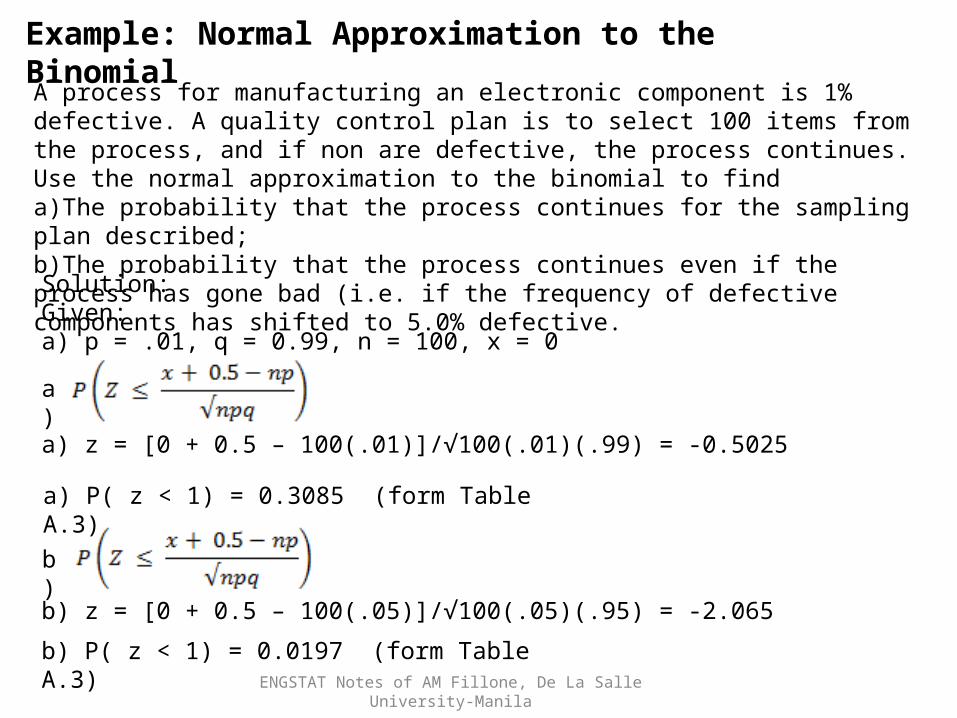
Example: Normal Approximation to the Binomial
A process for manufacturing an electronic component is 1% defective. A quality control plan is to select 100 items from the process, and if non are defective, the process continues. Use the normal approximation to the binomial to finda)The probability that the process continues for the sampling plan described;b)The probability that the process continues even if the process has gone bad (i.e. if the frequency of defective components has shifted to 5.0% defective.
Solution:Given: a) p = .01, q = 0.99, n = 100, x = 0
a) z = [0 + 0.5 – 100(.01)]/√100(.01)(.99) = -0.5025
a)
a) P( z < 1) = 0.3085 (form Table A.3)
b)
b) z = [0 + 0.5 – 100(.05)]/√100(.05)(.95) = -2.065
b) P( z < 1) = 0.0197 (form Table A.3)
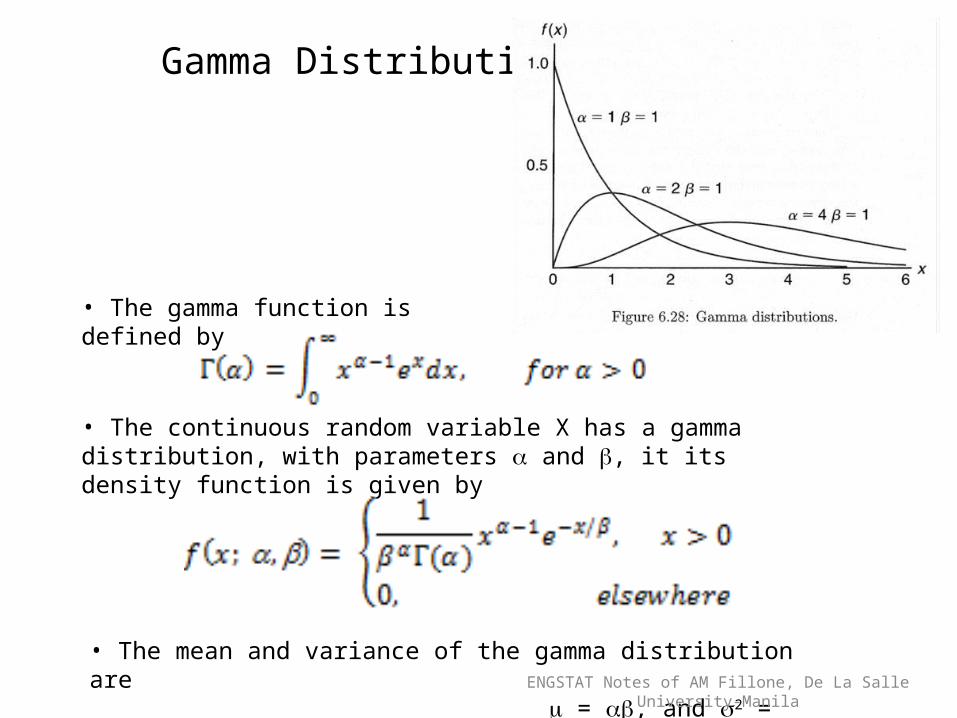
Gamma Distribution
• The gamma function is defined by
• The continuous random variable X has a gamma distribution, with parameters and , it its density function is given by
• The mean and variance of the gamma distribution are = , and 2 = 2. ENGSTAT Notes of AM Fillone, De La Salle University-Manila
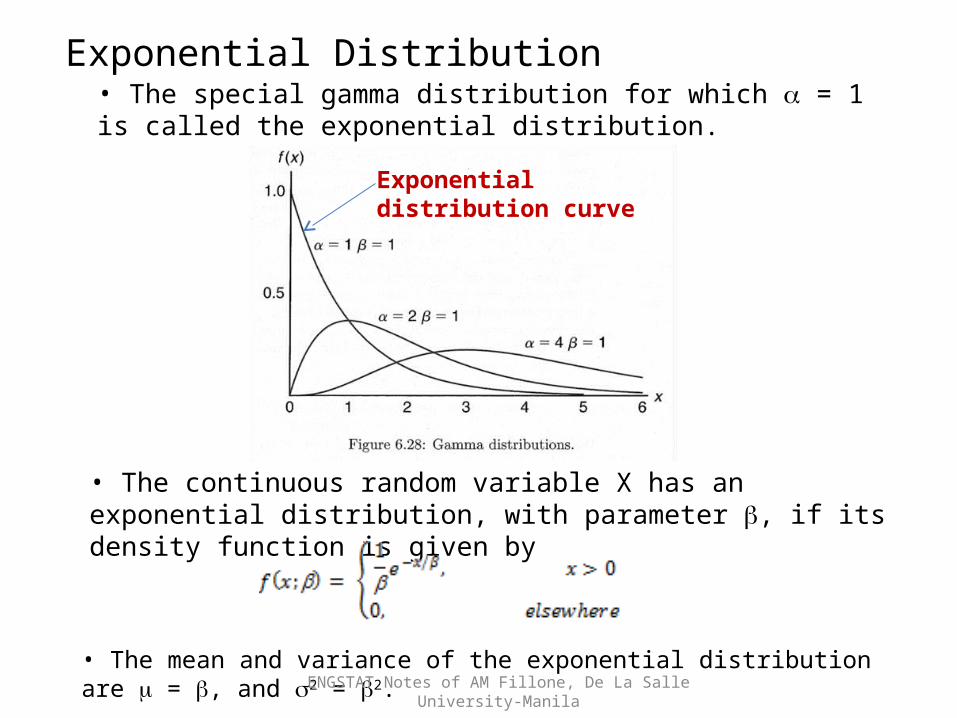
Exponential Distribution• The special gamma distribution for which = 1 is called the exponential distribution.
Exponential distribution curve
• The continuous random variable X has an exponential distribution, with parameter , if its density function is given by
• The mean and variance of the exponential distribution are = , and 2 = 2.ENGSTAT Notes of AM Fillone, De La Salle University-Manila
ENGSTAT Notes of AM Fillone, De La Salle University-Manila
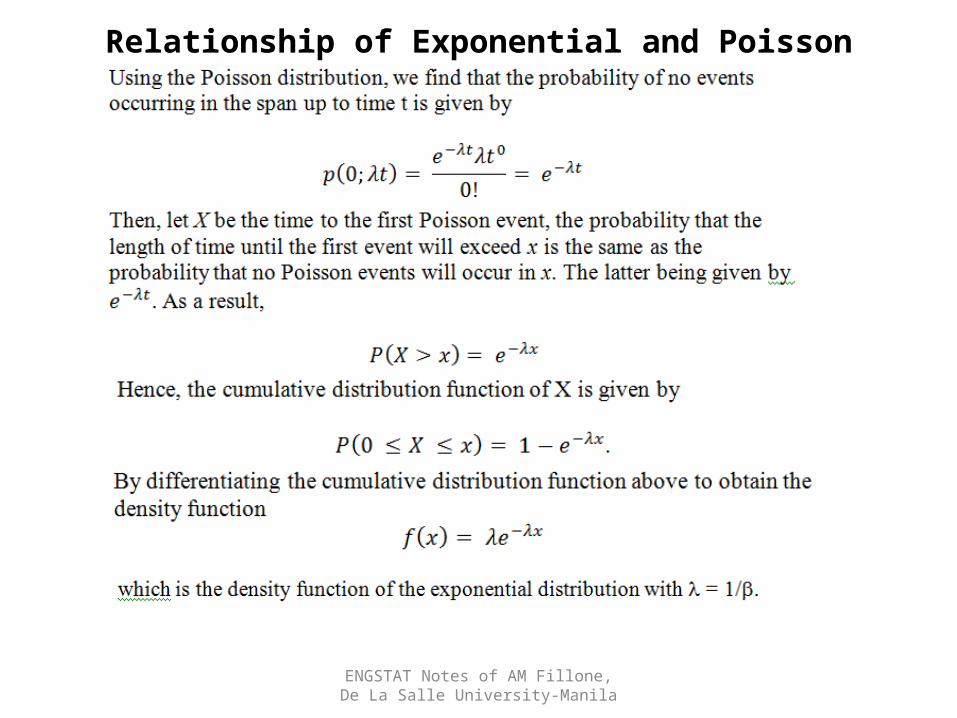
Relationship of Exponential and Poisson Process
ENGSTAT Notes of AM Fillone, De La Salle University-Manila
Gamma, Exponential and Erlang Distributions• Applications – queuing theory, reliability problems, time between arrivals at service facilities, and time to failure of component parts and electrical systems
• In reliability theory, where equipment failure often conforms to the Poisson Process, is called mean time between failures.
• Many equipment breakdowns do follow the Poisson process, and thus the exponential distribution does apply.
• Other applications include survival time in biomedical experiments and computer response time.• The binomial distribution also plays a role in exponential and poisson distribution problems.
ENGSTAT Notes of AM Fillone, De La Salle University-Manila
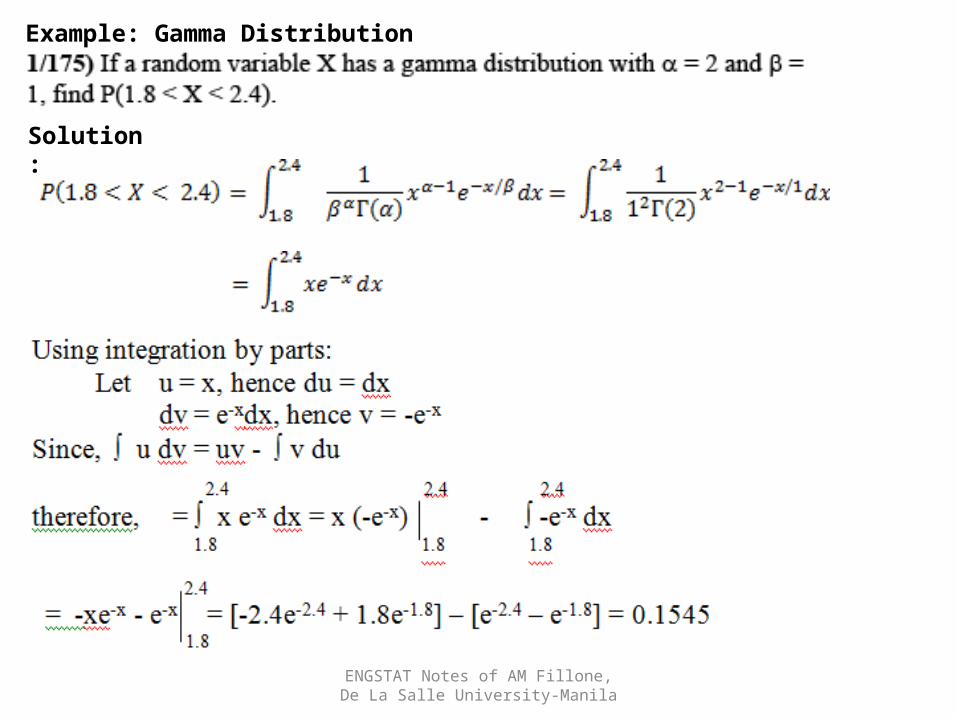
Example: Gamma Distribution
Solution:
ENGSTAT Notes of AM Fillone, De La Salle University-Manila
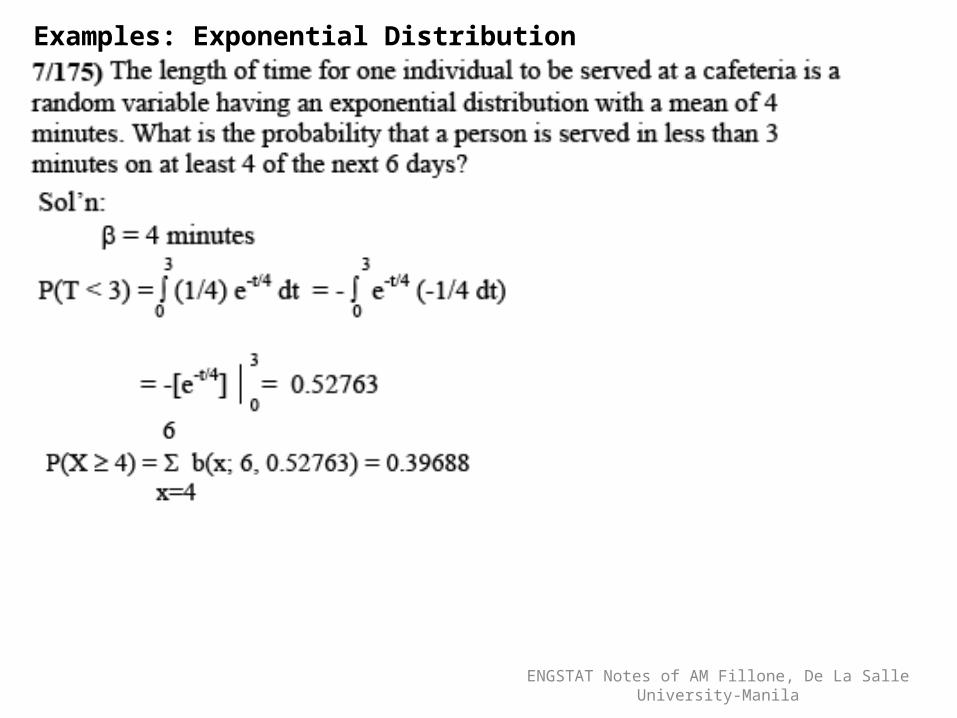
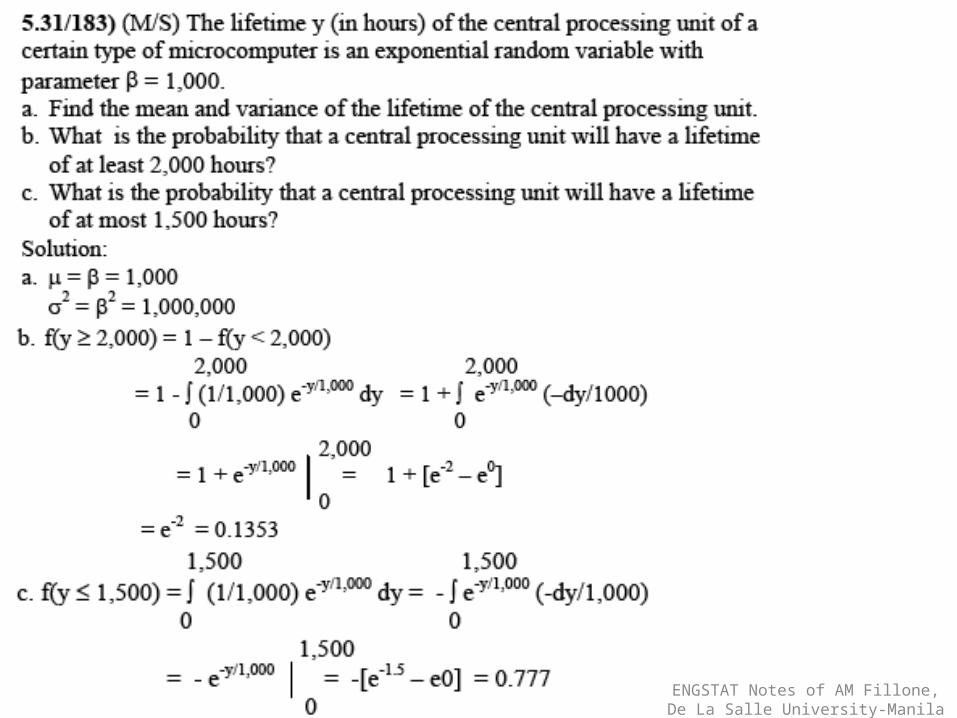
Examples: Exponential Distribution
ENGSTAT Notes of AM Fillone, De La Salle University-Manila
Erlang Distribution
• A special case of the Gamma distribution where the shape parameter is an integer.
• As noted earlier, when parameter equals 1, the distribution is an exponential distribution.
ENGSTAT Notes of AM Fillone, De La Salle University-Manila
ENGSTAT Notes of AM Fillone, De La Salle University-Manila
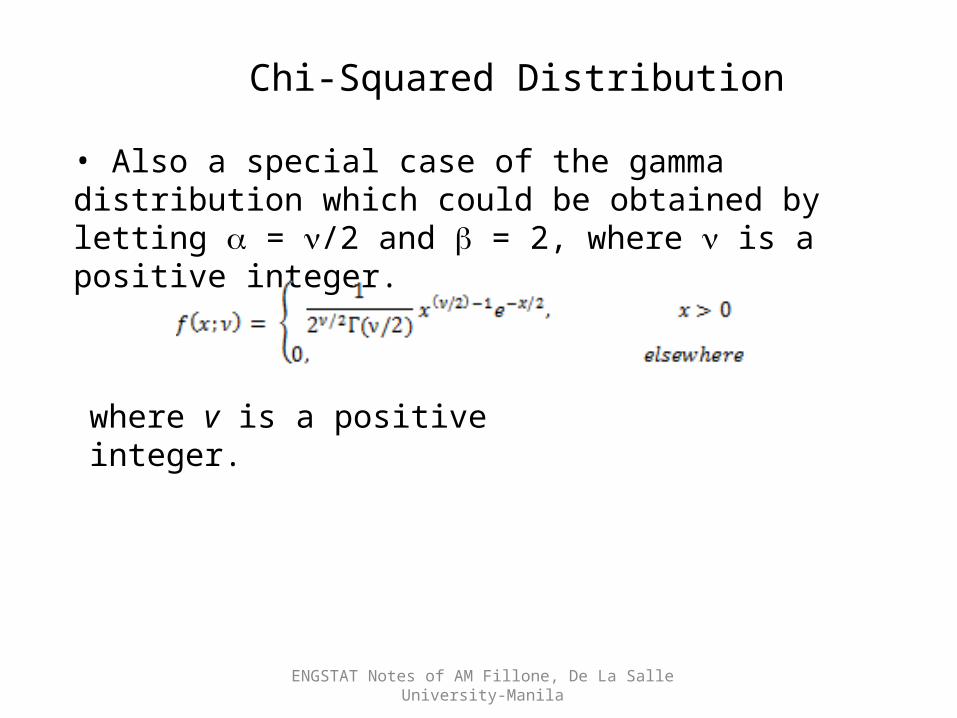
Chi-Squared Distribution
• Also a special case of the gamma distribution which could be obtained by letting = /2 and = 2, where is a positive integer.
where v is a positive integer.
ENGSTAT Notes of AM Fillone, De La Salle University-Manila
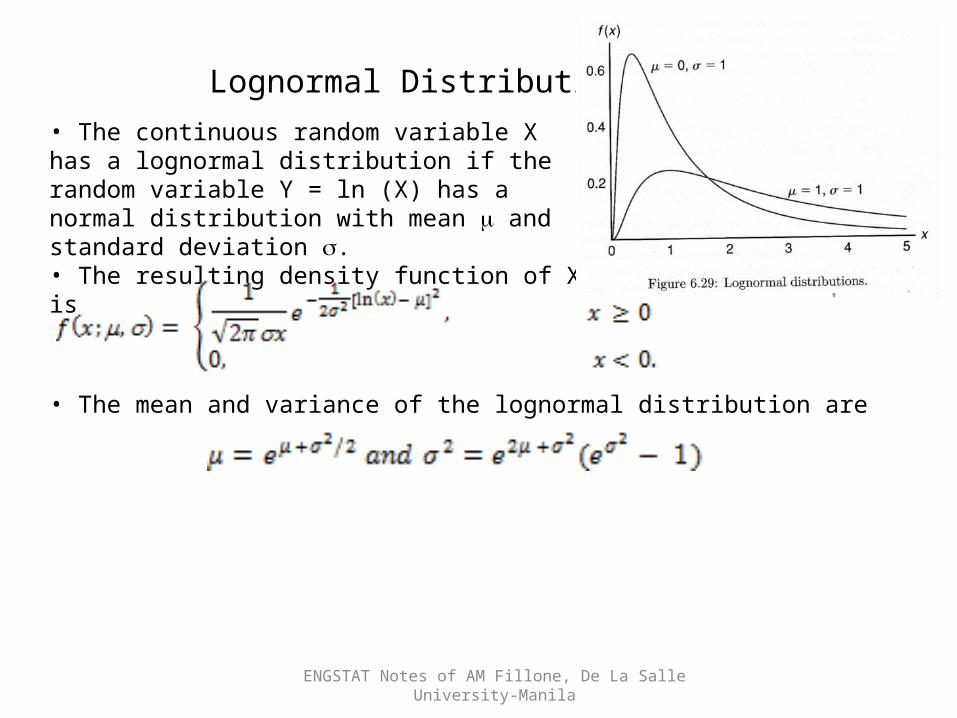
Lognormal Distribution• The continuous random variable X has a lognormal distribution if the random variable Y = ln (X) has a normal distribution with mean and standard deviation .• The resulting density function of X is
• The mean and variance of the lognormal distribution are
ENGSTAT Notes of AM Fillone, De La Salle University-Manila
ENGSTAT Notes of AM Fillone, De La Salle University-Manila
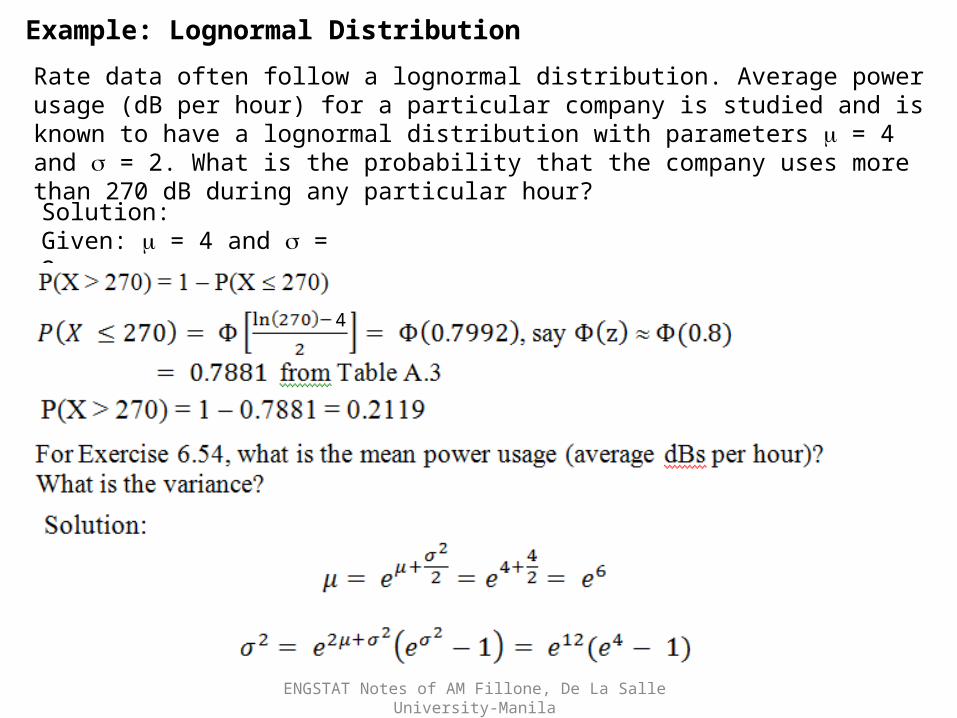
Example: Lognormal Distribution
Rate data often follow a lognormal distribution. Average power usage (dB per hour) for a particular company is studied and is known to have a lognormal distribution with parameters = 4 and = 2. What is the probability that the company uses more than 270 dB during any particular hour?
Solution:Given: = 4 and = 2
4
ENGSTAT Notes of AM Fillone, De La Salle University-Manila
Weibull Distribution
• Introduced by the Swedish physicist Waloddi Weibull in 1939.
• Used in reliability and life-testing problems such as the time to failure or life length of a component, measured from some specified time until it fails.
• Has the inherent flexibility that does not require the lack of memory property of the exponential distribution.
Weibull Distribution
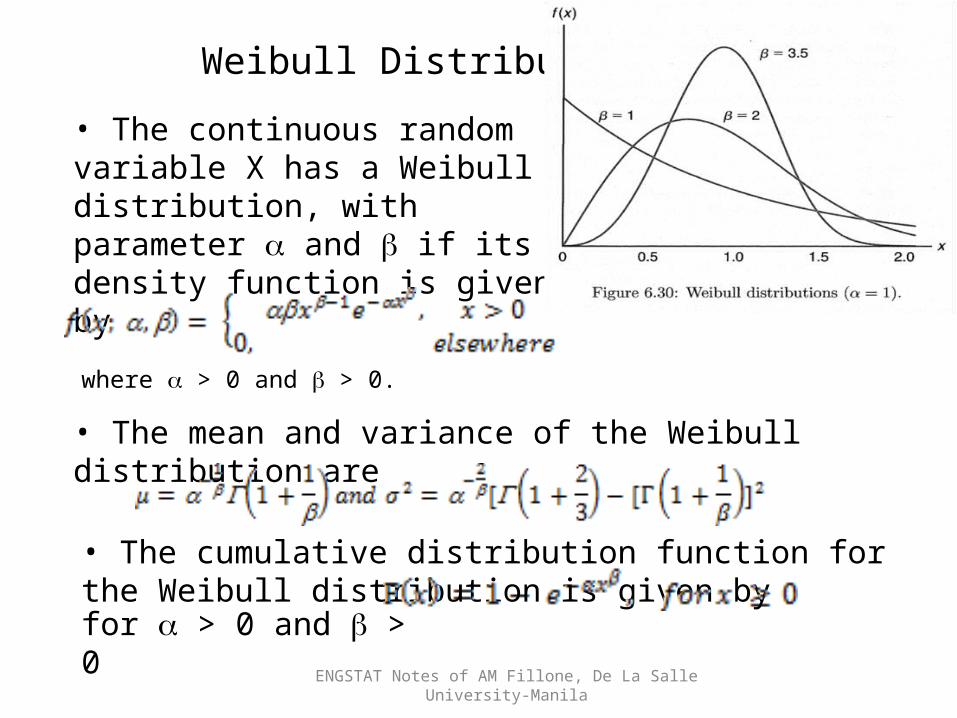
• The continuous random variable X has a Weibull distribution, with parameter and if its density function is given by
where > 0 and > 0.
• The mean and variance of the Weibull distribution are
• The cumulative distribution function for the Weibull distribution is given byfor > 0 and > 0
ENGSTAT Notes of AM Fillone, De La Salle University-Manila
ENGSTAT Notes of AM Fillone, De La Salle University-Manila