Embed Size (px)
Citation preview
Continuous sucrose crystallization
Item Type text; Thesis-Reproduction (electronic)
Authors Ziebold, Steven Anthony, 1949-
Publisher The University of Arizona.
Rights Copyright © is held by the author. Digital access to this materialis made possible by the University Libraries, University of Arizona.Further transmission, reproduction or presentation (such aspublic display or performance) of protected items is prohibitedexcept with permission of the author.
Download date 07/05/2018 08:34:00
Link to Item http://hdl.handle.net/10150/347817
CONTINUOUS SUCROSE CRYSTALLIZATION
bySteven Anthony Ziebold
A Thesis Submitted to the Faculty of the
DEPARTMENT OF CHEMICAL ENGINEERING
In Partial Fulfillment of the Requirements For the Degree of
MASTER OF SCIENCE
In the Graduate College
THE UNIVERSITY OF ARIZONA
1 9 7 3
STATEMENT BY AUTHOR
This thesis has been submitted in partial fulfillment of requirements for an advanced degree at The University of Arizona and is
under rules of the Library.
Brief quotations from this thesis are allowable without special permission, provided that accurate acknowledgment of source is made. Requests for permission for extended quotation from or reproduction of this manuscript in whole or in part may be granted by the head of the major department or the Dean of the Graduate College when in his judgment the proposed use of the material is in the interests of scholarship. In all other instances, however, permission must be obtained from the author.
deposited in the University Library to be made available to borrowers
SIGNED:
APPROVAL BY THESIS DIRECTOR
This thesis has been approved- on the date shown below:
ALAN D. RANDOLPH.ALAN D. RANDOLPH/. Professor of Chemical Engineering
Date
ACKNOWLEDGMENTS
I am deeply indebted to my advisor. Dr. Alan D„ Randolph, with
out whose assistance this thesis would not have been possible. I would
also like to extend my thanks to the faculty of the Chemical Engineering
Department for guidance in various areas related to the research work.
iii
TABLE OF CONTENTS
Page
LIST OF ILLUSTRATIONS „ . vi
LIST OF TABLES . . . . . . . . . . . .. . . . . . . . . . . . . . viii
ABSTRACT . . . . . . . . . . . . . . . . . . . . . . . . . . . . . ix
CHAPTER
I. INTRODUCTION ........... 1
II. SUGAR CRYSTALLIZATION . . . . . . „ . . . . . . . ... . . . 3
Raw Sugar Production . . . . . . . . . . . . . . . . . 3Refining of Raw Sugar . . . . . . . . . . . . . . . . . 7
III. CURRENT CONTINUOUS CRYSTALLIZATION DEVELOPMENTS . . . . . . 9
Scope of Present Study . . . . . . . . . . . . . . . . 12Experimental Studies . . . . . . . . . . . . . . . 13Computer Simulations . . . . . . . . . . . . . . . 15
IV. THEORETICAL CONSIDERATIONS . . . . . . . . . . . .... . . . 17
MSMPR Technique . . . . . . . . . . . . . . . . . . . . 17Sucrose Growth and Nucleation Kinetics . . . . . . . . 20
Types of Nucleation . . . . . . . . . . . . . . . . 21Growth Rate Correlation . . . . . . . . . . . . . . 23
Salting-out Crystallization . . . . . . . . . . . . . . 23Crystallization Modifiers (Surfactants) . . . . . . . . 26
V. EXPERIMENTATION . . . . . . . . . . . . . . . . . . . . . . 28
Apparatus . . . . . . . . . , „ . . . . . . . . . „ . . 29Coulter Counter . . „ . . . . „ . . . . . „ . . . „ 34Start-up Procedure . . . . . . . . . . . . . . . . 35Sampling and Particle Counts . . . . . . . . . . . 39
Experimental Runs . . . . . . . . . . . . .............. 42Description of Individual Experiments . . . . . . . 43Calibration of the Coulter Counter . . . . . . . . 45
Experimental Data .................. 46
iv
VTABLE OF CONTENTS (Continued)
: :
VI. ANALYSIS OF EXPERIMENTAL RESULTS . . . . . . . ... . . . . . 56 '
Statistical Results . . o o o o . o . o o o o . o o o . 56 Results of D-Series Runs , , , , « . „ . „ , , , , „ . * 66Crys tal Hab3. t . © © © © © © © © © © © © © © © © © © © © 67Kinetics Correlation © © © © © © © © © © © © © © © » © 0 70
VII© PROCESS CALCULATIONS © © © © © © © © © © © © © © © © © © © © 75
Nucleator/Ripener/F©C© Crystallizer © © 0 © , © © © © © 75Solvent Recovery © © © © © © © © © © © . © © .© © © © © 78 Retention Time Effects © © © © « © © © © © © © © © © 78
VIII© SUMMARY © © © © © © © © © © © © © © © © © © © © © © © © © © 82
IX© CONCLUSIONS © © © © © © © © © © © © © © © © © © © © © © © © 83
X© RECOMMENDATIONS © © © © © © © © © © © © © © © © © © © © © © 85
APPENDIX : SOLUBILITY DATA © © © © © © © © © © © © © © © © © © © © 87
NOMENCLATURE . ©.. © © © © © © © © © © © © © © © © © © © © © © © © © © 88LIST OF REFERENCES © © © © © © © © © © © © © © © © © © © © © © © © 90
LIST OF ILLUSTRATIONS
Figure ' Page. 1 Sucrose Molecule . . ... ... ... . ... ............ 1
2 MSMPR Crysfcallizer o . . . . . 17
3 Schematic Flow Diagram of Crystallizer System . . . » . . 32
4 Main Crystallizer Unit (Front View) . . . . . „ . . ... . . 33
5 Crystallization System (Side View) . . . . . . . . . . . . 33
6 Coulter Counter and Sampling Stand . . . . . . . . . . . . 36
7 Population Density vs. Crystal Size, Run 1-A . . . .... . . 49
8 Population Density vs. Crystal Size, Run 2-B . . . . . . . 50
9 Population Density vs. Crystal Size, Run 4-B . . . . . . . 51
10 Population Density vs. Crystal Size, Run 1-D . . . . . „ . 52
11 Population Density vs. Crystal Size, Run 7-B . . . . . . . 53
12 Population Density vs. Crystal Size, Run 8-B . . . . . . . 54
13 Calculated Yield vs. Experimental Yield . . . . . . . . 55
14 Microphotograph of Run 6-B Product . . . . . . . . . . . . 6 8
15 Microphotograph of Run 8-B Product . . . . . . . . . . . . 68
16 Microphotograph of Run 3-D Ripened Product No. 1 . . . . 69
17 Microphotograph of Run 3-D Ripened Product No. 2 . . . . . 69
18 Microphotograph of Run 1-D Agglomerates . . . . . . . . . 71
19 Microphotograph of Run 1-D Agglomerate . . . . . . . . . . . 71
20 Correlation Plot of Predicted vs. Actual NucleationRates . . . . . . . . . . . . . . . . . . . . . . . . . . 73
vi
viiLIST OF ILLUSTRATIONS (Continued)
Figure . Page
21 Nucleator CSD and Ripener CSD for Two Production Rates . „ 76
22 Ripener CSD and F.C. Crystallizer CSD for Two .Production Rates . . . . . „ „ „ „ , „ . „ „ „ „ „ „ „ „ „ 79
23 Ripener CSD and F.C, Crystallizer CSD with Growth Rate Dependency on Size . . . . . . . . . . . . . . . . . . „ . . 80
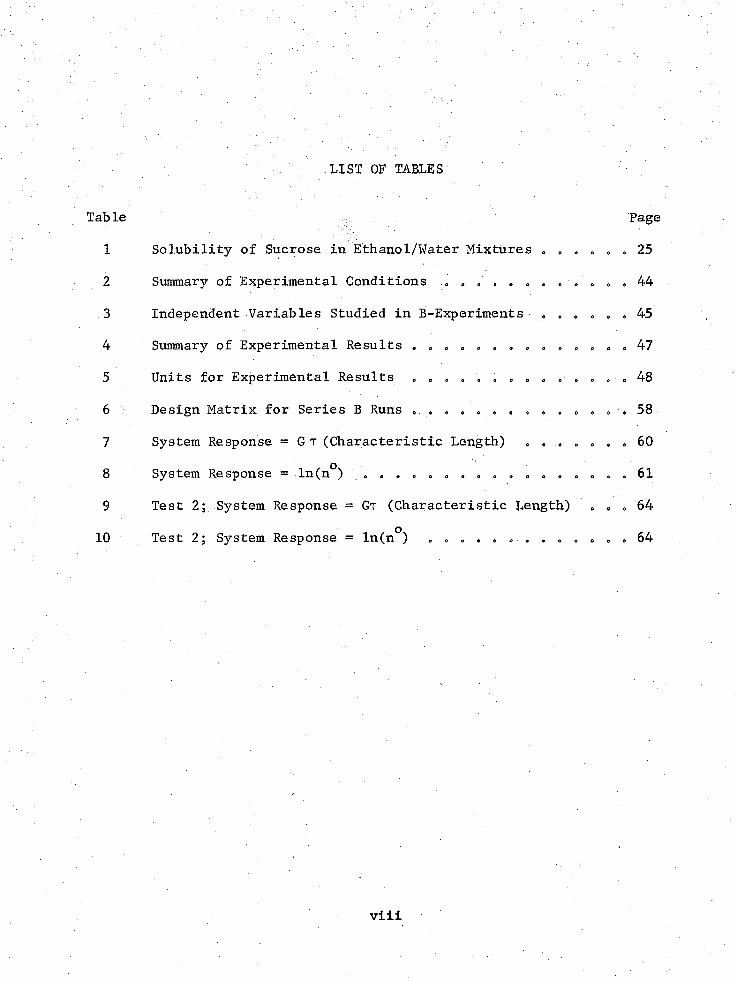
LIST OF TABLES
Table Page1 Solubility of Sucrose in Ethanol/Water Mixtures . . „ . „ . 25
2 Summary of Experimental Conditions .0 o 44
3 Independent Variables Studied in B-Experiments 0 . » o 0 0 45
4 Summary of Experimental Results . . • . . . . • • • * • • • 4 7
5 Units for Experimental Results • 0 • • . . • • . . • . ■ • 48
6 Design Matrix for Series B Runs , o e •' o -• 58 ■
7 System Response = G T (Characteristic Length) 0 • « 60
8 System Response = ln(n ) . o « o . o o o . o 0 .o. . . • • • • 61
9 Test 2; System Response = Gt (Characteristic Length) , . . 64
10 Test 2; System Response = ln(n°) 64
viii
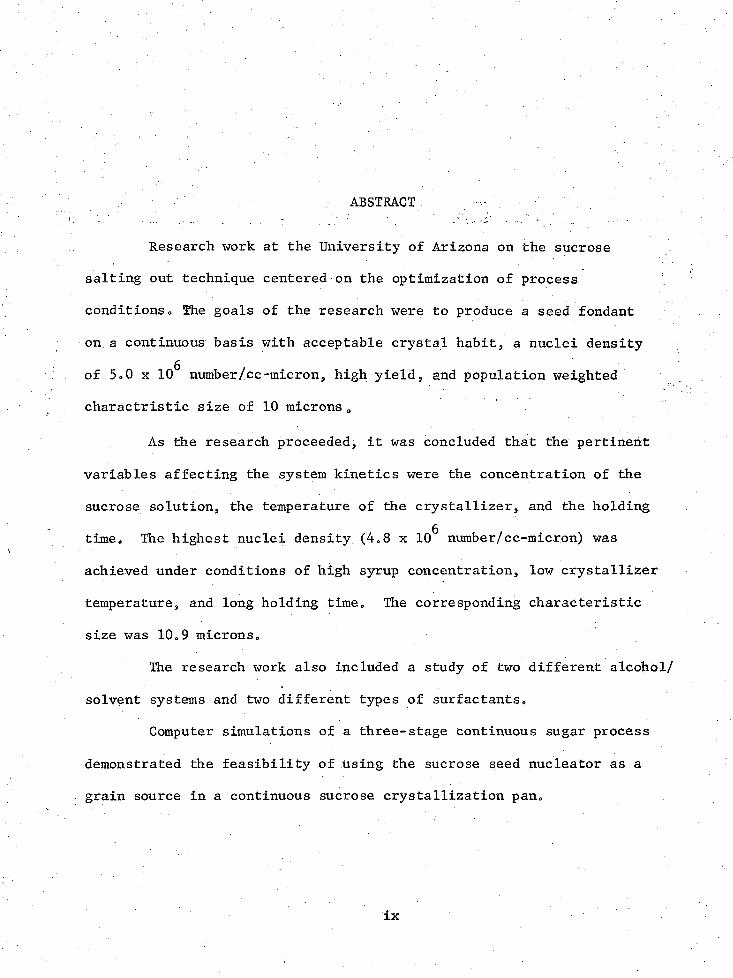
ABSTRACT
Research work at the University of Arizona on the sucrose
salting out technique centered on the optimization of process
conditionso The goals of the research were to produce a seed fondant
on a continuous basis with acceptable crystal habit, a nuclei density
of 5*0 x 10^ number/cc-micron, high yield, and population weighted
charactristic size of 10 microns0
As the research proceeded, it was concluded that the pertinent
variables affecting the system kinetics were the concentration of the
sucrose solution, the temperature of the crystallizer, and the holding
time0 The highest nuclei density (4,8 x 10^ number/cc-micron) was
achieved under conditions of high syrup concentration, low crystallizer
temperature, and long holding time. The corresponding characteristic
size was 10.9 microns.
The research work also included a study of two different alcohol/
solvent systems and two different types of surfactants.
Computer simulations of a three-stage continuous sugar process
demonstrated the feasibility of using the sucrose seed nucleator as a
grain source in a continuous sucrose crystallization pan.
CHAPTER I
INTRODUCTION
Sugar is the largest tonnage organic chemical produced in pure
form. It has been known to man for at least 3,000 years. Cane sugar
most likely originated in India, probably from the banks of the Ganges
River. We cannot be absolutely certain of this because today sugar cane
is not found anywhere in its wild state. A more complete history of
cane sugar is presented by Geerligs (1912).
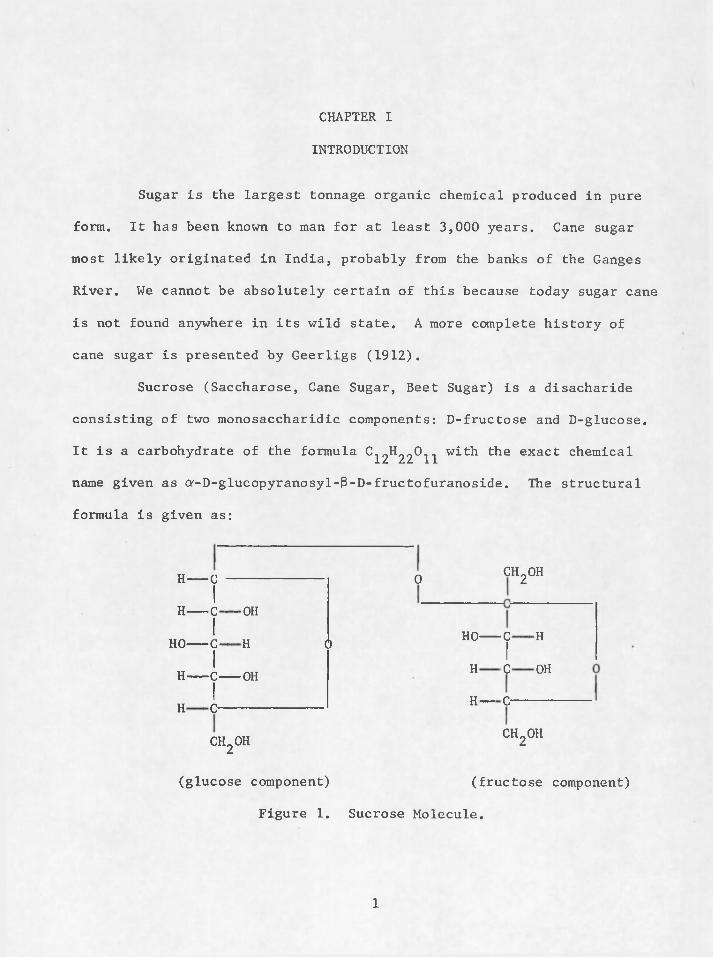
Sucrose (Saccharose, Cane Sugar, Beet Sugar) is a disacharide
consisting of two monosaccharidic components: D-fructose and D-glucose.
It is a carbohydrate of the formula ^ 2^ 2 2 ^ 1 1 with the exact chemical
name given as Q'-D-glucopyranosyl-f3-D-fructofuranoside. The structural
formula is given as:
H C -----I
H C " " OHI
HO C ■'■■■■ HI
H C OHI
H 1 C------
0 CH20H
0 HO C " 1 HI
H ' C ■ ■ OH
H C------
CH20H
(glucose component)
c h 2o h
(fructose component)
Figure 1. Sucrose Molecule.
1
In plants, sugar is formed by the photosynthetic assimilation
process which is essentially the conversion of water and carbon dioxide
into carbohydrateSo Sucrose is the most widespread sugar present in
the sap of plants and the sap of sugar cane contains more than 17 per
cent of sucroseo Hirschmuller (1953) presents a good description of
the sucrose molecule*
The increase of sugar consumption per capita since 1900 reflects
the growth and progress in methods of production and reduction in price0
It also reflects the increased appreciation of the benefits of sugar in
the diet by the consumer* Although there has been much research in the
past on the production of sugar there are still areas that if improved
would substantially benefit the economics of sugar production or would
improve the quality of the product itself*
Sugar represents one of the cheapest forms of all foods* It is
not only one of the most concentrated of all energy foods, but its
source plants are among the most productive of all agricultural plants*
Thus, in a world of exponentially increasing population it is desirable
to increase the consumption of sugar through technology*
CHAPTER II
SUGAR CRYSTALLIZATION
Much of the cane throughout the world is processed to final prod
ucts in factories which use standard procedures. Chemical processing
of sugar by man is concerned with separating the sucrose from the various
materials with which it is associated in the plant. Sugar is purified
by the process of crystallization which could be considered one of the
oldest chemical engineering unit operations. The literature is extensive
on research efforts associated with refining sugar and the processes pro
ducing raw sugar. Jenkins (1966) presents a fairly concise introduction
to cane sugar technology up to the production of raw sugar. Another
excellent source on the technology of crystallization of granulated
sugars is written by Alewijn and Honig (1959).
Grinding of the sugar cane is the first step in the production
of raw sugar from cane. The subsequent refining of raw sugar is gener
ally a separate process. This dual nature in the industry leads to a
natural division between raw. and refined sugar.
Raw Sugar Production
The harvested cane is taken to the factory where the first step
consists of removing the sugar juices from the cells of the plant. The
efficiency of the standard milling process as gauged by the extraction
of sucrose and soluble impurities is usually about 95 percent. The non-
soluble material taken out with the extracted juice is a cblloidal
,
. 4
impurity and presents problems in subsequent processing. Raw sugar
mills are rated by their daily grinding capacity. An average size mill
processes from 2,000 to 3,000 tons of cane a day.
The juice coming from the grinding mills is strained to remove
dirt and is then clarified. Such purification is necessary in order to
reduce the content of nonsucrose impurities which could interfere with
the subsequent crystallization. The efficiency of the clarification is
tested quantitatively by the change in purity which is characterized by
boiling and freezing point data. Qualitatively, this is reflected in
the color, consistency, and crystal habit of the product obtained. Clar
ification is affected by heat and lime; however, other agents are added
to supplement their action. The coagulated impurities are then filtered
out of the system; what remains is raw sugar usually known as "thin
juice." This material contains about 85% water. In this mixture
there are approximately 630 pounds of water for every 100 pounds of
sucrose in addition to impurities.
It is next necessary to remove the large quantities of water in
the thin juice to extract the sugar. The first step is evaporation to
remove most of the excess water in which the thin juice is converted
to a heavy syrup. This process is controlled to stop short of satura
tion. Multiple effect evaporators are used to achieve efficient evapora
tion, thus minimizing steam costs.
The next step is termed "sugar boiling." In this step, concen
tration is carried further so that crystals form and are grown under
controlled conditions to the desired size. This "sugar boiling" process
is carried out in stages, the final products being raw sugar and molasses.
Generally, there are at least three stages,. After the boiling process,
the liquor from the first stage is separated from the slurry and is fed
to the next pan in line. In turn, the mother liquor from the second pan
forms the feed to the third stage. The small amount of syrup remaining
in the low-end "strikes," i.e., in the crystal slurries in the second
and third pans, is run into the first stage where further crystallization
takes place without additional removal of water. The massecuite (mixture
of crystals and syrup) is cooled at this station in order to accelerate
the final crystallization from the solution. Thus, "sugar boiling" in
volves boiling a viscous liquid containing crystals in suspension.
Evaporators of a special design, known as vacuum pans, are used in single-
effect. Two designs of these single-effect evaporators are common-coil
and calandria, with the addition of forced circulation becoming more and
more common to either type. The work of the pan, which constitutes the
boiling of sugar manufacture, is one of the most important and strategic
steps in the entire sugar process. According to Van Hook (1949), the
sugar boiler is the true artisan of the sugarhouse, but scientific
knowledge of the boiling operation is reducing this step to one amenable
to exact control and duplication. Although concentration of the
massecuite by evaporation continues in the pan, the major pan function
is the induction of crystal formation and the continued growth thereof.
Thus the entire process of sugar manufacture culminates in the strike in
the pan. Sugar boiling could be considered strategic and critical in
the sense that the juice is at its maximum concentration or minimum

bulk and is most sensitive to degradation and spoiling by improper
'handling. The sugar boiling process commences with syrup from the
multiple effect evaporator at 65 -70 brix; this material is concentrated
to form crystals and grow them to the desired size. For maximum capacity,
it is desirable to carry the crystallization at each stage to the maximum
crystal content which can be handled. This means that at the conclusion
of each charge, the material or "massecuite" consists of a suspension of
crystals in a highly concentrated mother liquor or molasses,
A number of profound changes occur in the massecuite as soon as
crystallization starts. The immediate effect is a reduction in concen
tration so that the driving force for crystallization drops immediately,
Tov maintain continued crystallization, there must be a simultaneous
evaporation of water from the solution. During all this time concentra
tion of the noncrystallizing, nonsucrose solutes continues. There is
also the possibility of new nuclei being generated while the established
ones are growing. If uncontrolled, this situation, which is known in the
sugar industry as "false grain,u leads to a wide distribution in sizes
of the final product. Also conglomerates or intergrowth of crystals
already present must be avoided because part of the mother liquor is
then included within the crystal faces where it cannot be removed by
centrifugal force or washing.
The three-step operation of evaporation, sugar boiling and
crystallization, can be considered a semi-continuous process since the
raw juice is concentrated continuously by multiple-effeet evaporation
and the actual crystallization takes place batchwise in the pans.
Refining of Raw Sugar
Raw sugar is refined in a process similar to that used in the
raw sugar mill. Both the raw sugar and refining processes have distinct
similarities; however, refineries are generally characterized by their
large sizes in comparison to raw sugar mills. The refining process con
sists of affination (washing), clarification, decolorizing, crystalliza
tion, and drying and finishing. Crystallization of the sugar is again
accomplished in large vacuum pans. The pans, as in the raw factory, are
usually twelve to sixteen feet in diameter and the boiling procedures
in the two instances are practically identical. However, greater pre
cautions are exercised in the refinery because of the higher quality of
the finished product.
Crystallization consists of three different phases, all requir
ing separate specialized techniques and control. The first phase is the
graining or nucleation, the second is the growth of the crystals to the
required size and finally the last phase is the tying up or equilibra
tion of the syrup to obtain the highest yield of crystallized sugar.
The major product of most refineries is the standard granulated
grade which is classified as a hard, white sugar, as distinguished from
soft sugars which may be anywhere from almost white to deep brown in
color. The objective in the majority of crystallization processes is to
produce individual crystals of regular form, purity, and size. For
example, twinning or agglomeration of the crystal can have adverse
effects upon packing, storing, and shipping characteristics due to
" - . - :: 8 variations in void volumes. Consumers often demand uniform crystal
size distributions due to precedents.
As with raw sugar production , sucrose refining can be considered
a semi-continous process; evaporation of weak syrup is done continuously
followed by batch crystallization. Considerable economy could be
achieved if the crystallization process could be made continous while
still producing high quality crystals of a narrow size distribution.
CHAPTER IIICURRENT CONTINUOUS CRYSTALLIZATION DEVELOPMENTS
The conventional processing of sugar today is characterized by
a semi-continuous operation. From a chemical engineering standpoint,
continuous processing of sugar appears, to have some distinct advantages,
primarily that of reduction of equipment size and energy requirements.
The literature describes some efforts to obtain a workable continuous
process and there are at least two Russian patents and one Dutch patent
associated with continuous processing.
Preliminary announcement of a new continuous sugar crystalliza
tion system was made in 1970 by the Stark-Werkspoor Sugar Company in
the Netherlands. Their system calls for the use of a heater, evapora
tor , and sugar-crystal generator. With the use of automatic controls,
the system is based on crystallization by flash evaporation following
the heating of the syrup to a closely controlled degree of supersatura
tion. The sugar-crystal generator works under vacuum and is equipped
with an internal, positive displacement device for the removal of the
crystals, (Anonymous, 1970).
The Fives Lille Cail Company in France has developed a continu
ous vacuum pan system which is essentially a horizontal cylinder having
an open area at the top and compartment cells in the lower portion
(Silver, 1970). Crystallization is carried out successively on a con
tinuous basis progressively from one cell to the next. The benefits of
this system were determined to be fuel savings, power savings, labor
9 ' '

: iosavings, high quality product, elimination of a source of water pollu
tion, and increased sugar recovery.
The concept of a continuous vacuum crystallizer has also been
described by G. Luce (1970), In this article the author's approach was
to consider discontinuous pan boiling and continuous pan boiling as two
separate processes. The continuous unit had the following character
istics: (a) Continuous flow without the necessity of moving parts,
(b) identical and uniform flow patterns for all crystals, (c) elimina
tion of hydrostatic head effect, (d) uniform rate of crystal growth
within the maximum safe working limits in all stages, (e) eliminations
of conglomerates and false grain resulting from "pulling" the strike
together, (f) improved distribution of feed syrup in all stages of
crystal growth, and (g) consistent flow of materials in the process
from feed to discharge,
Bennett and Petri (1966) have also made pioneer investigations
of continuous sucrose crystallization in a pilot pan. In the early
1960's, the Swenson Evaporator Company began developmental work in the
area of continuous sugar processing. This work led to the development
of a process centered around a forced circulation type crystallizer.
The Swenson unit was operated under various conditions to test the
nucleation and growth kinetics of sugar crystals. Bennett (1969) con
cluded that the growth of sugar follows McCabe's A L law giving growth
rates of 0.007 to 0.090 millimeters per hour at typical pan super
saturations. Bennett also reported expected savings of a continuous
process when compared to a conventional process with respect to
' ' • -: • ' : : : 11utilities and labor plus operational advantages, in. the area of control
and the simplification of equipment items. Pilot plant tests were
carried out by Refined Sugar and Syrups Corporation using the facilities
of the Whiting Corporation’s Swenson Division in Harvey, Illinois. The.
sugar produced contained less conglomerates compared with sugar boiled
in conventional batch type equipment.
Nucleation rates were low in the process; thus, attempts were
made to increase nucleation through mechanical stimulation by suspending
a circular saw blade in the masseciiite and whirling the blade at tip
speeds of five thousand feet per minute. Bennett.reported increased
nucleation using this method; however, the crystals produced from these
nuclei had a poor visual appearance due to the damage caused by the
device.
Sugar solutions support a high degree of supersaturation without
spontaneous nucleation. This phenomena seems to block the development
of a continuous sugar process, unless seeded externally from another
source. Such.external seed is indeed required in any continuous pro
cesses attempted thus far. For example, if sugar seed were produced oh
a continuous basis and were added continuously to the Swenson forced
circulation crystallizer, then the inherent low nucleation levels en
countered in the Swenson process could be overcome. The crystals would
serve as nuclei for further growth. Evidence suggests that seed crystal
with perfect habits produce product crystals with desirable habit.
Seeding is not a new idea in the sugar industry and many pro
cedures use seeding to establish the proper grain centers for growth.

12The disadvantages of conventional seeding according to Van Hook (1959)
are in the availability of seeding stock, the difficulty in preparation
and cost, and in the amounts required0 Typically, seed is produced by
ballmilling off-grade product to chips and pieces in the 0 o 5 - 1 0 micron
size range. This material is usually ground in isopropyl alcohol
solution.
Thus, some research and development has been done in the area of
continuous sucrose crystallization. Progress has been hampered partly
by the lack of the development of theoretical methods for characterizing
and mathematically analyzing nucleation and growth rate phenomena as
well as due to the reluctance of sugar to nucleate spontaneously to any
significant degree. Minimal research has been carried out on the pre
diction of crystal size distributions through simulation techniques as
a function of fluidity, supersaturation, and vaporization rates, al
though the techniques necessary for such a study are at hand.
Scope of Present Study
The objective of this experimental work was to further develope
a method for producing high concentrations of well-formed sugar nuclei
on a continuous basis. Initial research on this process was carried out
by Crawford (1970); the results from his preliminary experimentation
seemed encouraging. The apparatus that Crawford used was a mixed
suspension mixed product removal (MSMPR) crystallizer of approximately
3 liters in volume. He confirmed earlier exploratory work at the
University of Florida by Randolph (1965) that it was possible to "salt-
out" sugar continuously from aqueous solution with low molecular weight
■ : ■ ' . ;. \ ^ ; 134 5alcohols and key tones with resulting nuclei densities of 10 -10 no<,/cc-
\ 4 : ■ /•-.micron. Nucleation rates of over 10 nuclei/cc-minute could also be
achieved. The product produced by "salting out" had a characteristic
single crystal form with exceptional crystal habit and color, provided
that the ethanol to water ratio (mass basis) was maintained around 1.4.
The population weighted mean crystal size of the product was 20-30 :
microns when the crystallizer was maintained at a holding time of approx
imately 50 minutes at ambient temperature. Extending the holding time
of the crystallizer to periods over 1.0 hour had a resultant effect of
reducing the average crystal size without any crystal habit deteriora
tion. Computer simulations carried out by Crawford indicated that seed
ing by the salting out process should overcome the inherently low nuclea
tion rates obtained in continuous forced circulation sugar crystallizefs,
Crawford recommended that further investigation of continuous
sucrose generation in an MSMPR crystallizer include careful control of
temperature so that the effects of temperature on the nucleation rate
could be studied. Another area to be further considered was that of the
effect of surfactants or additives since they often dramatically affect
nucleation rate as well as promote single-crystal growth. It was also
recommended that long periods of operation be studied to insure steady
state conditions and to study fouling.
Experimental Studies
With the above recommendations in mind, the continued research
work that was carried out over a period of nine months was executed as
follows:
141. A laboratory bench-scale salting-out MSMPR crystallizer was
modified and operated to produce sugar crystals from a sucrose/water/
solvent system. The solvent used was either a 50:50 MeOH/IPA mixture or
Vanzol A-l denatured ethanol (100 parts by volume of 190 proof alcohol,
1 part of methol isobutal keytone, 1 part of ethylacetate, 1 part of a
hydrocarbon solvent (Stoddard*s)),
20 Preliminary crystallizer runs were made to debug the system
and to make necessary modifications* A standard run was established
with set conditions to compare with Crawford’s data. Laboratory tech
nique, which is very important, was also developed,
3* Optimization of chosen process conditions was carried out
with the objective of finding conditions which would produce a crystal7size distribution with a nuclei density approaching 10 no,/cc-micron
with a characteristic population-weighted size of 10 microns.
In other words, the primary objective of the research was to
produce a sucrose seed crystal fondant with the salting-out process
having superior single crystal form and with a nuclei population density
of at least 5,0 x 10^ no,/cc-micron, and a population-averaged size
(Gt ) of less than 10 microns. Exploratory runs were executed to map out
regions worthwhile to study in depth. This phase was guided by a
Plackett-Burman, one-level statistical analysis design to elucidate a
likely region in which to carry, out more detailed kinetic studies
(Isaacson, 1970). Independent variables of the salting-out nucleator
that were explored were:
r . ■ '■ . ; . : :''':- : 15(a) System temperature (50C-27°G).
(b) Feed concentration (680-750Brix)„
(c) Solvent type (50:50 MeOH/IPA vs. Vanzol A-l).
(d) Surfactants (Methyfamine HC1 and Fluorocarbon (FC-96),3M Co.).
(e) Holding time (r:1-3 hours).
In short, the objective was to find conditions under which the
growth rate was reduced and the nucleation rate increased, thus produc
ing high population densities of small seed. This seed might then be
used directly in a full-scale process or as a seed source for a footing
crystallizer used to grow the seed to an intermediate size before seed
ing a vacuum pan. Eight exploratory runs were made after the shakedown
runs to study the effects of high and low level values of the aboveovariables upon the dependent variables nuclei density n and the char
acteristic size Gt according to the statistical design. An added con
straint which was verified by microphotographs was that the crystal
habit be of a single-crystal form* The key variables were selected and
evaluated in a further kinetic study in an attempt to optimize the
number and quality of seed produced.
Computer Simulations
The kinetics developed were used in an extensive computer simu
lation of continuous seeded sucrose processes* A computer simulation of
a three stage process comprised of a nucleator (with optimized condi
tions) staged in series to a seed ripener and a forced circulation
continuous crystallizer was implemented to study the feasibility of this

system used as seed source in a continuous crystallizer. Auxiliary
computations were made to determine the feasibility of recovering
solvent from the nucleator by flash evaporation in the ripener.
CHAPTER IV
THEORETICAL CONSIDERATIONS
The theoretical considerations of continuous sucrose crystal
lization can be separated into four categories: MSMPR crystallizer
techniques used to predict CSD, sucrose growth and nucleation kinetics,
salting-out crystallization, and crystallization modifiers (surfactants).
MSMPR Technique
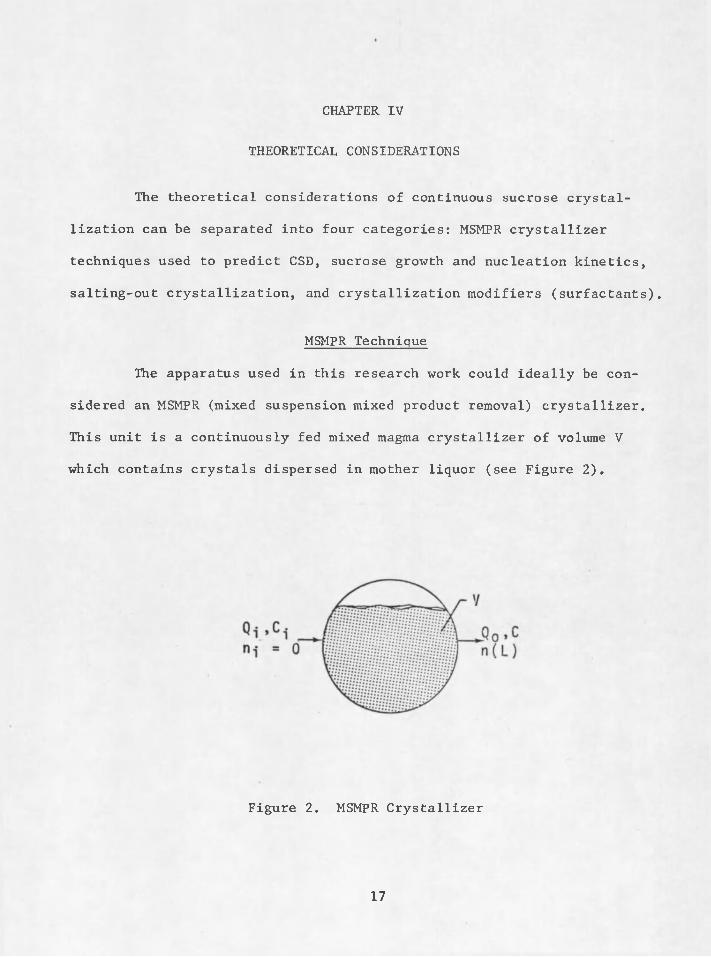
The apparatus used in this research work could ideally be con
sidered an MSMPR (mixed suspension mixed product removal) crystallizer.
This unit is a continuously fed mixed magma crystallizer of volume V
which contains crystals dispersed in mother liquor (see Figure 2).
Figure 2. MSMPR Crystallizer
17
;. • ; 18 It can be assumed that both growth and. nuoleatidh ate taking
place in the crystallizer because of supetsaturation» Supetsaturatinn
in MSMFR systems can be generated by chemical reaction, evaporation,
codling, and in our case, a precipitation or salting Out effedt which
will be described later*. It is required that the feed rate, composition,
and temperature as well as the crystallizer volume and temperature ros
main constant for steady-state operation of the MSMFR crystalliger*
in order to completely describe this crystallization gyatom,
mass, energy, and population balances must be sat up and solved along
acceptable paths provided by the process flows, the kinetics of growth,
and the kinetics of nucleation* Randolph and Larson (1071) present the
crystal population balance in an MSMPR crystallizer and derive the
following equation for the ideal expected number distributions of the
crystal products
n = n°exp(«L/gf) (1)
This expression was also derived by Saeman (19S6), in skis eqnaeion,
n is the populacion density whieh has dimensions of numher/length®0volume. Also, n is defined as the population density of the embryo*
siae crystals as these crystals approach zero sige. The characterizing
dimension of the crystal is given the symbol L and the rate at which
this dimension grows is termed the growth rate G. finally, f is the
drawdown time which is simply the crystallizer volume divided by the
suspension output, i.e., T = V/Q.
' 19
Some of the assumptions that must hold in order that equation
(1) be valid are:
1. McCabe’s AL law (McCabe and Smith, 1967), i.e., G 4 f (L) •
2. The feed to the crystallizer contains no seed (n_ = 0 ) .
3. The population density of the crystallizer product is the
same inside the crystallizer, i.e., no classification and perfect mixing.
4. The suspension volume remains constant in time.
The nucleation rate B° is related to the nuclei density and the
growth rate by the following equation:
(2)B° = n°G
Nuclei densities can be determined for various experimental runs by-
plotting ln(n) vSo L and determining the intercept at L = 0 o The
population-weighted characteristic size (Gt) can be found from the slopebof the line since r is known and then B is obtained from equation (2).
Randolph and Larson (1971) also relate the growth rate and the
particle solids concentration for the MSMPR case:
M t = 6kv pn°(GT) 4 (3)
Here, M̂ _ is the solids concentration, k^ is the crystal shape factor
which relates the cube of the characteristic size dimension of the
particle to its volume, and p is the crystal density.
Thus, equations (1) through (3) can be used to analyze the CSD
of the MSMPR crystallizer. It should be noted that each parameter of
equation (1) can be related to the kinetics of the system and the imposed
system constraints. The growth rate G is determined by the kinetics of
growth and T, the holding time9 which is known in any operating system*
These two quantities9 however, cannot be fixed independently. Generally
one fixes the mass and energy flows and the kinetics of growth and
nucleation inherent to the crystal system determine the growth rate
which exists. The adjustable controls in the sucrose system include the
syrup feed concentration, the rate of energy input or removal, and the
feed rate.
CSD analysis using the MSMPR technique has great utility in the
investigation and understanding of crystallizers. According to Randolph
(1970), the two goals of researchers who work on the CSD problem are to
be able to understand CSD so as to analyze and modify what a particular
operating crystallizer can and cannot do in the way.of producing accept
able particle size, and to be able to conceive an a priori CSD design
in new units before they are operating.
Sucrose Growth and Nucleation Kinetics
Van.Hook (1959) in his chapter of Honig has written extensively
on the mechanisms of sucrose nucleation and growth. He summarizes that
the rate of adjustment of a metastable, homogeneous melt or solution is
prescribed by the consecutive acts of nuclei formation and growth. The
procreating nuclei: (a) may already exist latently in the melt or solu
tion and merely require activation by cooling below the transition
point; (b) may be generated spontaneously as the equilibrium point is
exceeded; (c) may consist of fortuitous contaminating particle; or
(d) may be substances added as seeds which stimulate the change to the
stable configuration of the system.

21Types of Nucleation
Homogeneous nucleation is the formation of new crystals from the
liquid phase as a result of supersaturation alone. Van Hook (1959)
applies the theory of homogeneous nucleation to sugar solutions, and
Here, o' is the interfacial tension, M the molecular weight, N is
Avogadros ’ number, R the gas constant, T the temperature and p the
density of the separating phase. The degree of supersaturation S is
defined as the concentration in amount of solute per fixed amount of
solvent divided by the concentration of a saturated solution at the same
temperature. From S = 1,0 to 1.3 it has been observed that sugar
crystals do not form spontaneously under ordinary conditions, but that
adding of seed will cause the crystals to grow until the syrup is ex
hausted. Essentially only growth occurs for supersaturations of 1.0 to
1.2 while from 1.2 to 1.3 the growing crystals form additional growth
centers or "false grain," The theory concurs with the general observa
tion that homogeneous nucleation is a more difficult matter than sub
sequent growth.
Heterogeneous nucleation refers to new particle formation
resulting from the presence of foreign insoluble material. The foreign
indicates that the well-known homogeneous nucleation rate equation
accounts fairly well for the behavior of sugar solutions. This equation
is given as:
33° =B> e x -16ttM 2ct3N .. (4)
material.provides sites where crystals can form because of reduced
surface energy requirements.
A third type of nucleation applicable to sucrose systems is that
pf secondary nucleation. This refers to nucleation induced by the
presence of suspended crystals of the solute. This mechanism is related
to the phenomena of false graining. Secondary nucleation is to some
degree similar to heterogeneous nucleation and is also called ancillary
nucleation. The actual mechanism of secondary nucleation is still as
yet poorly understood. Much recent effort has been aimed at determining
the mechanisms and kinetics of this phenomena. The. reason for this is
that in most cases of industrial application, the production of crystals
from batch or continuous crystallization is characterized primarily by
secondary nucleation.
In the sugar/water/solvent system, secondary nucleation is
probably predominately due to collision breeding. Nuclei result from
the collision of seed crystals with solid surfaces, which in the case of
a stirred crystallizer may be other crystals, impeller blades, or
crystallizer surfaces.
According to Youngquist and Randolph (1972), no fundamental •
theory for prediction or correlation of secondary nucleation exists;
most experimental data have been obtained using MSMPR crystallizers.
Data are frequently correlated using a power-law model of the form:
B° = k ^ s ^ J (5)
owhere B is the nucleation rate., s is the super saturation, and M is. t
the solids concentration of the slurry0 -
The mechanism of secondary nucleation (or self-nucleation) has
also been studied by Clontz and McCabe (1969) and by Randolph and Cise
(1972)o Their findings^ as pointed out before, seem to indicate that
contact secondary nucleation plays an important role in operating
crystallizerso This effect is very important in the understanding of
the nucleation phenomena* Part of the research in this thesis was
aimed at correlating the data according to equation (5 )*
Growth Rate Correlation
One useful correlation that was used during the course of the
computer simulations was the relationship between crystal growth rate
and supersaturation. The following linear equation was derived using
the data that Bennett (1969) presented:
S = (G +5*36)/(4*66) (6 )
where S is the coefficient of supersaturation and G is the growth rate
in microns per minute*
Salting-out Crystallization
In this study, advantage was taken of the low solubility of
sucrose in aqueous alcohol solutions to affect the crystallization of
sucrose* Sucrose precipitated in this manner is of extremely small
size and of high purity* Purest sucrose for exact scientific investiga
tions is prepared by redissolving the best commercial sugar in water and
affecting precipitation with absolute ethyl alcohol*
' • ' 24Research in the area of preparing seed slurry, by the salting-out, ,
method for sugar boiling has been carried out by Gupta and Agarwal
(1968). The most recent research effort on the salting-out of sucrose
was conducted by Kelly and Keng (1972). In their work aqueous sucrose
(58.5% wt) solution was dispersed (2-10 volume %) in EtOH or Me
Cellosolve to prepare microcrystal nuclei for use as seed nuclei in
sugar crystallization. The high EtOH/HgO ratio used in this work would
appear to make this technique impractical on a commercial scale.
Crawford (1970) also studied the phenomena of salting-out
crystallization to precipitate sucrose from a sugar/water/alcohol system
in an MSMPR crystallizer as previously described.
Sucrose has the property of being very soluble in water as well
as slightly hygroscopic. In aqueous solution, sucrose molecules are
hydrated by not less than four molecules of water. When alcohol is
added to this system, these molecules displace one or more of the four
water molecules surrounding the sucrose, thereby forcing a decreased
solubility of sucrose in the mixture and thus affecting precipitation.
Although salting-out is employed industrially, relatively few
published data are available regarding its use in crystallization
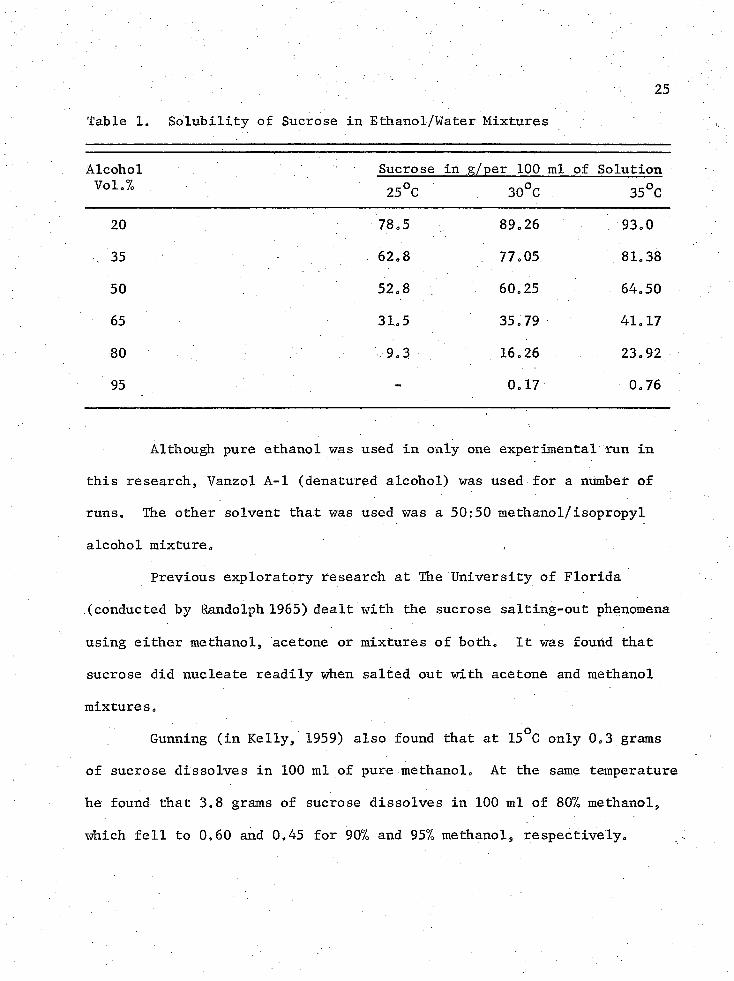
operations. Kelly (1959) presents some data on the solubility of sucrose
at various temperatures; these data are shown in Table 1.
From the data, one can see that sucrose is sparingly soluble in
ethanol. The 2:1 weight alcohol/water mixtures used in this study were
approximately 70% (volume) alcohol.
25
Table 1. Solubility of Sucrose in Ethanol/Water Mixtures
Alcohol Sucrose in g/per 1 0 0 ml of SolutionVol.% . 25 °C 30°C 35 °C
2 0 78.5 89.26 93.0
35 62.8 77.05 81.38
50 52.8 60.25 64.50
65 31.5 35.79 41.17
80 9.3 - . 16.26 23.92
95 - 0.17 0.76
Although pure ethanol was used in only one experimental run in
this research, Vanzol A-l (denatured alcohol) was used for a number of
runs. The other solvent that was used was a 50:50 methanol/isopropyl
alcohol mixtureo ,
Previous exploratory research at The University of Florida
(conducted by Randolph 1965) dealt with the sucrose salting-out phenomena
using either methanol, acetone or mixtures of both. It was found that
sucrose did nucleate readily when salted out with acetone and methanol
mixtures.
Gunning (in Kelly, 1959) also found that at 15°C only 0,3 grams
of sucrose dissolves in 100 ml of pure methanol. At the same temperature
he found that 3.8 grams of sucrose dissolves in 100 ml of 80% methanol,
which fell to 0.60 and 0.45 for 90% and 95% methanol, respectively.
' : 26
Crystallization Modifiers (Surfactants)
Randolph and Larson (1971) have pointed out that trace chemical
additives are often used to suppress or promote nucleation and/or
promote better crystal growth and habit. Such additives are usually
considered proprietary information by industrial companies and therefore
few published data exist on this subject. It was also pointed out that
additives are usually quite specific in their effect on nucleation.
Surface active agents have been known to inhibit3 rather than accelerate?
nucleation in many systems.
Shor and Larson (in Randolph and Larson, 1971) present a
mechanism for the effects of surfactants upon the system kinetics in
an MSMPR crystallizer. Their work consisted in measuring the affects
of three surface-active agents: methylamine hydrochloride, dodecylamine
hydrochloride, and a fluorocarbon (FC-98, 3M Company) upon the nuclea
tion and growth rates in a KNO^ system. Their data showed that
nucleation rate increases and the growth rate decreases with increasing
surfactant concentration. It was suggested that the surface active
agent was absorbed on the surface of the KNO^ crystal and that this was
the primary factor which caused the system kinetics to change. For this
reason, methylamine hydrochloride (CH^NH^HCl) and fluorocarbon were
selected for study with the sucrose system.
Other types of surfactants that affect crystal size distribution
of the sucrose system are discussed by Van Hook (1959). It was pointed
out that most impurities impede the crystallization velocity of sucrose
(growth rate). If an additive (e.g., an impurity or an electrolyte)
27can be found that will slow down the growth rate of the sucrose system,
and if this surfactant can be readily dissolved in aqueous-alcohol
mixtures, then a smaller crystal size in the sucrose seed nucleator may
be achieved* This is due to the fact that if growth rate is reduced,
the characteristic size of the CSD is also reduced. However, one must
also consider the toxic effects of additives if the crystalline product
is to be used for food purposes.
Nicol and Former (1972) have recently studied the effects of
lysine and glycine on the nucleation and crystallization of sucrose.
They found that the nucleation rate of sucrose was increased by lycine
because the impurity acted as a center for heterogeneous primary
nucleation.
Crawford (1970) tested the effect of the surfactant Aliquat 26
(which is Trimethyl Tallow Ammonium Chloride with some unsaturation
present in the alkyl chain) on the sucrose CSD. It was suggested that
the surfactant may have changed the system kinetics but no conclusive
evidence was given.
CHAPTER VEXPERIMENTATION
Exploratory sucrose research at The University of Florida by
Randolph(1965)was done with a continuous stirred tank crystallizer at room
temperature3 fed with near-saturated sucrose feed syrup» Mixtures of
methanol and acetone were used to affect salting-out conditions. It was
concluded from the work that a direct salting-out process for the contin
uous crystallization of sucrose was not attractive due to extreme con
glomerate habit3 occlusions of solvent in the crystals9 and the large
energy requirement necessary to recover solvent from mother liquor. It
was found3 however3 that if the process was carried out in a region of
low solvent addition, high nucleation with slow growth occurred to
produce a fine distribution of well-formed crystals. It was recognized
because of their good habit that such crystals would have potential as
a seed source in a conventional sugar boiler operated in a batch or
continuous mode.
Research to characterize the size and yield of these fine-sized
seeds to advance the idea of the nucleator as a grain source was carried
out by Crawford (1970) at The University of Arizona. His apparatus was
an MSMPR crystallizer with a capacity of around 3 liters. It was de
termined that the nucleation rates produced by salting-out with a 2 / 1
volume ratio of methanol/acetone were high and yield was of the order of
0.4 grams of crystals per cc of mother liquor. Crawford later assembled
28
V ; ' 29data on the sugar/water/ethanol system9 obtaining yields between 0 « 2
4 5and 0,3 g/cc with nucleation rates in the order of 10 to 10 number/
cubic centimeter-minute. These crystals produced by the salting-out
method were of acceptable crystal habit provided that the ethanol to
water mass ratio was maintained around 1,4,
Apparatus
The MSMPR crystallizer used in this research work was constructed
from a 10 liter capacity polyethylene tank, A combination draft tube/
baffle/cooling system was constructed and mounted in the crystallizer,
This system was a hollow stainless steel coaxial cylinder with baffles
welded on the outside of the cylinder so as to conform to the shape of
the crystallizer. The baffle system extended about three-quarters of
the height of the overall crystallizer. Cooling or heating fluid
circulated through the hollow draft tube which then served to develop a
torroidal mixing pattern in the vessel.
The cooling unit that was used to obtain high and low tempera
ture conditions (27°C vs, 5°C) was a model #2095 Refrigerated and Heated
Bath and Circulator manufactured by Forma Scientific, Inc, This unit
was connected directly to the baffle-cooling system through 3 / 8 inch
polyethylene tubing.
The impeller agitator used to mix the crystal magma was driven
by a type #60 stirrer built by the Heidolph Electro Co, A 3-bladed
impeller was used which was approximately 3 inches in diameter and was
seated through the baffle system into a mounting that was centered in
' / - ' - 30the bottom of the crystallizer0 The agitator was maintained at 1100
revolutions per minute during a crystallizer run.
An Eastern Industries U-17 (1/4-H.P., 1725 R,P.M,) circulation
pump was mounted directly on the side of the crystallizer about five
inches from the bottom, , Tygon plastic tubing (1/2 inch I,D,) was
connected to the discharge side of the pump and this was fed to a glass
tee connection through which one end circulated back to the bottom of
the crystallizer and the other end led to a Research Control Precision ..
air-to-close valve which led to the drain, A 3-way tee connection was
also placed on the downstream side of the valve so that a stream of
water was allowed to flow continuously through the discharge line to
prevent plugging of this 3/8-inch tygon tubing line.
The only modification to the circulation system, which is later
described in detail, was the outlet connection on the circulation pump
which plugged during the initial runs.
The level of the crystallizer was maintained at 8 liters by the
use of an automatic Matheson Lab Stat Controller. This unit operated by
sensing changes in the dielectric strength of a 1/4-inch sealed glass
probe inserted through the top of the crystallizer and immersed into the
liquid about 1/2-inch. As the liquid moved up the side of the probe,
the change in the dielectric strength of the probe caused the controller
to activate a solenoid which was connected to the air-valve. When the
solenoid was energized, the air pressure on the valve was released,
thus discharging about 150 milliliters of the crystal magma.
V ' 31The sucrose solution (6 8 ° or 75°brix) and the solvent (either
Vanzol A-1 or 50% MeOH/50% IPA) were fed to the crystallizer by a stain
less steel Micro Bellows pump manufactured by the Research Appliance
Company. Both bellows were 1/2-inch I.D. and operated 180 degrees out
of phase with each other. The feedlines from the supply tanks were
3/8-inch polyethylene plastic tubing. Actual delivery rates through the
bellows pump ranged from 18 to 70 milliliters per minute.
Both polyethylene storage tanks had an 11 gallon capacity, and
were graduated in gallons to #id in feed preparation. A steam coil was
mounted inside the sucrose tank which regulated feed temperature via a2"Therm-o-watch" controller manufactured by the I R Company. Feed
sucrose was continuously mixed with a 1/10-HP, 2-R Lab Agitator, manu
factured by the Bench Scale Equipment Company, to minimize formation of
crystals on the liquid surface. Feed syrup was maintained around 170°F;
there may have been some inversion occurring at this temperature.
A heating tape was wrapped around the stainless steel valve on
the sucrose bellows pump to prevent fouling inside the bellows.
Regulation of the sucrose flow rate presented operational
difficulties during the course of the research. A method for eliminat
ing this problem is described in the next section.
A schematic flow diagram for the crystallizer system is shown
in Figure 3. Photographs of the crystallizer and the entire crystal
lizer system are shown in Figures 4 and 5.
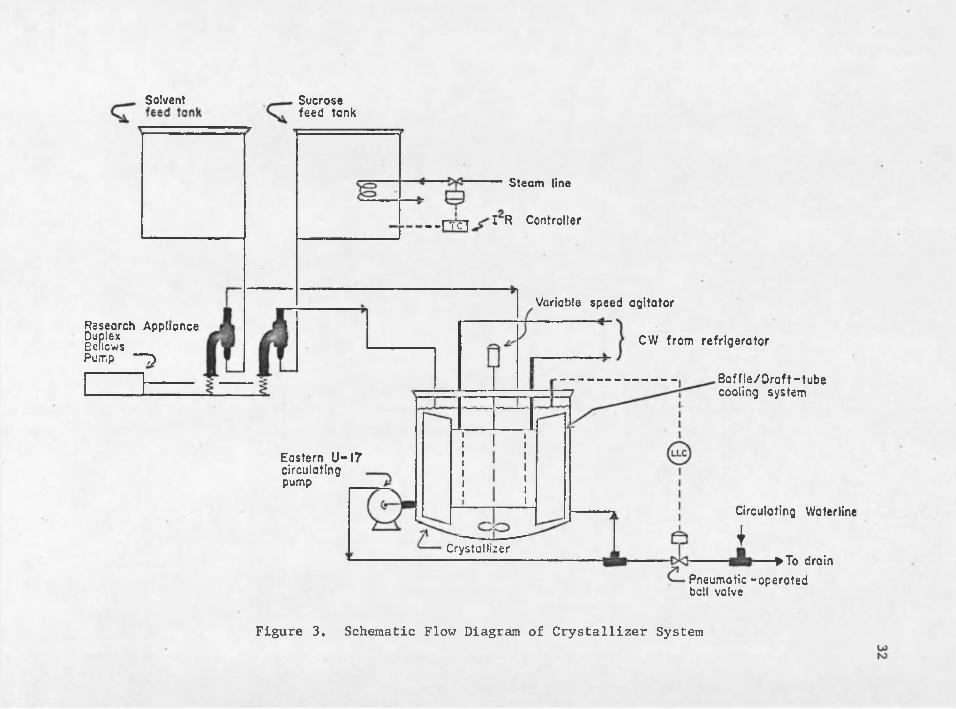
So lv en t S u c r o s e f e e d tonk
S t e a m line
I R Controller— -FtcI
R e se a r c h A p p l ia n c eDuplex Eciicws Pum p — 3
E a ste r n U - 17 c ircu la t in g pump
Crysta ll izer
Variable s p e e d a g i ta to r
CW fr o m r e f r ig e r a to r
B a f f l e / D r a f t - t u b e co o l in g s y s t e m
Circulating Waterline
4 ►To drain
P n e u m a t ic - o p e r a t e d ball v a lve
Figure 3. Schematic Flow Diagram of Crystallizer System
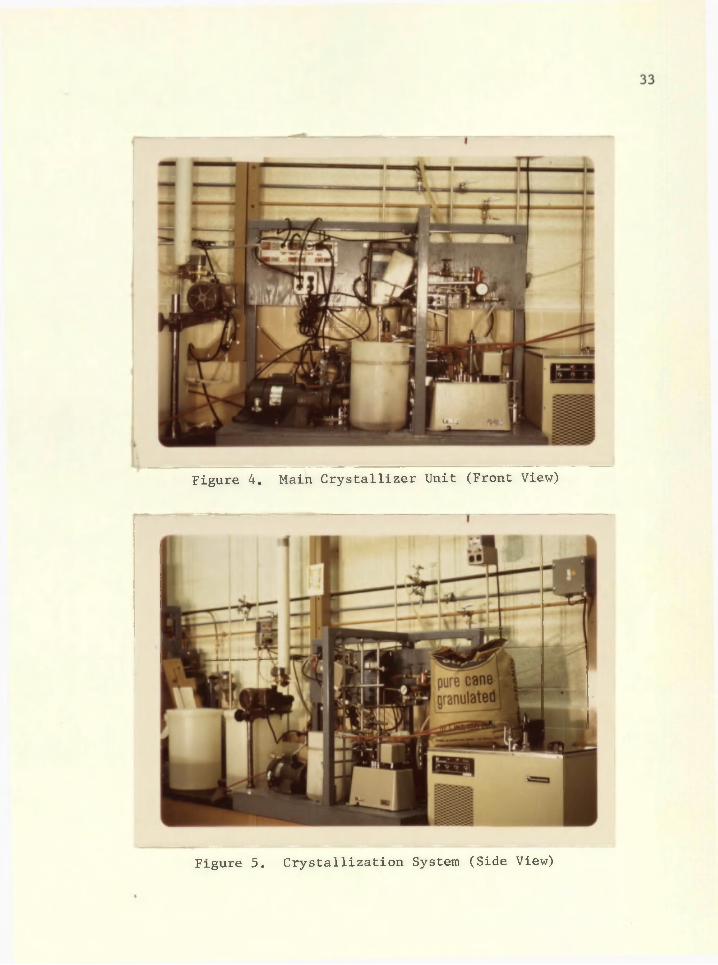
Figure 4. Main Crystallizer Unit (Front View)
Figure 5. Crystallization System (Side View)

Coulter Counter
Particle distributions were obtained with a sixteen channel
particle size distribution, analyzer, the Coulter Model "T" Particle
Counter. This counter is capable of analyzing a particulate sample
within twenty seconds. .The unit is manufactured by the Coulter
Electronics Industrial Division, a division of Coulter Electronics, Inc.
The unit represents the state-of-the-art in electronic particle counting
and sizing. •
The Coulter Counter works on the following principles.
Particles, suspended in electrolyte, can be sized and counted by passing
them through a specific path of current flow for some length of time. A
tube, containing an aperture of known dimensions is immersed in a con
ductive electrolytic solution which contains the sample to be counted.
Electrodes on the inside and on the outside of the tube provide the path
of current flow. As particles pass through the aperture and displace
electrolyte, resistance in the path of current flow changes which in
turn changes the current. The magnitude of the change is directly pro
portional to the volumetric size of the particle. The number of current
pulses within a specific sample is proportional to the number of
particles within the suspension.
Different apertures are used with the Coulter Counter. Currently
the range extends from a minimum size of 30 microns to a maximum of 560.
The work associated with this thesis was conducted with a 280 micron
aperture tube.
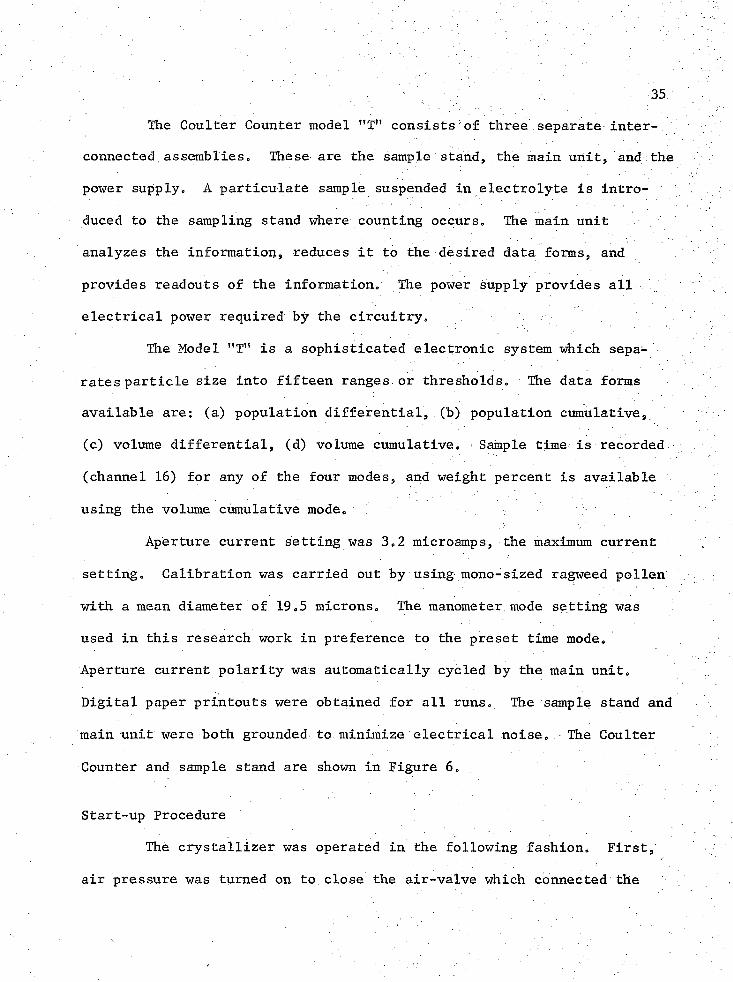
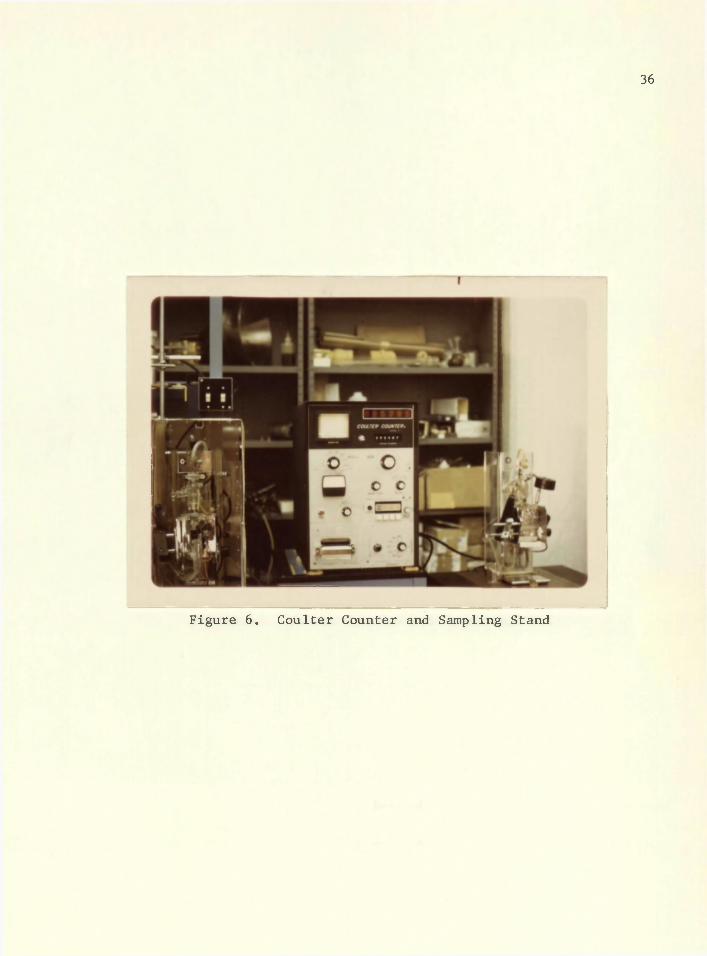
■ ■ ■ ' ■ : V , -The Coulter Counter model "T" consists of three separate inter
connected assemblieso These are the sample stand, the main unit, and the
power supplyo A particulate sample suspended in electrolyte is intro
duced to the sampling stand where counting occurs. The main unit
analyzes the information, reduces it to the desired data forms, and
provides readouts of the information. The power supply provides all
electrical power required by the circuitry.
The Model ,!Tn is a sophisticated electronic system which sepa
rates particle size into fifteen ranges, or thresholds. The data forms
available are: (a) population differential,.(b) population cumulative,
(c) volume differential, (d) volume cumulative. Sample time is recorded
(channel 16) for any of the four modes, and weight percent is available
using the volume cumulative mode*
Aperture current setting was 3.2 microamps, the maximum current
setting. Calibration was carried out by using mono-sized ragweed pollen
with a mean diameter of 19.5 microns. The manometer mode setting was
used in this research work in preference to the preset time mode.
Aperture current polarity was automatically cycled by the main unit.
Digital paper printouts were obtained for all runs. The sample stand and
main unit were both grounded to minimize electrical noise. The Coulter
Counter and sample stand are shown in Figure 6 .
Start-up Procedure
The crystallizer was operated in the following fashion. First,
air pressure was turned on to close the air-valve which connected the
36
Figure 6. Coulter Counter and Sampling Stand
37crystallizer to the drain» A bleed stream of water was turned on which
ran through a tee connection on the downstream portion of the air valve0
The purpose of the bleed stream was to keep the discharge tubing from
plugging.
Next., initial charges of sucrose solution and solvent were
placed into the crystallizer in the proper mass ratios. Care was taken
in the manner of introducing these two quantities together in order to
avoid sudden changes in concentrations between the two fluid quantities9
i.e., it was noticed during one start-up procedure that when the sucrose
solution of either 6 8 ° or 75 brix was added after the solvent was al
ready in the crystallizer (especially when the solvent was at a low
temperature) sudden crystallization occurred that produced many small
agglomerates. The problem was solved by putting the sucrose solution
in the crystallizer and then slowly adding the solvent (which was either
Vanzol A-l or 50% IPA 50% MeOH) with the agitator at a low speed until
the crystallizer was filled to 8000 ml. The agitator was then adjusted
to 1 1 0 0 revolutions per minute and the circulation pump was started.
Next,e the refrigeration unit was turned on if the operating conditions
required a low crystallization temperature. The level controller was
then activated to maintain the liquid in the crystallizer at the 8000 ml
level. Sucrose and solvent solutions were metered through the micro
bellows pump. The solvent was easily maintained at a constant flow
rate; however, the sucrose feed flow rate usually varied during the
course of an experimental run due to temperature and viscosity changes
from the tank to the bellows pump (approximately 10 feet of 1/4 -inch
' 38tygon tubing). The sucrose flow rate had to be constantly checked
during the course of the run. This problem was later corrected by sub
stituting a 1/4-inch bellows pump for the sucrose feed together with a
shortening of the sucrose line between the feed tank and the crystallizes
After these changes, the flow rate could be maintained at a more constant
level; however3 the stream still had to be checked and corrected
occasionally due to small fluctuations. A heating coil was also wrapped
around the top portion of the valve entrance to the sucrose bellows to
prevent temperature loss in the bellows. It was noticed from initial
runs that crystallization gradually occurred in the bellows. Therefore,
the bellows were flushed with hot water after each run to prevent
plugging.
The circulation line was found to plug during long retention
time runs due to a small diameter el-connection on the discharge side of
the circulation pump. This was corrected by replacing the circulation
line with a clear plastic 3/8 -inch tygon line stretched directly over
the discharge nozzle of the circulation pump.
The percent sucrose in the feed tank varied during runs due toO'evaporation at the high feed temperature (160-170 F) . Feed syrup con
centrations were measured by an Abbe fefractometer and water was added
periodically during the run to maintain a constant feed concentration.
Regulation of the syrup concentration by this technique was accurate to
within l°brix.
Sugar was obtained in 100 pound bags. For a typical run, 50 to
60 pounds were dissolved with tap water to make up to the required feed

39concentration (68 or 75 brix) 0 The sugar in all experiments was
commercial grade granulated cane sugar manufactured by the C & H Company.
After dissolving, the syrup was slightly yellowish in color. No analyses
were made of the syrup composition but it was noticed that pH of the
solution was slightly acidic (pH of approximately 6 ). Sodium hydroxide
was added to one run to make the solution basic. It was noticed that
the basic sucrose solution became brighter yellow in color than the
regular acidic solution. After this basic solution was allowed to set
for three days either bacterial decomposition or chemical reaction took
place because the sucrose solution then became dark brown in color. The
experimental run using this solution was characterized by large
agglomerates in the crystal distribution. This run was aborted and the
sucrose feed solution for the remaining runs was left at the original
pH of 6.0. Sucrose feed solution should evidently be used immediately
after it is prepared to prevent chemical reaction (probably inversion)
or bacterial decomposition.
Sampling and Particle Counts
After the crystallizer was ̂ assumed to be at steady state
(usually 7-8 retention times), a 5 ml sample was pipetted directly from
the crystallizer using a 2 0 ml pyrex pipette that had the tip opening
widened to prevent plugging. The sample was filtered slowly to avoid
agglomeration. Filtering was done with a 3.0 cm diameter microfilter
funnel using No. 30 Whatman filter paper. This paper could not be
subjected to isopropyl alcohol for periods of over one minute since the

alcohol had a deteriorating effect on the paper. Speed of filtration
was important to prevent complete drying of the filtered sample* This
drying of the sample on the filter also caused agglomeration. Some
error occurred during sampling due to the difficulty in filtering
exactly 5 ml of solution*
Initial sampling was carried out by diluting the filtered sample
in an electrolyte solution by a factor of 1500 in order that the Coulter
counter could count the sample in a dilute medium* Another purpose of
this dilution was to decrease the number concentration of large particles
in the system so that plugging up of the Coulter aperture would be re- .
duced* It was found later that diluting the sample by a factor of 2000
achieved the best counting results* This was done by adding the 5.ml
filtered sample to 200 ml of IPA/electrolyte solution in a 250 ml pyrex
beaker* The beaker was placed in an ultrasonic bath to disperse the
particles* The bath used for this operation was a "Balsonic" Model 1009
manufactured by Crest Ultrasonics Corporation* The covered beaker was
subjected to ultrasonic vibrations for a period of approximately one
minute so that the agglomerates caused by the filtration process were
broken up. After this treatment the solution was thoroughly mixed and
4 ml of the sample was pipetted into 196 ml of electrolytic IPA solution
thus bringing the dilution factor to 2 0 0 0 *
The electrolytic solution used for counting was a 4% by weight
filtered solution of ammonium thiocyanate in absolute isopropyl alcohol*
The ammonium thiocyanate (NH^CNS) was analytical grade as manufactured
by the Mallinckrodt Chemical Company* The isopropyl alcohol was an
\ 41-
analytical reagent9 also manufactured by the same company0 Although
sugar is very insoluble in isopropyl alcohol the solution was saturated
with sugar, then filtered using a 0.45 micron filter to prevent the
dissolving of fine sugar particles during the sampling and counting
procedure.
While the above operations were being carried out, the Coulter
Counter was turned on so that the circuitry was allowed time to warm up.
The aperture was immersed in pure isopropyl alcohol and then a noise
count of the 4% ammonium thiocyanate/isopropyl alcohol solution was
taken. The Coulter Counter calibration setting was set prior to this;
the unit was used in the manometer mode to take the counts. Prior to
the counting, the vacuum pump was checked to insure adequate vacuum
within the system, A complete counting cycle usually took about 20
seconds; 6 for the actual count, several for the drawdown time of the
manometer, and about 10 seconds for the digital printout. At least 4
counts were taken of each sample in order to obtain a true representation
of the particle population. The sucrose sample was counted after the
noise count. These counts were displayed on the main unit as histograms
of the distribution which could be checked with the previous run for
reproducibility of counts.
An important factor in this measurement procedure was to insure
that the sample was thoroughly mixed while the count was being taken.
Best results were obtained by placing the propeller tip directly under
the aperture tube close to the bottom of the sample beaker. Large
variations in counts were observed to occur in the highest channel
(low sizes) due to noise as well as in the lowest channels due to poor
mixing, of the larger crystals. Intermediate counts were usually
constant.
It was necessary to watch the aperture during counting with a
small microscope mounted on the sample stand to observe if the aperture
became clogged (particularly when the crystal density was high)„ When
this occurred, the Coulter aperture current was turned off and the
crystals were dislodged from the aperture. The count was then repeated.
As mentioned, samples from the crystallizef were diluted by a
factor of 2000 in the electrolytic IPA solution prior to counting. This
dilution was necessary to get a counting frequency that was consistent
with the speed of the Coulter and also to minimize the effect of double
and triple particles being counted as singles. The counter has a con
centration index meter calibrated in arbitrary units of 0-0.3. It was
found that concentrations of crystals resulting in a concentration index
of 0.2 to 0.3 gave inaccurate results. Indexes below 0.15 were found to
give reproducible results. The majority of runs were counted with the
concentration index scale below 0.15.
Experimental Runs
A total of fifteen runs were conducted in this research work.
Run 1-A, the first successful preliminary run, was used to compare with- ' - ■previous results (Crawford, 1970). Runs 1-B to 8-B were designed to
study the effects of five independent system variables upon the crystal
size distribution. These variables will be described later. The
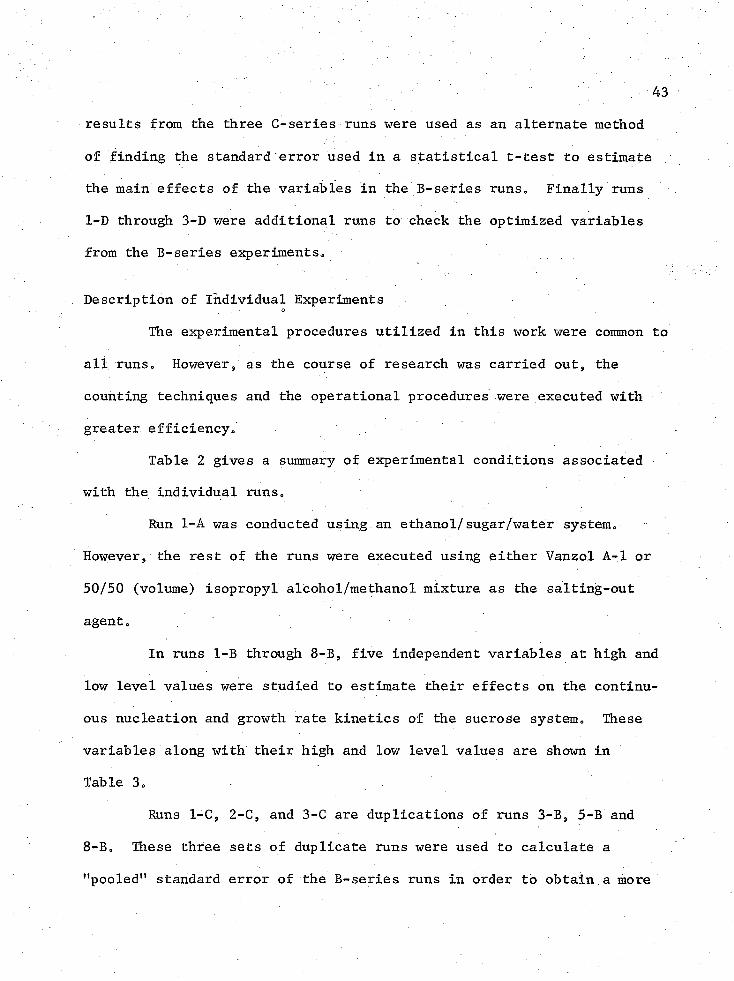
results from the three C-series runs were used as an alternate method
of finding the standard error used in a statistical t-test to estimate
the main effects of the variables in the 33-series runs. Finally runs
1-D through 3-D were additional runs to check the optimized variables
from the B-series experiments.
Description of Individual Experiments. . • °
The experimental procedures utilized in this work were common to
all runs. However, as the course of research was carried out, the
counting techniques and the operational procedures were executed with
greater efficiency.
Table 2 gives a summary of experimental conditions associated
with the individual runs.
Run 1-A was conducted using an ethanol/sugar/water system.
However, the rest of the runs were executed using either Vanzol A-l or
50/50 (volume) isopropyl alcohol/methanol mixture as the salting-out
agent.
In runs 1-B through 8-B, five independent variables at high and
low level values were studied to estimate their effects on the continu
ous nucleation and growth rate kinetics of the sucrose system. These
variables along with their high and low level values are shown in
Table 3.
Runs 1-C, 2-C, and 3-C are duplications of runs 3-B, 5-B and
8-B. These three sets of duplicate runs were used to calculate a
"pooled" standard error of the B-series runs in order to obtain.a more
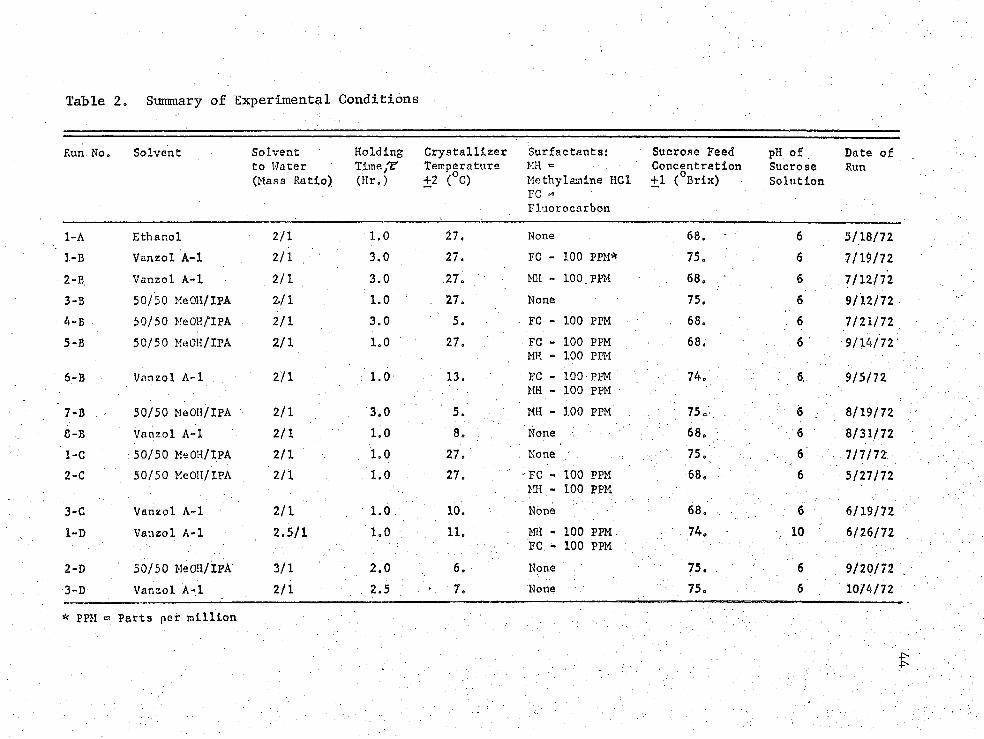
Table 2„ Summary of Experimental Conditions
Run No * Solvent Solvent Holding Crystallizer Surfactants; Sucrose Feed pH of Date ofto Water Time/T" Temperature MH = Concentration Sucrose Run(Mass Ratio) (Hr,) 42 (°C) Me thy1amine HC1 41 (°Brix) Solution
FC= . . .
Fluorocarbon
1-A Ethanol 2/1 1.0 27. None 68, 6 5/18/721-B Vanzol A-l 2/1 . 3.0 27. FC - 100 PPM* 75. 6 7/19/722-B Vanzol A-l 2/1 . 3.0 27. MH - 100,PPM 68, 6 7/12/723-B 50/50 MeOH/IPA 2./1 1.0 27. None 75. 6 9/12/72
50/50 Me OH/‘I PA 2/1 3.0 5. ■ FC - 100 PPM . 68. 6 7/21/725-B 50/50 MeOH/IPA 2/1 1.0 27. FC -
MH100 PPM 100 PPM .
68. 6 9/14/72;
6 - B Vanzol A-l . 2/1 1.0 ' 13. . FC - MH -
100 PPM 100 PPM
. 74. . 6. . 9/5/72
7-B 50/50 MeOH/IPA 2/1 3.0 v.' MH - 100 PPM ■ 75 o’ . 8/19/728-B Vanzol A-l 2/1 1.0 8. : None : 68. 6 8/31/721-C 50/50 MeOH/IPA 2/1 1.0 27. . None 75. 6 7/7/722-C 50/50 MeOH/IPA 2/1 1.0 27. - FC -
MH -100 PPM 100 PPM
68. 6 5/27/72
3-C Vanzol A-l 2/1 1.0 10. None 68. : e 6/19/721-D Vanzol A-l 2.5/1 1.0 11. MH -
FC -100 PPM 100 PPM
74. • 10 6/26/72
2-D 50/50 MeOH/IPA 3/1 2.0 , 6. None 75. . 6 . 9/20/72 ,3-D Vanzol A-l 2/1 . ; 2.5: . 7. None ; 75. ■ 6 , 10/4/72* PPM t= Parts per million
f :
45
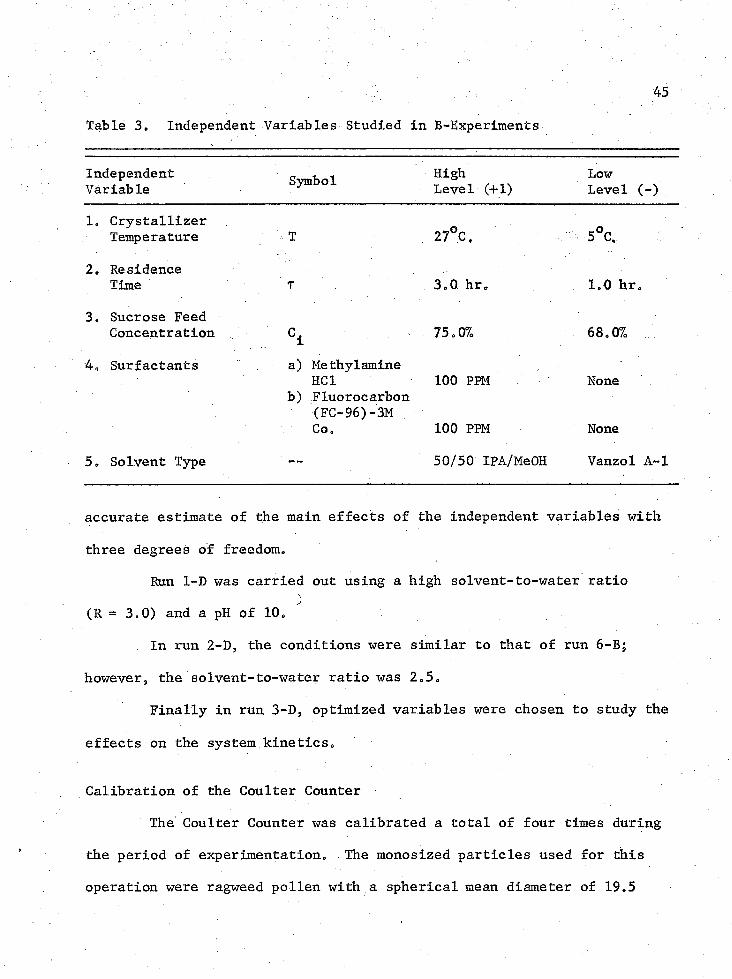
Table 3. Independent Variables Studied in B-Experiments
IndependentVariable Symbol High
Level (+1)LowLevel (-)
1. Crystallizer Temperature T 27°C, 5°C,
2. ResidenceTime T 3.0 hr. 1.0 hr.
3. Sucrose Feed Concentration V 75.07. 68.07.
4. Surfactants a) Methyl amineHC1 100 PPM None
b) Fluorocarbon (FC-96)-3M Co. 100 PPM None
5. Solvent Type -- 50/50 IPA/MeOH Vanzol A-l
accurate estimate of the main effects of the independent variables with
three degrees of freedom.
Run 1-D was carried out using a high solvent-to-water ratio
(R = 3.0) and a pH of 10.
In run 2-D, the conditions were similar to that of run 6-B;
however, the solvent-to-water ratio was 2.5.
Finally in run 3-D, optimized variables were chosen to study the
effects on the system kinetics.
Calibration of the Coulter Counter
The Coulter Counter was calibrated a total of four times during
the period of experimentation. The monosized particles used for this
operation were ragweed pollen with a spherical mean diameter of 19.5
: . - 46microns. All the calibrations gave a baseline for channel 5 of 40
microns. A standardized procedure was followed as described in the
Coulter Counter manual.
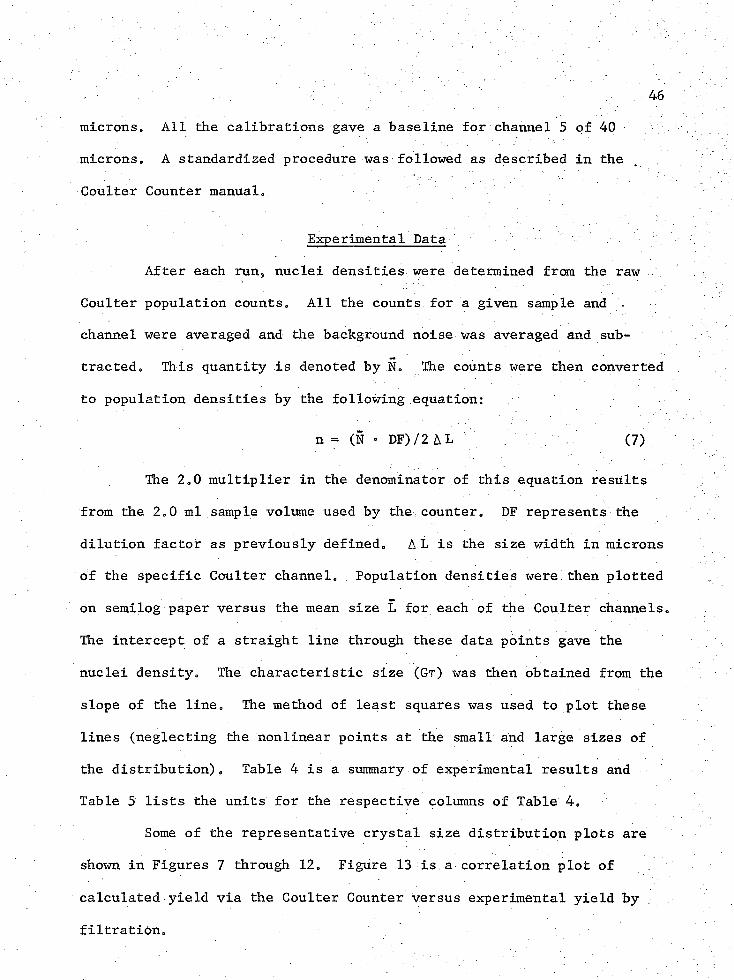
Experimental Data
After each run, nuclei densities were determined from the raw .
Coulter population counts. All the counts for a given sample and .
channel were averaged and the background noise was averaged and sub
tracted. This quantity is denoted by N. The counts were then converted
to population densities by the following equation:
n = (N - DF) /2 A L (7)
The 2.0 multiplier in the denominator of this equation results
from the 2.0 ml sample volume used by the counter. DF represents the
dilution factor as previously defined. A L is the size width in microns
of the specific Coulter channel. Population densities were then plotted
on semilog paper versus the mean size L for each of the Coulter channels.
The intercept of a straight line through these data points gave the
nuclei density. The characteristic size (Gr) was then obtained from the
slope of the line. The method of least squares was used to plot these
lines (neglecting the nonlinear points at the small and large sizes of
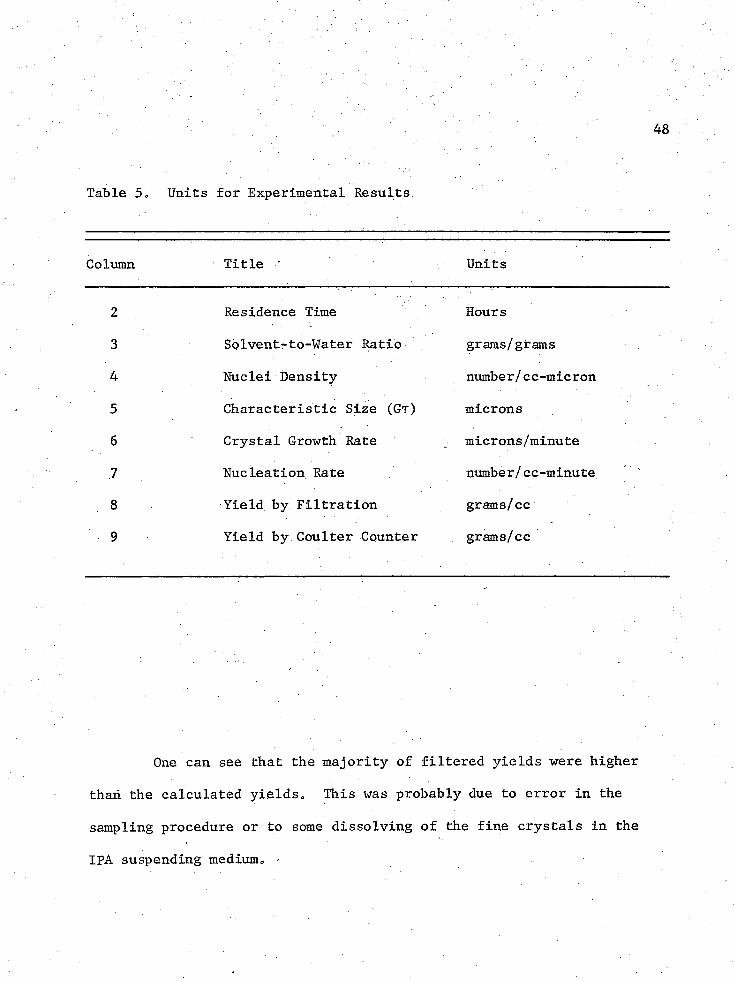
the distribution). Table 4 is a summary of experimental results and
Table 5 lists the units for the respective columns of Table 4.
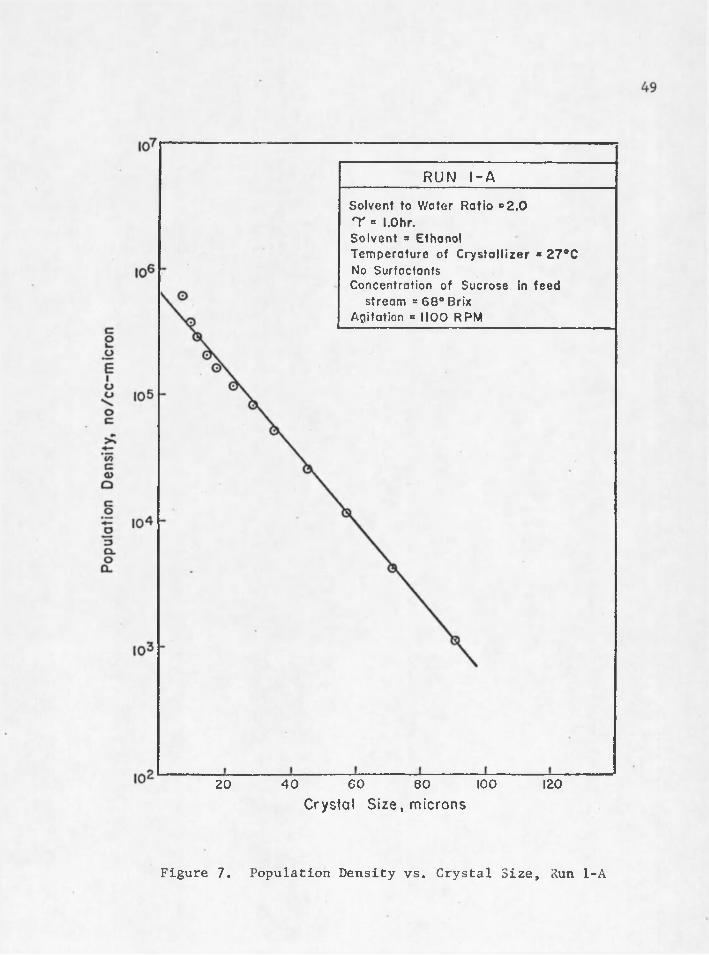
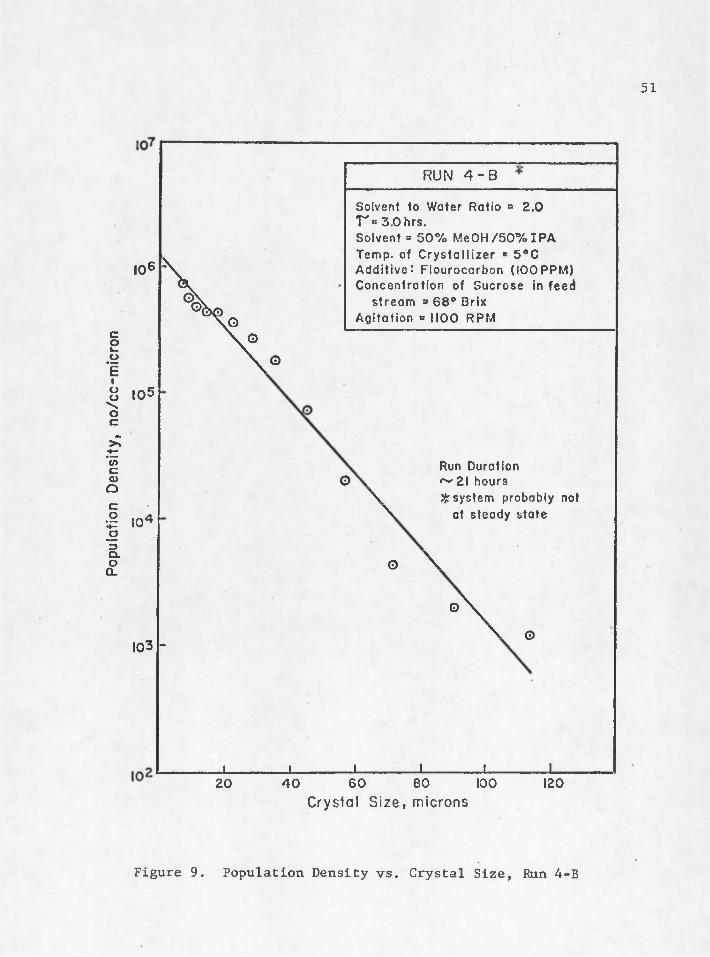
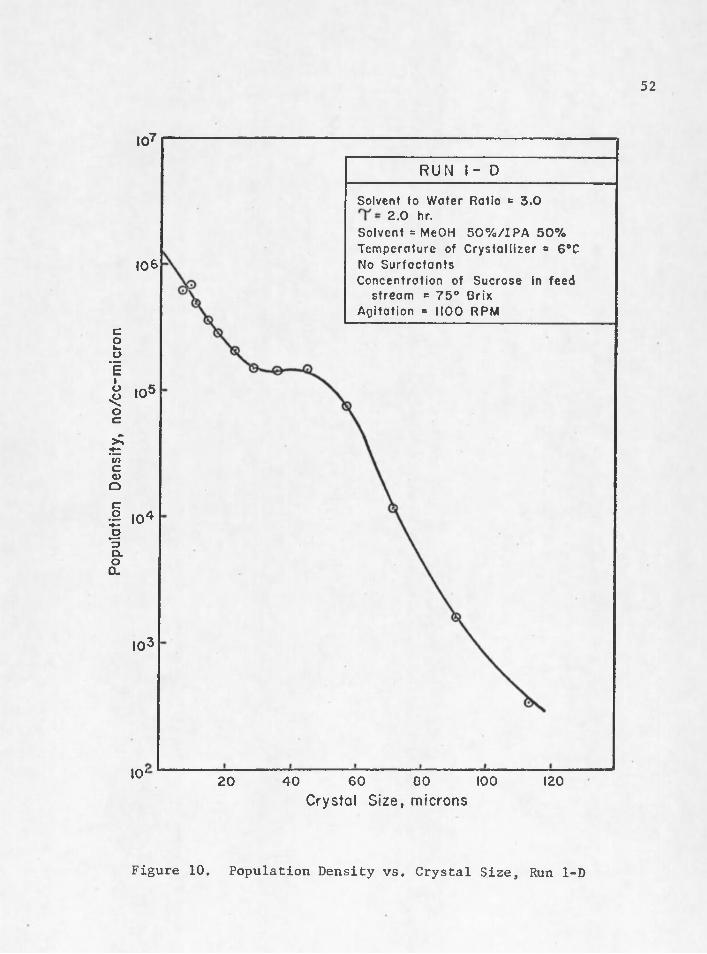
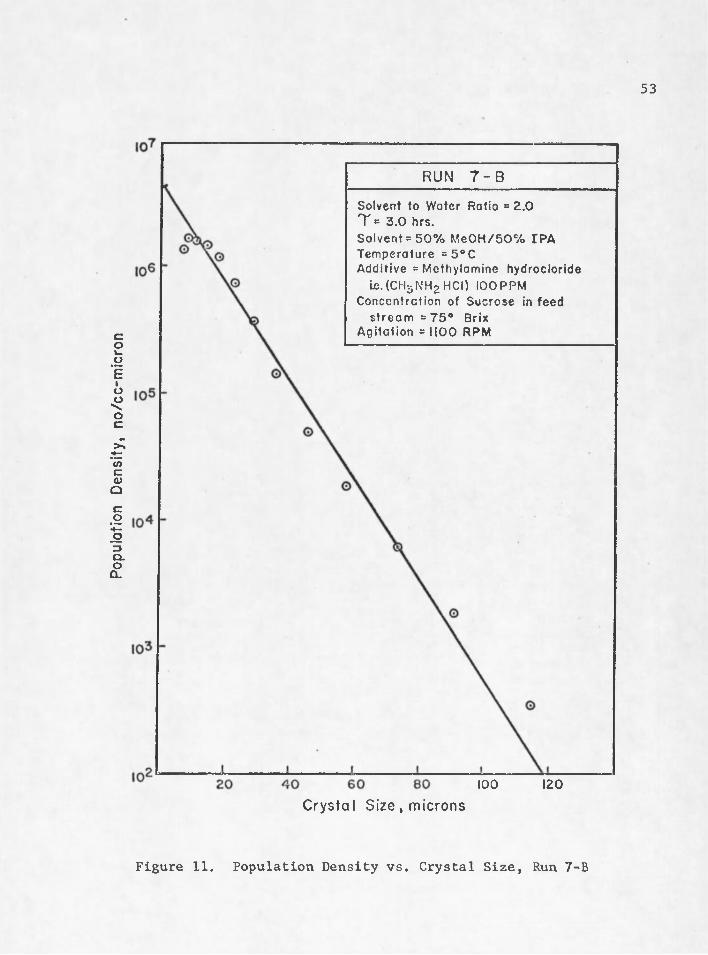
Some of the representative crystal size distribution plots are
shown in Figures 7 through 12. Figure 13 is.a correlation plot of
calculated yield via the Coulter Counter versus experimental yield by
filtration.
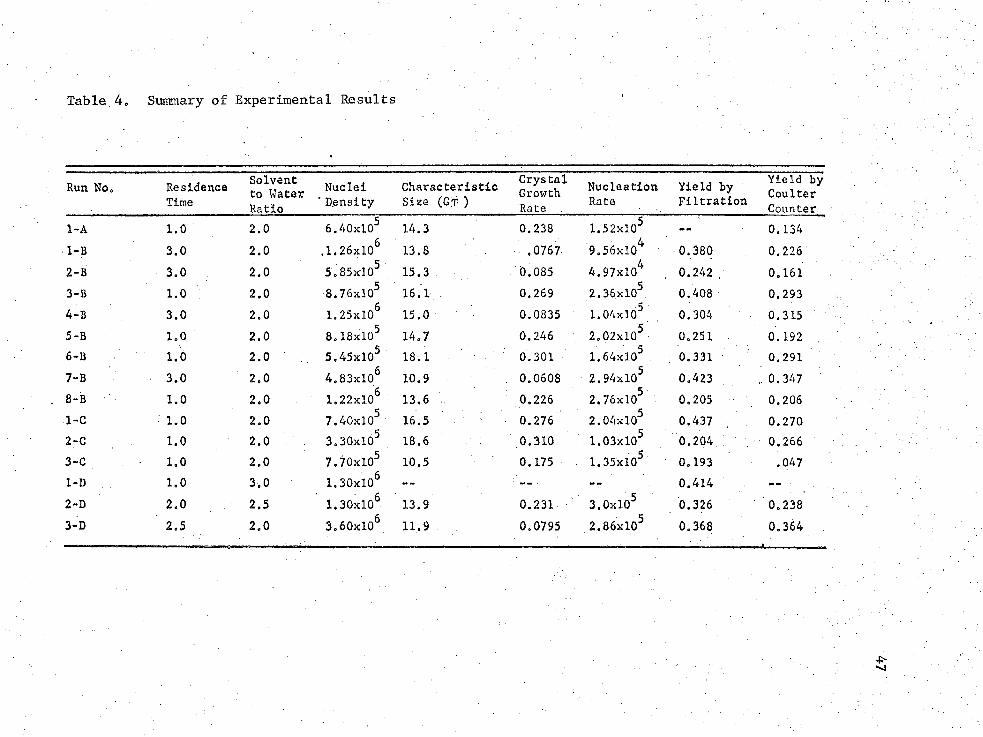
Table 4. Summary of Experimental Results
Run No. ResidenceTime
Solvent to Water Ratio
Nuclei " Density
Characteristic Size (GT )
CrystalGrowthRate
NucleationRate
Yield by Filtration
Yield byCoulterCounter
1-A 1.0 2.0 6.40xl05 14.3 0.238 1.52xl05 w- 0.1341-B 3.0 2.0 ,1.26xl06 13.8 .0767 9.56xl04 0.380 0.2262-B 3.0 2.0 5.85xl05 15.3 0.085 4.97xl04 . 0.242, 0.1613-B 1.0 2.0 8.76xl05 16.1 . 0.269 2.36xl0S 0.408 0.2934-B 3.0 2.0 1.25xl06 15.0 0.0835 1.04xl0S 0.304 0.3155-B 1.0 2.0 8.18xl05 14.7 0.246 2.02xl0S 0.251 0.1926-B 1.0 2.0 .. 5.45xl05 18.1 0.301 1.64xl0S ; 0.331 : 0.2917-B 3.0 2.0 4.83xl06
610.9 ■ . 0.0608 2.94xl05
5-0.423 .. 0. 347
8-B 1.0 2.0 1.22x10 13.6 .. 0.226 2.76x10 0.205 0.206l-C 1.0 2.0 7.40xl05 16.5 : 0.276 2.04xl0S 0.437 0.2702-C 1.0 2.0 3.30xl05 18.6 0.310 1.03xl0S 0.204 . ; 0.2663-C 1.0 2.0 7.70xl05 10.5 0.175 1.35xlOS 0.193 .047I'D 1.0 3.0 1.30xl06 0.4142-D 2.0 2.5 1.30x10* 13.9 0.231 3.0xiOS 0.326 0.2383-D 2,5 2.0 3.60x10* 11.9 0.0795 2.86xl0S 0.368 0.364
---n...,. ____ _
48
Table 5. Units for Experimental Results.
Column Title ' Units
2 Residence Time Hours
3 Solventsto-Water Ratio grams/grams
4 Nuclei Density number/cc-micron
5 Characteristic Size (Gt ) microns
6 Crystal Growth Rate microns/minute
7 Nucleation Rate number/cc-minute
8 Yield by Filtration grams/cc
9 Yield by Coulter Counter grams/cc
One can see that the majority of filtered yields were higher
than the calculated yields. This was probably due to error in the
sampling procedure or to some dissolving of the fine crystals in the
IPA suspending medium. •
RUN I-*A
S o l v e n t t o W a t e r R a t i o = 2 . 0 T = I.Ohr.S o l v e n t = E t h a n o lT e m p e r a t u r e o f C r y s t a l l i z e r * 2 7 e CNo S u r f a c t a n t sC o n c e n t r a t i o n o f S u c r o s e in f e e d
s t r e a m = 6 8 ° Br ix A g i t a t i o n = 1 1 0 0 R P M
2 0 4 0 6 0 8 0 1 0 0 120Crystal S i z e , microns
Figure 7. Population Density vs. Crystal Size, Run 1-A

Popu
lati
on
Den
sity
, n
o/cc
-mic
ron
50
to?
10*
105
10'
10'
t 0 ‘
__________ RUN 2 - B______________
S o l v e n t t o W a t e r R a t i o = 2 . 0 T = 3 . 0 h r s .S o l v e n t = V a n z o l - A - 1 T e m p e r a t u r e o f C r y s t a l l i z e r = 2 7 ° C Addi t ive * . M e t h y l a m i n e h y d r o c h l o r i d e ,
1 0 0 P P MC o n c e n t r a t i o n o f S u c r o s e in f e e d
s t r e a m = 6 8 ° Br ix A g i t a t i o n *= 1 1 0 0 R P M
JL2 0 4 0 6 0 8 0 1 0 0
Crysta l S i z e , microns120
Figure 8. Population Density vs. Crystal Size, Run 2-B
Popu
lati
on
Den
sity
, n
o/cc
-mic
ron
51
io6
105
104
103
2 0 4 0 6 0 6 0 1 0 0 1 2 0Crystal S i z e , microns
Figure 9. Population Density vs. Crystal Size, Run 4-B
R U N 4-B
X x d\ p
S o l v e n t t o W a t e r R a t i o = 2 . 0 ' T = 3 . 0 hr s .S o l v e n t = 5 0 % M e 0 H / 5 0 7 o I P A T e m p , o f C r y s t a l l i z e r e 5 e C A d d i t i v e : F l o u r o c a r b o n ( 1 0 0 P P M ) C o n c e n t r a t i o n o f S u c r o s e in f e e d
s t r e a m = 6 8 ° B r i x A g i t a t i o n » 1 1 0 0 R P M
\ o
\ o
Run D u r a t i o n O ^ 21 h o u r s
X - ^ s y s t e m p r o b a b l y not X k at s t e a d y s t a t e
O \
o \
-X . ©
i -1 _ L 1— __ J ___ j _
Popu
lati
on
Den
sity
, n
o/cc
-mic
ron
52
IQ?
106
I 0 5
104
I 0 3
10'
_________ RUN I - D____________
S o l v e n t t o W a t e r R a t i o = 3 . 0 2 . 0 hr.
S o l v e n t = M e O H 5 0 % / I P A 5 0 % T e m p e r a t u r e o f C r y s t a l l i z e r = 6 ° C N o S u r f a c t a n t sC o n c e n t r a t i o n o f S u c r o s e in f e e d
s t r e a m = 7 5 ° B r i x A g i t a t i o n = 1 1 0 0 R P M
2 0 4 0 6 0 8 0 1 0 0Crystal S i z e , microns
120
Figure 10. Population Density vs. Crystal Size, Run 1-D
Popu
lati
on
Den
sity
, n
o/cc
-mic
ron
53
RUN 7 - B____________
S o l v e n t t o W a t e r R a t i o = 2 . 0 T = 3 . 0 hrs .S o l v e n t = 5 0 % M e O H / 5 0 % I R A T e m p e r a t u r e = 5 ° C A d d i t i v e = M e t h y l o m i n e h y d r o c l o r i d e
i s . (CH3NH2HCn 1 0 0 P P M C o n c e n t r a t i o n o f S u c r o s e in f e e d
s t r e a m = 7 5 ° Br ix A g i t a t i o n = 1 1 0 0 R P M
100 120Crystal S i z e , microns
Figure 11. Population Density vs. Crystal Size, Run 7-B
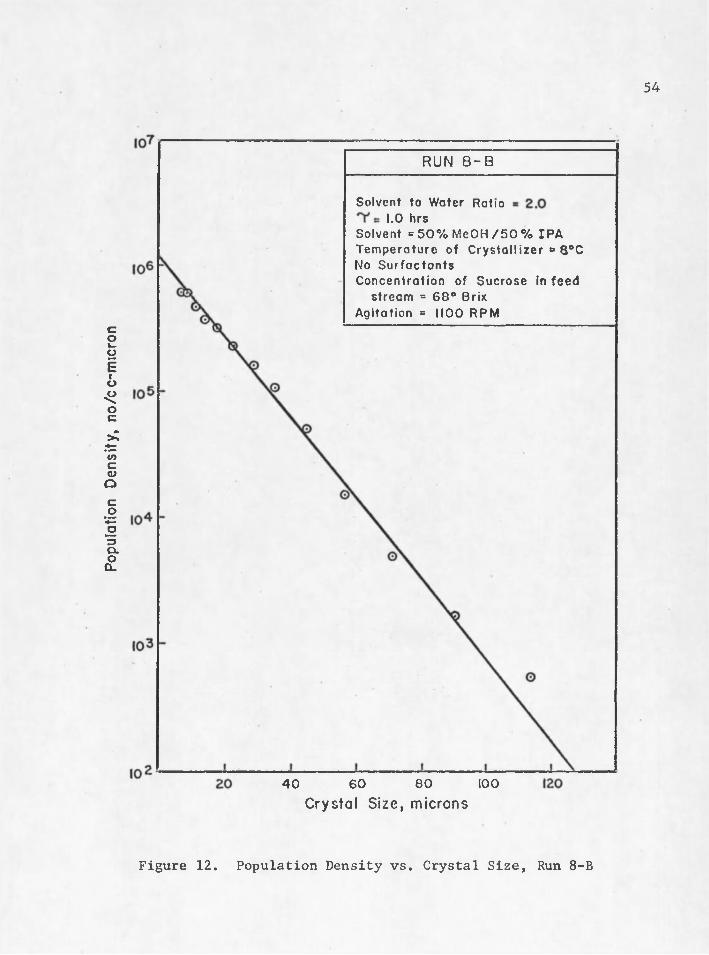
Popu
lati
on
Den
sity
, n
o/cc
-mic
ron
54
RUN 8 - B
S o l v e n t t o W a t e r 1 .0 h r s
S o l v e n t = 5 0 7 o M e 0 H / 5 0 % I PA T e m p e r a t u r e o f C r y s t a l l i z e r 6 8 e C N o S u r f a c t a n t sC o n c e n t r a t i o n o f S u c r o s e in f e e d
s t r e a m = 6 8 ° B r i x A g i t a t i o n = 1 1 0 0 R P M
R a t i o
40 60 80 100Crystal S i z e , m icrons
Figure 12. Population Density vs. Crystal Size, Run 8-B
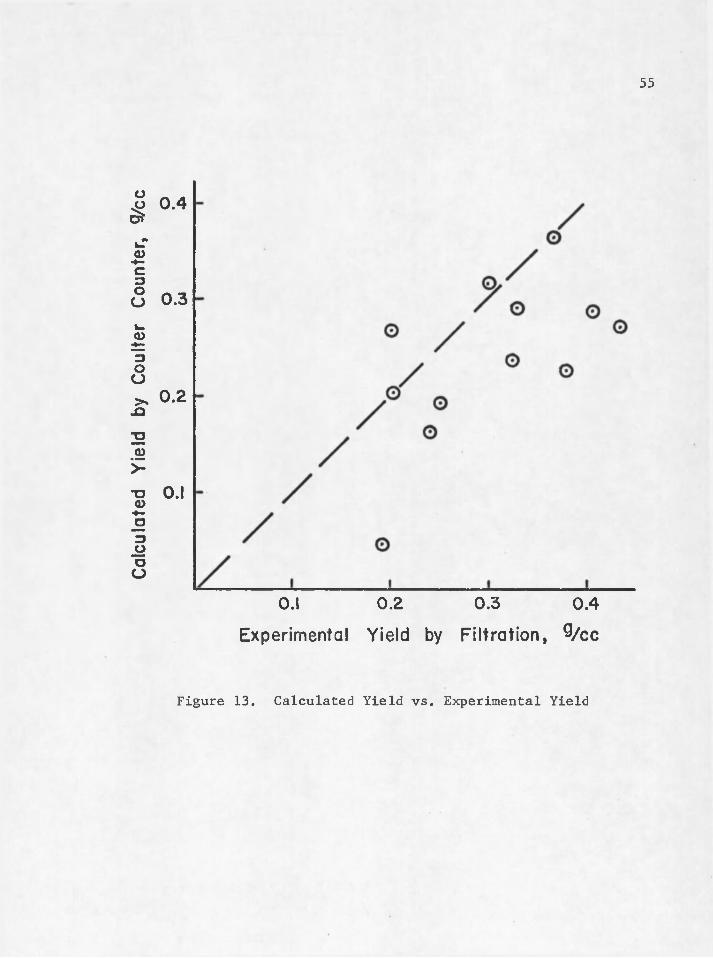
Cal
cula
ted
Yiel
d by
Cou
lter
C
ount
er,
9/cc
55
0.4
0.3
0.2
0.1
0.2 0.30.1 0.4E xper im en ta l Yield by F i l t r a t io n , 9/cc
Figure 13. Calculated Yield vs. Experimental Yield
CHAPTER VI
ANALYSIS OF EXPERIMENTAL RESULTS
Run 1-A was the only run that had experimental conditions
similar to Crawford* s (1970) <, The graphical representation of the CSD
along with the process conditions is shown in Figure 7« The system
kinetics of the run correspond to the growth rateenucleation rate curve
that Crawford plotted.
Statistical Results
The B-series experiments were run to find the effects of the
independent variables (from Table 3) on the system kinetics, i.e., the
nucleation rate and the population-weighted characteristic size.
Evaluation of these effects was made with the aid of the Placke11-Burman
analysis (Isaacson, 1970), which studies (n-1) independent variables in
n tests. This analysis consisted of a one-level statistical t-test,
i.e., no interactions were assumed between the real independent
variables. Thus, it was not possible to estimate the two-factor inter
actions that could have been significant in the system and which may
have contributed to make some main effect appear highly significant.
This series of experiments consisted of studying six variables
in eight experiments. These variables are shown in Table 3 (the sur
factants count as two separate variables), along with their chosen
high and low level values. One variable was assumed to be a dummy
variable for estimation of the standard error.
56 .
Each independent variable was studied at two levels; it was
important to choose as levels the values that were expected to produce
some significant change in the performance of the dependent variable.
This was considered the most important step in effectively applying
this experimental method.
The design matrix for the eight experimental runs is shown in.
Table 6. The + ' s and - ’s indicate the particular high and low settings
for the independent variables (designated by columns) for a given
experimental run (designated by rows).. The independent variables were
numbered as follows:
1. Crystallizer Temperature
2. Holding Time
3. Concentration of Sucrose Feed
4. Methyfamine Hydrochloride (surfactant)
5. Fluorocarbon (surfactant)
6. Solvent Type
7. Dummy Variable
After completion of the experiments, the effects of each inde
pendent variable was calculated going from the low level to the high
level.
For each independent variable and dummy variable, the net effect
is calculated to be the difference between the average value of the re
sponse obtained at the high levels and the average, value obtained at the
low levels. This may be described mathematically as:
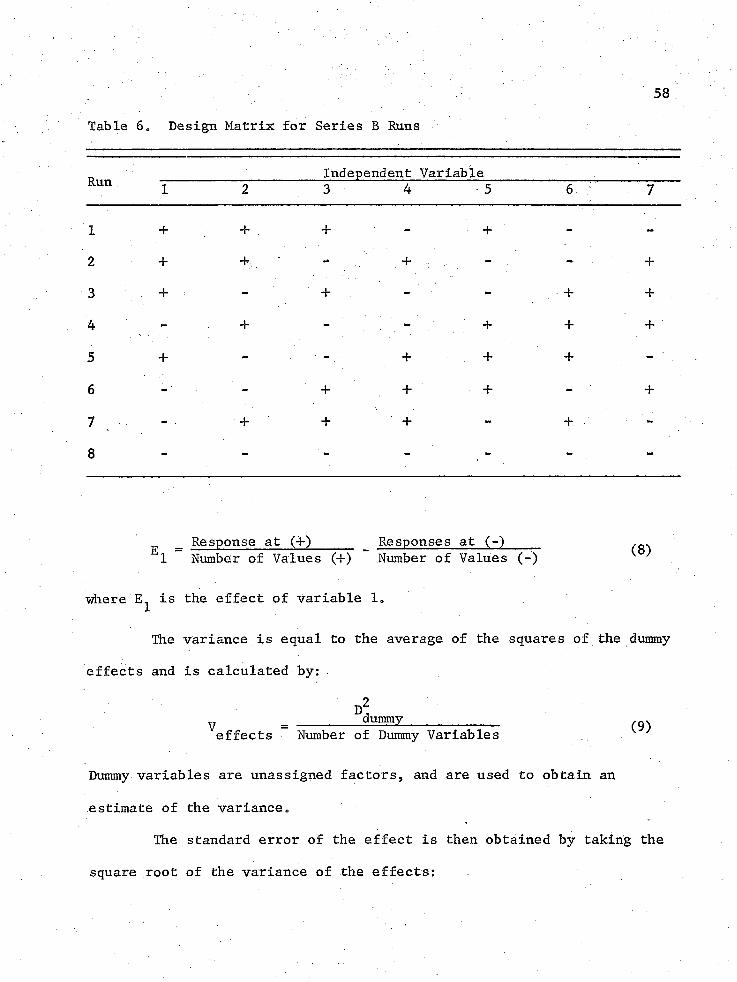
58Table 60 Design Matrix for Series B Runs
Run Independent Variable1 2 3 4 • 5 6 7
1 + + '. + - + - -
2 + - '' + - ; — 4-
3 + ' - -f 4
4 - + - - + + 4
5 + - + + > -
6 — + + - 4
7
8
+ + + ~ +
-
Response at (+) Responses at (-) (8)E 1 = Number of Values (+) Number of Values (-)
where E 1 is the effect of variable 1„
The variance is equal to the average of the isquares of the dummy
effects and is calculated by : .
Djdummy (9)effects Number of Dummy Variables
Dummy variables are unassigned factors, and are used to obtain an
estimate of the variance0
The standard error of the effect is then obtained by taking the
square root of the variance of the effects:
59 •
. ■■ ■-■■■ ; ■: ■... .•Standard Error (S.E.) = (veffec;t:s) 2 (10)
The significance of each effect is determined by using the
familiar t-test in accordance with:
t-Ef£ect/S.B.e££ec< ’ V (11)
In other words, if the t-value is significant at an arbitrary level, it
means that in going from a low level to the high level of that variable
in the design, the change observed in the response or dependent variable
is truly due to changing the variable and not to random error„ Values
of t-significance at various probability levels are found in standard,
tables at n-degrees of freedom.where n is the number of dummy variables
(n = 1 in our case)„ Tables 7 and 8 list the results of the Plackett-
Burman analysis on the system variables of characteristic length Gr and
nuclei density, respectively.
The standard errors of both evaluations were high (see Tables 7
and 8). This was due to a high effect value of the dummy variable.
One dummy variable (one degree of freedom) cannot be considered a good
estimate of the standard error. The analysis would be improved if two
or three dummy variables (two or three degrees of freedom) were chosen
in order to lower the standard error. This would result in a more
accurate t-test.
Three possible explanations can be given for the large effect
of the dummy variable:
1. Interactions between the real variables that are confounded
with the dummy variable are significantly large.
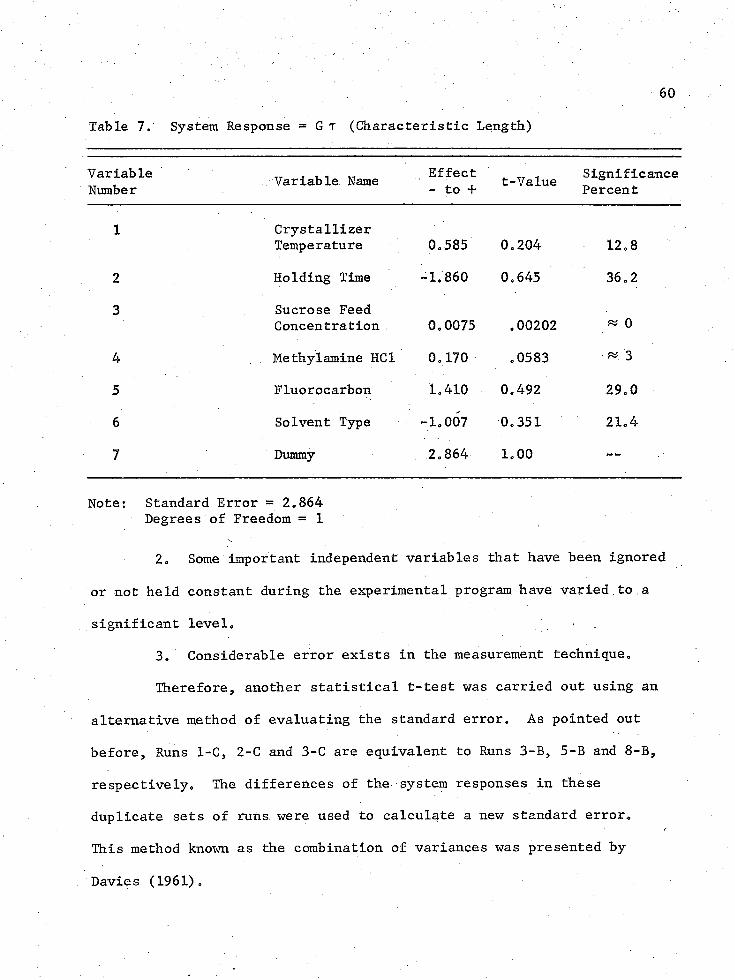
60Table 7. System Response = G r (Characteristic Length)
VariableNumber Variable Name . Effect ' TT - Significance
- to + t-Value Percent
1 CrystallizerTemperature 0.585 0.204 12.8
2 Holding Time -1.860 0.645 36.2
3 Sucrose Feed Concentration 0.0075 .00202 « 0
4 Methylamine HC1 0.170 .0583 to 3
5 Fluorocarbon 1.410 0.492 29.0
6 Solvent Type -1.007 0.351 21.4
7 Dummy 2,864 1.00 --
Note: Standard Error = 2.864Degrees of Freedom = 1
2. Some important independent variables that have been ignored
or not held constant during the experimental program have varied to.a
significant level.
3. Considerable error exists in the measurement technique.
Therefore, another statistical t-test was carried out using an
alternative method of evaluating the standard error. As pointed out
before. Runs 1-C, 2-C and 3-C are equivalent to Runs 3-B, 5-B and 8-B,
respectively. The differences of the system responses in these
duplicate sets of runs were used to calculate a new standard error.
This method known as the combination of variances was presented by
Davies (1961).
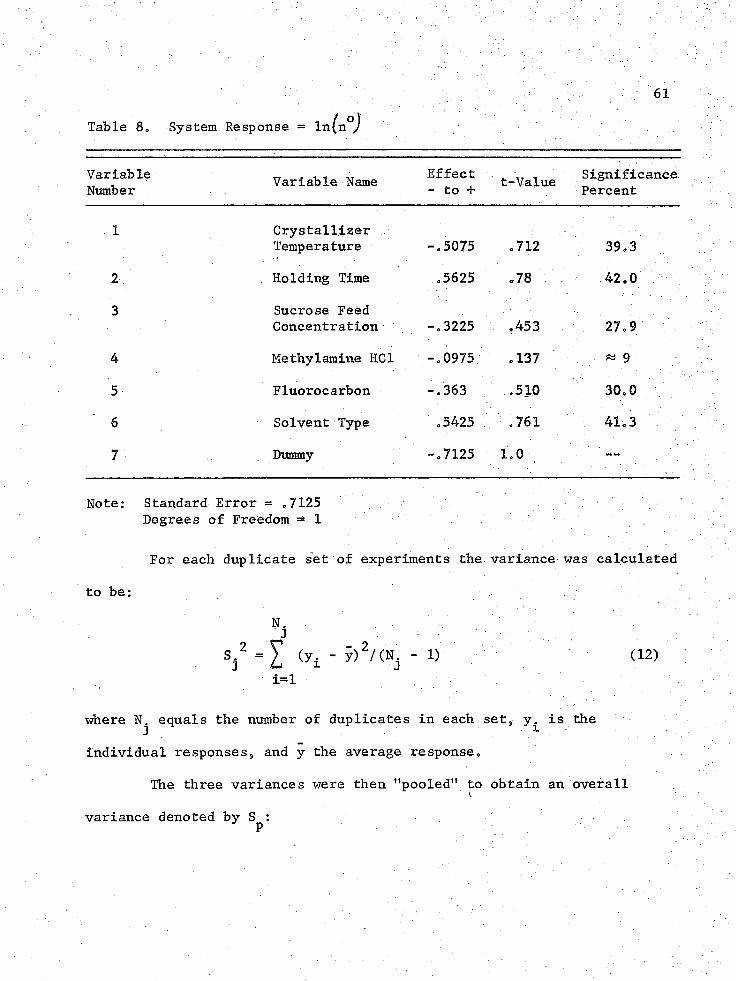
. o 61Table 8. System Response = Infn0̂
VariableNumber Variable Name Effect
- to + t-Value SignificancePercent
. 1 CrystallizerTemperature -.5075 .712 39.3
2 . Holding Time .5625 00 hs .
42.0
3 Sucrose Feed Concentration -.3225 .453 27.9 \
4 Methylamine HCl -.0975 .137 « 9
5 Fluorocarbon -. 363 .510 30.0
6 Solvent Type .5425 .761 41.3
7 Dummy -.7125 1.0
Note: Standard Error = .7125Degrees of Freedom = 1
For each duplicate set of experiments the variance was calculated
to be:
" j
Sj2 = Y (yi " y)2/<Nj • V (12);; ;
where N. equals the number of duplicates in each set, y. is the_ "L
individual responses, and y the average response.
The three variances were then "pooled" to obtain an overall■ vvariance denoted by S :P.
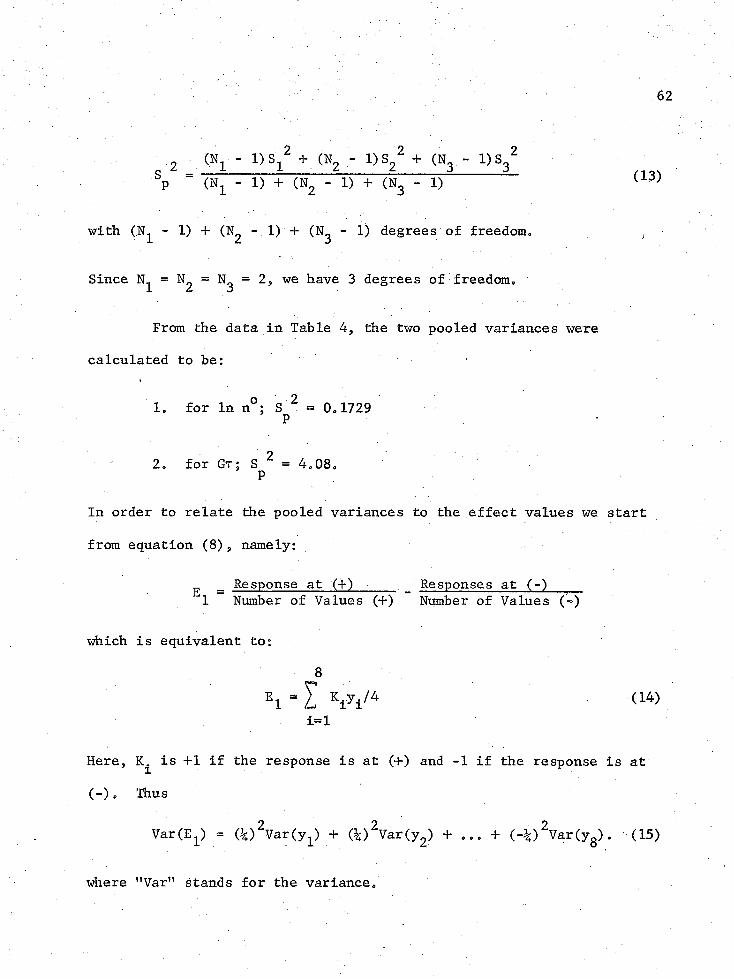
62
„ 2 1)SX2 H- (N2 - PS,? + („3 .
P " (N, - 1) + (N - 1) + (N_ - 1) (13)
with (N^ - 1) + (Ng -.1) + (N^ - 1) degrees of freedom, ;
Since = 2, we have 3 degrees of freedom.
From the data in Table 4, the two pooled variances were
calculated to be: •
1, for In n°; S 2 = 0,1729P ■
22 0 for Gt ; = 4.08.
In order to relate the pooled variances to the effect values we start
from equation (8), namely:
g _ Response at (+) Responses at (-■)1 Number of Values (+) Number of Values (-)
which is equivalent to:
8e i - Z K i n / 4 < i 4 >
i=l
Here, is +1 if the response is at (+) and -1 if the response is at
(-). Thus
Var(E^) = (%)2Var(y1) + (%)2Var(y2> + ,„, + (-%)2Var(yg). (15)
where "Var11 stands for the variance*
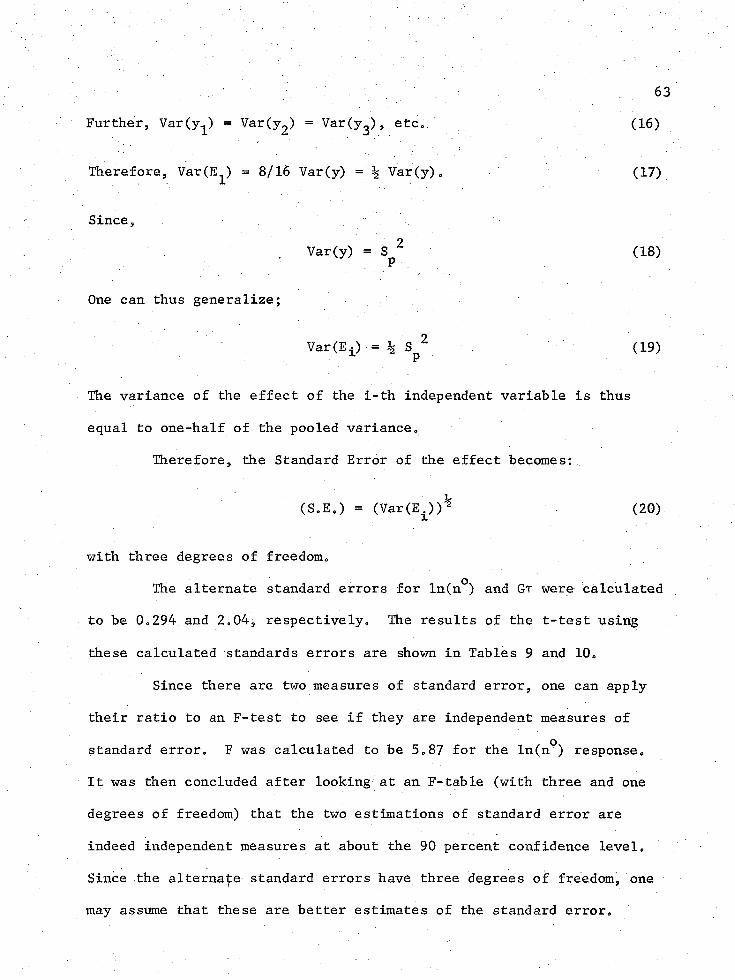
Further, Var(y^) = Vav(y^) = VarCy^), etc.
Therefore, Var(E^) = 8/16 Var(y) = % Var(y).
Since,2Var(y) = Sp
One can thus generalize;
2Var(Ei) = % 8̂
The variance of the effect of the i-th independent variable is thus
equal to one-half of the pooled variance0
Therefore, the Standard Error of the effect becomes:
^ ;'
(SoEo) = (Var(Ei))2 (20)
with three degrees of freedom*
The alternate standard errors for ln(n°) and Gt were calculated
to be 0*294. and 2*04, respectively* The results of the t-test using
these calculated standards errors are shown in Tables 9 and 10*
Since there are two measures of standard error, one can apply
their ratio to an F-test to see if they are independent measures of
standard error* F was calculated to be 5*87 for the ln(n°) response*
It was then concluded after looking at an F-table (with three and one
degrees of freedom) that the two estimations of standard error are
indeed independent measures at about the 90 percent confidence level*
Since the alternate standard errors have three degrees of freedom, one
may assume that these are better estimates of the standard error*
63(16)
(17)
(18)
(19)
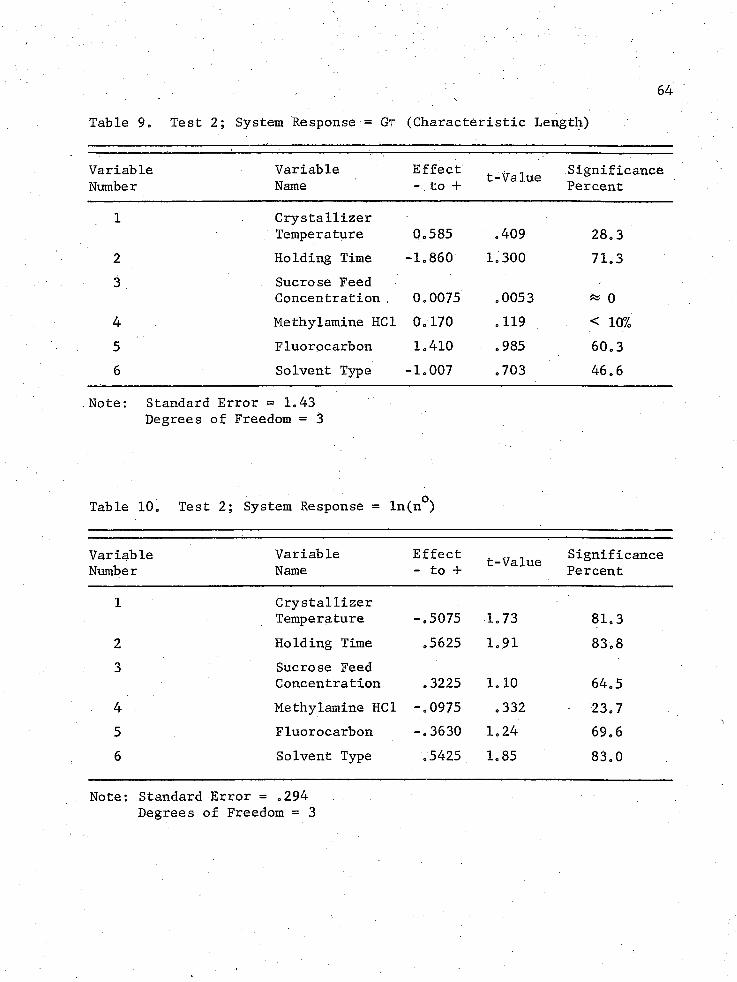
64Table 9. Test 2; System Response = Gr (Characteristic Length)
VariableNumber
VariableName
Effect t_value Significance to + Percent
1 CrystallizerTemperature 0.585 .409 28.3
2 Holding Time -1.860 1.300 71.33 Sucrose Feed
Concentration , 0.0075 .0053 « 04 Methylamine HC1 0.170 .119 < 10%5 Fluorocarbon 1.410 .985 60.36 Solvent Type -1.007 .703 46.6
Note: Standard Error = 1.43Degrees of Freedom = 3
Table 10. Test 2; System Response = In(n°)
VariableNumber
VariableName
Effect - to + t-Value Significance
Percent
1 CrystallizerTemperature -.5075 1.73 81.3
2 Holding Time .5625 1.91 83.83 Sucrose Feed
Concentration .3225 1.10 64.54 Methylamine HC1 -.0975 .332 23.75 Fluorocarbon -.3630 1.24 69.66 Solvent Type .5425 1.85 83.0
Note: Standard Error = .294 Degrees of Freedom = 3
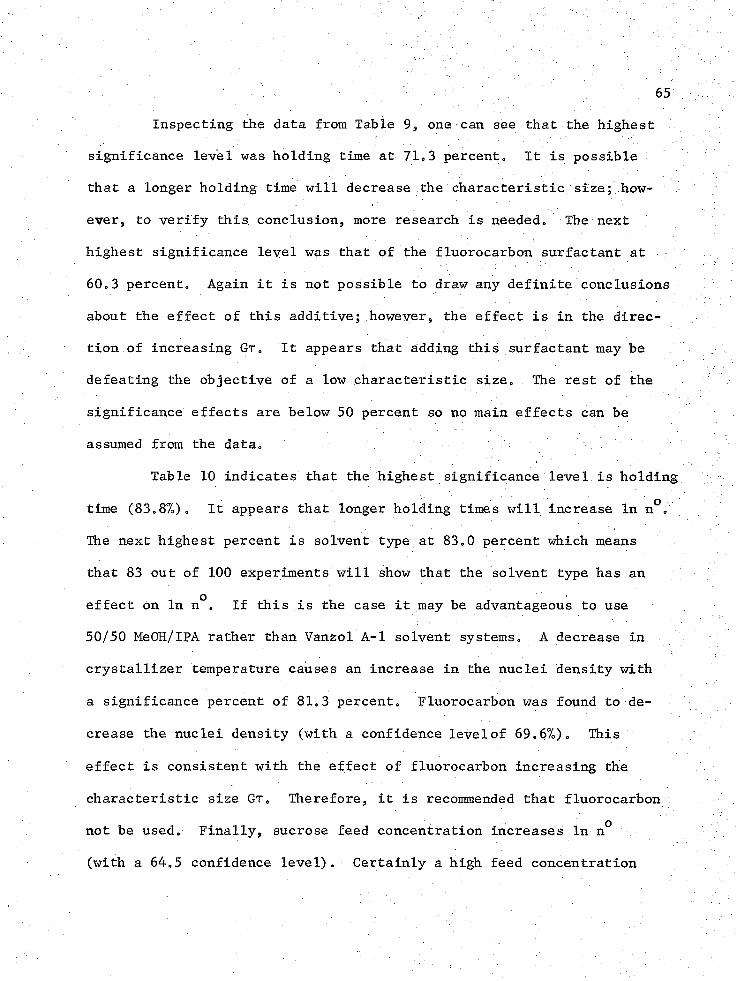
Inspecting the data from Table 99 one can see that the highest
significance level was holding time at 71,3 percent0 It is possible
that a longer holding time will decrease the characteristic size; how
ever, to verify this conclusion, more research is needed. The next
highest significance level was that of the fluorocarbon surfactant at
60.3 percento Again it is not possible to draw any definite conclusions
about the effect of this additive; however, the effect is in the direc
tion of increasing Gt . It appears that adding this surfactant may be
defeating the objective of a low characteristic size. The rest of the
significance effects are below 50 percent so no main effects can be
assumed from the data.
Table 10 indicates that the highest significance level is holding
time (83.8%). It appears that longer holding times will increase In n .
The next highest percent is solvent type at 83.0 percent which means
that 83 out of 100 experiments will show that the solvent type has anoeffect on In n . If this is the case it may be advantageous to use
50/50 MeOH/IPA rather than Vanzol A-l solvent systems. A decrease in
crystallizer temperature causes an increase in the nuclei density with
a significance percent of 81.3 percent. Fluorocarbon was found to de
crease the nuclei density (with a confidence level of 69.6%). This
effect is consistent with the effect of fluorocarbon increasing the
characteristic size Gr. Therefore, it is recommended that fluorocarbon
not be used. Finally, sucrose feed concentration increases In n°
(with a 64.5 confidence level). Certainly a high feed concentration
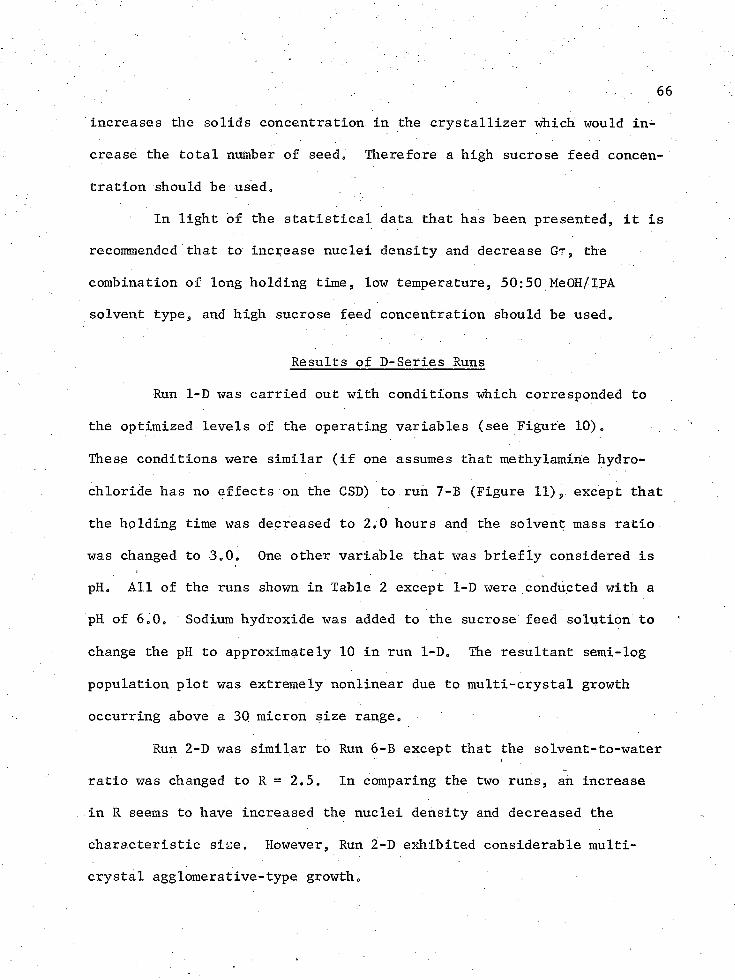
66increases the solids concentration in the crystallizer which would in
crease the total number of seed. Therefore a high sucrose feed concen
tration should be used.
In light of the statistical data that has been presented, it is
recommended that to increase nuclei density and decrease Gr, the
combination of long holding time, low temperature, 50:50 MeOH/IPA
solvent type, and high sucrose feed concentration should be used.
Results of D-Series Runs
Run 1-D was carried out with conditions which corresponded to
the optimized levels of the operating variables (see Figure 10),
These conditions were similar (if one assumes that methy1amine hydro
chloride has no effects on the CSD) to run 7-B (Figure 11)9 except that
the holding time was decreased to 2,0 hours and the solvent mass ratio
was changed to 3,0, One other variable that was briefly considered is
pH, All of the runs shown in Table 2 except 1-D were conducted with a
pH of 6,0, Sodium hydroxide was added to the sucrose feed solution to
change the pH to approximately 10 in run 1-D, The resultant semi-log
population plot was extremely nonlinear due to multi-crystal growth
occurring above a 30 micron size range.
Run 2-D was similar to Run 6-B except that the solvent-to-water
ratio was changed to R = 2,5, In comparing the two runs, an increase
in R seems to have increased the nuclei density and decreased the
characteristic size. However, Run 2-D exhibited considerable multi
crystal agglomerative-type growth.
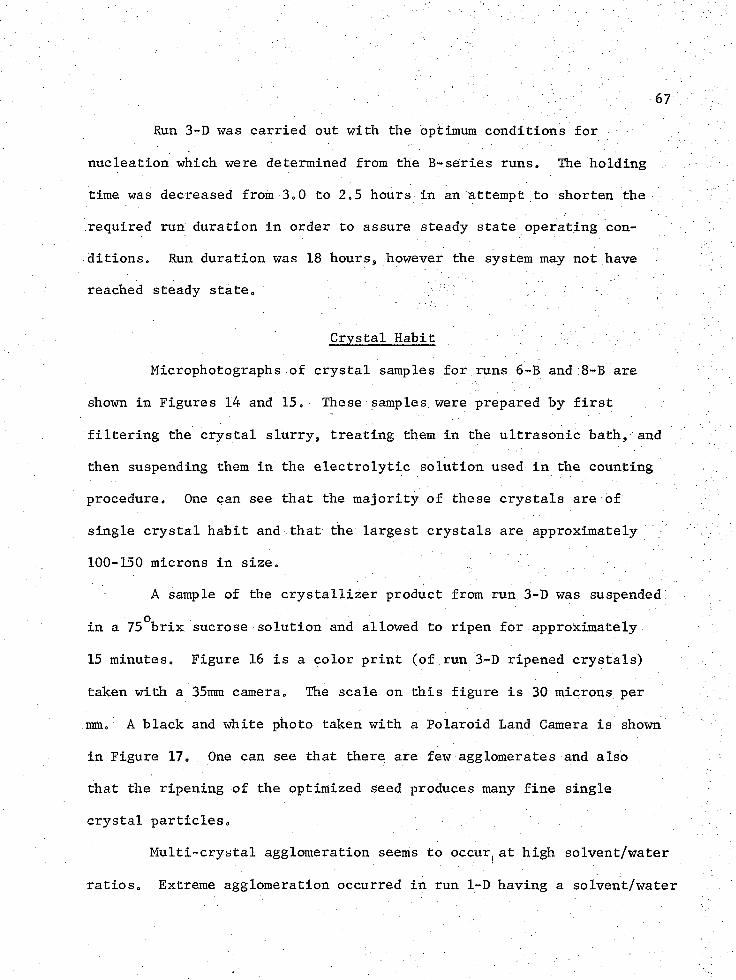
Run 3-D was carried out with the optimum conditions for
nucleation which were determined from the B-series runs. The holding
time was decreased from 3o0 to 2,5 hours in an attempt to shorten the
required run duration in order to assure steady state operating con
ditions, Run duration was 18 hours, however the system may not have
reached steady state.
Crystal Habit „
Microphotographs of crystal samples for runs 6 -B and 8 -B are
shown in Figures 14 and 15, These samples, were prepared by first
filtering the crystal slurry, treating them in the ultrasonic bath, and
then suspending them in the electrolytic solution used in the counting
procedure. One can see that the majority of these crystals are of
single crystal habit and that the largest crystals are approximately
100-150 microns in size,
A sample of the crystallizer product from run 3-D was suspended
in a 75 brix sucrose solution and allowed to ripen for approximately
15 minutes. Figure 16 is a color print (of run 3-D ripened crystals)
taken with a 35mm camera. The scale on this figure is 30 microns per
mm, A black and white photo taken with a Polaroid Land Camera is shown
in Figure 17, One can see that there are few agglomerates and also
that the ripening of the optimized seed produces many fine single
crystal particles.
Multi-crystal agglomeration seems to occur( at high solvent/water
ratios. Extreme agglomeration occurred in run 1-D having a solvent/water
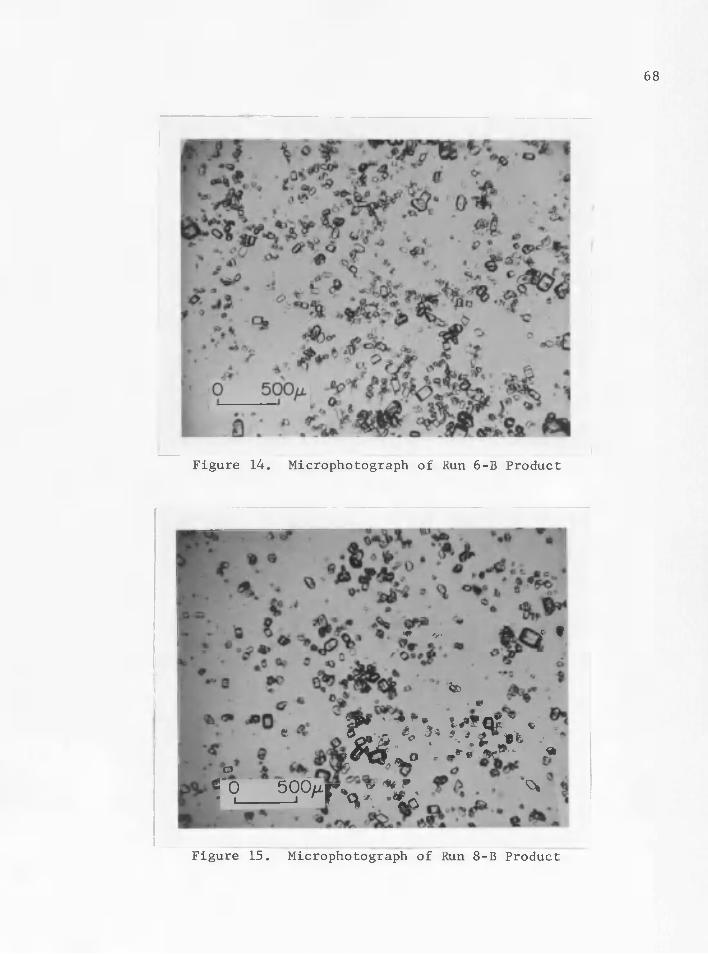
68
Figure 14. Microphotograph of Run 6-B Product
V <vj P t
<30. ct
e
oW > m \
rq_5S6'Tv% ^Figure 15. Microphotograph of Run 8-B Product
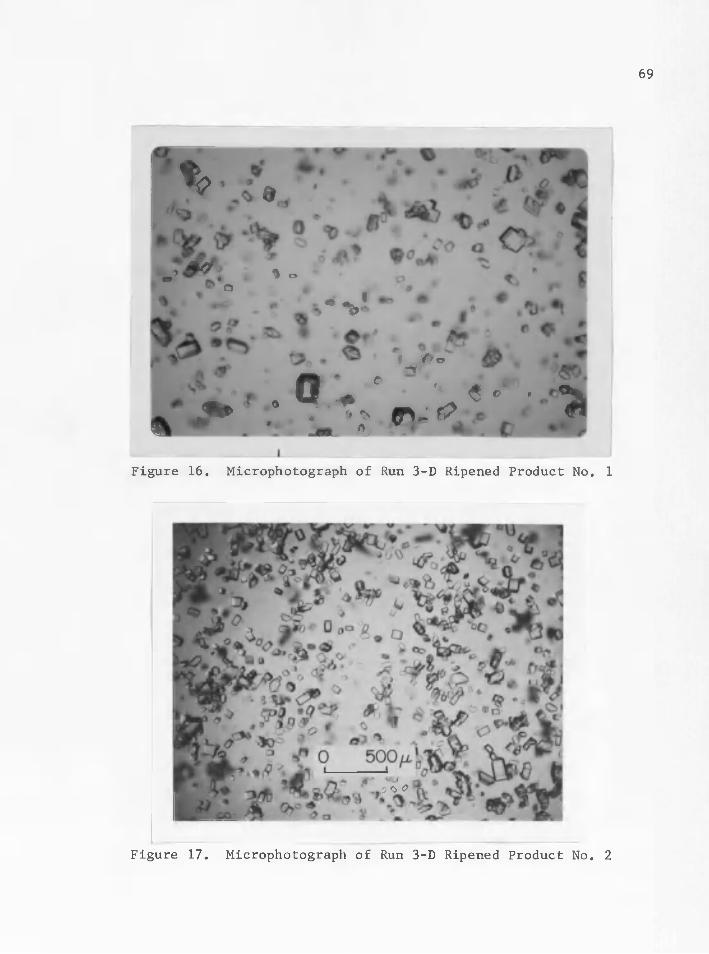
69
% a
* • " % • • • v’
* - > ' •“ % V , e > »0 .
’ r f f *
» « < 5 o - . %Figure 16. Microphotograph of Run 3-D Ripened Product No. 1
,o o <?
Figure 17. Microphotograph of Run 3-D Ripened Product No. 2
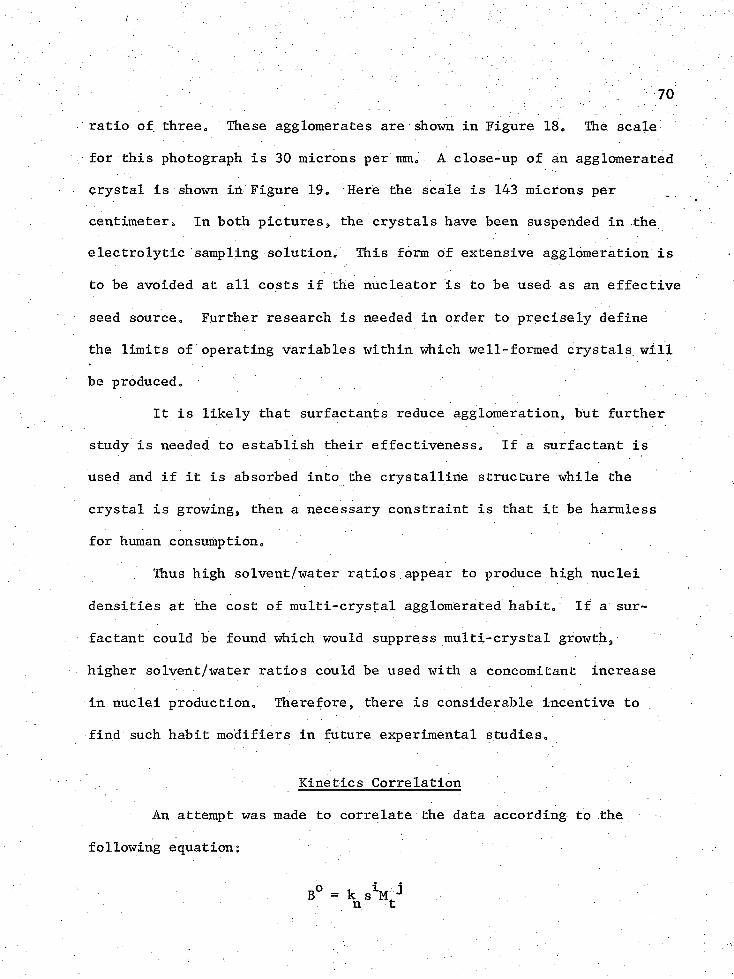
70ratio of three0 These agglomerates are shown in Figure 180 The scale
for this photograph is 30 microns per mmo A close-up of an agglomerated
crystal is shown in Figure 19„ Here the scale is 143 microns per
centimetere In both pictures, the crystals have been suspended in the
electrolytic sampling solution^ This form of extensive agglomeration is
to be avoided at all costs if the nucleator is to be used as an effective
seed sourceo Further research is needed in order to precisely define
the limits of operating variables within which well-formed crystals, will
be producedo
It is likely that surfactants reduce agglomeration, but further
study is needed to establish their effectiveness. If a surfactant is
used and if it is absorbed into the crystalline structure while the
crystal is growing, then a necessary constraint is that it be harmless
for human consumption.
Thus high solvent/water ratios appear to produce high nuclei
densities at the cost of multi-crystal agglomerated habit. If a sur
factant could be found which would suppress multi-crystal growth,
higher solvent/water ratios could be used with a concomitant increase
in nuclei production. Therefore, there is considerable incentive to
find such habit modifiers in future experimental studies.
Kinetics Correlation
An attempt was made to correlate the data according to the
following equation:
B° = V V
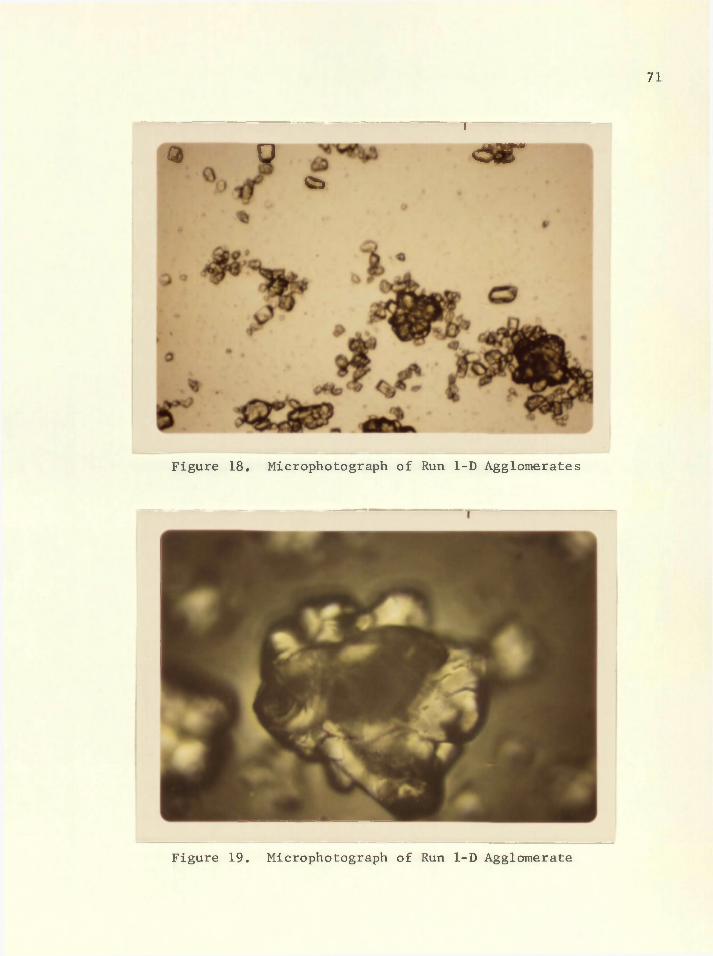
71
l
a o <sr= »
Figure 18. Microphotograph of Run 1-D Agglomerates
Figure 19. Microphotograph of Run 1-D Agglomerate
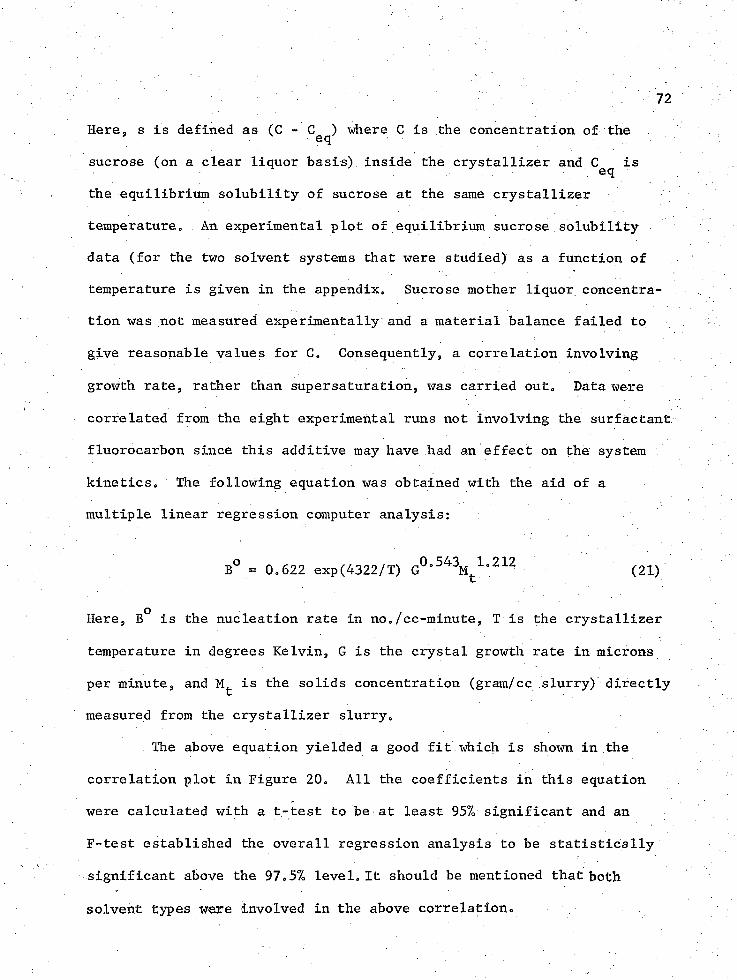
72Here, s is defined as (C - C ) where C is the concentration of theeqsucrose (on a clear liquor basis) inside the crystallizer and is
the equilibrium solubility of sucrose at the same crystallizer
temperature. An experimental plot of equilibrium sucrose solubility
data (for the two solvent systems that were studied) as a function of
temperature is given in the appendix. Sucrose mother liquor concentra
tion was not measured experimentally and a material balance failed to
give reasonable values for C, Consequently, a correlation involving
growth rate, rather than supersaturation, was carried out. Data were
correlated from the eight experimental runs not involving the surfactant
fluorocarbon since this additive may have had an effect on the system
kinetics. The following equation was obtained with the aid of a
multiple linear regression computer analysis:
B° = 0,622 exp(4322/T) G0 o5 4 3M t 1 °2 1 2 (21)
Here, B° is the nucleation rate in no*/cc-minute, T is the crystallizer
temperature in degrees Kelvin, G is the crystal growth rate in microns
per minute, and is the solids concentration (gram/cc slurry) directly
measured from the crystallizer slurry0
The above equation yielded a good fit which is shown in the
correlation plot in Figure 20, All the coefficients in this equation
were calculated with a t-test to be at least 95% significant and an
F-test established the overall regression analysis to be statistically
significant above the 97,5% level. It should be mentioned that both
solvent types were involved in the above correlationo
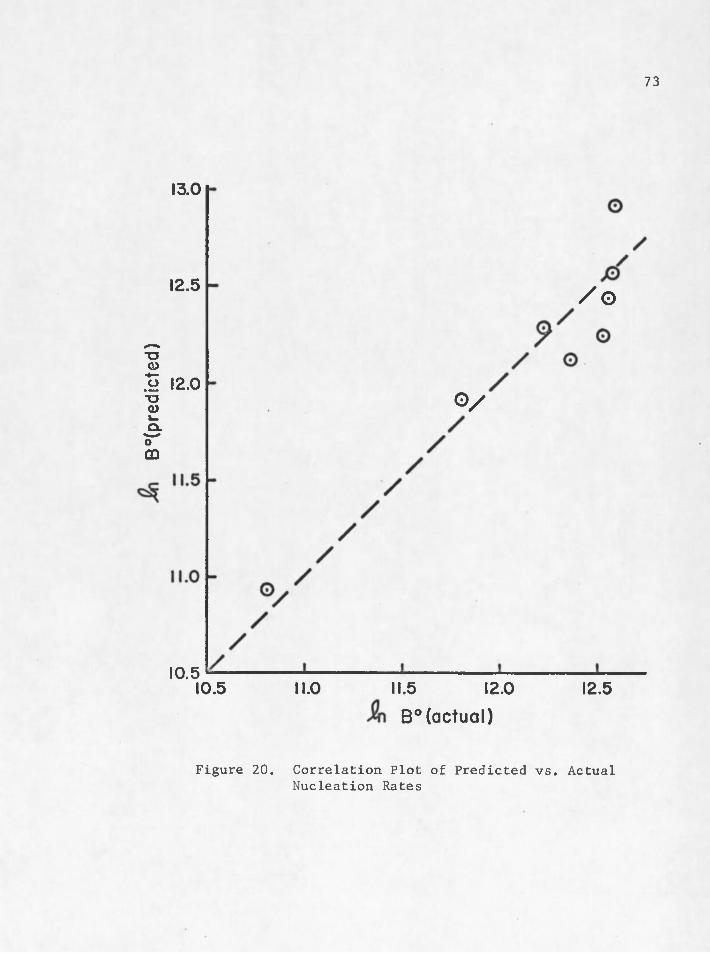
B "(
pred
icte
d)
73
13.0
12.5 Zo
12.0O /
10.510.5 11.0 11.5 12.0 12.5B ° ( a c t u a l )
Figure 20. Correlation Plot of Predicted vs. Actual Nucleation Rates
>'■■■■ : , . 7 4
As was expected from the experimental results, one can see from
equation 2 1 that a decrease in temperature will increase the nucleation
rate over the range of the independent variables that were studied0
CHAPTER VIIPROCESS CALCULATIONS
Computer simulations of a three stage continuous sucrose
crystallization unit were carried out during the course of the research
worko Use was made of the steady state CSD Mark I-A program written by
Nuttal (1970)o In a typical simulation, the production and flow rates
along with seeding, classification and growth rate dependency (if any)
are read in as data and the program then calculates the level of the
driving forces that are required in order to produce the specified
production,
Nucleator/Ripener/F,C,Crystallizer
The first stage of the continuous sugar crystallizer was assumed
to be a 30 gallon MSMPR nucleator which operated at conditions similar to
run 7 -B but without any surfactants and with a pure ethanol solvent
system. The nucleator operated at a holding time of 3 hours and a
solids concentration of 0,42 grams/cc. The production in this stage was60.33 tons per day. Nuclei density was assumed to be 5.0 x 10 no./cc-
micron and the growth rate was determined to be 0i063 microns per minute.
The CSD for this stage is shown in Figure 21. The average size (popula
tion weighted) for this distribution was calculated to be 11.4 microns.
On a weight basis, the average size was 45.54 microns and the coeffic
ient of variation was 0.4999.
75
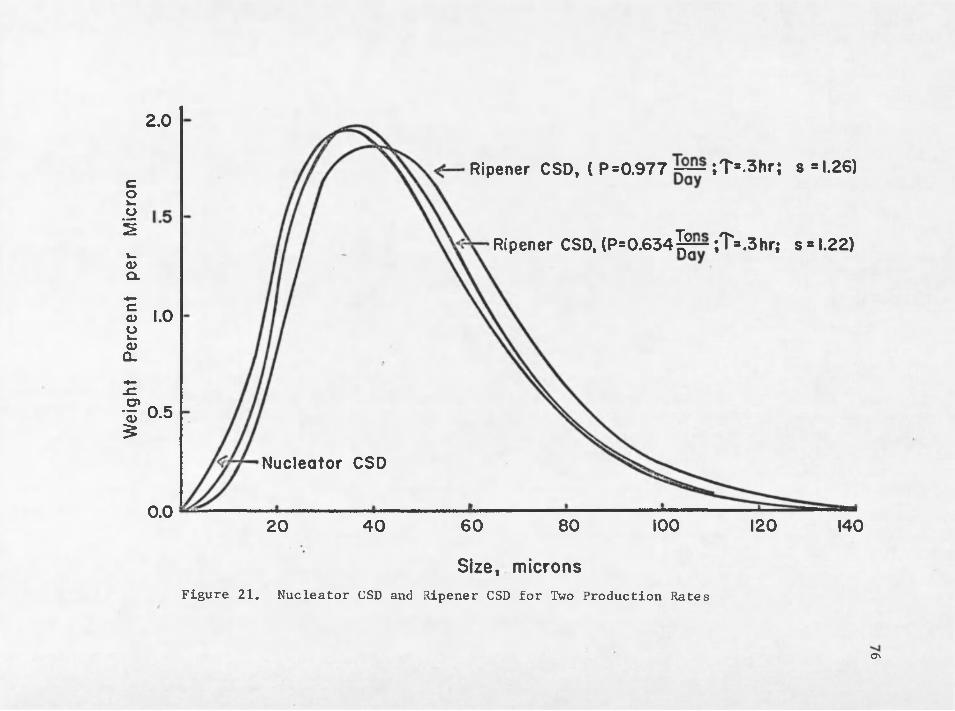
Wei
ght
Per
cent
pe
r M
icro
n2.0
Ripener CSD, ( P =0.977 ~ ; T s .3hr; s = 1.26)
Ripener CSD, (P = 0 .6 3 4 ^ ~ ;T=.3hr; s = 1.22)
1.0
0.5
Nucleator CSD
0.0 100 1208060 1404 020Size, microns
Figure 21. Nucleator CSD and Ripener CSD for Two Production Rates
ON
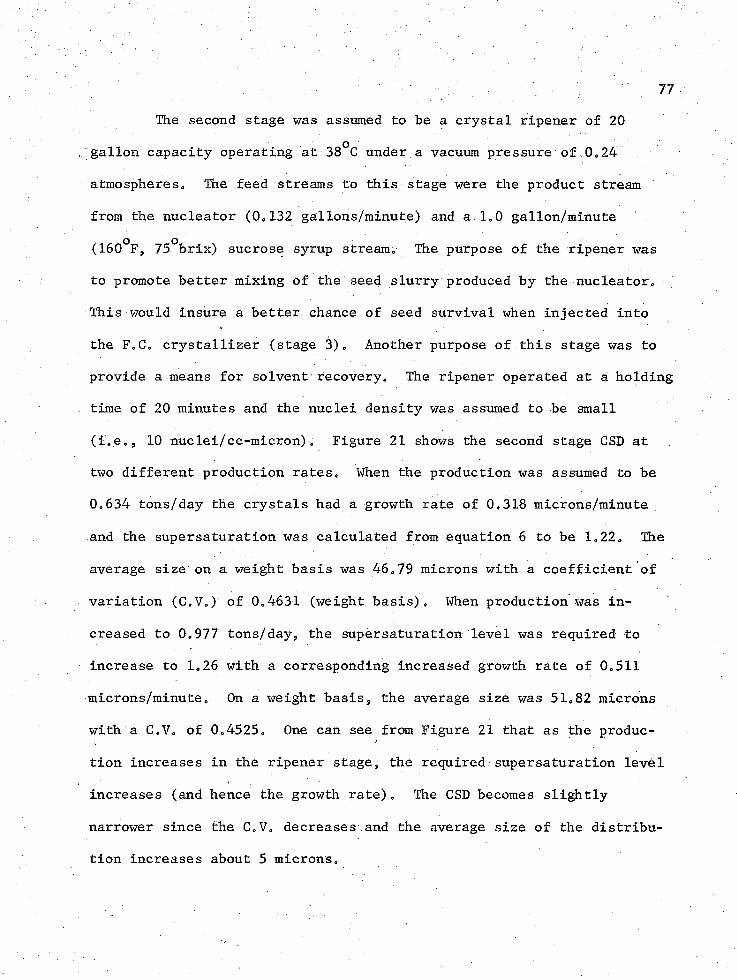
. ■ ■ ■ ■ ■ : ■ 77The second stage was assumed to be a crystal ripener of 20
gallon capacity operating at 38 C under a vacuum pressure of 0.24
atmosphereSo The feed streams to this stage were the product stream
from the nucleator (0o132 galIons/minute) and a 1»0 gallon/minute
(160 F, 75 brix) sucrose syrup stream* The purpose of the ripener was
to promote better mixing of the seed slurry produced by the nucleator*
This would insure a better chance of seed survival when injected into
the F o C » crystallizer (stage 3) 0 Another purpose of this stage was to
provide a means for solvent recovery* The ripener operated at a holding
time of 2 0 minutes and the nuclei density was assumed to be small
(io.e* 9 10 nuclei/cc-micron) * Figure 21 shows the second stage .OSD at
two different production rates* When the production was assumed to be
0*634 tons/day the crystals had a growth rate of 0*318 microns/minute
and the supersaturation was calculated from equation 6 to be 1*22* The
average size on a weight basis was 46*79 microns with a coefficient of
variation ( C * V * ) of 0*4631 (weight basis)* When production was in
creased to 0*977 tons/day9 the supersaturation level was required to
increase to 1*26 with a corresponding increased growth rate of 0*511
microns/minute* On a weight basis, the average size was 51*82 microns
with a C o V * of 0*4525* One can see from Figure 21 that as the produc
tion increases in the ripener stage, the required supersaturation level
increases (and hence the growth rate)* The C S D becomes slightly
narrower since the C*V. decreases and the average size of the distribu
tion increases about 5 microns*
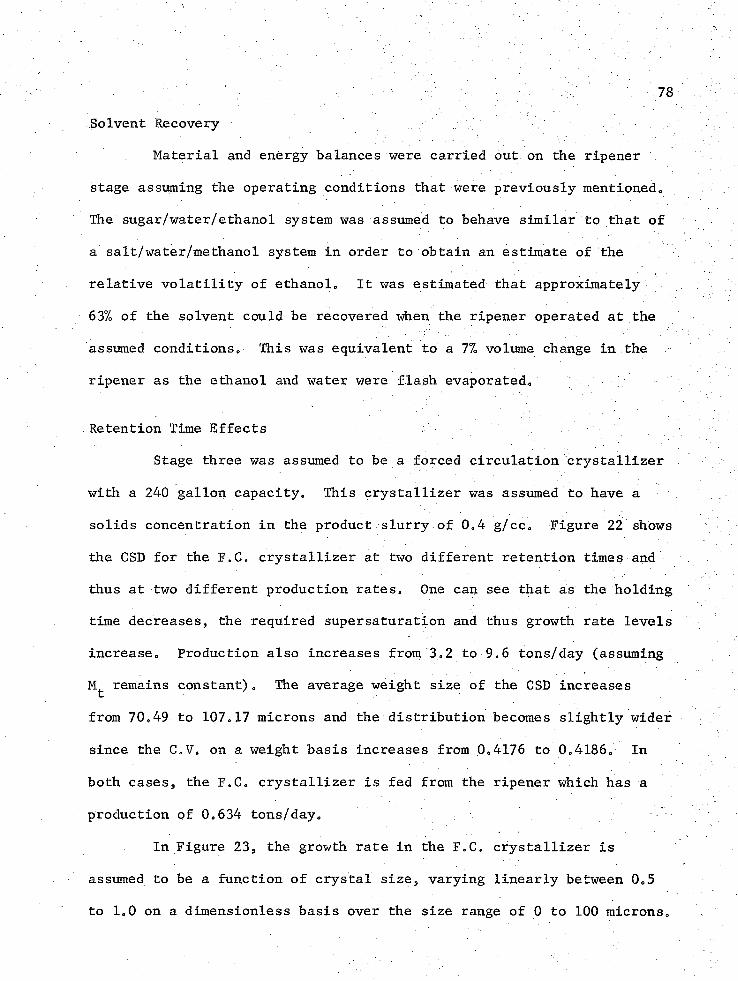
: - - ' . 78Solvent Recovery
Material and energy balances were carried out on the ripener .
stage assuming the operating conditions that were previously mentioned.
The sugar/water/ethanol system was assumed to behave similar to that of
a salt/water/methanol system in order to obtain an estimate of the
relative volatility of ethanolo It was.estimated that approximately
63% of the solvent could be recovered when the ripener operated at the
assumed conditions. This was equivalent to a 7% volume change in the
ripener as the ethanol and water were flash evaporated.
Retention Time Effects
Stage three was assumed to be a forced circulation crystallizer
with a 240 gallon capacity. This crystallizer was assumed to have a
solids concentration in the product slurry of 0,4 g/cc. Figure 22 shows
the CSD for the F„C, crystallizer at two different retention times and
thus at two different production rates. One can see that as the holding
time decreases, the required supersaturation and thus growth rate levels
increase. Production also increases from 3,2 to 9,6 tons/day (assuming
M t remains constant), The average weight size of the CSD increases
from 70,49 to 107,17 microns and the distribution becomes slightly wider
since the C,V, on a weight basis increases from 0,4176 to 0,4.186, In
both cases, the F,C, crystallizer is fed from the ripener which has a
production of 0,634 tons/day.
In Figure 23, the growth rate in the F,C. crystallizer is
assumed to be a function of crystal size, varying linearly between 0 , 5
to 1 , 0 on a dimensionless basis over the size range of 0 to 1 0 0 microns.
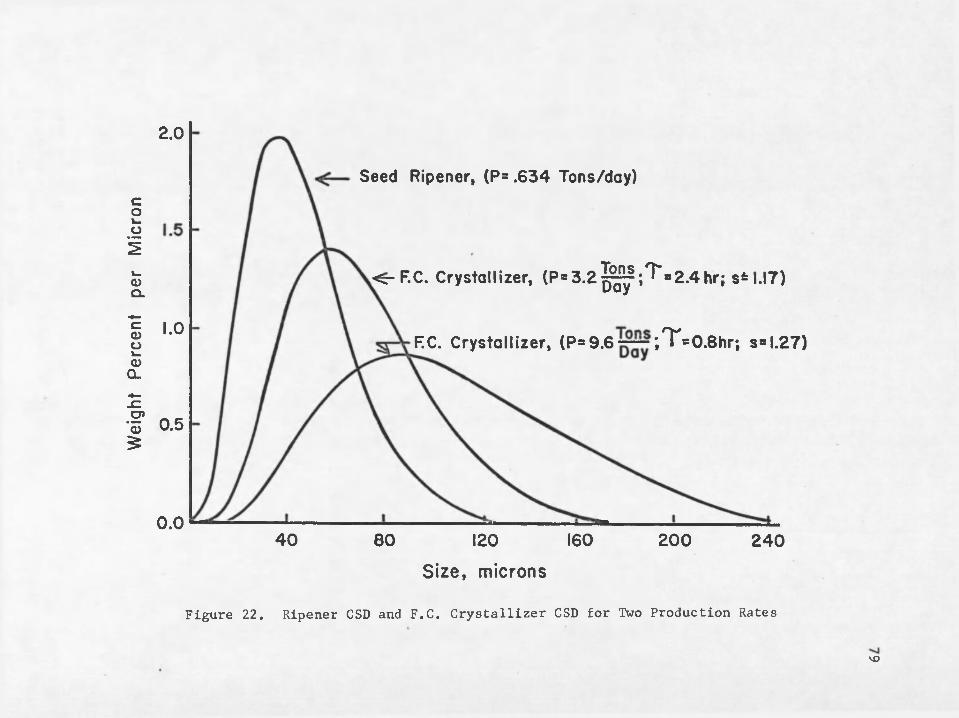
Wei
ght
Per
cent
pe
r M
icro
n2.0
Seed Ripener, (P= .634 Tons/day)
«r-F.C. Crystallizes (P= 3 . 2 ^ ; ^ = 2 . 4 hr; sM.I7)
1.0F.C. Crystallizes (P=9.6~~;T=0.8hr; s=l.27)
0.5
0.04 0 16080 200120 2 4 0
Size , microns
Figure 22. Ripener CSD and F.C. Crystallizer CSD for Two Production Rates
VO

Wei
ght
Per
cent
pe
r M
icro
n2.0
,<f—Seed Ripener, (P= 0 .634 Ton/day)
1.0F C. Crystallize^ ( P = 9 . 6 ^ ; ^ = 0 .8 ; s=l.3l)
0.5
0.0 200 240120 1604 0 80
Size , microns
Figure 23. Ripener CSD and F.C. Crystallizer CSD with Growth Rate Dependency on Size
ooo
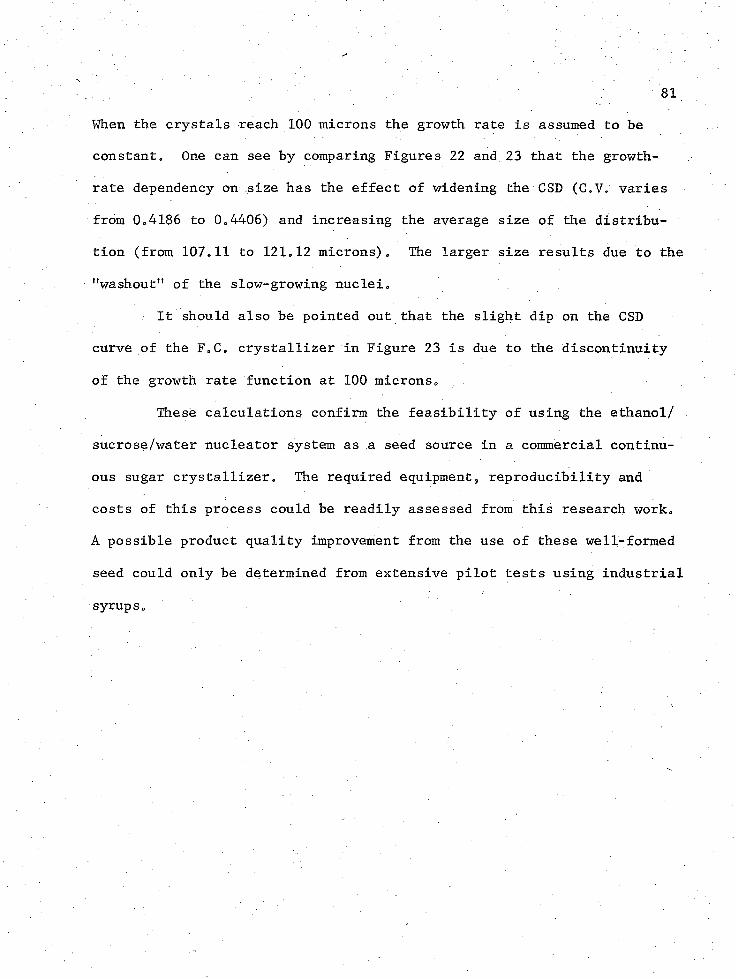
When the crystals reach 100 microns the growth rate is assumed to be
constanto One can see by comparing Figures 22 and 23 that the growth-
rate dependency on size has the effect of widening the CSD (C.V.. varies
from 0.4186 to 0.4406) and increasing the average size of the distribu
tion (from 107.11 to 121.12 microns). The larger size results due to the
"washout" of the slow-growing nuclei.
It should also be pointed out that the slight dip on the CSD
curve of the F.C. crystallizer in Figure 23 is due to the discontinuity
of the growth rate function at 1 0 0 microns.
These calculations confirm the feasibility of using the ethanol/
sucrose/water nucleator system as a seed source in a commercial continu
ous sugar crystallizer. The required equipment, reproducibility and
costs of this process could be readily assessed from this research work.
A possible product quality improvement from the use of these well-formed
seed could only be determined from extensive pilot tests using industrial
syrups.
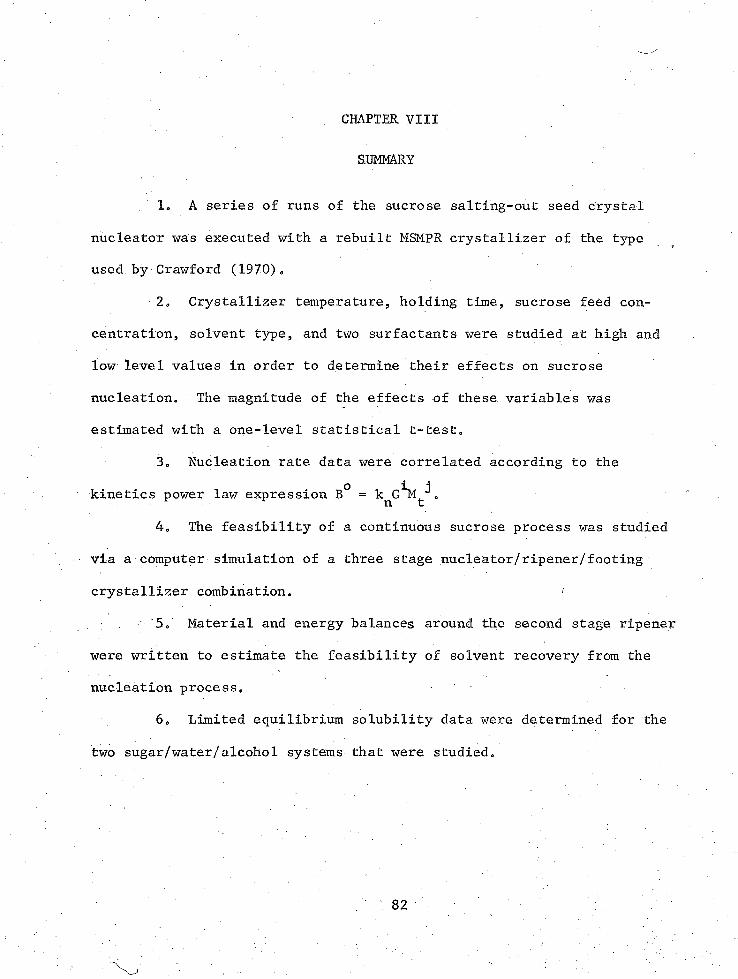
CHAPTER VIII
SUMMARY
1* A series of runs of the sucrose salting-out seed crystal
nucleator was executed with a rebuilt MSMPR crystallizer of the type
used by Crawford (1970)0
2o Crystallizer temperature, holding time, sucrose feed con
centration, solvent type, and two surfactants were studied at high and
low level values in order to determine their effects on sucrose
nucleation. The magnitude of the effects of these variables was
estimated with a one-level statistical t-test.
3 0 Nucleation rate data were correlated according to the
kinetics power law expression B° = k^G^I^ ,
4 0 The feasibility of a continuous sucrose process was studied
via a computer simulation of a three stage nucleator/ripener/footing
crystallizer combination. z
5. Material and energy balances around the second stage ripener
were written to estimate the feasibility of solvent recovery from the
nucleation process. "
6 . Limited equilibrium solubility data were determined for the
two sugar/water/alcohol systems that were studied.
82
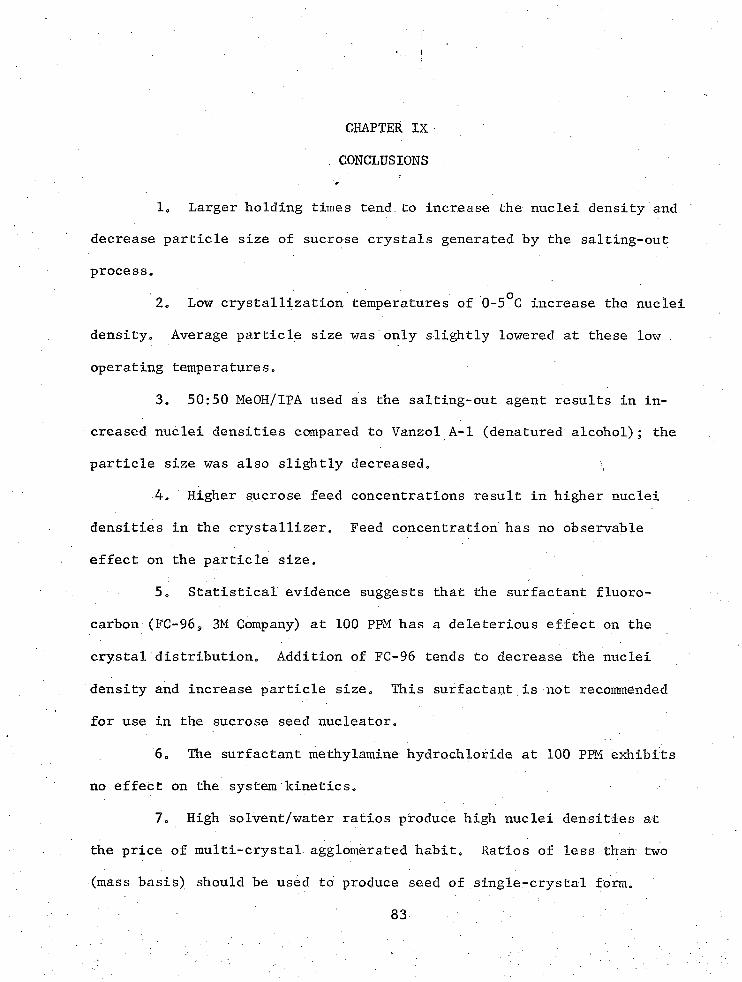
CHAPTER IX
. CONCLUSIONS
lo Larger holding times tend to increase the nuclei density and
decrease particle size of sucrose crystals generated by the salting-out
process.O2 0 Low crystallization temperatures of 0-5 C increase the nuclei
density. Average particle size was only slightly lowered at these low
operating temperatures.
3. 50:50 MeOH/IPA used as the salting-out agent results in in
creased nuclei densities compared to Vanzol A-l (denatured alcohol); the
particle size was also slightly decreased.
4. Higher sucrose feed concentrations result in higher nuclei
densities in the crystallizer. Feed concentration has no observable
effect on the particle size.
5. Statistical evidence suggests that the surfactant fluoro-
carbon (FC-96, 3M Company) at 100 PPM has a deleterious effect on the
crystal distribution. Addition of FC-96 tends to decrease the nuclei
density and increase particle size. This surfactant is not recommended
for use in the sucrose seed nucleator.
6 . The surfactant methylamine hydrochloride at 100 PPM exhibits
no effect on the system kinetics.
7. High solvent/water ratios produce high nuclei densities at
the price of multi-crystal agglomerated habit. Ratios of less than two
(mass basis) should be used to produce seed of single-crystal form.
83
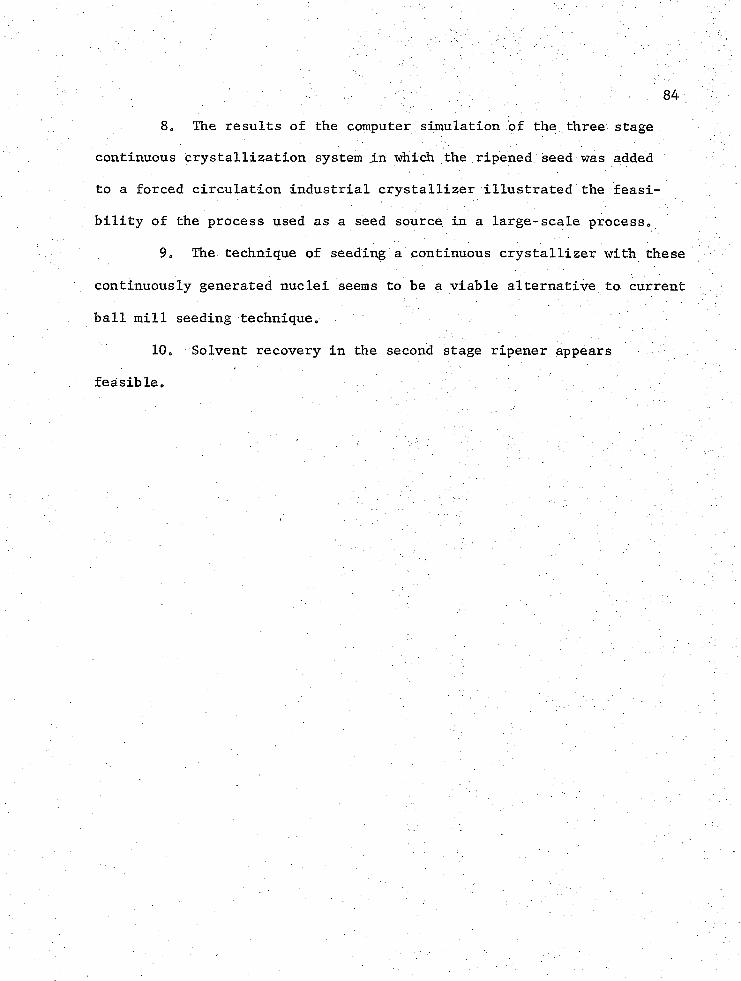
■ ■■ . ■ ■' ; r ' / : " ̂ ' 8480 The results of the computer simulation of the three stage
continuous crystallization system in which the ripened seed was added
to a forced circulation industrial crystallizer illustrated the feasi
bility of the process used as a seed source in a large-scale process0
9. The technique of seeding a continuous crystallizer with these
continuously generated nuclei seems to be a viable alternative to current
ball mill seeding technique0
10o Solvent recovery in the second stage ripener appears
feasible.
CHAPTER X
RECOMMENDATIONS
1. Future experiments should quantitatively investigate the
effects of the key independent variables upon the system kinetics.
Wider ranges of these independent variables should be studied.
2. Extensive study of the effects of additives should be made.
It may be possible to optimize the system kinetics and/or reduce
agglomeration through the use of various non-toxic surfactants. If a
surfactant habit modifier could be found which would suppress multi-
crystal growth, higher solvent/water ratios could be used with a con-
committant increase in nuclei production. Thus, there is considerable
incentive to find such habit modifiers in future experimental studies.
3. Future research should investigate the effects of feed pH
and temperature on system kinetics. These variables are directly
related to the degree of inversion in the syrup. Work in the literature
indicates invert sugar affects crystal growth rate. The specific
effects of sucrose inversion on nucleation rate and crystal habit should
be quantitatively determined.\4. The differences of beet vs. cane sugar on nucleation kinetics
and crystal habit should also be studied. Different impurities exist in
these sugars which may have different effects on system kinetics.
5. The effect of agitation on crystal habit and system kinetics
shquId be quantitatively investigated.
85
866 e The apparatus should be rebuilt so that long-term unattended
runs can be made. This will enable study of possible habit improvement
to be gained with lower supersaturation driving forces and perhaps will
allow operation at higher solvent/water ratios without making crystals
of multi-crystal habit. . Long-term fouling tendencies can also be
studied with such unattended runs.
7o The seed crystal nucleation process of this study should be
implemented at the pilot plant level in a commercial sucrose refinery0
Product quality improvement using these seed should be quantitatively
determined.
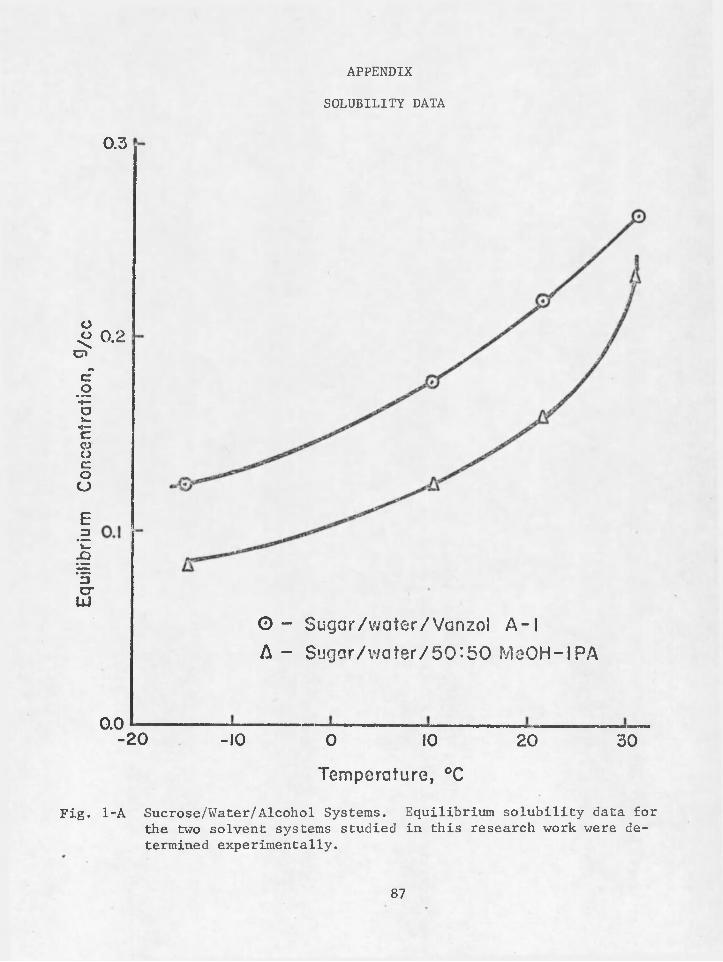
Equi
libr
ium
C
once
ntra
tion
, 9
/cc
APPENDIXSOLUBILITY DATA
0 .3
0.2
O - S u g a r / w a t e r / V a n z o l A - 1
A - S u g a r / v / a t e r / 5 0 : 5 0 M e O H - I P A
0.0- 2 0 - 1 0 0 10 2 0 3 0
T e m p e r a t u r e , °C
Fig. 1-A Sucrose/Water/Alcohol Systems. Equilibrium solubility data for the two solvent systems studied in this research work were determined experimentally.
87
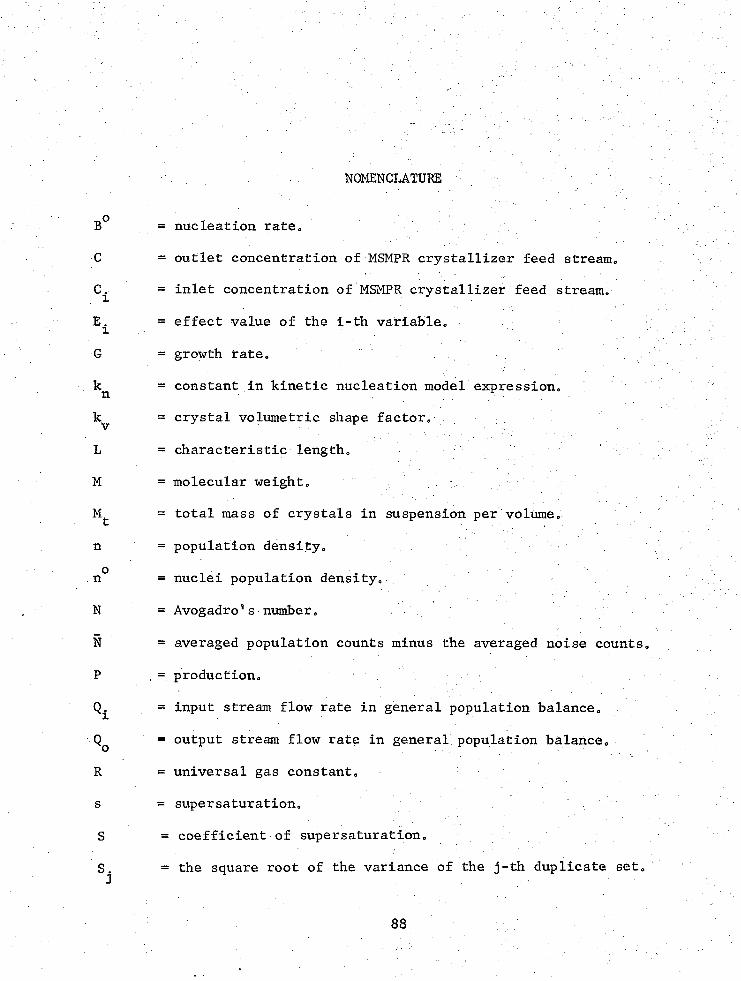
NOMENCLATURE
B° = nucleation rate*
C = outlet concentration of MSMPR crystallizer feed stream,,
C . = inlet concentration of MSMPR crystallizer feed stream,
E. = effect value of the i-th variable,
G = growth rate.
k = constant in kinetic nucleation model expression.n
k = crystal volumetric shape factor.v - ' ■ ■ ■ ■ ; : , ■
L = characteristic length. . ' ;
M = molecular weight.
M = total mass of crystals in suspension per volume,
n = population density.
n° = nuclei population density.
N = Avogadro s number„
N = averaged population counts minus the averaged noise counts.
P ,= production.
= input stream flow rate in general population balance.
Q = output stream flow rate in general population balance.° ' ' - -
R = universal gas constant,
s = supersaturation.
S = coefficient of supersaturation.
S. = the square root of the variance of the j-th duplicate set.
88
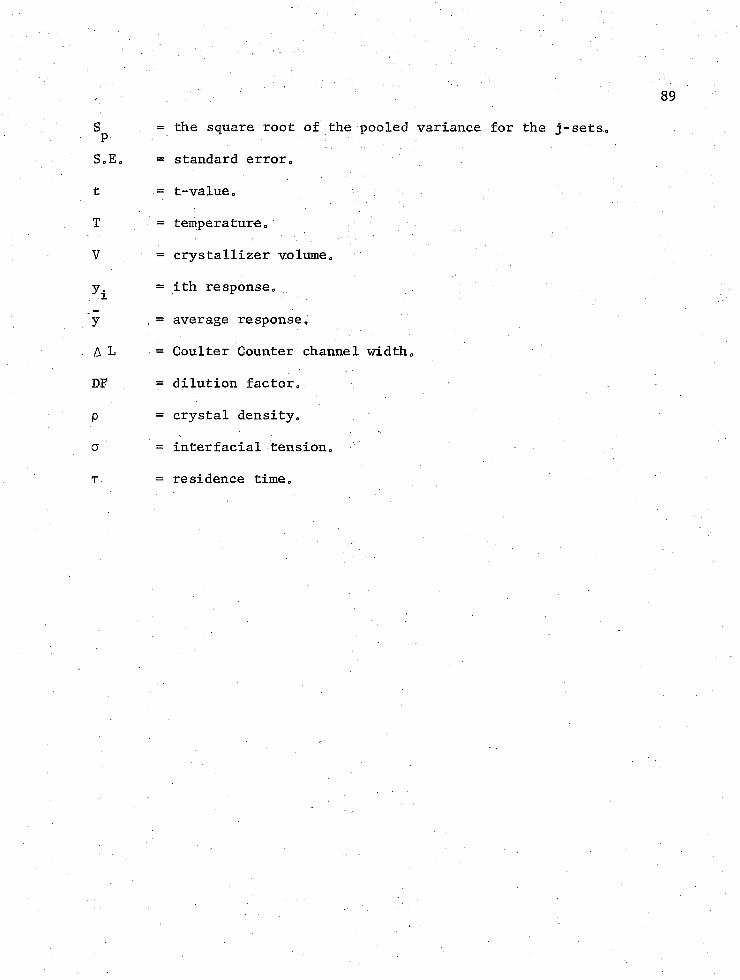
the square root of the pooled variance for the
standard error.
t-value.
temperature.
crystallizer volume.
ith response.
average response.
Coulter Counter channel width,
dilution factor,
crystal density,
interfacial tension,
residence time.
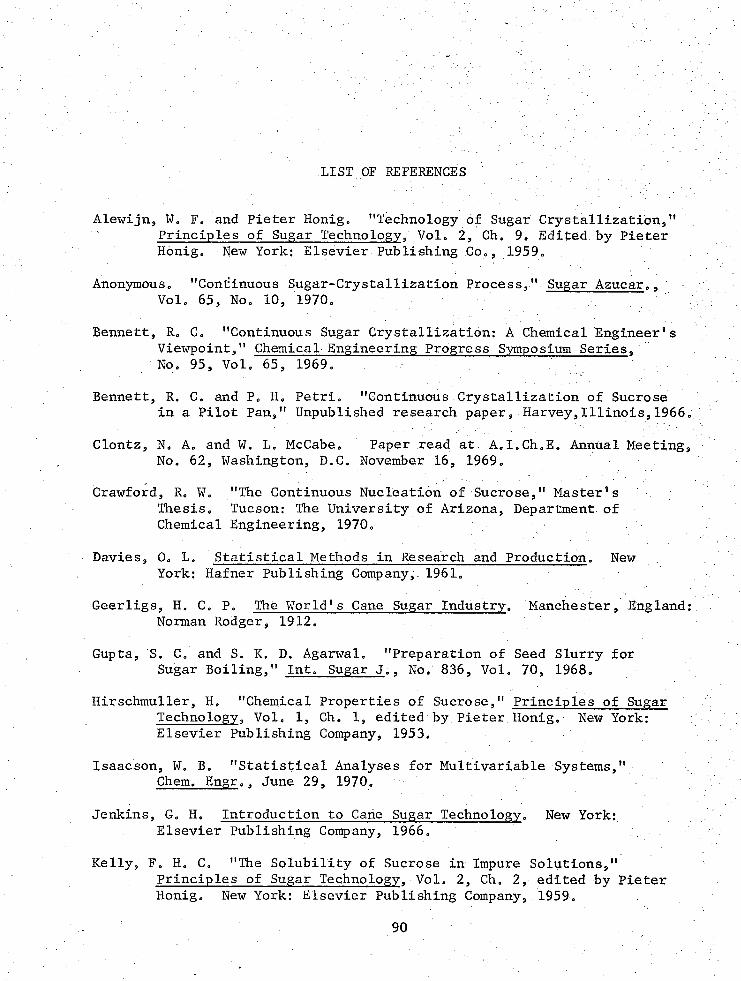
LIST.OF REFERENCES
Alewijn, W„ F. and Pieter Honig. "Technology of Sugar Crystallization," Principles of Sugar Technology, Vol. 2, Ch. 9. Edited, by Pieter Honig. New York: Elsevier Publishing Co., 1959.
Anonymous. "Continuous Sugar-Crystallization Process," Sugar Azucar., Vol. 65, No. 10, 1970.
Bennett, R. C. "Continuous Sugar Crystallization: A Chemical Engineer's Viewpoint," Chemical Engineering Progress Symposium Series,No. 95, Vol. 65, 1969.
Bennett, R. C„ and P. H. Petri. "Continuous Crystallization of Sucrosein a Pilot Pan," Unpublished research paper, Harvey,Illinois,1966
Clontz, N. A. and W. L. McCabe. Paper read at A.I.Ch.E. Annual Meeting No. 62, Washington, B.C. November 16, 1969.
Crawford, R. W. "The Continuous Nucleation of Sucrose," Master's Thesis. Tucson: The University of Arizona, Department of Chemical Engineering, 1970.
Davies, 0. L. Statistical Methods in Research and Production. New York: Hafner Publishing Company, 1961.
Geerligs, H. C. P. The World's Cane Sugar Industry. Manchester, England Norman Rodger, 1912.
Gupta, S. C. and S. K. D. Agarwal. "Preparation of Seed Slurry for Sugar Boiling," Int. Sugar J ., No. 836, Vol. 70, 1968.
Hirschmuller, H„ "Chemical Properties of Sucrose," Principles of Sugar Technology, Vol. 1, Ch. 1, edited by Pieter Honig. New York: Elsevier Publishing Company, 1953.
Isaacson, W. B. "Statistical Analyses for Multivariable Systems,"Chem. Engr., June 29, 1970.
Jenkins, G. H. Introduction to Cane Sugar Technology. New York:Elsevier Publishing Company, 1966.
Kelly, F. H. C. "The Solubility of Sucrose in Impure Solutions,"Principles of Sugar Technology, Vol. 2, Ch. 2, edited by Pieter Honig. New York: Elsevier Publishing Company, 1959.
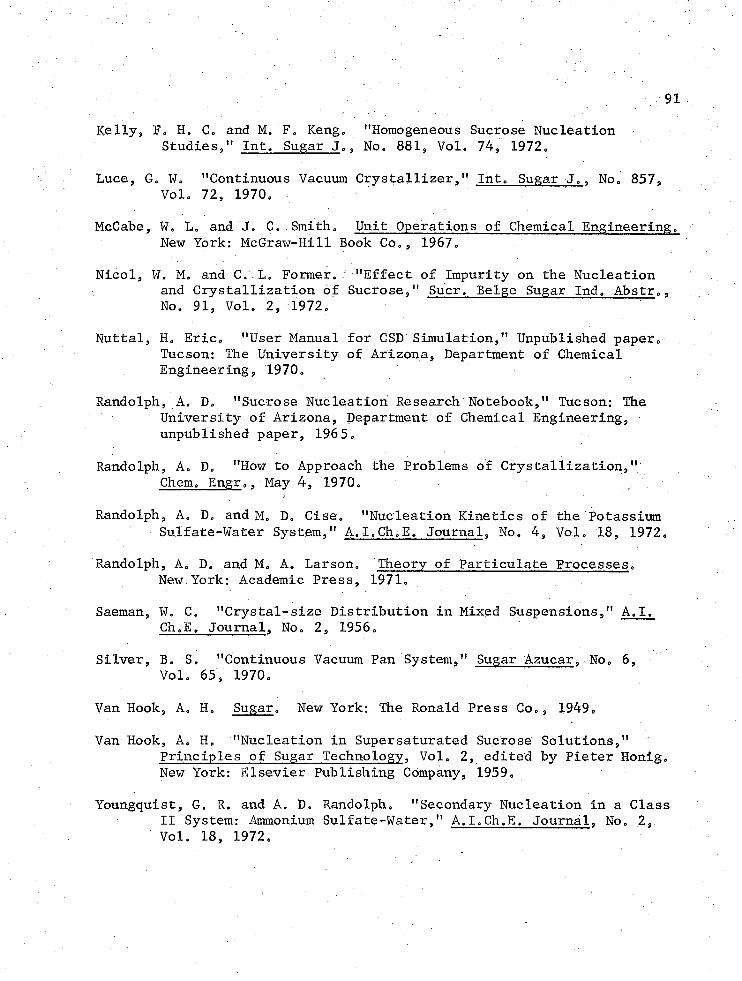
91Kelly, F. H. C. and M. F. Keng. "Homogeneous Sucrose Nucleation
Studies," Int. Sugar J ., No. 881, Vol. 74, 1972.
Luce, G. W. "Continuous Vacuum Crystallizer," Int. Sugar J.. No. 857, Vol. 72, 1970.
McCabe, W. L. and J . C. Smith. Unit Operations of Chemical Engineering. New York: McGraw-Hill Book Co., 1967.
Nicol, W. M. and C. L, Former. "Effect of Impurity on the Nucleation and Crystallization of Sucrose," Suer. Beige Sugar Ind. Abstr., No. 91, Vol. 2, 1972.
Nuttal, H. Eric. "User Manual for CSD Simulation," Unpublished paper. Tucson: The University of Arizona, Department of Chemical Engineering, 1970.
Randolph, A. D. "Sucrose Nucleation Research Notebook," Tucson: The University of Arizona, Department of Chemical Engineering, unpublished paper, 1965.
Randolph, A. D. "How to Approach the Problems of Crystallization,"Chem. Engr., May 4, 1970.
Randolph, A. D. and M. D. Cise. "Nucleation Kinetics of the Potassium Sulfate-Water System," A.I.Ch.E. Journal, No. 4, Vol. 18, 1972.
Randolph, A. D. and M, A. Larson. Theory of Particulate Processes.New.York: Academic Press, 1971,
Saeman, W. C. "Crystal-size Distribution in Mixed Suspensions," A.I. Ch.E. Journal, No. 2, 1956.
Silver, B. S. "Continuous Vacuum Pan System," Sugar Azucar, No. 6,Vol. 65, 1970.
Van Hook, A. H. Sugar. New York: The Ronald Press Co., 1949.
Van Hook, A. H. "Nucleation in Supersaturated Sucrose Solutions,"Principles of Sugar Technology, Vol. 2, edited by Pieter Honig. New York: Elsevier Publishing Company, 1959.
Youngquist, G. R. and A. D. Randolph. "Secondary Nucleation in a Class II System: Ammonium Sulfate-Water," A.I.Ch.E. Journal, No. 2, Vol. 18, 1972.

-