Embed Size (px)
Citation preview
Colorado Department of Human Services
Office of Children, Youth and Family Services
Division of Youth Corrections
Continuum of Care Initiative Baseline Evaluation Report Fiscal Year 2005-06 and July-August 2006
October 2006

Page ii TriWest Group DYC Continuum of Care Baseline Evaluation Report
Page iii TriWest Group DYC Continuum of Care Baseline Evaluation Report
DYC Commitment Continuum
Continuum of Care Initiative Baseline Evaluation Report
Fiscal Year 2005-06 and July-August FY 2006/07
Table of Contents
Executive Summary ...................................................................................................... v
Background and Context.............................................................................................. 1
Scope of the Current Report ........................................................................................ 7
Youth Served ................................................................................................................. 9
Expenditures ............................................................................................................... 13
Preliminary Outcomes ............................................................................................... 17
Baseline Data: Future Evaluation Data...................................................................... 20
Conclusions and Recommendations ....................................................................... 24
Page iv TriWest Group DYC Continuum of Care Baseline Evaluation Report
List of Tables & Figures
Table 1: Footnote Requirements and Report Sections ................................................................7
Table 2: Continuum of Care Youth Served by DYC Commitment Population ..............................9
Table 3: Gender and Primary Ethnicity......................................................................................10
Table 4: Original Sentence Types of Continuum of Care Initiative Youth...................................10
Table 5: Expenditures Across DYC Management Regions .......................................................13
Table 6: Expenditures by Service Type.....................................................................................14
Table 7: Placement of Participating Youth as of Aug. 30, 2006 ................................................17
Table 8: Average Time in Commitment ...................................................................................18
Table 9: CJRA Domains............................................................................................................20
Table 10: Youth-Specific Evaluation Measures .........................................................................22
Table 11: System Effectiveness Measures................................................................................23
Figures
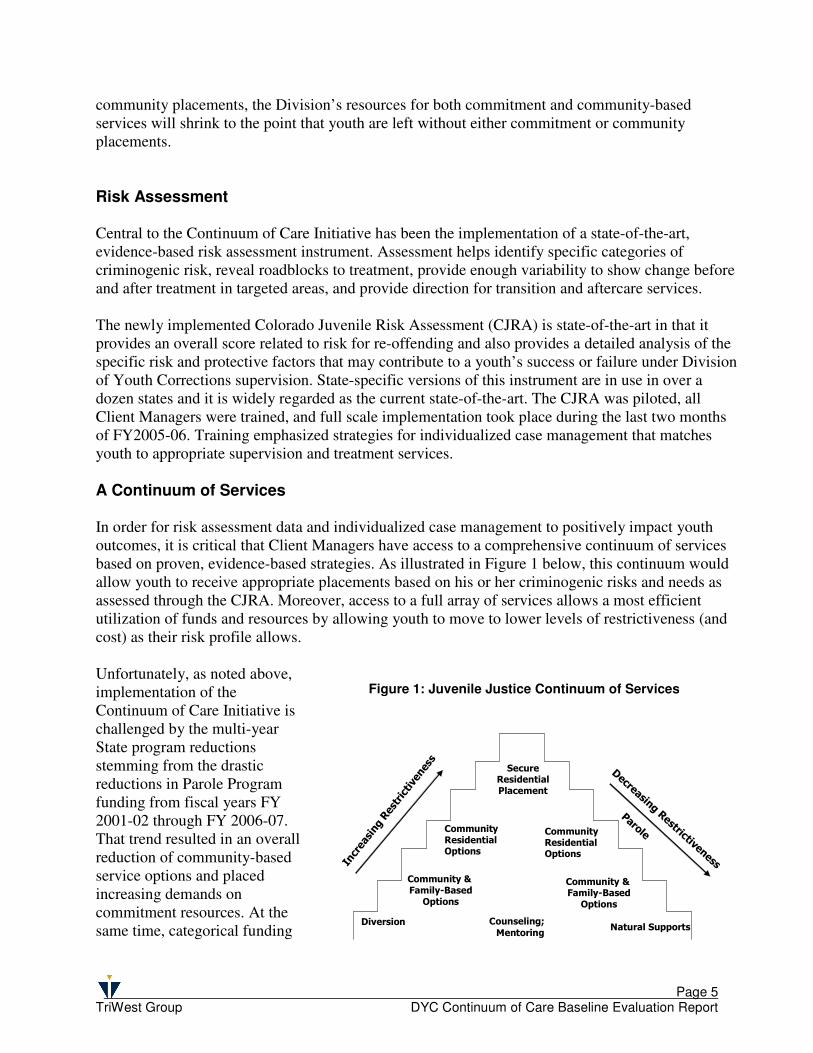
Figure 1: Juvenile Justice Continuum of Services ......................................................................5
Figure 2: Youth Served by DYC Management Region ................................................................9
Figure 3: CCI Distribution of Youth Served ...............................................................................12
Figure 4: Commitment ADP Rate Trends ..................................................................................19
Page v TriWest Group DYC Continuum of Care Baseline Evaluation Report
Executive Summary
Over the last two years, the Colorado Division of Youth Corrections (DYC) has undertaken a comprehensive systems improvement effort – the Continuum of Care Initiative. This initiative has brought significant attention and improvements to the Division’s continuum of services from pre-commitment (detention) services through commitment and parole. The Division of Youth Corrections sought authorization from the General Assembly to flexibly deploy funds from the Division’s Purchase of Contract Placements line along the continuum of services in order to optimize the availability of the most effective services in the most appropriate settings to meet the rehabilitation needs of juvenile offenders in the Division’s custody. Thus, the authorization contained in Footnote 84 of the FY2005-06 Long Bill is an important component of the overall Continuum of Care Initiative.
Context: The Continuum of Care Initiative
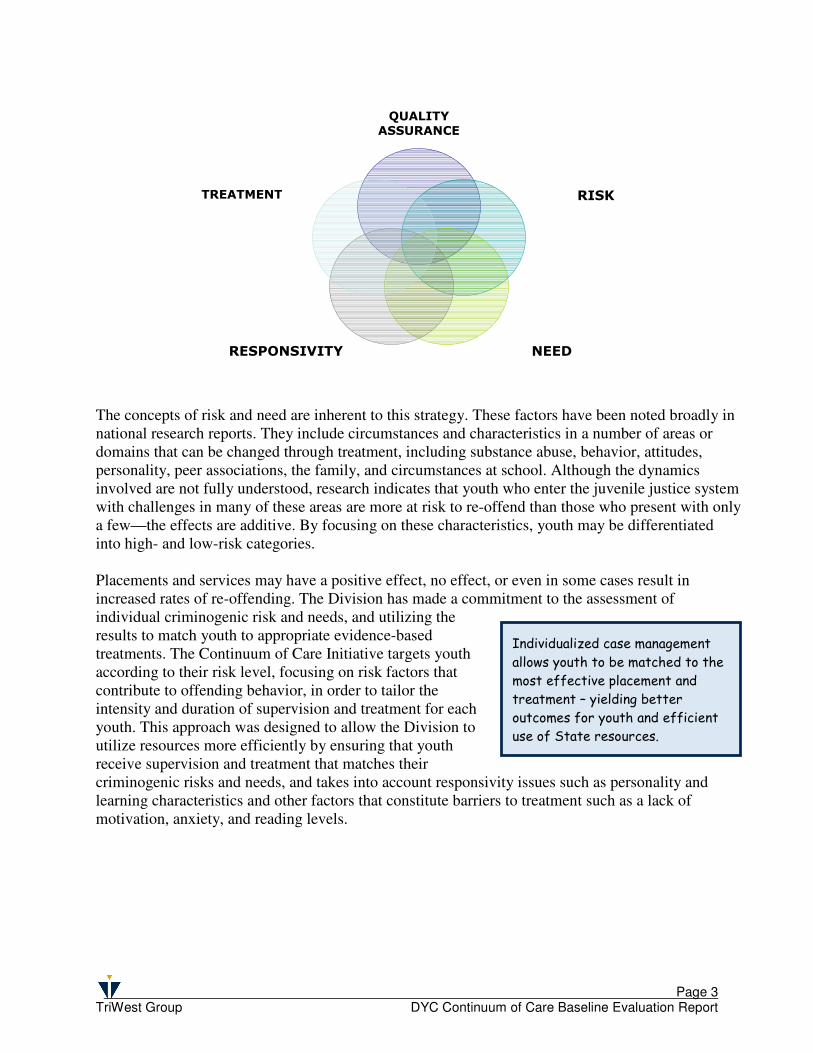
The Division of Youth Corrections (the Division), as part of its ongoing efforts to systematically pursue and utilize the most advanced strategies available for juvenile rehabilitation, has launched the Continuum of Care Initiative. The initiative is based on principles of effective juvenile justice strategy that have been proven through research and practice. These principles include an integrated strategy involving state-of-the-art assessment, enhanced treatment services within residential facilities, and improved transitions to appropriate community-based services. The Division made a commitment to examine and realign internal operational practices to be more consistent with the principles of evidence-based practice and a broader array of interventions that have the most research support for being effective in reducing recidivism and re-victimization by juvenile offenders. As part of this strategy, the Continuum of Care Initiative seeks to provide the optimal length of stay in each stage of service as juvenile offenders move from secure residential to community-based parole services. In order to ensure accurate and targeted information to support individualized case planning, the Division identified a state-of-the-art, empirically-based risk assessment instrument (the Washington State Juvenile Risk Assessment) modified and renamed the Colorado Juvenile Risk Assessment (CJRA) for use in Colorado1. The Continuum of Care Initiative is organized around the following, nationally recognized principles of effective practice: � Risk Principle: Target intensive services on higher risk youth. � Need Principle: Treat risk factors associated with offending behavior. � Treatment Principle: Employ evidence-based treatment approaches as available. � Responsivity Principle: Use individualized case management to tailor treatments to meet
special needs. � Quality Assurance (Fidelity) Principle: Monitor implementation quality and treatment
fidelity.
1 The CJRA is described in the body of this report, under Risk Assessment
Page vi TriWest Group DYC Continuum of Care Baseline Evaluation Report
Decreasing R
estrictiveness
Natural SupportsDiversion
Community
ResidentialOptions
SecureResidential Placement
Parole
Counseling;
Mentoring
Increasing Restrictiveness
Community & Family-Based
Options
Community Residential
Options
Community &
Family-BasedOptions
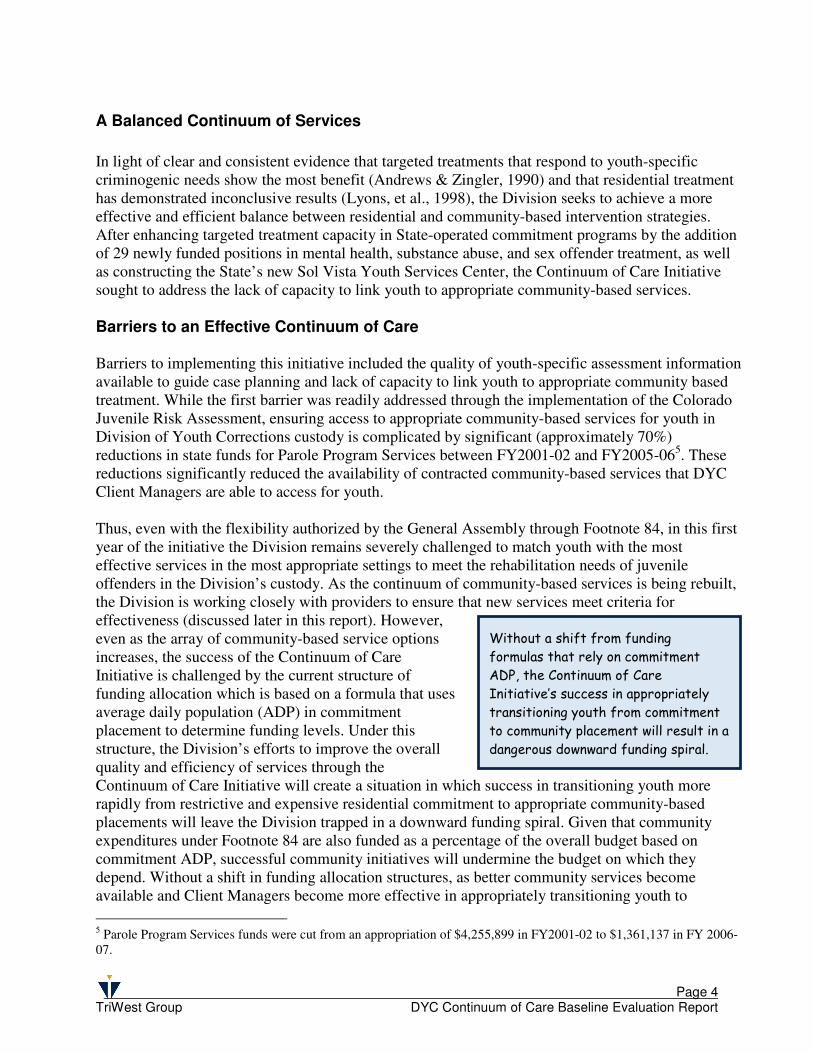
Without a shift from funding
formulas that rely on commitment
ADP, the Continuum of Care
Initiative’s success in appropriately
transitioning youth from commitment
to community placement could result
in a dangerous downward funding
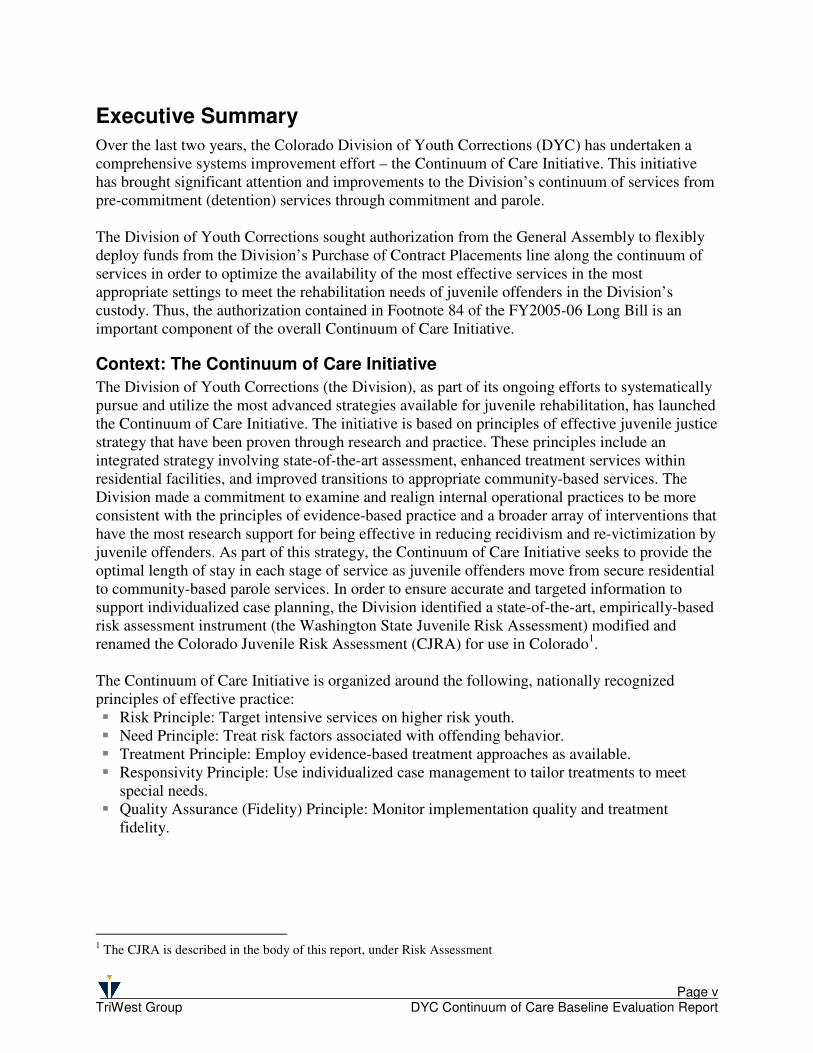
The Division has made a commitment to the assessment of individual criminogenic risk and needs, and utilizing the results to match youth to appropriate evidence-based treatments. The Continuum of Care Initiative targets youth according to their risk level, focusing on risk factors that contribute to offending behavior, in order to tailor the intensity and duration of supervision and treatment for each youth. This approach allows DYC to utilize resources more efficiently by ensuring that youth receive supervision and treatment that matches their criminogenic risks and needs, and takes into account responsivity issues such as personality and learning characteristics and other factors that constitute barriers to treatment such as a lack of motivation, anxiety, and reading levels. In light of clear and consistent evidence that targeted treatments that respond to youth-specific criminogenic needs show the most benefit (Andrews & Zingler, 1990) and that residential treatment has demonstrated inconclusive results (Lyons, et al., 1998), the Continuum of Care features a more effective and efficient balance between residential and community-based strategies.
Barriers to implementing this initiative include the quality of youth-specific assessment information available to guide case planning and lack of capacity to link youth to appropriate community based treatment.. While the first barrier was readily addressed through the implementation of the Colorado Juvenile Risk Assessment, ensuring access to appropriate community-based services for youth in DYC custody is complicated by significant (approximately 70%) reductions in state funds for Parole Program Services between FY2001-02 and FY2005-062. These reductions significantly reduced the availability of contracted community-based services that DYC Client Managers are able to access for youth. Thus, even with the flexibility authorized by the General Assembly through Footnote 84, in this first year of the initiative the Division remains severely challenged to match youth with the most effective services in the most appropriate settings to meet their rehabilitation needs. Even as the array of community-based service options increases, the success of the Continuum of Care Initiative is challenged by the current structure of funding allocation which is based on a formula that uses average daily population (ADP) in commitment
2 Parole Program Services funds were cut from an appropriation of $4,255,899 in FY2001-02 to $1,361,137 in FY 2006-07.
Juvenile Justice Continuum of Services
Page vii TriWest Group DYC Continuum of Care Baseline Evaluation Report
placement to determine funding levels. Under this structure, the Division’s efforts to improve the overall quality and efficiency of services through the Continuum of Care Initiative will create a situation in which success in transitioning youth more rapidly from restrictive and expensive residential commitment to appropriate community-based placements will leave DYC trapped in a downward funding spiral. Given that community expenditures under Footnote 84 are also funded as a percentage of the overall budget based on commitment ADP, successful community initiatives will undermine the budget on which they depend. Without a shift in funding allocation structures, as better community services become available and Client Managers become more effective in appropriately transitioning youth to community placements, the Division’s resources for both commitment and community-based services could shrink to the point that youth are left without either commitment or community placements.
Youth Served
DYC records of flexible funding expenditures identify 723 individual youth receiving services under the Division’s Continuum of Care Initiative. All of the youth receiving services were DYC committed youth. No detained youth were served using Continuum of Care Initiative funds. The majority of youth served in the Continuum of Care Initiative (89%) were male. The majority of youth served were either Caucasian (45%) or Hispanic (35%), with African American youth making up 17% of youth served. American Indian or Alaskan Native made up just fewer than 2% of youth served, while Asian youth and Native Hawaiian or Pacific Islander youth together made up about 1% of the youth served. Youth served across the Continuum of Care Initiative were an average of 16.4 years of age at the time of commitment. These proportions closely mirror the proportions of all DYC committed youth served during FY2005-06. The majority of youth served (73%) were originally committed under a Non-Mandatory (indeterminate, 0 to 24 month) sentence. Another 18% were committed on a Mandatory Sentence. The remaining youth were sentenced to DYC as Repeat (7%), Aggravated (1%) or Violent (1%) offenders.
Expenditures
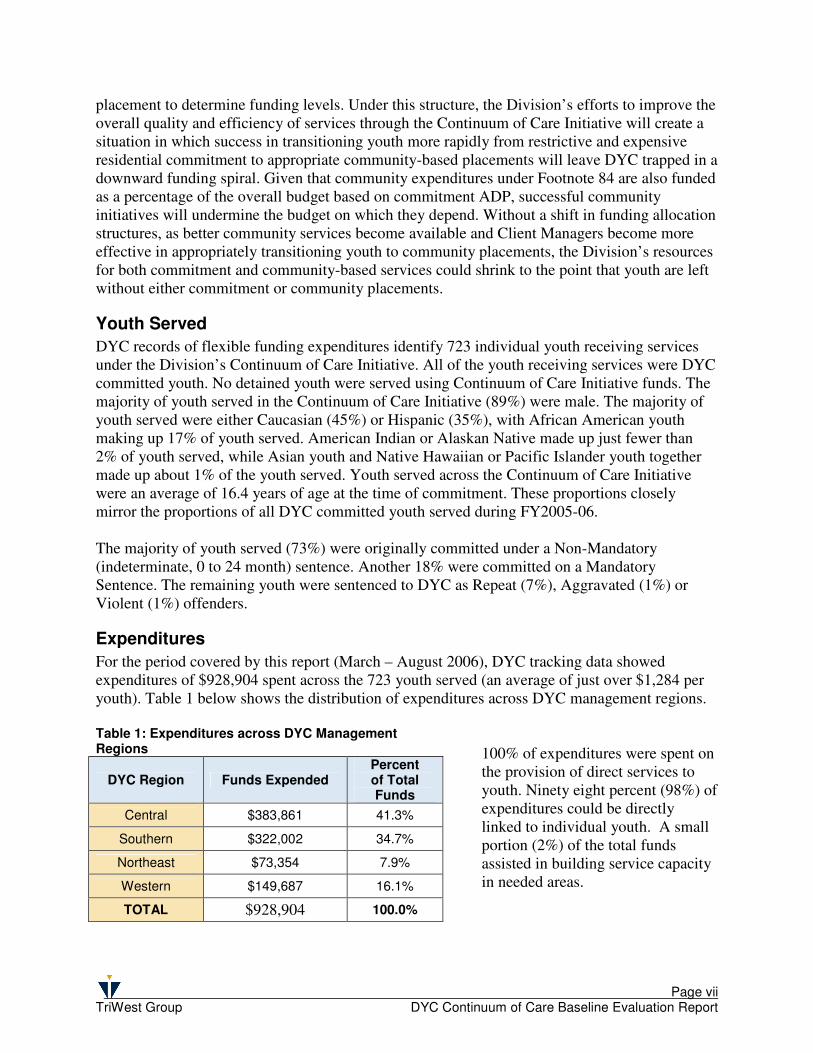
For the period covered by this report (March – August 2006), DYC tracking data showed expenditures of $928,904 spent across the 723 youth served (an average of just over $1,284 per youth). Table 1 below shows the distribution of expenditures across DYC management regions.
100% of expenditures were spent on the provision of direct services to youth. Ninety eight percent (98%) of expenditures could be directly linked to individual youth. A small portion (2%) of the total funds assisted in building service capacity in needed areas.
Table 1: Expenditures across DYC Management Regions
DYC Region Funds Expended Percent of Total Funds
Central $383,861 41.3%
Southern $322,002 34.7%
Northeast $73,354 7.9%
Western $149,687 16.1%
TOTAL $928,904 100.0%
Page viii TriWest Group DYC Continuum of Care Baseline Evaluation Report
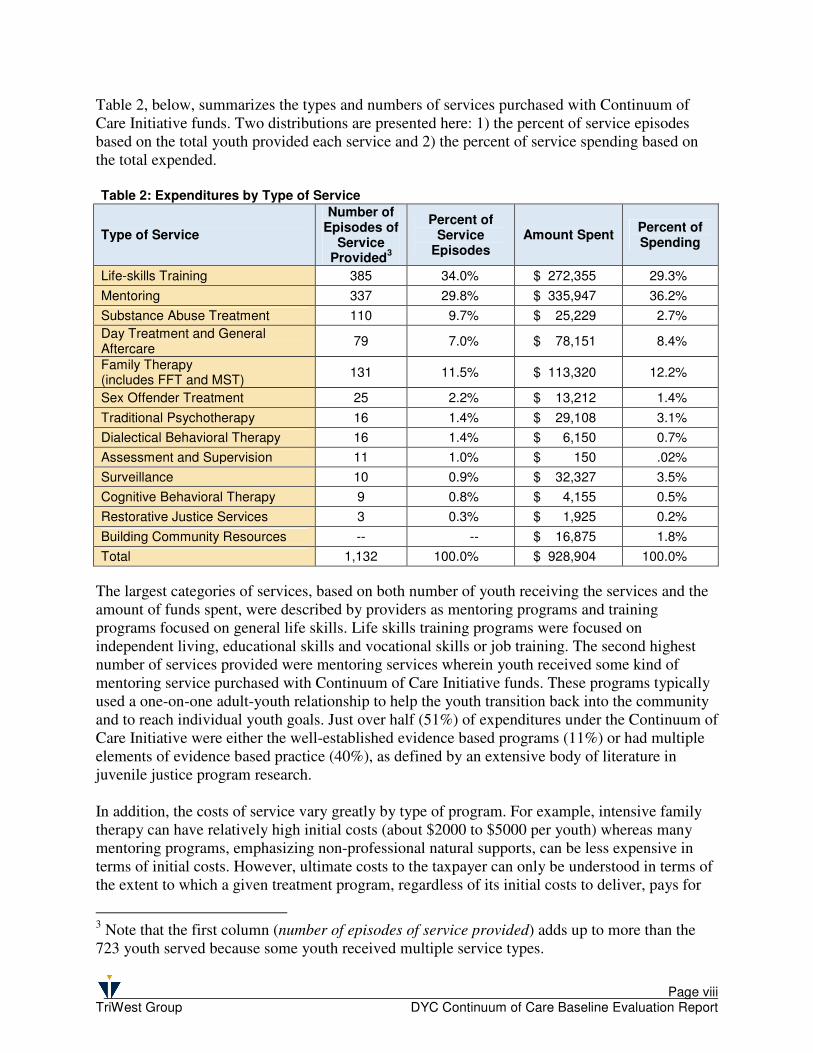
Table 2, below, summarizes the types and numbers of services purchased with Continuum of Care Initiative funds. Two distributions are presented here: 1) the percent of service episodes based on the total youth provided each service and 2) the percent of service spending based on the total expended. Table 2: Expenditures by Type of Service
Type of Service
Number of Episodes of
Service Provided
3
Percent of Service
Episodes Amount Spent
Percent of Spending
Life-skills Training 385 34.0% $ 272,355 29.3%
Mentoring 337 29.8% $ 335,947 36.2%
Substance Abuse Treatment 110 9.7% $ 25,229 2.7%
Day Treatment and General Aftercare
79 7.0% $ 78,151 8.4%
Family Therapy (includes FFT and MST)
131 11.5% $ 113,320 12.2%
Sex Offender Treatment 25 2.2% $ 13,212 1.4%
Traditional Psychotherapy 16 1.4% $ 29,108 3.1%
Dialectical Behavioral Therapy 16 1.4% $ 6,150 0.7%
Assessment and Supervision 11 1.0% $ 150 .02%
Surveillance 10 0.9% $ 32,327 3.5%
Cognitive Behavioral Therapy 9 0.8% $ 4,155 0.5%
Restorative Justice Services 3 0.3% $ 1,925 0.2%
Building Community Resources -- -- $ 16,875 1.8%
Total 1,132 100.0% $ 928,904 100.0%
The largest categories of services, based on both number of youth receiving the services and the amount of funds spent, were described by providers as mentoring programs and training programs focused on general life skills. Life skills training programs were focused on independent living, educational skills and vocational skills or job training. The second highest number of services provided were mentoring services wherein youth received some kind of mentoring service purchased with Continuum of Care Initiative funds. These programs typically used a one-on-one adult-youth relationship to help the youth transition back into the community and to reach individual youth goals. Just over half (51%) of expenditures under the Continuum of Care Initiative were either the well-established evidence based programs (11%) or had multiple elements of evidence based practice (40%), as defined by an extensive body of literature in juvenile justice program research. In addition, the costs of service vary greatly by type of program. For example, intensive family therapy can have relatively high initial costs (about $2000 to $5000 per youth) whereas many mentoring programs, emphasizing non-professional natural supports, can be less expensive in terms of initial costs. However, ultimate costs to the taxpayer can only be understood in terms of the extent to which a given treatment program, regardless of its initial costs to deliver, pays for
3 Note that the first column (number of episodes of service provided) adds up to more than the 723 youth served because some youth received multiple service types.
Page ix TriWest Group DYC Continuum of Care Baseline Evaluation Report
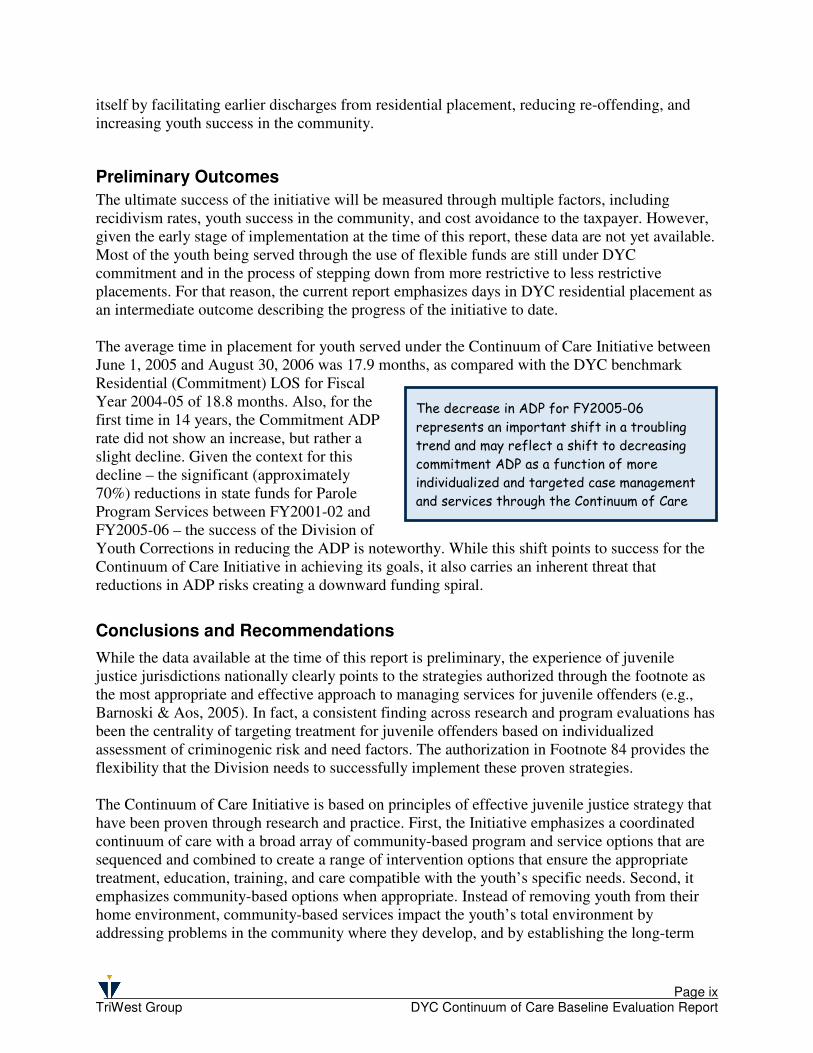
The decrease in ADP for FY2005-06
represents an important shift in a troubling
trend and may reflect a shift to decreasing
commitment ADP as a function of more
individualized and targeted case management
and services through the Continuum of Care
itself by facilitating earlier discharges from residential placement, reducing re-offending, and increasing youth success in the community.
Preliminary Outcomes
The ultimate success of the initiative will be measured through multiple factors, including recidivism rates, youth success in the community, and cost avoidance to the taxpayer. However, given the early stage of implementation at the time of this report, these data are not yet available. Most of the youth being served through the use of flexible funds are still under DYC commitment and in the process of stepping down from more restrictive to less restrictive placements. For that reason, the current report emphasizes days in DYC residential placement as an intermediate outcome describing the progress of the initiative to date. The average time in placement for youth served under the Continuum of Care Initiative between June 1, 2005 and August 30, 2006 was 17.9 months, as compared with the DYC benchmark Residential (Commitment) LOS for Fiscal Year 2004-05 of 18.8 months. Also, for the first time in 14 years, the Commitment ADP rate did not show an increase, but rather a slight decline. Given the context for this decline – the significant (approximately 70%) reductions in state funds for Parole Program Services between FY2001-02 and FY2005-06 – the success of the Division of Youth Corrections in reducing the ADP is noteworthy. While this shift points to success for the Continuum of Care Initiative in achieving its goals, it also carries an inherent threat that reductions in ADP risks creating a downward funding spiral.
Conclusions and Recommendations
While the data available at the time of this report is preliminary, the experience of juvenile justice jurisdictions nationally clearly points to the strategies authorized through the footnote as the most appropriate and effective approach to managing services for juvenile offenders (e.g., Barnoski & Aos, 2005). In fact, a consistent finding across research and program evaluations has been the centrality of targeting treatment for juvenile offenders based on individualized assessment of criminogenic risk and need factors. The authorization in Footnote 84 provides the flexibility that the Division needs to successfully implement these proven strategies. The Continuum of Care Initiative is based on principles of effective juvenile justice strategy that have been proven through research and practice. First, the Initiative emphasizes a coordinated continuum of care with a broad array of community-based program and service options that are sequenced and combined to create a range of intervention options that ensure the appropriate treatment, education, training, and care compatible with the youth’s specific needs. Second, it emphasizes community-based options when appropriate. Instead of removing youth from their home environment, community-based services impact the youth’s total environment by addressing problems in the community where they develop, and by establishing the long-term
Page x TriWest Group DYC Continuum of Care Baseline Evaluation Report
support necessary to sustain progress. Third, the Continuum of Care Initiative features individualized programming that is sufficiently intensive and comprehensive to accommodate the individual needs and potentials of the children and their families. Fourth, the Initiative attends to aftercare and re-integration so that youth continue receiving the support of treatment services following their treatment in a residential facility. Ongoing barriers to the Continuum of Care Initiative’s success nevertheless remain significant. Given reductions in appropriate community-based services for youth in DYC custody over recent years, the Division remains challenged to match youth with the most effective services in the most appropriate settings to meet their rehabilitation needs. In addition, as the array of community-based service options is rebuilt and expanded, the success of the Continuum of Care Initiative will in turn be challenged by the current structure of funding allocation which is based on a formula that uses average daily population (ADP) in commitment placement to determine funding levels.
Page 1 TriWest Group DYC Continuum of Care Baseline Evaluation Report
Background
The Continuum of Care Initiative
Over the last two years, the Colorado Division of Youth Corrections has undertaken a comprehensive systems improvement effort – the Continuum of Care Initiative. This initiative has brought significant attention and improvements to the Division’s continuum of services from the continuum of pre-commitment (detention) services through commitment and parole. The flexible funding authorization contained in Footnote 84 of the FY2005-06 Long Bill is an important component of the overall Continuum of Care Initiative. The Division of Youth Corrections sought authorization from the General Assembly to flexibly deploy funds from the Division’s Purchase of Contract Placements line in order to optimize the availability of the most effective services in the most appropriate settings to meet the rehabilitation needs of juvenile offenders in the Division’s custody. In Fiscal Year 2005-06, the General Assembly authorized the Division to engage in a demonstration of enhanced flexibility in treating and transitioning youth from residential to non-residential settings. This authorization comes in the form of a footnote to the FY 2005-06 Long Bill:
84 Department of Human Services, Division of Youth Corrections, Community
Programs, Purchase of Contract Placements
-- It is the intent of the General Assembly that up to 10.0 percent of the General Fund
appropriation to this line may be used to provide treatment, transition, and
wrap-around services to youths in the Division of Youth Correction's system in
residential and non-residential settings. The Division is requested to provide a
report to the Joint Budget Committee on November 1, 2006. This report should
include the following information:
(1) The amount spent serving youths in residential and non-residential settings from
this line item in FY 2005-06
(2) the type of services purchased with such expenditures
(3) the number of committed and detained youths treated with such expenditures
(4) baseline data that will serve to measure the effectiveness of such expenditures
(5) An evaluation of the effectiveness of this footnote in addressing the need for
flexibility in treating and transitioning youth from residential to non-residential
settings.
Page 2 TriWest Group DYC Continuum of Care Baseline Evaluation Report
Context: The Continuum of Care Initiative
The current report responds to the requirements of Footnote 84 and should be understood in the context of both the Division of Youth Corrections’ overall Continuum of Care Initiative and the existing national research base regarding effective strategies in juvenile corrections. As noted above, the Division seeks to improve the overall effectiveness of its commitment services continuum through a comprehensive system improvement initiative. The integrated set of strategies making up the Continuum of Care Initiative are based to a large degree on available research and the experiences of jurisdictions across the country regarding “what works” in juvenile justice. The Division of Youth Corrections (the Division), as part of its ongoing efforts to systematically pursue and utilize the most advanced strategies available for juvenile rehabilitation, has launched the Continuum of Care Initiative. The initiative is based on principles of effective juvenile justice strategy that have been proven through research and practice to be effective. The Continuum of Care Initiative has been implemented through an integrated strategy involving state-of-the-art assessment, enhanced treatment services within residential facilities, and improved transitions to appropriate community-based services. The Division made a commitment to examine and realign internal operational practices to be more consistent with the principles of evidence-based practice (EBP) and a broader array of interventions that have the most research support for being effective in reducing recidivism and re-victimization by juvenile offenders. As part of this strategy, the Continuum of Care Initiative seeks to provide the optimal length of stay in each stage of service to juvenile offenders as they move from secure residential to community-based services on parole. In order to ensure accurate and targeted information to support individualized case planning, the Division identified a state-of-the-art, empirically-based risk assessment instrument (the Washington State Juvenile Risk Assessment) modified and renamed the Colorado Juvenile Risk Assessment (CJRA)) for use in Colorado4. The Continuum of Care Initiative is organized around the following, nationally recognized principles of effective practice: � Risk Principle: Target intensive services on higher risk youth. � Need Principle: Treat risk factors associated with offending behavior. � Treatment Principle: Employ evidence-based treatment approaches as available. � Responsivity Principle: Use individualized case management to tailor treatments to meet special
needs. � Quality Assurance (Fidelity) Principle: Monitor implementation quality and treatment fidelity.
As depicted in the figure below, these principles are inter-related and must be implemented together in order to yield the full benefits of the Continuum of Care Initiative.
4 The CJRA is described later, under Risk Assessment
Page 3 TriWest Group DYC Continuum of Care Baseline Evaluation Report
QUALITY
ASSURANCE
RISK
NEED RESPONSIVITY
TREATMENT
Individualized case management
allows youth to be matched to the
most effective placement and
treatment – yielding better
outcomes for youth and efficient
use of State resources.
The concepts of risk and need are inherent to this strategy. These factors have been noted broadly in national research reports. They include circumstances and characteristics in a number of areas or domains that can be changed through treatment, including substance abuse, behavior, attitudes, personality, peer associations, the family, and circumstances at school. Although the dynamics involved are not fully understood, research indicates that youth who enter the juvenile justice system with challenges in many of these areas are more at risk to re-offend than those who present with only a few—the effects are additive. By focusing on these characteristics, youth may be differentiated into high- and low-risk categories. Placements and services may have a positive effect, no effect, or even in some cases result in increased rates of re-offending. The Division has made a commitment to the assessment of individual criminogenic risk and needs, and utilizing the results to match youth to appropriate evidence-based treatments. The Continuum of Care Initiative targets youth according to their risk level, focusing on risk factors that contribute to offending behavior, in order to tailor the intensity and duration of supervision and treatment for each youth. This approach was designed to allow the Division to utilize resources more efficiently by ensuring that youth receive supervision and treatment that matches their criminogenic risks and needs, and takes into account responsivity issues such as personality and learning characteristics and other factors that constitute barriers to treatment such as a lack of motivation, anxiety, and reading levels.
Page 4 TriWest Group DYC Continuum of Care Baseline Evaluation Report
Without a shift from funding
formulas that rely on commitment
ADP, the Continuum of Care
Initiative’s success in appropriately
transitioning youth from commitment
to community placement will result in a
dangerous downward funding spiral.
A Balanced Continuum of Services
In light of clear and consistent evidence that targeted treatments that respond to youth-specific criminogenic needs show the most benefit (Andrews & Zingler, 1990) and that residential treatment has demonstrated inconclusive results (Lyons, et al., 1998), the Division seeks to achieve a more effective and efficient balance between residential and community-based intervention strategies. After enhancing targeted treatment capacity in State-operated commitment programs by the addition of 29 newly funded positions in mental health, substance abuse, and sex offender treatment, as well as constructing the State’s new Sol Vista Youth Services Center, the Continuum of Care Initiative sought to address the lack of capacity to link youth to appropriate community-based services. Barriers to an Effective Continuum of Care
Barriers to implementing this initiative included the quality of youth-specific assessment information available to guide case planning and lack of capacity to link youth to appropriate community based treatment. While the first barrier was readily addressed through the implementation of the Colorado Juvenile Risk Assessment, ensuring access to appropriate community-based services for youth in Division of Youth Corrections custody is complicated by significant (approximately 70%) reductions in state funds for Parole Program Services between FY2001-02 and FY2005-065. These reductions significantly reduced the availability of contracted community-based services that DYC Client Managers are able to access for youth. Thus, even with the flexibility authorized by the General Assembly through Footnote 84, in this first year of the initiative the Division remains severely challenged to match youth with the most effective services in the most appropriate settings to meet the rehabilitation needs of juvenile offenders in the Division’s custody. As the continuum of community-based services is being rebuilt, the Division is working closely with providers to ensure that new services meet criteria for effectiveness (discussed later in this report). However, even as the array of community-based service options increases, the success of the Continuum of Care Initiative is challenged by the current structure of funding allocation which is based on a formula that uses average daily population (ADP) in commitment placement to determine funding levels. Under this structure, the Division’s efforts to improve the overall quality and efficiency of services through the Continuum of Care Initiative will create a situation in which success in transitioning youth more rapidly from restrictive and expensive residential commitment to appropriate community-based placements will leave the Division trapped in a downward funding spiral. Given that community expenditures under Footnote 84 are also funded as a percentage of the overall budget based on commitment ADP, successful community initiatives will undermine the budget on which they depend. Without a shift in funding allocation structures, as better community services become available and Client Managers become more effective in appropriately transitioning youth to
5 Parole Program Services funds were cut from an appropriation of $4,255,899 in FY2001-02 to $1,361,137 in FY 2006-07.
Page 5 TriWest Group DYC Continuum of Care Baseline Evaluation Report
Decreasing Restrictiveness
Natural SupportsDiversion
Community
ResidentialOptions
SecureResidential
Placement
Parole
Counseling;
Mentoring
Increasing Restrictiveness
Community &
Family-Based
Options
Community ResidentialOptions
Community & Family-Based
Options
community placements, the Division’s resources for both commitment and community-based services will shrink to the point that youth are left without either commitment or community placements. Risk Assessment Central to the Continuum of Care Initiative has been the implementation of a state-of-the-art, evidence-based risk assessment instrument. Assessment helps identify specific categories of criminogenic risk, reveal roadblocks to treatment, provide enough variability to show change before and after treatment in targeted areas, and provide direction for transition and aftercare services. The newly implemented Colorado Juvenile Risk Assessment (CJRA) is state-of-the-art in that it provides an overall score related to risk for re-offending and also provides a detailed analysis of the specific risk and protective factors that may contribute to a youth’s success or failure under Division of Youth Corrections supervision. State-specific versions of this instrument are in use in over a dozen states and it is widely regarded as the current state-of-the-art. The CJRA was piloted, all Client Managers were trained, and full scale implementation took place during the last two months of FY2005-06. Training emphasized strategies for individualized case management that matches youth to appropriate supervision and treatment services. A Continuum of Services In order for risk assessment data and individualized case management to positively impact youth outcomes, it is critical that Client Managers have access to a comprehensive continuum of services based on proven, evidence-based strategies. As illustrated in Figure 1 below, this continuum would allow youth to receive appropriate placements based on his or her criminogenic risks and needs as assessed through the CJRA. Moreover, access to a full array of services allows a most efficient utilization of funds and resources by allowing youth to move to lower levels of restrictiveness (and cost) as their risk profile allows. Unfortunately, as noted above, implementation of the Continuum of Care Initiative is challenged by the multi-year State program reductions stemming from the drastic reductions in Parole Program funding from fiscal years FY 2001-02 through FY 2006-07. That trend resulted in an overall reduction of community-based service options and placed increasing demands on commitment resources. At the same time, categorical funding
Figure 1: Juvenile Justice Continuum of Services
Page 6 TriWest Group DYC Continuum of Care Baseline Evaluation Report
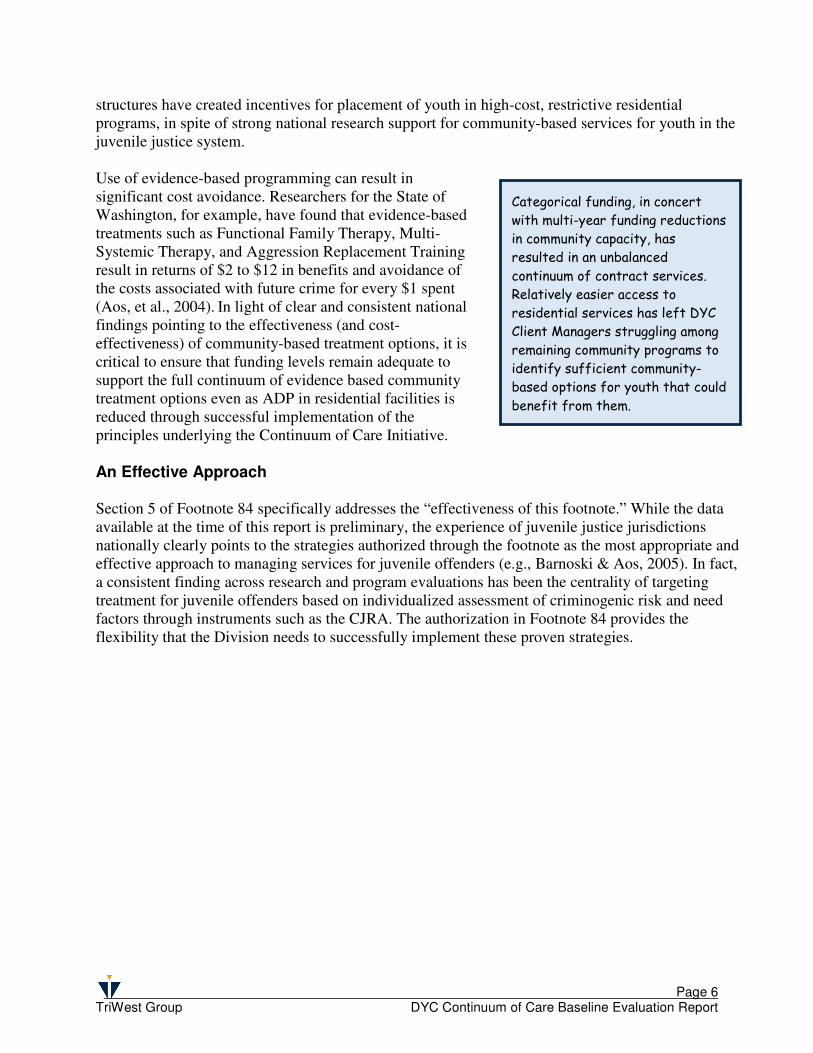
Categorical funding, in concert
with multi-year funding reductions
in community capacity, has
resulted in an unbalanced
continuum of contract services.
Relatively easier access to
residential services has left DYC
Client Managers struggling among
remaining community programs to
identify sufficient community-
based options for youth that could
benefit from them.
structures have created incentives for placement of youth in high-cost, restrictive residential programs, in spite of strong national research support for community-based services for youth in the juvenile justice system. Use of evidence-based programming can result in significant cost avoidance. Researchers for the State of Washington, for example, have found that evidence-based treatments such as Functional Family Therapy, Multi- Systemic Therapy, and Aggression Replacement Training result in returns of $2 to $12 in benefits and avoidance of the costs associated with future crime for every $1 spent (Aos, et al., 2004). In light of clear and consistent national findings pointing to the effectiveness (and cost-effectiveness) of community-based treatment options, it is critical to ensure that funding levels remain adequate to support the full continuum of evidence based community treatment options even as ADP in residential facilities is reduced through successful implementation of the principles underlying the Continuum of Care Initiative. An Effective Approach Section 5 of Footnote 84 specifically addresses the “effectiveness of this footnote.” While the data available at the time of this report is preliminary, the experience of juvenile justice jurisdictions nationally clearly points to the strategies authorized through the footnote as the most appropriate and effective approach to managing services for juvenile offenders (e.g., Barnoski & Aos, 2005). In fact, a consistent finding across research and program evaluations has been the centrality of targeting treatment for juvenile offenders based on individualized assessment of criminogenic risk and need factors through instruments such as the CJRA. The authorization in Footnote 84 provides the flexibility that the Division needs to successfully implement these proven strategies.
Page 7 TriWest Group DYC Continuum of Care Baseline Evaluation Report
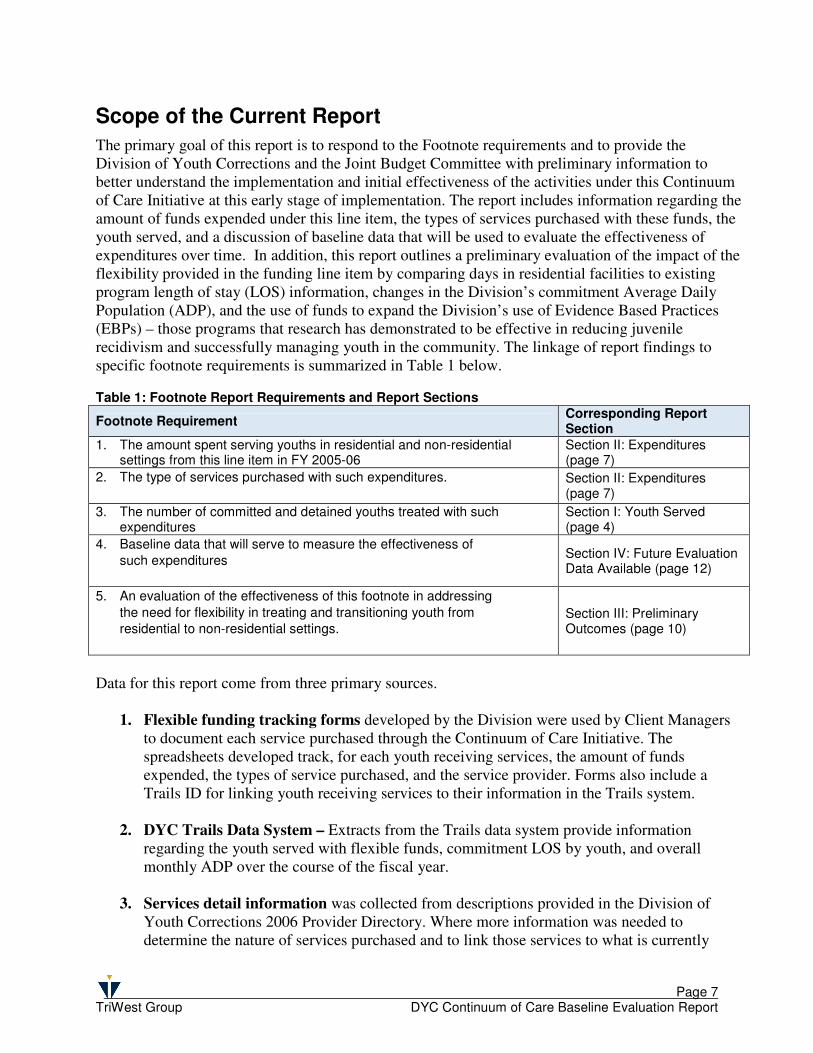
Scope of the Current Report
The primary goal of this report is to respond to the Footnote requirements and to provide the Division of Youth Corrections and the Joint Budget Committee with preliminary information to better understand the implementation and initial effectiveness of the activities under this Continuum of Care Initiative at this early stage of implementation. The report includes information regarding the amount of funds expended under this line item, the types of services purchased with these funds, the youth served, and a discussion of baseline data that will be used to evaluate the effectiveness of expenditures over time. In addition, this report outlines a preliminary evaluation of the impact of the flexibility provided in the funding line item by comparing days in residential facilities to existing program length of stay (LOS) information, changes in the Division’s commitment Average Daily Population (ADP), and the use of funds to expand the Division’s use of Evidence Based Practices (EBPs) – those programs that research has demonstrated to be effective in reducing juvenile recidivism and successfully managing youth in the community. The linkage of report findings to specific footnote requirements is summarized in Table 1 below. Table 1: Footnote Report Requirements and Report Sections
Footnote Requirement Corresponding Report Section
1. The amount spent serving youths in residential and non-residential settings from this line item in FY 2005-06
Section II: Expenditures (page 7)
2. The type of services purchased with such expenditures. Section II: Expenditures (page 7)
3. The number of committed and detained youths treated with such expenditures
Section I: Youth Served (page 4)
4. Baseline data that will serve to measure the effectiveness of such expenditures
Section IV: Future Evaluation Data Available (page 12)
5. An evaluation of the effectiveness of this footnote in addressing
the need for flexibility in treating and transitioning youth from residential to non-residential settings.
Section III: Preliminary Outcomes (page 10)
Data for this report come from three primary sources.
1. Flexible funding tracking forms developed by the Division were used by Client Managers to document each service purchased through the Continuum of Care Initiative. The spreadsheets developed track, for each youth receiving services, the amount of funds expended, the types of service purchased, and the service provider. Forms also include a Trails ID for linking youth receiving services to their information in the Trails system.
2. DYC Trails Data System – Extracts from the Trails data system provide information
regarding the youth served with flexible funds, commitment LOS by youth, and overall monthly ADP over the course of the fiscal year.
3. Services detail information was collected from descriptions provided in the Division of
Youth Corrections 2006 Provider Directory. Where more information was needed to determine the nature of services purchased and to link those services to what is currently
Page 8 TriWest Group DYC Continuum of Care Baseline Evaluation Report
known regarding evidence based practice, brief phone interviews were conducted by TriWest with providers to clarify the nature of services delivered.
As this is the first evaluation report, covering less than a full year of implementation, data collection continued through August 30, 2006, in order to be able to include as large a sample size as possible to maximize the relevance of the data analysis. Because many of the youth being served under the Continuum of Care Initiative to date remained under commitment at the time data was collected for this report, limited outcome data is available for this first evaluation report. Therefore, this report focuses on three main goals: � To report on baseline data and briefly compare these to program benchmarks for the one outcome
area for which data is available for this report (days in residential placement); � To describe the services provided relative to the features of evidence based practice; and � To describe the types of outcomes for which we will look for changes in future reports.
Page 9 TriWest Group DYC Continuum of Care Baseline Evaluation Report
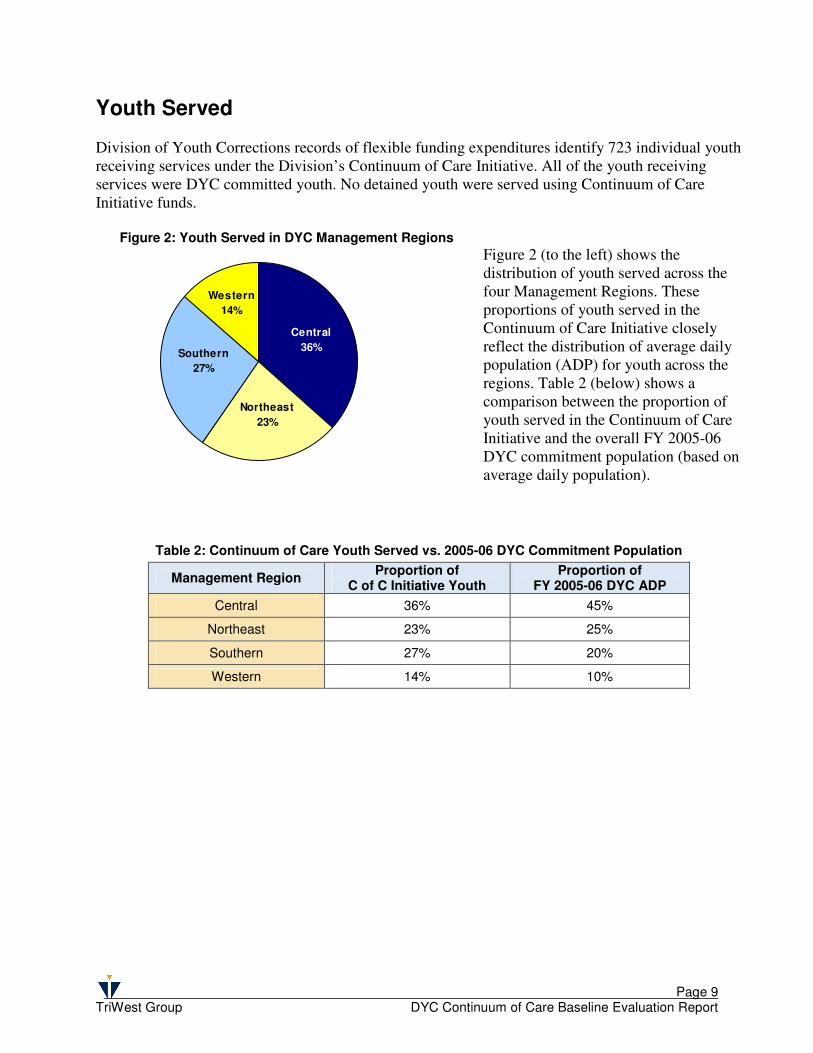
Youth Served Division of Youth Corrections records of flexible funding expenditures identify 723 individual youth receiving services under the Division’s Continuum of Care Initiative. All of the youth receiving services were DYC committed youth. No detained youth were served using Continuum of Care Initiative funds.
Figure 2: Youth Served in DYC Management Regions Figure 2 (to the left) shows the distribution of youth served across the four Management Regions. These proportions of youth served in the Continuum of Care Initiative closely reflect the distribution of average daily population (ADP) for youth across the regions. Table 2 (below) shows a comparison between the proportion of youth served in the Continuum of Care Initiative and the overall FY 2005-06 DYC commitment population (based on average daily population).
Table 2: Continuum of Care Youth Served vs. 2005-06 DYC Commitment Population
Management Region Proportion of
C of C Initiative Youth Proportion of
FY 2005-06 DYC ADP
Central 36% 45%
Northeast 23% 25%
Southern 27% 20%
Western 14% 10%
Northeast
23%
Southern
27%
Western
14%
Central
36%
Page 10 TriWest Group DYC Continuum of Care Baseline Evaluation Report
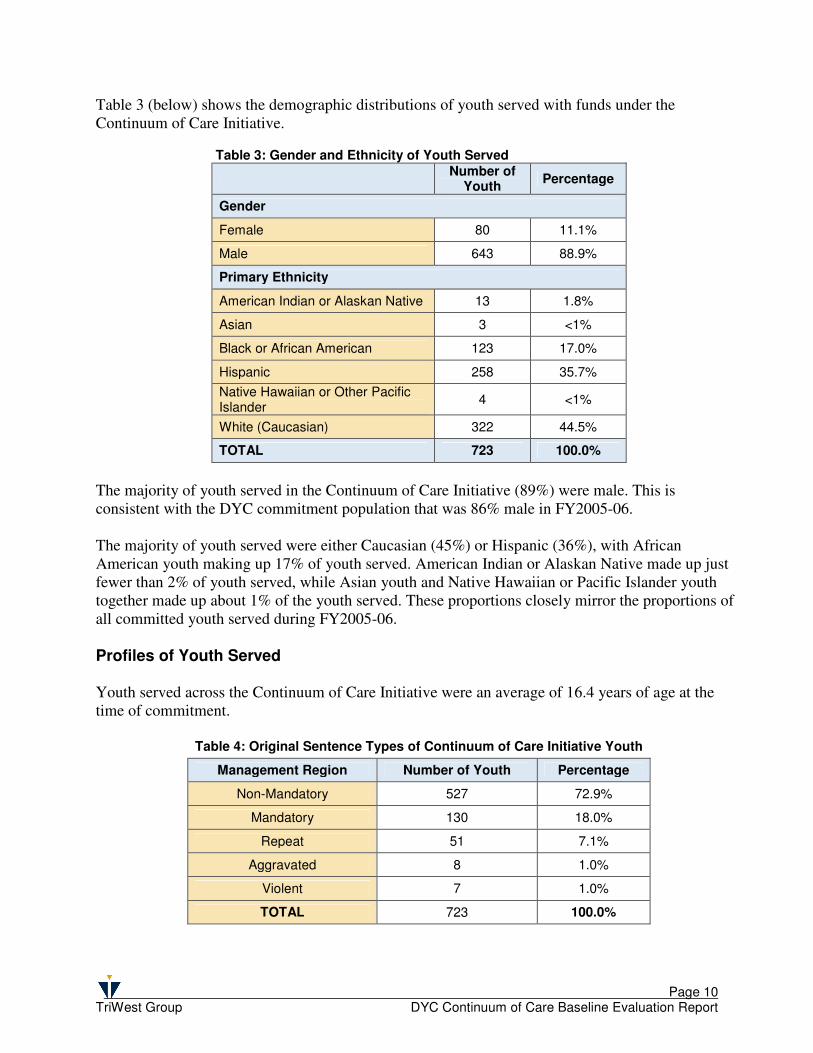
Table 3 (below) shows the demographic distributions of youth served with funds under the Continuum of Care Initiative.
Table 3: Gender and Ethnicity of Youth Served
Number of
Youth Percentage
Gender
Female 80 11.1%
Male 643 88.9%
Primary Ethnicity
American Indian or Alaskan Native 13 1.8%
Asian 3 <1%
Black or African American 123 17.0%
Hispanic 258 35.7%
Native Hawaiian or Other Pacific Islander
4 <1%
White (Caucasian) 322 44.5%
TOTAL 723 100.0%
The majority of youth served in the Continuum of Care Initiative (89%) were male. This is consistent with the DYC commitment population that was 86% male in FY2005-06. The majority of youth served were either Caucasian (45%) or Hispanic (36%), with African American youth making up 17% of youth served. American Indian or Alaskan Native made up just fewer than 2% of youth served, while Asian youth and Native Hawaiian or Pacific Islander youth together made up about 1% of the youth served. These proportions closely mirror the proportions of all committed youth served during FY2005-06. Profiles of Youth Served Youth served across the Continuum of Care Initiative were an average of 16.4 years of age at the time of commitment.
Table 4: Original Sentence Types of Continuum of Care Initiative Youth
Management Region Number of Youth Percentage
Non-Mandatory 527 72.9%
Mandatory 130 18.0%
Repeat 51 7.1%
Aggravated 8 1.0%
Violent 7 1.0%
TOTAL 723 100.0%
Page 11 TriWest Group DYC Continuum of Care Baseline Evaluation Report
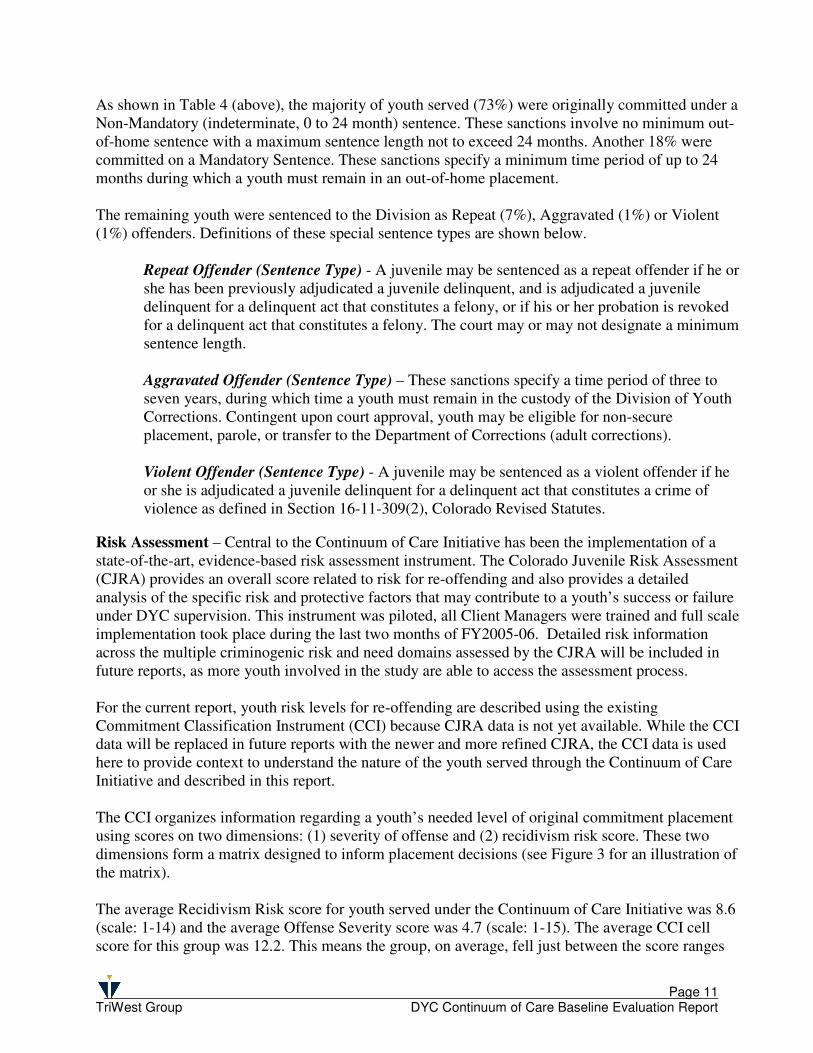
As shown in Table 4 (above), the majority of youth served (73%) were originally committed under a Non-Mandatory (indeterminate, 0 to 24 month) sentence. These sanctions involve no minimum out-of-home sentence with a maximum sentence length not to exceed 24 months. Another 18% were committed on a Mandatory Sentence. These sanctions specify a minimum time period of up to 24 months during which a youth must remain in an out-of-home placement. The remaining youth were sentenced to the Division as Repeat (7%), Aggravated (1%) or Violent (1%) offenders. Definitions of these special sentence types are shown below.
Repeat Offender (Sentence Type) - A juvenile may be sentenced as a repeat offender if he or she has been previously adjudicated a juvenile delinquent, and is adjudicated a juvenile delinquent for a delinquent act that constitutes a felony, or if his or her probation is revoked for a delinquent act that constitutes a felony. The court may or may not designate a minimum sentence length. Aggravated Offender (Sentence Type) – These sanctions specify a time period of three to seven years, during which time a youth must remain in the custody of the Division of Youth Corrections. Contingent upon court approval, youth may be eligible for non-secure placement, parole, or transfer to the Department of Corrections (adult corrections). Violent Offender (Sentence Type) - A juvenile may be sentenced as a violent offender if he or she is adjudicated a juvenile delinquent for a delinquent act that constitutes a crime of violence as defined in Section 16-11-309(2), Colorado Revised Statutes.
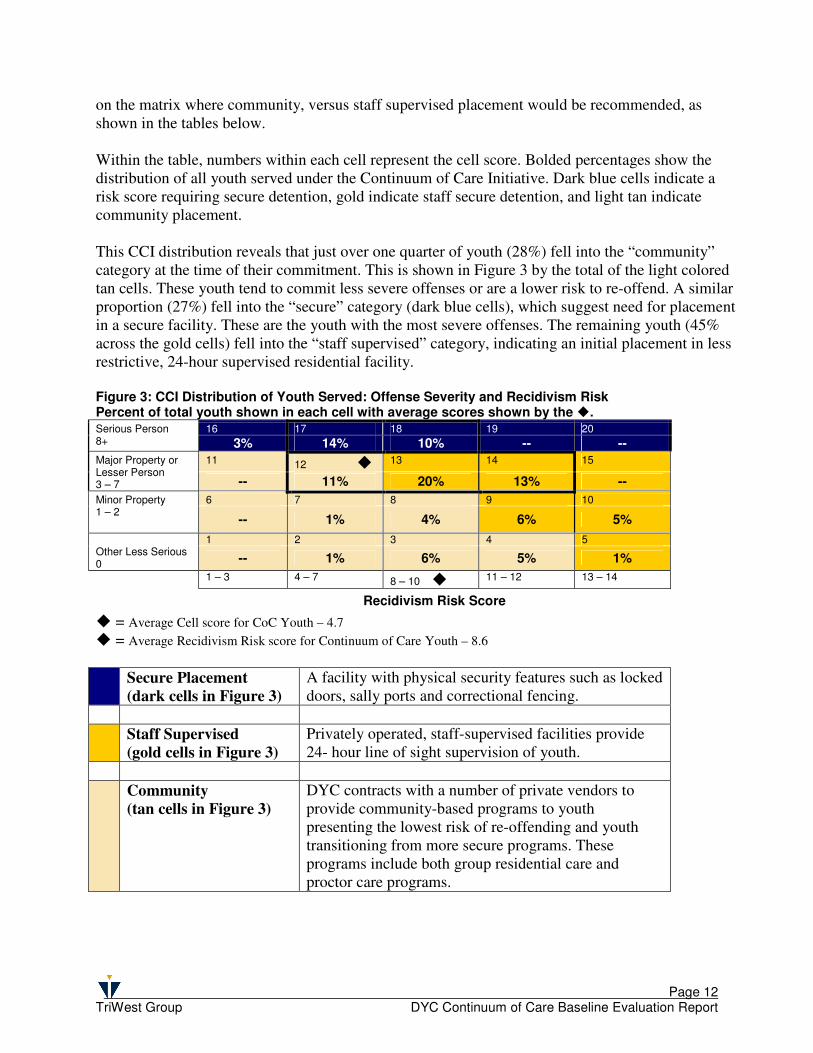
Risk Assessment – Central to the Continuum of Care Initiative has been the implementation of a state-of-the-art, evidence-based risk assessment instrument. The Colorado Juvenile Risk Assessment (CJRA) provides an overall score related to risk for re-offending and also provides a detailed analysis of the specific risk and protective factors that may contribute to a youth’s success or failure under DYC supervision. This instrument was piloted, all Client Managers were trained and full scale implementation took place during the last two months of FY2005-06. Detailed risk information across the multiple criminogenic risk and need domains assessed by the CJRA will be included in future reports, as more youth involved in the study are able to access the assessment process. For the current report, youth risk levels for re-offending are described using the existing Commitment Classification Instrument (CCI) because CJRA data is not yet available. While the CCI data will be replaced in future reports with the newer and more refined CJRA, the CCI data is used here to provide context to understand the nature of the youth served through the Continuum of Care Initiative and described in this report. The CCI organizes information regarding a youth’s needed level of original commitment placement using scores on two dimensions: (1) severity of offense and (2) recidivism risk score. These two dimensions form a matrix designed to inform placement decisions (see Figure 3 for an illustration of the matrix). The average Recidivism Risk score for youth served under the Continuum of Care Initiative was 8.6 (scale: 1-14) and the average Offense Severity score was 4.7 (scale: 1-15). The average CCI cell score for this group was 12.2. This means the group, on average, fell just between the score ranges
Page 12 TriWest Group DYC Continuum of Care Baseline Evaluation Report
on the matrix where community, versus staff supervised placement would be recommended, as shown in the tables below. Within the table, numbers within each cell represent the cell score. Bolded percentages show the distribution of all youth served under the Continuum of Care Initiative. Dark blue cells indicate a risk score requiring secure detention, gold indicate staff secure detention, and light tan indicate community placement. This CCI distribution reveals that just over one quarter of youth (28%) fell into the “community” category at the time of their commitment. This is shown in Figure 3 by the total of the light colored tan cells. These youth tend to commit less severe offenses or are a lower risk to re-offend. A similar proportion (27%) fell into the “secure” category (dark blue cells), which suggest need for placement in a secure facility. These are the youth with the most severe offenses. The remaining youth (45% across the gold cells) fell into the “staff supervised” category, indicating an initial placement in less restrictive, 24-hour supervised residential facility. Figure 3: CCI Distribution of Youth Served: Offense Severity and Recidivism Risk Percent of total youth shown in each cell with average scores shown by the �.
16 17 18 19 20 Serious Person 8+ 3% 14% 10% -- --
11 12 � 13 14 15 Major Property or Lesser Person 3 – 7 -- 11% 20% 13% --
6 7 8 9 10 Minor Property 1 – 2
-- 1% 4% 6% 5%
1 2 3 4 5 Other Less Serious 0 -- 1% 6% 5% 1%
1 – 3 4 – 7 8 – 10 � 11 – 12 13 – 14
Recidivism Risk Score
� = Average Cell score for CoC Youth – 4.7
� = Average Recidivism Risk score for Continuum of Care Youth – 8.6
Secure Placement
(dark cells in Figure 3)
A facility with physical security features such as locked doors, sally ports and correctional fencing.
Staff Supervised
(gold cells in Figure 3)
Privately operated, staff-supervised facilities provide 24- hour line of sight supervision of youth.
Community
(tan cells in Figure 3)
DYC contracts with a number of private vendors to provide community-based programs to youth presenting the lowest risk of re-offending and youth transitioning from more secure programs. These programs include both group residential care and proctor care programs.
Page 13 TriWest Group DYC Continuum of Care Baseline Evaluation Report
Expenditures
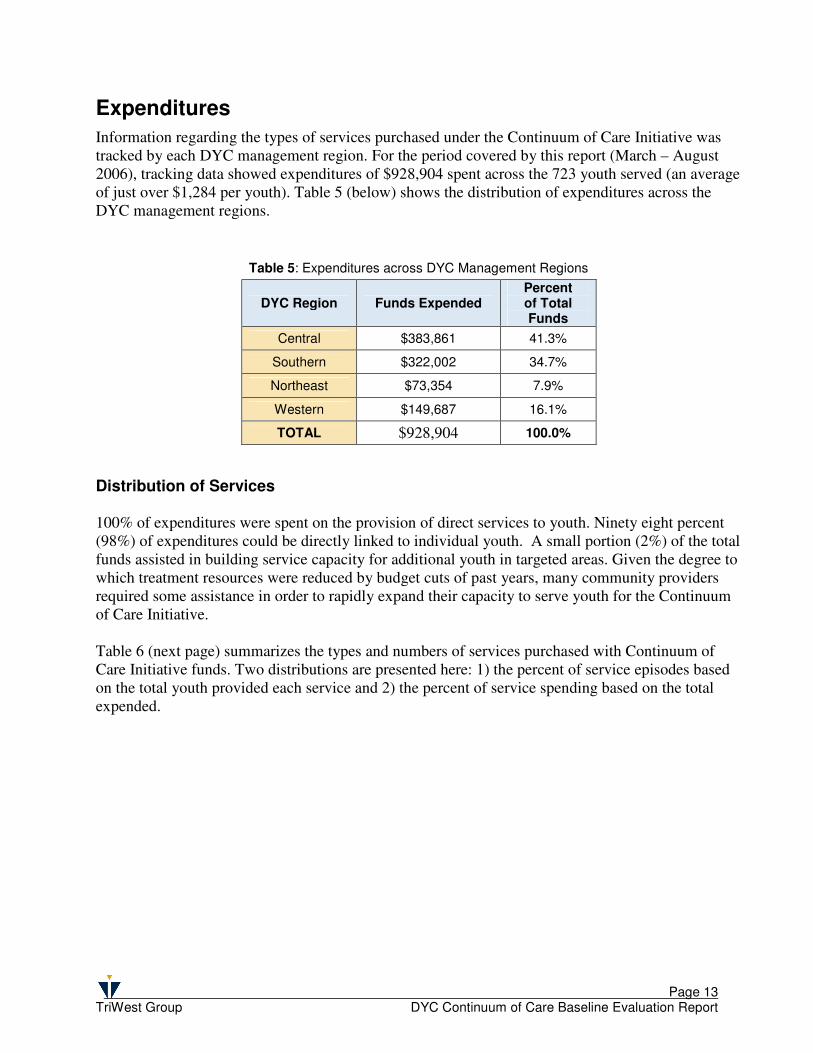
Information regarding the types of services purchased under the Continuum of Care Initiative was tracked by each DYC management region. For the period covered by this report (March – August 2006), tracking data showed expenditures of $928,904 spent across the 723 youth served (an average of just over $1,284 per youth). Table 5 (below) shows the distribution of expenditures across the DYC management regions. Distribution of Services
100% of expenditures were spent on the provision of direct services to youth. Ninety eight percent (98%) of expenditures could be directly linked to individual youth. A small portion (2%) of the total funds assisted in building service capacity for additional youth in targeted areas. Given the degree to which treatment resources were reduced by budget cuts of past years, many community providers required some assistance in order to rapidly expand their capacity to serve youth for the Continuum of Care Initiative. Table 6 (next page) summarizes the types and numbers of services purchased with Continuum of Care Initiative funds. Two distributions are presented here: 1) the percent of service episodes based on the total youth provided each service and 2) the percent of service spending based on the total expended.
Table 5: Expenditures across DYC Management Regions
DYC Region Funds Expended Percent of Total Funds
Central $383,861 41.3%
Southern $322,002 34.7%
Northeast $73,354 7.9%
Western $149,687 16.1%
TOTAL $928,904 100.0%
Page 14 TriWest Group DYC Continuum of Care Baseline Evaluation Report
Table 6: Expenditures by Type of Service
Type of Service
Number of Episodes of
Service Provided
6
Percent of Service
Episodes Amount Spent
Percent of Spending
Life-skills Training 385 34.0% $ 272,355 29.3%
Mentoring 337 29.8% $ 335,947 36.2%
Substance Abuse Treatment 110 9.7% $ 25,229 2.7%
Day Treatment and General Aftercare
79 7.0% $ 78,151 8.4%
Family Therapy (includes FFT and MST)
131 11.5% $ 113,320 12.2%
Sex Offender Treatment 25 2.2% $ 13,212 1.4%
Traditional Psychotherapy 16 1.4% $ 29,108 3.1%
Dialectical Behavioral Therapy 16 1.4% $ 6,150 0.7%
Assessment and Supervision 11 1.0% $ 150 .02%
Surveillance 10 0.9% $ 32,327 3.5%
Cognitive Behavioral Therapy 9 0.8% $ 4,155 0.5%
Restorative Justice Services 3 0.3% $ 1,925 0.2%
Building Community Resources -- -- $ 16,875 1.8%
Total 1,132 100.0% $ 928,904 100.0%
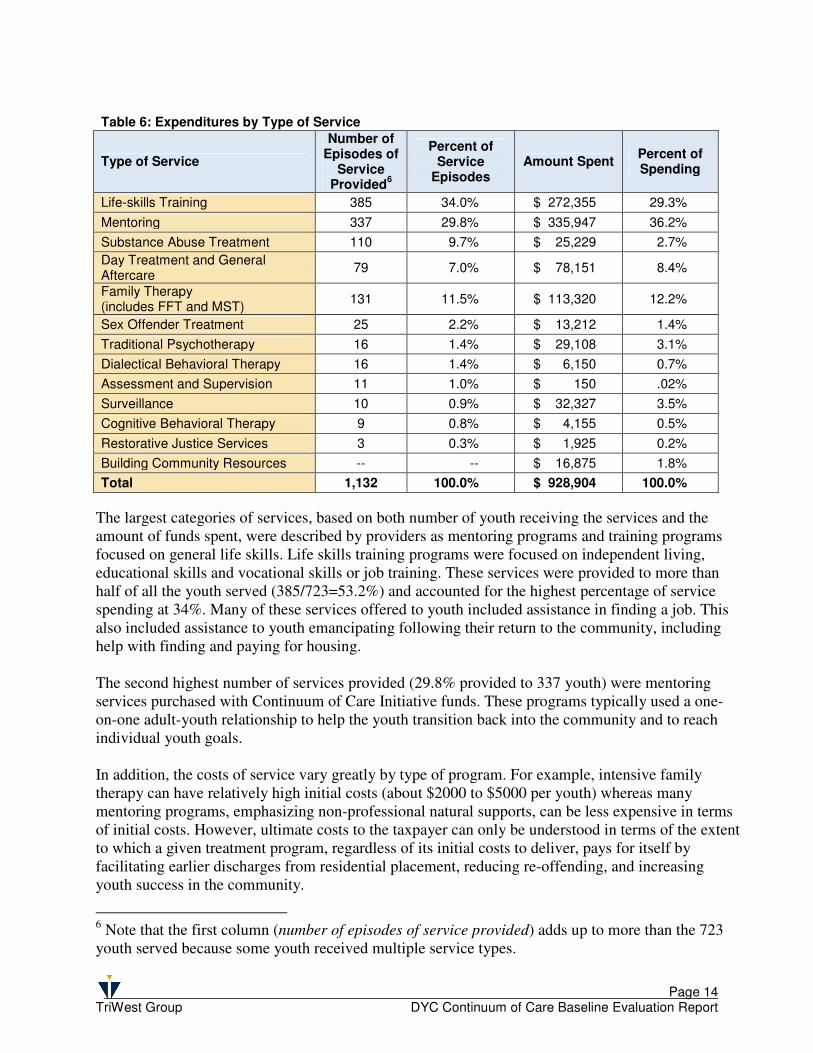
The largest categories of services, based on both number of youth receiving the services and the amount of funds spent, were described by providers as mentoring programs and training programs focused on general life skills. Life skills training programs were focused on independent living, educational skills and vocational skills or job training. These services were provided to more than half of all the youth served (385/723=53.2%) and accounted for the highest percentage of service spending at 34%. Many of these services offered to youth included assistance in finding a job. This also included assistance to youth emancipating following their return to the community, including help with finding and paying for housing. The second highest number of services provided (29.8% provided to 337 youth) were mentoring services purchased with Continuum of Care Initiative funds. These programs typically used a one-on-one adult-youth relationship to help the youth transition back into the community and to reach individual youth goals. In addition, the costs of service vary greatly by type of program. For example, intensive family therapy can have relatively high initial costs (about $2000 to $5000 per youth) whereas many mentoring programs, emphasizing non-professional natural supports, can be less expensive in terms of initial costs. However, ultimate costs to the taxpayer can only be understood in terms of the extent to which a given treatment program, regardless of its initial costs to deliver, pays for itself by facilitating earlier discharges from residential placement, reducing re-offending, and increasing youth success in the community.
6 Note that the first column (number of episodes of service provided) adds up to more than the 723 youth served because some youth received multiple service types.
Page 15 TriWest Group DYC Continuum of Care Baseline Evaluation Report
Individualized case management,
guided by risk and needs
information from the CJRA, will
allow DYC to match youth to the
most appropriate treatment
options.
In light of clear and consistent
research evidence to support the
cost effectiveness of community-
based options, it is critical that
community program funding levels
be maintained even as residential
ADP is reduced by successful
implementation of the Continuum
of Care Initiative.
Evidence Based Practice
At the core of the Division’s Continuum of Care Initiative is an emphasis on evidence-based practice. Put simply, the term “evidence-based practice” describes programs or approaches for which there is consistent evidence showing that they improve client outcomes. In juvenile justice settings, prioritized outcomes include reduced recidivism and successful community functioning. DYC has been working with service providers to move towards a service array built upon evidence-based practices and that is focused on strengths, interests, abilities and capabilities, rather than deficits, weaknesses, or problems. Recent implementation of the CJRA will provide Client Managers with individualized assessment information regarding the specific criminogenic risks and needs relating to each youth’s offending behavior. This information will be used to match youth, through individualized case management, to programs that most directly target the specific risk and need areas that are leading the youth to criminal behavior. Research has shown that the most effective programs typically involve intensive skills training and cognitive behavior modification techniques aimed at reducing risk factors for juvenile justice involvement (Lipsey, 1992). Programs which use cognitive behavioral approaches to improve interpersonal skills, self-control, anger management, and substance abuse resistance have been found to be most effective at reducing recidivism. In general, the most effective programs are highly structured, emphasize the development of basic social skills, and provide individual counseling that directly addresses behavior, attitudes, and perceptions (Altschuler, 1998). Effective programs also tend to be community-based. Removal from the community and placement in secure settings is necessary for some youth. However, for youth for whom community safety concerns are not immediate and preeminent, the most promising approaches, based on research evidence, are family and community-based approaches (e.g., Henggeler, et al., 1998; Greenbaum, et al., 1998). Admission to restrictive residential placement is typically justified on the basis of community protection or the perceived benefits of residential treatment itself (Barker, 1982; Lyons, et al., 1998). However, these justifications have limited research support. For example, youth who engage in seriously violent and aggressive behavior have not shown improvement from participation in residential treatment (Joshi & Rosenberg, 1997). One possible reason is that association with delinquent peers is a major risk factor for later behavior problems (Loeber & Farrington, 1998). Moreover, community-based interventions that target change in peer relationships have been found to be effective at breaking contact with violent peers and reducing aggressive behaviors (Henggeler et al., 1998). Use of evidence-based programming can result in significant cost avoidance. Researchers for the State of
Page 16 TriWest Group DYC Continuum of Care Baseline Evaluation Report
Categorical funding, in concert
with other barriers, has
resulted in an unbalanced
continuum of contract services.
Relatively easier access to
residential services has left DYC
Client Managers struggling to
identify sufficient community-
based options for youth that
could benefit from them.
Washington, for example, have found that for every $1 spent on evidence-based treatments such as Functional Family Therapy, Multi- Systemic Therapy, and Aggression Replacement Training result in returns of $2 to $12 in benefits and avoidance of the costs associated with future crime (Aos, et al., 2004). In addition, avoiding the referral of youth to programs that have not demonstrated effectiveness can in and of itself result in further savings, since some programs fail to generate more benefits than costs. In light of clear and consistent national findings pointing to the effectiveness (and cost-effectiveness) of community-based treatment options, it is critical to ensure that community program funding levels remain adequate to support the full continuum of evidence based community treatment options even as ADP in residential facilities is reduced through successful implementation of the principles underlying the Continuum of Care Initiative. Just over half (51%) of expenditures under the Continuum of Care Initiative were either the well-established evidence based programs (11%) or had multiple elements of evidence based practice (40%), as defined by an extensive body of literature in juvenile justice program research and assess through the study’s targeted review of these program components. Well-established evidence based programs, often labeled “model,” are supported by a body of research that has demonstrated their effectiveness in reducing recidivism for juvenile offenders. Most intervention programs, however, do not have access to rigorous program evaluation and lack a strong evidence base. However, the national research base has yielded a consistent set of key components of effectiveness. These “evidence-based practice” elements include: � a theoretical foundation based on existing research and/or program evaluation; � a focus on cognitive-behavioral training and on teaching concrete skills; � a concrete program structure with intensive service delivery; � involvement of the youth’s family and community, as possible; � quality assurance and training measures to ensure fidelity to the program model. Programs used by the Continuum of Care Initiative that did not have their own well-established research base were examined to determine the degree to which these key elements could be identified. While existing community programs varied in the degree of information they could provide for this report, most (just over 51%) reported incorporating more than one of the key elements listed above. For some programs, we were not able to gather sufficient information for this report to determine whether these key elements were present. It is possible that more detailed information specifying the programs would reveal additional elements of evidence based practice within the array of programs available to the Continuum of Care Initiative. Future reports will attempt to gather additional information. Perhaps more important, however, was the clear finding of a current lack of evidence-based community program capacity. This reflects the funding landscape in Colorado in which categorical funding has resulted in an imbalance in contract services with relatively more accessible residential, rather than community-based, treatment programs.
Page 17 TriWest Group DYC Continuum of Care Baseline Evaluation Report
While Community Review Boards
and the Juvenile Parole Board
control youths’ movement from
residential to community
placement, the flexibility allowed
through this footnote, coupled
with the enhanced risk and needs
information from the Colorado
Juvenile Risk Assessment (CJRA),
give the Division powerful tools to
increase the effectiveness of
placements across the Continuum.
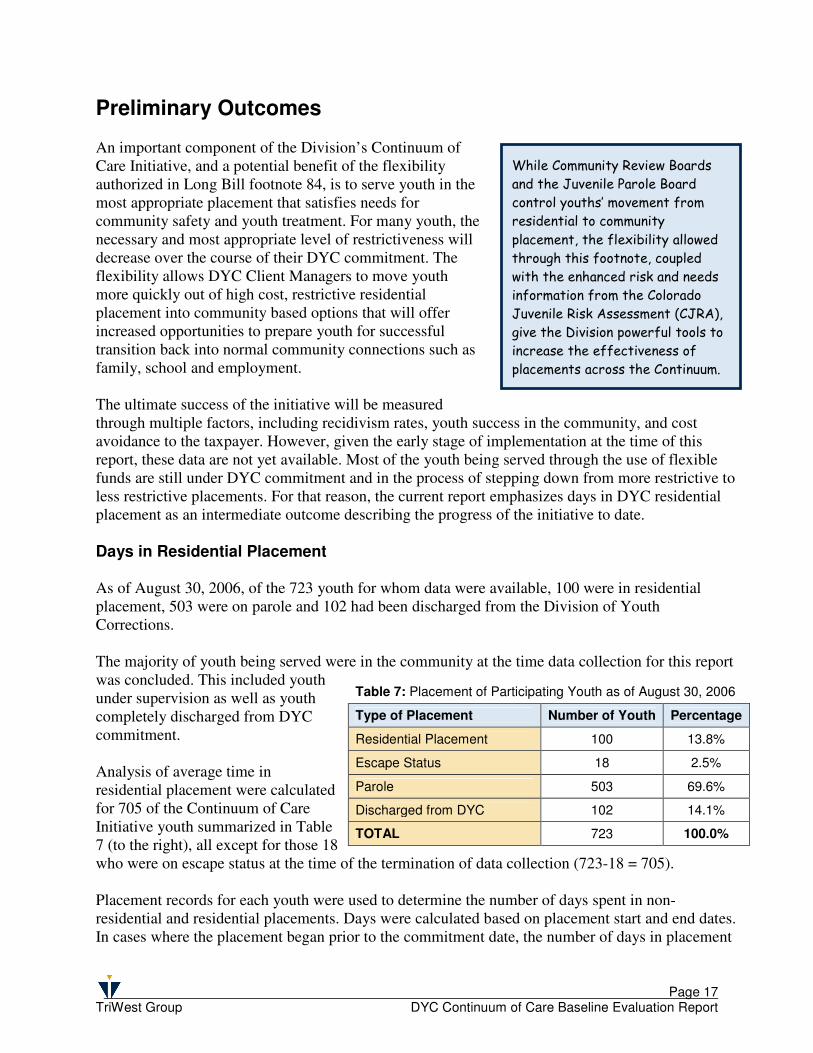
Preliminary Outcomes An important component of the Division’s Continuum of Care Initiative, and a potential benefit of the flexibility authorized in Long Bill footnote 84, is to serve youth in the most appropriate placement that satisfies needs for community safety and youth treatment. For many youth, the necessary and most appropriate level of restrictiveness will decrease over the course of their DYC commitment. The flexibility allows DYC Client Managers to move youth more quickly out of high cost, restrictive residential placement into community based options that will offer increased opportunities to prepare youth for successful transition back into normal community connections such as family, school and employment. The ultimate success of the initiative will be measured through multiple factors, including recidivism rates, youth success in the community, and cost avoidance to the taxpayer. However, given the early stage of implementation at the time of this report, these data are not yet available. Most of the youth being served through the use of flexible funds are still under DYC commitment and in the process of stepping down from more restrictive to less restrictive placements. For that reason, the current report emphasizes days in DYC residential placement as an intermediate outcome describing the progress of the initiative to date. Days in Residential Placement As of August 30, 2006, of the 723 youth for whom data were available, 100 were in residential placement, 503 were on parole and 102 had been discharged from the Division of Youth Corrections. The majority of youth being served were in the community at the time data collection for this report was concluded. This included youth under supervision as well as youth completely discharged from DYC commitment. Analysis of average time in residential placement were calculated for 705 of the Continuum of Care Initiative youth summarized in Table 7 (to the right), all except for those 18 who were on escape status at the time of the termination of data collection (723-18 = 705). Placement records for each youth were used to determine the number of days spent in non-residential and residential placements. Days were calculated based on placement start and end dates. In cases where the placement began prior to the commitment date, the number of days in placement
Table 7: Placement of Participating Youth as of August 30, 2006
Type of Placement Number of Youth Percentage
Residential Placement 100 13.8%
Escape Status 18 2.5%
Parole 503 69.6%
Discharged from DYC 102 14.1%
TOTAL 723 100.0%
Page 18 TriWest Group DYC Continuum of Care Baseline Evaluation Report
The decrease in ADP for FY2005-06 represents an important shift in a troubling trend and
may reflect a shift to decreasing commitment ADP as a function of more individualized and
targeted case management and services through the Continuum of Care Initiative.
was calculated based on the commitment date and the placement end date. Days in each placement were aggregated across each placement type for each youth. Table 8 (below) shows the average time in placement for youth served under the Continuum of Care Initiative between June 1, 2005 and August 30, 2006. These averages are compared with the DYC benchmark Residential (Commitment) LOS for Fiscal Year 2004-05 of 18.8 months.
While the residential LOS for Continuum of Care Initiative youth appears to be lower than the total residential LOS reported by DYC for FY05, this difference is not statistically significant (t = -1.096; p=.273). Furthermore, this average includes some youth who are continuing in residential placement, so additional days are possible. However, the average is a meaningful indicator of average days per youth at this point in the study.
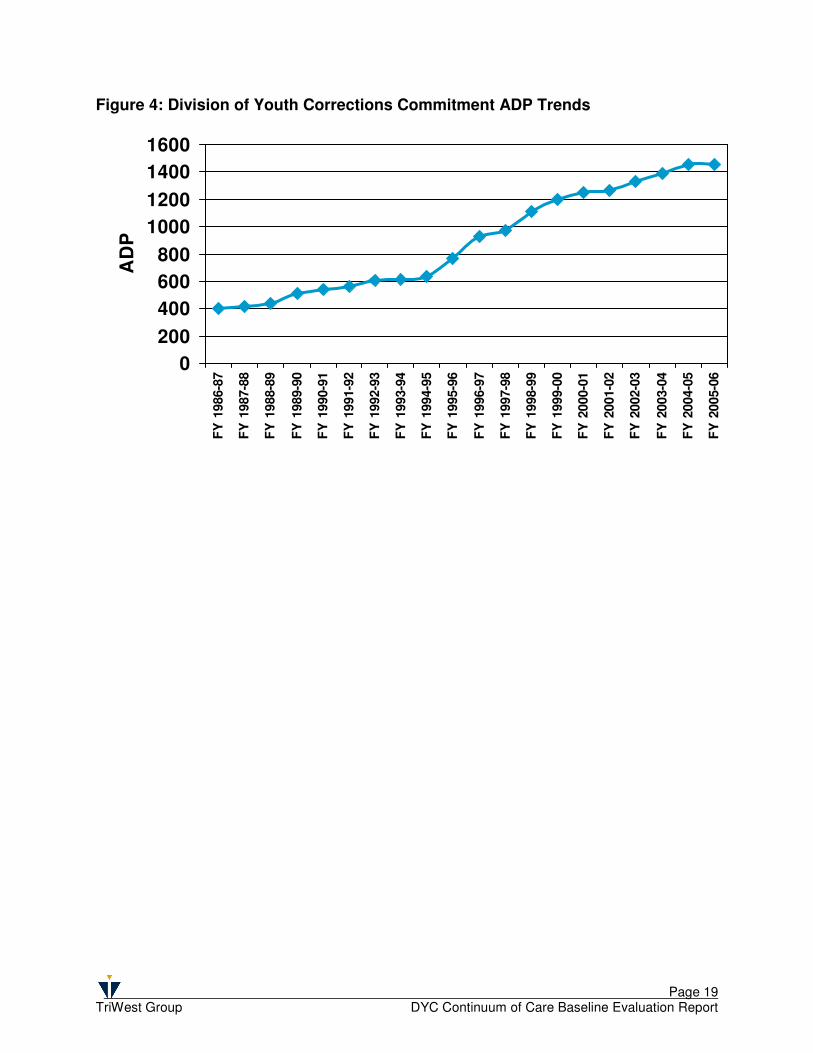
Changes in Commitment Residential ADP
As is shown in Figure 4 (next page), commitment ADP trends have shown a steady increase over the past 14 years. During the first year of the Continuum of Care Initiative, for the first time in 14 years, the commitment ADP rate did not show an increase, but rather a slight decline. Given the context for this decline – most notably, the significant (approximately 70%) multi-year reductions in state funds for Parole Program Services between FY2001-02 and FY2005-06 – the success of the Division of Youth Corrections in reducing the ADP is noteworthy. In addition, the Division’s Research and Evaluation office notes a marked and consistent increase in the mental health and substance use-related treatment needs of youth in commitment. This trend would suggest increasing, rather than declining, ADP. While this shift points to success for the Continuum of Care Initiative in achieving its goals, it also carries an inherent threat. Under a funding allocation structure based on average daily population (ADP) in commitment placement, reductions in ADP risks creating a downward funding spiral. Given that community expenditures under Footnote 84 are also funded as a percentage of the overall budget based on commitment ADP, successful community initiatives will undermine the budget on which they depend. Without a shift in funding allocation structures, as better community services become available and Client Managers become more effective in appropriately transitioning youth to community placements, the Division’s resources for both commitment and community-based services may shrink to the point that youth are left without placement.
Table 8: Average Time in Commitment LOS in Months Months in Residential Placement (Commitment)
(n=705). Excludes youth on escape status as of 8/30/2006.
CoC Youth
DYC Benchmark
Total Residential Length of Stay (LOS) 17.9 18.8
Page 19 TriWest Group DYC Continuum of Care Baseline Evaluation Report
Figure 4: Division of Youth Corrections Commitment ADP Trends
0
200
400
600
800
1000
1200
1400
1600
FY
1986-8
7
FY
1987-8
8
FY
1988-8
9
FY
1989-9
0
FY
1990-9
1
FY
1991-9
2
FY
1992-9
3
FY
1993-9
4
FY
1994-9
5
FY
1995-9
6
FY
1996-9
7
FY
1997-9
8
FY
1998-9
9
FY
1999-0
0
FY
2000-0
1
FY
2001-0
2
FY
2002-0
3
FY
2003-0
4
FY
2004-0
5
FY
2005-0
6
AD
P
Page 20 TriWest Group DYC Continuum of Care Baseline Evaluation Report
Baseline Data
Future Evaluation Data
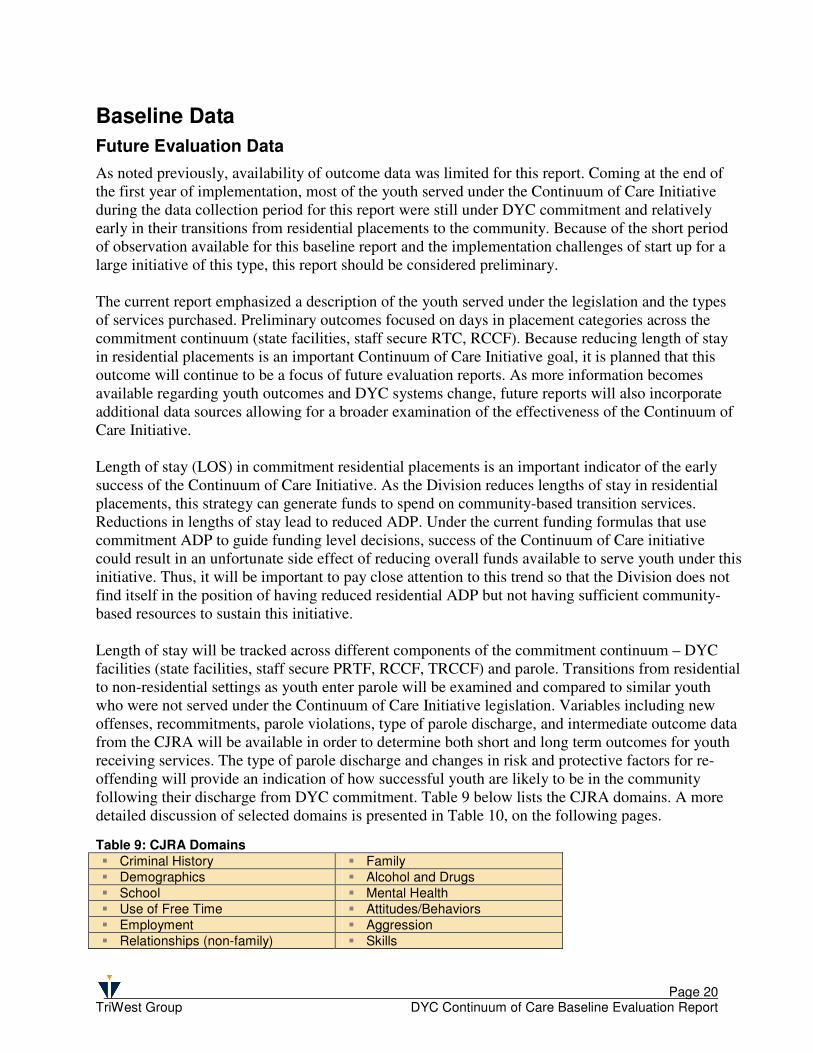
As noted previously, availability of outcome data was limited for this report. Coming at the end of the first year of implementation, most of the youth served under the Continuum of Care Initiative during the data collection period for this report were still under DYC commitment and relatively early in their transitions from residential placements to the community. Because of the short period of observation available for this baseline report and the implementation challenges of start up for a large initiative of this type, this report should be considered preliminary. The current report emphasized a description of the youth served under the legislation and the types of services purchased. Preliminary outcomes focused on days in placement categories across the commitment continuum (state facilities, staff secure RTC, RCCF). Because reducing length of stay in residential placements is an important Continuum of Care Initiative goal, it is planned that this outcome will continue to be a focus of future evaluation reports. As more information becomes available regarding youth outcomes and DYC systems change, future reports will also incorporate additional data sources allowing for a broader examination of the effectiveness of the Continuum of Care Initiative. Length of stay (LOS) in commitment residential placements is an important indicator of the early success of the Continuum of Care Initiative. As the Division reduces lengths of stay in residential placements, this strategy can generate funds to spend on community-based transition services. Reductions in lengths of stay lead to reduced ADP. Under the current funding formulas that use commitment ADP to guide funding level decisions, success of the Continuum of Care initiative could result in an unfortunate side effect of reducing overall funds available to serve youth under this initiative. Thus, it will be important to pay close attention to this trend so that the Division does not find itself in the position of having reduced residential ADP but not having sufficient community-based resources to sustain this initiative. Length of stay will be tracked across different components of the commitment continuum – DYC facilities (state facilities, staff secure PRTF, RCCF, TRCCF) and parole. Transitions from residential to non-residential settings as youth enter parole will be examined and compared to similar youth who were not served under the Continuum of Care Initiative legislation. Variables including new offenses, recommitments, parole violations, type of parole discharge, and intermediate outcome data from the CJRA will be available in order to determine both short and long term outcomes for youth receiving services. The type of parole discharge and changes in risk and protective factors for re-offending will provide an indication of how successful youth are likely to be in the community following their discharge from DYC commitment. Table 9 below lists the CJRA domains. A more detailed discussion of selected domains is presented in Table 10, on the following pages.
Table 9: CJRA Domains � Criminal History � Family � Demographics � Alcohol and Drugs � School � Mental Health � Use of Free Time � Attitudes/Behaviors � Employment � Aggression � Relationships (non-family) � Skills
Page 21 TriWest Group DYC Continuum of Care Baseline Evaluation Report
DYC Recidivism Reports have repeatedly demonstrated that youth either enrolled in school or employed at the time of discharge have a lower probability of re-offending following their discharge from DYC commitment7. Other studies have shown that specific factors in a youth’s home life, social network, personality, and temperament can place a youth at greater risk for re-offending8. If program services purchased for youth under the Continuum of Care Initiative can directly impact those factors directly related to a youth’s re-offending, then evidence suggests that these programs will have a high likelihood of reducing recidivism and helping youth succeed in the community. Beginning June 1, 2006 the Division began administering the CJRA to all newly committed youth during the assessment phase of their commitment. Since then, Client Managers have begun to use information from the CJRA to create detailed case plans which target the specific risk and need factors that make each youth more likely to re-offend. In addition to help targeting services, the CJRA also measures changes across time in each domain as it is re-administered during placement moves, when a youth is preparing for the transition to parole, and at other pre-determined time periods. In addition, a final CJRA is completed at the time the youth discharges completely from DYC supervision. These baseline measures taken at assessment and subsequent re-assessments will allow future evaluations of the Continuum of Care Initiative to examine changes in youth risk and protective factors as they move through the continuum. Improvements (decreases in risk and increases in protective factors) can be used to track how the Continuum of Care Initiative is achieving desired outcomes for youth. Ultimately, whether a youth commits any new offenses in the community (either during or following parole supervision) is of concern to both DYC and the General Assembly. A significant potential for cost avoidance and re-investment in community alternatives exists if it can be demonstrated that youth can be successfully managed through less restrictive, more community-based evidence based practices. It would not be realistic to expect that no youth will re-offend during or following their community supervision. However rates of recidivism for Continuum of Care Initiative youth which are equal to or lower than DYC recidivism rates of the past, or which are equal to or lower than recidivism rates for similar youth not served under this Initiative would be strong evidence of the effectiveness and efficiency of this funding approach. Table 10 (next page) explains in more detail the variables that will be available to examine this outcome.
7 CO Department of Health and Human Services, Division of Youth Corrections. (2005). Recidivism evaluation of committed youth discharged in fiscal year 2003-04. Denver, CO: author. 8 Washington State Institute for Public Policy (2001). Manual for the Washington State Juvenile Court Assessment. Olympia, WA: author.
Page 22 TriWest Group DYC Continuum of Care Baseline Evaluation Report
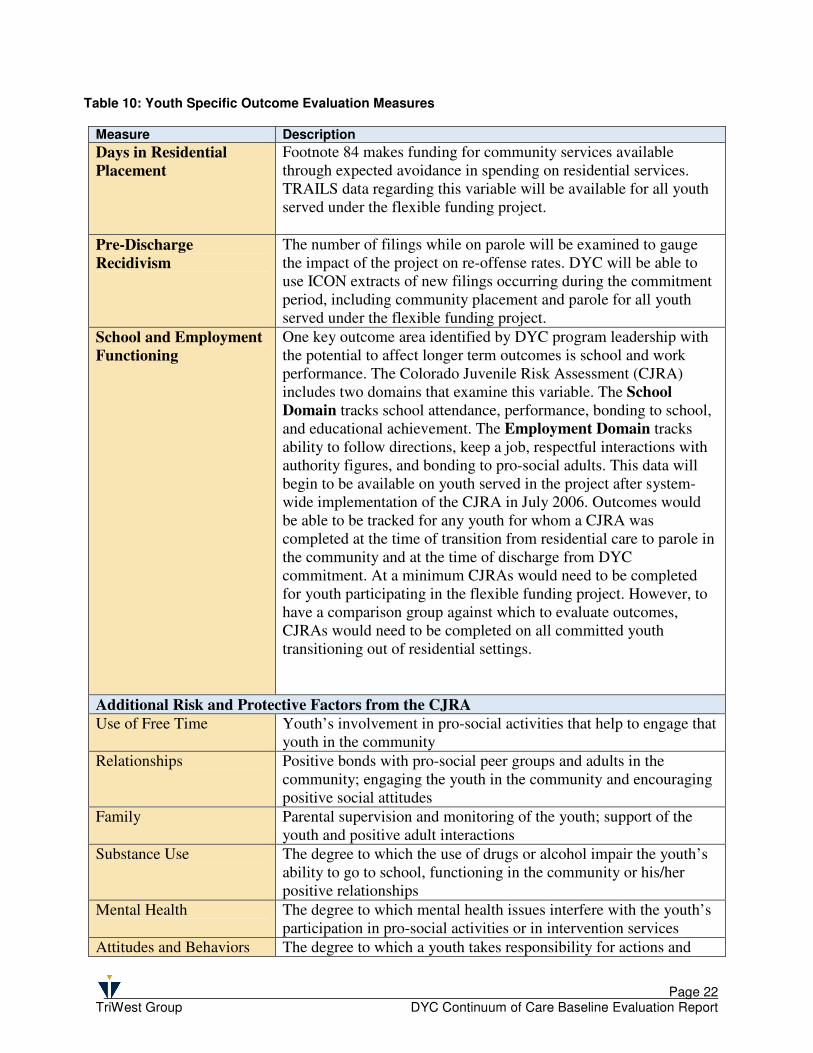
Table 10: Youth Specific Outcome Evaluation Measures
Measure Description
Days in Residential
Placement Footnote 84 makes funding for community services available through expected avoidance in spending on residential services. TRAILS data regarding this variable will be available for all youth served under the flexible funding project.
Pre-Discharge
Recidivism The number of filings while on parole will be examined to gauge the impact of the project on re-offense rates. DYC will be able to use ICON extracts of new filings occurring during the commitment period, including community placement and parole for all youth served under the flexible funding project.
School and Employment
Functioning One key outcome area identified by DYC program leadership with the potential to affect longer term outcomes is school and work performance. The Colorado Juvenile Risk Assessment (CJRA) includes two domains that examine this variable. The School
Domain tracks school attendance, performance, bonding to school, and educational achievement. The Employment Domain tracks ability to follow directions, keep a job, respectful interactions with authority figures, and bonding to pro-social adults. This data will begin to be available on youth served in the project after system-wide implementation of the CJRA in July 2006. Outcomes would be able to be tracked for any youth for whom a CJRA was completed at the time of transition from residential care to parole in the community and at the time of discharge from DYC commitment. At a minimum CJRAs would need to be completed for youth participating in the flexible funding project. However, to have a comparison group against which to evaluate outcomes, CJRAs would need to be completed on all committed youth transitioning out of residential settings.
Additional Risk and Protective Factors from the CJRA Use of Free Time Youth’s involvement in pro-social activities that help to engage that
youth in the community
Relationships Positive bonds with pro-social peer groups and adults in the community; engaging the youth in the community and encouraging positive social attitudes
Family Parental supervision and monitoring of the youth; support of the youth and positive adult interactions
Substance Use The degree to which the use of drugs or alcohol impair the youth’s ability to go to school, functioning in the community or his/her positive relationships
Mental Health The degree to which mental health issues interfere with the youth’s participation in pro-social activities or in intervention services
Attitudes and Behaviors The degree to which a youth takes responsibility for actions and
Page 23 TriWest Group DYC Continuum of Care Baseline Evaluation Report
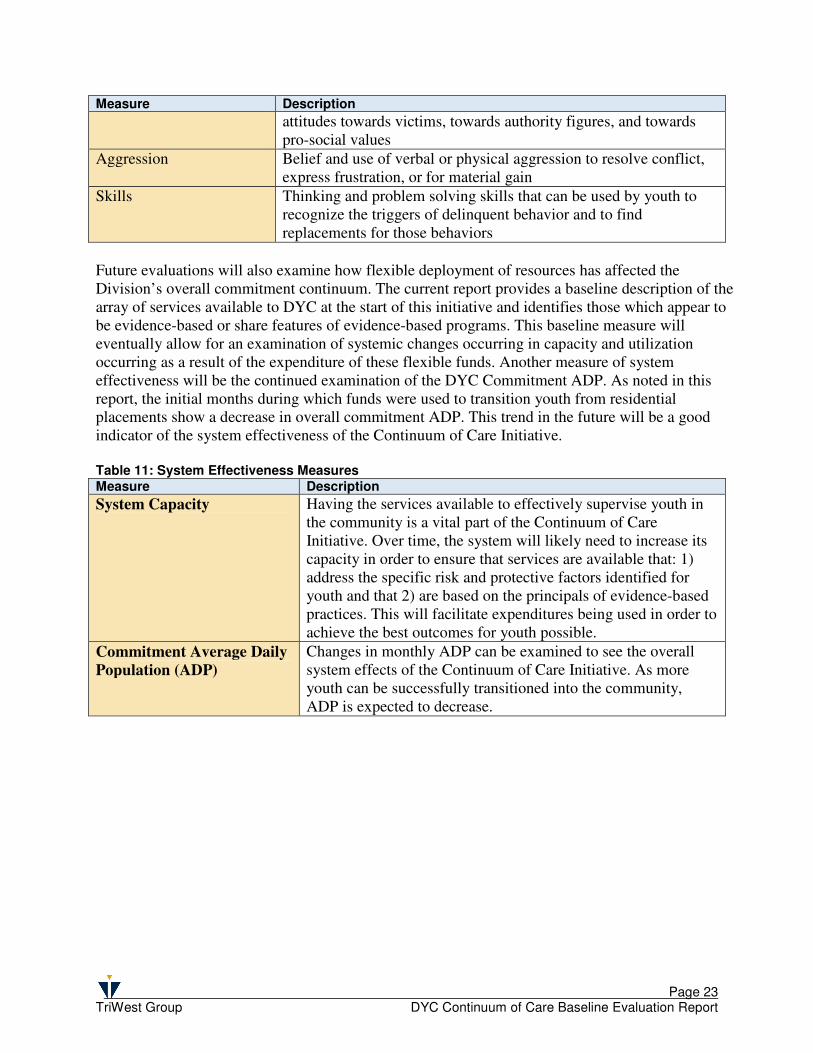
Measure Description
attitudes towards victims, towards authority figures, and towards pro-social values
Aggression Belief and use of verbal or physical aggression to resolve conflict, express frustration, or for material gain
Skills Thinking and problem solving skills that can be used by youth to recognize the triggers of delinquent behavior and to find replacements for those behaviors
Future evaluations will also examine how flexible deployment of resources has affected the Division’s overall commitment continuum. The current report provides a baseline description of the array of services available to DYC at the start of this initiative and identifies those which appear to be evidence-based or share features of evidence-based programs. This baseline measure will eventually allow for an examination of systemic changes occurring in capacity and utilization occurring as a result of the expenditure of these flexible funds. Another measure of system effectiveness will be the continued examination of the DYC Commitment ADP. As noted in this report, the initial months during which funds were used to transition youth from residential placements show a decrease in overall commitment ADP. This trend in the future will be a good indicator of the system effectiveness of the Continuum of Care Initiative. Table 11: System Effectiveness Measures Measure Description
System Capacity Having the services available to effectively supervise youth in the community is a vital part of the Continuum of Care Initiative. Over time, the system will likely need to increase its capacity in order to ensure that services are available that: 1) address the specific risk and protective factors identified for youth and that 2) are based on the principals of evidence-based practices. This will facilitate expenditures being used in order to achieve the best outcomes for youth possible.
Commitment Average Daily
Population (ADP) Changes in monthly ADP can be examined to see the overall system effects of the Continuum of Care Initiative. As more youth can be successfully transitioned into the community, ADP is expected to decrease.
Page 24 TriWest Group DYC Continuum of Care Baseline Evaluation Report
The outcomes and process
information available for this
report are consistent with the
successful implementation of a
juvenile justice system
improvement such as this one.
Conclusions and Recommendations
Over the last two years, the Division of Youth Corrections has undertaken a comprehensive systems improvement effort – the Continuum of Care Initiative. This initiative has brought significant attention and improvements to the Division’s continuum of services from the continuum of pre-commitment (detention) services, through commitment and parole. The flexible funding authorization contained in Footnote 84 of the FY2005-06 Long Bill is an important component of the overall Continuum of Care Initiative. This authorization, states that:
“ … up to 10.0 percent of the General Fund appropriation to this [purchase of contract placements] line may be used to provide treatment, transition, and wrap-around services to youths in the Division of Youth Correction's system in residential and non-residential settings.”
The Division of Youth Corrections is using this added flexibility to support the implementation of a set of integrated system improvements based on research based principles of effective practice. An Effective Approach – Section 5 of Footnote 84 specifically addresses the need to evaluate the “effectiveness of this footnote.” While the data available at the time of this report is preliminary, the experience of juvenile justice jurisdictions nationally clearly points to the strategies authorized through the footnote as the most appropriate and effective approach to managing services for juvenile offenders (e.g., Barnoski & Aos, 2005). In fact, a consistent finding across research and program evaluations has been the centrality of targeting treatment for juvenile offenders based on individualized assessment of criminogenic risk and need factors. The authorization in Footnote 84 provides the flexibility that the Division needs to successfully implement these proven strategies. The Continuum of Care Initiative is well-founded. It is based on strategies of effective juvenile justice strategy that have been proven through research and practice to be effective. First, the Initiative emphasizes a coordinated continuum of care with a broad array of program and service options that are sequenced and combined to create a range of intervention options that ensure the appropriate treatment, education, training, and care compatible with the youth’s specific needs. Second, it emphasizes community-based options when appropriate. Instead of removing youth from their home environment, community-based services impact the youth’s total environment by addressing problems in the community where they develop, and by establishing the long-term support necessary to sustain progress. Third, the Continuum of Care Initiative features individualized programming that is sufficiently intensive and comprehensive to accommodate the individual needs and potentials of the youth and their families. Fourth, the Initiative attends to aftercare and re-integration so that youth continue receiving the support of treatment services following their treatment in a residential facility.
Page 25 TriWest Group DYC Continuum of Care Baseline Evaluation Report
In keeping with these strategies, the Continuum of Care Initiative has been implemented through an integrated strategy involving state-of-the-art assessment, enhanced treatment services within residential facilities, and improved transitions to appropriate community-based services. The Division made a commitment to examine and realign internal operational practices to be more consistent with the principles of evidence-based practice and the interventions that have the most research support for being effective in reducing recidivism and re-victimization by juvenile offenders. As part of this strategy, the Continuum of Care Initiative seeks to provide the optimal length of stay in each stage of service to juvenile offenders as they move from secure residential to community-based services on parole. In order to ensure accurate and targeted information to support individualized case planning, DYC identified a state-of-the-art, empirically-based risk assessment instrument (the Washington State Juvenile Risk Assessment), modified and renamed the Colorado Juvenile Risk Assessment (CJRA) for use in Colorado. A system change initiative like the Continuum of Care Initiative takes time to implement fully and must take into account the inter-dependency of all parts of the system – both state-run and contracted. Complex assessment information for each youth must be integrated into a case plan that is then communicated across the system so that the same delinquency risk and needs factors for a given youth are being addressed in each component of the system. This systemic perspective is critical for long term success, but necessarily suggests that the system change will not be able to be achieved in one year, but will be developmental. The outcomes and process information available for this report are consistent with the successful implementation of a juvenile justice system improvement such as this one. The initiative is now in the start-up or early implementation phase. DYC has identified and provided system-wide training on a state-of-the-art, empirically based risk and needs assessment that is now in use and will be available to target services and track outcomes for youth enrolled this fiscal year. The current report reveals that initial outcomes, in terms of LOS and ADP suggest a positive trend. This is especially notable in light of the fourteen year trend toward increasing ADP. The assessment system based on the CJRA provides for the development of a comprehensive case management and treatment plan addressing specific risk factors across the continuum of services and placements. Information from the CJRA began to become available in July 2006 and will be used in following reports. Overall, the Continuum of Care Initiative has made a strong start toward implementing the vision of the Division to continually improve its system of care. The elements are in place to meet the goals of DYC and the General Assembly over time, and an evaluation framework has been established to measure the extent to which those goals are achieved. As noted earlier, in light of the early success of the Initiative in Colorado and the clear and consistent research evidence to support the cost effectiveness of community-based options, it is critical that funding levels be maintained even as residential ADP is reduced by successful implementation of the Continuum of Care Initiative. Ongoing barriers to the Continuum of Care Initiative’s success remain significant. Given reductions in appropriate community-based services for youth in DYC custody over recent years, the Division remains challenged to match youth with the most effective services in the most appropriate settings to meet their rehabilitation needs. As the array of community-based service options is rebuilt and
Page 26 TriWest Group DYC Continuum of Care Baseline Evaluation Report
expanded, the success of the Continuum of Care Initiative will in turn be challenged by the current funding structure which is based on a formula that uses average daily population (ADP) in commitment placement to determine funding levels. Without a shift in funding methodology, as better community services become available and Client Managers become more effective in appropriately transitioning youth to community placements, the Division’s resources for both commitment and community-based services could shrink to the point that youth are left without placement.