Embed Size (px)
DESCRIPTION
tes
Citation preview
7/18/2019 Contoh B_Dhanani_Unemployment and Underemployment in Indonesia
http://slidepdf.com/reader/full/contoh-bdhananiunemployment-and-underemployment-in-indonesia 1/41
Unemployment and Underemployment in Indonesia,
1976-2000: Paradoxes and Issues
By
Shafiq Dhanani*
International Labour Office, Geneva
January 2004
Papers prepared in this Series are the views of the author(s)and do not necessarily reflect the views of the ILO
*United Nations Industrial Development Organization, Jakarta, Indonesia.
For more information on the InFocus Programme on Socio-Economic Security, please see the related web page
http://www.ilo.org/ses or contact the Secretariat at Tel: +41.22.799.8893, Fax: +41.22.799.7123 or E-mail:[email protected]
7/18/2019 Contoh B_Dhanani_Unemployment and Underemployment in Indonesia
http://slidepdf.com/reader/full/contoh-bdhananiunemployment-and-underemployment-in-indonesia 2/41
ii
Copyright © International Labour Organization 2004
Publications of the International Labour Office enjoy copyright under Protocol 2 of the
Universal Copyright Convention. Nevertheless, short excerpts from them may bereproduced without authorization, on condition that the source is indicated. For rights ofreproduction or translation, application should be made to the ILO Publications Bureau(Rights and Permissions), International Labour Office, CH-1211 Geneva 22, Switzerland.
The International Labour Office welcomes such applications.
Libraries, institutions and other users registered in the United Kingdom with the CopyrightLicensing Agency, 90 Tottenham Court Road, London W1P 9HE (Fax: +44 171436 3986),in the United States with the Copyright Clearance Centre, 222 Rosewood Drive, Danvers,
MA 01923 (Fax: +1 508 750 4470), or in other countries with associated ReproductionRights Organizations, may make photocopies in accordance with the licences issued tothem for this purpose.
___________________________________________________________________
ISBN 92-2-115216-2
First published 2004
The designations employed in ILO publications, which are in conformity with United Nations practice, and the presentation of material therein do not imply the expression of
any opinion whatsoever on the part of the International Labour Office concerning the legalstatus of any country, area or territory or of its authorities, or concerning the delimitationof its frontiers.
The responsibility for opinions expressed in signed articles, studies and other contributionsrests solely with their authors, and publication does not constitute an endorsement by theInternational Labour Office of the opinions expressed in them.
Reference to names of firms and commercial products and processes does not imply their
endorsement by the International Labour Office, and any failure to mention a particularfirm, commercial product or process is not a sign of disapproval.
ILO publications can be obtained through major booksellers or ILO local offices in manycountries, or direct from ILO Publications, International Labour Office, CH-1211 Geneva22, Switzerland. Catalogues or lists of new publications are available free of charge from
the above address.
Printed by the International Labour Office. Geneva, Switzerland
7/18/2019 Contoh B_Dhanani_Unemployment and Underemployment in Indonesia
http://slidepdf.com/reader/full/contoh-bdhananiunemployment-and-underemployment-in-indonesia 3/41
iii
Contents
Preface ............................................................................................................................................... v
1. Introduction ............................................................................................................................. 1
2. Eight paradoxes of open unemployment ................................................................................. 3
2.1 Higher unemployment rate in urban areas..................................................................... 5 2.2 Higher unemployment rate of youth ............................................................................. 5 2.3 Higher unemployment rate of females .......................................................................... 9 2.4 Is educated unemployment an issue? ............................................................................ 10 2.5 Higher unemployment rate of senior versus vocational secondary school leavers ....... 14 2.6 Why did the unemployment rate continue to rise during rapid growth?....................... 16 2.7 Not all job seekers are affluent...................................................................................... 18 2.8 Why did unemployment rates vary by province?.......................................................... 21
3. Underemployment ................................................................................................................... 22
3.1 The voluntary nature of most part-time work................................................................ 22 3.2 Disguised unemployment.............................................................................................. 25
4. Conclusions and implications.................................................................................................. 27 4.1 Open unemployment ..................................................................................................... 27 4.2 Underemployment and disguised unemployment ......................................................... 30 4.3 Employment data........................................................................................................... 31
References.......................................................................................................................................... 32
Other papers in the SES Series .......................................................................................................... 33
List of f igures
1. Open urban unemployment rate by age, 1990 and 2000 (% of labour force)................................ 6 2. Unemployment rate of 1989-93 technical graduates (% of labour force)...................................... 14
List of tables
1. Open unemployment rates by gender and in urban-rural areas, 1976 – 2000 (% of labour force) 5 2. Open unemployment rates and composition by age, 1976 – 2000 ................................................ 6 3. Job search duration and strategy, 1996-1997................................................................................. 8 4. Open unemployment rates by gender, 1976 – 2000....................................................................... 10 5. Age and education-specific urban unemployment rates, 1976 – 2000 .......................................... 11 6. Age and education-specific urban employment rates, 1976 – 2000 .............................................. 12 7. Urban median job search duration by education level, 1976 – 1998 (months).............................. 12 8. Open unemployment rates of senior secondary school leavers, 1976 – 2000................................ 15 9. Open unemployment rates in Sakernas and Susenas surveys, 1992–1994 (Population aged 10
and above)
................................................................................................................................... 16 10. Changes in working age population and unemployment rate by gender, 1976 - 2000................ 17 11. Open unemployment rates by expenditure quintiles, 1997 and 1999 .......................................... 18 12. Unemployment and employment rates by expenditure groups and age, 1993............................. 19 13. Median expenditure of unemployed and population by expenditure groups, 1993 (Rp.
000/capita/month)........................................................................................................................ 20 14. Factors contributing to open urban unemployment rate, 1990 - 1993 ......................................... 21 15. Trends in part-time employment, 1976 – 1997 (% of total employment) ................................... 23 16. Characteristics of Part-time Employment, 2000.......................................................................... 23 17. Employment and average hours of work of family workers, 1995.............................................. 24 18. Workers looking for work and reasons for not looking for work, 1995 (% of total
employment) ............................................................................................................................ 24
19. Others and Open Unemployment Rates, 1976 – 2000 (% of Population 15+)............................ 26 20. Composition of “others” outside the labour force by age group, 1990........................................ 26 21. Willingness to work for persons outside the labour force, 1993.................................................. 27

7/18/2019 Contoh B_Dhanani_Unemployment and Underemployment in Indonesia
http://slidepdf.com/reader/full/contoh-bdhananiunemployment-and-underemployment-in-indonesia 4/41
7/18/2019 Contoh B_Dhanani_Unemployment and Underemployment in Indonesia
http://slidepdf.com/reader/full/contoh-bdhananiunemployment-and-underemployment-in-indonesia 5/41
v
Preface
As Indonesia has struggled to recover from its dark and ugly period of devastationand repression, and from the “Asia crisis”, it has moved into an era where new institutions
are taking shape.
In 2000, the ILO’s Socio-Economic Security Programme launched an ambitious project to take stock of the social and economic insecurities in the country, to assist ourconstituents and colleagues to devise new policies for reducing those insecurities and to promote universal social protection.
This paper is one of more than 20 that has emerged so far and focuses on labourutilization problems that emerged in the period of democratization.
Guy StandingDirectorSocio-Economic Security Programme

7/18/2019 Contoh B_Dhanani_Unemployment and Underemployment in Indonesia
http://slidepdf.com/reader/full/contoh-bdhananiunemployment-and-underemployment-in-indonesia 6/41
7/18/2019 Contoh B_Dhanani_Unemployment and Underemployment in Indonesia
http://slidepdf.com/reader/full/contoh-bdhananiunemployment-and-underemployment-in-indonesia 7/41
1
1. Introduction
This paper has three objectives. The first one is to illustrate, with labour force surveydata spanning over 25 years, that much unemployment in a young and rapidly growing
developing country, such as Indonesia before the crisis, was transitional, first-job searchunemployment. This is fundamentally different to unemployment in developed countries.
The second objective is to show that educated unemployment was not a problem inIndonesia, as was believed by many Indonesian policy makers and academics. The thirdobjective is to show that underemployment, when defined in terms of involuntarilyworking shorter hours, was also not an employment issue. Working for long hours for little pay, misleadingly sometimes termed underemployment, remains a serious problem that thegovernment should worry about.
The traditional view of developing country unemployment is that it is of minorimportance, because it affects mainly members of relatively well-off families who can afford along job search to obtain suitable formal sector employment. The luxury unemploymenthypothesis states that most job seekers, being relatively poor, will quickly settle for the first job available, and implicitly assume that jobs are relatively easily available in traditionaloccupations or in self-employment. Though this hypothesis has rarely been adequately testedusing data on income distribution for the unemployed, and on job search duration and
unemployment rates of job seekers by income groups, the observation that unemployment isvirtually non-existent in the adult population in many developing countries is taken as
sufficient proof that unemployment is not a serious policy issue in developing countries.
This above view has been challenged by noting that unemployment rates have been highor even higher in poorer households than in richer households in a number of Latin Americancountries and that, even in the absence of an unemployment security system, job seekers from poor households do receive substantial support from their families to finance their often long
job search (Turnham, 1994). This view further holds that youth unemployment in developing
countries constitutes an economic, social and political problem of equal importance to that indeveloped countries, because young job seekers, who constitute the majority of theunemployed, experience serious difficulty in gaining access to gainful employment,notwithstanding the existence of a large traditional and self-employed sector.
The economic aspect of unemployment is related to the under-utilization of labour in poor countries, where this is often the only production factor in abundant supply. Educatedunemployment has received particular attention in this context, since education oftenconstitutes the largest component of the recurrent budget of developing countries. While thesocial aspect of unemployment is related to the sense of dignity, participation and contribution
to society that work confers on the employed, the political aspect is mainly concerned with the potential for social unrest of unemployed urban youth, many of whom are said to come from
relatively comfortable and influential families.
While this paper attempts to provide an assessment of the extent, nature and possiblecauses of unemployment in a large and rapidly developing country such as Indonesia, it
should be stated at the outset that the statistical measurement of the unemployment rate itself portrays quite an ambiguous picture of the extent of unemployment. This is because the
statistical definition of unemployment in labour force surveys and other similar enquiries indeveloping countries involves the key concept of active job search, or of actively looking forwork in a reference period, usually in the week prior to enumeration. Thus those who are notworking and not looking for work, such as the two thirds of the urban and half of the ruralfemale population of working age population are not considered unemployed, even though thefemale working age population would be considered to be substantially under-utilized by
developed country standards, where female labour participation rates are usually much higher.Those who were not looking for work in the previous week, but were doing so in the previous
7/18/2019 Contoh B_Dhanani_Unemployment and Underemployment in Indonesia
http://slidepdf.com/reader/full/contoh-bdhananiunemployment-and-underemployment-in-indonesia 8/41
2
month will similarly be missed out. In addition, discouraged workers, those not looking forwork because they believe jobs were not available, would not be classified as unemployed
especially in rural areas, though they certainly represent an important component of under-utilization of labour, and perhaps also constitute a social and political problem.
On the other hand, more people in urban areas actively look for work in the expectationof finding a job, and more urban females may also start actively looking for work in periods of
abundant jobs and a tight labour market. Thus a high and rising urban unemployment rate mayindeed signal a favourable economic environment. Similarly, if unemployment wereconcentrated in relatively richer families, a rising unemployment rate would further indicate arising share of such families in urban areas and increasing economic prosperity in the
population as a whole. The above illustrations warn against the reliance on the unemploymentrate as the sole indicator of under-utilization of labour. As argued in this report, an adequate
assessment of unemployment must measure unemployment rates by cohort due to thetransitional nature of most open unemployment in developing countries, and combine thesemeasures with information on job search duration.
The open unemployment rate of a country or region is the result of a combination of amultitude of circumstances and distinct factors, some acting on the supply side and others
on the demand side. Supply side factors such as the age structure of the population, thedecline in fertility, the educational attainment of youth, and the sustained rise in theeconomic well-being of the population, are generally of a long-term nature. The situation isrendered more complex because the first three factors above often increase the openunemployment rate as more people, particularly women, join the labour force, while thewithdrawal of children and teenagers from the labour force, including those looking forwork, to attend school is made possible by rising living standards of the ordinaryhouseholds.
Others factors, acting on the demand side, are both of a long-term nature, such as thesectoral and status structure of employment, and some of a medium and short-term nature,such as the pace and nature of economic growth as a result of economic activity. Here toosome features, such as the magnitude of self-employment and the size of the traditional andself-employed sector, are likely to facilitate youth employment, while others, such as capital-intensive product mix and manufacturing processes, restrict access to such employment. Inaddition, a strong rise in economic activity may increase the number of job seekers in its
initial phase, while sustained labour-intensive growth eventually reduces unemployment.
The mere statement of a level of open unemployment or even the trend in its rate has
therefore little substantive meaning in either the economic, social and political contexts unlessaccompanied by adequate additional information, even when confined to the urban populationor the youth. Without the explicit consideration of the specific circumstances mentionedabove and giving rise to the observed level and trends in the open unemployment rate, and
without complementary information on the unemployment rate expressed as a ratio of theworking age population, job search duration and trends in the employment rates, it is not possible to decide whether a particularly high level of open unemployment constitutes anemployment problem or an indication of improvement in employment opportunities. Similarlya low or declining open unemployment rate can equally signal a rise in the demand for labour,or a low or deteriorating level of economic activity, resulting in a withdrawal from the labourforce and increased disguised unemployment.
A detailed assessment of the age and educational structure of the population and of theemployment structure of the work force is all the more necessary when drawing comparisons between the open unemployment rates of different countries, or among regions in a country,where the above factors are likely to be present in different degrees. Comparisons between
narrowly defined groups such as the urban males, or female youth, by controlling for some ofthese factors, may be more instructive. An international comparison requires added care since
7/18/2019 Contoh B_Dhanani_Unemployment and Underemployment in Indonesia
http://slidepdf.com/reader/full/contoh-bdhananiunemployment-and-underemployment-in-indonesia 9/41
3
survey methods and questionnaires are likely to vary a great deal, and the existence orotherwise of employment insurance and social security schemes introduces a further
complication.
The outline of the paper is as follows. Section 2 discusses eight paradoxes of openunemployment in Indonesia. It discusses the higher unemployment rate in urban areas, offemales, of youth, of the more educated job seekers, and of general as opposed to vocational
school leavers. It asks why the open unemployment rate rose while the economy grew in the1980s and 1990s. It also discusses why the open unemployment rate did not vary withincome, and the reasons for its widely different level in apparently similar provinces acrossthe country. Section 3 reviews the characteristics of the underemployed, particularly the part-
time and voluntary nature of much unemployment when defined in terms of short workinghours. It then attempts to quantify disguised unemployment.
The final section 4 summarizes the findings of the study, and suggests that governmentshould not unduly worry about unemployment and underemployment, and should criticallyevaluate all requests for government resources to alleviate unemployment. Nevertheless, it
should not be complacent about unemployment and underemployment in Indonesia. It shouldclosely monitor developments in unemployment and job search duration as they provide
important indications of changes in the labour market and the general economy. Access tofirst-time employment is relatively difficult even in countries with a large traditional and self-employed sector. Young job seekers come for all income groups, not just the affluent, andfrom all educational backgrounds, and most of them look for work for a relatively long periodof time. So whatever the government can do to facilitate the transition from school and collegeto work will be welcome. Second, it argues that many adults have to work extremely longhours to earn a living wage, and this is a cause for concern.
2. Eight paradoxes of open unemployment
Observers of open unemployment data in Indonesia before the crisis, and othersimilarly rapidly growing developing countries, are presented with the following eight
paradoxes:
i. Urban open unemployment rates were three times higher than in rural areas.Jakarta’s unemployment rate was the highest in the country. So why did people continue to migrating to urban areas where, if we the openunemployment figures, urban areas had even fewer jobs than rural areas?
ii. The youth open unemployment rate was several times higher than for adults,yet most businesses and the civil service recruited young people rather than people past the age of 30.
iii. The female open unemployment rate was higher than for males, yet manymodern sector activities recruited large numbers of women, including inlabour-intensive manufacturing factories, supermarkets, department stores,restaurants, hotels, banks, insurance companies, and travel services.
iv. The open unemployment for more educated persons was higher than for less
educated persons. Senior secondary school leavers and university graduatesformed an increasingly large proportion of the openly unemployed, 60 per
cent of the total in 1997. Yet the demand for education remains strong, and private education schools and universities have mushroomed. Furthermore, businesses increasingly recruit tertiary graduates in preference to those
holding lower qualifications even for secretarial and technician jobs, leadingto qualification escalation.
7/18/2019 Contoh B_Dhanani_Unemployment and Underemployment in Indonesia
http://slidepdf.com/reader/full/contoh-bdhananiunemployment-and-underemployment-in-indonesia 10/41
4
v. At the senior secondary school level, the open unemployment rate of generalsecondary school leavers has been higher than that of vocational school
leavers, yet they often do the same jobs and show little difference in pay oncerecruited.
vi. The Indonesian economy grew by an average of 7-8 per cent per year sincethe mid-1970s, yet the open unemployment rate steadily increased from 2 to 6
per cent by 1997. Why did economic growth not reduce the openunemployment rate?
vii. The open unemployment rate was very similar across income levels, yet jobseekers from poorer households could apparently not afford to be openly
unemployed.
viii. The open urban unemployment rate in some provinces such as SouthSumatra, Aceh, East Kalimantan, NTT, Maluku and Irian Jaya was two orthree times higher than in neighbouring, provinces such as Lampung, NTBand Central Kalimantan for no apparent reason.
Before addressing these paradoxes, it is worth pointing out that the interpretation ofunemployment data is not merely academic. In the past, the government, committed scarce
resources to alleviate the apparent plight of the urban unemployed, particularly its collegegraduates, and to expanded investment in vocational education on the basis ofunemployment data. Since central, provincial and district governments may make furthersimilar budgetary allocations in the future; a correct interpretation of the nature andcharacteristics of unemployment is essential to assist policy makers in the judiciousallocation of scarce government resources.
Most of the above paradoxes stem from the fact that the official rate of openunemployed measures simultaneously the lack and the increase in employmentopportunities. Statistical offices measure the open unemployment rate by identifying
persons who are not currently working and actively looking for work. Because of thelatter, if more people actively look for work when they believe there are jobs available in a buoyant economy, this will push up the unemployment rate. On the other hand, if they donot actively look for work, perhaps because they believe there are no jobs available, thiswill keep the open unemployment rate low.
More fundamentally, unemployment in a rapidly growing developing country, such as
Indonesia before the crisis, is different than in developed countries because most of it istransitional, search unemployment rather than structural unemployment. This is in turn due
to their young and rapidly growing working age population, and the resulting large numberof young, first-time job seekers entering the labour market each year. The evidence for thetransitional or search nature of most open unemployment is provided by the age profile ofthe job seekers and their lack of job experience. This was first presented in tables 3 and 4of Section 2 above, and is discussed again below. In addition to their increasing workingage population, the low income and savings of most ordinary households, and the absenceof an unemployment security system prevented most adults from remaining out of work forany length of time.
In addition, even within developing countries, urban unemployment levels vary fromone country to another, from being relatively low in Indonesia to being relatively high inothers, due to the prevalence of self-employment and unpaid family work as opposed towage employment. These fundamental differences between developed and developingcountries, and within developing countries, are discussed in the context of the eight
paradoxes below.

7/18/2019 Contoh B_Dhanani_Unemployment and Underemployment in Indonesia
http://slidepdf.com/reader/full/contoh-bdhananiunemployment-and-underemployment-in-indonesia 11/41
5
Having drawn attention to the inherent ambiguity in the measurement of the openunemployment rate, and the transitional nature of most of it in a growing developing
country, this section examines the relevance of models using the open unemployment ratesuch as the Harris-Todaro model, and the luxury unemployment hypothesis. But first, theseven paradoxes noted at the beginning of this section are addressed in turn below.
2.1 Higher unemployment rate in urban areas
The open unemployment rate in urban areas was higher than in rural areas becausethe proportion of urban youth actively looked for work was higher in urban areas. Job
seekers believed that jobs were available in urban areas, and looked for work, while they believed that there were no jobs available in rural areas. Also some rural youth migrated tourban areas to look for work, precisely because they rated their chances of getting a jobthere as higher than if they remained in rural areas.
Before the crisis, the open unemployment rate in urban was 8 per cent, or three timeshigher than the 2.9 per cent rate in rural areas (Table 1). The urban-rural gap was even fourtimes higher between 1976 and 1993. The open unemployment for Jakarta, at 11 per cent in
1997, was one of the highest in the country.
Table 1. Open unemployment rates by gender and in urban-rural areas, 1976 – 2000 (% of labour force)
1976-79 1986-89 1990-93 1994-97 1998-2000
Urban Areas 6.4 7.1 5.7 8.2 9.7Male 7.0 6.8 5.3 7.2 9.0Female 5.0 7.8 6.5 10.0 10.7
Rural Areas 1.7 1.4 1.5 2.9 3.7Male 2.0 1.4 1.4 2.4 3.4Female 1.2 1.4 1.7 3.5 4.2
Total 2.5 2.7 2.7 4.6 6.0Male 2.9 2.8 2.5 4.1 5.6Female 1.7 2.7 2.9 5.6 6.6
Source: Labour Force Situation in Indonesia (Sakernas Survey), annual publication (table 2),CBS.
Note:
1. Four-year average for 1976-79, 1986-89 and 1990-93, and three-year average for 1993-97and 1989-2000.
2. Reference period for looking for work changed from “previous week” to “currently” between1993 and 1994. Figures for open unemployment rates are thus not directly comparable beforeand after 1993.
In 1994, the reference period for active job search was changed from looking for work
in the previous week to currently looking for work . This definitional change resulted in anearly doubling of the open unemployment rate form 2.7 to 4.6 per cent. However, theincrease was more pronounced in rural areas than in urban areas (1.5 to 2.9 versus 5.7 to 8 per cent), in the sense that a majority of urban job seekers looked for work in the previousweek, compared with just half in rural areas. This suggests that the urban unemployed
were more active job seekers than their rural counterparts.
2.2 Higher unemployment rate of youth
The open unemployment rate for youth was higher than for adults, not because theywere less employable, but because of a continuous flow of school leavers and college
graduates undergoing their transition from full time education to full time work. Around 90 per cent of all open unemployment consisted of youth aged 15-29, and 80 per cent of all
7/18/2019 Contoh B_Dhanani_Unemployment and Underemployment in Indonesia
http://slidepdf.com/reader/full/contoh-bdhananiunemployment-and-underemployment-in-indonesia 12/41
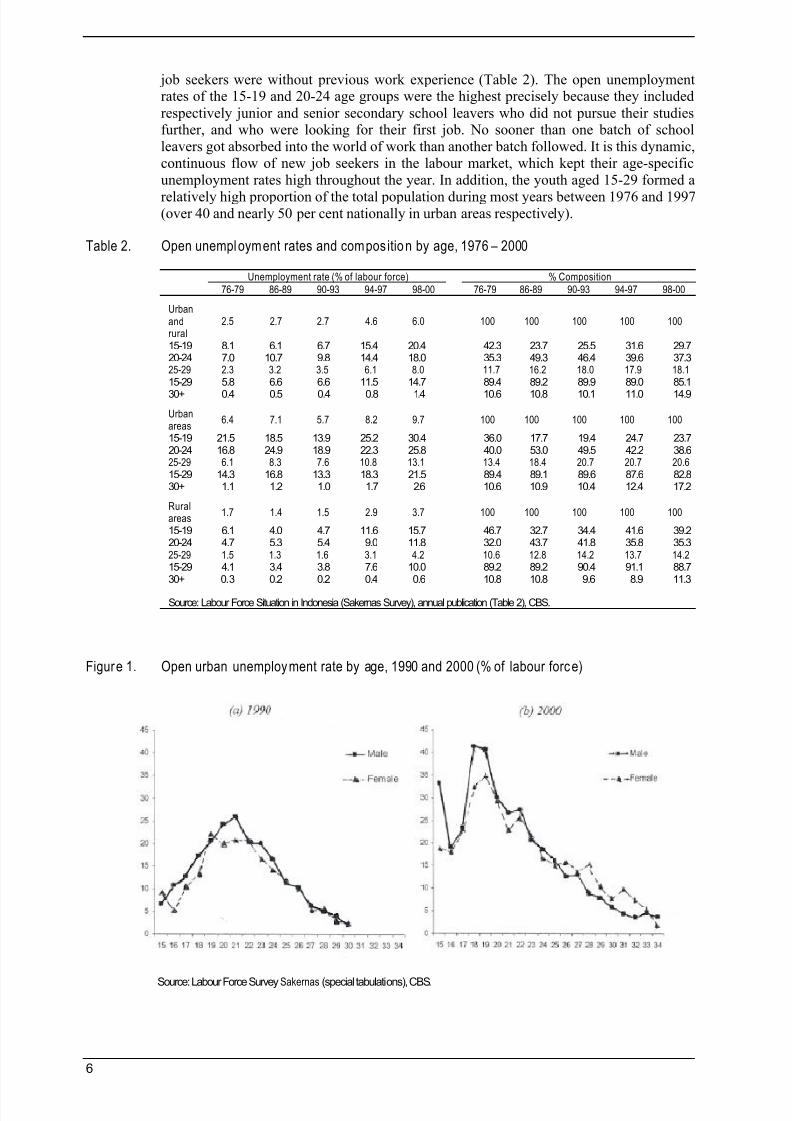
6
job seekers were without previous work experience (Table 2). The open unemploymentrates of the 15-19 and 20-24 age groups were the highest precisely because they included
respectively junior and senior secondary school leavers who did not pursue their studiesfurther, and who were looking for their first job. No sooner than one batch of schoolleavers got absorbed into the world of work than another batch followed. It is this dynamic,continuous flow of new job seekers in the labour market, which kept their age-specificunemployment rates high throughout the year. In addition, the youth aged 15-29 formed a
relatively high proportion of the total population during most years between 1976 and 1997(over 40 and nearly 50 per cent nationally in urban areas respectively).
Table 2. Open unemployment rates and composition by age, 1976 – 2000
Unemployment rate (% of labour force) % Composition
76-79 86-89 90-93 94-97 98-00 76-79 86-89 90-93 94-97 98-00
Urbanandrural
2.5 2.7 2.7 4.6 6.0 100 100 100 100 100
15-19 8.1 6.1 6.7 15.4 20.4 42.3 23.7 25.5 31.6 29.720-24 7.0 10.7 9.8 14.4 18.0 35.3 49.3 46.4 39.6 37.325-29 2.3 3.2 3.5 6.1 8.0 11.7 16.2 18.0 17.9 18.115-29 5.8 6.6 6.6 11.5 14.7 89.4 89.2 89.9 89.0 85.1
30+ 0.4 0.5 0.4 0.8 1.4 10.6 10.8 10.1 11.0 14.9
Urbanareas
6.4 7.1 5.7 8.2 9.7 100 100 100 100 100
15-19 21.5 18.5 13.9 25.2 30.4 36.0 17.7 19.4 24.7 23.720-24 16.8 24.9 18.9 22.3 25.8 40.0 53.0 49.5 42.2 38.625-29 6.1 8.3 7.6 10.8 13.1 13.4 18.4 20.7 20.7 20.615-29 14.3 16.8 13.3 18.3 21.5 89.4 89.1 89.6 87.6 82.830+ 1.1 1.2 1.0 1.7 2.6 10.6 10.9 10.4 12.4 17.2
Ruralareas
1.7 1.4 1.5 2.9 3.7 100 100 100 100 100
15-19 6.1 4.0 4.7 11.6 15.7 46.7 32.7 34.4 41.6 39.220-24 4.7 5.3 5.4 9.0 11.8 32.0 43.7 41.8 35.8 35.325-29 1.5 1.3 1.6 3.1 4.2 10.6 12.8 14.2 13.7 14.215-29 4.1 3.4 3.8 7.6 10.0 89.2 89.2 90.4 91.1 88.730+ 0.3 0.2 0.2 0.4 0.6 10.8 10.8 9.6 8.9 11.3
Source: Labour Force Situation in Indonesia (Sakernas Survey), annual publication (Table 2), CBS.
Figure 1. Open urban unemployment rate by age, 1990 and 2000 (% of labour force)
Source: Labour Force SurveySakernas (special tabulations), CBS.
7/18/2019 Contoh B_Dhanani_Unemployment and Underemployment in Indonesia
http://slidepdf.com/reader/full/contoh-bdhananiunemployment-and-underemployment-in-indonesia 13/41
7
Though the overall unemployment rate remained quite low at below 5 per cent of thelabour force until 1997, the open unemployment rate for young job seekers in the 15-29
age group was more than twice as high at 12 per cent. Within this age range, the openunemployment rate was higher at 15 per cent for the 15-19 and the 20-24 age groups, before declining to around 6 per cent for the 25-29 age group. Past the age of 30 however,the unemployment rate dropped to less than 1 per cent of the labour force before the crisis.Interestingly before 1993, the open unemployment rate was much higher for the 20-24 age
group than for the 15-19 age group, when the definition for job seeking required them todo so in the previous week (10 versus 7 per cent in 1990-93).
In fact, the incidence of unemployment varied systematically with age, even within
narrow age groups such as 15-19 and 20-24, and followed an inverted U-shape curve. Theurban open unemployment rate rose rapidly from only 7-9 per cent at age 15, peaked at 22-
26 per cent at age 19-21, before declining rapidly to 10 per cent for persons aged 26, andfinally to 1-2 per cent for persons aged 30 and above (see Figure 1). The profile justdescribed was almost identical for males and females, and followed a similar though muchlower curve in rural areas, peaking at about 6 per cent at age 20-21. The difference in openunemployment rates between single ages confirms the gradual absorption of unemployed
school leavers into the work force, and thus of the transitional nature of most youth
measured unemployment.
In terms of composition, the largest group within the openly unemployed consisted ofthe 20-24 age group, which accounted for 40-50 per cent of all open unemployment, whilethe age groups immediately below and above it accounted for a further 25-30 and 20 percent.
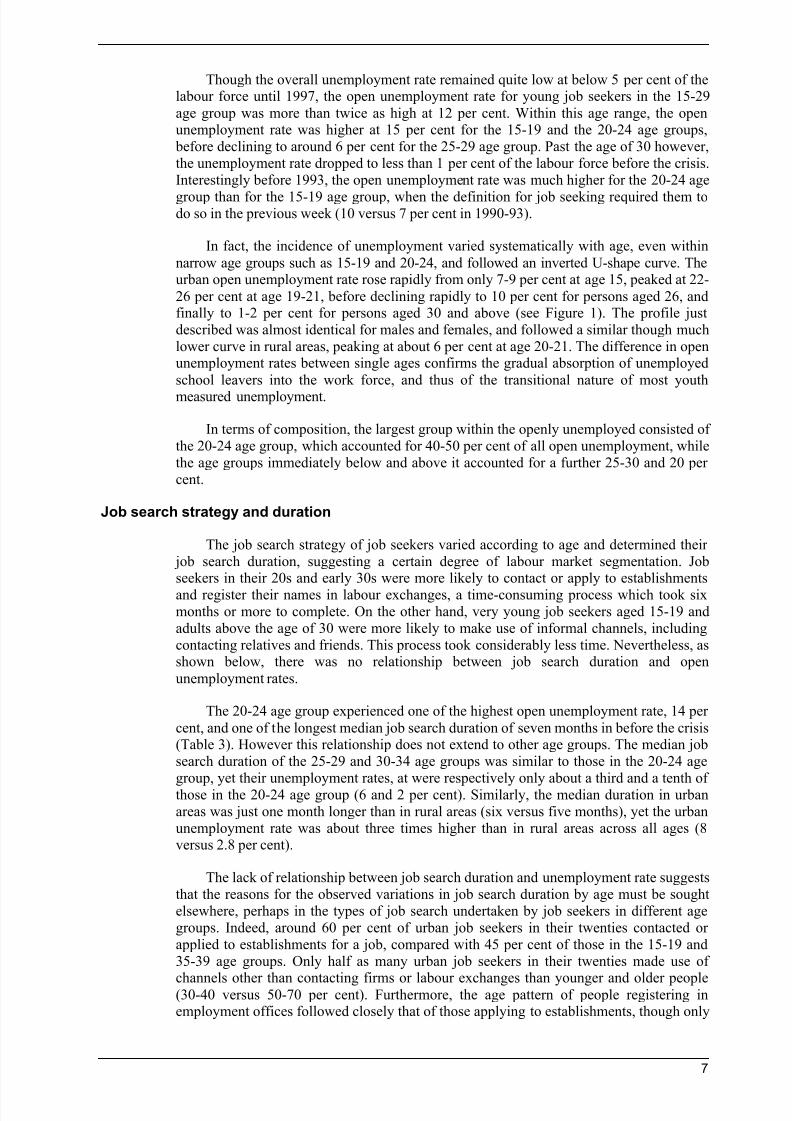
Job search strategy and duration
The job search strategy of job seekers varied according to age and determined their job search duration, suggesting a certain degree of labour market segmentation. Jobseekers in their 20s and early 30s were more likely to contact or apply to establishments
and register their names in labour exchanges, a time-consuming process which took sixmonths or more to complete. On the other hand, very young job seekers aged 15-19 andadults above the age of 30 were more likely to make use of informal channels, includingcontacting relatives and friends. This process took considerably less time. Nevertheless, asshown below, there was no relationship between job search duration and open
unemployment rates.
The 20-24 age group experienced one of the highest open unemployment rate, 14 per
cent, and one of the longest median job search duration of seven months in before the crisis(Table 3). However this relationship does not extend to other age groups. The median jobsearch duration of the 25-29 and 30-34 age groups was similar to those in the 20-24 agegroup, yet their unemployment rates, at were respectively only about a third and a tenth ofthose in the 20-24 age group (6 and 2 per cent). Similarly, the median duration in urbanareas was just one month longer than in rural areas (six versus five months), yet the urbanunemployment rate was about three times higher than in rural areas across all ages (8versus 2.8 per cent).
The lack of relationship between job search duration and unemployment rate suggeststhat the reasons for the observed variations in job search duration by age must be soughtelsewhere, perhaps in the types of job search undertaken by job seekers in different agegroups. Indeed, around 60 per cent of urban job seekers in their twenties contacted orapplied to establishments for a job, compared with 45 per cent of those in the 15-19 and35-39 age groups. Only half as many urban job seekers in their twenties made use of
channels other than contacting firms or labour exchanges than younger and older people(30-40 versus 50-70 per cent). Furthermore, the age pattern of people registering inemployment offices followed closely that of those applying to establishments, though only
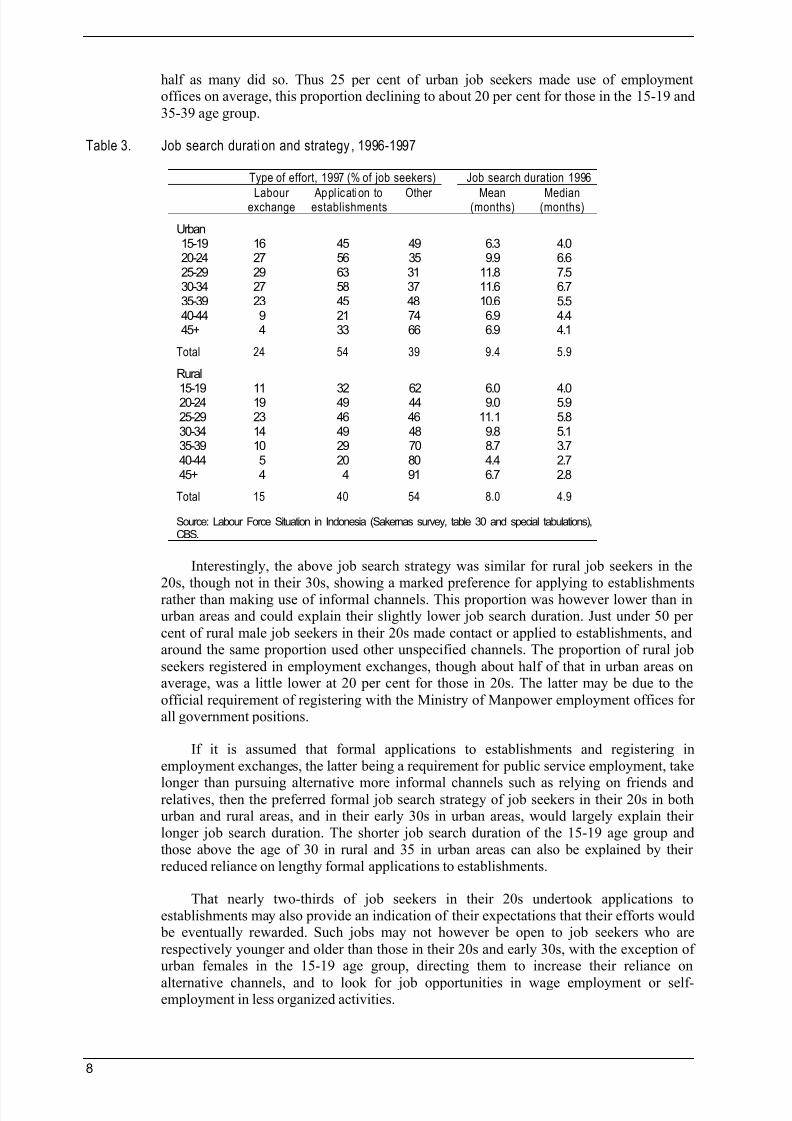
7/18/2019 Contoh B_Dhanani_Unemployment and Underemployment in Indonesia
http://slidepdf.com/reader/full/contoh-bdhananiunemployment-and-underemployment-in-indonesia 14/41
8
half as many did so. Thus 25 per cent of urban job seekers made use of employmentoffices on average, this proportion declining to about 20 per cent for those in the 15-19 and
35-39 age group.
Table 3. Job search duration and strategy , 1996-1997
Type of effort, 1997 (% of job seekers) Job search duration 1996
Labourexchange Appl ication toestablishments Other Mean(months) Median(months)
Urban15-19 16 45 49 6.3 4.020-24 27 56 35 9.9 6.625-29 29 63 31 11.8 7.530-34 27 58 37 11.6 6.735-39 23 45 48 10.6 5.540-44 9 21 74 6.9 4.445+ 4 33 66 6.9 4.1
Total 24 54 39 9.4 5.9
Rural
15-19 11 32 62 6.0 4.020-24 19 49 44 9.0 5.925-29 23 46 46 11.1 5.830-34 14 49 48 9.8 5.135-39 10 29 70 8.7 3.740-44 5 20 80 4.4 2.745+ 4 4 91 6.7 2.8
Total 15 40 54 8.0 4.9
Source: Labour Force Situation in Indonesia (Sakernas survey, table 30 and special tabulations),CBS.
Interestingly, the above job search strategy was similar for rural job seekers in the
20s, though not in their 30s, showing a marked preference for applying to establishmentsrather than making use of informal channels. This proportion was however lower than inurban areas and could explain their slightly lower job search duration. Just under 50 per
cent of rural male job seekers in their 20s made contact or applied to establishments, andaround the same proportion used other unspecified channels. The proportion of rural job
seekers registered in employment exchanges, though about half of that in urban areas onaverage, was a little lower at 20 per cent for those in 20s. The latter may be due to the
official requirement of registering with the Ministry of Manpower employment offices forall government positions.
If it is assumed that formal applications to establishments and registering inemployment exchanges, the latter being a requirement for public service employment, take
longer than pursuing alternative more informal channels such as relying on friends andrelatives, then the preferred formal job search strategy of job seekers in their 20s in bothurban and rural areas, and in their early 30s in urban areas, would largely explain theirlonger job search duration. The shorter job search duration of the 15-19 age group andthose above the age of 30 in rural and 35 in urban areas can also be explained by theirreduced reliance on lengthy formal applications to establishments.
That nearly two-thirds of job seekers in their 20s undertook applications toestablishments may also provide an indication of their expectations that their efforts would be eventually rewarded. Such jobs may not however be open to job seekers who are
respectively younger and older than those in their 20s and early 30s, with the exception ofurban females in the 15-19 age group, directing them to increase their reliance on
alternative channels, and to look for job opportunities in wage employment or self-employment in less organized activities.
7/18/2019 Contoh B_Dhanani_Unemployment and Underemployment in Indonesia
http://slidepdf.com/reader/full/contoh-bdhananiunemployment-and-underemployment-in-indonesia 15/41
9
There may in effect exist a number of labour market segments open to job seekersaccording to age and education, a first largely informal one open to those aged below 20
where entry is relatively easy and takes three to four months, a second largely formal oneopen to those who are educated and aged between 20 and 35, who are however required toundergo a lengthy application process lasting six to seven months, and a third largelyinformal one again open to adults aged 35 and above who spend some three months to findwork which includes self-employment, particularly in rural males where search time is
reduced to less than three months.
The job search duration differences between those looking for work while notworking and those doing so while working at the time indicates that work experience
conferred some advantage to job seekers, but only to adults. In general the difference between employed and unemployed job seekers increased with age as more experience
was accumulated. Thus the share of those looking for work for less than three months wasonly 3 per cent higher for experienced male workers in the 25-29 age group at 32compared with 29 per cent for unemployed job seekers. This gap however increased to 9 per cent in the 30+ age group. There was however little difference in the two younger 15-19 and 20-24 age groups, and persons in these age groups looking for work while
employed spent about the same time as the unemployed job seekers (Dhanani, 1995, Table
2.2.7). The above finding that work experience only assisted the adult job seekers and not persons in the teens or early 20s, is consistent with that of a previous tracer study ofsecondary school leavers in Indonesia which observed that being unemployed did little orno harm to job seekers’ chances of getting a good job, the latter being a reference tostarting salary (Clark, 1983).
Finally, the median job search duration for unemployed urban job seekers was aboutsix months in 1997, while the average or mean job search duration was three monthslonger at nine months. This is because a fifth of all job seekers looked for work for longerthan 12 months, and provides an indication of the difficulty faced by the youth in obtaining
their first full-time jobs.
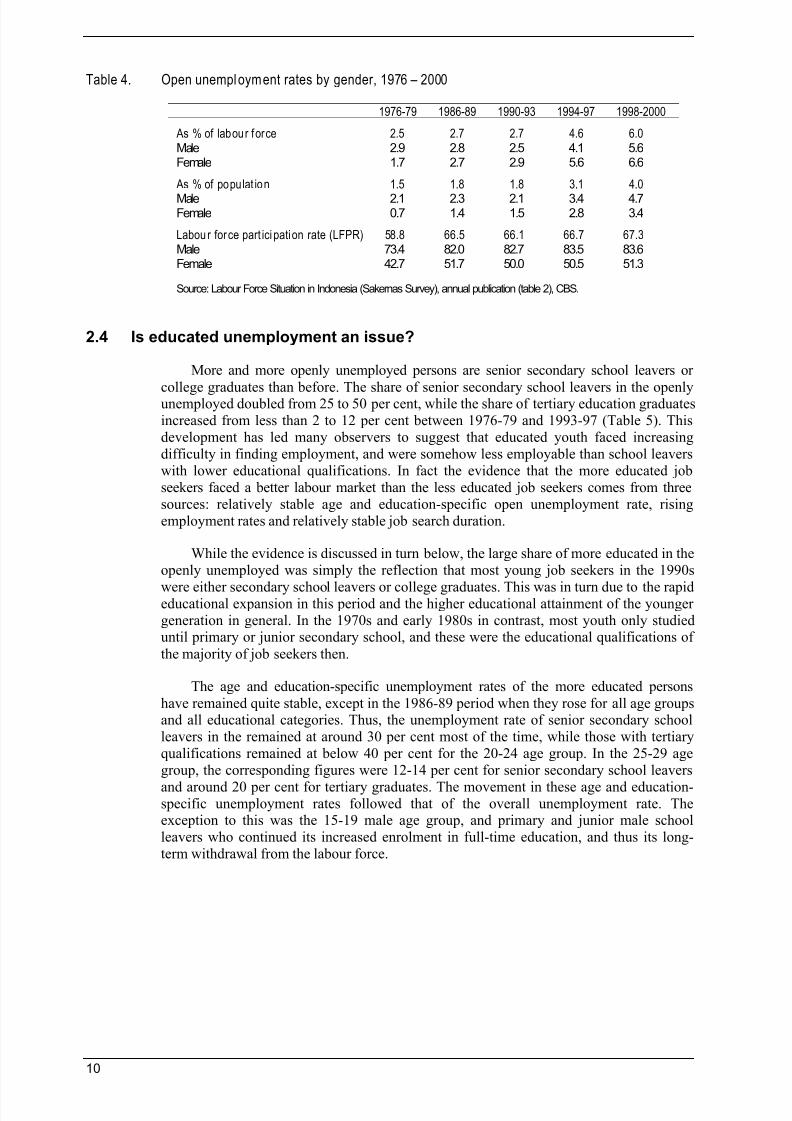
2.3 Higher unemployment rate of females
The higher open unemployment rate of females was more apparent than real.Expressed as a percentage of their working age population rather than the usual labourforce, this ranking was reversed because of the lower labour force participation of females.Only half of all women were in the labour force compared with more than 80 per cent formen. This in turn was due to the larger proportion of females outside the labour forceengaged in housekeeping. Nevertheless the open unemployment for females rose fasterthan for males since 1976, precisely because of more job openings for women in themodern sector, and encouraging a larger number of women to actively look for work.
The open unemployment rate for females surpassed that of males since the mid 1980s in
urban areas, and since the early 1990s in both urban and rural areas (Tables 1 and 4). In 1994-97, the female open unemployment rate was nearly 2 per cent higher overall (6 vs. 4 per cent),
this difference widening to 3 per cent in urban areas (10 versus 7 per cent for females andmales respectively). However, when expressed as a percentage of the working age population,the open unemployment rates of men were higher during 1994-97 (3.4 and 2.8 per cent). Ineither case, the open unemployment rate for women nearly doubled between 1990-93 and1994-97compared with a 60 percentage point increase for men.
7/18/2019 Contoh B_Dhanani_Unemployment and Underemployment in Indonesia
http://slidepdf.com/reader/full/contoh-bdhananiunemployment-and-underemployment-in-indonesia 16/41
10
Table 4. Open unemployment rates by gender, 1976 – 2000
1976-79 1986-89 1990-93 1994-97 1998-2000
As % of labour force 2.5 2.7 2.7 4.6 6.0Male 2.9 2.8 2.5 4.1 5.6Female 1.7 2.7 2.9 5.6 6.6
As % of populat ion 1.5 1.8 1.8 3.1 4.0
Male 2.1 2.3 2.1 3.4 4.7Female 0.7 1.4 1.5 2.8 3.4
Labou r force part ici pation rate (LFPR) 58.8 66.5 66.1 66.7 67.3Male 73.4 82.0 82.7 83.5 83.6Female 42.7 51.7 50.0 50.5 51.3
Source: Labour Force Situation in Indonesia (Sakernas Survey), annual publication (table 2), CBS.
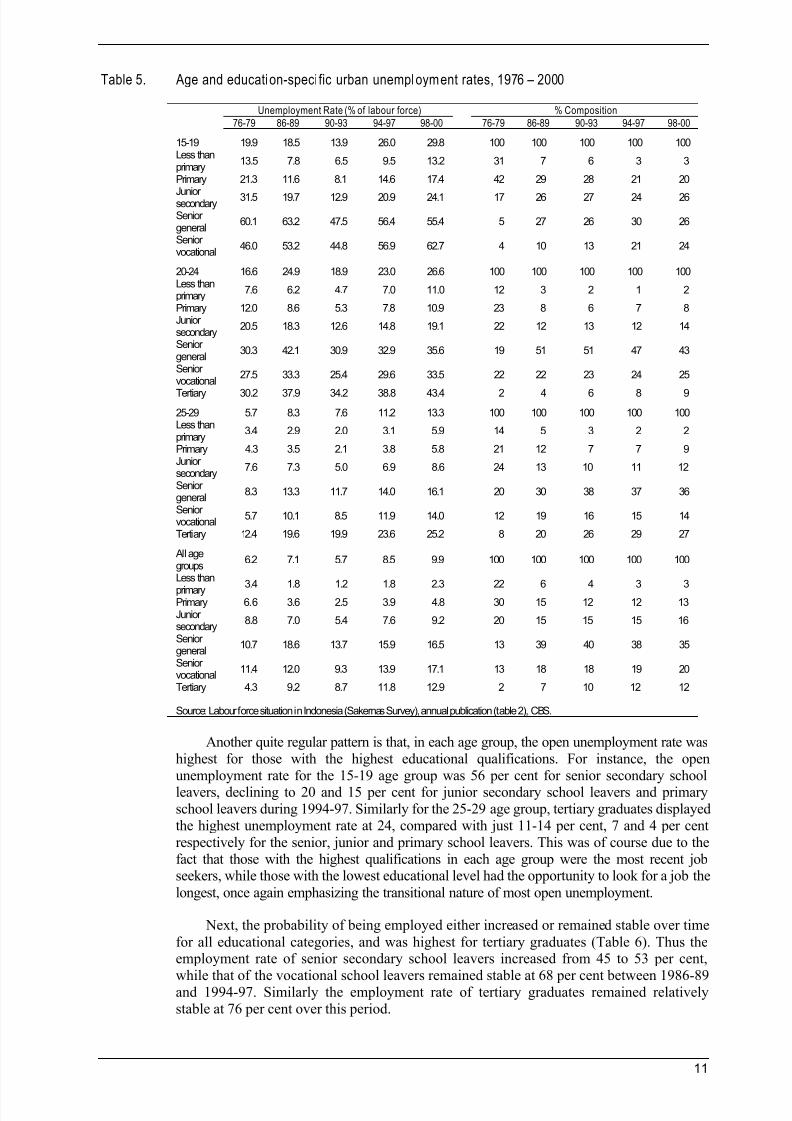
2.4 Is educated unemployment an issue?
More and more openly unemployed persons are senior secondary school leavers or
college graduates than before. The share of senior secondary school leavers in the openlyunemployed doubled from 25 to 50 per cent, while the share of tertiary education graduatesincreased from less than 2 to 12 per cent between 1976-79 and 1993-97 (Table 5). Thisdevelopment has led many observers to suggest that educated youth faced increasingdifficulty in finding employment, and were somehow less employable than school leaverswith lower educational qualifications. In fact the evidence that the more educated jobseekers faced a better labour market than the less educated job seekers comes from threesources: relatively stable age and education-specific open unemployment rate, risingemployment rates and relatively stable job search duration.
While the evidence is discussed in turn below, the large share of more educated in theopenly unemployed was simply the reflection that most young job seekers in the 1990s
were either secondary school leavers or college graduates. This was in turn due to the rapideducational expansion in this period and the higher educational attainment of the youngergeneration in general. In the 1970s and early 1980s in contrast, most youth only studieduntil primary or junior secondary school, and these were the educational qualifications of
the majority of job seekers then.
The age and education-specific unemployment rates of the more educated persons
have remained quite stable, except in the 1986-89 period when they rose for all age groupsand all educational categories. Thus, the unemployment rate of senior secondary schoolleavers in the remained at around 30 per cent most of the time, while those with tertiaryqualifications remained at below 40 per cent for the 20-24 age group. In the 25-29 agegroup, the corresponding figures were 12-14 per cent for senior secondary school leavers
and around 20 per cent for tertiary graduates. The movement in these age and education-specific unemployment rates followed that of the overall unemployment rate. Theexception to this was the 15-19 male age group, and primary and junior male schoolleavers who continued its increased enrolment in full-time education, and thus its long-term withdrawal from the labour force.
7/18/2019 Contoh B_Dhanani_Unemployment and Underemployment in Indonesia
http://slidepdf.com/reader/full/contoh-bdhananiunemployment-and-underemployment-in-indonesia 17/41
11
Table 5. Age and education-speci fic urban unemployment rates, 1976 – 2000
Unemployment Rate (% of labour force) % Composition
76-79 86-89 90-93 94-97 98-00 76-79 86-89 90-93 94-97 98-00
15-19 19.9 18.5 13.9 26.0 29.8 100 100 100 100 100Less thanprimary
13.5 7.8 6.5 9.5 13.2 31 7 6 3 3
Primary 21.3 11.6 8.1 14.6 17.4 42 29 28 21 20
Juniorsecondary 31.5 19.7 12.9 20.9 24.1 17 26 27 24 26
Seniorgeneral
60.1 63.2 47.5 56.4 55.4 5 27 26 30 26
Seniorvocational
46.0 53.2 44.8 56.9 62.7 4 10 13 21 24
20-24 16.6 24.9 18.9 23.0 26.6 100 100 100 100 100Less thanprimary
7.6 6.2 4.7 7.0 11.0 12 3 2 1 2
Primary 12.0 8.6 5.3 7.8 10.9 23 8 6 7 8Juniorsecondary
20.5 18.3 12.6 14.8 19.1 22 12 13 12 14
Seniorgeneral
30.3 42.1 30.9 32.9 35.6 19 51 51 47 43
Seniorvocational
27.5 33.3 25.4 29.6 33.5 22 22 23 24 25
Tertiary 30.2 37.9 34.2 38.8 43.4 2 4 6 8 9
25-29 5.7 8.3 7.6 11.2 13.3 100 100 100 100 100Less thanprimary
3.4 2.9 2.0 3.1 5.9 14 5 3 2 2
Primary 4.3 3.5 2.1 3.8 5.8 21 12 7 7 9Juniorsecondary
7.6 7.3 5.0 6.9 8.6 24 13 10 11 12
Seniorgeneral
8.3 13.3 11.7 14.0 16.1 20 30 38 37 36
Seniorvocational
5.7 10.1 8.5 11.9 14.0 12 19 16 15 14
Tertiary 12.4 19.6 19.9 23.6 25.2 8 20 26 29 27
All agegroups
6.2 7.1 5.7 8.5 9.9 100 100 100 100 100
Less than
primary 3.4 1.8 1.2 1.8 2.3 22 6 4 3 3Primary 6.6 3.6 2.5 3.9 4.8 30 15 12 12 13Juniorsecondary
8.8 7.0 5.4 7.6 9.2 20 15 15 15 16
Seniorgeneral
10.7 18.6 13.7 15.9 16.5 13 39 40 38 35
Seniorvocational
11.4 12.0 9.3 13.9 17.1 13 18 18 19 20
Tertiary 4.3 9.2 8.7 11.8 12.9 2 7 10 12 12
Source: Labour force situation in Indonesia (Sakernas Survey), annual publication (table 2), CBS.
Another quite regular pattern is that, in each age group, the open unemployment rate washighest for those with the highest educational qualifications. For instance, the openunemployment rate for the 15-19 age group was 56 per cent for senior secondary schoolleavers, declining to 20 and 15 per cent for junior secondary school leavers and primaryschool leavers during 1994-97. Similarly for the 25-29 age group, tertiary graduates displayedthe highest unemployment rate at 24, compared with just 11-14 per cent, 7 and 4 per centrespectively for the senior, junior and primary school leavers. This was of course due to thefact that those with the highest qualifications in each age group were the most recent jobseekers, while those with the lowest educational level had the opportunity to look for a job the
longest, once again emphasizing the transitional nature of most open unemployment.
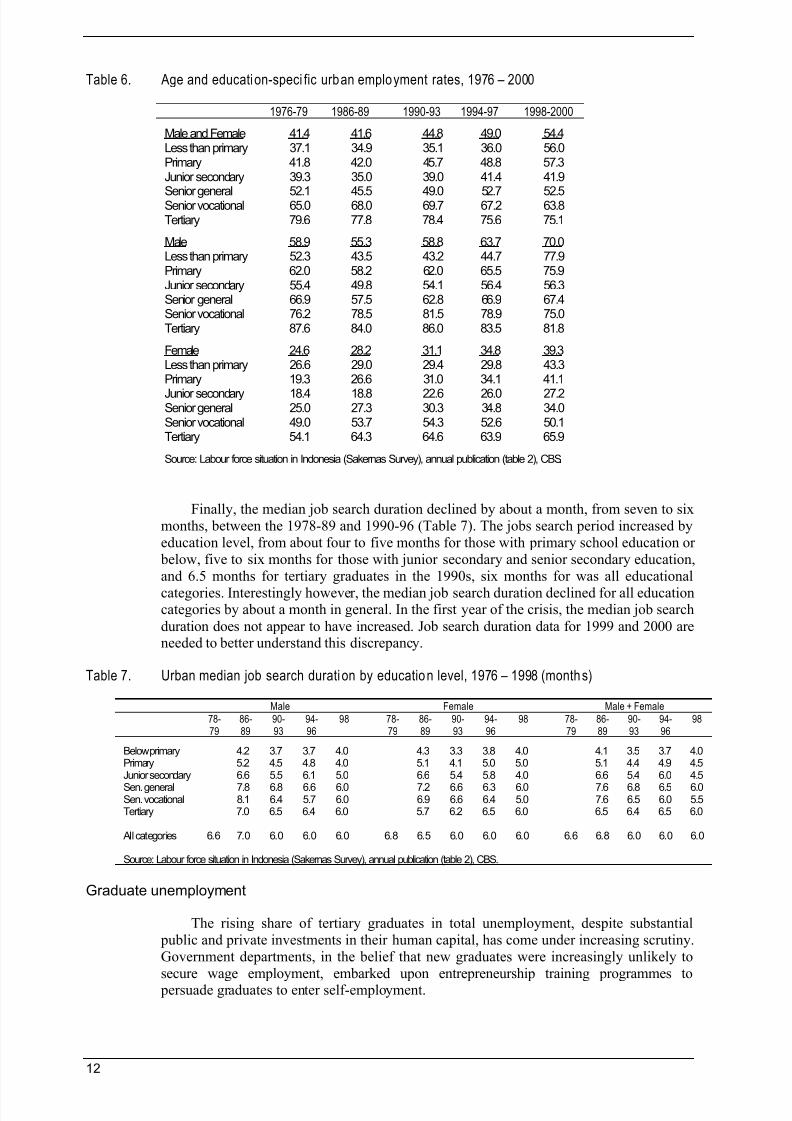
Next, the probability of being employed either increased or remained stable over time
for all educational categories, and was highest for tertiary graduates (Table 6). Thus theemployment rate of senior secondary school leavers increased from 45 to 53 per cent,
while that of the vocational school leavers remained stable at 68 per cent between 1986-89and 1994-97. Similarly the employment rate of tertiary graduates remained relativelystable at 76 per cent over this period.
7/18/2019 Contoh B_Dhanani_Unemployment and Underemployment in Indonesia
http://slidepdf.com/reader/full/contoh-bdhananiunemployment-and-underemployment-in-indonesia 18/41
12
Table 6. Age and education-speci fic urban employment rates, 1976 – 2000
1976-79 1986-89 1990-93 1994-97 1998-2000
Male and Female 41.4 41.6 44.8 49.0 54.4Less than primary 37.1 34.9 35.1 36.0 56.0Primary 41.8 42.0 45.7 48.8 57.3Junior secondary 39.3 35.0 39.0 41.4 41.9
Senior general 52.1 45.5 49.0 52.7 52.5Senior vocational 65.0 68.0 69.7 67.2 63.8Tertiary 79.6 77.8 78.4 75.6 75.1
Male 58.9 55.3 58.8 63.7 70.0Less than primary 52.3 43.5 43.2 44.7 77.9Primary 62.0 58.2 62.0 65.5 75.9Junior secondary 55.4 49.8 54.1 56.4 56.3Senior general 66.9 57.5 62.8 66.9 67.4Senior vocational 76.2 78.5 81.5 78.9 75.0Tertiary 87.6 84.0 86.0 83.5 81.8
Female 24.6 28.2 31.1 34.8 39.3Less than primary 26.6 29.0 29.4 29.8 43.3Primary 19.3 26.6 31.0 34.1 41.1
Junior secondary 18.4 18.8 22.6 26.0 27.2Senior general 25.0 27.3 30.3 34.8 34.0Senior vocational 49.0 53.7 54.3 52.6 50.1Tertiary 54.1 64.3 64.6 63.9 65.9
Source: Labour force situation in Indonesia (Sakernas Survey), annual publication (table 2), CBS.
Finally, the median job search duration declined by about a month, from seven to sixmonths, between the 1978-89 and 1990-96 (Table 7). The jobs search period increased byeducation level, from about four to five months for those with primary school education or below, five to six months for those with junior secondary and senior secondary education,and 6.5 months for tertiary graduates in the 1990s, six months for was all educational
categories. Interestingly however, the median job search duration declined for all educationcategories by about a month in general. In the first year of the crisis, the median job search
duration does not appear to have increased. Job search duration data for 1999 and 2000 areneeded to better understand this discrepancy.
Table 7. Urban median job search duration by education level, 1976 – 1998 (months)
Male Female Male + Female
78-79
86-89
90-93
94-96
98 78-79
86-89
90-93
94-96
98 78-79
86-89
90-93
94-96
98
Below primary 4.2 3.7 3.7 4.0 4.3 3.3 3.8 4.0 4.1 3.5 3.7 4.0Primary 5.2 4.5 4.8 4.0 5.1 4.1 5.0 5.0 5.1 4.4 4.9 4.5Junior secondary 6.6 5.5 6.1 5.0 6.6 5.4 5.8 4.0 6.6 5.4 6.0 4.5
Sen. general 7.8 6.8 6.6 6.0 7.2 6.6 6.3 6.0 7.6 6.8 6.5 6.0Sen. vocational 8.1 6.4 5.7 6.0 6.9 6.6 6.4 5.0 7.6 6.5 6.0 5.5Tertiary 7.0 6.5 6.4 6.0 5.7 6.2 6.5 6.0 6.5 6.4 6.5 6.0
All categories 6.6 7.0 6.0 6.0 6.0 6.8 6.5 6.0 6.0 6.0 6.6 6.8 6.0 6.0 6.0
Source: Labour force situation in Indonesia (Sakernas Survey), annual publication (table 2), CBS.
Graduate unemployment
The rising share of tertiary graduates in total unemployment, despite substantial public and private investments in their human capital, has come under increasing scrutiny.Government departments, in the belief that new graduates were increasingly unlikely tosecure wage employment, embarked upon entrepreneurship training programmes to persuade graduates to enter self-employment.
7/18/2019 Contoh B_Dhanani_Unemployment and Underemployment in Indonesia
http://slidepdf.com/reader/full/contoh-bdhananiunemployment-and-underemployment-in-indonesia 19/41
13
Tertiary education has experienced rapid expansion in recent years, with an estimatedone hundred new private universities opening their doors every year in the early 1990s.
Estimates of the annual output of the tertiary education system vary widely howeverdepending on the source of data used, from about 350,000 per year according to the labourforce surveys to only half as many, 180,000 graduates, according to the Ministry ofEducation in 1993. The annual tertiary education output over the past three years cannevertheless be estimated at around 200,000, more than two-thirds of whom were
university graduates, while the remaining were diploma graduates. Private institutionsaccounted for around 60 per cent of the total output, but they specialized in non-technicalcourses. Public institutions, though accounting for the remaining 40 per cent of the total
output, therefore continued to account for two-thirds of all science and technologygraduates, a situation which has changed little in the previous five years (Dhanani and
Sweeting, 1995).
That the labour market for tertiary graduates improved between the late 1980s and the1990s was already pointed out earlier, with evidence of relatively stable age and education-unemployment rates, stable job search duration declining, and employment rates,indicating their high participation in the labour force, and their continued access to jobs in
a period of rapid expansion of tertiary education. Unfortunately, the labour force surveys
do not provide information on the unemployment profile of tertiary graduates by year ofgraduation. For those looking for work, the data does not distinguish between the largenumbers of people who have just graduated, and those who graduated in the previous yearor even two years ago. In a period of rapid tertiary education expansion, the former arelikely to dominate the aggregate unemployment figures, and give an exaggerated view ofdifficulty in access to work for tertiary graduates. A 1994 tracer study of technicalgraduates sheds some more light on this process of transition from college to work(Dhanani and Sweeting, 1995).
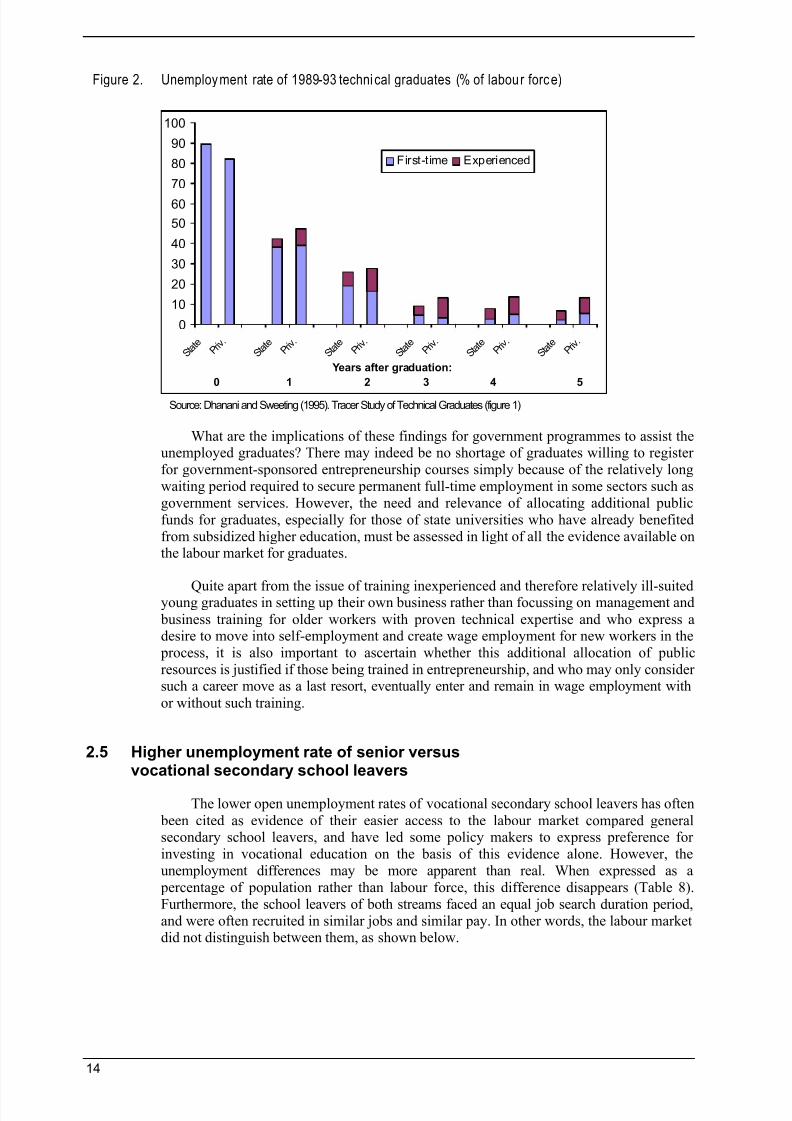
This tracer study noted that the unemployment rate dropped from around 85 to 44 per
cent within a year of graduation, and to 27 per cent within two years of leaving college(Figure 2). The transition from college to work was virtually but not altogether complete,when the unemployment rate fell again to 11, 10 and 9 per cent some three, four and fiveyears after graduation. Of these, respectively 85, 60 and 25 were first-time job seekersfrom respectively one, two and three-year old cohorts. In other words, after two years, the
majority of the openly unemployed graduates were experienced job seekers looking for thesecond or third job, and consisting of frictional unemployment while in between jobs.
In line with their generally low unemployment rates, the median job search durationof engineering graduates was only two months for diploma graduates and four months fordegree graduates. Science and agricultural graduates spent respectively twice and threetimes as long, since around half of all them entered government service characterized byslow recruitment procedures stretching to ten months. Furthermore, job search time
decreased by a month between 1989 and 1993, partly due to a shift in employment fromgovernment service and state-owned enterprises to private sector enterprises, though it alsodeclined by about a month in government service. This study revealed that long-term
graduate unemployment, though relatively low at 3 to 4 per cent, affected mainlyagricultural and science graduates in locations where private sector employmentopportunities in manufacturing, trade and construction were relatively scarce such as WestSumatra and East Nusa Tenggara.
7/18/2019 Contoh B_Dhanani_Unemployment and Underemployment in Indonesia
http://slidepdf.com/reader/full/contoh-bdhananiunemployment-and-underemployment-in-indonesia 20/41
14
Figure 2. Unemployment rate of 1989-93 technical graduates (% of labour force)
Source: Dhanani and Sweeting (1995). Tracer Study of Technical Graduates (figure 1)
What are the implications of these findings for government programmes to assist theunemployed graduates? There may indeed be no shortage of graduates willing to registerfor government-sponsored entrepreneurship courses simply because of the relatively longwaiting period required to secure permanent full-time employment in some sectors such asgovernment services. However, the need and relevance of allocating additional publicfunds for graduates, especially for those of state universities who have already benefitedfrom subsidized higher education, must be assessed in light of all the evidence available onthe labour market for graduates.
Quite apart from the issue of training inexperienced and therefore relatively ill-suitedyoung graduates in setting up their own business rather than focussing on management and
business training for older workers with proven technical expertise and who express adesire to move into self-employment and create wage employment for new workers in the process, it is also important to ascertain whether this additional allocation of publicresources is justified if those being trained in entrepreneurship, and who may only considersuch a career move as a last resort, eventually enter and remain in wage employment with
or without such training.
2.5 Higher unemployment rate of senior versusvocational secondary school leavers
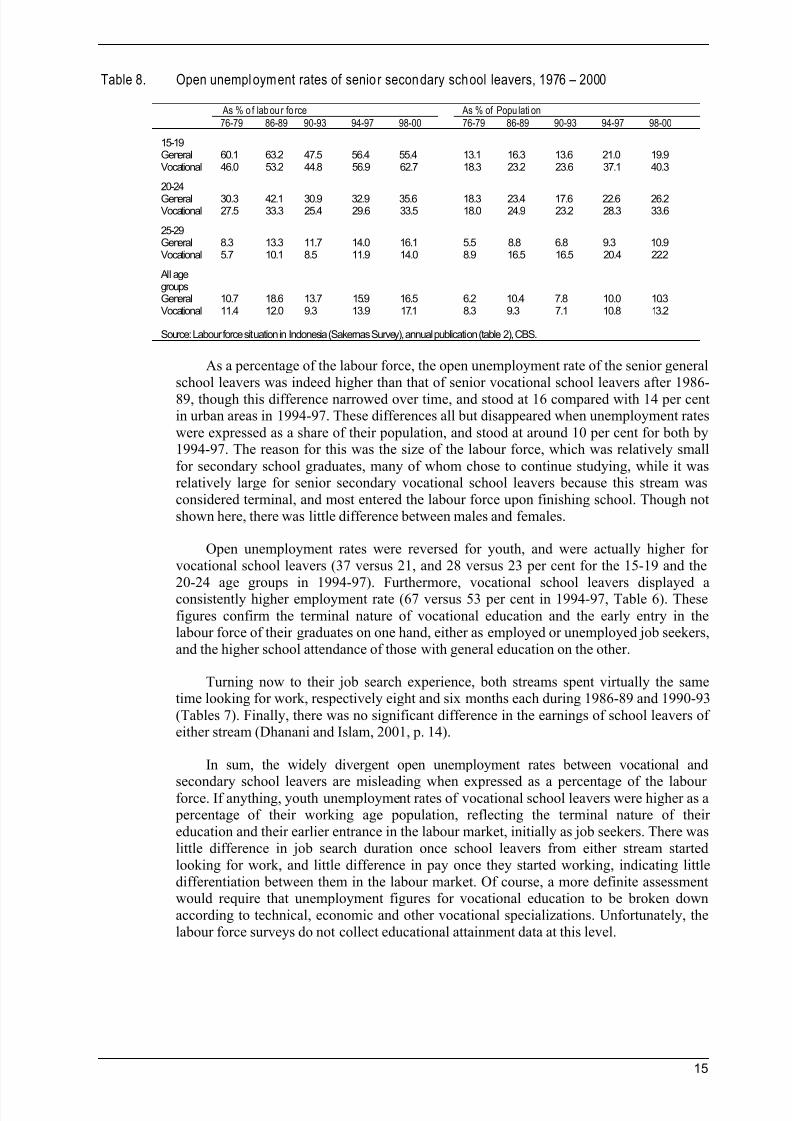
The lower open unemployment rates of vocational secondary school leavers has often
been cited as evidence of their easier access to the labour market compared generalsecondary school leavers, and have led some policy makers to express preference forinvesting in vocational education on the basis of this evidence alone. However, theunemployment differences may be more apparent than real. When expressed as a percentage of population rather than labour force, this difference disappears (Table 8).Furthermore, the school leavers of both streams faced an equal job search duration period,and were often recruited in similar jobs and similar pay. In other words, the labour marketdid not distinguish between them, as shown below.
0
10
20
30
40
50
60
70
80
90
100
S t a t e
P r i v
.
S t a t e
P r i v
.
S t a t e
P r i v
.
S t a t e
P r i v
.
S t a t e
P r i v
.
S t a t e
P r i v
.
Years after graduation:
0 1 2 3 4 5
First-time Experienced
7/18/2019 Contoh B_Dhanani_Unemployment and Underemployment in Indonesia
http://slidepdf.com/reader/full/contoh-bdhananiunemployment-and-underemployment-in-indonesia 21/41
15
Table 8. Open unemployment rates of senior secondary school leavers, 1976 – 2000
As % o f labour fo rce As % of Popu lati on
76-79 86-89 90-93 94-97 98-00 76-79 86-89 90-93 94-97 98-00
15-19General 60.1 63.2 47.5 56.4 55.4 13.1 16.3 13.6 21.0 19.9Vocational 46.0 53.2 44.8 56.9 62.7 18.3 23.2 23.6 37.1 40.3
20-24
General 30.3 42.1 30.9 32.9 35.6 18.3 23.4 17.6 22.6 26.2Vocational 27.5 33.3 25.4 29.6 33.5 18.0 24.9 23.2 28.3 33.6
25-29General 8.3 13.3 11.7 14.0 16.1 5.5 8.8 6.8 9.3 10.9Vocational 5.7 10.1 8.5 11.9 14.0 8.9 16.5 16.5 20.4 22.2
All agegroupsGeneral 10.7 18.6 13.7 15.9 16.5 6.2 10.4 7.8 10.0 10.3Vocational 11.4 12.0 9.3 13.9 17.1 8.3 9.3 7.1 10.8 13.2
Source: Labour force situation in Indonesia (Sakernas Survey), annual publication (table 2), CBS.
As a percentage of the labour force, the open unemployment rate of the senior generalschool leavers was indeed higher than that of senior vocational school leavers after 1986-89, though this difference narrowed over time, and stood at 16 compared with 14 per centin urban areas in 1994-97. These differences all but disappeared when unemployment rates
were expressed as a share of their population, and stood at around 10 per cent for both by1994-97. The reason for this was the size of the labour force, which was relatively small
for secondary school graduates, many of whom chose to continue studying, while it wasrelatively large for senior secondary vocational school leavers because this stream wasconsidered terminal, and most entered the labour force upon finishing school. Though notshown here, there was little difference between males and females.
Open unemployment rates were reversed for youth, and were actually higher forvocational school leavers (37 versus 21, and 28 versus 23 per cent for the 15-19 and the
20-24 age groups in 1994-97). Furthermore, vocational school leavers displayed aconsistently higher employment rate (67 versus 53 per cent in 1994-97, Table 6). These
figures confirm the terminal nature of vocational education and the early entry in thelabour force of their graduates on one hand, either as employed or unemployed job seekers,and the higher school attendance of those with general education on the other.
Turning now to their job search experience, both streams spent virtually the sametime looking for work, respectively eight and six months each during 1986-89 and 1990-93
(Tables 7). Finally, there was no significant difference in the earnings of school leavers ofeither stream (Dhanani and Islam, 2001, p. 14).
In sum, the widely divergent open unemployment rates between vocational and
secondary school leavers are misleading when expressed as a percentage of the labourforce. If anything, youth unemployment rates of vocational school leavers were higher as a percentage of their working age population, reflecting the terminal nature of theireducation and their earlier entrance in the labour market, initially as job seekers. There waslittle difference in job search duration once school leavers from either stream startedlooking for work, and little difference in pay once they started working, indicating littledifferentiation between them in the labour market. Of course, a more definite assessmentwould require that unemployment figures for vocational education to be broken downaccording to technical, economic and other vocational specializations. Unfortunately, thelabour force surveys do not collect educational attainment data at this level.
7/18/2019 Contoh B_Dhanani_Unemployment and Underemployment in Indonesia
http://slidepdf.com/reader/full/contoh-bdhananiunemployment-and-underemployment-in-indonesia 22/41
16
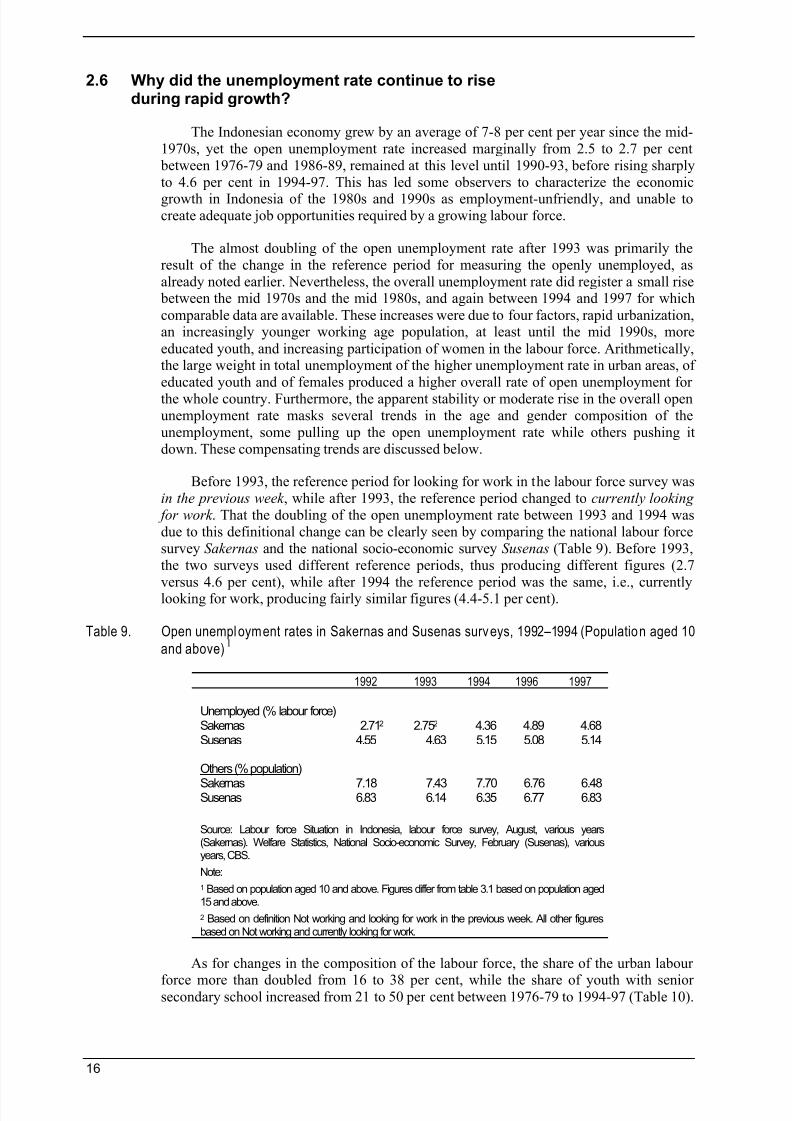
2.6 Why did the unemployment rate continue to riseduring rapid growth?
The Indonesian economy grew by an average of 7-8 per cent per year since the mid-1970s, yet the open unemployment rate increased marginally from 2.5 to 2.7 per cent between 1976-79 and 1986-89, remained at this level until 1990-93, before rising sharplyto 4.6 per cent in 1994-97. This has led some observers to characterize the economic
growth in Indonesia of the 1980s and 1990s as employment-unfriendly, and unable tocreate adequate job opportunities required by a growing labour force.
The almost doubling of the open unemployment rate after 1993 was primarily theresult of the change in the reference period for measuring the openly unemployed, asalready noted earlier. Nevertheless, the overall unemployment rate did register a small rise between the mid 1970s and the mid 1980s, and again between 1994 and 1997 for which
comparable data are available. These increases were due to four factors, rapid urbanization,an increasingly younger working age population, at least until the mid 1990s, more
educated youth, and increasing participation of women in the labour force. Arithmetically,the large weight in total unemployment of the higher unemployment rate in urban areas, ofeducated youth and of females produced a higher overall rate of open unemployment forthe whole country. Furthermore, the apparent stability or moderate rise in the overall openunemployment rate masks several trends in the age and gender composition of theunemployment, some pulling up the open unemployment rate while others pushing itdown. These compensating trends are discussed below.
Before 1993, the reference period for looking for work in the labour force survey wasin the previous week , while after 1993, the reference period changed to currently looking for work . That the doubling of the open unemployment rate between 1993 and 1994 wasdue to this definitional change can be clearly seen by comparing the national labour forcesurvey Sakernas and the national socio-economic survey Susenas (Table 9). Before 1993,the two surveys used different reference periods, thus producing different figures (2.7
versus 4.6 per cent), while after 1994 the reference period was the same, i.e., currentlylooking for work, producing fairly similar figures (4.4-5.1 per cent).
Table 9. Open unemployment rates in Sakernas and Susenas surveys, 1992–1994 (Population aged 10
and above) 1
1992 1993 1994 1996 1997
Unemployed (% labour force)Sakernas 2.712 2.752 4.36 4.89 4.68Susenas 4.55 4.63 5.15 5.08 5.14
Others (% population)
Sakernas 7.18 7.43 7.70 6.76 6.48Susenas 6.83 6.14 6.35 6.77 6.83
Source: Labour force Situation in Indonesia, labour force survey, August, various years(Sakernas). Welfare Statistics, National Socio-economic Survey, February (Susenas), variousyears, CBS.
Note:
1 Based on population aged 10 and above. Figures differ from table 3.1 based on population aged15 and above.
2 Based on definition Not working and looking for work in the previous week. All other figuresbased on Not working and currently looking for work.
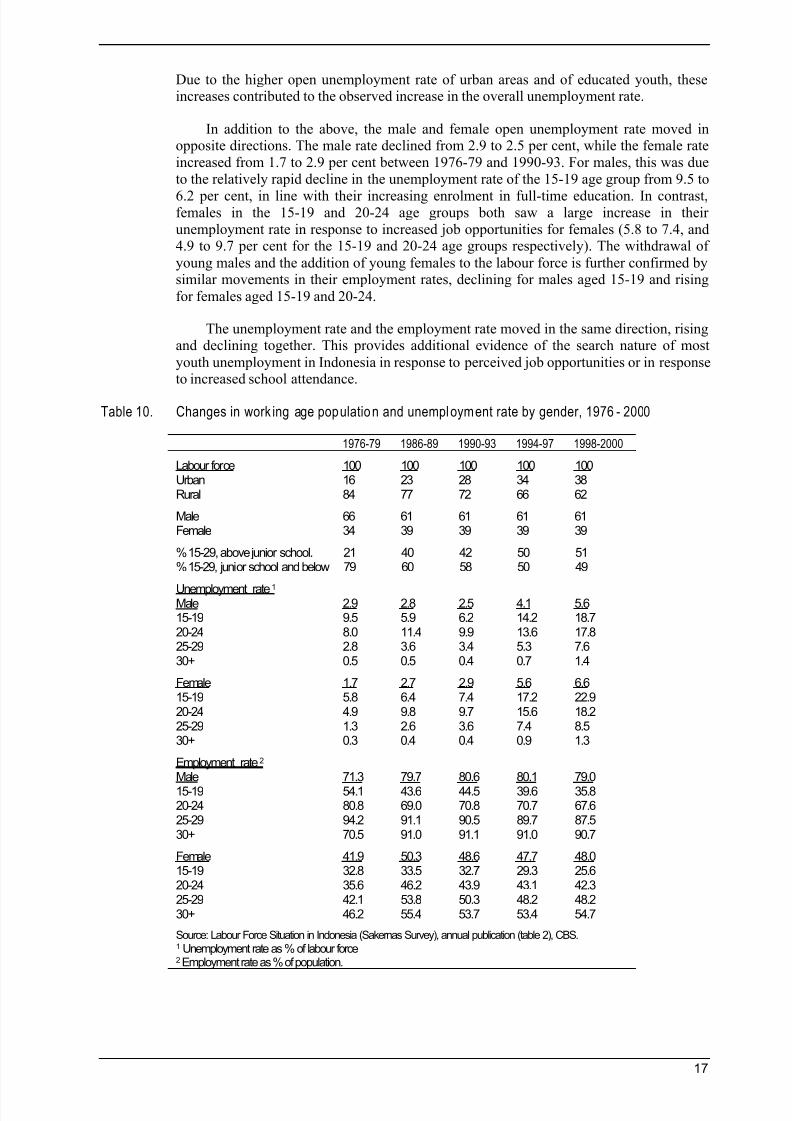
As for changes in the composition of the labour force, the share of the urban labour
force more than doubled from 16 to 38 per cent, while the share of youth with seniorsecondary school increased from 21 to 50 per cent between 1976-79 to 1994-97 (Table 10).
7/18/2019 Contoh B_Dhanani_Unemployment and Underemployment in Indonesia
http://slidepdf.com/reader/full/contoh-bdhananiunemployment-and-underemployment-in-indonesia 23/41
17
Due to the higher open unemployment rate of urban areas and of educated youth, theseincreases contributed to the observed increase in the overall unemployment rate.
In addition to the above, the male and female open unemployment rate moved inopposite directions. The male rate declined from 2.9 to 2.5 per cent, while the female rateincreased from 1.7 to 2.9 per cent between 1976-79 and 1990-93. For males, this was dueto the relatively rapid decline in the unemployment rate of the 15-19 age group from 9.5 to
6.2 per cent, in line with their increasing enrolment in full-time education. In contrast,females in the 15-19 and 20-24 age groups both saw a large increase in theirunemployment rate in response to increased job opportunities for females (5.8 to 7.4, and4.9 to 9.7 per cent for the 15-19 and 20-24 age groups respectively). The withdrawal of
young males and the addition of young females to the labour force is further confirmed bysimilar movements in their employment rates, declining for males aged 15-19 and rising
for females aged 15-19 and 20-24.
The unemployment rate and the employment rate moved in the same direction, risingand declining together. This provides additional evidence of the search nature of most
youth unemployment in Indonesia in response to perceived job opportunities or in responseto increased school attendance.
Table 10. Changes in work ing age population and unemployment rate by gender, 1976 - 2000
1976-79 1986-89 1990-93 1994-97 1998-2000
Labour force 100 100 100 100 100Urban 16 23 28 34 38Rural 84 77 72 66 62
Male 66 61 61 61 61Female 34 39 39 39 39
% 15-29, above junior school. 21 40 42 50 51% 15-29, junior school and below 79 60 58 50 49
Unemployment rate 1 Male 2.9 2.8 2.5 4.1 5.615-19 9.5 5.9 6.2 14.2 18.720-24 8.0 11.4 9.9 13.6 17.825-29 2.8 3.6 3.4 5.3 7.630+ 0.5 0.5 0.4 0.7 1.4
Female 1.7 2.7 2.9 5.6 6.615-19 5.8 6.4 7.4 17.2 22.920-24 4.9 9.8 9.7 15.6 18.225-29 1.3 2.6 3.6 7.4 8.530+ 0.3 0.4 0.4 0.9 1.3
Employment rate 2 Male 71.3 79.7 80.6 80.1 79.015-19 54.1 43.6 44.5 39.6 35.820-24 80.8 69.0 70.8 70.7 67.625-29 94.2 91.1 90.5 89.7 87.530+ 70.5 91.0 91.1 91.0 90.7
Female 41.9 50.3 48.6 47.7 48.015-19 32.8 33.5 32.7 29.3 25.620-24 35.6 46.2 43.9 43.1 42.325-29 42.1 53.8 50.3 48.2 48.230+ 46.2 55.4 53.7 53.4 54.7
Source: Labour Force Situation in Indonesia (Sakernas Survey), annual publication (table 2), CBS. 1 Unemployment rate as % of labour force2 Employment rate as % of population.
7/18/2019 Contoh B_Dhanani_Unemployment and Underemployment in Indonesia
http://slidepdf.com/reader/full/contoh-bdhananiunemployment-and-underemployment-in-indonesia 24/41
18
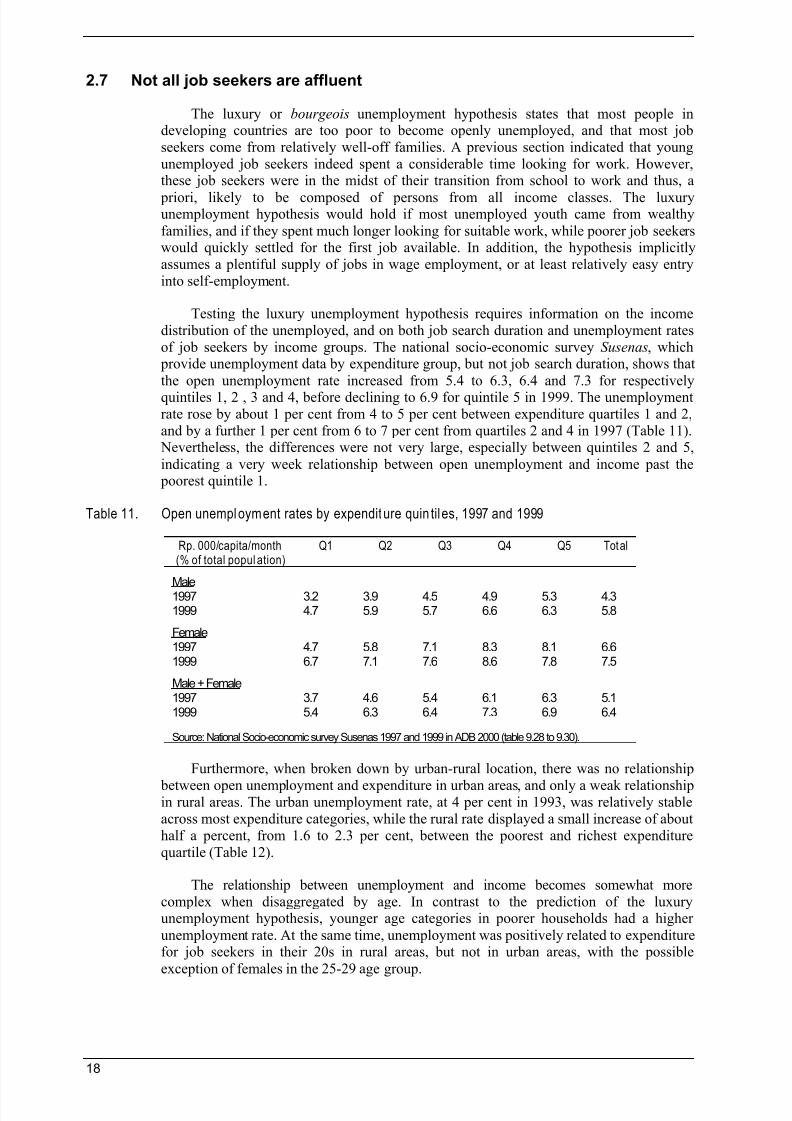
2.7 Not all job seekers are affluent
The luxury or bourgeois unemployment hypothesis states that most people indeveloping countries are too poor to become openly unemployed, and that most jobseekers come from relatively well-off families. A previous section indicated that youngunemployed job seekers indeed spent a considerable time looking for work. However,these job seekers were in the midst of their transition from school to work and thus, a
priori, likely to be composed of persons from all income classes. The luxuryunemployment hypothesis would hold if most unemployed youth came from wealthy
families, and if they spent much longer looking for suitable work, while poorer job seekerswould quickly settled for the first job available. In addition, the hypothesis implicitlyassumes a plentiful supply of jobs in wage employment, or at least relatively easy entryinto self-employment.
Testing the luxury unemployment hypothesis requires information on the incomedistribution of the unemployed, and on both job search duration and unemployment ratesof job seekers by income groups. The national socio-economic survey Susenas, which provide unemployment data by expenditure group, but not job search duration, shows that
the open unemployment rate increased from 5.4 to 6.3, 6.4 and 7.3 for respectively
quintiles 1, 2 , 3 and 4, before declining to 6.9 for quintile 5 in 1999. The unemploymentrate rose by about 1 per cent from 4 to 5 per cent between expenditure quartiles 1 and 2,and by a further 1 per cent from 6 to 7 per cent from quartiles 2 and 4 in 1997 (Table 11). Nevertheless, the differences were not very large, especially between quintiles 2 and 5,
indicating a very week relationship between open unemployment and income past the poorest quintile 1.
Table 11. Open unemployment rates by expenditure quin tiles, 1997 and 1999
Rp. 000/capita/month(% of total popul ation)
Q1 Q2 Q3 Q4 Q5 Total
Male1997 3.2 3.9 4.5 4.9 5.3 4.31999 4.7 5.9 5.7 6.6 6.3 5.8
Female1997 4.7 5.8 7.1 8.3 8.1 6.61999 6.7 7.1 7.6 8.6 7.8 7.5
Male + Female1997 3.7 4.6 5.4 6.1 6.3 5.11999 5.4 6.3 6.4 7.3 6.9 6.4
Source: National Socio-economic survey Susenas 1997 and 1999 in ADB 2000 (table 9.28 to 9.30).
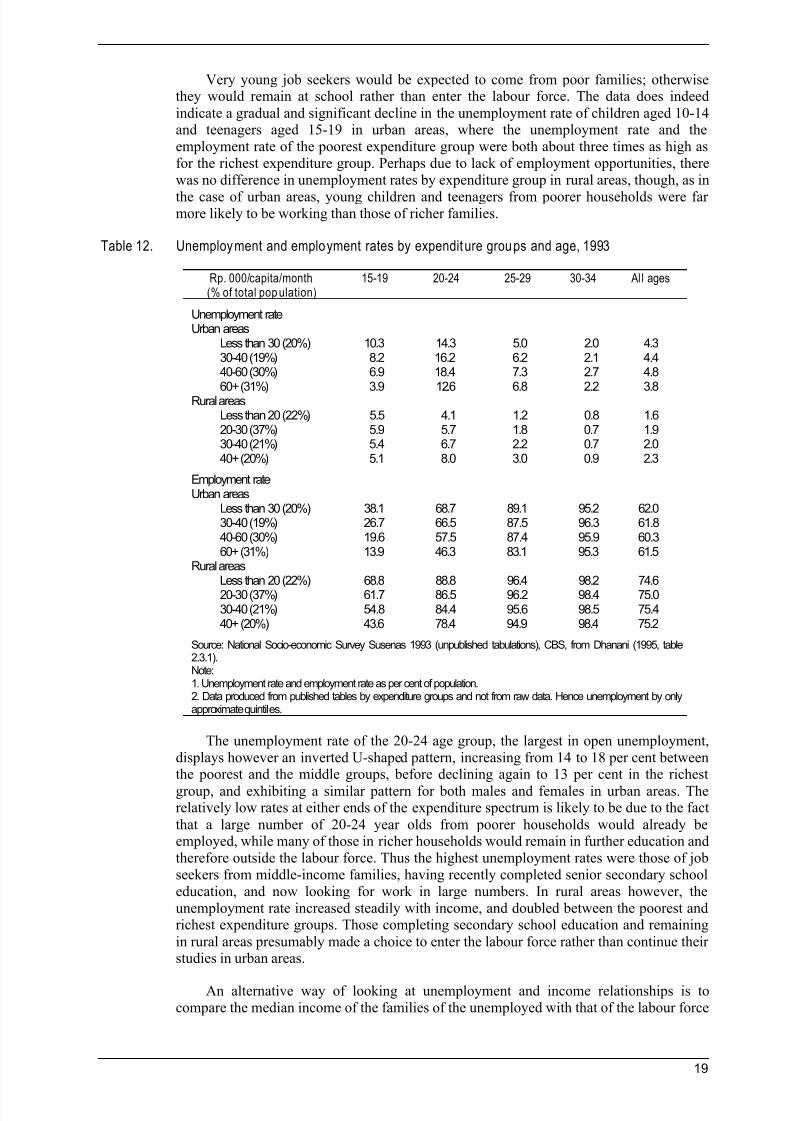
Furthermore, when broken down by urban-rural location, there was no relationship
between open unemployment and expenditure in urban areas, and only a weak relationshipin rural areas. The urban unemployment rate, at 4 per cent in 1993, was relatively stableacross most expenditure categories, while the rural rate displayed a small increase of abouthalf a percent, from 1.6 to 2.3 per cent, between the poorest and richest expenditurequartile (Table 12).
The relationship between unemployment and income becomes somewhat morecomplex when disaggregated by age. In contrast to the prediction of the luxuryunemployment hypothesis, younger age categories in poorer households had a higher
unemployment rate. At the same time, unemployment was positively related to expenditurefor job seekers in their 20s in rural areas, but not in urban areas, with the possible
exception of females in the 25-29 age group.
7/18/2019 Contoh B_Dhanani_Unemployment and Underemployment in Indonesia
http://slidepdf.com/reader/full/contoh-bdhananiunemployment-and-underemployment-in-indonesia 25/41
19
Very young job seekers would be expected to come from poor families; otherwisethey would remain at school rather than enter the labour force. The data does indeed
indicate a gradual and significant decline in the unemployment rate of children aged 10-14and teenagers aged 15-19 in urban areas, where the unemployment rate and theemployment rate of the poorest expenditure group were both about three times as high asfor the richest expenditure group. Perhaps due to lack of employment opportunities, therewas no difference in unemployment rates by expenditure group in rural areas, though, as in
the case of urban areas, young children and teenagers from poorer households were farmore likely to be working than those of richer families.
Table 12. Unemployment and employment rates by expenditure groups and age, 1993
Rp. 000/capita/month(% of total pop ulation)
15-19 20-24 25-29 30-34 Al l ages
Unemployment rateUrban areas
Less than 30 (20%) 10.3 14.3 5.0 2.0 4.330-40 (19%) 8.2 16.2 6.2 2.1 4.440-60 (30%) 6.9 18.4 7.3 2.7 4.8
60+ (31%) 3.9 12.6 6.8 2.2 3.8Rural areasLess than 20 (22%) 5.5 4.1 1.2 0.8 1.620-30 (37%) 5.9 5.7 1.8 0.7 1.930-40 (21%) 5.4 6.7 2.2 0.7 2.040+ (20%) 5.1 8.0 3.0 0.9 2.3
Employment rateUrban areas
Less than 30 (20%) 38.1 68.7 89.1 95.2 62.030-40 (19%) 26.7 66.5 87.5 96.3 61.840-60 (30%) 19.6 57.5 87.4 95.9 60.360+ (31%) 13.9 46.3 83.1 95.3 61.5
Rural areasLess than 20 (22%) 68.8 88.8 96.4 98.2 74.620-30 (37%) 61.7 86.5 96.2 98.4 75.030-40 (21%) 54.8 84.4 95.6 98.5 75.440+ (20%) 43.6 78.4 94.9 98.4 75.2
Source: National Socio-economic Survey Susenas 1993 (unpublished tabulations), CBS, from Dhanani (1995, table2.3.1).Note:1. Unemployment rate and employment rate as per cent of population.2. Data produced from published tables by expenditure groups and not from raw data. Hence unemployment by onlyapproximate quintiles.
The unemployment rate of the 20-24 age group, the largest in open unemployment,displays however an inverted U-shaped pattern, increasing from 14 to 18 per cent betweenthe poorest and the middle groups, before declining again to 13 per cent in the richest
group, and exhibiting a similar pattern for both males and females in urban areas. Therelatively low rates at either ends of the expenditure spectrum is likely to be due to the fact
that a large number of 20-24 year olds from poorer households would already beemployed, while many of those in richer households would remain in further education andtherefore outside the labour force. Thus the highest unemployment rates were those of jobseekers from middle-income families, having recently completed senior secondary schooleducation, and now looking for work in large numbers. In rural areas however, theunemployment rate increased steadily with income, and doubled between the poorest andrichest expenditure groups. Those completing secondary school education and remaining
in rural areas presumably made a choice to enter the labour force rather than continue theirstudies in urban areas.
An alternative way of looking at unemployment and income relationships is tocompare the median income of the families of the unemployed with that of the labour force
7/18/2019 Contoh B_Dhanani_Unemployment and Underemployment in Indonesia
http://slidepdf.com/reader/full/contoh-bdhananiunemployment-and-underemployment-in-indonesia 26/41
20
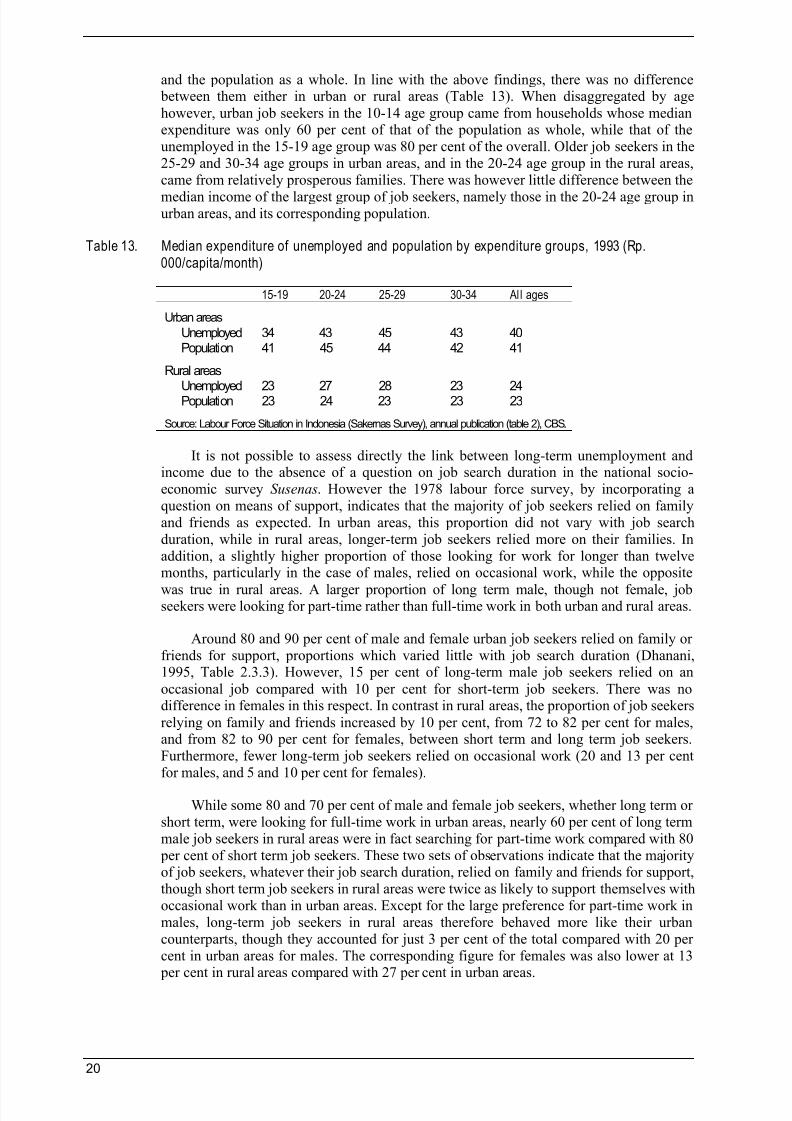
and the population as a whole. In line with the above findings, there was no difference between them either in urban or rural areas (Table 13). When disaggregated by age
however, urban job seekers in the 10-14 age group came from households whose medianexpenditure was only 60 per cent of that of the population as whole, while that of theunemployed in the 15-19 age group was 80 per cent of the overall. Older job seekers in the25-29 and 30-34 age groups in urban areas, and in the 20-24 age group in the rural areas,came from relatively prosperous families. There was however little difference between the
median income of the largest group of job seekers, namely those in the 20-24 age group inurban areas, and its corresponding population.
Table 13. Median expenditure of unemployed and population by expenditure groups, 1993 (Rp.000/capita/month)
15-19 20-24 25-29 30-34 Al l ages
Urban areas
Unemployed 34 43 45 43 40Population 41 45 44 42 41
Rural areas
Unemployed 23 27 28 23 24Population 23 24 23 23 23
Source: Labour Force Situation in Indonesia (Sakernas Survey), annual publication (table 2), CBS.
It is not possible to assess directly the link between long-term unemployment andincome due to the absence of a question on job search duration in the national socio-economic survey Susenas. However the 1978 labour force survey, by incorporating aquestion on means of support, indicates that the majority of job seekers relied on familyand friends as expected. In urban areas, this proportion did not vary with job searchduration, while in rural areas, longer-term job seekers relied more on their families. Inaddition, a slightly higher proportion of those looking for work for longer than twelvemonths, particularly in the case of males, relied on occasional work, while the opposite
was true in rural areas. A larger proportion of long term male, though not female, jobseekers were looking for part-time rather than full-time work in both urban and rural areas.
Around 80 and 90 per cent of male and female urban job seekers relied on family orfriends for support, proportions which varied little with job search duration (Dhanani,1995, Table 2.3.3). However, 15 per cent of long-term male job seekers relied on an
occasional job compared with 10 per cent for short-term job seekers. There was nodifference in females in this respect. In contrast in rural areas, the proportion of job seekers
relying on family and friends increased by 10 per cent, from 72 to 82 per cent for males,and from 82 to 90 per cent for females, between short term and long term job seekers.Furthermore, fewer long-term job seekers relied on occasional work (20 and 13 per centfor males, and 5 and 10 per cent for females).
While some 80 and 70 per cent of male and female job seekers, whether long term orshort term, were looking for full-time work in urban areas, nearly 60 per cent of long termmale job seekers in rural areas were in fact searching for part-time work compared with 80 per cent of short term job seekers. These two sets of observations indicate that the majorityof job seekers, whatever their job search duration, relied on family and friends for support,though short term job seekers in rural areas were twice as likely to support themselves withoccasional work than in urban areas. Except for the large preference for part-time work inmales, long-term job seekers in rural areas therefore behaved more like their urbancounterparts, though they accounted for just 3 per cent of the total compared with 20 percent in urban areas for males. The corresponding figure for females was also lower at 13 per cent in rural areas compared with 27 per cent in urban areas.
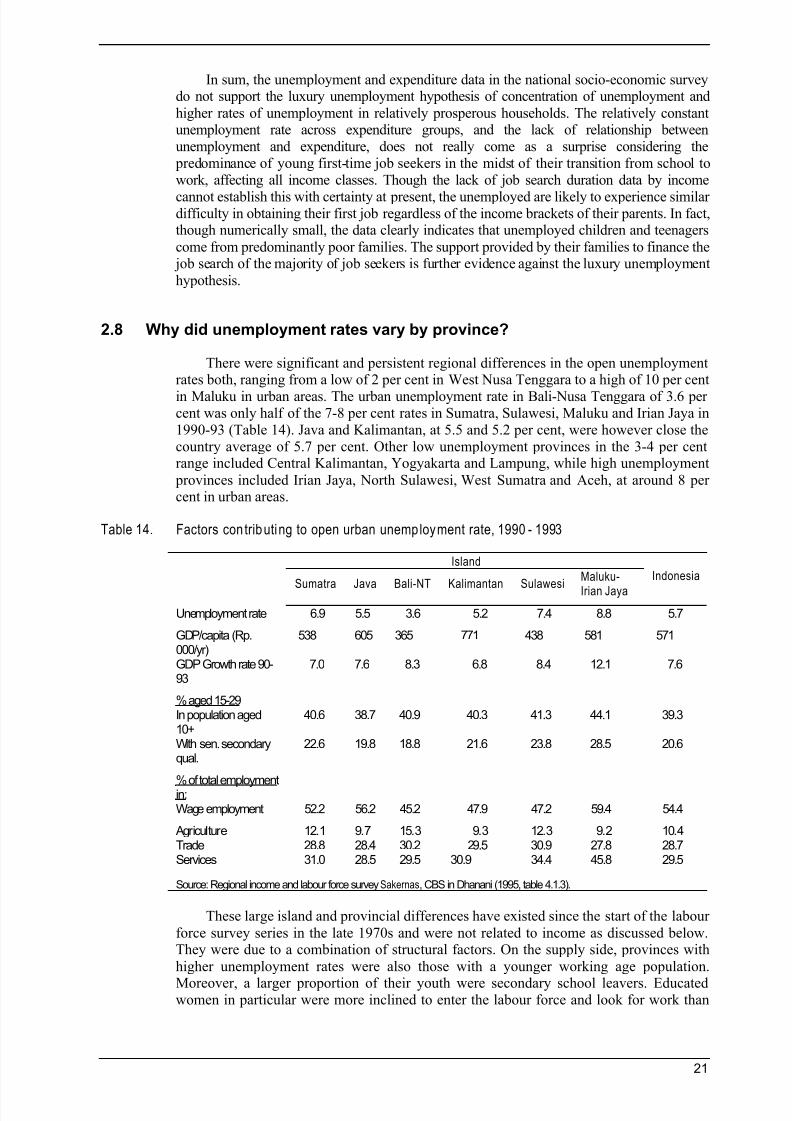
7/18/2019 Contoh B_Dhanani_Unemployment and Underemployment in Indonesia
http://slidepdf.com/reader/full/contoh-bdhananiunemployment-and-underemployment-in-indonesia 27/41
21
In sum, the unemployment and expenditure data in the national socio-economic surveydo not support the luxury unemployment hypothesis of concentration of unemployment and
higher rates of unemployment in relatively prosperous households. The relatively constantunemployment rate across expenditure groups, and the lack of relationship betweenunemployment and expenditure, does not really come as a surprise considering the predominance of young first-time job seekers in the midst of their transition from school towork, affecting all income classes. Though the lack of job search duration data by income
cannot establish this with certainty at present, the unemployed are likely to experience similardifficulty in obtaining their first job regardless of the income brackets of their parents. In fact,though numerically small, the data clearly indicates that unemployed children and teenagers
come from predominantly poor families. The support provided by their families to finance the job search of the majority of job seekers is further evidence against the luxury unemployment
hypothesis.
2.8 Why did unemployment rates vary by province?
There were significant and persistent regional differences in the open unemploymentrates both, ranging from a low of 2 per cent in West Nusa Tenggara to a high of 10 per cent
in Maluku in urban areas. The urban unemployment rate in Bali-Nusa Tenggara of 3.6 percent was only half of the 7-8 per cent rates in Sumatra, Sulawesi, Maluku and Irian Jaya in1990-93 (Table 14). Java and Kalimantan, at 5.5 and 5.2 per cent, were however close thecountry average of 5.7 per cent. Other low unemployment provinces in the 3-4 per centrange included Central Kalimantan, Yogyakarta and Lampung, while high unemployment
provinces included Irian Jaya, North Sulawesi, West Sumatra and Aceh, at around 8 percent in urban areas.
Table 14. Factors contributing to open urban unemployment rate, 1990 - 1993
Island
Sumatra Java Bali-NT Kalimantan Sulawesi
Maluku-
Irian Jaya
Indonesia
Unemployment rate 6.9 5.5 3.6 5.2 7.4 8.8 5.7
GDP/capita (Rp.000/yr)
538 605 365 771 438 581 571
GDP Growth rate 90-93
7.0 7.6 8.3 6.8 8.4 12.1 7.6
% aged 15-29In population aged10+
40.6 38.7 40.9 40.3 41.3 44.1 39.3
With sen. secondaryqual.
22.6 19.8 18.8 21.6 23.8 28.5 20.6
% of total employmentin:Wage employment 52.2 56.2 45.2 47.9 47.2 59.4 54.4
Agriculture 12.1 9.7 15.3 9.3 12.3 9.2 10.4Trade 28.8 28.4 30.2 29.5 30.9 27.8 28.7Services 31.0 28.5 29.5 30.9 34.4 45.8 29.5
Source: Regional income and labour force survey Sakernas, CBS in Dhanani (1995, table 4.1.3).
These large island and provincial differences have existed since the start of the labour
force survey series in the late 1970s and were not related to income as discussed below.They were due to a combination of structural factors. On the supply side, provinces with
higher unemployment rates were also those with a younger working age population.
Moreover, a larger proportion of their youth were secondary school leavers. Educatedwomen in particular were more inclined to enter the labour force and look for work than
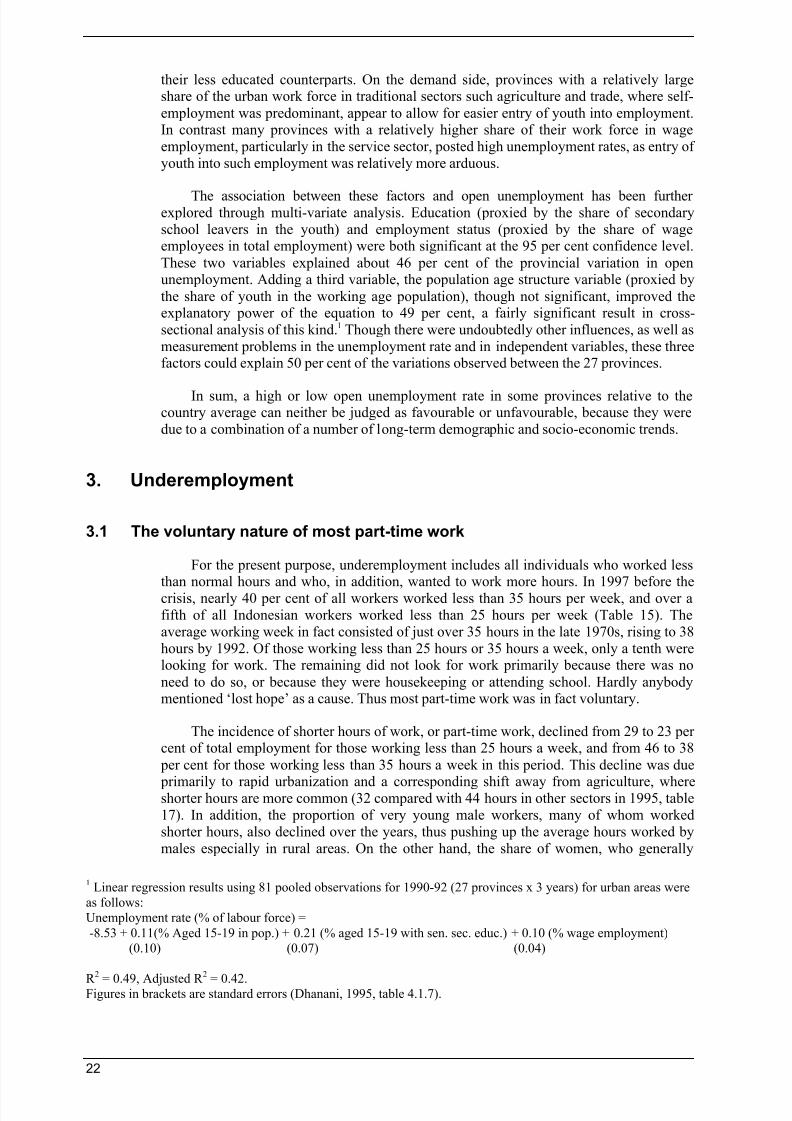
7/18/2019 Contoh B_Dhanani_Unemployment and Underemployment in Indonesia
http://slidepdf.com/reader/full/contoh-bdhananiunemployment-and-underemployment-in-indonesia 28/41
22
their less educated counterparts. On the demand side, provinces with a relatively largeshare of the urban work force in traditional sectors such agriculture and trade, where self-
employment was predominant, appear to allow for easier entry of youth into employment.In contrast many provinces with a relatively higher share of their work force in wageemployment, particularly in the service sector, posted high unemployment rates, as entry ofyouth into such employment was relatively more arduous.
The association between these factors and open unemployment has been furtherexplored through multi-variate analysis. Education (proxied by the share of secondaryschool leavers in the youth) and employment status (proxied by the share of wageemployees in total employment) were both significant at the 95 per cent confidence level.
These two variables explained about 46 per cent of the provincial variation in openunemployment. Adding a third variable, the population age structure variable (proxied by
the share of youth in the working age population), though not significant, improved theexplanatory power of the equation to 49 per cent, a fairly significant result in cross-sectional analysis of this kind.1 Though there were undoubtedly other influences, as well asmeasurement problems in the unemployment rate and in independent variables, these threefactors could explain 50 per cent of the variations observed between the 27 provinces.
In sum, a high or low open unemployment rate in some provinces relative to thecountry average can neither be judged as favourable or unfavourable, because they weredue to a combination of a number of long-term demographic and socio-economic trends.
3. Underemployment
3.1 The voluntary nature of most part-time work
For the present purpose, underemployment includes all individuals who worked lessthan normal hours and who, in addition, wanted to work more hours. In 1997 before thecrisis, nearly 40 per cent of all workers worked less than 35 hours per week, and over afifth of all Indonesian workers worked less than 25 hours per week (Table 15). Theaverage working week in fact consisted of just over 35 hours in the late 1970s, rising to 38hours by 1992. Of those working less than 25 hours or 35 hours a week, only a tenth werelooking for work. The remaining did not look for work primarily because there was no
need to do so, or because they were housekeeping or attending school. Hardly anybodymentioned ‘lost hope’ as a cause. Thus most part-time work was in fact voluntary.
The incidence of shorter hours of work, or part-time work, declined from 29 to 23 percent of total employment for those working less than 25 hours a week, and from 46 to 38
per cent for those working less than 35 hours a week in this period. This decline was due
primarily to rapid urbanization and a corresponding shift away from agriculture, whereshorter hours are more common (32 compared with 44 hours in other sectors in 1995, table17). In addition, the proportion of very young male workers, many of whom workedshorter hours, also declined over the years, thus pushing up the average hours worked bymales especially in rural areas. On the other hand, the share of women, who generally
1 Linear regression results using 81 pooled observations for 1990-92 (27 provinces x 3 years) for urban areas were
as follows:
Unemployment rate (% of labour force) =
-8.53 + 0.11(% Aged 15-19 in pop.) + 0.21 (% aged 15-19 with sen. sec. educ.) + 0.10 (% wage employment)
(0.10) (0.07) (0.04)
R 2
= 0.49, Adjusted R 2
= 0.42.Figures in brackets are standard errors (Dhanani, 1995, table 4.1.7).
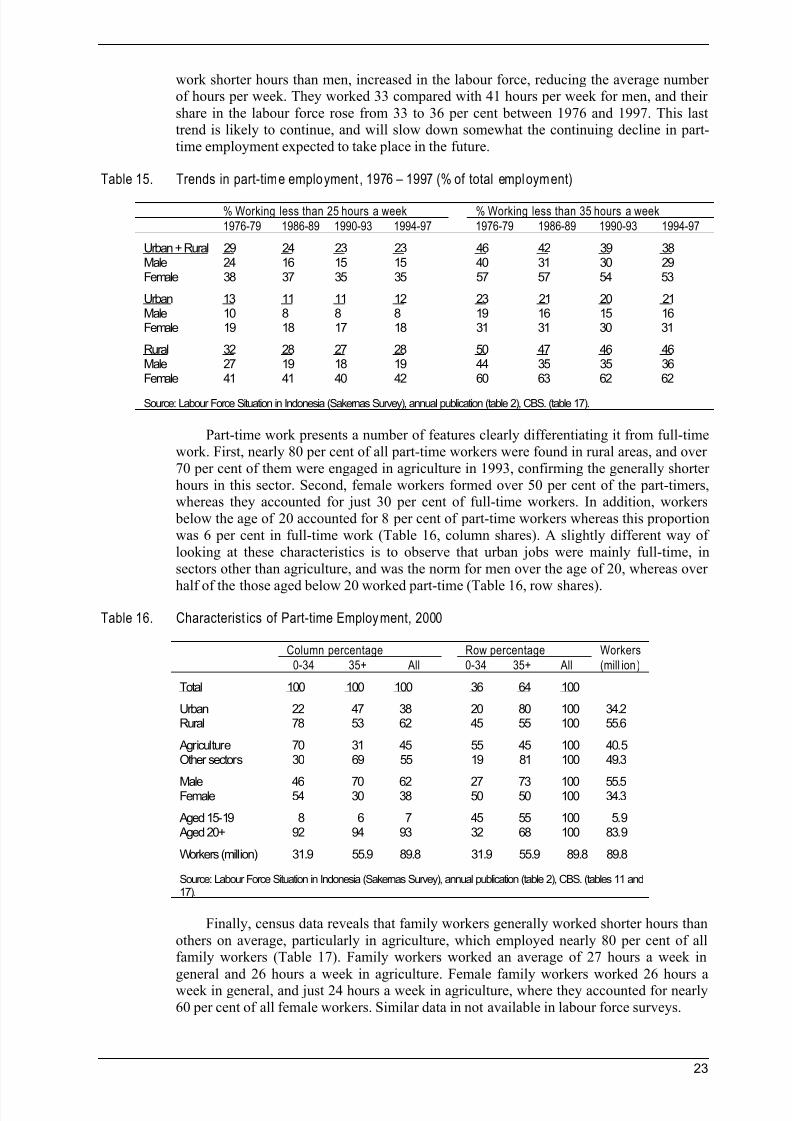
7/18/2019 Contoh B_Dhanani_Unemployment and Underemployment in Indonesia
http://slidepdf.com/reader/full/contoh-bdhananiunemployment-and-underemployment-in-indonesia 29/41
23
work shorter hours than men, increased in the labour force, reducing the average numberof hours per week. They worked 33 compared with 41 hours per week for men, and their
share in the labour force rose from 33 to 36 per cent between 1976 and 1997. This lasttrend is likely to continue, and will slow down somewhat the continuing decline in part-time employment expected to take place in the future.
Table 15. Trends in part-time employment , 1976 – 1997 (% of total employment)
% Working less than 25 hours a week % Working less than 35 hours a week
1976-79 1986-89 1990-93 1994-97 1976-79 1986-89 1990-93 1994-97
Urban + Rural 29 24 23 23 46 42 39 38Male 24 16 15 15 40 31 30 29Female 38 37 35 35 57 57 54 53
Urban 13 11 11 12 23 21 20 21Male 10 8 8 8 19 16 15 16Female 19 18 17 18 31 31 30 31
Rural 32 28 27 28 50 47 46 46Male 27 19 18 19 44 35 35 36Female 41 41 40 42 60 63 62 62
Source: Labour Force Situation in Indonesia (Sakernas Survey), annual publication (table 2), CBS. (table 17).
Part-time work presents a number of features clearly differentiating it from full-timework. First, nearly 80 per cent of all part-time workers were found in rural areas, and over70 per cent of them were engaged in agriculture in 1993, confirming the generally shorterhours in this sector. Second, female workers formed over 50 per cent of the part-timers,whereas they accounted for just 30 per cent of full-time workers. In addition, workers below the age of 20 accounted for 8 per cent of part-time workers whereas this proportionwas 6 per cent in full-time work (Table 16, column shares). A slightly different way oflooking at these characteristics is to observe that urban jobs were mainly full-time, insectors other than agriculture, and was the norm for men over the age of 20, whereas over
half of the those aged below 20 worked part-time (Table 16, row shares).
Table 16. Characterist ics of Part-time Employment, 2000
Column percentage Row percentage Workers
0-34 35+ All 0-34 35+ All (mill ion)
Total 100 100 100 36 64 100
Urban 22 47 38 20 80 100 34.2Rural 78 53 62 45 55 100 55.6
Agriculture 70 31 45 55 45 100 40.5Other sectors 30 69 55 19 81 100 49.3
Male 46 70 62 27 73 100 55.5Female 54 30 38 50 50 100 34.3
Aged 15-19 8 6 7 45 55 100 5.9 Aged 20+ 92 94 93 32 68 100 83.9
Workers (million) 31.9 55.9 89.8 31.9 55.9 89.8 89.8
Source: Labour Force Situation in Indonesia (Sakernas Survey), annual publication (table 2), CBS. (tables 11 and17).
Finally, census data reveals that family workers generally worked shorter hours than
others on average, particularly in agriculture, which employed nearly 80 per cent of allfamily workers (Table 17). Family workers worked an average of 27 hours a week in
general and 26 hours a week in agriculture. Female family workers worked 26 hours aweek in general, and just 24 hours a week in agriculture, where they accounted for nearly60 per cent of all female workers. Similar data in not available in labour force surveys.
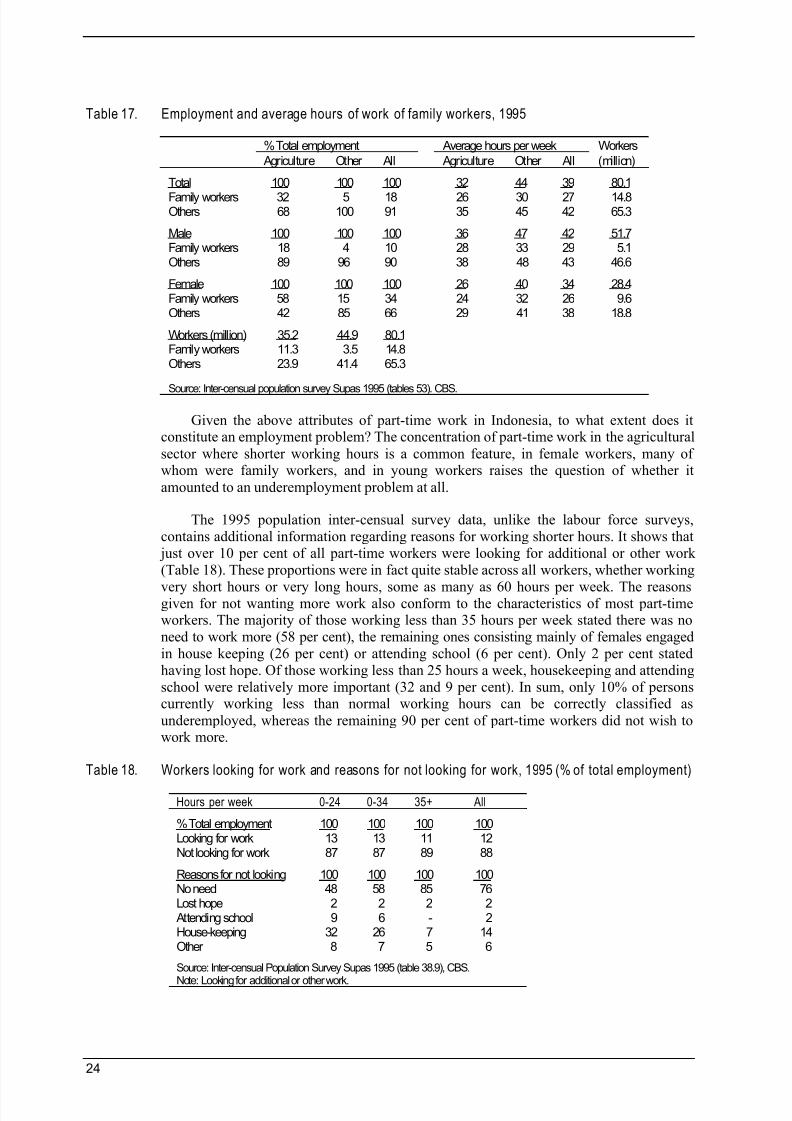
7/18/2019 Contoh B_Dhanani_Unemployment and Underemployment in Indonesia
http://slidepdf.com/reader/full/contoh-bdhananiunemployment-and-underemployment-in-indonesia 30/41
24
Table 17. Employment and average hours of work of family workers, 1995
% Total employment Average hours per week Workers
Agriculture Other All Agriculture Other All (million)
Total 100 100 100 32 44 39 80.1
Family workers 32 5 18 26 30 27 14.8Others 68 100 91 35 45 42 65.3
Male 100 100 100 36 47 42 51.7Family workers 18 4 10 28 33 29 5.1Others 89 96 90 38 48 43 46.6
Female 100 100 100 26 40 34 28.4Family workers 58 15 34 24 32 26 9.6Others 42 85 66 29 41 38 18.8
Workers (million) 35.2 44.9 80.1Family workers 11.3 3.5 14.8Others 23.9 41.4 65.3
Source: Inter-censual population survey Supas 1995 (tables 53). CBS.
Given the above attributes of part-time work in Indonesia, to what extent does itconstitute an employment problem? The concentration of part-time work in the agricultural
sector where shorter working hours is a common feature, in female workers, many ofwhom were family workers, and in young workers raises the question of whether it
amounted to an underemployment problem at all.
The 1995 population inter-censual survey data, unlike the labour force surveys,contains additional information regarding reasons for working shorter hours. It shows that just over 10 per cent of all part-time workers were looking for additional or other work(Table 18). These proportions were in fact quite stable across all workers, whether working
very short hours or very long hours, some as many as 60 hours per week. The reasonsgiven for not wanting more work also conform to the characteristics of most part-timeworkers. The majority of those working less than 35 hours per week stated there was noneed to work more (58 per cent), the remaining ones consisting mainly of females engagedin house keeping (26 per cent) or attending school (6 per cent). Only 2 per cent statedhaving lost hope. Of those working less than 25 hours a week, housekeeping and attendingschool were relatively more important (32 and 9 per cent). In sum, only 10% of personscurrently working less than normal working hours can be correctly classified as
underemployed, whereas the remaining 90 per cent of part-time workers did not wish towork more.
Table 18. Workers looking for work and reasons for not looking for work, 1995 (% of total employment)
Hours per week 0-24 0-34 35+ All
% Total employment 100 100 100 100Looking for work 13 13 11 12Not looking for work 87 87 89 88
Reasons for not looking 100 100 100 100No need 48 58 85 76Lost hope 2 2 2 2 Attending school 9 6 - 2House-keeping 32 26 7 14Other 8 7 5 6
Source: Inter-censual Population Survey Supas 1995 (table 38.9), CBS.
Note: Looking for additional or other work.
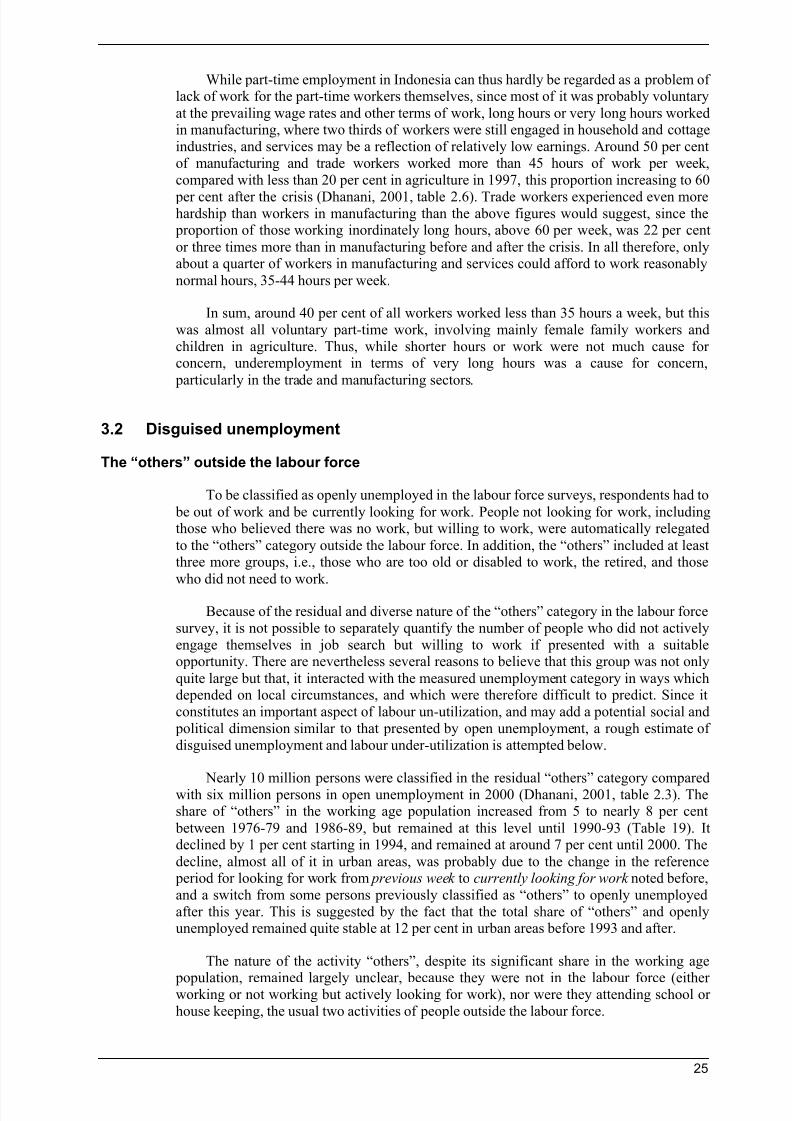
7/18/2019 Contoh B_Dhanani_Unemployment and Underemployment in Indonesia
http://slidepdf.com/reader/full/contoh-bdhananiunemployment-and-underemployment-in-indonesia 31/41
25
While part-time employment in Indonesia can thus hardly be regarded as a problem oflack of work for the part-time workers themselves, since most of it was probably voluntary
at the prevailing wage rates and other terms of work, long hours or very long hours workedin manufacturing, where two thirds of workers were still engaged in household and cottageindustries, and services may be a reflection of relatively low earnings. Around 50 per centof manufacturing and trade workers worked more than 45 hours of work per week,compared with less than 20 per cent in agriculture in 1997, this proportion increasing to 60
per cent after the crisis (Dhanani, 2001, table 2.6). Trade workers experienced even morehardship than workers in manufacturing than the above figures would suggest, since the proportion of those working inordinately long hours, above 60 per week, was 22 per cent
or three times more than in manufacturing before and after the crisis. In all therefore, onlyabout a quarter of workers in manufacturing and services could afford to work reasonably
normal hours, 35-44 hours per week.
In sum, around 40 per cent of all workers worked less than 35 hours a week, but thiswas almost all voluntary part-time work, involving mainly female family workers andchildren in agriculture. Thus, while shorter hours or work were not much cause forconcern, underemployment in terms of very long hours was a cause for concern,
particularly in the trade and manufacturing sectors.
3.2 Disguised unemployment
The “others” outside the labour force
To be classified as openly unemployed in the labour force surveys, respondents had to
be out of work and be currently looking for work. People not looking for work, includingthose who believed there was no work, but willing to work, were automatically relegated
to the “others” category outside the labour force. In addition, the “others” included at leastthree more groups, i.e., those who are too old or disabled to work, the retired, and those
who did not need to work.
Because of the residual and diverse nature of the “others” category in the labour forcesurvey, it is not possible to separately quantify the number of people who did not activelyengage themselves in job search but willing to work if presented with a suitableopportunity. There are nevertheless several reasons to believe that this group was not only
quite large but that, it interacted with the measured unemployment category in ways whichdepended on local circumstances, and which were therefore difficult to predict. Since itconstitutes an important aspect of labour un-utilization, and may add a potential social and political dimension similar to that presented by open unemployment, a rough estimate ofdisguised unemployment and labour under-utilization is attempted below.
Nearly 10 million persons were classified in the residual “others” category comparedwith six million persons in open unemployment in 2000 (Dhanani, 2001, table 2.3). Theshare of “others” in the working age population increased from 5 to nearly 8 per cent
between 1976-79 and 1986-89, but remained at this level until 1990-93 (Table 19). Itdeclined by 1 per cent starting in 1994, and remained at around 7 per cent until 2000. The
decline, almost all of it in urban areas, was probably due to the change in the reference period for looking for work from previous week to currently looking for work noted before,and a switch from some persons previously classified as “others” to openly unemployedafter this year. This is suggested by the fact that the total share of “others” and openlyunemployed remained quite stable at 12 per cent in urban areas before 1993 and after.
The nature of the activity “others”, despite its significant share in the working age
population, remained largely unclear, because they were not in the labour force (eitherworking or not working but actively looking for work), nor were they attending school orhouse keeping, the usual two activities of people outside the labour force.
7/18/2019 Contoh B_Dhanani_Unemployment and Underemployment in Indonesia
http://slidepdf.com/reader/full/contoh-bdhananiunemployment-and-underemployment-in-indonesia 32/41
26
Table 19. Others and Open Unemployment Rates, 1976 – 2000 (% of Population 15+)
1976-79 1986-89 1990-93 1994-97 1998-2000
Urban + Rural 6.40 9.29 9.36 10.07 10.72Others 4.95 7.47 7.60 6.98 6.71
Openly Unemployed 1.46 1.82 1.76 3.09 4.02
Urban 9.94 13.13 12.05 12.31 13.36Others 6.55 9.38 8.89 7.48 7.51Openly Unemployed 3.39 3.75 3.16 4.84 5.85
Rural 5.66 7.72 8.03 8.71 8.82Others 4.61 6.68 6.96 6.68 6.13Openly Unemployed 1.05 1.03 1.07 2.03 2.69
Source: Labour Force Situation in Indonesia (Sakernas Survey), annual publication (table 2), CBS.
Between 1986 and 1990 at least, but not after 1994, the labour force surveyquestionnaire distinguished between those not capable of work and all others, though
corresponding tabulations are not published. Unpublished tables revealed that some 40 percent of all “others” were incapable of work in 1990. Though this proportion was 60 percent for adults, it dropped to just 6 per cent for younger persons aged 10-29, signifying that
the remaining 94 per cent of youth, amounting to some 3.5 million persons, were at leastcapable of work but chose to remain outside the labour force (Table 20). Adding the 2.2
million adults, who similarly shunned the labour force, a total of 5.7 million persons, orroughly three times the total number of openly unemployed persons, remained outside thelabour force in that year.
Table 20. Composition of “ others” outside the labour force by age group, 1990
Million Percent
10-29 30+ All 10-29 30+ AllUrban + Rural 3.78 5.41 9.20 100 100 100Not capable 0.24 3.22 3.47 6 60 38Others 3.54 2.19 5.73 94 40 62
Urban 1.31 1.87 3.19 100 100 100Not capable 0.05 0.81 0.86 4 43 27Others 1.26 1.06 2.32 96 57 73
Rural 2.47 3.54 6.01 100 100 100Not capable 0.19 2.41 2.60 8 68 43Others 2.28 1.13 3.41 92 32 57
Male 1.97 2.49 4.46 100 100 100Not capable 0.12 1.28 1.40 6 51 31
Others 1.85 1.21 3.06 94 49 69
Female 1.81 2.93 4.74 100 100 100Not capable 0.12 1.95 2.07 7 67 44Others 1.69 0.98 2.67 93 33 56
Source: Labour Force Survey Sakernas 1990 (unpublished tabulation), CBS.
Also starting in 1986, all respondents in and out of the labour force were asked if theywould accept work, although the wording of the question does not make it clear whetherthis signified additional work or a new job in the case of those already working, and under
what terms and conditions of work. The high response rate to this question from thosealready employed, just under a quarter of the total labour force in 1993, was therefore not
altogether unexpected in such a relatively vaguely worded enquiry, and may be a reasonfor not publishing the corresponding tabulations. Nevertheless, for those outside the labourforce, 8 million persons, equivalent to 11 per cent of the labour force, were willing to
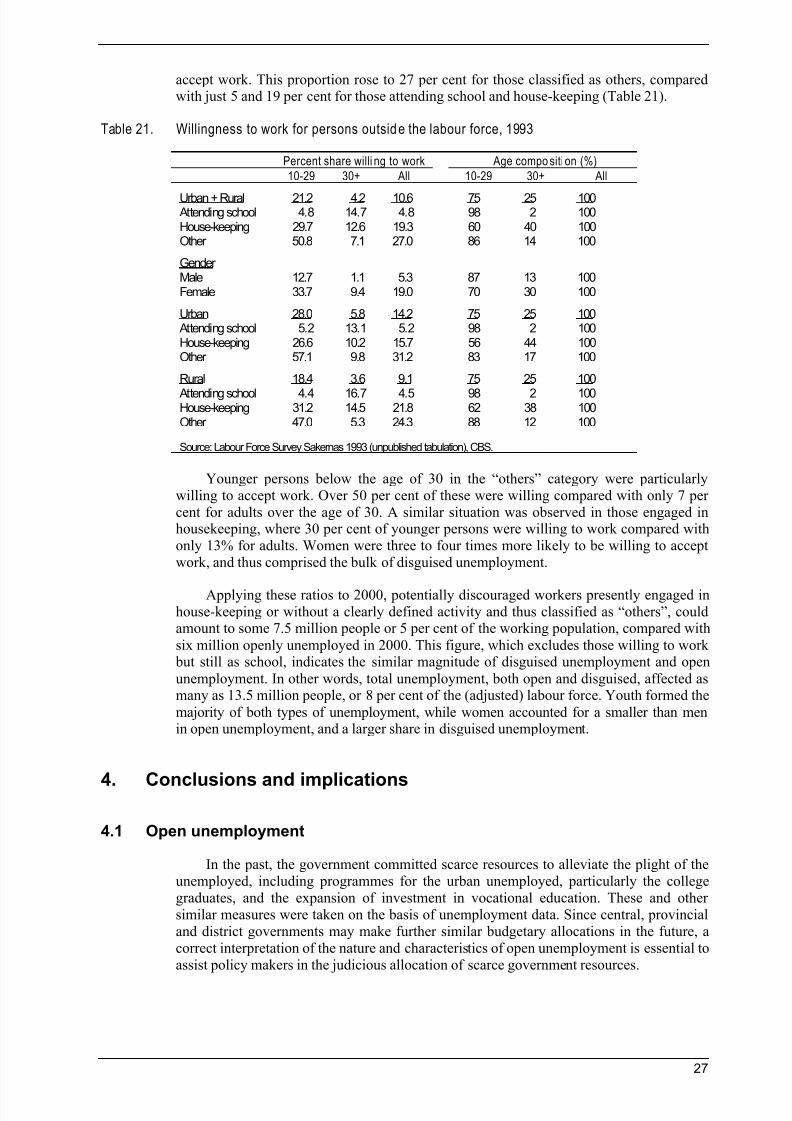
7/18/2019 Contoh B_Dhanani_Unemployment and Underemployment in Indonesia
http://slidepdf.com/reader/full/contoh-bdhananiunemployment-and-underemployment-in-indonesia 33/41
27
accept work. This proportion rose to 27 per cent for those classified as others, comparedwith just 5 and 19 per cent for those attending school and house-keeping (Table 21).
Table 21. Willingness to work for persons outside the labour force, 1993
Percent share willi ng to work Age compo siti on (%)
10-29 30+ All 10-29 30+ All
Urban + Rural 21.2 4.2 10.6 75 25 100 Attending school 4.8 14.7 4.8 98 2 100House-keeping 29.7 12.6 19.3 60 40 100Other 50.8 7.1 27.0 86 14 100
GenderMale 12.7 1.1 5.3 87 13 100Female 33.7 9.4 19.0 70 30 100
Urban 28.0 5.8 14.2 75 25 100 Attending school 5.2 13.1 5.2 98 2 100House-keeping 26.6 10.2 15.7 56 44 100Other 57.1 9.8 31.2 83 17 100
Rural 18.4 3.6 9.1 75 25 100
Attending school 4.4 16.7 4.5 98 2 100House-keeping 31.2 14.5 21.8 62 38 100Other 47.0 5.3 24.3 88 12 100
Source: Labour Force Survey Sakernas 1993 (unpublished tabulation), CBS.
Younger persons below the age of 30 in the “others” category were particularlywilling to accept work. Over 50 per cent of these were willing compared with only 7 percent for adults over the age of 30. A similar situation was observed in those engaged inhousekeeping, where 30 per cent of younger persons were willing to work compared withonly 13% for adults. Women were three to four times more likely to be willing to acceptwork, and thus comprised the bulk of disguised unemployment.
Applying these ratios to 2000, potentially discouraged workers presently engaged inhouse-keeping or without a clearly defined activity and thus classified as “others”, couldamount to some 7.5 million people or 5 per cent of the working population, compared with
six million openly unemployed in 2000. This figure, which excludes those willing to work but still as school, indicates the similar magnitude of disguised unemployment and open
unemployment. In other words, total unemployment, both open and disguised, affected asmany as 13.5 million people, or 8 per cent of the (adjusted) labour force. Youth formed the
majority of both types of unemployment, while women accounted for a smaller than menin open unemployment, and a larger share in disguised unemployment.
4. Conclusions and implications
4.1 Open unemployment
In the past, the government committed scarce resources to alleviate the plight of theunemployed, including programmes for the urban unemployed, particularly the collegegraduates, and the expansion of investment in vocational education. These and othersimilar measures were taken on the basis of unemployment data. Since central, provincialand district governments may make further similar budgetary allocations in the future, acorrect interpretation of the nature and characteristics of open unemployment is essential toassist policy makers in the judicious allocation of scarce government resources.
7/18/2019 Contoh B_Dhanani_Unemployment and Underemployment in Indonesia
http://slidepdf.com/reader/full/contoh-bdhananiunemployment-and-underemployment-in-indonesia 34/41
28
Statistical offices measure the open unemployment rate by identifying persons whoare not currently working and actively looking for work. Because of the latter, if more
people actively look for work when they believe there are jobs available in a buoyanteconomy, this will push up the unemployment rate. On the other hand, if they do notactively look for work, perhaps because they believe there are no jobs available, this willkeep the open unemployment rate low. Thus the official rate of open unemployedmeasures simultaneously the lack and the increase in employment opportunities. This
ambiguity is not unique to Indonesia or developing countries. Even the United Statesmonthly labour force survey has reported a surge in open unemployment at the beginningof several business cycles for the same reason.
Nevertheless, open unemployment in a rapidly growing developing country, such asIndonesia before the crisis, is different than in developed countries because most of it
consists mainly of youth looking for their first job. Thus it is transitional, searchunemployment rather than structural unemployment. The large number of young, first-time job seekers entering the labour market each year is in turn the result of their young andrapidly growing working age population. In addition, the low income and savings of mostordinary households, and the absence of an unemployment security system prevented most
adults from remaining out of work for any length of time. Finally, even within developing
countries, urban unemployment levels vary from one country to another and from oneregion to another, due to differences in the education level of youth, and the prevalence ofself-employment and unpaid family work compared to wage employment.
In light of these fundamental characteristics of open unemployment in Indonesia, thissection addressed at least eight paradoxes of open unemployment data in Indonesia beforethe crisis, and found the following. The open unemployment rate in urban areas was higherthan in rural areas because the proportion of urban youth actively looked for work washigher in urban areas. Job seekers believed that jobs were available in urban areas, andlooked for work, while they believed that there were no jobs available in rural areas. Also
some rural youth migrated to urban areas to look for work, precisely because they ratedtheir chances of getting a job there as higher than if they remained in rural areas.
The open unemployment rate for youth was higher than for adults, not because theywere less employable, but because of a continuous flow of school leavers and collegegraduates undergoing their transition from full time education to full time work. Around 90
per cent of all open unemployment consisted of youth aged 15-29, and 80 per cent of all job seekers were without previous work experience. It is this dynamic, continuous flow of
new job seekers in the labour market, which kept their age-specific unemployment rateshigh throughout the year. In addition, the youth aged 15-29 formed a relatively high proportion of the total population during most years between 1976 and 1997.
The higher open unemployment rate of females than for males was more apparent
than real. Expressed as a percentage of their working age population rather than the usuallabour force, this ranking was reversed because of the lower labour force participation offemales. Only half of all women were in the labour force compared with more than 80 percent for men. This in turn was due to the larger proportion of females outside the labourforce engaged in housekeeping. Nevertheless the open unemployment for females rosefaster than for males since 1976, precisely because of more job openings for women in themodern sector, and encouraging a larger number of women to actively look for work.
The large share of more educated in the openly unemployed was simply the reflectionthat most young job seekers in the 1990s were either secondary school leavers or collegegraduates. This was in turn due to the rapid educational expansion in this period and thehigher educational attainment of the younger generation in general. In the 1970s and early
1980s in contrast, most youth only studied until primary or junior secondary school, andthese were the educational qualifications of the majority of job seekers then.
7/18/2019 Contoh B_Dhanani_Unemployment and Underemployment in Indonesia
http://slidepdf.com/reader/full/contoh-bdhananiunemployment-and-underemployment-in-indonesia 35/41
29
The labour market for senior secondary school leavers and tertiary graduatesimproved between the late 1980s and the 1990s, with evidence of relatively stable age and
education-unemployment rates, stable job search duration and employment rates,indicating their high participation in the labour force, and their continued access to jobs ina period of rapid expansion of secondary and tertiary education.
The difference in open unemployment rates between vocational and secondary school
leavers were misleading when expressed as a percentage of the labour force. If anything,youth unemployment rates of vocational school leavers were higher as a percentage oftheir working age population, reflecting the terminal nature of their education and theirearlier entrance in the labour market, initially as job seekers. There was little difference in
job search duration once school leavers from either stream started looking for work, andlittle difference in pay once they started working, indicating little differentiation between
them in the labour market. Of course, a more definite assessment would require thatunemployment figures for vocational education to be broken down according to technical,economic and other vocational specializations. Unfortunately, the labour force surveys donot collect educational attainment data at this level.
The rising of the open unemployment rate over the years was due to a number of
factors. The almost doubling of the open unemployment rate after 1993 was primarily theresult of the change in the reference period for measuring the openly unemployed. Inaddition, the small rise between the mid 1970s and the mid 1980s, and again between 1994and 1997 was due to rapid urbanization, an increasingly younger working age population,at least until the mid 1990s, more educated youth, and increasing participation of womenin the labour force. Arithmetically, the large weight in total unemployment of the higherunemployment rate in urban areas, of educated youth and of females produced a higheroverall rate of open unemployment for the whole country.
The unemployment and expenditure data in the national socio-economic survey didnot appear to support the luxury unemployment hypothesis of concentration ofunemployment and higher rates of unemployment in relatively prosperous households. Thesmall differences in open unemployment rates across expenditure quintiles, and thus theweak relationship between unemployment and expenditure, was due to the predominanceof young first-time job seekers in the midst of their transition from school to work,affecting most income groups. In fact, though numerically small, unemployed children and
teenagers came from predominantly poor families. During the extended job search, most job seekers received support from their families. However, to the extent that the Susenas
survey underestimates the true degree of poverty at the bottom end of the distribution, the poorest quintile of households, where they to be correctly identified, would becharacterized by lower levels of education and would display less open unemploymentthan richer households. This should be subjected to a survey better designed to cover the poorest households, such as those without fixed address or living illegally on state land.
The open unemployment rate varied widely between provinces and islands, due to acombination of structural factors. On the supply side, provinces with higher unemploymentrates were also those with a younger working age population. Moreover, a larger proportion of their youth were secondary school leavers. Educated women in particularwere more inclined to enter the labour force and look for work than their less educatedcounterparts. On the demand side, provinces with a relatively large share of the urban workforce in traditional sectors such agriculture and trade, where self-employment was predominant, appear to allow for easier entry of youth into employment. In contrast many provinces with a relatively higher share of their work force in wage employment, particularly in the service sector, posted high unemployment rates, as entry of youth into
such employment was relatively more arduous.
7/18/2019 Contoh B_Dhanani_Unemployment and Underemployment in Indonesia
http://slidepdf.com/reader/full/contoh-bdhananiunemployment-and-underemployment-in-indonesia 36/41
30
What are the policy implications of the above findings? First of all, having noted theinherent ambiguity in the measurement of the open unemployment rate, and the transitional
nature of most of it in a growing developing country, models using the unemployment ratesuch as the Harris-Todaro model, have limited relevance to countries such as Indonesia.The open unemployment rate, on its own, provides little information on difficulty orotherwise in access to employment. Its use in the Harris-Todaro model of rural-urbanmigration for calculating the expected urban wage may not therefore be justified in all
countries, since a high urban rate of unemployment can signify a higher opportunity forfinding work in urban areas compared with rural areas.
Second, the luxury unemployment hypothesis is only partially correct, and the reality
is in fact more complex. The traditional view of unemployment in developing countries,that it is of minor importance, because it affects mainly members of relatively well off
families who can afford a long job search to obtain suitable formal sector employment, wasshown not to be valid. The observation that unemployment is virtually non-existent in theadult population in many developing countries is taken as sufficient proof thatunemployment is not a serious policy issue in developing countries. While the overallunemployment rate is low, access to first-time employment is relatively difficult even in
countries with a large traditional sector. Young job seekers come for all income groups,
not just the affluent, and from all educational backgrounds, and most of them must be prepared to look for work for a relatively long period of time. Anything that thegovernment can do to facilitate this transition from school and college to work will bewelcomed by the openly unemployed.
Third, the government should focus its assistance for unemployed school leavers andgraduates on better matching of job seekers with potential employers, and better labourmarket information and labour exchanges. It does not need to spend its scarce resources inassisting unemployed graduates in becoming self-employed entrepreneurs, especially thosewho may only consider such an opportunity move as a temporary move, while looking for
permanent wage employment with or without such training. Young graduates areinexperienced and therefore relatively ill suited in setting up their own business. In anycase, graduates and senior school leavers will continue to be given preferences for jobsrelative to less educated job seekers. Little can be done in practice to this qualificationescalation in the light of the rapid expansion of public and private education at all levels,
but it does mean that educated job seekers are at advantage in the labour market. If anyexpenditure at all is justified, then it should be focused on enterprise managers with a track
record of some years and who have shown their potential to expand the number ofwageworkers they employ.
Fourth, the choice of investment in secondary vocational schools or general schoolsshould not be based on unemployment data alone, which are misleading at best. Theyshould be made on the basis of other labour market signals and information such as wage
trends and differentials, employer surveys and key informants in the industrial andcommercial sectors.
4.2 Underemployment and disguised unemployment
Around 40 per cent of all workers worked less than 35 hours a week, but the averageworking week consisted of 39 hours in 1995, this number being smaller for females and inagriculture (34 and 32 hours respectively). Of those working less than 25 hours or 35 hoursa week, only a tenth were looking for more or additional work. The remaining did not lookfor work primarily because there was no need to do so, or because they were housekeepingor attending school. Hardly anybody mentioned ‘lost hope’ as a cause. Thus most part-time
work was in fact voluntary, involving mainly female family workers and children inagriculture. While shorter hours or work were not much cause for concern,
7/18/2019 Contoh B_Dhanani_Unemployment and Underemployment in Indonesia
http://slidepdf.com/reader/full/contoh-bdhananiunemployment-and-underemployment-in-indonesia 37/41
31
underemployment in terms of very long hours was a cause for concern, particularly in thetrade and manufacturing sectors, where nearly 60 per cent of workers worked more than 45
hours a week, indicating low earnings.
Discouraged workers presently engaged in house-keeping or without a clearly definedactivity and thus classified as ‘others’, could amount to some 7.5 million people or 5 percent of the working population, compared with six million openly unemployed in 2000.
This figure, which excludes those willing to work but still as school, indicates the similarmagnitude of disguised unemployment and open unemployment. In other words, totalunemployment, both open and disguised, affected as many as 13.5 million people, or 8 percent of the (adjusted) labour force. Youth formed the majority of both types of
unemployment, while women accounted for a smaller than men in open unemployment,and a larger share in disguised unemployment.
4.3 Employment data
There are at least four implications for data collection and presentation. First, asatisfactory monitoring of youth unemployment rate requires unemployment information
by year of leaving school or graduation. The design of an appropriate question in nationallabour surveys, to elicit important information relating to cohorts with particular age andeducation characteristics, should be a priority for labour statisticians and the InternationalLabour Organization. Second, no additional information is collected on those outside thelabour force classified as “others” and “housekeepers”, which nevertheless constitutesignificant proportions of the working age population. This should be rectified since much
of this may actually constitute disguised unemployment.
Third, a more detailed classification of those currently classified as “self-employed”
is needed to differentiate those who are really wage employed, but whose wages take theform of commissions on sales, or are paid through some sort of piece rate system. Fourth,
the labour force survey publications do not include tables on job search duration, althoughthe relevant information is collected and processed. This serious discrepancy should berectified soon by providing standard tables on job search duration by age, education andtype of effort undertaken. And fourth, national statistical authorities should introducechanges in the wording and order of questions relating to unemployment with only thegreatest of caution and pre-testing, to avoid a repeat of the sharp break in unemploymentseries such as that witnessed between 1993 and 1994.
The well-established annual national labour force survey Sakernas, on which thisstudy relied on almost exclusively, is indispensable for monitoring employment,unemployment, underemployment and wages. No other survey does this. Because ofscarce resources and decentralization, this integrity of this crucial survey is in jeopardy,
with constant pressures to reduce its size and other cost-cutting measures. One recentcasualty has been the reduction of the publication of the 2000 survey to a breakdown by
island rather than province, and fewer tables. The government should in fact allocate morefunds to strengthen and expand this survey to provide reliable and comparable data across
the country, by adding questions on the place of work and residence, inter-sectoralmobility and migration, and by allocating sufficient funds for its complete publication.
7/18/2019 Contoh B_Dhanani_Unemployment and Underemployment in Indonesia
http://slidepdf.com/reader/full/contoh-bdhananiunemployment-and-underemployment-in-indonesia 38/41
32
References
ADB. 2000. Assessment of poverty in Indonesia: Statistical appendices, ProgrammesDepartment (East), Division 1 (East), Manila: Asian Development Bank.
Clark, D. 1984. How do secondary school graduates perform in the labour market?,discussion paper (Washington, World Bank).
Dhanani, S. 1995. Unemployment and underemployment in a growing economy: Evidence from Indonesian labour force surveys 1976-1993, Technical report No. 45,Regional Manpower Planning and Training Project (RMPT), World Bank HumanResource Development Loan 3134-IND, National Development Planning Board:Jakarta.
Dhanani, S. and Islam, I. Forthcoming. Indonesian wage structure and trends, 1976-2000. Background paper, InFocus Socio-Economic Security Program (ILO/SES).
(Geneva, International Labour Organization).
Dhanani, S. and Sweeting, E. 1995. Employment, remuneration and training in a 1994tracer study of technical graduates in Indonesia, Technical report No. 41, RegionalManpower Planning and Training Project (RMPT), World Bank Human Resource
Development Loan 3134-IND, Bappenas, Jakarta.
Turnham, D. 1994. Employment and development: A new review of evidence (Paris,
OECD).
7/18/2019 Contoh B_Dhanani_Unemployment and Underemployment in Indonesia
http://slidepdf.com/reader/full/contoh-bdhananiunemployment-and-underemployment-in-indonesia 39/41
33
Other papers in the SES Series
?? Worker Insecurities in Ukrainian Industry: The 1999 ULFS by Guy Standing and LászlóZsoldos, InFocus Programme on Socio-Economic Security.
?? Globalisation and Flexibility: Dancing Around Pensions by Guy Standing, InFocusProgramme on Socio-Economic Security.
?? Unemployment Benefits and Income Security by Guy Standing, InFocus Programme onSocio-Economic Security.
?? Modes of Control: A Labour-Status Approach to Decent Work by Guy Standing, InFocus
Programme on Socio-Economic Security.
?? Workfare Tendencies in Scandinavian Welfare Policies by Nanna Kildal, Centre for SocialResearch, University of Bergen, Norway.
?? Combining Compensatory and Redistributive Benefits: The Challenge of Social Policies in Brazil by Lena Lavinas, InFocus Programme on Socio-Economic Security.
?? The Appeal of Minimum Income Programmes in Latin America by Lena Lavinas, InFocusProgramme on Socio-Economic Security.
?? Socio-Economic Security, Justice and the Psychology of Social Relationships by RosamundStock, Department of Social Psychology, London School of Economics.
?? Socio-Economic Security in the Context of Pervasive Poverty: A Case Study of India bySeeta Prabhu, Human Development Resource Centre, UNDP, New Delhi.
?? Employment Security: Conceptual and Statistical Issues by Sukti Dasgupta, InFocusProgramme on Socio-Economic Security.
?? Worker Insecurities in the Ukrainian Industry: The 2000 ULFS by Guy Standing and László
Zsoldos, InFocus Programme on Socio-Economic Security.?? Does Informal Credit Provide Security? Rural Banking Policy in India by V.K.
Ramachandran and Madhura Swaminathan, Indian Statistical Institute, Calcutta
?? Workfare Programmes in Brazil: An Evaluation of Their Performance by Sonia Rocha,Institute for Applied Economic Research, Brazil.
?? Applying Minimum Income Programmes in Brazil: Two Case Studies by Sonia Rocha,Institute for Applied Economic Research, Brazil.
?? Assessing Local Minimum Income Programmes in Brazil by Lena Lavinas, InFocusProgramme on Socio-Economic Security; Octavio Tourinho and Maria Lígia Barbosa, ILOArea Office in Brazil.
?? Changing Employment Patterns and the Informalization of Jobs: General Trends andGender Dimensions by Lourdes Beneria, Cornell University.
?? Coping with Insecurity: The Ukrainian People’s Security Survey by Guy Standing and
László Zsoldos, InFocus Programme on Socio-Economic Security.
?? Social Protection for Informal Workers: Insecurities, Instruments and Institutional Mechanisms by Jeemol Unni and Uma Rani, Gujarat Institute for Development Research,Gota, India.
?? Sustainable Development of the Global Economy: A Trade Union Perspective by Winston
Gereluk, Public Services International and Lucien Royer, Trade Union Advisory Committeeto the OECD.
?? Employment Security in Europe and Canada: A Review of Recent Legislation in ThreeCountries by Walter Onubogu, InFocus Programme on Socio-Economic Security.
7/18/2019 Contoh B_Dhanani_Unemployment and Underemployment in Indonesia
http://slidepdf.com/reader/full/contoh-bdhananiunemployment-and-underemployment-in-indonesia 40/41
34
?? Innovations in Monitoring Work Security: A Case Study of Southeast Asian Refugees in Lowell, Massachusetts by Lenore Azaroff and Charles Levenstein, Department of WorkEnvironment, University of Lowell, Massachusetts.
?? Health Care in Central and Eastern Europe: Reform, Privatization and Employment in FourCountries – A Draft Report for the International Labour Office InFocus Programme on
Socio-Economic Security and Public Services International.?? Failing Health Systems: Failing Health Workers in Eastern Europe by Carl Warren Afford,
InFocus Programme on Socio-Economic Security (also available in Russian).
?? Socio-Economic Status of Health Care Workers in the Russian Federation by Natalia
Stepantchikova, Liana Lakunina and Tatyana Tchetvernina, Centre for Labour MarketStudies, Institute of Economics, Russian Academy of Sciences (also available in Russian).
?? Exclusion, précarité, insécurité socio-économique (apports et débats des sciences sociales
en France) and La prise en compte de l'insécurité socio-économique dans les grandesenquêtes statistiques en France by Helena Hirata, Groupe d’Etudes sur les Rapports Sociaux
de Sexe and Edmond Préteceille, Centre de Sociologie Urbaine, Institut de Recherche sur lesSociétés Contemporaines, Centre National de la Recherche Scientifique.
?? Is there a Welfare State Crisis? A Comparative Study of French Social Policy by RobertBoyer, Centre d’Etudes Prospectives d’Economie Mathématiques Appliquées à laPlanification, Paris.
?? Social Policy with Respect to Care: A Perspective for Sub-Saharan Africa by KanyhamaDixon-Fyle, Independent Consultant.
?? Workers’ Representation Insecurity in Brazil: Global Forces, Local Stress by Adalberto
Moreira Cardosa, Instituto Universitário de Pesquisas do Rio de Janeiro, Brazil.
?? An Evaluation Methodology for Minimum Income Programmes in Brazil by João Saboia,Federal University of Rio de Janeiro and Sonia Rocha, State University of Rio de Janeiro.
?? Insecurities of Informal Workers in Gujarat, India by Jeemol Unni and Uma Rani, GujaratInstitute for Development Research, Gota, India.
?? Organizing for Socio-Economic Security in India by Sukti Dasgupta, InFocus Programmeon Socio-Economic Security.
?? Income (In)Security in Argentina by Alberto C. Barbeito and Ruben M. Lo Vuolo, CentroInterdisciplinario para el Estudio de Politicas Públicas (CIEPP), Buenos Aires, Argentina.
?? The Institutionalization of Unemployment in Urban China: Processes, Policies and
Implications by Edward Gu, East Asian Institute, National University of Singapore.
?? Urban Poverty in China: Measurements, Patterns and Policies by Athar Hussain, AsiaResearch Centre, London School of Economics.
?? Social Welfare Provision and the Transition: Towards Pluralism in Service Delivery by
Anthony Saich, Kennedy School of Government.
?? Migration and Socio-Economic Insecurity: Patterns, Process and Policies by Cai Fang,Institute of Population and Labour Economics, Chinese Academy of Social Sciences.
?? The Decent Work Enterprise: Worker Security and Dynamic Efficiency by Guy Standing,ILO InFocus Programme on Socio-Economic Security.
?? Civil Society and Civil Society Organizations in Indonesia by Stefano Harney and RitaOlivia.
?? Towards Gender Equity in Japanese and Nordic Labour Markets: A Tale of Two Paths by
Helinä Melkas, Helsinki University of Technology and Richard Anker, Former ILO official.
7/18/2019 Contoh B_Dhanani_Unemployment and Underemployment in Indonesia
http://slidepdf.com/reader/full/contoh-bdhananiunemployment-and-underemployment-in-indonesia 41/41
?? The Insecurities of Service: Airport Check-in Workers by Ellen Rosskam, InFocusProgramme on Socio-Economic Security; Andrew Drewczynski and Renzo Bertolini,Canadian Centre for Occupational Health and Safety, Ontario, Canada.
Statistical and Methodology Series:
?? Concealed Unemployment in Ukrainian Industry: A Statistical Analysis by Maria JeriaCaceres, InFocus Programme on Socio-Economic Security.