Embed Size (px)
Citation preview

ContourGlobal
Investor Presentation September 2019

Disclaimer
The information contained in these materials has been provided by ContourGlobal plc (“ContourGlobal” or the “Company”) and has not been independently verified.No representation or warranty, express or implied, is made as to, and no reliance should be placed on, the fairness, accuracy, completeness or correctness of theinformation or opinions contained herein. It is not the Company’s intention to provide, and you may not rely on these materials as providing, a complete orcomprehensive analysis of the Company’s financial position or prospects. The information and opinions contained in these materials are provided as at the date ofthis presentation and are subject to change without notice. Neither the Company nor any of its affiliates, advisors or representatives shall have any liabilitywhatsoever (in negligence or otherwise) for any loss whatsoever arising from any use of this presentation or its contents or otherwise arising in connection with thispresentation.
Certain statements in this presentation are “forward-looking statements.” All statements other than statements of historical facts included in this presentation,including, without limitation, those regarding the Company’s financial position, business strategy, plans and objectives of management for future operations, areforward-looking statements. These statements involve a number of factors that could cause actual results to differ materially, including, but not limited to, changesin economic, business, social, political and market conditions, success of business and operating initiatives, and changes in the legal and regulatory environment andother government actions. Forward-looking statements contained in this presentation regarding past trends or activities should not be taken as a representation thatsuch trends or activities will continue in the future. Any forward-looking statement made during this presentation or in these materials speaks only as of the date onwhich it is made. The Company assumes no obligation to update or revise any forward-looking statements.
Information contained herein relating to markets, market size, market share, market position, growth rates, penetration rates and other industry data pertainingto the Company’s business is based on the Company’s estimates and is provided solely for illustrative purposes. In many cases, there is no readily available externalinformation to validate market-related analyses and estimates, thus requiring the Company to rely on internal surveys and studies. The Company has also compiled,extracted and reproduced market or other industry data from external sources, including third parties or industry or general publications, for the purposes ofits internal surveys and studies. Any such information may be subject to significant uncertainty due to differing definitions of the relevant markets and marketsegments described.
This presentation contains references to certain non-IFRS financial measures and operating measures. These supplemental measures should not be viewed in isolationor as alternatives to measures of the Company’s financial condition, results of operations or cash flows as presented in accordance with IFRS in its consolidatedfinancial statements. The non-IFRS financial and operating measures used by the Company may differ from, and not be comparable to, similarly titled measures usedby other companies. The non-IFRS adjustments for all periods presented are based upon information and assumptions available as of the date of this presentation.
2

3
I. Business Highlights
Asa Branca Wind Farm (Brazil)

Focused business model: acquire, develop and operate long-term contracted power generation assets
Well protected dividend and high cashflow generation provides strong income protection while leaving significant liquidity for growth
Long term contracts and regulated tariffs with significant risk mitigation delivering stable and secure cash flows
Diversified footprint by geography and technology: all assets less than 20% group EBITDA
Proven track record of value accretive growth through both operationally lead acquisitions and greenfield development, with attractive M&A and development pipeline
Appropriate Capital Structure: primary use of non-recourse debt financing provides significant protection to equity investor
4
Business HighlightsWell established power generation company with exceptional growth and dividend profile
(1) Based on 2019 $99m dividend and share price of GBP185p (as of 9th of September 2019)
6.5% dividend yield1 10% p.a. dividend growth target
4.8 GW capacity across 3 continents

✓ Long-term contracts typically with state-owned or supported utilities or large investment grade companies, or stable regulatory regimes (avg. credit rating BBB-)
✓ Typical Thermal PPAs virtually eliminate commodity risk via fuel and CO2 emissions costs pass-through mechanisms
Limited
Credit Risk
Limited Duration
Risk
No
Cost Risk
No
Price Risk
✓ Long-term contracts, weighted average remaining contract life of 11 years1
✓ Fixed-price contracts that typically contain inflation pass-through terms
Contract Structure Differs between technologies✓ Thermal: No volume risk; plants paid full capacity payment irrespective of off-taker demand✓ Renewables: Plants typically paid set price based on MWh produced
Negligible Revenue /
Volume Risk
5
High-Quality and Stable BusinessesFixed-price, long-term contracts or regulation, with credit worthy off-takers.
✓ Policy of putting political risk insurance with US government or AAA private insurers, whenever investing in sub-investment grade countries
Mitigated Political Risk
(1) As of 30 June 2019 based on EBITDA

17%
15%
6%
17%
14%
23%
8%
Coal Natural Gas
Fuel oil High Efficiency Cogen
Wind Solar
Hydro
Maintaining a Diversified Footprint Across Geographies and Technologies
LTM H1 2019 PF EBITDA by Technology1
LTM H1 2019 PF EBITDA by Currency1
LTM H1 2019 PF EBITDA by Geography1
(1) PF for full year EBITDA of Mexican CHP acquisition signed in January 2019 ($110m) and Solar InterPorto acquisition completed in June 2019 ($6m). Split excludes Thermal and Renewable HoldCo expenses and gain on CSP and Solar Italy and Slovakia farm downs
53%
11%
36%
Europe Africa Latin America
54%31%
13%
2%
EUR USD BRL Other
Renewable45%
HE Cogen17%
Thermal38%
6

434
536 610
226 300
576
2017A 2018A LTM H12019
H12018
H12019
513
610
706
262
357
650
2017A 2018A LTM H12019
H12018
H12019
High Growth and Robust Financial PerformanceSignificant growth in all key financial metrics
(1) Adjusted EBITDA and FFO are non-IFRS measures as defined in IPO Prospectus(2) Pro forma numbers: Adjusted to reflect full year contribution of Spanish CSP(3) Growth based on 2017 to LTM H1 2019 (CAGR)(4) EBITDA includes net gains from farm down transactions of $46m
Adjusted EBITDA1
($m)
+24%3 +26%3
FFO1
($m)
2
Proportionate Adjusted EBITDA($m)
2
+25%3+36% +33% +53%
4 4
2
256 302
361
111
170
330
2017A 2018A LTM H12019
H12018
H12019
7

8
Improving Cost Structure While Increasing Operational Performance
Proven track-record of creating significant value in acquisitions through operational improvement
Asset Size Plant Type
908 MW LigniteMaritsa
800 MW Gas-firedArrubal
150 MW WindAustria Wind
65 MW Solar PVSolar Italy
28 MW Wind & HFOBonaire
250 MW Solar CSP Spanish CSP
Fixed Cost Reduction AvailabilityOther Operational Improvements
✓
✓
✓
✓
✓
✓
22%
20%
32%
16%
26%
12%
✓
✓
✓
✓
✓
✓
2%
2%
1%
3%
2%
4%
€2m fuel savings✓
✓ Insourced Operations: Zero LTI
✓ Repowering
O&M insourcedSell-down of 49% of asset for ~2x net equity value✓
Zero LTIs since 2015✓
Sell-down of 49% of asset for ~2x net equity value✓
Value Lever

49%
28%
37%
16%
74%
51%
CG PeersAverage
CG Thermal PeersAverage
CGRenewable
PeersAverage
High Margins Relative to Sector and Continued Focus on Cost Efficiencies Gains
31.0%
27.7%
28.8%
2016 2017 2018 2019E
27 – 28%
✓Continued focus on strong margins and efficient cost structures through streamlined operations – EBITDA margins on average approx. 20% higher than peers
✓~350bps decrease in Fixed Cost / Variable margin vs. 2016 levels on a run-rate basis
✓100bps increase in 2018 partially caused by increased overhead costs resulting as a public listed company
9
Resilient Cost Structure and EBITDA Margins1
(1) Thermal and Renewable margins include corporate SG&A fully allocated proportionately to each division
Fixed Costs to Variable Margin (%)
~ 350 bps.
+21%
+20%
+22%

0.60
0.20
0.030.00
US Utilities - Average Peers - Top Quartile CG 2018 CG 2019 YTD
10
Leadership Commitment to World-Class HSE Visible, Longstanding Commitment to Health and Safety
✓Everyone goes home safe, every day, everywhere; “Target zero” program sets the company-wide expectation that we will incur zero LTIs in all businesses for all people – employees, contractors and visitors
✓Commitment to maintain the same high H&S standards in every country that we operate in
✓Proud to achieve globally consistently high H&S standards
(1) Lost time incident rate (LTIR) is an industry standard reporting convention for calculating injuries in the workplace. LTIR measures recordable lost time incident (LTI) rates based on 200,000 working hours
(2) Peers information as of 2018 reported in annual reports / sustainability reports published by companies normalized to basis of 200,000 workings hours. (3) Based on the 2018 US Bureau of Labor Statistics report(4) Selection of comparable peers from study performed by Black & Veatch
0.06
0.03 0.03
0
2016 2017 2018 H1 201943
Lost Time Incident Rate (LTIR) – On-going improvement in key H&S indicator
LTIR Compared to Peers2 – Industry leader in H&S with KPIs significantly better than industry benchmarks

11
II. H1 2019 Financial Update
KivuWatt - Methane Gas Extraction Facility & Power Plant (Rwanda)

262 357
H1 2018 H1 2019
535 617
H1 2018 H1 2019
Revenue ($m)
H1 2019: Strong Growth in All Key Financial Metrics
226 300
H1 2018 H1 2019
111
170
H1 2018 H1 2019
Adjusted EBITDA ($m)
FFO ($m)Proportionate EBITDA ($m)
48% cash Conversion1
Increased cash conversion vs. 42% in H1 18
(1) Cash conversion rate defined as FFO / Adjusted EBITDA
$50m increase from CSP
acquisition, $46m net farm down
gains, -$24m from FX and $10m from positive renewable
resource
12

✓ Good progress in regards to achieving target of doubling Adjusted EBITDA by 2022
✓ Declaring a second quarterly dividend for 2019 of $24.75 million corresponding to 3.6901 USD cents per share, which
is expected to be paid on September 6, covered by strong cash flow and in line with our policy of growing the dividend
by at least 10% per annum
✓ Mexico CHP¹ acquisition expected to close in the third quarter of 2019 and to generate $110 million of Adjusted
EBITDA on a full year basis
✓ Sale of 49% of our 250 MW Concentrated Solar Power portfolio in Spain in May 2019 with €134m cash proceeds
✓ €100 million 4.125% senior secured notes due 2025 issued subsequent to the end of the half year at 106.0% of par
corresponding to a yield to maturity of 3.024% to fund further growth
✓ Reflecting the timing of the closing of the Mexico CHP acquisition, we expect 2019 Adjusted EBITDA to be in the lower
half of our previously communicated guidance of $720-770 million for the full year at constant foreign exchange rate2
(1) CHP – Combined Heat and Power(2) 0.8851 for EUR/USD, and 3.914 for BRL/USD
Ongoing Strong Growth and Cash Generation
Key Highlights
H1 2019 Consolidated Results
13

Mexican Cogeneration Business Acquisition Signed in Jan 2019; closing expected in Q3 2019
• Acquisition of natural-gas fired combined heat & power assets
with 518MW of operational capacity at completion, potential
for a further 414MW in development
• More than 90% contracted revenues including heat and steam
with seller
• Integration of Mexico CHP¹ is progressing as planned with all
key integration workstreams on track
• Commissioning of 414 MW CGA 1 plant progressing with COD²
and closing expected in Q3 2019
• $590m project financing underwritten by Scotiabank to be
syndicated in Q3 2019 with syndication progressing well
• Estimated Adj. EBITDA of $110m in first full year of operations
Transaction Highlights and Update Geographic Footprint
Altamira, TamaulipasCGA
Cosoleacaque, VeracruzCELCSA
(1) CHP – Combined Heat and Power(2) Commercial Operations Date
14
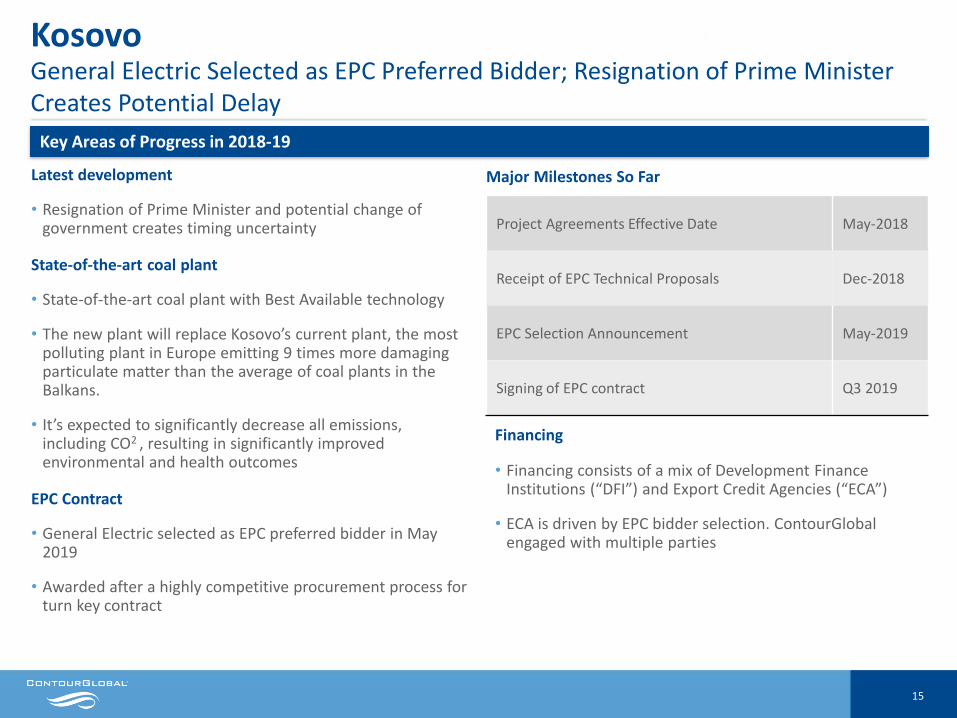
Latest development
• Resignation of Prime Minister and potential change of government creates timing uncertainty
State-of-the-art coal plant
• State-of-the-art coal plant with Best Available technology
• The new plant will replace Kosovo’s current plant, the most polluting plant in Europe emitting 9 times more damaging particulate matter than the average of coal plants in the Balkans.
• It’s expected to significantly decrease all emissions, including CO2 , resulting in significantly improved environmental and health outcomes
EPC Contract
• General Electric selected as EPC preferred bidder in May 2019
• Awarded after a highly competitive procurement process for turn key contract
Key Areas of Progress in 2018-19
Major Milestones So Far
Project Agreements Effective Date May-2018
Receipt of EPC Technical Proposals Dec-2018
EPC Selection Announcement May-2019
Signing of EPC contract Q3 2019
KosovoGeneral Electric Selected as EPC Preferred Bidder; Resignation of Prime Minister Creates Potential Delay
Financing
• Financing consists of a mix of Development Finance Institutions (“DFI”) and Export Credit Agencies (“ECA”)
• ECA is driven by EPC bidder selection. ContourGlobal engaged with multiple parties
15

Renewable UpdatesFurther Growth with both Strategic Projects and M&A. Successful Refinancing at Solar Assets
Installed Capacity(1) : 1,820 MW Adjusted EBITDA H1 2019: $214m
(1) As of June 2019, including Solar Italy Interporto acquisition(2) Feed in tariff (3) Assuming consistent amount of debt
Austria Wind Repowering
• Phase 1 (30 MW): Repowering of Velm (13 MW) reached COD on 31st Jan 2019 on time and below budgeted cost, with FiT secured for 13 years;
• Scharndorf (17 MW) to complete in H2 2019 / H1 2020 , with FiT secured for 13 years
Solar Europe Growth
• Acquisition of a 12.4MW add-on Solar Italy asset completed in June 20 – rooftop PV solar portfolio with average remaining FiT² period of 13 years, located close to existing Northern Italy hub
• Strong Solar Europe pipeline identified for future growth
Vorotan Refurbishment
• Electro-mechanical refurbishment and modernization program started in 2017 to improve operational performance, safety, reliability and efficiency of Vorotan. Initial phase has been completed and the project is on track with completion expected in 2020, ahead of original schedule and on budget
• Total $71.5m investments: electrical part funded by a €51m loan with a Development Finance Institution and additional civil works at $13.5m are funded by company’s operating cash flow
• Civil works to be entitled to a reimbursement and a regulated unlevered return through an adjustment to the tariff
• Expected Results: Vorotan EBITDA increases by approx. $7m from 2019 to 2021
Solar Italy and Solar Slovakia Refinancing
• Refinancing of Italian and Slovakian solar businesses in two separate financings• €196m refinancing in Solar Italy – increased tenor by 2.7 years from 8.9 years to 11.6
years and reduced interest costs by 1.49% p.a. (incl. breakage costs) from 4.14% to 2.65%
• €51m refinancing in Slovakia – increased tenor by 1.4 years from 5.4 years to 6.8 years and reduced interest costs by 1.95% p.a. (incl. breakage costs) from 4.48% to 2.53%
• €4m interest savings on an annualized basis³
16

Thermal UpdatesContinuation of established projects across geographies: Battery Upgrade Project implemented in Bonaire, serving as Pilot Project for future growth
Installed Capacity(1) : 3,027 MW Adjusted EBITDA H1 2019: $161m
(1) As of June 2019, including Mexico CHP and Cogeneration Assets(2) Reliability charge is a regulated fixed monthly fee to incentivize base load plants to be available
• With the acquisition of Bonaire in 2013, the company moved into a newhybrid technology and gained further expertise in battery storage withoutassuming construction risk
• In 2018 we commenced an innovative battery replacement and hybridexpansion project, which will enable us to integrate more wind energy intothe system and further reduce costs to the island customers
• Project status:
• Phase 01: Successfully implemented 6 MW/MWh Battery upgradeproject in Q1 2019. 7.7 GWh production increase
• Phase 02: Replace rented engines and ensure security of supply andgrid stability COD in Nov 2019
• Phase 03: 10 MW PV plant, 7-10 MW wind park expansion andadditional battery capacity
• Expected Results: Upon completion, the project will increase the energyproduction in line with growing energy demand on the island, achieve furtherenergy tariff reductions and increase the renewable mix on the island.Moreover, ContourGlobal will become the sole power producer on theisland.
Bonaire Hybrid Concept, a 24
MW integrated Wind, Diesel and Battery Power Plant
TermoemCali Reliability
charge assignment
extension and refinancing
• $80m refinancing: $45m long term and $35m working capital facility completed following Reliability Charge2 (the primary source of EBITDA for this peaker CCGT plant) assignment extension until November 2023.
• Optimizes capital structure and demonstrates long-term positive outlook for the asset post current regulatory period
17

Optimized Debt/Capital Structure in H1 2019Long-term non-recourse Project Finance at asset level ensures sustainable debt ratios and significant dividend coverage at corporate level
18
Asset levelSignificant recurring cash flow from asset to corporate level…
Corporate level
Distributions to Corporate Level:
$283m
Cash overhead at Corporate Level:
($31m)
Corporate Bond Interest Costs: ($34m)
Cash available for investment and dividends:
$217m
Key Corporate Metrics
DSCR1: 7.4x (6.5x including interest from Bond Tap)2
Net Corporate Leverage: 1.6x3
…results in consistently high corporate interest cover and
sustainable corporate leverage
(1) CFADS as defined in Bond Indenture (including thermal and Renewable holding cost) post cash overhead at the corporate level divided by corporate bond interest (2) Includes $5m pro-forma interest attribute to €100m Bond Tap(3) Net corporate debt divided by CFADS

4.1x 4.4x
4.0x
2017A 2018A LTM H1 2019
Jun-19 liquidity – ($m)
Ample Cash Resources to Support Future Growth and DividendImprovement in Net debt / EBITDA metric – at the lower range of 4.0x-4.5x guidance
• $2.9bn Net Debt as of June 30, 2019
• Committed to high value growth while maintaining strong BB credit metrics
• Improvement in Net Debt / EBITDA metric to 4.0x
• $497m liquidity at parent level, including $445m of cash and $52m undrawn capacity under corporate level revolver
19
299
796 445
52
Asset LevelCash
HoldCoLevel Cash
RevolvingCreditFacility
TotalLiquidityJun-19
Net Debt/EBITDA (x)Jun-19 net debt – ($m)
(1) Restricted cash at the operating assets’ level(2) Unrestricted cash at the HoldCo level(3) Includes full year earnings of Spanish CSP, which was acquired in May 2018 (+$40m of Adjusted EBITDA based on FY Earnings)
(3)
2,744 2,857
857
(744)
ProjectDebt
CorporateDebt
Cash Net DebtJun-19(IFRS)
(1) (2)
III. Appendices
Sao Domingos II Hydro Power Plant (Brazil) 20

Segment Facility / Project Name LocationGross Cap.
(MW)Number of
Assets Fuel Type1ContourGlobal
Ownership COD Power Purchaser PPA Expiration
Maritsa Bulgaria 908 1 Coal 73% 1978 NEK 2024
Arrubal Spain 800 1 Natural Gas 100% 2005 Gas Natural Fenosa 2021
TermoemCali Colombia 240 1 Natural Gas / Diesel 37% 1999 Various N/A
Sochagota Colombia 165 1 Coal 49% 1999 Gensa 20192
Togo Togo 100 1 Natural Gas / HFO / Diesel 80% 2010 CEET 2035
Cap des Biches Senegal 86 1 Oil /Natural Gas 100% Q2 2016 / Q4 2016
Senelec 2036
Energies Antilles / Energies St Martin
French Caribbean 35 2 HFO / LFO 100% 2000; 2003 EDF 2020; 2023
Bonaire Dutch Antilles 28 1 HFO / Wind 100% 2010 WEB 2025
KivuWatt Rwanda 26 1 Natural Gas 100% Q4 2015 EWSA (ex-Electrogaz & REC) 2040 (expected)
Total Thermal 2,388 10
Mexican CHP assets(5) Mexico 518 2 Natural Gas cogeneration 100% 2014/19 Mexican industrial/commercial N/A
ContourGlobal Solutions Europe – Nigeria –Brazil
132 11 Natural Gas / Diesel / LFO 100%;100%; 80% 1995-2015 Investment grade global industrial companies
2018-2032
Total Cogen 650 13
Chapada Complex Brazil 438 3 Wind 51%, 51%, 100% 2015; Q1 2016 CCEE; distribution companies 2035
Vorotan Armenia 404 1 Hydro 100% 1970 AEN 2040
CSP Portfolio Spain 250 5 CSP 100% 2010 CNMC 2034-2037
Hydro Brazil Brazil 167 9 Hydro 79%3 1963; 1992; 2009-2012
Distribution companies 2027-2042
Asa Branca Brazil 160 1 Wind 100% 2013 Distribution companies 2033
Austria Wind Austria 155 10 Wind 94% 2003-2014 OeMAG 2016-2027
Inka Peru 114 2 Wind 100% 2014 Distribution companies 2034
Solar Italy4 Italy 77 48 Solar 51% 2007-2013 Gestore Servizi Energetici S.p.A 2027-2033
Solar Slovakia Slovakia 35 3 Solar 51% 2010-2011 Distribution companies 2025-2026
Solar Romania Romania 7 1 Solar 100% 2013 Distribution companies 2028
Biogas Italy Italy 2 2 Biogas 100% 2013 Gestore Servizi Energetici S.p.A 2028
Total Renewable 1,809 85
Total portfolio 4,847 108
ContourGlobal Portfolio
Thermal Renewables
(1) HFO refers to heavy fuel oil, and LFO to light fuel oil. (2) CES has already signed 4 contracts to replace existing PPA, extending expiration to 2024, with an additional 5 year extension expected(3) Capacity weighted(4) Italian solar assets in 20 clusters. Includes InterPorto acquisition, which was completed in June 2019(5) Signed but not closed
21

ContourGlobal Footprint: 4.8GW in 19 Countries
ARRUBAL
800 MW – SPAIN
CSP COMPLEX
250 MW – SPAIN
MARITSA
908 MW – BULGARIA
INKA
114 MW – PERU
BRAZIL WIND
598 MW
VOROTAN
404 MW – ARMENIA
BRAZIL SOLUTIONS
76 MW
LEGENDThermal Solar
Wind Hydro
High Efficiency Cogen / Energy Solutions business
CARIBBEAN
64 MW
BRAZIL HYDRO
167 MW
CHP COMPLEX
518 MW – MEXICO
SOLAR ITALY
77 MW
AUSTRIA WIND
155 MW
Africa228 MW | 11% EBITDA
Europe2,677 MW | 53% EBITDA
LatAm1,942 MW | 36% EBITDA
(1) As of H1 2019 including Mexican CHP acquisition signed in January 2019 and Solar InterPorto acquisition completed in June 2019 (12MW). 22
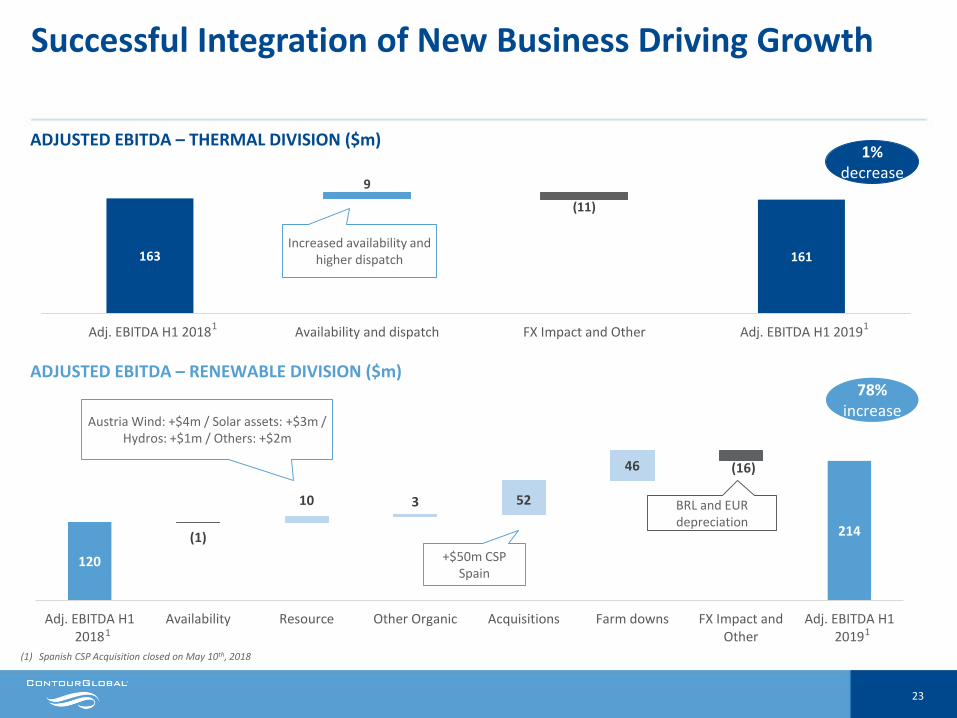
120 119 119 129 131 184
214 214
10 3 52
46
(1)
(16)
Adj. EBITDA H12018
Availability Resource Other Organic Acquisitions Farm downs FX Impact andOther
Adj. EBITDA H12019
163 163 161 161
9
(11)
Adj. EBITDA H1 2018 Availability and dispatch FX Impact and Other Adj. EBITDA H1 2019
Successful Integration of New Business Driving Growth
ADJUSTED EBITDA – THERMAL DIVISION ($m)
ADJUSTED EBITDA – RENEWABLE DIVISION ($m)
1
(1) Spanish CSP Acquisition closed on May 10th, 2018
78% increase
1%decrease
Austria Wind: +$4m / Solar assets: +$3m / Hydros: +$1m / Others: +$2m
+$50m CSP Spain
Increased availability and higher dispatch
1
11
BRL and EUR depreciation
23

Net Leverage Ratio1 DSCR2
Continued Strong Bond Credit Metrics
(1) Net leverage defined as net corporate debt over CFADS (as defined in Bond Indenture)(2) DSCR as defined in Bond Indenture. (2) Includes distributions from Solar Italy farm down
In $m or multiple
202
301
237 232
291
203
251
32 33 41 41 43 34 34
6.3x
9.2x
5.7x 5.6x
6.8x
6.1x
7.4x
(0.5x)
0.5x
1.5x
2.5x
3.5x
4.5x
5.5x
6.5x
7.5x
8.5x
9.5x
-
50
100
150
200
250
300
350
400
450
500
Jun-16 Dec-16 Jun-17 Dec-17 Jun-18 Dec-18 Jun-19
CFADS (LTM) Annualized Debt Service
DSCR Incurrence Level (2x min)
2x
1.6x
2.2x
1.2x
H1 201920182017
2
24
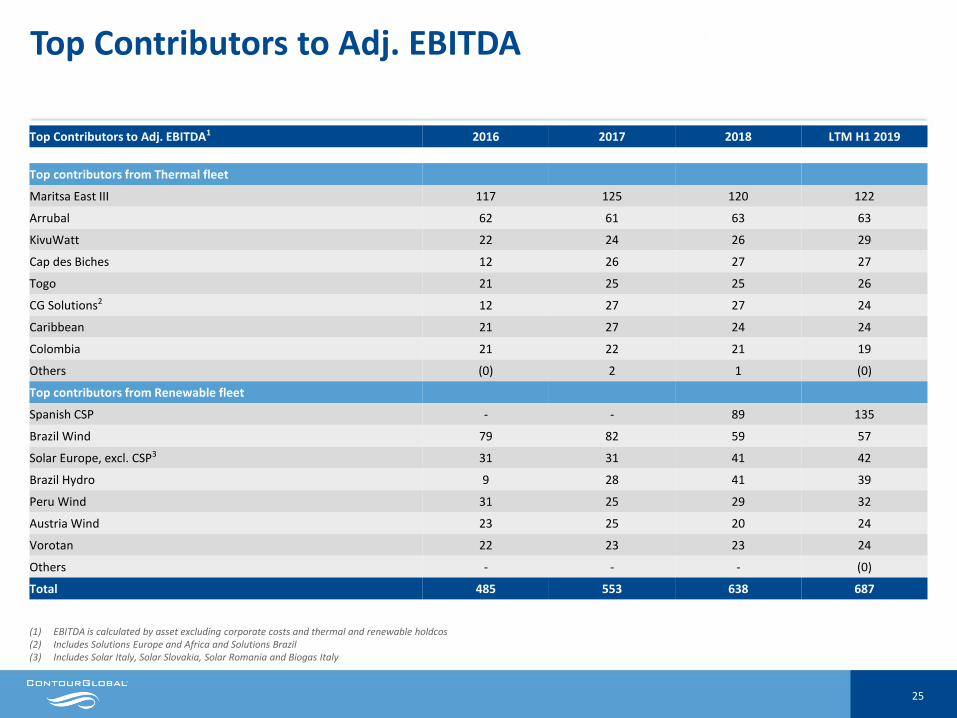
Top Contributors to Adj. EBITDA
(1) EBITDA is calculated by asset excluding corporate costs and thermal and renewable holdcos(2) Includes Solutions Europe and Africa and Solutions Brazil(3) Includes Solar Italy, Solar Slovakia, Solar Romania and Biogas Italy
Top Contributors to Adj. EBITDA1 2016 2017 2018 LTM H1 2019
Top contributors from Thermal fleet
Maritsa East III 117 125 120 122
Arrubal 62 61 63 63
KivuWatt 22 24 26 29
Cap des Biches 12 26 27 27
Togo 21 25 25 26
CG Solutions2 12 27 27 24
Caribbean 21 27 24 24
Colombia 21 22 21 19
Others (0) 2 1 (0)
Top contributors from Renewable fleet
Spanish CSP - - 89 135
Brazil Wind 79 82 59 57
Solar Europe, excl. CSP3 31 31 41 42
Brazil Hydro 9 28 41 39
Peru Wind 31 25 29 32
Austria Wind 23 25 20 24
Vorotan 22 23 23 24
Others - - - (0)
Total 485 553 638 687
25

Top Contributors to CFADS(Before Corporate and Other Costs)1 2016 2017 2018 LTM H1 2019
Spanish CSP - - 35 75
Solar Europe excl. CSP2 22 55 38 61
Maritsa 118 30 65 34
Arrubal 19 28 18 29
Brazil Hydros (1) 55 14 23
CG Solutions3 28 41 15 15
Cap des Biches - 7 17 12
Peru Wind 23 5 15 12
Colombia 4 8 4 12
KivuWatt - - 4 8
Vorotan 111 13 9 5
Austria Wind 7 8 4 5
Togo 6 6 7 5
Caribbean 10 9 5 4
Brazil Wind 2 5 (0) (2)
Total 349 270 249 298
Top Contributors to CFADS1
(1) CFADS (Cash Flows Available for (Corporate) Debt Service) as defined in Bond Indenture(2) Includes Solar Italy, Solar Slovakia, Solar Romania and Biogas Italy(3) Includes Solutions Europe and Africa and Solutions Brazil(4) $84m second instalment of acquisition payment not deducted from CFADS
4
26

Disclaimer
The information contained in these materials has been provided by ContourGlobal plc (the “Company”) and has not been independently verified. No representation or warranty, express or implied, is made as to, and no reliance should be placed on, the fairness, accuracy, completeness or correctness of the information or opinions contained herein. It is not the Company’s intention to provide, and you may not rely on these materials as providing, a complete or comprehensive analysis of the Company’s financial position or prospects. The information and opinions contained in these materials are provided as at the date of this presentation and are subject to change without notice. Neither the Company nor any of its affiliates, advisors or representatives shall have any liability whatsoever (in negligence or otherwise) for any loss whatsoever arising from any use of this presentation or its contents or otherwise arising in connection with this presentation.
Certain statements in this presentation are “forward-looking statements.” All statements other than statements of historical facts included in this presentation, including, without limitation, those regarding the Company’s financial position, business strategy, plans and objectives of management for future operations, are forward-looking statements. These statements involve a number of factors that could cause actual results to differ materially, including, but not limited to, changes in economic, business, social, political and market conditions, success of business and operating initiatives, and changes in the legal and regulatory environment and other government actions. Forward-looking statements contained in this presentation regarding past trends or activities should not be taken as a representation that such trends or activities will continue in the future. Any forward-looking statement made during this presentation or in these materials speaks only as of the date on which it is made. The Company assumes no obligation to update or revise any forward-looking statements.
Information contained herein relating to markets, market size, market share, market position, growth rates, penetration rates and other industry data pertaining to the Company’s business is based on the Company’s estimates and is provided solely for illustrative purposes. In many cases, there is no readily available external information to validate market-related analyses and estimates, thus requiring the Company to rely on internal surveys and studies. The Company has also compiled, extracted and reproduced market or other industry data from external sources, including third parties or industry or general publications, for the purposes of its internal surveys and studies. Any such information may be subject to significant uncertainty due to differing definitions of the relevant markets and market segments described.
This presentation contains references to certain non-IFRS financial measures and operating measures. These supplemental measures should not be viewed in isolation or as alternatives to measures of the Company’s financial condition, results of operations or cash flows as presented in accordance with IFRS in its consolidated financial statements. The non-IFRS financial and operating measures used by the Company may differ from, and not be comparable to, similarly titled measures used by other companies. The non-IFRS adjustments for all periods presented are based upon information and assumptions available as of the date of this presentation.
27