Embed Size (px)
Citation preview
CONTRACEPTIVE PERFORMANCE REPORT
2014-2015
GOVERNMENT OF PAKISTAN STATISTICS DIVISION
PAKISTAN BUREAU OF STATISTICS
TEAM OF THE REPORT
The Contraceptive Performance Report owes to devoted and tireless efforts of the following staff of
Pakistan Bureau of Statistics (PBS):
Compilation of Report
Dr. Bahrawar Jan,
Deputy Director General
Ms. Rizwana Siddique,
Director
Syed Adil Hashmi,
Statistical Officer
Mr. Arshad Ahmad Khan,
Data Processing Assistant
Mr. Mahmood-ul-Hassan,
Data Processing Assistant
Data Processing
Mr. Muhammad Akram Assi
Deputy Director General
Mr. Pervaiz Akhtar Bhatti
Director
Mr. Shahid Islam
Chief System Analyst
Mr. Ghulam Kibria,
Data Processing Assistant
Typing and Graphic
Mr. Mahmood-ul-Hasan,
Data Processing Assistant
Mr. Ali Hasnain Abbasi,
Stenotypist

ii
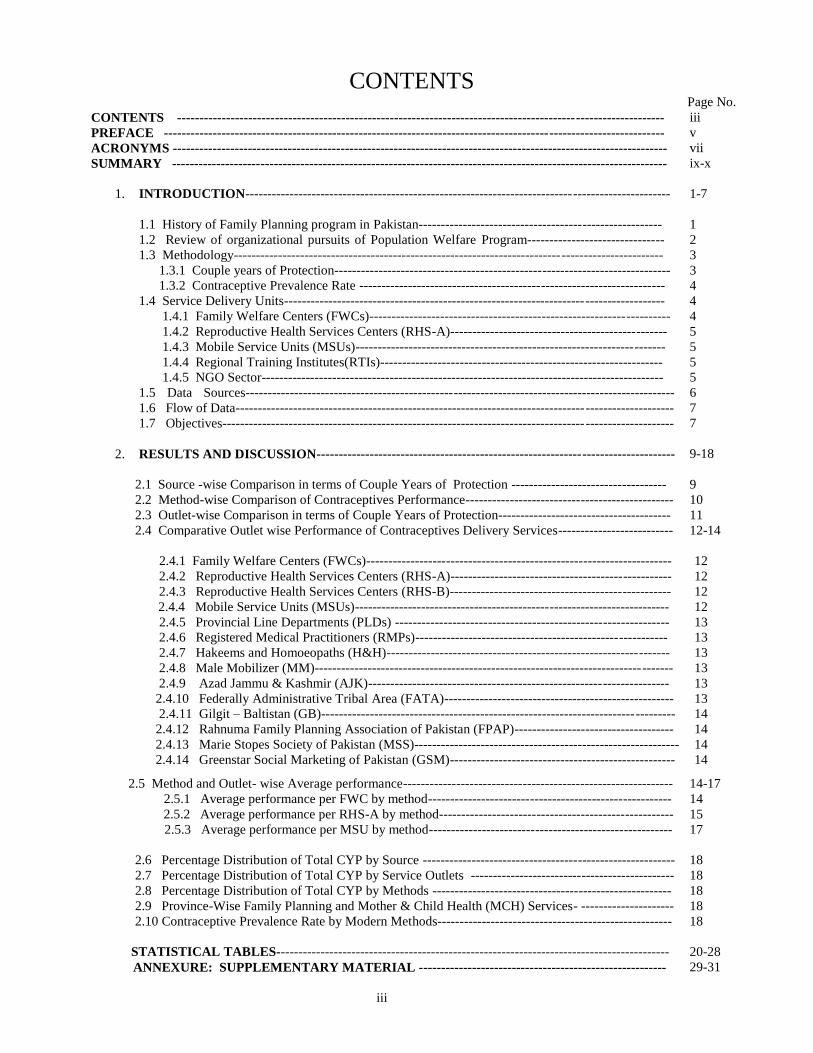
CONTENTS Page No.
CONTENTS --------------------------------------------------------------------------------------------------------------
PREFACE -----------------------------------------------------------------------------------------------------------------
ACRONYMS ----------------------------------------------------------------------------------------------------------------
SUMMARY ----------------------------------------------------------------------------------------------------------------
1. INTRODUCTION------------------------------------------------------------------------------------------------
1.1 History of Family Planning program in Pakistan-------------------------------------------------------
1.2 Review of organizational pursuits of Population Welfare Program-------------------------------
1.3 Methodology-------------------------------------------------------------------------------------------------
1.3.1 Couple years of Protection----------------------------------------------------------------------------
1.3.2 Contraceptive Prevalence Rate ---------------------------------------------------------------------
1.4 Service Delivery Units--------------------------------------------------------------------------------------
1.4.1 Family Welfare Centers (FWCs)--------------------------------------------------------------------
1.4.2 Reproductive Health Services Centers (RHS-A)-------------------------------------------------
1.4.3 Mobile Service Units (MSUs)----------------------------------------------------------------------
1.4.4 Regional Training Institutes(RTIs)----------------------------------------------------------------
1.4.5 NGO Sector-------------------------------------------------------------------------------------------
1.5 Data Sources-------------------------------------------------------------------------------------------------
1.6 Flow of Data---------------------------------------------------------------------------------------------------
1.7 Objectives------------------------------------------------------------------------------------------------------
iii
v
vii
ix-x
1-7
1
2
3
3
4
4
4
5
5
5
5
6
7
7
2. RESULTS AND DISCUSSION--------------------------------------------------------------------------------- 9-18
2.1 Source -wise Comparison in terms of Couple Years of Protection -----------------------------------
2.2 Method-wise Comparison of Contraceptives Performance-----------------------------------------------
9
10
2.3 Outlet-wise Comparison in terms of Couple Years of Protection--------------------------------------- 11
2.4 Comparative Outlet wise Performance of Contraceptives Delivery Services-------------------------- 12-14
2.4.1 Family Welfare Centers (FWCs)---------------------------------------------------------------------
2.4.2 Reproductive Health Services Centers (RHS-A)--------------------------------------------------
2.4.3 Reproductive Health Services Centers (RHS-B)--------------------------------------------------
2.4.4 Mobile Service Units (MSUs)-----------------------------------------------------------------------
2.4.5 Provincial Line Departments (PLDs) --------------------------------------------------------------
2.4.6 Registered Medical Practitioners (RMPs)---------------------------------------------------------
2.4.7 Hakeems and Homoeopaths (H&H)----------------------------------------------------------------
2.4.8 Male Mobilizer (MM)---------------------------------------------------------------------------------
2.4.9 Azad Jammu & Kashmir (AJK)--------------------------------------------------------------------
2.4.10 Federally Administrative Tribal Area (FATA)----------------------------------------------------
2.4.11 Gilgit – Baltistan (GB)--------------------------------------------------------------------------------
2.4.12 Rahnuma Family Planning Association of Pakistan (FPAP)------------------------------------
2.4.13 Marie Stopes Society of Pakistan (MSS)------------------------------------------------------------
2.4.14 Greenstar Social Marketing of Pakistan (GSM)---------------------------------------------------
12
12
12
12
13
13
13
13
13
13
14
14
14
14
2.5 Method and Outlet- wise Average performance-------------------------------------------------------------
2.5.1 Average performance per FWC by method-------------------------------------------------------
2.5.2 Average performance per RHS-A by method-----------------------------------------------------
2.5.3 Average performance per MSU by method-------------------------------------------------------
14-17
14
15
17
2.6 Percentage Distribution of Total CYP by Source --------------------------------------------------------- 18
2.7 Percentage Distribution of Total CYP by Service Outlets ---------------------------------------------- 18
2.8 Percentage Distribution of Total CYP by Methods ------------------------------------------------------ 18
2.9 Province-Wise Family Planning and Mother & Child Health (MCH) Services- ---------------------
2.10 Contraceptive Prevalence Rate by Modern Methods-----------------------------------------------------
18
18
STATISTICAL TABLES-----------------------------------------------------------------------------------------
ANNEXURE: SUPPLEMENTARY MATERIAL --------------------------------------------------------
iii
20-28
29-31

iv
PREFACE
Pakistan Bureau of Statistics (PBS) is prime official agency of Pakistan, responsible for
the collection, compilation and timely dissemination of reliable statistical information to the
policy makers, planners and researchers. This organization publishes a variety of data, primary as
well as secondary, especially on economic and social aspects of the country.
The task of producing Contraceptive Performance Report has been assigned to PBS as a
sequel to the devolution of Ministry of Population Welfare (MOPW). Pursuantly, Population
Welfare Statistics Section (PWSS) of PBS has produced the 5th issue of the Annual
Contraceptive Performance Report of Population Welfare Program for the year 2014-15.
Requisite information stems from all service delivery points in the country in order to
ensure nationwide coverage of Family Planning/Reproductive Health activities. Annual
Contraceptive Performance Report is an important intervention to gauge outlet, sector and
method-wise contraceptive progress and observe the direction and track/trend for future
Contraceptive Requirement and Distribution in the country.
I am grateful to Provincial Population Welfare Departments (PPWDs), the District
Population Welfare Office, Islamabad Capital Territory (ICT), Population Welfare Department
Azad Jammu & Kashmir (AJK), Population Welfare Programme Gilgit-Baltistan (GB), Social
Marketing of Contraceptive (SMC) and other stakeholders for their valuable support in the
compilation of this document.
I hope that the user of the report will get benefit of it and learn about important measures
being undertaken to promote awareness of family planning methods among general public.
Comments and suggestions for improvement of Contraceptive Performance Report would be
highly appreciated.
ASIF BAJWA
Chief Statistician
Pakistan Bureau of Statistics
Statistics Division
Government of Pakistan
Islamabad.
v

vi
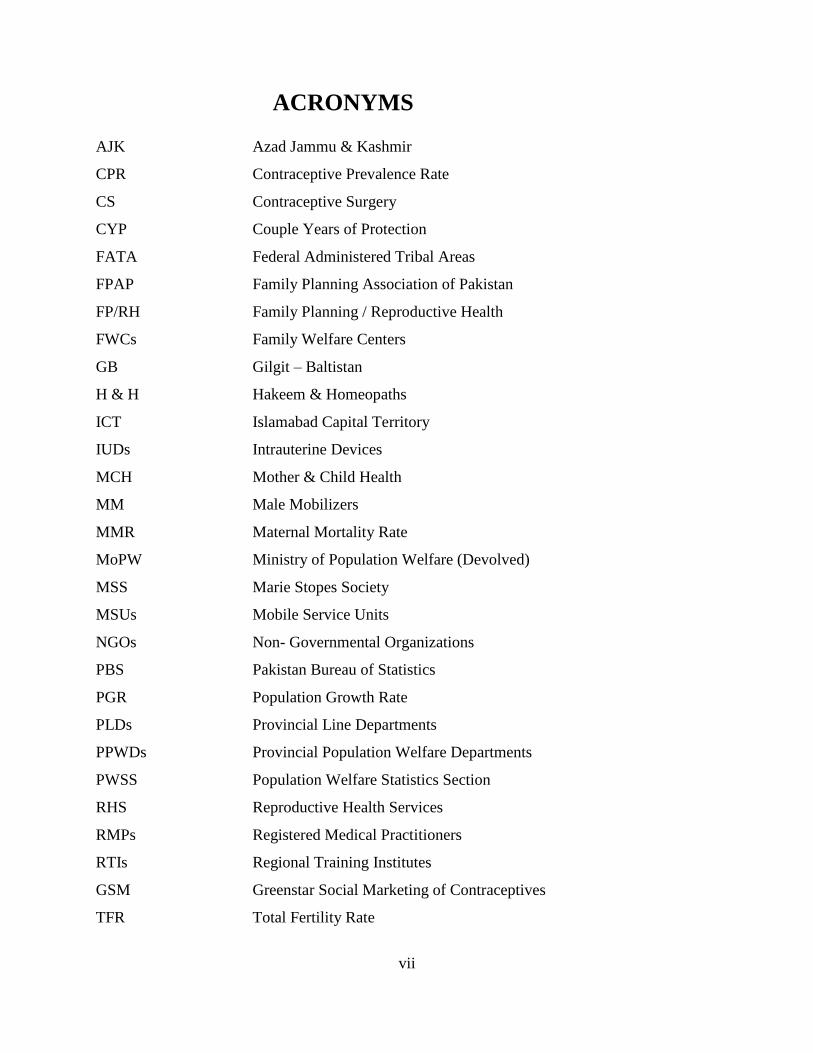
ACRONYMS AJK Azad Jammu & Kashmir
CPR Contraceptive Prevalence Rate
CS Contraceptive Surgery
CYP Couple Years of Protection
FATA Federal Administered Tribal Areas
FPAP Family Planning Association of Pakistan
FP/RH Family Planning / Reproductive Health
FWCs Family Welfare Centers
GB Gilgit – Baltistan
H & H Hakeem & Homeopaths
ICT Islamabad Capital Territory
IUDs Intrauterine Devices
MCH Mother & Child Health
MM
MMR
Male Mobilizers
Maternal Mortality Rate
MoPW Ministry of Population Welfare (Devolved)
MSS Marie Stopes Society
MSUs Mobile Service Units
NGOs Non- Governmental Organizations
PBS Pakistan Bureau of Statistics
PGR Population Growth Rate
PLDs Provincial Line Departments
PPWDs Provincial Population Welfare Departments
PWSS Population Welfare Statistics Section
RHS Reproductive Health Services
RMPs Registered Medical Practitioners
RTIs Regional Training Institutes
GSM Greenstar Social Marketing of Contraceptives
TFR Total Fertility Rate
vii

viii
SUMMARY
The profile of contraceptive performance in 2014–15, compared with the preceding year
2013–14 is summarized as under:-
a) The overall Contraceptive Performance for the year 2014-15 in terms of Couple Years of
Protection (CYP) has decreased by 7.2% in comparison with the last year 2013-14.
b) The Province-wise profile of CYP indicates a decrease in all provinces, i.e. Punjab
(13.4%), Sindh (2.2%), Khyber Pakhtunkhwa (10.2%) and Balochistan (1.3%).
Significant decrease in progress of Punjab for 2014-15 over 2013-14 is due to shortage of
technical staff i.e. Family Welfare Councilors/Workers and Women Medical Officers,
coupled with some other factors like engagement of staff in refresher training; low
clientage due to severe weather conditions & heavy rains; shifting of Family Welfare
Centers to Health Outlets and insufficient contraceptive availability in some districts.
Significant decrease in progress of Khyber Pakhtunkhwa for 2014-15 over 2013-14 is due
to completion of project life and resulted in termination of 550 FWCs project employees
along-with deregistration of 480 Male Mobilizers by June, 2014. As far as the district
Islamabad and Gilgit-Baltistan are concerned, the contraceptive performance has depicted
a decrease of 0.1% and 19.4% respectively, compared with the previous year. Significant
decrease in progress of GB during 2014-15 over 2013-14 is due to shortage of
contraceptive (Norigest), poor performance (low sale of contraceptives) of Male
Mobilizers and declined progress of MSU component. During Oct-Dec, 2013, a total 51
MSU camps were arranged whereas during Oct- Dec, 2014 only 13 MSU camps were
held. While the performance of AJK and FATA has been increased by 43.7% and 2.9%
respectively for 2014-15 compared with the year 2013-14. Significant increase in progress
of AJK for 2014-15 over 2013-14 is due to availability of medicines and increased
frequency of mobile camping.
c) Method-wise comparison of CYP has shown an increase in new method Norplant
(227.5%) whereas a decrease in Condoms (6.7%), Oral Pills (7.3%), IUDs (9.3%),
Injectables (4.8%) and Contraceptive Surgery cases (5.4%) has been observed, compared
with the previous year. The new method Norplant is included in Government Sector
Population Welfare Programme as well as Private Sector in 2014-15 and noted a
significant increase when compared with 2013-14.
ix
d) Outlet-wise CYP during the year 2014-15 compared with year 2013-14, has shown an
increase of 1.2% in Reproductive Health Services-A(RHS-A) Centers, 3.1% in Regional
Training Institutes (RTIs), Whereas performance has decreased 10.3% in Family Welfare
Centers (FWCs), 54.8% in RHS-B centres, 13.0% in Mobile Service Units (MSUs),
11.9% in Hakeems and Homeopaths (H&H), 32.3% in Male Mobilizers (MM), 64.2% in
Provincial Line Departments (PLDs) and 27.5% in Registered Medical Practitioners
(RMPs).
e) For NGO sector, an increase has been observed in the performance of Rahnuma Family
Planning Association of Pakistan (FPAP) (15.8%) and in Marie Stopes Society of
Pakistan (MSS) (33.9%) in the year 2014-15 compared to year 2013-14. Significant
increase in the performance of Rahnuma FPAP during 2014-15 over 2013-14 is due to
skill-based training & refreshers of more than 100 service providers on comprehensive
package of modern contraceptive methods with focus on long term permanent methods.
Surgical intervention specially tub-ligation and non scalpel vasectomy were strengthened;
staff was trained for extending these intervention through static & mobile camps and
provision family planning services through mobile service units especially in
humanitarian settings. Significant increase in the progress of Marie Stopes Society (MSS)
for 2014-15 over 2013-14 is due to rapid increased number of Social Franchise Units
along-with Field Health Educators; community based Private Providers (PK Providers)
and mobile outreach camps. However, the performance of Greenstar Social Marketing
(GSM) has decreased by 30.5%. Significant decrease in progress of Greenstar (GSM) for
2014-15 over 2013-14 is due to restructuring of its network, IPC activities remain
stagnant during the period, halted community-level demand generation activities; less
emphasis on VSC (Volunteer Surgery Contraceptive) services; increase in prices of
injectables coupled with adverse variance in commercial sales due to distributor
bottleneck in supplying to the smaller and remote provider’s clinic & pharmacies, in that
time period.
f) The overall Contraceptive Prevalence Rate (CPR) by modern methods, during 2014-15 is
25.54% which is lower than 27.41% in the year 2013-14. The CPR among the provinces
has been witnessed in Punjab (16.65%), Sindh (12.10%), Khyber Pakhtunkhwa (21.78%)
and Balochistan (6.93%). The highest CPR has been observed in the Federal district
Islamabad (41.36%).
x
1
1. INTRODUCTION
At present, Pakistan is the 6th most populous country in the world with estimated projected
population of 191.71 million and Growth Rate of 1.92 percent. The population growth is one of
the key factor that has a strong effect on economic development of a country. High population
growth not only puts a country’s economic resources under stress, but also increase
dependency ratio of young people and thereby constrain the productivity growth in the
economy.
Pakistan population is projected to increase to over 227 million by 2025. It is well
established fact that, other than oil rich economies, no country can prosperous without a radical
reduction in its population growth rate. As such, the need for lowering the growth rate of
population is more urgent than ever. Another positive impact of the declining fertility rates
during this period will create a demographic dividend, in which the dependency rate (the ratio
of working to non-working people, i.e. adults verses children and old people) will fall. This can
create an opportunity for the country to boost its productive capacity because of the increase in
the supply of human resources. This demographic dividend as a window of opportunity will be
available till 2045 beyond which aging trend will set in. Thus, reduction in population growth
through accelerated family planning efforts, is the need of the hour.
Though, reduction in population growth is one of the top priorities of the government of
Pakistan to maintain balance between country’s resources and population. However, according
to the Economic Survey of Pakistan, 2014-15, Pakistan is still lagging behind other
neighboring countries in all Family Planning indicators (TFR, CPR, PGR & MMR etc.) except
Afghanistan. In this context, Family Planning Programs can contribute significantly as there is
negative correlation between the Total Fertility Rate (TFR) and the Contraceptive Prevalence
Rate (CPR). The decline in the TFR could be more substantial if there is greater use of
contraceptives in the country. Use of contraceptives can be increased through female literacy,
role of women in decision making, awareness through media and easy access to contraceptive
techniques and tools. Keeping in view the key role of contraceptives in the reduction of TFR,
this report is an effort to have an up-to-date data on the contraceptives provided in the market
by the government and private stakeholders under the population welfare program.
1.1 History of Family Planning Program- in Pakistan
Recognizing the consequences of high Population Growth Rate (PGR) on the economic
and social development programs, family planning activities were started in Pakistan on
limited scale in the First Five Year National Development Plan (1955-1960) through voluntary
organizations. In the Second Five –Year Plan (1960-65), however, family planning services
were dispensed through the health infrastructure. In the 1960s, Pakistan was at the vanguard of
2
family planning, becoming one of the first countries in the world, to develop a national
Population Policy. Again, Family Planning gained priority in the Third Five year Plan (1965-
1970), when an independent setup was established for managing and executing the Population
Welfare Program. Institutional arrangements for the program attained the status of an
independent ministry on 12th June, 1990. Pakistan's first Family Planning Scheme was a part of
the country's Third Five Year Plan (1965–1970). This scheme became the template for all
subsequent family planning strategies. The scheme's goal was to have a vast impact in the
shortest time possible, with a reduction of the birth rate from 50 to 40 per 1000 by 1970. The
program witnessed a positive change and received sustained political support from 1988 to
2002 and, as a signatory to the Program of Action developed at the International Conference on
Population and Development at Cairo in 1994, Pakistan pledged to provide universal access to
family planning by 2010. There was consistency and continuity in the operations during these
years, however that initial wave of progress has stalled. Today only one-fourth of married or
in-union Pakistani women use modern contraceptive.
Though Pakistan was one of the first Asian countries to begin a family planning program
with some help from international donors, fertility has declined slower than in neighbouring
countries. Historical & political strife and cultural restrictions on women constraining their
empowerment have hampered implementation of family planning strategies throughout the
country. Besides this, most women say that they do not want any more children or would like
to wait a period of time before their next pregnancy, don’t have access to the contraceptive
resources. So unmet need of contraceptives is also a big obstacle in the effective
implementation of family planning program.
In this scenario, the 2012 London Summit on family planning was a transformational
moment that inspired the current FP2020 movement, in which leaders from around the world
committed to expanding contraceptive access to an additional 120 million women and girls in
the world’s 69 poorest countries by the year 2020. At 2012 London Summit on family
Planning, Pakistan committed to increasing the contraceptive prevalence rate to 55% by 2020.
The obstacles to success are many as also pointed out earlier including political upheaval,
social constraints, women’s low status and limited autonomy, yet positive steps are being taken
on the national & regional levels, under the auspices of FP2020 movement.
1.2 Review of Organizational Pursuits of Population Welfare Program
In pursuance to 18th Constitutional Amendment Act 2010, the functions of Collection,
Maintenance and Analysis of Population Statistics, handled earlier by the Ministry of
Population Welfare (MoPW) have been relocated to Statistics Division (Pakistan Bureau of
Statistics). To implement the decision of the Government of Pakistan, the Statistics Division
3
has established a new section in PBS entitled “Population Welfare Statistics Section (PWSS)”
with the following objectives:
a. To collect, compile and disseminate contraceptive performance data on monthly,
quarterly and yearly basis at provincial and national level;
b. To maintain data base on contraceptive services statistics;
c. To carry out periodic analysis of contraceptive performance statistics and
d. To develop liaison with national & international statistical agencies
1.3 Methodology
As per past practice in the Ministry of Population Welfare, the Pakistan Bureau of
Statistics collect contraceptive performance data on monthly basis by post, through e-mail and
by fax from the Provincial Population Welfare Departments (PWDs); Population Welfare
Departments AJK, GB ,FATA; District Population Welfare Office(ICT), Islamabad; Family
Planning Association of Pakistan (FPAP) ; Marie Stopes Society of Pakistan (MSS); Greenstar
Social Marketing of Contraceptives (GSM) and Regional Training Institutes (RTIs). After
careful editing and coding, the data is classified according to tabulation plan and data
processing is undertaken at Data Processing Centre of PBS.
The data is entered on monthly basis and consolidated after three months, to compile the
quarterly performance report. At the end of financial year, the performance of all four quarters is
combined together to compile the annual report. In the current annual report, the percentage
change in the contraceptive performance for the financial year 2014-15 using Couple Years of
Protection (CYP) has been compared with the last year (2013-14). Contraceptive Prevalence
Rate (CPR) on the basis of Modern Methods is also estimated to gauge the birth control process
in the country. Methodology involved in the calculation of Couple Years of Protection (CYP)
and Contraceptive Prevalence Rate (CPR) is detailed in the proceeding text. It is worthy to
mention here that efforts are under way to collect the data relating to Family Planning services
rendered by Department of Health including the contribution of Lady Health Workers that
includes holding meeting with the concerned stakeholders in collaboration with Population
Council and the development of software / application for on-line data supply from the
stakeholders, as decided in the meetings of technical committee, held during the last year.
1.3.1 Couple Years of Protection (CYP)
The term Couple Years of Protection (CYP) is one of several commonly used indicators
to assess internationally the family planning efforts. It is the protection provided by
4
contraceptive methods during one-year period, based upon the volume of all contraceptives
sold or distributed to clients during that period. It is also an indirect estimate of birth control.
CONVERSION FORMULAE FOR COUPLE YEARS OF PROTECTION (CYP)
144 UNITS OF CONDOM = 1 CYP
15 CYCLES OF ORAL PILL = 1 CYP
1 INSERTION OF IUD = 3.5 CYP
5 VIALS OF INJECTABLE = 1 CYP
1 CASE OF CONTRACEPTIVE SURGERY (CS) = 12.5 CYP
1.3.2 Contraceptive Prevalence Rate (CPR)
The CPR is the percentage of women who are practicing, or whose sexual partners are
practicing, any form of contraception. It is usually measured for married women of
reproductive age i.e., 15-49 years. The Contraceptive Prevalence Rate (CPR) of Pakistan is
calculated on the basis of consumption of contraceptive by converting number of units sold
into users with the help of the formulae given in the following table:
CONVERSION FORMULAE FOR USERS
100 UNITS OF CONDOM = 1 USER
13 CYCLES OF ORAL PILL = 1 USER
1 INSERTION OF IUD = 1 USER
5 VIALS OF INJECTABLE = 1 USER
1 CONTRACEPTIVE SURGERY (CS) CASE = 1 USER
Thereafter, number of users is divided by number of Married Women of Reproductive
Age (MWRA), symbolically represented as under:
No. of Users
CPR (%) = *100
MWRA
1.4 Service Delivery Units
The following Service Delivery Units are spread all over in the country to facilitate the
users for their needs:
1.4.1 Family Welfare Centre (FWC)
The FWC is the cornerstone of Pakistan’s Population Welfare Programme. These centers
constitute the most extensive institutional network in the country for promoting and delivering
5
family planning services in both urban and rural areas. As a static facility, it serves a
population of about 7000; while operating through its satellites clinics and outreach facility, a
FWC covers a population of about 12000.
1.4.2 Reproductive Health Services Centers
The Reproductive Health Service Centers are the major clinical component of the
Pakistan’s Population Welfare Programme. They provide services through RHS-A Centers and
RHS-B Centers.The RHS-A centers are hospital-based service delivery units. They provide
contraceptive surgery facilities for women and men with safe and effective backup medical
support.Well-established hospitals and clinics with fully-equipped operating facilities
(operation theatre facilities, beds for admission, post-operative care, sterilization and
emergency resuscitation equipment, etc.) and trained work force.
1.4.3 Mobile Service Units (MSUs)
The MSUs are the flagship of the Population Welfare Programme. These provide a
package of quality Family Planning/Reproductive Health (FP/RH) services to the people of
those remote villages and hamlets where no other health facility exists. The MSUs operate
from specially-designed vehicles which carry with-in them all the facilities of a mini clinic
ensuring complete privacy for simple gynecological procedures.
1.4.4 Regional Training Institutes (RTIs)
The RTIs provide skill-based training in FP/RH for all categories of health care providers
i.e. Doctors, medical students, nurses, student nurses, lady health visitors and other paramedics.
The RTIs also undertake activities focused on raising the awareness level of hakims,
homeopaths, community health workers, teachers and college students.
1.4.5 NGO Sector
There are many NGOs that are providing family planning & reproductive health services
in the country. However, PBS is collecting contraceptive performance data from the following
three eminent NGOs. Their service delivery mechanism is deliberated below:
i. Rahnuma Family Planning Association of Pakistan (FPAP): At present Rahnuma
FPAP is located in five Regional Offices (Sind, KPK, Islamabad/AJK/Gilgit-Baltistan,
Punjab and Baluchistan) and Fourteen Program Management Offices (PMOs) having
extensive service delivery network.
6
ii. Marie Stopes Society of Pakistan (MSS): MSS is providing family planning services
through its Behtar Zindagi Centres (BZCs), Suraj Social Franchise (SF) Centres,
Maternal and Child Health (MCH) Centres, Field-based Health Educators (FHEs),
Reproductive Health Private Providers (RHPPs) and Outreach Services/Sites.
iii. Greenstar Social Marketing of Pakistan (GSM): Greenstar is also one of the eminent
private sector provider of reproductive health services. Greenstar is contributing in the
improvement of the quality of life among low-income people throughout Pakistan by
increasing access to and use of health products, services and information through private
sector franchise clinics.
1.5 Data Sources
The Contraceptive Performance Report is prepared on the basis of data received from the
following sources:
Provincial Population Welfare Departments (PPWDs);
Population Welfare Departments AJK, GB and FATA;
The District Population Welfare Office, (ICT), Islamabad
Rahnuma Family Planning Association of Pakistan (FPAP) ;
Marie Stopes Society of Pakistan (MSS);
Greenstar Social Marketing (GSM);
Regional Training Institutes (RTIs) and
1.6 Flow of Data/Performance Reports
The District Population Welfare Office is the main operational tier of Population Welfare
Program. It is responsible for actual implementation of population welfare activities in the
field. For the purpose, it collects Contraceptive Performance Reports of all the reporting units
(FWCs, RHS-A, MSUs etc.). After consolidating these reports, are transmitted to the
provincial Population Welfare Department. The provincial Population Welfare Departments
forwarded these reports to Pakistan Bureau of Statistics. Apart from the provincial
departments, FATA, AJK, GB and few prominent NGOs i.e. Rahnuma (FPAP); Marie Stopes
and Greenstar (GSM) also provide Contraceptive Performance data to PBS, that are being
utilized for the preparation of contraceptive performance reports.
7
1.7 Objectives:
Main objectives of the Contraceptive Performance Report are as following:
o To assess the province/sector-wise, method-wise and outlet-wise contraceptive
performance using Couple Year of Protection (CYP).
o To provide basis for estimating annual contraceptives requirement and
distribution in the country.
o To calculate Contraceptive Prevalence Rate (CPR) for assessing the birth control
strategy of the country

8
9
2 RESULTS AND DISCUSSION
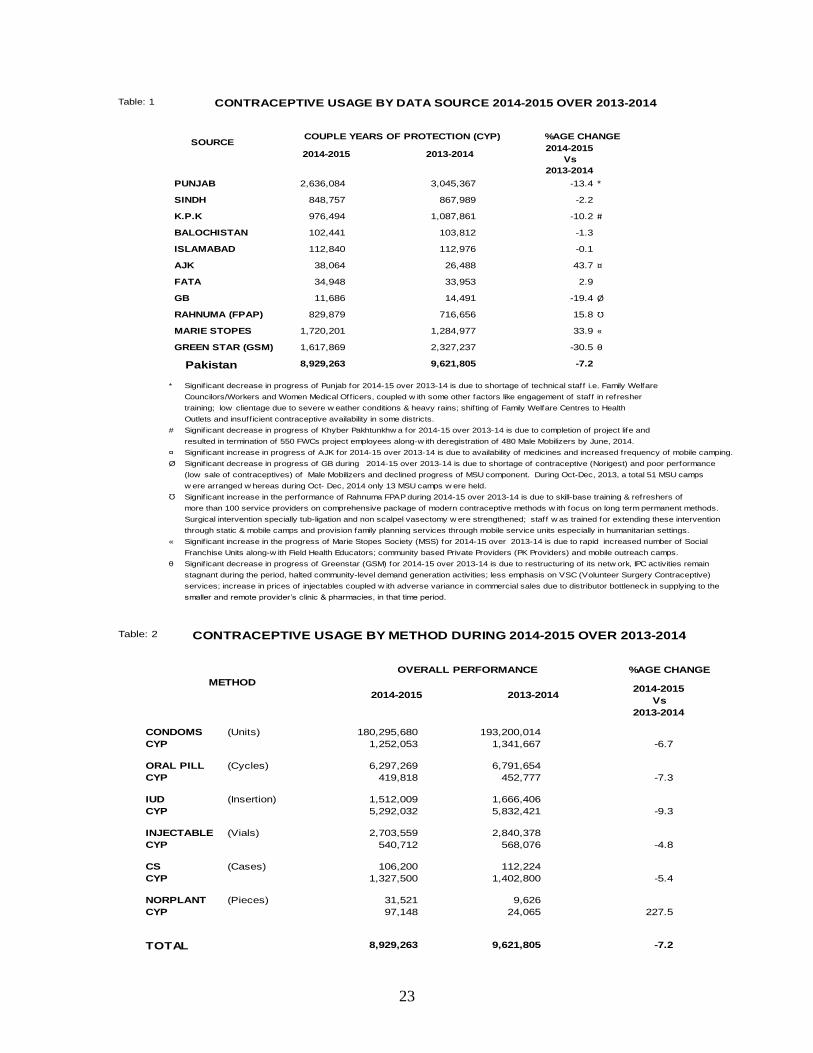
2.1 Source-wise Comparison in terms of Couple Years of Protection
The province/sector-wise comparison of contraceptive performance during the year
2014-15 in terms of Couple Year of Protection (CYP) has been made with the previous year
2013-14 in Table-1 annexed with the report.
At national level, a decrease of 7.2% has been observed for all program and non-program
outlets during the year (2014-15) compared with 2013 -14.
At provincial level, contraceptive performance of the year 2014-15 compared with the
previous year, a decrease has been witnessed in all provinces i.e. Punjab (13.4%), Sindh
(2.2%), Khyber Pakhtunkhwa (10.2%) and Balochistan (1.3%). Significant decrease in
progress of Punjab for 2014-15 over 2013-14 is due to shortage of technical staff i.e. Family
Welfare Councilors/Workers and Women Medical Officers, coupled with some other factors
like engagement of staff in refresher training; low clientage due to severe weather conditions
& heavy rains; shifting of Family Welfare Centers to Health Outlets and insufficient
contraceptive availability in some districts. Significant decrease in progress of Khyber
Pakhtunkhwa for 2014-15 over 2013-14 is due to completion of project life and resulted in
termination of 550 FWCs project employees along-with deregistration of 480 Male Mobilizers
by June, 2014.
As far as the district Islamabad and Gilgit-Baltistan are concerned, the contraceptive
performance for the year 2014-15 compared with year 2013-14 has depicted a decrease of 0.1%
and 19.4% respectively. Significant decrease in progress of GB during 2014-15 over 2013-14 is
due to shortage of contraceptive (Norigest), poor performance (low sale of contraceptives) of
Male Mobilizers and declined progress of MSU component. During October-December 2013, a
total 51 MSU camps were arranged whereas during Oct- Dec, 2014 only 13 MSU camps were
held. While the performance of AJK and FATA has been increased by 43.7% and 2.9%
respectively, for 2014-15 compared with year 2013-14. Significant increase in progress of AJK
for 2014-15 over 2013-14 is due to availability of medicines and increased frequency of mobile
camping.
For NGO sector, an increase has been observed in the performance of Rahnuma Family
Planning Association of Pakistan (FPAP) (15.8%) and in Marie Stopes Society of Pakistan
(MSS) (33.9%) in the year 2014-15 compared to year 2013-14. Significant increase in the
performance of Rahnuma FPAP during 2014-15 over 2013-14 is due to skill-based training &
refreshers of more than 100 service providers on comprehensive package of modern
contraceptive methods with focus on long term permanent methods. Surgical intervention
10
specially tub-ligation and non scalpel vasectomy were strengthened; staff was trained for
extending these intervention through static & mobile camps and provision family planning
services through mobile service units especially in humanitarian settings. Significant increase
in the progress of Marie Stopes Society (MSS) for 2014-15 over 2013-14 is due to rapid
increased number of Social Franchise Units along-with Field Health Educators; community
based Private Providers (PK Providers) and mobile outreach camps. However, the performance
of Greenstar Social Marketing (GSM) of contraceptive has decreased by 30.5%. Significant
decrease in progress of Greenstar (GSM) for 2014-15 over 2013-14 is due to restructuring of
its network, IPC activities remain stagnant during the period, halted community-level demand
generation activities; less emphasis on VSC (Volunteer Surgery Contraceptive) services;
increase in prices of injectables coupled with adverse variance in commercial sales due to
distributor bottleneck in supplying to the smaller and remote provider’s clinic & pharmacies,
in that time period.
2.2 Method-wise Comparison of Contraceptive Performance
In absolute terms, the contraceptive performance of program and non-program service
outlets have reported a sale of 180.296 million units of Condoms, 6.297 million cycles of Oral
Pills, 1.512 million insertions of Internal Uterine Devices (IUDs) and 2.704 million vials of
Injectables. In addition to this, a total 106,200 Contraceptive Surgery (CS) cases and 31,512
Norplant cases have been performed during the financial year 2014-15.
At national level, method-wise comparison during 2014-15 over 2013-14 has shown an
increase in new method Norplant (227.5%) whereas a decrease in Condoms (6.7%), Oral Pills
(7.3%), IUDs (9.3%), Injectables (4.8%) and Contraceptive Surgery cases (5.4%) has been
observed. The details are shown in Table-2 at the end of report.
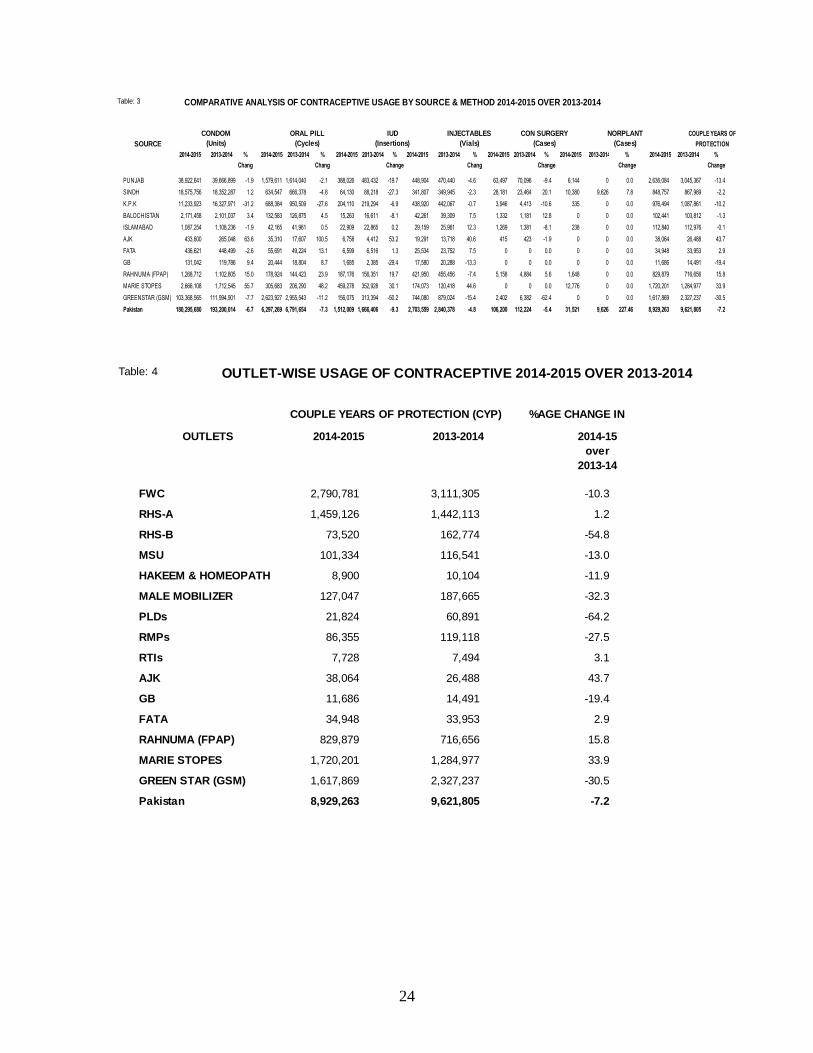
At provincial level, method-wise contraceptives performance in terms of CYP, for the
year 2014-15 is highlighted in Table-3 and related description is given in the proceeding
paragraphs.
In case of condoms, method-wise performance of year 2014-15 compared with the last
year (2013-14), has reflected an increase in Sindh (1.2%), Baluchistan (3.4%) AJK (63.6%),
Gilgit-Baltistan (9.4%), Rahnuma FPAP (15.0%), Marie Stopes (55.7%). However, a decrease
in Punjab (1.9%), Khyber Pakhtunkhwa (31.2%), Islamabad (1.9%), FATA (2.6%) and GSM
(7.7%) has been noticed.
For Oral Pills, an increase has been witnessed in Balochistan (4.5%), Islamabad (0.5%),
AJK (100.5%), FATA (13.1%), Gilgit-Baltistan (8.7%), Rahnuma FPAP (23.9%) and Marie
Stopes Society (48.2%), while decrease has been shown in Punjab (2.1%), Sindh (4.8%),
Khyber Pakhtunkhwa (27.6%), and GSM (11.2%).
11
For IUDs, an increase has been observed in Islamabad (0.2%), AJK (53.2%), FATA
(1.3%), Rahnuma FPAP (19.7%) and Marie Stopes Society (30.1%), while a decrease has
been depicted in Punjab (19.7%), Sindh (27.3%), Khyber Pakhtunkhwa (6.9%), Balochistan
(8.1%), , Gilgit-Baltistan (29.4%) and GSM (50.2%).
In case of Injectables, an increase has been observed in Balochistan (7.5%), Islamabad
(12.3%), AJK (40.6%), FATA (7.5%) and Marie Stopes Society (44.6%) whereas a decrease
has been observed in Punjab (4.6%), Sindh (2.3%), Khyber Pakhtunkhwa (0.7%),
Gilgit-Baltistan (13.3%), Rahnuma FPAP (7.4%) and GSM (15.4%).
If we look into the figure of Contraceptives Surgery cases, an increase has been recorded
in Sindh (20.1%), Balochistan (12.8%) and Rahnuma FPAP (5.6%) whereas a decrease has
been observed in Punjab (9.4%), KPK (10.6%), Islamabad (8.1%), AJK (1.9%) and GSM
(62.4%). A new modern contraceptive method Norplant has been included in this report.
During the year 2014-15, 6144 cases of Norplant in Punjab, 10,380 cases of Norplant in Sindh,
335 cases of Norplant in Khyber Pakhtunkhwa, 238 cases of Norplant in Islamabad, 1648 cases
of Norplant in Rahnuma FPAP and 12776 cases of Norplant in MSS were performed.
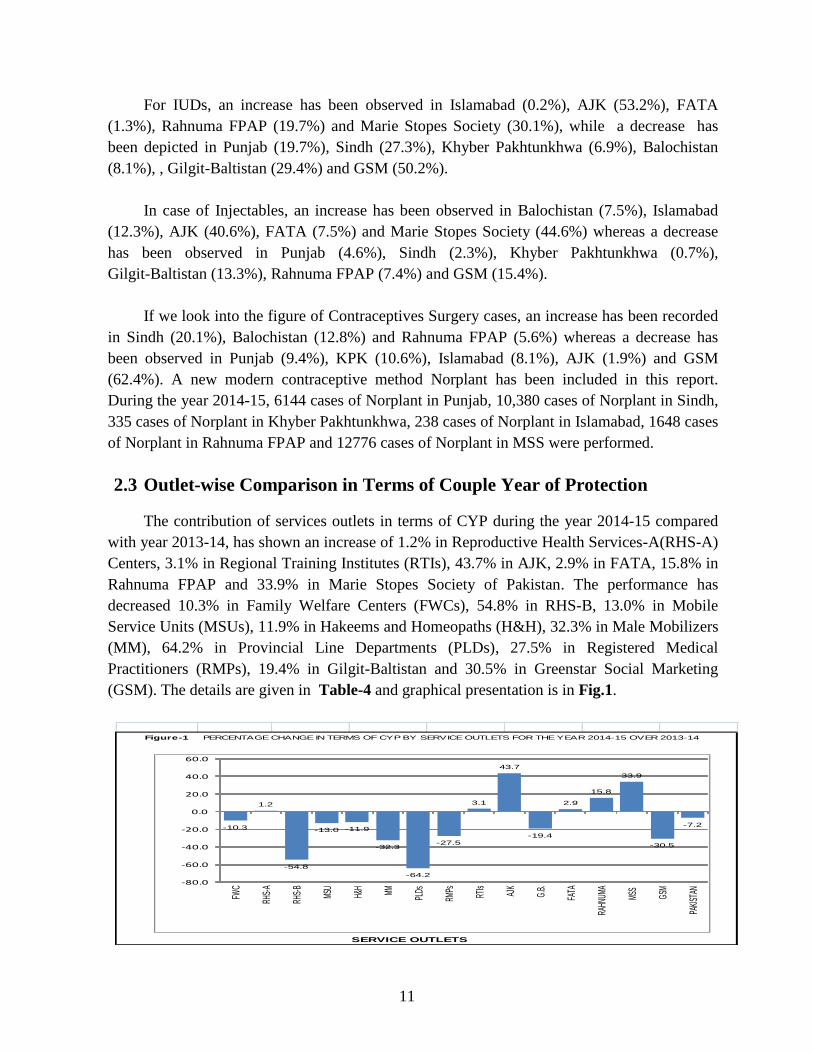
2.3 Outlet-wise Comparison in Terms of Couple Year of Protection
The contribution of services outlets in terms of CYP during the year 2014-15 compared
with year 2013-14, has shown an increase of 1.2% in Reproductive Health Services-A(RHS-A)
Centers, 3.1% in Regional Training Institutes (RTIs), 43.7% in AJK, 2.9% in FATA, 15.8% in
Rahnuma FPAP and 33.9% in Marie Stopes Society of Pakistan. The performance has
decreased 10.3% in Family Welfare Centers (FWCs), 54.8% in RHS-B, 13.0% in Mobile
Service Units (MSUs), 11.9% in Hakeems and Homeopaths (H&H), 32.3% in Male Mobilizers
(MM), 64.2% in Provincial Line Departments (PLDs), 27.5% in Registered Medical
Practitioners (RMPs), 19.4% in Gilgit-Baltistan and 30.5% in Greenstar Social Marketing
(GSM). The details are given in Table-4 and graphical presentation is in Fig.1.
Figure-1 PERCENTAGE CHANGE IN TERMS OF CYP BY SERVICE OUTLETS FOR THE YEAR 2014-15 OVER 2013-14
SERVICE OUTLETS
-10.3
1.2
-54.8
-13.0 -11.9
-32.3
-64.2
-27.5
3.1
43.7
-19.4
2.9
15.8
33.9
-30.5
-7.2
-80.0
-60.0
-40.0
-20.0
0.0
20.0
40.0
60.0
FWC
RHS-
A
RHS-
B
MSU
H&H
MM PLDs
RMPs
RTIs
AJK
G.B.
FATA
RAHN
UMA
MSS
GSM
PAKI
STAN
12
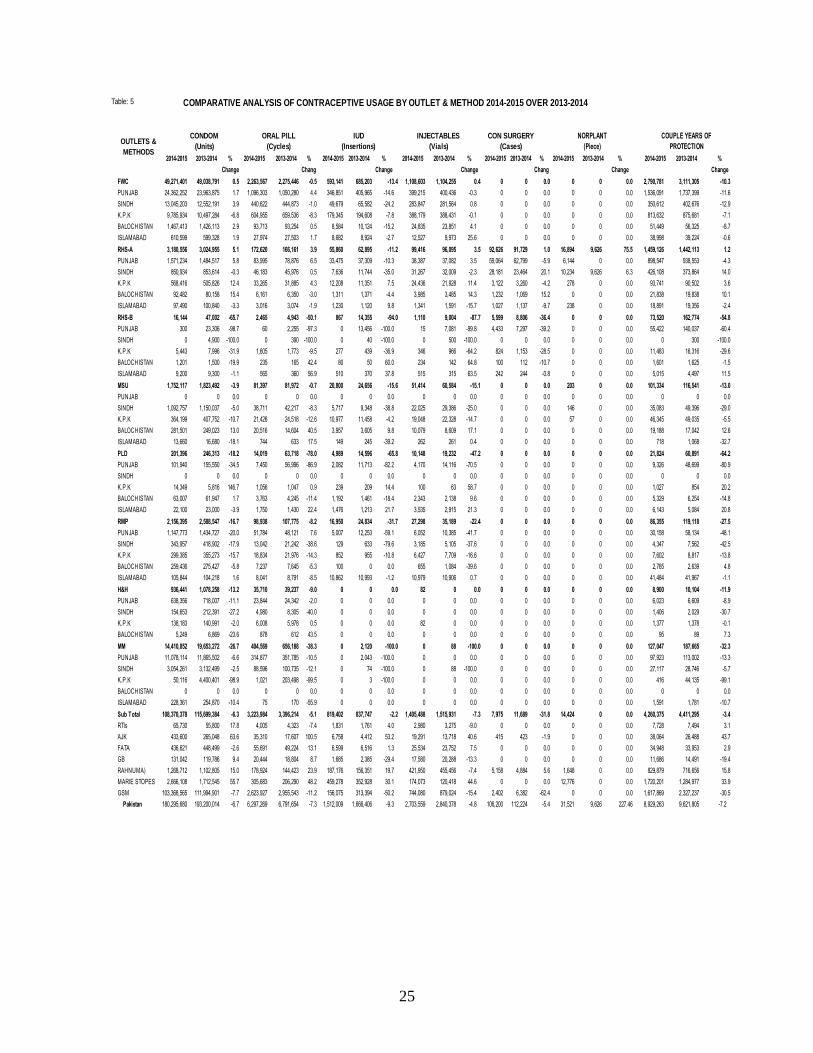
2.4 Comparative Outlet-wise Contraceptive Performance of Delivery Services
The Outlet/Province/Sector-wise comparison of Contraceptives Performance for Delivery
Services has been given in detail at Table-5. Discussion on the results is as under:
2.4.1 Family Welfare Centers (FWCs)
The performance of FWCs in terms of CYP has decreased by 10.3%, at the national level
during the year 2014-15, compared with the last year (2013-14). At the provincial level,
decrease has been observed in all provinces i.e. Punjab (11.6%), Sindh (12.9%), Khyber
Pakhtunkhwa (7.1%), Balochistan (8.7%), whereas in Islamabad decrease is (0.6%). For
Method wise comparison, at national level, FWCs have shown an increase of 0.5% in
Condoms and 0.4% in Injectables while decrease has been witnessed in Oral Pills (0.5%) and
IUDs (13.4%).
2.4.2 Reproductive Health Services Centers (RHS-A)
The performance of RHS-A centers, at national level, during the year 2014-15 compared
with the last year (2013-14) in terms of CYP has increased by 1.2%. At provincial level, an
increase has been observed in Sindh (14%), Khyber Pakhtunkhwa (3.6%) and Balochistan
(10.1%), whereas decrease has been noted in Punjab (4.3%) and Islamabad (2.4%). Regarding
Method-wise comparison, the performance of RHS-A centers, at national level, has shown an
increase in Condoms (5.1%), Oral Pills (3.9%), Injectables (3.5%), Contraceptive Surgery
(1.0%) and Norplant (75.5%) whereas a decrease is witnessed in IUDs by 11.2%,.
2.4.3 Reproductive Health Services Centers (RHS-B)
The performance of RHS-B centers for the year 2014-15 compared with the last year, in
terms of CYP has decreased by 54.8%, at national level. At provincial level, decrease has been
observed in all provinces i.e. Punjab (60.4%), Sindh (100%), Khyber Pakhtunkhwa (29.6%),
and Balochistan (1.5%), whereas Islamabad has been reported increase of 11.5%. However for
Method wise comparison, the performance of RHS-B centers has shown a decrease in
Condoms (65.7%), Oral Pills (50.1%), IUDs (94.0%), Injectables (87.7%) and Contraceptive
Surgery cases (36.4%), at the national level.
2.4.4 Mobile Service Units (MSUs)
The performance of MSUs for the year 2014-15 compared with the year 2013-14, in
terms of CYP, has decreased by 13.0%, at national level. At provincial level, increase has been
witnessed in Balochistan (12.6%) whereas decrease has been observed in Sindh (29.0%),
Khyber Pakhtunkhwa (5.5%) and Islamabad (32.7%), however performance of MSUs of
Punjab has not been received. For Method wise comparison, the Performance of MSUs has
shown a decrease in Condoms (3.9%), Oral Pills (0.7%), IUDs (15.6%) and Injectables
(15.1%), at national level.
13
2.4.5 Provincial Line Departments (PLDs)
The performance of PLDs for 2014-15 compared with the last year (2013-14), in terms of
CYP, has decreased by 64.2%, at national level. At Provincial level, an increase has been
observed in Khyber Pakhtunkhwa (20.2%) and Islamabad (20.8%); whereas decrease has been
witnessed in Punjab (80.9%) and Balochistan (14.8%). Performance of PLDs of Sindh has not
been received. From Method-wise analysis, it has been computed that the performance has
decreased in Condoms (18.2%), Oral Pills (78.0%), IUDs (65.8%) and Injectables (47.2%), at
national level.
2.4.6 Registered Medical Practitioners (RMPs)
While comparing the performance of RMPs for the current year with the last year
(2013-14), in terms of CYP, a decrease of 27.5% has been observed, at national level. At
provincial level, an increase has been noticed in Balochistan (4.8%), whereas decline has been
reported in Punjab (48.1%), Sindh (42.5%), Khyber Pakhtunkhwa (13.8%) and in Islamabad
(1.1%). The method-wise performance of RMPs has shown a decrease in Condoms (16.7%),
Oral Pills (8.2%), IUD (31.7%) and Injectables (22.4%), at national level.
2.4.7 Hakeems and Homoeopaths (H&H)
In terms of CYP, a decrease of 11.9% has been observed in the performance of H&H
during the year 2014-15 compared with the year 2013-14, at national level. At provincial level,
increase is observed in Balochistan (7.3%) whereas decrease has been witnessed in Punjab
(8.9%), Sindh (30.7%) and Khyber Pakhtunkhwa (0.1%). The method-wise performance of
H&H for the year 2014-15 has shown a decrease in Condoms by 13.2% and in Oral Pills by
9.0%, at national level.
2.4.8 Male Mobilizer (MM)
In terms of CYP, a decrease has been observed in the performance of Male Mobilizer by
32.3%, at national level. At provincial level, decrease has been witnessed in Punjab (13.3%),
Sindh (5.7%), Khyber Pakhtukhwa (99.1%). The method-wise performance of MM has shown
a decrease in Condoms by 26.7% and in Oral Pills by 38.3%, at national level.
2.4.9 Azad Jammu & Kashmir (AJK)
The contraceptive performance during 2014-15 for AJK has increased in terms of CYP
by 43.7% over the previous year. While the method-wise performance, an increase has been
reported in Condoms (63.6%), Oral Pills (100.5%), IUDs (53.2%) and Injectables (40.6%)
whereas decrease has been reported in Contraceptive Surgery cases (1.9%).
2.4.10 Federally Administrative Tribal Area (FATA)
For FATA, the overall contraceptive performance for 2014-15 has shown an increase of
2.9%, in terms of CYP, compared with the last year (2013-14).The comparison of the
14
method-wise performance has depicted an increase in Oral Pills (13.1%) IUDs (1.3%) and
Injectables (7.5%) whereas decrease has been noted in Condoms (2.6 %).
2.4.11 Gilgit – Baltistan (GB)
The contraceptive performance of GB for the year 2014-15 has reported a decrease of
19.4% in terms of CYP. The method-wise analysis, increase has been observed for Condoms
(9.4%) and Oral Pills (8.7%) whereas decrease is noticed in IUDs (29.4%) and Injectables
(13.3%).
2.4.12 Rahnuma Family Planning Association of Pakistan (FPAP)
For Rahnuma (FPAP), the overall contraceptive performance for 2014-15 has shown an
increase by 15.8%, in terms of CYP, compared with the last year (2013-14).The comparison of
the method-wise performance has revealed an increase in Condoms (15.0 %), Oral Pills
(23.9%), IUDs (19.7%) and Contraceptive Surgery cases (5.6%) whereas decrease has been
noted in Injectables (7.4%).
2.4.13 Marie Stopes Society of Pakistan (MSS)
For MSS, the overall contraceptive performance for 2014-15 has shown an increase by
33.9%, in terms of CYP, compared with the last year (2013-14). The comparison of the
method-wise performance has witnessed an increase in Condoms (55.7 %), Oral Pills (48.2%),
IUDs (30.1%) and Injectables (44.6%).
2.4.14 Greenstar Social Marketing (GSM)
For GSM, the overall contraceptive performance for 2014-15 has noted a decrease of
30.5%, in terms of CYP, compared with the last year (2013-14).The comparison of the
method-wise performance has shown a decrease in Condoms (7.7 %), Oral Pills (11.2%), IUDs
(50.2%), Injectables (15.4%) and Contraceptive Surgery cases (62.4%).
2.5 Method and Outlet-wise Average Performance
Method and Outlet-wise Average performance for the Federal and Provincial setup
during the financial year 2014-15 is given in Table-6. The details are as follows:
2.5.1 Average performance of FWC by method
Among provinces, the highest average performance of FWC has been reported by Sindh
for Condoms i.e. 20,773 units, followed by 18,395 units in Khyber Pakhtunkhwa, 16,198 units
in Punjab and 9171 units in Balochistan were sold per FWC whereas 21,055 units per FWC
have been reported in Islamabad. The maximum numbers of 1137 cycles of Oral Pills were
dispensed by Khyber Pakhtunkhwa and the lowest 586 cycles were reported by FWCs of
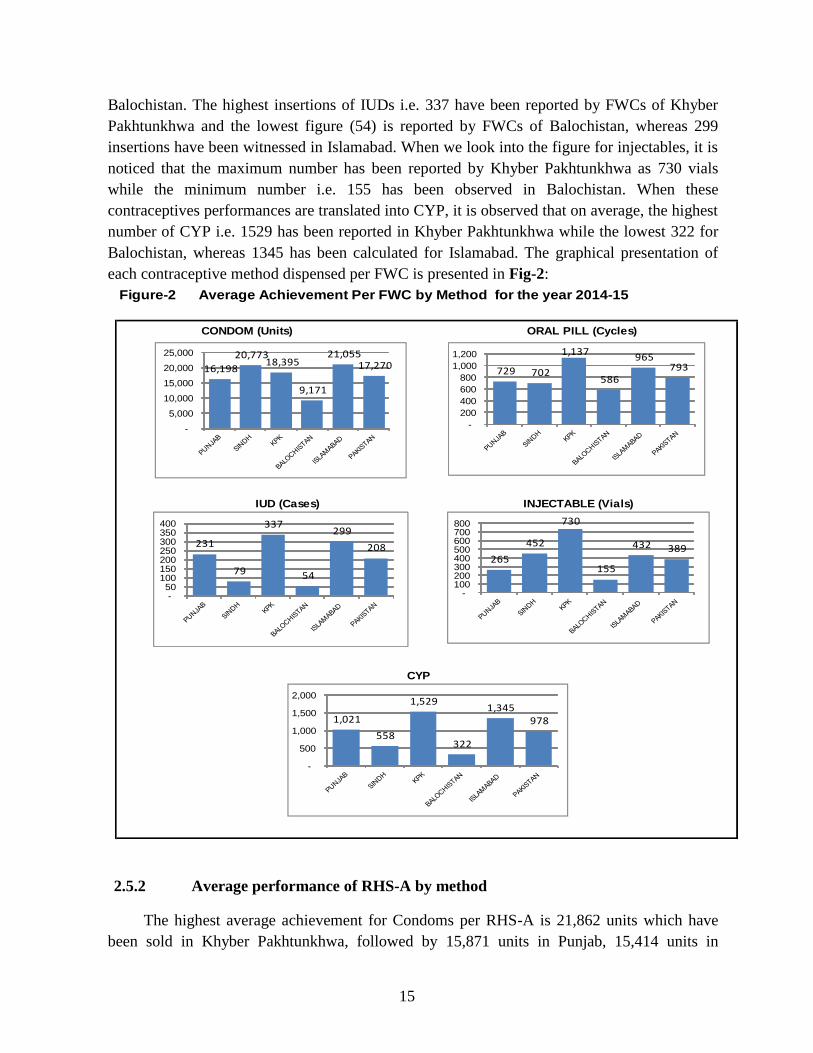
15
Balochistan. The highest insertions of IUDs i.e. 337 have been reported by FWCs of Khyber
Pakhtunkhwa and the lowest figure (54) is reported by FWCs of Balochistan, whereas 299
insertions have been witnessed in Islamabad. When we look into the figure for injectables, it is
noticed that the maximum number has been reported by Khyber Pakhtunkhwa as 730 vials
while the minimum number i.e. 155 has been observed in Balochistan. When these
contraceptives performances are translated into CYP, it is observed that on average, the highest
number of CYP i.e. 1529 has been reported in Khyber Pakhtunkhwa while the lowest 322 for
Balochistan, whereas 1345 has been calculated for Islamabad. The graphical presentation of
each contraceptive method dispensed per FWC is presented in Fig-2:
2.5.2 Average performance of RHS-A by method
The highest average achievement for Condoms per RHS-A is 21,862 units which have
been sold in Khyber Pakhtunkhwa, followed by 15,871 units in Punjab, 15,414 units in
Figure-2 Average Achievement Per FWC by Method for the year 2014-15
CONDOM (Units) ORAL PILL (Cycles)
IUD (Cases) INJECTABLE (Vials)
CYP
16,198
20,773 18,395
9,171
21,055 17,270
-
5,000
10,000
15,000
20,000
25,000
729 702
1,137
586
965 793
-
200
400
600
800
1,000
1,200
231
79
337
54
299
208
-50
100 150 200 250 300 350 400
265
452
730
155
432 389
-100 200 300 400 500 600 700 800
1,021
558
1,529
322
1,345 978
-
500
1,000
1,500
2,000
16
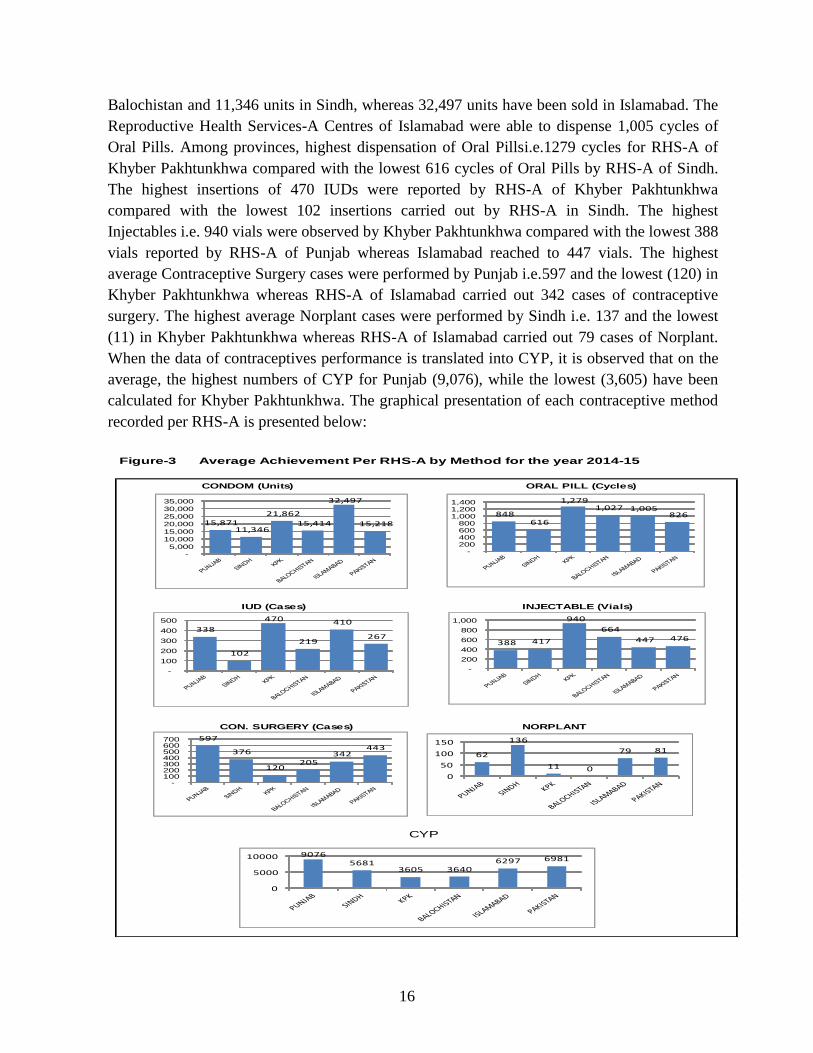
Balochistan and 11,346 units in Sindh, whereas 32,497 units have been sold in Islamabad. The
Reproductive Health Services-A Centres of Islamabad were able to dispense 1,005 cycles of
Oral Pills. Among provinces, highest dispensation of Oral Pillsi.e.1279 cycles for RHS-A of
Khyber Pakhtunkhwa compared with the lowest 616 cycles of Oral Pills by RHS-A of Sindh.
The highest insertions of 470 IUDs were reported by RHS-A of Khyber Pakhtunkhwa
compared with the lowest 102 insertions carried out by RHS-A in Sindh. The highest
Injectables i.e. 940 vials were observed by Khyber Pakhtunkhwa compared with the lowest 388
vials reported by RHS-A of Punjab whereas Islamabad reached to 447 vials. The highest
average Contraceptive Surgery cases were performed by Punjab i.e.597 and the lowest (120) in
Khyber Pakhtunkhwa whereas RHS-A of Islamabad carried out 342 cases of contraceptive
surgery. The highest average Norplant cases were performed by Sindh i.e. 137 and the lowest
(11) in Khyber Pakhtunkhwa whereas RHS-A of Islamabad carried out 79 cases of Norplant.
When the data of contraceptives performance is translated into CYP, it is observed that on the
average, the highest numbers of CYP for Punjab (9,076), while the lowest (3,605) have been
calculated for Khyber Pakhtunkhwa. The graphical presentation of each contraceptive method
recorded per RHS-A is presented below:
Figure-3 Average Achievement Per RHS-A by Method for the year 2014-15
CONDOM (Units) ORAL PILL (Cycles)
IUD (Cases) INJECTABLE (Vials)
CON. SURGERY (Cases) NORPLANT
CYP
15,871 11,346
21,862
15,414
32,497
15,218
-
5,000
10,000
15,000
20,000
25,000
30,000
35,000
848 616
1,279 1,027 1,005
826
-200 400 600 800
1,000 1,200 1,400
338
102
470
219
410
267
-
100
200
300
400
500
388 417
940
664
447 476
-
200
400
600
800
1,000
597
376
120 205
342 443
-100 200 300 400 500 600 700
62
136
11 0
79 81
0
50
100
150
90765681
3605 36406297 6981
0
5000
10000
17
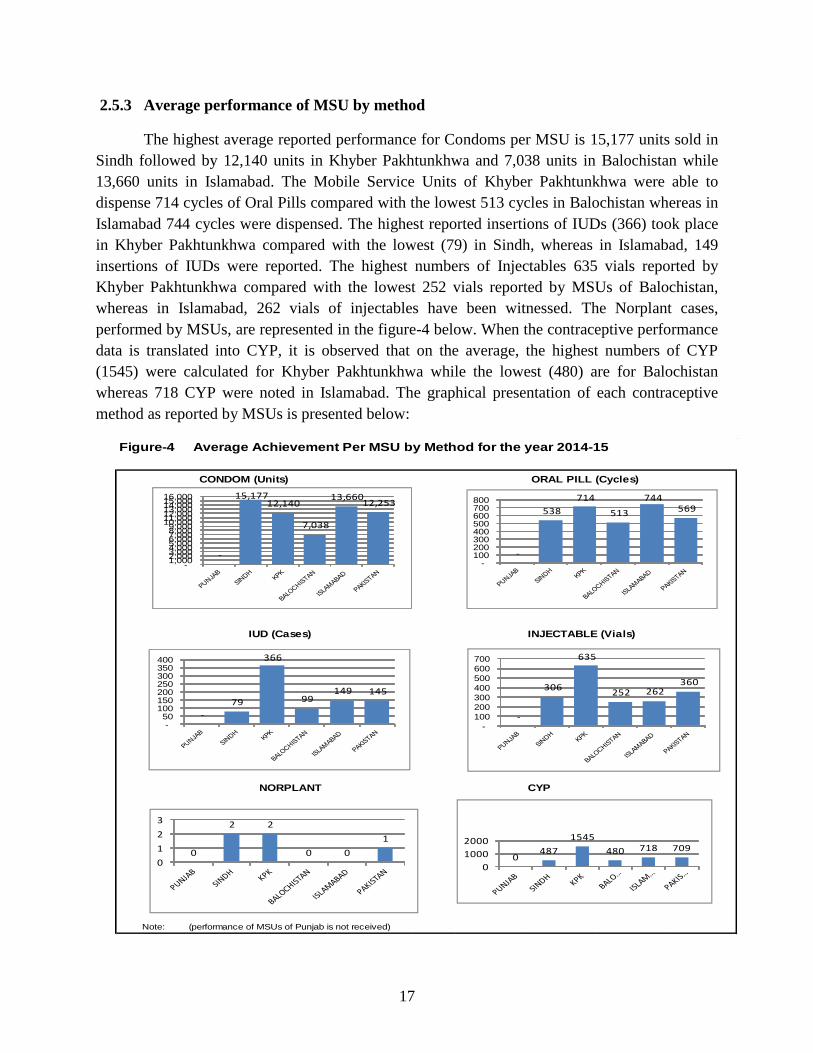
2.5.3 Average performance of MSU by method
The highest average reported performance for Condoms per MSU is 15,177 units sold in
Sindh followed by 12,140 units in Khyber Pakhtunkhwa and 7,038 units in Balochistan while
13,660 units in Islamabad. The Mobile Service Units of Khyber Pakhtunkhwa were able to
dispense 714 cycles of Oral Pills compared with the lowest 513 cycles in Balochistan whereas in
Islamabad 744 cycles were dispensed. The highest reported insertions of IUDs (366) took place
in Khyber Pakhtunkhwa compared with the lowest (79) in Sindh, whereas in Islamabad, 149
insertions of IUDs were reported. The highest numbers of Injectables 635 vials reported by
Khyber Pakhtunkhwa compared with the lowest 252 vials reported by MSUs of Balochistan,
whereas in Islamabad, 262 vials of injectables have been witnessed. The Norplant cases,
performed by MSUs, are represented in the figure-4 below. When the contraceptive performance
data is translated into CYP, it is observed that on the average, the highest numbers of CYP
(1545) were calculated for Khyber Pakhtunkhwa while the lowest (480) are for Balochistan
whereas 718 CYP were noted in Islamabad. The graphical presentation of each contraceptive
method as reported by MSUs is presented below:
Figure-4 Average Achievement Per MSU by Method for the year 2014-15
CONDOM (Units) ORAL PILL (Cycles)
IUD (Cases) INJECTABLE (Vials)
NORPLANT CYP
Note: (performance of MSUs of Punjab is not received)
-
15,177 12,140
7,038
13,660 12,253
-1,000 2,000 3,000 4,000 5,000 6,000 7,000 8,000 9,000
10,000 11,000 12,000 13,000 14,000 15,000 16,000
-
538
714
513
744 569
-100 200 300 400 500 600 700 800
-
79
366
99 149 145
-50
100 150 200 250 300 350 400
-
306
635
252 262 360
-
100
200
300
400
500
600
700
0
2 2
0 0
1
0
1
2
3
0487
1545
480 718 709
0
1000
2000
18
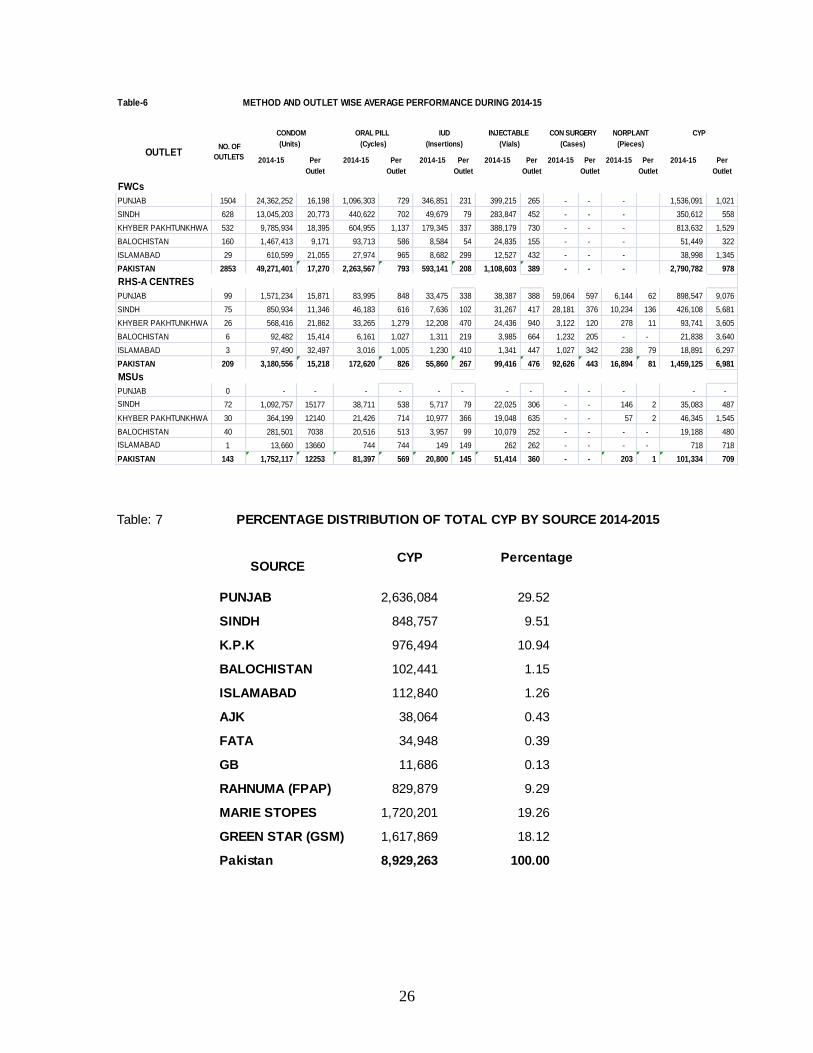
2.6 Percentage Distribution of Total CYP by Source
The percentage distribution of total CYP by data source during the year 2014-15 reflected
29.52% in Punjab, 9.51% in Sindh, 10.94% in Khyber Pakhtunkhwa, 1.15% in Balochistan,
1.26% in Islamabad, 0.43% in AJK, 0.39% in FATA, 0.13% in Gilgit – Baltistan, 9.29% in
Rahnuma FPAP, 19.26% in Marie Stopes Society and 18.12 % in GSM. The details are given
in Table-7.
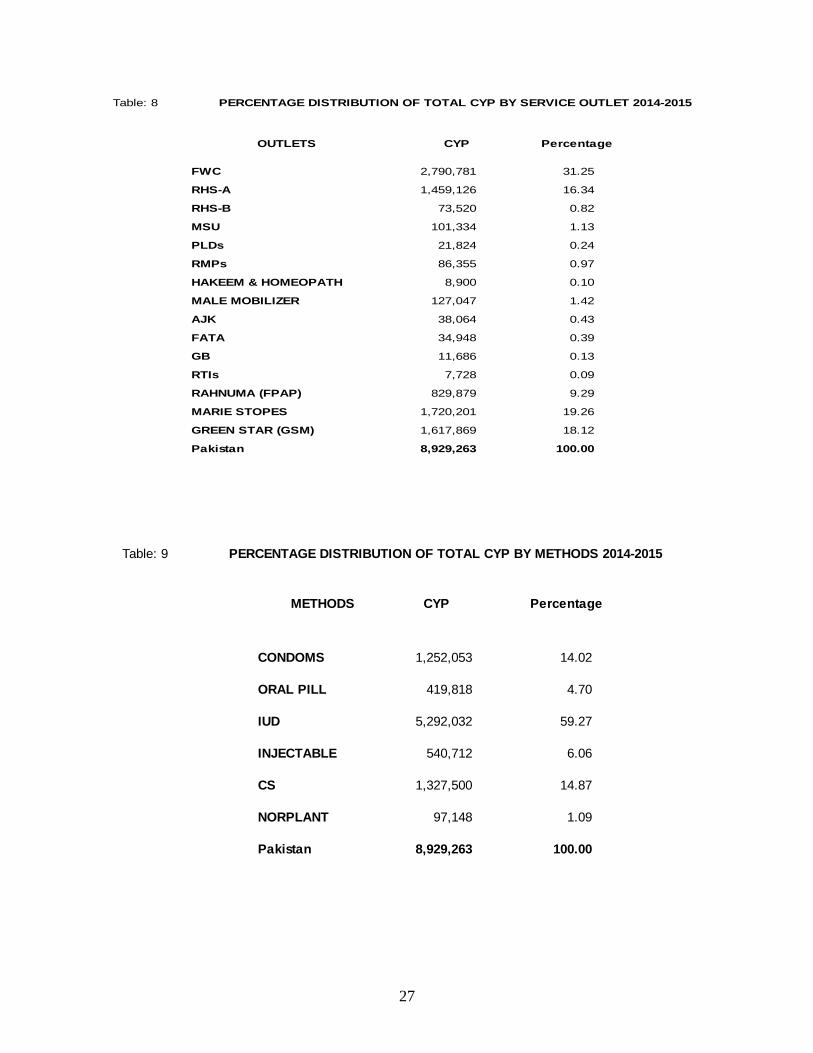
2.7 Percentage Distribution of Total CYP by Service Outlets
The percentage distribution of total CYP by Service outlets, during the financial year
2014-15, is depicted 31.25% in FWCs, 16.34% in RHS-A, 0.82% in RHS-B, 1.13% in MSUs,
0.24% in PLDs, 0.97% in RMPs, 0.10% in H&H and 1.42% in MM. The details are presented
in the Table-8.
2.8 Percentage Distribution of Total CYP by Methods
The method-wise percentage contribution in terms of total CYP has been calculated for
Condom (14.02%), Oral Pills (4.70%), IUDs (59.27%), Injectables (6.06%), Contraceptive
Surgery (14.87) and Norplant (1.09%). The details are given in Table-9.
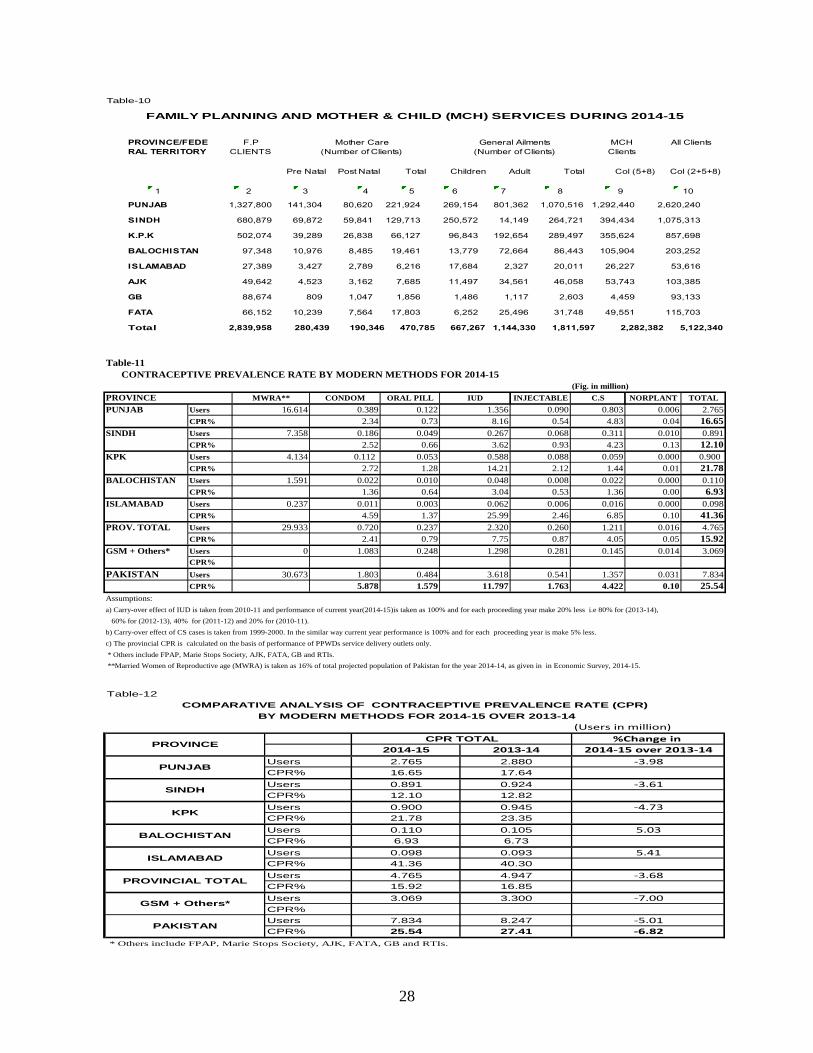
2.9 Province-wise Family Planning and Mother & Child Health
(MCH) Services Delivery
The data indicates that during the year (2014-15), 2,839,958 clients availed Family
Planning Services of various contraceptive methods out of which the Family Welfare Centers
provided the services to 280,439 clients for Pre-natal and 190,346 clients for Post-natal Care.
Apart from these, Family Welfare Centers had provided treatment to 1,811,597 clients
(Children + Adults) for General Ailments. The details are given in Table-10.
2.10 Pakistan-Contraceptive Prevalence Rate (CPR) by Modern Methods
The overall Contraceptive Prevalence Rate, on the basis of modern methods, during the
year 2014-15 is 25.54%, under the Population Welfare Program. In the Provincial setup, the
CPR in Punjab is 16.65%, Sindh 12.11%, Khyber Pakhtunkhwa 21.78%, Balochistan 6.93%
and in Federal district Islamabad is 41.36%.The CPR is calculated from Contraceptive
Performance data received from the Provincial Population Welfare Departments (PPWDs);
Population Welfare Departments AJK, GB & FATA; The District Population Welfare Office,
Islamabad; Rahnuma Family Planning Association of Pakistan (FPAP) ; Marie Stopes Society
of Pakistan (MSS); Greenstar Social Marketing (GSM) and Regional Training Institutes
(RTIs). The details are given in Table-11. The CPR 25.54% for the year 2014-15 is slipped
down from 27.41% in the year 2013-14. The comparative analysis of CPR is given in
Table-12.
19
STATISTICAL TABLES

20
21
STATISTICAL TABLES
TABLE-1 CONTRACEPTIVE USAGE BY DATA SOURCE DURING 2014-15
OVER 2013-14.
TABLE-2 CONTRACEPTIVE USAGE BY METHOD DURING 2014-15
OVER 2013-14.
TABLE-3 COMPARATIVE ANALYSIS OF CONTRACEPTIVE USAGE BY SOURCE
& METHOD DURING 2014-15 OVER 2013-14.
TABLE-4 OUTLET - WISE USAGE OF CONTRACEPTIVE DURING 2014-15
OVER 2013-14.
TABLE-5 COMPARATIVE ANALYSIS OF CONTRACEPTIVE BY OUTLET &
METHOD DURING 2014-15 OVER 2013-14.
TABLE-6 METHOD AND OUTLET - WISE AVERAGE PERFORMANCE
DURING 2014-15.
TABLE-7 PERCENTAGE DISTRIBUTION OF TOTAL CYP BY SOURCE
DURING 2014-15.
TABLE-8 PERCENTAGE DISTRIBUTION OF TOTAL CYP BY SERVICE OUTLET
DURING 2014-15.
TABLE-9 PERCENTAGE DISTRIBUTION OF TOTAL CYP BY METHOD
DURING 2014-15.
TABLE-10 FAMILY PLANNING AND MOTHER & CHILD HEALTH
(MCH) SERVICES DURING 2014-15.
TABLE-11 CONTRACEPTIVE PREVALENCE RATE BY MODERN METHODS FOR
THE YEAR 2014-15.
TABLE-12 COMPARATIVE ANALYSIS OF CONTRACEPTIVE PREVALENCE RATE
BY MODERN METHODS FOR 2014-15 OVER 2013-14.

22
23
2,636,084 3,045,367 -13.4 *
848,757 867,989 -2.2
976,494 1,087,861 -10.2 #
102,441 103,812 -1.3
112,840 112,976 -0.1
38,064 26,488 43.7 ¤
34,948 33,953 2.9
11,686 14,491 -19.4 Ø
829,879 716,656 15.8 Ʊ
1,720,201 1,284,977 33.9 «
1,617,869 2,327,237 -30.5 θ
9,621,805 -7.2
* Signif icant decrease in progress of Punjab for 2014-15 over 2013-14 is due to shortage of technical staff i.e. Family Welfare
Councilors/Workers and Women Medical Officers, coupled w ith some other factors like engagement of staff in refresher
training; low clientage due to severe w eather conditions & heavy rains; shifting of Family Welfare Centres to Health
Outlets and insuff icient contraceptive availability in some districts.
# Signif icant decrease in progress of Khyber Pakhtunkhw a for 2014-15 over 2013-14 is due to completion of project life and
resulted in termination of 550 FWCs project employees along-w ith deregistration of 480 Male Mobilizers by June, 2014.
¤ Signif icant increase in progress of AJK for 2014-15 over 2013-14 is due to availability of medicines and increased frequency of mobile camping.
Ø Signif icant decrease in progress of GB during 2014-15 over 2013-14 is due to shortage of contraceptive (Norigest) and poor performance
(low sale of contraceptives) of Male Mobilizers and declined progress of MSU component. During Oct-Dec, 2013, a total 51 MSU camps
w ere arranged w hereas during Oct- Dec, 2014 only 13 MSU camps w ere held.
Ʊ Signif icant increase in the performance of Rahnuma FPAP during 2014-15 over 2013-14 is due to skill-base training & refreshers of
more than 100 service providers on comprehensive package of modern contraceptive methods w ith focus on long term permanent methods.
Surgical intervention specially tub-ligation and non scalpel vasectomy w ere strengthened; staff w as trained for extending these intervention
through static & mobile camps and provision family planning services through mobile service units especially in humanitarian settings.
« Signif icant increase in the progress of Marie Stopes Society (MSS) for 2014-15 over 2013-14 is due to rapid increased number of Social
Franchise Units along-w ith Field Health Educators; community based Private Providers (PK Providers) and mobile outreach camps.
θ Signif icant decrease in progress of Greenstar (GSM) for 2014-15 over 2013-14 is due to restructuring of its netw ork, IPC activities remain
stagnant during the period, halted community-level demand generation activities; less emphasis on VSC (Volunteer Surgery Contraceptive)
services; increase in prices of injectables coupled w ith adverse variance in commercial sales due to distributor bottleneck in supplying to the
smaller and remote provider’s clinic & pharmacies, in that time period.
Table: 1 CONTRACEPTIVE USAGE BY DATA SOURCE 2014-2015 OVER 2013-2014
COUPLE YEARS OF PROTECTION (CYP) %AGE CHANGESOURCE
2014-2015
Vs
2013-2014
2014-2015 2013-2014
PUNJAB
SINDH
K.P.K
BALOCHISTAN
ISLAMABAD
AJK
8,929,263
FATA
GB
RAHNUMA (FPAP)
MARIE STOPES
GREEN STAR (GSM)
Pakistan
(Units)
1,252,053 1,341,667 -6.7
(Cycles)
419,818 452,777 -7.3
(Insertion)
5,292,032 5,832,421 -9.3
(Vials)
540,712 568,076 -4.8
(Cases)
1,327,500 1,402,800 -5.4
(Pieces)
97,148 24,065 227.5
8,929,263 9,621,805 -7.2
CYP
TOTAL
CYP
CS 106,200 112,224
CYP
NORPLANT 31,521 9,626
CYP
IUD 1,512,009 1,666,406
CYP
INJECTABLE 2,703,559 2,840,378
CONDOMS 180,295,680 193,200,014
CYP
ORAL PILL 6,297,269 6,791,654
Table: 2 CONTRACEPTIVE USAGE BY METHOD DURING 2014-2015 OVER 2013-2014
OVERALL PERFORMANCE %AGE CHANGE
METHOD2014-2015
Vs
2013-2014
2014-2015 2013-2014
24
39,666,899 -1.9 1,579,611 1,614,040 -2.1 388,026 63,497 -9.4 0.0 2,636,084 3,045,367
18,352,287 1.2 634,547 666,378 -4.8 64,130 28,181 20.1 7.8 848,757 867,989
16,327,971 -31.2 688,384 950,509 -27.6 204,110 3,946 -10.6 0.0 976,494 1,087,861
2,101,037 3.4 132,583 126,875 4.5 15,263 1,332 12.8 0.0 102,441 103,812
1,108,236 -1.9 42,165 41,961 0.5 22,909 1,269 -8.1 0.0 112,840 112,976
265,048 63.6 35,310 17,607 100.5 6,758 415 -1.9 0.0 38,064 26,488
448,499 -2.6 55,691 49,224 13.1 6,599 0 0.0 0.0 34,948 33,953
119,786 9.4 20,444 18,804 8.7 1,685 0 0.0 0.0 11,686 14,491
1,102,805 15.0 178,924 144,423 23.9 187,176 5,158 5.6 0.0 829,879 716,656
1,712,545 55.7 305,683 206,290 48.2 459,278 0 0.0 0.0 1,720,201 1,284,977
111,994,901 -7.7 2,623,927 2,955,543 -11.2 156,075 2,402 -62.4 0.0 1,617,869 2,327,237
193,200,014 -6.7 6,297,269 6,791,654 -7.3 1,512,009 -9.3 106,200 -5.4 227.46 8,929,263 9,621,805 -7.2
Table: 3 COMPARATIVE ANALYSIS OF CONTRACEPTIVE USAGE BY SOURCE & METHOD 2014-2015 OVER 2013-2014
CONDOM
(Units)
ORAL PILL
(Cycles)
IUD
(Insertions)
INJECTABLES
(Vials)
CON SURGERY
(Cases)
NORPLANT
(Cases)
COUPLE YEARS OF
PROTECTIONSOURCE
2014-2015 2013-2014 %
Chang
2014-2015 2013-2014 %
Chang
2014-2015 2013-2014 %
Change
2014-2015 2013-2014 %
Chang
2014-2015 2013-2014 %
Change
2014-2015 2013-2014 %
Change
2014-2015 2013-2014 %
Change
PUNJAB 38,922,641 483,432 -19.7 448,904 470,440 -4.6 70,096 6,144 0 -13.4
SINDH 18,575,756 88,218 -27.3 341,807 349,945 -2.3 23,464 10,380 9,626 -2.2
K.P.K 11,233,923 219,294 -6.9 438,920 442,067 -0.7 4,413 335 0 -10.2
BALOCHISTAN 2,171,458 16,611 -8.1 42,261 39,309 7.5 1,181 0 0 -1.3
ISLAMABAD 1,087,254 22,865 0.2 29,159 25,961 12.3 1,381 238 0 -0.1
AJK 433,600 4,412 53.2 19,291 13,718 40.6 423 0 0 43.7
FATA 436,621 6,516 1.3 25,534 23,752 7.5 0 0 0 2.9
GB 131,042 2,385 -29.4 17,580 20,288 -13.3 0 0 0 -19.4
RAHNUMA (FPAP) 1,268,712 156,351 19.7 421,950 455,456 -7.4 4,884 1,648 0 15.8
MARIE STOPES 2,666,108 352,928 30.1 174,073 120,418 44.6 0 12,776 0 33.9
GREENSTAR (GSM) 103,368,565 313,394 -50.2 744,080 879,024 -15.4 6,382 0 0 -30.5
112,224 31,521 9,626Pakistan 180,295,680 1,666,406 2,703,559 2,840,378 -4.8
2,790,781 3,111,305 -10.3
1,459,126 1,442,113 1.2
73,520 162,774 -54.8
101,334 116,541 -13.0
8,900 10,104 -11.9
127,047 187,665 -32.3
21,824 60,891 -64.2
86,355 119,118 -27.5
7,728 7,494 3.1
38,064 26,488 43.7
11,686 14,491 -19.4
34,948 33,953 2.9
829,879 716,656 15.8
1,720,201 1,284,977 33.9
1,617,869 2,327,237 -30.5
8,929,263 9,621,805 -7.2
RAHNUMA (FPAP)
MARIE STOPES
GREEN STAR (GSM)
Pakistan
PLDs
RMPs
RTIs
AJK
GB
FATA
FWC
RHS-A
RHS-B
MSU
HAKEEM & HOMEOPATH
MALE MOBILIZER
Table: 4 OUTLET-WISE USAGE OF CONTRACEPTIVE 2014-2015 OVER 2013-2014
COUPLE YEARS OF PROTECTION (CYP) %AGE CHANGE IN
OUTLETS 2014-2015 2013-2014 2014-15
over
2013-14
25
49,038,791 2,263,567 2,275,446 593,141 685,203 1,104,255 0 0 0 0 3,111,305
23,963,875 1,096,303 1,050,280 346,851 405,965 -14.6 400,436 -0.3 0 0 0 0 1,737,399
12,552,191 440,622 444,873 49,679 65,582 -24.2 281,564 0.8 0 0 0 0 402,676
10,497,284 604,955 659,536 179,345 194,608 -7.8 388,431 -0.1 0 0 0 0 875,681
1,426,113 93,713 93,254 8,584 10,124 -15.2 23,851 4.1 0 0 0 0 56,325
599,328 27,974 27,503 8,682 8,924 -2.7 9,973 25.6 0 0 0 0 39,224
3,024,955 172,620 166,161 55,860 62,895 96,095 92,626 91,729 16,894 9,626 1,442,113
1,484,517 83,995 78,876 33,475 37,309 -10.3 37,082 3.5 59,064 62,799 6,144 0 938,553
853,614 46,183 45,976 7,636 11,744 -35.0 32,009 -2.3 28,181 23,464 10,234 9,626 373,864
505,826 33,265 31,885 12,208 11,351 7.5 21,928 11.4 3,122 3,260 278 0 90,502
80,158 6,161 6,350 1,311 1,371 -4.4 3,485 14.3 1,232 1,069 0 0 19,838
100,840 3,016 3,074 1,230 1,120 9.8 1,591 -15.7 1,027 1,137 238 0 19,356
47,002 2,465 4,943 867 14,355 9,004 5,599 8,806 0 0 162,774
23,306 60 2,255 0 13,456 -100.0 7,081 -99.8 4,433 7,297 0 0 140,037
4,900 0 390 0 40 -100.0 500 -100.0 0 0 0 0 300
7,996 1,605 1,773 277 439 -36.9 966 -64.2 824 1,153 0 0 16,316
1,500 235 165 80 50 60.0 142 64.8 100 112 0 0 1,625
9,300 565 360 510 370 37.8 315 63.5 242 244 0 0 4,497
1,823,492 81,397 81,972 20,800 24,656 60,584 0 0 203 0 116,541
0 0 0 0 0 0.0 0 0.0 0 0 0 0 0
1,150,037 38,711 42,217 5,717 9,348 -38.8 29,386 -25.0 0 0 146 0 49,396
407,752 21,426 24,518 10,977 11,458 -4.2 22,328 -14.7 0 0 57 0 49,035
249,023 20,516 14,604 3,957 3,605 9.8 8,609 17.1 0 0 0 0 17,042
16,680 744 633 149 245 -39.2 261 0.4 0 0 0 0 1,068
246,313 14,019 63,718 4,989 14,596 19,232 0 0 0 0 60,891
155,550 7,450 56,996 2,082 11,713 -82.2 14,116 -70.5 0 0 0 0 48,699
0 0 0 0 0 0.0 0 0.0 0 0 0 0 0
5,816 1,056 1,047 239 209 14.4 63 58.7 0 0 0 0 854
61,947 3,763 4,245 1,192 1,461 -18.4 2,138 9.6 0 0 0 0 6,254
23,000 1,750 1,430 1,476 1,213 21.7 2,915 21.3 0 0 0 0 5,084
2,588,547 98,938 107,775 16,950 24,834 35,189 0 0 0 0 119,118
1,434,727 51,784 48,121 5,007 12,253 -59.1 10,385 -41.7 0 0 0 0 58,134
418,902 13,042 21,242 129 633 -79.6 5,105 -37.6 0 0 0 0 7,562
355,273 18,834 21,976 852 955 -10.8 7,709 -16.6 0 0 0 0 8,817
275,427 7,237 7,645 100 0 0.0 1,084 -39.6 0 0 0 0 2,639
104,218 8,041 8,791 10,862 10,993 -1.2 10,906 0.7 0 0 0 0 41,967
1,078,258 35,710 39,237 0 0 0 0 0 0 0 10,104
718,007 23,844 24,342 0 0 0.0 0 0.0 0 0 0 0 6,609
212,391 4,980 8,305 0 0 0.0 0 0.0 0 0 0 0 2,029
140,991 6,008 5,978 0 0 0.0 0 0.0 0 0 0 0 1,378
6,869 878 612 0 0 0.0 0 0.0 0 0 0 0 89
19,653,272 404,569 656,188 0 2,120 88 0 0 0 0 187,665
11,865,502 314,877 351,785 0 2,043 -100.0 0 0.0 0 0 0 0 113,002
3,132,499 88,596 100,735 0 74 -100.0 88 -100.0 0 0 0 0 28,746
4,400,401 1,021 203,498 0 3 -100.0 0 0.0 0 0 0 0 44,135
0 0 0 0 0 0.0 0 0.0 0 0 0 0 0
254,870 75 170 0 0 0.0 0 0.0 0 0 0 0 1,781
115,699,384 3,223,984 3,396,214 819,402 837,747 1,515,931 7,975 11,689 14,424 0 4,411,295
55,800 4,005 4,323 1,831 1,761 4.0 3,275 -9.0 0 0 0 0 7,494
265,048 35,310 17,607 6,758 4,412 53.2 13,718 40.6 415 423 0 0 26,488
448,499 55,691 49,224 6,599 6,516 1.3 23,752 7.5 0 0 0 0 33,953
119,786 20,444 18,804 1,685 2,385 -29.4 20,288 -13.3 0 0 0 0 14,491
1,102,805 178,924 144,423 187,176 156,351 19.7 455,456 -7.4 5,158 4,884 1,648 0 716,656
1,712,545 305,683 206,290 459,278 352,928 30.1 120,418 44.6 0 0 12,776 0 1,284,977
111,994,901 2,623,927 2,955,543 156,075 313,394 -50.2 879,024 -15.4 2,402 6,382 0 0 2,327,237
-6.7 6,297,269 6,791,654 -7.3 1,512,009 1,666,406 -9.3 2,703,559 2,840,378 -4.8 106,200 112,224 31,521 9,626 9,621,805 -7.2
Table: 5 COMPARATIVE ANALYSIS OF CONTRACEPTIVE USAGE BY OUTLET & METHOD 2014-2015 OVER 2013-2014
CONDOM
(Units)
ORAL PILL
(Cycles)
IUD
(Insertions)
INJECTABLES
(Vials)
CON SURGERY
(Cases)
NORPLANT
(Piece)
COUPLE YEARS OF
PROTECTIONOUTLETS &
METHODS2014-2015 2013-2014 %
Change
2014-2015 2013-2014 %
Chang
2014-2015 2013-2014 %
Change
2014-2015 2013-2014 %
Change
2014-2015 2013-2014 %
Chang
2014-2015 2013-2014 %
Change
2014-2015 2013-2014 %
Change
FWC 49,271,401 0.5 -0.5 -13.4 1,108,603 0.4 0.0 0.0 2,790,781 -10.3
PUNJAB 24,362,252 1.7 4.4 399,215 0.0 0.0 1,536,091 -11.6
SINDH 13,045,203 3.9 -1.0 283,847 0.0 0.0 350,612 -12.9
K.P.K 9,785,934 -6.8 -8.3 388,179 0.0 0.0 813,632 -7.1
BALOCHISTAN 1,467,413 2.9 0.5 24,835 0.0 0.0 51,449 -8.7
ISLAMABAD 610,599 1.9 1.7 12,527 0.0 0.0 38,998 -0.6
RHS-A 3,180,556 5.1 3.9 -11.2 99,416 3.5 1.0 75.5 1,459,126 1.2
PUNJAB 1,571,234 5.8 6.5 38,387 -5.9 0.0 898,547 -4.3
SINDH 850,934 -0.3 0.5 31,267 20.1 6.3 426,108 14.0
K.P.K 568,416 12.4 4.3 24,436 -4.2 0.0 93,741 3.6
BALOCHISTAN 92,482 15.4 -3.0 3,985 15.2 0.0 21,838 10.1
ISLAMABAD 97,490 -3.3 -1.9 1,341 -9.7 0.0 18,891 -2.4
RHS-B 16,144 -65.7 -50.1 -94.0 1,110 -87.7 -36.4 0.0 73,520 -54.8
PUNJAB 300 -98.7 -97.3 15 -39.2 0.0 55,422 -60.4
SINDH 0 -100.0 -100.0 0 0.0 0.0 0 -100.0
K.P.K 5,443 -31.9 -9.5 346 -28.5 0.0 11,483 -29.6
BALOCHISTAN 1,201 -19.9 42.4 234 -10.7 0.0 1,601 -1.5
ISLAMABAD 9,200 -1.1 56.9 515 -0.8 0.0 5,015 11.5
MSU 1,752,117 -3.9 -0.7 -15.6 51,414 -15.1 0.0 0.0 101,334 -13.0
PUNJAB 0 0.0 0.0 0 0.0 0.0 0 0.0
SINDH 1,092,757 -5.0 -8.3 22,025 0.0 0.0 35,083 -29.0
K.P.K 364,199 -10.7 -12.6 19,048 0.0 0.0 46,345 -5.5
BALOCHISTAN 281,501 13.0 40.5 10,079 0.0 0.0 19,188 12.6
ISLAMABAD 13,660 -18.1 17.5 262 0.0 0.0 718 -32.7
PLD 201,396 -18.2 -78.0 -65.8 10,148 -47.2 0.0 0.0 21,824 -64.2
PUNJAB 101,940 -34.5 -86.9 4,170 0.0 0.0 9,326 -80.9
SINDH 0 0.0 0.0 0 0.0 0.0 0 0.0
K.P.K 14,349 146.7 0.9 100 0.0 0.0 1,027 20.2
BALOCHISTAN 63,007 1.7 -11.4 2,343 0.0 0.0 5,329 -14.8
ISLAMABAD 22,100 -3.9 22.4 3,535 0.0 0.0 6,143 20.8
RMP 2,156,395 -16.7 -8.2 -31.7 27,298 -22.4 0.0 0.0 86,355 -27.5
PUNJAB 1,147,773 -20.0 7.6 6,052 0.0 0.0 30,158 -48.1
SINDH 343,957 -17.9 -38.6 3,185 0.0 0.0 4,347 -42.5
K.P.K 299,385 -15.7 -14.3 6,427 0.0 0.0 7,602 -13.8
BALOCHISTAN 259,436 -5.8 -5.3 655 0.0 0.0 2,765 4.8
ISLAMABAD 105,844 1.6 -8.5 10,979 0.0 0.0 41,484 -1.1
H&H 936,441 -13.2 -9.0 0.0 82 0.0 0.0 0.0 8,900 -11.9
PUNJAB 638,356 -11.1 -2.0 0 0.0 0.0 6,023 -8.9
SINDH 154,653 -27.2 -40.0 0 0.0 0.0 1,406 -30.7
K.P.K 138,183 -2.0 0.5 82 0.0 0.0 1,377 -0.1
BALOCHISTAN 5,249 -23.6 43.5 0 0.0 0.0 95 7.3
MM 14,410,852 -26.7 -38.3 -100.0 0 -100.0 0.0 0.0 127,047 -32.3
PUNJAB 11,078,114 -6.6 -10.5 0 0.0 0.0 97,923 -13.3
SINDH 3,054,261 -2.5 -12.1 0 0.0 0.0 27,117 -5.7
K.P.K 50,116 -98.9 -99.5 0 0.0 0.0 416 -99.1
BALOCHISTAN 0 0.0 0.0 0 0.0 0.0 0 0.0
ISLAMABAD 228,361 -10.4 -55.9 0 0.0 0.0 1,591 -10.7
Sub Total 108,370,378 -6.3 -5.1 -2.2 1,405,488 -7.3 -31.8 0.0 4,260,375 -3.4
RTIs 65,730 17.8 -7.4 2,980 0.0 0.0 7,728 3.1
AJK 433,600 63.6 100.5 19,291 -1.9 0.0 38,064 43.7
FATA 436,621 -2.6 13.1 25,534 0.0 0.0 34,948 2.9
GB 131,042 9.4 8.7 17,580 0.0 0.0 11,686 -19.4
RAHNUMA) 1,268,712 15.0 23.9 421,950 5.6 0.0 829,879 15.8
MARIE STOPES 2,666,108 55.7 48.2 174,073 0.0 0.0 1,720,201 33.9
GSM 103,368,565 -7.7 -11.2 744,080 -62.4 0.0 1,617,869 -30.5
Pakistan 180,295,680 193,200,014 -5.4 227.46 8,929,263
26
Table-6 METHOD AND OUTLET WISE AVERAGE PERFORMANCE DURING 2014-15
2014-15 Per 2014-15 Per 2014-15 Per 2014-15 Per 2014-15 Per 2014-15 Per 2014-15 Per
Outlet Outlet Outlet Outlet Outlet Outlet Outlet
FWCs
PUNJAB 1504 24,362,252 16,198 1,096,303 729 346,851 231 399,215 265 - - - 1,536,091 1,021
SINDH 628 13,045,203 20,773 440,622 702 49,679 79 283,847 452 - - - 350,612 558
KHYBER PAKHTUNKHWA 532 9,785,934 18,395 604,955 1,137 179,345 337 388,179 730 - - - 813,632 1,529
BALOCHISTAN 160 1,467,413 9,171 93,713 586 8,584 54 24,835 155 - - - 51,449 322
ISLAMABAD 29 610,599 21,055 27,974 965 8,682 299 12,527 432 - - - 38,998 1,345
PAKISTAN 2853 49,271,401 17,270 2,263,567 793 593,141 208 1,108,603 389 - - - 2,790,782 978
RHS-A CENTRES
PUNJAB 99 1,571,234 15,871 83,995 848 33,475 338 38,387 388 59,064 597 6,144 62 898,547 9,076
SINDH 75 850,934 11,346 46,183 616 7,636 102 31,267 417 28,181 376 10,234 136 426,108 5,681
KHYBER PAKHTUNKHWA 26 568,416 21,862 33,265 1,279 12,208 470 24,436 940 3,122 120 278 11 93,741 3,605
BALOCHISTAN 6 92,482 15,414 6,161 1,027 1,311 219 3,985 664 1,232 205 - - 21,838 3,640
ISLAMABAD 3 97,490 32,497 3,016 1,005 1,230 410 1,341 447 1,027 342 238 79 18,891 6,297
PAKISTAN 209 3,180,556 15,218 172,620 826 55,860 267 99,416 476 92,626 443 16,894 81 1,459,125 6,981
MSUs
PUNJAB 0 - - - - - - - - - - - - -
SINDH 72 1,092,757 15177 38,711 538 5,717 79 22,025 306 - - 146 2 35,083 487
KHYBER PAKHTUNKHWA 30 364,199 12140 21,426 714 10,977 366 19,048 635 - - 57 2 46,345 1,545
BALOCHISTAN 40 281,501 7038 20,516 513 3,957 99 10,079 252 - - - - 19,188 480
ISLAMABAD 1 13,660 13660 744 744 149 149 262 262 - - - - 718 718
PAKISTAN 143 1,752,117 12253 81,397 569 20,800 145 51,414 360 - - 203 1 101,334 709
CON SURGERY CYP
(Units) (Cycles) (Insertions) (Vials) (Cases)
NORPLANT
(Pieces)OUTLET
NO. OF
OUTLETS
CONDOM ORAL PILL IUD INJECTABLE
2,636,084
848,757
976,494
102,441
112,840
38,064
34,948
11,686
829,879
1,720,201
1,617,869
Pakistan 8,929,263
GREEN STAR (GSM) 18.12
100.00
GB 0.13
RAHNUMA (FPAP) 9.29
MARIE STOPES 19.26
ISLAMABAD 1.26
AJK 0.43
FATA 0.39
SINDH 9.51
K.P.K 10.94
BALOCHISTAN 1.15
Table: 7 PERCENTAGE DISTRIBUTION OF TOTAL CYP BY SOURCE 2014-2015
CYP PercentageSOURCE
PUNJAB 29.52
27
Table: 8
2,790,781 31.25
1,459,126 16.34
73,520 0.82
101,334 1.13
21,824 0.24
86,355 0.97
8,900 0.10
127,047 1.42
38,064 0.43
34,948 0.39
11,686 0.13
7,728 0.09
829,879 9.29
1,720,201 19.26
1,617,869 18.12
Pakistan 8,929,263 100.00
GREEN STAR (GSM)
AJK
FATA
GB
RTIs
RAHNUMA (FPAP)
MARIE STOPES
RHS-B
MSU
PLDs
RMPs
HAKEEM & HOMEOPATH
MALE MOBILIZER
PERCENTAGE DISTRIBUTION OF TOTAL CYP BY SERVICE OUTLET 2014-2015
OUTLETS CYP Percentage
FWC
RHS-A
Table: 9
1,252,053 14.02
419,818 4.70
5,292,032 59.27
540,712 6.06
1,327,500 14.87
97,148 1.09
8,929,263 100.00
IUD
INJECTABLE
CS
NORPLANT
Pakistan
PERCENTAGE DISTRIBUTION OF TOTAL CYP BY METHODS 2014-2015
METHODS CYP Percentage
CONDOMS
ORAL PILL
28
1 2 3 4 5 6 7 8 9 10
Table-10
FAMILY PLANNING AND MOTHER & CHILD (MCH) SERVICES DURING 2014-15
PROVINCE/FEDE
RAL TERRITORY
F.P
CLIENTS
Mother Care
(Number of Clients)
General Ailments
(Number of Clients)
MCH
Clients
All Clients
801,362 1,070,516
Pre Natal Post Natal Total Children Adult Total
14,149 264,721
Col (5+8) Col (2+5+8)
PUNJAB 1,327,800 141,304 80,620 221,924 269,154
192,654 289,497
1,292,440 2,620,240
SINDH 680,879 69,872 59,841 129,713 250,572
72,664 86,443
394,434 1,075,313
K.P.K 502,074 39,289 26,838 66,127 96,843
2,327 20,011
355,624 857,698
BALOCHISTAN 97,348 10,976 8,485 19,461 13,779
34,561 46,058
105,904 203,252
ISLAMABAD 27,389 3,427 2,789 6,216 17,684
1,117 2,603
26,227 53,616
AJK 49,642 4,523 3,162 7,685 11,497
25,496 31,748
53,743 103,385
GB 88,674 809 1,047 1,856 1,486
1,144,330 1,811,597
4,459 93,133
FATA 66,152 10,239 7,564 17,803 6,252
2,282,382 5,122,340
49,551 115,703
Total 2,839,958 280,439 190,346 470,785 667,267
Table-11
(Fig. in million)
PROVINCE MWRA** CONDOM ORAL PILL IUD INJECTABLE C.S NORPLANT TOTAL
PUNJAB Users 16.614 0.389 0.122 1.356 0.090 0.803 0.006 2.765
CPR% 2.34 0.73 8.16 0.54 4.83 0.04 16.65
SINDH Users 7.358 0.186 0.049 0.267 0.068 0.311 0.010 0.891
CPR% 2.52 0.66 3.62 0.93 4.23 0.13 12.10
KPK Users 4.134 0.112 0.053 0.588 0.088 0.059 0.000 0.900
CPR% 2.72 1.28 14.21 2.12 1.44 0.01 21.78
BALOCHISTAN Users 1.591 0.022 0.010 0.048 0.008 0.022 0.000 0.110
CPR% 1.36 0.64 3.04 0.53 1.36 0.00 6.93
ISLAMABAD Users 0.237 0.011 0.003 0.062 0.006 0.016 0.000 0.098
CPR% 4.59 1.37 25.99 2.46 6.85 0.10 41.36
PROV. TOTAL Users 29.933 0.720 0.237 2.320 0.260 1.211 0.016 4.765
CPR% 2.41 0.79 7.75 0.87 4.05 0.05 15.92
GSM + Others* Users 0 1.083 0.248 1.298 0.281 0.145 0.014 3.069
CPR%
PAKISTAN Users 30.673 1.803 0.484 3.618 0.541 1.357 0.031 7.834
CPR% 5.878 1.579 11.797 1.763 4.422 0.10 25.54
Assumptions:
a) Carry-over effect of IUD is taken from 2010-11 and performance of current year(2014-15)is taken as 100% and for each proceeding year make 20% less i.e 80% for (2013-14),
60% for (2012-13), 40% for (2011-12) and 20% for (2010-11).
b) Carry-over effect of CS cases is taken from 1999-2000. In the similar way current year performance is 100% and for each proceeding year is make 5% less.
c) The provincial CPR is calculated on the basis of performance of PPWDs service delivery outlets only.
* Others include FPAP, Marie Stops Society, AJK, FATA, GB and RTIs.
**Married Women of Reproductive age (MWRA) is taken as 16% of total projected population of Pakistan for the year 2014-14, as given in in Economic Survey, 2014-15.
CONTRACEPTIVE PREVALENCE RATE BY MODERN METHODS FOR 2014-15
Table-12
(Users in million)
%Change in
2014-15 2013-14 2014-15 over 2013-14
Users 2.765 2.880 -3.98
CPR% 16.65 17.64
Users 0.891 0.924 -3.61
CPR% 12.10 12.82
Users 0.900 0.945 -4.73
CPR% 21.78 23.35
Users 0.110 0.105 5.03
CPR% 6.93 6.73
Users 0.098 0.093 5.41
CPR% 41.36 40.30
Users 4.765 4.947 -3.68
CPR% 15.92 16.85
Users 3.069 3.300 -7.00
CPR%
Users 7.834 8.247 -5.01
CPR% 25.54 27.41 -6.82
* Others include FPAP, Marie Stops Society, AJK, FATA, GB and RTIs.
CPR TOTALPROVINCE
BY MODERN METHODS FOR 2014-15 OVER 2013-14
COMPARATIVE ANALYSIS OF CONTRACEPTIVE PREVALENCE RATE (CPR)
PUNJAB
GSM + Others*
PAKISTAN
SINDH
KPK
BALOCHISTAN
ISLAMABAD
PROVINCIAL TOTAL

29
Annexure
SUPPLEMENTARY MATERIAL
A meeting of Technical Committee on Contraceptive Performance Report, 2014-15 was
held on 26th February, 2016, under the chairmanship of Chief Statistician, Pakistan Bureau of
Statistics (PBS), at Islamabad. In the meeting, the stakeholders/participants has proposed that
internationally revised conversion formulae may be adopted for calculation of Couple Year of
Protection (CYP), to facilitate the comparison since all provinces are using revised formulae.
As desired by the stakeholders, an in house study has been carried out by using data of
Annual Contraceptive Performance Report, 2014-15 by using conversion formulae/factors
employed by USAID/MEASURE and variation in the result have been noted in terms of %age
change in CYP using proposed CYP conversion formulae/factors (USAID/MEASURE), 18.7%
increase has been observed in terms of CYP as compared to currently used standard conversion
formulae. The national level contraceptive performance in terms of CYP has been computed as
8.9 million, will swell to 10.6 million by the use of proposed conversion formulae/factors of
CYP.
The source-wise comparison by the use of proposed CYP conversion formulae/factors
(USAID/MEASURE) made with the standard formulae/factors currently in practice is given in
supplementary Table-1.
At national level, in method-wise comparison by use of proposed factors, CYP computed for
various modern methods Condoms, IUDs, Injectables and Contraceptive Surgery cases has
increased by 20.0%, 24.9%, 13.6% and 4.0% respectively. While 7.4% decrease has been
observed in Oral Pills. The details are shown in supplementary Table-2.
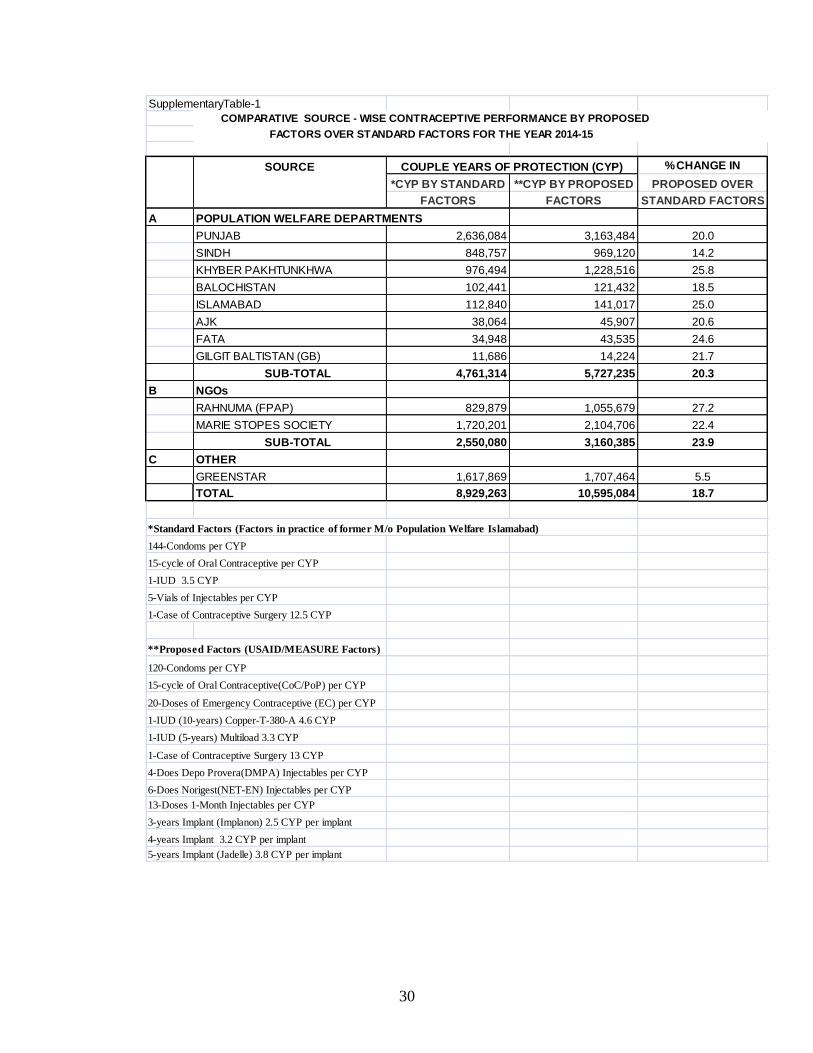
30
SupplementaryTable-1
COMPARATIVE SOURCE - WISE CONTRACEPTIVE PERFORMANCE BY PROPOSED
FACTORS OVER STANDARD FACTORS FOR THE YEAR 2014-15
SOURCE %CHANGE IN
*CYP BY STANDARD **CYP BY PROPOSED PROPOSED OVER
FACTORS FACTORS STANDARD FACTORS
A POPULATION WELFARE DEPARTMENTS
PUNJAB 2,636,084 3,163,484 20.0
SINDH 848,757 969,120 14.2
KHYBER PAKHTUNKHWA 976,494 1,228,516 25.8
BALOCHISTAN 102,441 121,432 18.5
ISLAMABAD 112,840 141,017 25.0
AJK 38,064 45,907 20.6
FATA 34,948 43,535 24.6
GILGIT BALTISTAN (GB) 11,686 14,224 21.7
SUB-TOTAL 4,761,314 5,727,235 20.3
B NGOs
RAHNUMA (FPAP) 829,879 1,055,679 27.2
MARIE STOPES SOCIETY 1,720,201 2,104,706 22.4
SUB-TOTAL 2,550,080 3,160,385 23.9
C OTHER
GREENSTAR 1,617,869 1,707,464 5.5
TOTAL 8,929,263 10,595,084 18.7
*Standard Factors (Factors in practice of former M/o Population Welfare Islamabad)
144-Condoms per CYP
15-cycle of Oral Contraceptive per CYP
1-IUD 3.5 CYP
5-Vials of Injectables per CYP
1-Case of Contraceptive Surgery 12.5 CYP
**Proposed Factors (USAID/MEASURE Factors)
120-Condoms per CYP
15-cycle of Oral Contraceptive(CoC/PoP) per CYP
20-Doses of Emergency Contraceptive (EC) per CYP
1-IUD (10-years) Copper-T-380-A 4.6 CYP
1-IUD (5-years) Multiload 3.3 CYP
1-Case of Contraceptive Surgery 13 CYP
4-Does Depo Provera(DMPA) Injectables per CYP
6-Does Norigest(NET-EN) Injectables per CYP
13-Doses 1-Month Injectables per CYP
3-years Implant (Implanon) 2.5 CYP per implant
4-years Implant 3.2 CYP per implant
5-years Implant (Jadelle) 3.8 CYP per implant
COUPLE YEARS OF PROTECTION (CYP)

31
SupplementaryTable-2
COMPARATIVE METHOD WISE PERFORMANCE OF CONTRACEPTIVE USAGE
BY PROPOSED FACTORS OVER STANDARD FACTORS FOR THE YEAR 2014-15
OVERALL PERFORMANCE %CHANGE IN
METHOD 2014-15 *CYP BY STANDARD **CYP BY PROPOSED PROPOSED OVER
FACTORS FACTORS STANDARD FACTOES
CONDOM (Units) 180,295,680 1,252,053 1,502,464 20.0
ORAL PILL (Cycles) 6,297,269 419,818 388,948 -7.4
COC 4,099,379 273,292 273,292 0.0
POP 345,702 23,047 23,047 0.0
EC 1,852,188 123,479 92,609 -25.0
IUD (Insertions) 1,512,009 5,292,032 6,611,729 24.9
COPPER-T380-A 1,247,769 4,367,192 5,739,737 31.4
MULTILOAD 264,240 924,840 871,992 -5.7
INJECTIABLE (Vials) 2,703,559 540,712 614,194 13.6
3-MONTHS (DMPA) 2,050,303 410,061 512,576 25.0
2-MONTHS (NET-EN) 572,387 114,477 95,398 -16.7
1-MONTH (FEMIJECT) 80,869 16,174 6,221 -61.5
CON. SURGERY (Cases) 106,200 1,327,500 1,380,600 4.0
NORPLANT (Pices) 31,521 97,148 97,148 0.0
IMPLANON 9,045 22,613 22,613 0.0
IMPLANT 18,122 57,990 57,990 0.0
JADELLE 4,354 16,545 16,545 0.0
8,929,263 10,595,084 18.7
*Standard Factors (Factors in practice of former M/o Population Welfare Islamabad)
144-Condoms per CYP
15-cycle of Oral Contraceptive per CYP
1-IUD 3.5 CYP
5-Vials of Injectables per CYP
1-Case of Contraceptive Surgery 12.5 CYP
**Proposed Factors (USAID/MEASURE Factors)
120-Condoms per CYP
15-cycle of Oral Contraceptive(CoC/PoP) per CYP
20-Doses of Emergency Contraceptive (EC) per CYP
1-IUD (10-years) Copper-T-380-A 4.6 CYP
1-IUD (5-years) Multiload 3.3 CYP
1-Case of Contraceptive Surgery 13 CYP
4-Does Depo Provera(DMPA) Injectables per CYP
6-Does Norigest(NET-EN) Injectables per CYP
13-Doses 1-Month Injectables per CYP
3-years Implant (Implanon) 2.5 CYP per implant
4-years Implant 3.2 CYP per implant
5-years Implant (Jadelle) 3.8 CYP per implant
COUPLE YEARS OF PROTECTION (CYP)
TOTAL CYP

32
Annexure
SUPPLEMENTARY MATERIAL
A meeting of Technical Committee on Contraceptive Performance Report, 2014-15 was
held on 26th February, 2016, under the chairmanship of Chief Statistician, Pakistan Bureau of
Statistics (PBS), at Islamabad. In the meeting, the stakeholders/participants has proposed that
internationally revised conversion formulae may be adopted for calculation of Couple Year of
Protection (CYP), to facilitate the comparison since all provinces are using revised formulae.
As desired by the stakeholders, an in house study has been carried out by using data of
Annual Contraceptive Performance Report, 2014-15 by using conversion formulae/factors
employed by USAID/MEASURE and variation in the result have been noted in terms of %age
change in CYP using proposed CYP conversion formulae/factors (USAID/MEASURE), 18.7%
increase has been observed in terms of CYP as compared to currently used standard conversion
formulae. The national level contraceptive performance in terms of CYP has been computed as
8.9 million, will swell to 10.6 million by the use of proposed conversion formulae/factors of
CYP.
The source-wise comparison by the use of proposed CYP conversion formulae/factors
(USAID/MEASURE) made with the standard formulae/factors currently in practice is given in
supplementary Table-1.
At national level, in method-wise comparison by use of proposed factors, CYP computed for
various modern methods Condoms, IUDs, Injectables and Contraceptive Surgery cases has
increased by 20.0%, 24.9%, 13.6% and 4.0% respectively. While 7.4% decrease has been
observed in Oral Pills. The details are shown in supplementary Table-2.

SupplementaryTable-1
COMPARATIVE SOURCE - WISE CONTRACEPTIVE PERFORMANCE BY PROPOSED
FACTORS OVER STANDARD FACTORS FOR THE YEAR 2014-15
SOURCE %CHANGE IN
*CYP BY STANDARD **CYP BY PROPOSED PROPOSED OVER
FACTORS FACTORS STANDARD FACTORS
A POPULATION WELFARE DEPARTMENTS
PUNJAB 2,636,084 3,163,484 20.0
SINDH 848,757 969,120 14.2
KHYBER PAKHTUNKHWA 976,494 1,228,516 25.8
BALOCHISTAN 102,441 121,432 18.5
ISLAMABAD 112,840 141,017 25.0
AJK 38,064 45,907 20.6
FATA 34,948 43,535 24.6
GILGIT BALTISTAN (GB) 11,686 14,224 21.7
SUB-TOTAL 4,761,314 5,727,235 20.3
B NGOs
RAHNUMA (FPAP) 829,879 1,055,679 27.2
MARIE STOPES SOCIETY 1,720,201 2,104,706 22.4
SUB-TOTAL 2,550,080 3,160,385 23.9
C OTHER
GREENSTAR 1,617,869 1,707,464 5.5
TOTAL 8,929,263 10,595,084 18.7
*Standard Factors (Factors in practice of former M/o Population Welfare Islamabad)
144-Condoms per CYP
15-cycle of Oral Contraceptive per CYP
1-IUD 3.5 CYP
5-Vials of Injectables per CYP
1-Case of Contraceptive Surgery 12.5 CYP
**Proposed Factors (USAID/MEASURE Factors)
120-Condoms per CYP
15-cycle of Oral Contraceptive(CoC/PoP) per CYP
20-Doses of Emergency Contraceptive (EC) per CYP
1-IUD (10-years) Copper-T-380-A 4.6 CYP
1-IUD (5-years) Multiload 3.3 CYP
1-Case of Contraceptive Surgery 13 CYP
4-Does Depo Provera(DMPA) Injectables per CYP
6-Does Norigest(NET-EN) Injectables per CYP
13-Doses 1-Month Injectables per CYP
3-years Implant (Implanon) 2.5 CYP per implant
4-years Implant 3.2 CYP per implant
5-years Implant (Jadelle) 3.8 CYP per implant
COUPLE YEARS OF PROTECTION (CYP)
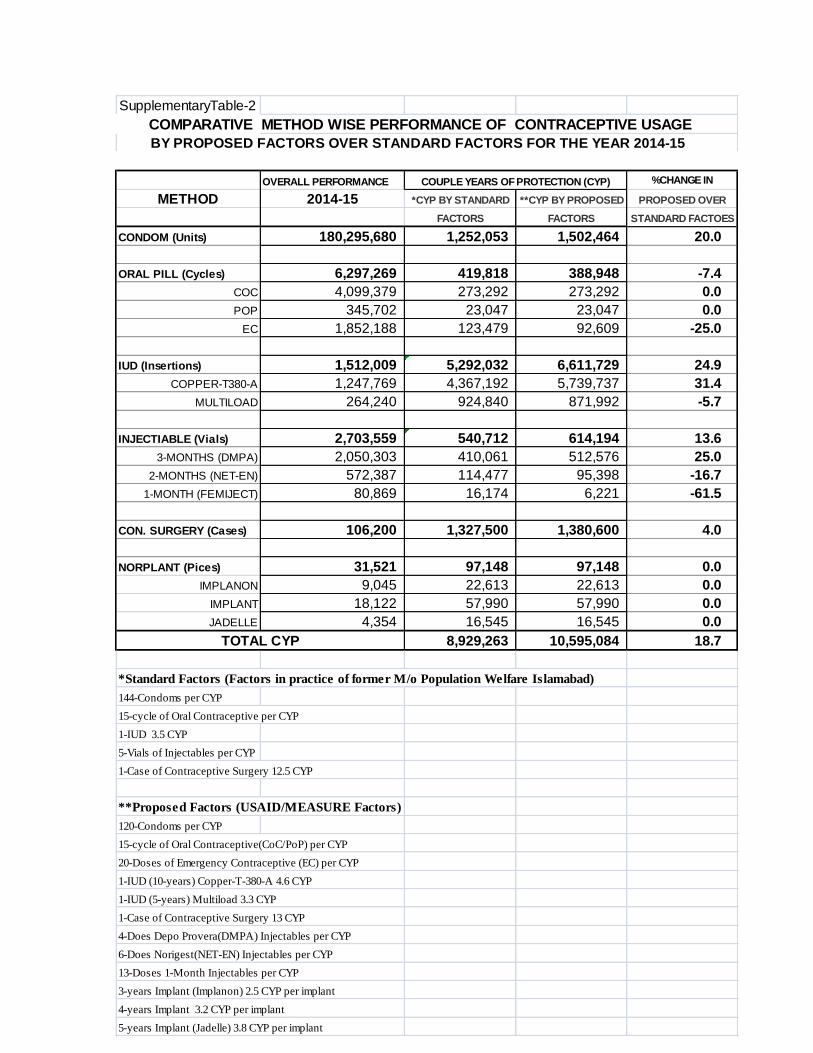
SupplementaryTable-2
COMPARATIVE METHOD WISE PERFORMANCE OF CONTRACEPTIVE USAGE
BY PROPOSED FACTORS OVER STANDARD FACTORS FOR THE YEAR 2014-15
OVERALL PERFORMANCE %CHANGE IN
METHOD 2014-15 *CYP BY STANDARD **CYP BY PROPOSED PROPOSED OVER
FACTORS FACTORS STANDARD FACTOES
CONDOM (Units) 180,295,680 1,252,053 1,502,464 20.0
ORAL PILL (Cycles) 6,297,269 419,818 388,948 -7.4
COC 4,099,379 273,292 273,292 0.0
POP 345,702 23,047 23,047 0.0
EC 1,852,188 123,479 92,609 -25.0
IUD (Insertions) 1,512,009 5,292,032 6,611,729 24.9
COPPER-T380-A 1,247,769 4,367,192 5,739,737 31.4
MULTILOAD 264,240 924,840 871,992 -5.7
INJECTIABLE (Vials) 2,703,559 540,712 614,194 13.6
3-MONTHS (DMPA) 2,050,303 410,061 512,576 25.0
2-MONTHS (NET-EN) 572,387 114,477 95,398 -16.7
1-MONTH (FEMIJECT) 80,869 16,174 6,221 -61.5
CON. SURGERY (Cases) 106,200 1,327,500 1,380,600 4.0
NORPLANT (Pices) 31,521 97,148 97,148 0.0
IMPLANON 9,045 22,613 22,613 0.0
IMPLANT 18,122 57,990 57,990 0.0
JADELLE 4,354 16,545 16,545 0.0
8,929,263 10,595,084 18.7
*Standard Factors (Factors in practice of former M/o Population Welfare Islamabad)
144-Condoms per CYP
15-cycle of Oral Contraceptive per CYP
1-IUD 3.5 CYP
5-Vials of Injectables per CYP
1-Case of Contraceptive Surgery 12.5 CYP
**Proposed Factors (USAID/MEASURE Factors)
120-Condoms per CYP
15-cycle of Oral Contraceptive(CoC/PoP) per CYP
20-Doses of Emergency Contraceptive (EC) per CYP
1-IUD (10-years) Copper-T-380-A 4.6 CYP
1-IUD (5-years) Multiload 3.3 CYP
1-Case of Contraceptive Surgery 13 CYP
4-Does Depo Provera(DMPA) Injectables per CYP
6-Does Norigest(NET-EN) Injectables per CYP
13-Doses 1-Month Injectables per CYP
3-years Implant (Implanon) 2.5 CYP per implant
4-years Implant 3.2 CYP per implant
5-years Implant (Jadelle) 3.8 CYP per implant
COUPLE YEARS OF PROTECTION (CYP)
TOTAL CYP