Embed Size (px)
Citation preview

Contract�Areas�and�Service�Quality�Issues
15
Contract Areas and ServiceQuality Issues
in Public Transit Provision:Some Thoughts on the European
and Australian Context
David�A.�Hensher,�The�University�of�Sydney
Abstract
The�introduction�of�contract�regimes�for�the�provision�of�bus�s ervices,�such�as�com-
petitive�tendering1�and�performance-based�contracts,�is�usually�premised�on�a�prior
assumption�that�the�size�of�the�physical�contract�area�is�given �and�that�any�policies
related� to� interactions�between� contract� areas,� such�as� integra ted� ticketing�and
fares,2�are�agreed�to.�This�article�examines�the�evolving�arguments�th at�encourage�a
review�of�contract�area�sizes�before�recontracting�and�the�posi tions�supporting�the
benefits�of�service�quality-related�issues�such�as�an�integrated�fares�policy.�Given�that
a�growing�number�of�analysts�(especially�in�Europe�and�Australi a)�are�promoting�the
appeal�of�increasing�physical�contract�area�size�to�facilitate, �among�other�reasons,�an
integrated�fare�regime,�it�is�timely�to�explore�the�pros�and�cons�for�such�reform�to
ensure� that� they�are�not� counterproductive� to� the�desired�outcomes�of� a� reform
process.�The�arguments�presented�here�caution�the�support�for�too�small�a�number
of�large�contract�areas�on�grounds�of�internal�efficiency�losse s�and�limited�gains�in
network�economies�(but�support�amalgamating�very�small�contract �areas).�Existing

Journal�of�Public�Transportation,�Vol.�6,�No.�3,�2003
16
empirical� evidence,� limited�as� it� is,� tends� to� support� contract �areas� (and�depots)
currently�serviced�by�fleet�sizes�in�the�range�30�to�100�regard less�of�urban�develop-
ment�profile.�Alternative�ways�of�delivering�cross-regional�and �broad-based�network
benefits�are�proposed.
IntroductionReform�of�the�bus�sector� in�many�countries�has� focussed�on�alte rnative�service
delivery�regimes�such�as�competitive�tendering3�and�performance-based�quality
contracts�(see,�for�example,�Hensher�and�Stanley�[2003]�and�Pre ston�and�van�de
Velde�[2002]�for�details).�Two�issues�that�arise�when�detailing�specific�reform�strat-
egies�are�the�geographical�definition�of�the�service�area�(or�e ven�whether� it� is�a
single� route�as� in�London)�and�the� flow-through� implications�of � service�quality
initiatives�such�as�integrated�fares.4�The�latter�relates�to�the�ability�of�a�passenger�to
travel�between�public�transport�modes�and�operators�on�a�single �fare�as�well�as
potentially�offering�time�savings.5)
In�developing�an�implementation�plan�for�performance-based�cont racts�(such�as
the�one�developed�by�Hensher�and�Houghton�[2003]),�a�number�of� commenta-
tors�have� raised� the�question�of�how�many�contracts� should�best �be�provided
within�a�particular� geographical� setting.� Should�we� take� the�ex isting� contracts
(and�areas)�or� rationalize� the� contracts� to� a� smaller�number?�Arguments�pro-
posed�for�fewer�contract�areas�are�mainly�related�to�administrative�coherence�and
passenger�benefits� from�network� integration.�A� concern�with� fewer� contracts
(depending�on�the�meaning�of��fewer�)�is�the�potential�loss�of� internal�efficiency
and�the�high�risk�of�monopoly�power�and/or�market�dominance,�wi th�resultant
pressures�on�government�to�increase�subsidies�beyond�what�currently�exist�and/
or�are�in�any�sense�optimal.
This�article�examines�the�arguments�for�and�against�a�range�of� reform�initiatives
associated�with�the�determination�of�the�geographical�size�of�contract�areas,�as
well�as�revenue�allocation�and�patronage�benefit�issues�linked� to�integrated�fares
associated�with�cross-contract� service�delivery.�Although� the�article� focuses�on
Australia�(Sydney�in�particular),�and�to�a�lesser�extent�Europe ,�to�illustrate�some�of
the�evidence,�the�arguments�presented�are�of�relevance�universa lly�and�are�espe-
cially�useful� for�the�United�States,�which�appears�to� lag�behind�the�reform�pro-
grams�of�Europe�and�Australia.6

Contract�Areas�and�Service�Quality�Issues
17
Contract Area Size and NumberThe�problem�is�that�individual�firms�in�the�transportation�indu s-
tries�provide�service�only�over� limited�portions�of�a�network,� but
[some]�customers��demands�extend�over�the�entire�network.�The
necessity�of�providing� through��� service� from�any�origin� to�any
destination� requires� cooperation�among� firms�who�are�also� ex-
pected�to�compete�in�the�new�environment�of�regulatory�reform.
These�industries�have�been�regulated�in�the�past�precisely�to�deal
with�the��interconnect��and��competitive�access��issues.�But�the�[com-
petition�policy]�laws�generally�presume�that�firms�should�compete
[in�a�potential�if�no�actual�sense],�not�cooperate.�(Tye�1987:�xviii)
Is�there�such�a�thing�as�an�optimal�contract�area�size�in�a�geographical�sense?7�What
criteria�might�one�apply�to�decide�on�this?�Presumably�the�answer�relates�to�de-
mand-side�considerations,�such�as�network�connectivity� impacts� (economies�of
scope�through�networks,� integrated�fares,�etc.),�and�the�supply-side,� in�terms�of
cost�and�service�delivery�efficiencies.�It�is�not�dissimilar�to �the�arguments�on�the
optimal�number�of�firms�in�an�industry.8
There�are�two�issues�(at�least)�to�address:�(1)�what�likely�changes�in�network�service
delivery�are�desired�and�can�be�achieved�by�amalgamating�contra ct� areas� that
cannot�be�achieved�by�alternative�strategies,�such�as�establish ing�network�alliances
(even�incentive-based�ones9)�within�the�existing�contract�area�regime;�and�(2)�will
such�amalgamations�lose�the�internal�(to�an�operator)�efficienc ies�that�currently
exist�and�which�promote�sufficient�observations�for�benchmarking�performance?
How�many�contract�areas�are�appropriate?�Preston�and�van�de�Velde�(2002)�com-
ment�that�the�U-shaped�subsidy�profile�detected�over�time�in�competitive�tender-
ing� is,� in�part,�due�to� the�winner�s� curse10�but�more� importantly� in� the�current
context,�in�part,�due�to�excessive�concentration�or�collusion.�The�upping�of�prices
in�rebids�is�becoming�common�(as�observed�in�Europe�in�particular)�as�the�num-
ber�of�bidders�drops�(as�a�result�of�fewer�operators�in�the�market).�Contract�area
size�is�a�feature�of�the�literature�on�spatial�monopoly�where�e ach�contract�area�may
be�in�the�hands�of�a�few�operators�who�are�able�to�collude�acti vities�across�contract
areas�under�their�control.�By�amalgamating�contract�areas�this� is�tantamount�to
the�same�implications�for�efficiency�(albeit�legally)�as�collusion.
The�trade-offs�between�network/demand�economies�and�internal�ef ficiency�will
depend�on�a�number�of�structural�and�historically�contingent�characteristics�in-

Journal�of�Public�Transportation,�Vol.�6,�No.�3,�2003
18
cluding� such� different� aspects� as� urban� development� and� operato r� culture
(Carlquist�2002).�This�was�certainly�true�in�the�Sydney�context �in�the�early�1990s
when�the�NSW�1990�Passenger�Transport�Act�was�introduced.�It�defined�a�suite�of
78�contract� areas�based�primarily�on� incumbency� (tantamount� to� grandfather
rights).�Since�then�the�number�of�operators�has�been�reduced,�while�the�contract
areas�have�remained�in�tact.�New�global�operators�have�moved�in to�Sydney�(e.g.,
National�Express�from�the�United�Kingdom,�Connex�and�Transdev�from�France)
looking�for�opportunities�to�expand�in�the�Australian�market.�Where�geographi-
cally�adjacent�operators�have�been�willing�to�sell,�in�part�due �to�pressures�to�sell
from�the�large�global�operators,�but�also�because�of�the�percei ved�uncertainty�of
the�new� reform�agenda� (under�discussion� in� 2003�but�without� a�d irection� to
date),�there�is�evidence�of�larger�service�areas�under�one�oper ator�(strictly�the�same
contract�areas�as�before�but�now�bringing�a�capability�of�cross -contract�opera-
tions).
The�State�Transit�Authority�of�New�South�Wales�(STA),�the�government-owned
operator,� is�the� largest�operator�with�26�contracts�and�runs�the�public�bus�net-
work�which�covers�almost�half�of�Sydney�(1.6�1.8�million�popula tion,�nearly�800
square�kilometres,�and�1,750�buses�operating�out�of�11�depots)� centered�on�the
Sydney�CBD�(See�Figure�1).�It�has�many�adjacent�contract�areas� so�that�its�services
are�not�delivered�on�a�contract�area�basis�per�se,�operating�as �one�very�large�pro-
vider.�The�STA�has�designed�a�route�network�of�services�that�takes�passengers�to
key�centers�across�a�region,�not�just�within�the�contract�area. �This�network�economy
is�achieved,�however,�at�a�relatively�high�internal�inefficienc y�cost�of�$4.86�per�bus
kilometer11�(in�contrast�to�the�best�practice�cost�of�$2.60/bus�kilometer�for�private
operators�who�currently�have�53�contracts�among�30�operators).� The�important
question�herein�is�the�extent�to�which�the�cross-contract�area� service�provision
has�contributed�to�these�higher�unit�costs�or�whether�it�is�the �product�of�govern-
ment�ownership�and�specific�restrictions�of�service�delivery.�Part�can�be�attributed
to�externalities�such�as�traffic�congestion.�Based�on�the�STA�s�operations�outside�of
the�Sydney�Metropolitan�Area�(in�Newcastle,�a�regional�Center�120kms�from�Sydney
with�a�population�of�about�500,000),�we�could�reduce�the�$4.86� to�$3.54�(Daniels
2002).�However� internal� inefficiency�must� account� for�much�of� t he� remaining
increment�above�$2.60.

Contract�Areas�and�Service�Quality�Issues
19
Figure 1. The Sydney Metropolitan Area and the STA Contract Area

Journal�of�Public�Transportation,�Vol.�6,�No.�3,�2003
20
The� literature�on� industrial�organization� from�which� ideas�cent ral� to� tendering
evolved�such�as�principal-agent�relationships,�transactions�costs,�and�economies
of�scale�and�scope,�puts�forward�compelling�arguments�that�many �of�the�gains�in
service�delivery� to� the�market� can�be�effected� through�preserva tion�of� smaller
effective�management�units�working�within�a�range�of�alliance�s tructures,�where
each�alliance�is�established�to�best�accommodate�the�interests�of�the�market�(i.e.,
customers)�and�the�interests�of�the�supplying�stakeholders�(see �Hay�and�Vickers
[1987]� and�Williamson� [1987]).�To�assume� that�one� large�organization�with� a
single�large�contract�area�(or�even�a�few�under�an�oligopoly)�is�the�best�way�for-
ward�in�servicing�the�market�is�questionable.�It�assumes�that�the�transactions�costs
between�operators�and�customers�are�excessive�and�the�transactions�costs�within
an�organization�are�nonexistent�or�minimal12.� Indeed�the� literature�on�the�eco-
nomic�theory�of�regulation�(or��capture��theory)�describes�how�regulatory�agen-
cies�may� end�up�more�or� less� in� the�pocket�of� those�whom� they�p urport� to
regulate.�The�response�in�some�industries�has�been�the�dismantl ing�of�such�regu-
latory� frameworks� through�economic�deregulation� (e.g.,� airlines ,� telecommuni-
cations),�with�a�replaced�regulatory�regime�focused�on�monitoring.
There�is�an�analogous�literature�arguing�for�local�specialization�and�alliances�in-
stead�of�the�formation�of�large,�single-entity�businesses.�Inde ed,�it�does�not�take
long�before�we�see�many�of�the�very�large�entities�essentially� operating�as�a�set�of
separate� entities�with�occasional� cross-subsidy� to� facilitate� short-run� (at� least)
viability�across�the�entire�set�of�organizations�under�the�one� control.�This�breeds
inefficiency�(like�governments�bailing�out�their�own�public�monopolies)�and�up-
ward�pressures�on� subsidy� support� from�government.�As�Preston� a nd�van�de
Velde� (2002)� state� ��governments� caving� in� to�operators� suffering� from� the
winner�s� curse�or� generally� finding� life� tough�was� a� real� threat� to� competitive
tendering�in�some�countries�and�situations.�
Fundamentally,� the� reduction� in� the�number�of� contract�areas� runs� the� risk�of
further�promoting�dominance�and�a�further�move�away�from�the�id eals�of�com-
petition�policy.13�It�is�a�dangerous�move�if�it�erodes�the�competitive�base�of�the�bus
market�in�the�sense�that�it�reduces�the�ability�to�promote�and�maintain�a�process
of�effective�or�potential�competition�so�as�to�achieve�a�more�e fficient�allocation�of
resources.14�In�large�measure,�we�have�to�put�to�the�test�the�case�that�such�amal-
gamations�deliver� additional�benefits� that�more� than�outweigh� t he�additional
costs.

Contract�Areas�and�Service�Quality�Issues
21
However�alliances�do�not�just�happen.�The�market�may�well�send� signals�to�en-
courage�such�alliances�but�there�is�no�guarantee�that�the�signa ls�will�be�registered
and�acted�upon.�To�ensure�market�signal�activation,�appropriate�information�and
incentives�need�to�be�put� in�place.�Government,�through� its� regulatory�agency,
can�make�a�major�contribution�to�this�process.�In�the�presence�of�imperfect�infor-
mation,�signaling�and�incentive�systems�are�at�the�center�stage.�To�date�in�most
international�settings�where�regulatory�reform�is�active,�there�is�little�evidence�of
alliances� (although� see�Norway� in� the�next�paragraph),�which� is �disappointing,
but�this�may�well�be�explained�by�the�strategic�intent�of�the�n ew�(global)�players
and�the�lack�of�incentives�in�the�past.�The�evolution�of�allian ces�will�require�much
more�incentive-driven�initiatives�by�the�regulator�especially�where�there�is�a�loss�of
internal�efficiency�due� to� the� scale�of�operations.�There� is�no �denying� that� this
happens,�but�what� is� important� is� the� size�of� an�operator�beyond�which� such
internal� efficiencies� come� into�play.� In�Sydney,� for�example,�where�most� recent
purchases�involve�operators�controlling�more�than�100�buses,�th ese�are�worrying
signals�(see�evidence�below).
There� is� an� interesting�history�of� cooperation� and�merger� in�Be rgen,�Norway
(Carlquist�2002).�Although�a�merger�attempt�between�the�two�maj or�operators
failed�in�the�early�1990s,�it�led�to�substantial�route�and�fare �cooperation.�In�1998�a
new�merger� attempt� succeeded.� Furthermore,� all�bus� companies� in � the� region
already�cooperated�in�an�alliance�regarding�electronic�ticketing�fare�coordination
and�purchasing.�It�was,�therefore,�easy�for�the�regional�public �transport�authority
to�impose�a�requirement�for�integrated�fares�in�the�performance �contract,�initi-
ated�in�2000.�The�operators�were�obliged�to�have�a�common�ticke ting�system�and
fare� tariff,�but� there� is�no� limit� to� the�upper� fare� level.�The re� is�no�evidence� to
support�(or�falsify)�the�existence�of�new�patronage�attraction�or�increased�benefits
to�existing�passengers,�although�Carlquist�(2002)�suggests�that �the�latter�is�more
likely�than�the�former.� In�either�case,� it�would�be�difficult�to�hypothesise�that�a
�successful��integration�was�due�to�regulatory�intervention,�as�a�successful�alliance
between�the�operators�already�existed.
Whether�by�amalgamation�of�ownership�or� alliance� formation,� the se� are�both
merger�phenomenon.�For�example,�combining�three�contract�areas� into�one�area
is�a�(horizontal)�merger�and�should�be�assessed�along�the�same� lines�as�the�merger
of�two�organizations.�If�there�are�economies�of�scale�(for�the� exact�same�service
type),�then�there�are�efficiency�gains.�The�realization�of�these�gains,�however,�could
be�offset�by�welfare�losses�due�to�reduced�competition,�be�it�a ctual�or�yardstick,�in
Journal�of�Public�Transportation,�Vol.�6,�No.�3,�2003
22
the� case�of� either� competitive� tendering�or�performance-based�contracts� (the
latter�during�the�contract�period�in�competing�for�incentive�payments,�the�former
at�the�time�of�bidding).�DeBorger�and�Kerstens�(2000)�review�th e�evidence�and
conclude�overall� that� there� are�no�economies�of� scale�but�mild� economies�of
scope�associated�with�demand�complementarities�where�the�evidence�suggests
spatial�demand�exists�beyond�contract/operator�areas.�The�latter�is�an�empirical
issue.�It�is�investigated�below�for�Sydney�where�there�is�very� little�intercontract�area
use�of�public� transport�but�opportunities� for� cross-regional� se rvices� capable�of
being�delivered�efficiently�by�a�single�operator.�Indeed,�as�organizations�increase�in
size,�they�lose�the�relative�precision�required�to�establish�the�value�of�specific�activi-
ties;�in�contrast,�through�alliances�there�is�much�more�precision�and�transparency.
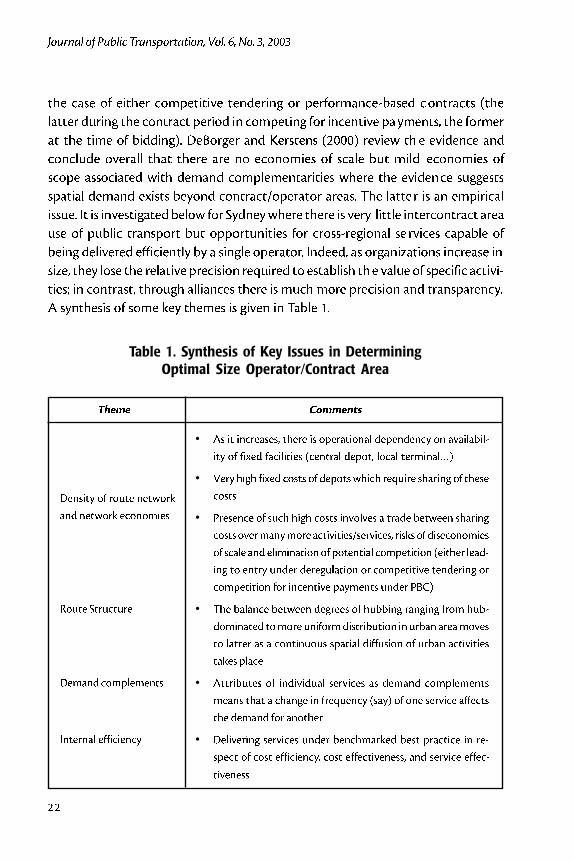
A�synthesis�of�some�key�themes�is�given�in�Table�1.
Table 1. Synthesis of Key Issues in DeterminingOptimal Size Operator/Contract Area
� As�it�increases,�there�is�operational�dependency�on�availabil-
ity�of�fixed�facilities�(central�depot,�local�terminal�)
� Very�high�fixed�costs�of�depots�which�require�sharing�of�these
costs
� Presence�of�such�high�costs�involves�a�trade�between�sharing
costs�over�many�more�activities/services,�risks�of�diseconomies
of�scale�and�elimination�of�potential�competition�(either�lead-
ing�to�entry�under�deregulation�or�competitive�tendering�or
competition�for�incentive�payments�under�PBC)
� The�balance�between�degrees�of�hubbing�ranging�from�hub-
dominated�to�more�uniform�distribution�in�urban�area�moves
to�latter�as�a�continuous�spatial�diffusion�of�urban�activities
takes�place
� Attributes�of� individual� services� as�demand�complements
means�that�a�change�in�frequency�(say)�of�one�service�affects
the�demand�for�another
� Delivering�services�under�benchmarked�best�practice� in�re-
spect�of�cost�efficiency,�cost�effectiveness,�and�service�effec-
tiveness
Density�of�route�network
and�network�economies
Route�Structure
Demand�complements
Internal�efficiency
Theme Comments

Contract�Areas�and�Service�Quality�Issues
23
The Theoretical Argument
The�relevant�literature�on�the�optimum�number�of�firms�in�a�market�focuses�on
the�cost�and�performance�structure�of�each�firm�both�in�respect �of�the�supply�of
services�and�the�welfare�benefits�to�passengers�of�a�specific�supply�regime.�Evidence
of�scale�and�scope�(especially�network�economies)�is�an�important�basis�for�com-
menting�on�the�appropriate�number�of�operators�(and�hence�contr acts).
Transaction�cost�economics�(TCE)�provides�an�appealing�framework�within�which
to�develop�the�arguments�for�the�roles�of�the�market�and�governance.�A�transac-
tion�occurs�when�one�stage�of�activity�finishes�and�another�beg ins.�With�a�well-
working�interface�these�transfers�occur�smoothly.�Establishing�a�smooth�transfer
is�what�network�economies�(including�integrated�fares)�are�all�about.�Their�achieve-
ment� is�possible� through�a�number�of� strategies� such�as�alliance�contracts�and
merger�(see�the�Bergen�experience�cited�above).�TCE�supplants�the�usual�preoccu-
pation�with�technology�and�distribution�costs,�with�an�examinat ion�of�the�com-
parative� costs� of� planning,� adapting,� and�monitoring� task� compl etion�under
alternative�governance�structures.�It�is�as�much�about�transact ions�within�a�single
entity�(e.g.,�one�bus�operator,�a�regulator)�as�it�is�between�entities.�It�pays�special
attention�to� information�signaling�and�processing�(and� its�asymmetry�through-
out�the�system),�bounded�rationality�(i.e.,�the�ability�to�proc ess�a�limited�amount
of� information),�hazard,�opportunism,�and�asset�specificity.
Transaction�cost�economics�maintains�that�it�is�impossible�to�concentrate�all�of�the
relevant�bargaining�action�at�the�ex�ante�contracting�stage�(wh ich�is�what�com-
petitive�tendering�essentially�does).�Instead,�bargaining�is�pe rvasive�in�which�case
the�institutions�of�private�ordering�and�the�study�of�contracti ng�in�its�entirety�take
on�critical�economic�significance.�Performance-based�contracts� (PBCs)�align�with
this�view�(see�Hensher�and�Stanley�2003)�since�the�market�opera tes�actively�through-
out� the�contract�period� (under� signals�delivered� through� incent ive�payments).
The�behavioral�attributes�of�human�agents,�whereby�conditions�o f�bounded�ra-
tionality�and�opportunism�are�joined,�and�the�complex�attribute s�of�transaction
with�special�reference�to�the�condition�of�asset�specificity,�are�responsible�for�this
condition�(Williamson�1987:�178).�Alignment�of�incentives�is�ce ntral�to�efficient
contracts� and�property� rights.�The� latter� emphasises� that�ownership�matters,
with�rights�of�ownership�of�an�asset�defined�as�the�rights�to�u se�the�asset,�the�right
to�appropriate�returns�from�the�asset,�and�the�right�to�change� the�form�and/or
substance�of�an�asset.

Journal�of�Public�Transportation,�Vol.�6,�No.�3,�2003
24
Transaction�cost�economics�acknowledges�merit�in�both�monopoly�and�efficient
risk-bearing�approaches�to�contract.� It� insists,�however,�that�efficiency�purposes
are�sometimes�served�by�restraints�on�trade.� (Williamson�1987:188).�This� state-
ment�by�a�pioneer�of�transactional�economics,�X-efficiency,�and�contracting�theory,
is�crucial�to�the�discussion�because�it�puts�forth�the�argument �that�examination�of
the�underlying�attributes�of� transactions�discloses� that� restra ints�on� trade�can
help�to�safeguard�the�integrity�of�transactions�when�firm-speci fic�investments�are
at�hazard.
Evidence on Cost Savings from Scale of Operations
One�useful�analysis�to�establish�the�potential�gains�for� larger �operations�(which
also�means�larger�contract�areas�and�hence�less�operators)�is�to�look�at�the�evi-
dence�on�performance�outcomes�when�tendering�for�different�size �bids.�A�caveat:
The�great�majority�of�the�empirical�evidence�focuses�on�operational�cost�savings
and�little�about�the�true�costs�of�conducting�tendering�and�mon itoring�etc.�The
competitive�tendering�of�a�large�public�sector�provider�delivers�an�immediate�cost
saving�but�it�is�a�once-only�gain.15��This�gain�is�greater�when�the�pretendered�unit�is
large�(as�in�most�government-owned�bus�operations,�such�as�occu rred�in�London
in�the�1980s�and�1990s)�and�it�is�being�tendered�out�as�a�set�o f�smaller�contracts.
Subsequent�retendering�of�the�smaller�contracts,�however,�leads �to�very�little�cost
savings� if� any.� Indeed,� the�often-quoted� cost� savings�up� to�20� percent� (net�of
administrative�costs�of�tendering)�do�not�shed�light�on�the�cru cial�question�as�to
what�proportion�of�these�savings�can�be�attributed�to�competiti ve�tendering�per
se.16�The�switch�to�a�smaller�operator�with�lower�fixed�costs�and�overheads�in�itself,
could�achieve�these�savings�regardless�of�the�mechanism�used�to �select�the�opera-
tor.
The�main�message�is�that�savings�increase�as�system�size�increases,�which�implies
that� if�we�move� to� larger� contracts�by�operator�merger� (or�buyouts�by� large
players),�we�can�expect�increases�in�the�costs�of�doing�busines s.�While�this�might
not�be�disputed,�the�rebuttal�is�likely�to�come�in�terms�of�network�economies�on
the�demand�side.�This�is�where�we�draw�on�transaction�cost�economics�to�assist,
since�even�in�the�presence�of�economies�of�network�integrity�there�are�alternative
ways�of�delivering�optimal�network�performance�without�creating �a�small�num-
ber�of�large�and�relatively�inefficient�contract�areas.

Contract�Areas�and�Service�Quality�Issues
25
Summary of the Main Argument
In�determining�the�appropriate�size�of�contract�areas,�it�is�important�to�recognize
both�internal�efficiency�and�external�benefit�arguments.�Intern al�efficiency�argu-
ments�recognize�the�importance�of�the�performance�of�the�service�delivery�entity
regardless�of�whether�the�objective�is�commercial�or�social�obl igation.�Efficiency
encompasses�cost�efficiency,�cost�effectiveness,�and�service�effectiveness.�External
benefits�focus�primarily�on�accessibility�and,�in�particular,�the�integrity�of�the�net-
work�and�associated�network�economies.
In�considering�the�appropriate�size�of�the�service�delivery�uni t�(SDU),�the�costs�of
transaction�are�very�important.�These�costs�are�not�limited�to� the�interfirm�envi-
ronment� (which�would� include� integrated� fares� and� servicing�of� an� intercon-
nected�network)�but�include�the�costs�outlaid�within�a�firm.�An �issue�of�relevance
in�achieving�the�efficiency�and�network�benefits� is� the�reveali ng�of� information
through�appropriate�signals�(either�from�the�market�or�by�the�r egulator)�to�en-
sure�that�the�best�information�is�acted�upon�to�deliver�service s�to�the�market�at
cost�efficient�and�effective�levels�that,�within�a�subsidy-dependent�environment,
delivers�best�value� for�money� (in�an�efficiency�and�equity� sens e)� for� the� scarce
subsidy�dollar.
Looking�at� the� internal� efficiency�of� an�SDU,� the�evidence� from� the�published
literature�supports�the�view�that�there�are�no�scale�economies� (over�100�buses)17
but�mild�network�economies.18�The� latter� translates� in�particular� into�an�argu-
ment� for� having� fewer� (or� even�one)� SDU�operating� a� network-bas ed� cross-
regional� service,� since� the�argued�benefits� to�passengers�are�g reater� than� if� the
cross-regional� services�were�provided�by�more�than�one�operator.�The�assump-
tion�implicit�in�this�evidence�is�that�passengers�would�have�to �transfer�between
modes�(or�bus�operators)�to�complete�their� journey.�These�network�economies
are�relatively�weak�where�cross-regional�services�are�shown�to� be�deliverable�by
smaller�operators�who�move� through�other� contract� areas�or�where,� through
contract�area�alliances�for�specific�routes,�they�can�pick�up�and�drop�off�passengers
anywhere�along�the�route.
A�good�example�in�Sydney�of�the�former�is�the�private�operator,�Forest�Coaches,
who�has�a� service� from�St.� Ives/Chatswood� (20�kms�north�of� the� city� in�a�very
wealthy�area)�to�the�city;�a�good�example�of�the�latter�is�the� 35�km�orbital�service
about�5�kms�out�from�the�CBD�in�Perth�(Western�Australia)�operated�through�an
alliance�of�three�operators.�This�last�example�is�equivalent�to �what�Adelaide�(South

Journal�of�Public�Transportation,�Vol.�6,�No.�3,�2003
26
Australia)�would� refer� to�as�a� route-specific�contract�across�contract�areas� (see
Appendix�2).�Creating�a�monopoly�supplier�to�deliver�the�mild�n etwork�econo-
mies�is�false�economy�since�it�will�almost�definitely�lead�to�major�losses�in�internal
efficiency.�Rather,�given�the�evidence�from�the�Transport�Data�Centre�(TDC)�of�the
NSW�government� that� the�majority�of� travel� in�Sydney�occurs� locally19�(mainly
within�one�contract�area�but�also�between�two�adjacent�contract�areas),�typically
over�80�percent�of�all�trips�(often�within�a�single�contract�area�using�a�bus�service
locally�or�to�access�a�rail�interchange),�the�risk�of�delivering�highly�expensive�local
services�to�the�majority�of�users�just�to�satisfy�a�claim�on�network�economies�for�a
small�amount�of�patronage�service�delivery�is�poor�economics.�Indeed,�encourag-
ing� longer� trips�by� any� form�of� transport� seems� inconsistent�wi th� a�desire� to
curtail�travel�and�promote�more�local�activity.
An�important�message�from�the�institutional�economics�literature�is�that�we�should
focus�on�efficiency�and�not�market�power�(the�concern�with�reducing�the�num-
ber�of�contract�areas);�and�we�should�not�aggregate�operators�o r�contract�areas
just�to�gain�network�benefits�in�situations�where�most�of�these �benefits�are�within
an�existing�contract�area�in�the�main.�Through�recognition�of�market�opportuni-
ties� (using�appropriate� signalling�methods� to� reveal�and�share� information�and
hence�reduce�information�asymmetry)�created�by�partnerships�between�all�opera-
tors�and�government�(via�the�regulator),�and�the�formation�of�o perator�alliances
to�serve�specialised�cross-regional�market�niches,�the�major�transaction�costs�(e.g.,
information� asymmetry)� appear� to�be�more� than�offset� by� the�hug e� gains� in
internal�efficiency�associated�with�operators�with�contracts�in�the�30�to�100�fleet-
size�range.�Importantly,�an�individual�operator�may�have�more�than�one�contract
(as�many�do),�but�there�are�sensible�arguments�to�support�the�maintenance�of
each�contract�as�a�separate�business�center.�Large�operations,�such�as�many�Asian-
based�bus�businesses�(e.g.,�in�Hong�Kong),�might�benefit�by�reviewing�their�struc-
tures�and�may�reduce�the�growing�levels�of�subsidy�support�that ,� in�part,� funds
inefficiencies.
Integrated Fares: Regulatory Control and/or Genuine Benefitto Passengers?
Do�people�need�to�use�more�than�one�mode�of�public�transport/
operator�to�use�public�transport�as�an�alternative�to�the�car?�Maybe
the�transfers�associated�with�multi-modal�movement�are�a�major
barrier�regardless�of�what�fare�arrangements�are�in�place?
Contract�Areas�and�Service�Quality�Issues
27
Integrated�fares�are�seen�as�a�way�of�attracting�more�public�tr ansport�patronage
because�they�enable�one�to�purchase�a�multimodal�and/or�multioperator�ticket�at
one�point� in� time� from�one�source.�Although�there� is� initial�appeal� in� this� fare
strategy,�the�justification�must�be�based�on�an�agreed�set�of�objectives.�The�most
important�must�be�a�benefit�to�passengers�(and�associated�flow- through�to�op-
erators�and�the�community�at�large).�It�is�assumed�that�one�of� the�reasons�why
public�transport�is�not�used�as�much�as�it�might�is�the�poor�in tegration�of�services
across� the�network.�One� feature�of�poor� integration� is� the�need � to�purchase�a
separate�ticket�from�each�operator,�which�is�assumed�to�be�more�expensive�than
the�purchase�of�a�single�multimodal/operator�fare�because�of�the�fixed-cost�com-
ponent� in� each� ticket.�The�presumption� is� that� there�would�be� a � single-fixed
component�in�an�integrated�fare�(although�this�needs�to�be�demonstrated).
Overriding� the�actual� fare� level� is� the� issue�of�network� integr ity� and�what� this
actually�means�for�passenger�growth�and�benefit.�What�is�the�ev idence�that�pas-
sengers�actually�want�to�travel�by�a�number�of�public�transport �modes�across�a
network�if�the�modes�were�better�integrated?�What�is�the�eviden ce�that�integrated
fares�is�the�solution�(or�even�a�significant�contributor)?�The�counterfactuals�would
have�to�show�that�improved�integration,�on�whatever�criteria�ar e�adopted,�would
indeed�show�movements�between�modes�and�operators�that�are�currently�not�able
to�be�undertaken.�The�opportunity�for�such�travel�does�exist�in�most�cities�(at �least
to�some�extent)�in�terms�of�services�available,�but�is�it�what� people�want?�Such�a
system�leads�to�transfers�and�with�greater�dominance�of�a�few�operators�there�is�a
real�risk�on�hubbing�whereby�transfers�become�a�negative�featur e.�The�evidence�in
Appendix� 1� from�around� the�world� initially� looks� compelling,� bu t� it�must�be
interpreted�very� carefully.�What� exactly� are�we� seeing�some� sort�of�discount
disguised� through� integrated� fares� and/or�genuine� contributions � to� improving
mobility�across�the�network?
To�illustrate�this�matter,�Table�2�shows�the�year�2000�evidence�on�public�transport
use�in�Sydney�involving�more�than�one�public�mode.�The�use�of�m ultiple�public
modes�in�2000�is�17.4�percent.�This�table�distinguishes�the�number�of�times�in�a
trip�that�a�specific�mode�is�used.�Of�particular�interest�is�the�use�of�more�than�one
bus� for�a�one-way� trip.�Out�of� a� total�of�1.29�million�daily�pa ssenger� trips� that
involve�at� least�one�public�mode� in�a� trip� chain,� 2.861�percent �of� all� trips� (i.e.,
36,982� trips)� involve� two�or�more�buses.� It�might�be�argued�tha t� switching�be-
tween�buses�highlights� a�downside�of� services� that� is�better�de livered� through
single-vehicle�cross-regional�services.�The�greater�amount�of�the�multiple-bus�trips

Journal�of�Public�Transportation,�Vol.�6,�No.�3,�2003
28
are�on�government�buses� (31,508�or�85.2%)�operating�close� to� th e�CBD,�which
may�say�something�positive�about�the�ability�to�travel�beyond�contract�areas�by
bus�although�it�says�something�negative�in�respect�of�the�requi rement�to�have�to
transfer.20
Table 2. Average Day Linked Trips Involving at LeastOne Public Transport Mode, HTS2000
Note:�Data�includes�trips�that�may�have�used�other�(non-T)�modes.�The�other�modes�are�ignored;
therefore�one�public�bus�may�mean�one�public�bus�only�or�one�public�bus�plus�car.
Public�Bus
Ferry Private�Bus Train 0 1 2 3 4 Total
0 0 0 338,364 28,065 1,396 346 368,171
0 0 1 446,502 72,852 3,229 522,583
0 0 2 34,132 2,868 197 235 37,432
0 0 3 2,739 571 214 3,524
0 0 4 428 428
0 1 0 267,790 2,372 270,162
0 1 1 45,883 2,605 48,488
0 1 2 1,926 365 2,291
0 2 0 6,688 6,688
0 2 1 2,471 132 2,603
0 3 0 1,397 1,397
1 0 0 15,281 5,166 1,070 21,517
1 0 1 2,574 1,044 3,618
1 0 2 1,252 1,252
1 1 0 634 234 868
1 1 1 375 375
2 0 0 1,055 159 1,214

Contract�Areas�and�Service�Quality�Issues
29
Interconnectivity� involving�more� than�one�bus�operator� in�Sydne y� is�negligible
(even�if�one�argues�this�is�due�to�relatively�poor�existing�int erconnectivity)�and�is
unlikely�to�be�of�concern�to�most�of�the�traveling�population.� While�it�might�be
argued�that�the�nature�of�the�existing�network�of�services�deni es�this�opportunity
(and�certainly�the�counterfactuals�are�not�available),�if�such�network�connectivity
were�to�be�provided�and�would�increase�patronage,�the�issue�of� relevance�here�is
whether�cross-regional�and�long-haul�metropolitan�services�can� be�achieved�un-
der�existing�area�contracts�by�appropriate�alliances�which�preserve�the�efficiencies
of�each�operator�(including�transaction�cost�advantages).
The�recent�growth�in�cross-regional�services�in�Sydney�by�private�operators�with-
out�transfers�demonstrates�one�useful�counter-factual� in�which�a�passenger�can
travel�on�a� single-mode/single-operator� service�without�transfe rs�over� long�dis-
tances�within�the�Sydney�Metropolitan�area�(to/from�the�CBD�which�is�not�owned
by�a�single�contract�and�an�open-access�service�zone).�Examples�include�the�Westbus
M2�and�Hills�services�(in�the�northwest),�Harris�Park�Citybus�( from�Parramatta�in
the�west),�and�Forest�Coaches�St.�Ives/Chatswood-City�service�( in�the�north),�all�of
which�serve�the�outer�suburbs�and�deliver�passengers� into�the�C BD�(see�Figure
1).21�Similar�examples�exist�for�the�STA�except�that�many�of�the�STA�services�are
across�contract�areas�belonging�to�the�STA�enabling�pick�up�and�drop�off�across
the�contract� areas� (although�one�might�argue� that� strictly� this � is� violating� the
terms�of�a�contract).�The�need�for�integrated�fares�in�these�ex amples�(where�public
transport� is� showing�evidence�of� serious� competition�with� the� car)� is�not� rel-
evant.22
Integrated�fares�are�a�form�of�regulatory�intervention�if�imposed�on�all�operators
from�above�since�all�must�conform�to�the�grand�plan.�As�Hibbs�( 2000)�has�indi-
cated,�constructs�of�integration�(of�which�integrated�fares�are �an�example)�lead�to
a�weakening�of�both�effectiveness�and�efficiency.�It�denies�individual�operators�or
groups�of�operators�the� full�ability�to�be�responsive�to�market �opportunities� in
ways� that�are�consistent�with�delivering� the�appropriate� services� to�customers.
Again,�Hibbs�and�others�argue�that�other�than�the�regard�for�sa fety�and�issues�of
scale�and�power,�public�passenger�transport� is�a�market-based,� customer-driver
activity�and�especially�with� regard� to� its� relationship�with� the�private�car,� from
where�most�of�its�competition�comes.�Integrated�fares�dictated� across�the�board
may�well�be�inequitable�as�well�as�an�inefficient�way�of�securing�optimum�social
benefit.23�Market-based� fares�policies�designed�to�benefit�users�are�need ed,�and
the�best�test�of�this�is�the�levels�of�patronage�resulting�from�the�policy.�If�a�specific
Journal�of�Public�Transportation,�Vol.�6,�No.�3,�2003
30
arrangement�or�alliance�between�operators�in�a�particular�publi c�transport�chain
sees�merit�in�integrated�fares,�then�this�should�be�supported,� but�not�as�a�carte
blanche,�no-choice�policy.�The��one-size-fits-all��philosophy�is�very�dangerous�and
counterproductive.
What Is the Broader Evidence on Patronage Benefits?
The�matter�of�integrated�fares�and�impacts�on�patronage�is�not�well�studied.�There
are�virtually�no�published�papers�on�the�topic�that�make�the�li nk�clear�and�unam-
biguous.�That�is,�unless�one�can�separate�out�all�the�other�cha nges�that�are�hap-
pening�at�the�same�time�(e.g.,� fare�discounting),24� it� is�not�possible�to�make�any
sensible� statements� on� the� specific� contribution� of� integrated/ intermodal/
interoperator� fares.
In�reviewing�the�literature�we�have�found�a�number�of�comments� that�state�that
intermodal� fares� are�often� inappropriate�where�one�has�mainly�mode-specific
travel.�That�is,�most�circumstances�where�the�topic�is�mentioned,�talk�about�lim-
ited�modal�switching�(i.e.,�rail�to�bus)�and�focus�on�single-mode�discounted�fares
and�other�deals�(including�the�growing�interest�in�multipurpose �fare�media�that
enable�one�to�use�a�smartcard�on�buses,�shopping,�cinemas).�The �examples�never
refer�to�smartcards� for�traveling�on�buses�and�trains,�which� is � interesting�by� its
absence.
The�studies�in�Appendix�1�are�based�on�a�literature�review�by�Booz�Allan�Hamilton
(BAH)�in�2002.�Most�are�questionable.�For�example,�one�of�the�b etter�studies�by
London�Transport� (Fairhurst�1993)� found� that� the� introduction�of�Travelcards
boosted�passenger�miles�in�the�first�year�by�3.83�percent�is�ba sed�on�very�aggre-
gated�time�series�data.�We�question�what�other�control�variables�were�included.
The�paper�by�Foote�and�Darwin�(2001)�for�Chicago�concludes�that �a�3.6�percent
increase�in�ridership�over�a�year�when�AFC�was�introduced�is�attributed�to�many
factors�but�most�is�attributed�to�fare�policies�within�a�single �mode�(which�is�more
reflective�of�where�the�market�is).�The�overall�growth�impact�( i.e.,�new�trips)�of�all
sources�of� fare�changes� is�maximally�30�percent�of�3.6�percent� or�1.08�percent.
Clearly�much�less�than�10�percent�suggested�by�the�BAH�review.25
The�Dutch�rail-taxi�combination�introduced�in�2000�is�another�e xample�of�inte-
gration� of� two�modes.�One� cannot� infer� anything� about� patronage � growth
because�the�new�taxi� services�provided�were� rather�different� from�those�of� the
ordinary�taxis.�The�train-taxis�have�a�lower�quality�of�service .�With�more�passengers
per� taxi,� one�may�have� to�wait� at� the� railway� station.�Another� example� is� the
Contract�Areas�and�Service�Quality�Issues
31
introduction�of�the�standardized�nationwide�bus/tram/metro�ticket�in�the�Neth-
erlands�in�the�1970s,�enabling�passengers�to�use�the�same�ticke t�irrespective�of�the
mode�or�the�company�providing�the�services.�No�monitoring�was�undertaken�on
the�effects�of�its�introduction�at�that�time.�Such�changes�tend�not�only�to�encour-
age�integration�but�also�produce�a�different�price�structure.
ConclusionsThe�arguments�and�evidence�presented�in�this�article�suggest�th at�the�perceived
gains�from�the�reduction�in�the�number�of�contract�areas�are�likely�to�be�illusory.
If�the�gains�in�network�economies�are�not�sufficiently�large�to �outweigh�any�likely
loss�of�internal�efficiency,�there�is�a�case�for�amalgamating�contract�areas�to�ensure
that�local�services�are�not�hampered�by�cross-contract�area�constraints�on�service
delivery.�Given�the�major�focus�on�local�service�provision,�opportunities�to�deliver
appropriate�cross-regional�and�cross-network�services�can�be�revealed�and�pro-
moted�by�partnerships�between�bus�operators�and�the�regulator.
A�mechanism�by�which�the�appropriate�market�signals�are�captured�and�made
available�to�all�relevant�parties�(i.e.,�the�release�of�informa tion)�is�required.�Inte-
grated� fares� as�one� instrument� to�promote�network�public� transport� activity,
while�having�some�merit,�are�unlikely�to�be�a�major�influence�on�the�take-up�rate
of�cross-regional�network�services�since�they�are�best�supplied �as�a�single�modal
service� through�an�alliance�or�agreement� for�a� single�operator� to�deliver� cross-
contract�route-specific�services�where�transfers�are�minimised� if�not�eliminated.
Then�and�only�then�might�we�have�a�chance�of�taking�some�traffi c�from�the�car
market.

Journal�of�Public�Transportation,�Vol.�6,�No.�3,�2003
32
Appendix 1. Impact of Fares and Ticketing Integrationon Patronage International Case StudiesSource:�Booz�Allan�Hamilton�Review�2002
London
As�part�of�a�number�of� initiatives� to� increase�public� transport �use,�multimodal
Travelcards�were�introduced�for�bus�and�underground�services�during�early�1983.
Rail�was�later�included�in�the�scheme�with�the�merging�of�Travelcard�and�Capitalcard
during�1989.�Fairhurst�(1993)�sought�to�separately�isolate�patr onage�impacts�from
changes�in�fares�and�fares�integration.�The�first�year�impact�f rom�fares�integration
was�significant�with�passenger�miles� increasing�around�18�percent�on�buses,�28
percent�on�underground�services,�and�24�percent�overall.
Paris
In�mid�1975,�the��Orange�Card��was�introduced�in�the�Paris�regi on.�The�card�is�a
nontransferable,�monthly�(or�yearly)�season�ticket�that�can�be� used�on�different
transport�modes�including�bus,�the�metro,�suburban�train,�and�v arious�operator
networks�(i.e.,�RER,�SNCF,�APTR).�The�Orange�Card�has�had�a�significant�effect�on
patronage�although�the�impacts�on�bus�and�metro�services�have�been�dispropor-
tionate.
New�York
A�major�change�in�ticketing�occurred�in�New�York�during�1997�with�the�introduc-
tion�of�the��MetroCard.��A�stored�value�card,�the�MetroCard�can�be�used�on�the
bus�and�the�subway�and�is�accepted�by�all�operators.�The�MetroCard�had�a�signifi-
cant� effect�on�patronage,�particularly�buses.� Between� July�1996 �and� July�1997,
average�weekday�bus�ridership�increased�16.9�percent�and�averag e�weekend�bus
ridership�increased�20.2�percent.�The�effects�on�the�subway�wer e�less�marked,�with
weekday�subway�ridership�increasing�by�2.6�percent.�Overall�rid ership�levels�were
at�their�highest�since�1971�(Walker�1997).
Zurich
Prior�to�the�introduction�of�integrated�ticketing,�Zurich�was�characterized�by�an
exceptionally�high�level�of�public�transport�use.�Schedules�were�coordinated�on�a
voluntary�basis�with�each�operator�having�its�own�fares.
After� the� formation�of� the�Zurcher�Verkenrsverbund� (ZVV),� a� comprehensive
integrated�fare�and�ticketing�system�was�introduced.�This�invol ved�the�full�coordi-

Contract�Areas�and�Service�Quality�Issues
33
nation�of�services�and�the�development�of�a�single�fare�system�based�on�zonal�fares.
The�combination�of�these�two�factors�increased�overall�patronage�by�an�average
12�percent� in� the� first� twp�years�of�operation,�with� significan t� increases�of� 53
percent�and�30�percent�for�feeder�buses�and�heavy�rail�respecti vely�(Laube�1995).
Surrey
Surrey�County�Council�has�made�significant�investments�in�sever al�public�trans-
port�schemes�including�the�Travelwide�ticket�in�Woking.�User�surveys�were�con-
ducted�to�evaluate�the�performance�of�such�schemes.�Surveys�rev ealed�that�the
Travelwide� ticket�had� little� effect�on�patronage� in� terms�of� take-up�by�existing
users�(i.e.,�less�than�2%�of�bus�users�had�used�the�Travelwide�ticket).�The�Travelwide
ticket�had�limited�success�in�generating�new�bus�journeys.�Overall,�the�study�con-
cluded�that�the�multiple�journey�Travelwide�ticket�had�a�negligible�effect�on�pa-
tronage� (unknown�author).
Los�Angeles
Interoperator�transfers�accounted�for�less�than�0.5�percent�of�total�regional�rides
prior�to�the�growth�of�fares�and�service�integration.�As�servic e�and�fares�integra-
tion�grew,� the�number�of�passengers�making�multioperator� trips� increased.�By
1994�the�number�of�multioperator�trips�had�increased�2�percent� (i.e.,�11�million
boardings�per�year)�(Carter�and�Pollen�1994).
Chicago
A�Chicago�study�estimated�that�ridership�would�increase�between �2�to�5�percent
as� a� result�of� the� introduction�of� automated� fare� collection� sy stems� (Dinning
1996).
West�Midlands
One�of�the� first�major�examples�of� integrated�ticketing� in�Britain�was�the�West
Midlands�Travelcard�scheme�introduced�in�1972.�As�result�of�the�scheme�it�was
estimated� that� 7� percent�more� trips�were� being�made� by� 1981� (Wh ite� and
Brocklebank�1994).\
Singapore
During�1991� to�1992,� the� �Farecard�� system� in� Singapore� increas ed�passenger
numbers�by�2.5�percent.�Given�the�increases�in�fare�levels,�thi s�outcome�was�not
anticipated�(Baggaley�and�Fong�Choon�Khin�1994).

Journal�of�Public�Transportation,�Vol.�6,�No.�3,�2003
34
Appendix 2. Contract Area Size: The Adelaide ViewSource:�Tom�Wilson,�Passenger�Transport�Board,�Adelaide
Our�limited�experience�in�Adelaide�was�that�there�seemed�to�be�little�interest�from
tenderers� in� contracts�with� less� than�30�buses� (e.g.,� the�Outer�NE�Transit� Link
Contract� for�25�buses).�Of� course,� there�are�many�arguments�about�bus�depot
size,�but�a�large�contract�can�easily�have�a�number�of�depots.
As�someone�who�largely�designed�the�shape/size/boundaries�of�ou r�Adelaide�con-
tracts,�I�would�suggest�that�the�most�important�issues�are:
� Closely�examining�the�structure�of�the�existing�route�network�to�see�how
it�fits�together,�and�locate�the�natural�breaks�and�boundaries
� Examining�geographic�boundaries
� Examining�passenger� travel� patterns� as�well� as� having� a� knowledge�of
nonpublic�transport�(but�potential)�travel�patterns
� As�the�main�all-day�public�transport�passenger�flows�in�Austral ian�suburbs
are�primarily�to�the�City�and�to�major�regional/district�centers,�these�cen-
ters�(and�major�interchange�points)�should�form�the�focus�point s�of�con-
tract�areas.�They�can�either�be�in�the�center�of�them,�so�the�c ontract�area
surrounds� and� focuses�on� them,�or�on� the�boundaries�of� two�or�m ore
contract� areas,� so� that� each�adjacent� contract� area� can� focus�on� those
centers.�The�trade�areas�of�these�centers�is�an�important�element�in�con-
tract�area�design
� Allowing�cross-boundary�services�to�continue,�and�ensuring�that �new�cross
boundary�services�can�be�implemented�by�writing�their�possibili ty�into�the
contracts.�Cross�boundary� services� should�generally�be�allocated� to� the
contract�area�within�which�most�of�the�route�falls
� Alternatively,�very�long�cross�boundary�routes�could�be�treated�as�separate
�route��contracts,�providing�a�significant�number�of�buses�is�i nvolved
� Small� route�groups�that�do�not�comply�with�all�of� the�above�should�be
amalgamated�with�the�larger�area�contracts�to�allow�flexibility �in�network
planning.�They�could�be�retained�if�necessary�where�they�serve� an�isolated
area�(e.g.,�a�suburban�area�on�one�of�Sydney�s�many�peninsulas�could�have
its�own�contract�without�impacting�on�flexibility)

Contract�Areas�and�Service�Quality�Issues
35
Endnotes1�Readers�unfamiliar�with� the�details�of� competitive� tendering�wi ll� find�a�useful
summary�in�Hensher�and�Brewer�(2001:�27�34.)
2�Integrated�fares�is�not�the�same�as�integrated�ticketing.�The� latter�refers�to�the
technological�platform�within�which�operators�provide�electronic�tickets.
3�See�Note�1.
4�See�Note�2.
5�Although�not�the�focus�of�this�article,�an�important�issue�is�t he�mechanism�for
distributing� the� fare� revenue� to� the� transport� suppliers,� compl icated� in� some
jurisdictions�by�the�absence�of�a��flag�fall��component�of�a�bu s�fare�for�each�leg�of
a�trip�(i.e.,�a�fixed�overhead�charge�per�trip�regardless�of�di stance�traveled).
6�Australasia�includes�Australia�and�New�Zealand.
7�An� important�distinction� is�made�between�contract/operator�areas�that�are�a
single�route�in�contrast�to�a�geographical�area.�The�distinction�appears�primarily�a
matter�of�shared�resources�such�as�depots�and�coordinated�timetabling.�A�review
of�the�literature�failed�to�find�a�single�paper�addressing�this �issue.
8�Although�the�firm�size�literature�includes�direct�competition� between�firms,�it
also�recognises�situations�in�which�firms�operate�as�spatial�monopolies�as�is�the
situation�with�bus�operators�who�do�not�compete� in�the�market�( even�though
they�compete�with�the�car).
9�The�question�not�addressed� in�the� literature�on�bus�provision� i s�the�extent�to
which�innovative�opportunities�are�greater�under�regimes�which� lessen�the�power
of�the�regulator�in�delivery�of�services.�It�may�be�the�case�th at�the�empirical�evi-
dence,�as�limited�as�it�is,�is�misleading�because�of�the�failur e�of�incentive�structures
to�deliver�the�gains�which�are�inherent�in�a�less�constrained�market.�We�need�to
understand�the�circumstances�under�which�incentives�can�evolve�and�be�effective.
One�problem�with�the�bus�industry�may�be�that�the�lack�of�exper ience�in�manag-
ing�change�and/or�the�reticence�in�being�innovative�given�a�his tory�of�suppression
of� innovation� is� hampering� the� speed�of� taking�up�opportunities �waiting� for
action.�Generational�inheritance,�for�example,�which�often�lack s�an�understand-
ing�of�the�need�to�sustain�wealth�and�survival�leads�to�a�reduction�in�entrepreneur-
ial�activity�and�hence�a�decline�in�any�potential�innovation.

Journal�of�Public�Transportation,�Vol.�6,�No.�3,�2003
36
10�The�winner�s� curse� exists�when� the�winning�operator�discovers�after�winning
that�it�has�overpaid�given�the�real�value�of�the�tender.
11��All�costs�are�in�$AUD,�with�$AUD1.0�approximately�equal�to�$U.S.�0.59.
12��The�internal�efficiency�of�an�organization�depends�on�the�degre e�of�competition
it�faces�in�so�far�as�competition�affects�managerial�incentives �and�opportunities.
One�way�that�competition�sharpens�incentives,�and�hence�internal�efficiency,�is�by
permitting� the� relative�performance�of� agents� to�be� compared.�Benchmarking
runs�the�real�risk�of�being�lost�with�a�very�few�operators.
13��In�Oslo�there�is�currently�discussion�about�the�contract�size�for�the�future�bus
tenders.�The�authority�has�clearly�stated�that�operators�should �be�given�financial
incentives� for�passenger�growth�and� service�quality,� and�performance� contract
principles� should�be�applied.�The�problem�here� is� that�there�are�two�principal-
agent�relationships.�Firstly,�there�will�be�a�contract�between�the�city�and�the�mu-
nicipal� company� (Oslo�Sporveier)� that� serves�as� the�public� transport�executive
(PTE).�This�will�be�a�network-wide�net�contract�that�will�not�be�tendered.�Previ-
ously,�this�relation�was�subject�to�a�performance-based�subsidy,�but�this�has�been
discontinued.�Secondly,�there�will�be�tendered�subcontracts�for�various�packages.
These�are�the�contracts�for�which�performance-based�principles� will�be�applied.
(Both�net�and�gross�contracts�are�currently�in�use�for�these�operations,�but�ten-
dering�has�not�yet�commenced.)�To�ensure�a�sufficient�number�of�competitors,�it
is�expected�that�the�PTE�will�want�to�restrict�the�size�of�contract�areas.�In�practice
this�will�mean�that�the�tender�packages�will�consist�of�a�small �number�of�routes.
The�Oslo�network�is�complex�and�routes�crisscross�all�over�the�city.�Consequently,
it�may�be�difficult�to� implement�net-cost�contracts,�at� least�without�a�sophisti-
cated�revenue�allocation�system.�The�alternative�is�a�gross-cost�system�with�quality
incentives,�but�that�is�something�different�from�the�Hordaland� type�model,�which
requires�a�net-cost�contract.
14��Although�not�specifically�related�to�number�of�operators,�the�i ssue�of�who�owns
what�is�very�important�in�determining�economic�efficiency�in�service�delivery.�Op-
erating�franchises,�such�as�those�in�Adelaide�that�separate�investment�from�oper-
ating�decisions,�are��bound�to�result�in�resource�misallocation,�manifested�by�over-
capitalization� and� the�production�of� dispensable� and�underutili zed� services�
(Berechman�1993:294).�Apart� from�the�diverse�goals�of� the�owner �of� the�assets
(i.e.,�public�sector)�who�promote�social�welfare�outcomes�in�contrast�to�the�com-
mercial�outcomes�of�the�operator,�the�government�and�operator�disproportion-
Contract�Areas�and�Service�Quality�Issues
37
ately�share�the�overall�risk�since�the�bulk�of�the�risk�associa ted�with�capital�invest-
ment�(notably�the�fleet)�is�assumed�by�government.�With�the�ris k�of�overcapital-
ization�greater�than�under�single�ownership�(and�a�single�commercial�objective),
the�loss�of�economic�efficiency�is�very�real,�exacerbated�if�the�operator�engages�in
higher�risk�projects�than�it�would�otherwise�do�so�if�it�carried�the�full�risk.�This�risk
can,� in�part,� be� circumvented�by�monitoring�but� at� a�much�highe r� level� that
would�be�required�if�the�operator�carried�all�the�risk.�It�is�doubtful�that�the�gov-
ernment�would�be� able� to� acquire� all� the�necessary� information� on�costs� and
demand�without�outlaying�a�lot�of�resources.�Transactions�costs�are�likely�to�raise
questions�about�the�value�of�this�approach�to�service�delivery.�Under�risk-sharing
the�notion�that�bidders�are�expected�to�bear�the�entire�risk�st emming�from�invest-
ment�and�operational�decisions,�with�the�face�value�of�their�bi ds�serving�as�a�sound
predictor�of�their�expected�performance,�evaporates.
15��If�costs�of�having�a�private�firm�supply�the�services�could�be �reduced�by�means
of�a�negotiated�contract,�the�considerable�costs�of�organizing� a�competitive�bid-
ding�would�be�averted.�Indeed��a�competitive�tendering�scheme�m ight�in�some
cases�be� inferior� to�methods�of� contract� renewal�or�negotiation�� (Berechman,
1993,� 298�99)
16�Within� the�Sydney�metropolitan�area,�private�bus�operators�are � some�of� the
most�cost�efficient�in�the�world.�Consequently,�competitive�tendering�is�very�un-
likely�to�deliver�financial�benefit.
17��There�is�a�case�for�economies�of�scale�in�moving�from�a�very�small�operation�such
as�1�to�4�buses�up�to�about�30�buses,�but�over�the�range�30�to� 100�we�see�almost
constant� returns� to� scale�with� decreasing� returns� to� scale� over � 100� buses
(Berechman�1993�and�personal�communication�(July�11,�2002)�with�Kjell�Jansson,
Sweden).� Fleet� size� is� an�appropriate� indicator�of� scale,�being �highly� correlated
with�other�contenders�such�as�population�per�square�kilometer�(a�correlation�of
0.886�for�the�STA�contract�areas).�Other�indicators�such�as�area�(in�sq�kms)�has�a
simple�correlation�of��0.80�for�STA��areas.
18�The�Sydney�2000�Olympics�provided�valuable�evidence�on�this�ma tter�(Hensher
and�Brewer�2003).�The�depot�set�up�to�coordinate�bus�services�a ccommodated
more�than�1,000�buses,�substantially�larger�than�the�largest�de pot�in�Sydney�under
normal�conditions�(an�STA�depot�with�250�buses).�In�hindsight,�it�was�concluded
that�major� internal� efficiencies� could�have�been�obtained�by�ha ving�a� series�of
smaller�depots�up�to�150�buses.

Journal�of�Public�Transportation,�Vol.�6,�No.�3,�2003
38
19�We�would�argue�that�this�is�common�in�most�large�metropolitan�areas.
20.�Research�by�Alsnih�and�Hensher�(2003)�suggests�that�seniors�and �the�elderly
(i.e.,�individuals�over�55�years�old)�are�less�inclined�to�use� public�transport�where
transfers�are�required.
21�Examples�of�cross-regional�services�in�the�text�are�very�weak�because�they�do�not
involve�picking�up�and�dropping�off�in�more�than�one�contract�a rea.�(The�CBD�of
Sydney�is�not�a�contract�area.)�This�ability�does�not�exist�among�private�operators
in�Sydney�because�of�the�existing�contract�requirements.�It�is� suggested�that�the
government�operator�(State�Transit)�has�true�cross-regional�services�such�as�Route
400�(Burwood�to�Bondi�Junction),�Route�370�(Coogee�to�Leichhard t),�and�Route
L20�(City�to�Parramatta).�Private�operators�have�not�to�date�de veloped�strategic
alliances�to�pick�up�and�drop�off�in�more�than�one�operator�s�area,�denying�them-
selves�of�alliance�revenue.
22�Although�the�automated� fare�collection�(AFC)�system�of� the�STA�shows�that
one� in� five�boardings� is�made�by�a�Travelpass� ticket�of�which�66�percent�are�a
train+bus+ferry�ticket�and�32�percent�are�a�bus-ferry�ticket�(w ith�only�3%�being
bus�only),�it�is�unclear�as�to�whether�the�ticket�purchaser�actually�uses�more�than
one�mode�or� is�simply�taking�advantage�of�the�attractive�discounts�offered.�For
example,�the�average�discount�on�Travelpasses�is�between�27�and �36�percent.
23��The�inequity�is�likely�to�arise�from�cross-subsidy�to�the�relat ively�wealthier�trav-
elers�who�tend�to�undertake�the�longer�trips.
24�The� introduction�of� integrated� fares� is�often� in� conjunction�wi th�other�mea-
sures,� such�as� increased�marketing�budgets�to�push�the�new�tick eting�and�pro-
moting�bus� travel,� better� information� systems,� increased�bus� fr equencies� and
discounts�to�fares.�Increased�discounting�would�be�a�feature�of �many�integrated
ticketing�exercises�and�would�have�an�impact�on�ridership.
�25�One�referee�suggested,��The�appendices�definitely�demonstrate�i ncreased�rider-
ship�in�cases�of�fare�integration.��While�not�denying�the�absolute�evidence,�the�text
argues�that�the�contribution�of�fare�integration�to�the�patrona ge�increases�is�by
no�means�clear�and�that�other�factors�have�played�a�role.�We�support�a�much�more
carefully�constructed�empirical�study�to�establish�the�wider�set�of�influence�son
patronage�increases�rather�than�credit�it�all�to�fares�integrat ion.

Contract�Areas�and�Service�Quality�Issues
39
Acknowledgments
Discussions�with�Erik�Carlquist,�Rhonda�Daniels,� Erne�Houghton,� John�Stanley,
Tom�Wilson,�Piet�Rietveld,�David�Royle,�Kjell�Jansson,�and�Darryl�Mellish�are�grate-
fully�appreciated.�The�STA�data�was�provided�by�Rhonda�Daniels.�The�comments
of�two�referees�were�especially�useful.
Journal�of�Public�Transportation,�Vol.�6,�No.�3,�2003
40
References
Alsnih,�R.,�and�D.�A.�Hensher.�2003.�The�mobility�and�accessibility�expectations�of
seniors�in�an�aging�population.�Institute�of�Transport�Studies.�The�University�of
Sydney,�March.
Baggaley,� J.� and�M.� Fong�Choon�Khin.� 1994.� Farecards:� The� fair� way� forward?
Proceedings�of�the�International�Conference�on�Advanced�Technologies�in�Trans-
portation�and�Traffic�Management.�Singapore,�18�20�May.
Berechman,�J.�1993.�Public�transit�economics�and�deregulation�policy.�North�Hol-
land,�Amsterdam.
Carlquist,�E.��2002.�Comments�on�this�paper,�personal�email�communication,�18
July.
Carter,�D.,� and�C.�Pollen.�1994.�A� Joint� Effort:�Multi-Operator�Fare� Integration.
California:�Booz�Allen�and�Hamilton.
Daniels,�R.� � 2002.�Comments�on�Cost�Differences,�personal� communication,�31
May.
DeBorger,�B.,�and�K.�Kerstens.�2000.�The�performance�of�bus-transit�operators.�In
Handbook�of� transport�modelling.�D.�A.�Hensher�and�K.� J.� Button,�K.J.,� eds.:
577�595.�Handbooks� in�Transport,�Volume�1.�Oxford:�Pergamon�Press.
Dinning,�M.� 1996.�The�business� case� for� smartcards� in�public� tr ansit� systems.
Washington�DC:�U.S.�Department�of�Transportation.
Fairhurst,�M.�H.�1993.�Fares�and�ticketing�policy� in�London:�From�Travelcards�to
smartcards.�London�Transport.�Research�Report�R273.� LT�Planning�Depart-
ment.� July.
Foote,�P.,�and�S.�Darwin.�2001.� Impacts�of�transit� fare�policy� initiatives�under�an
automated�fare�system.�Transportation�Quarterly�54�(3):�51�66.
Hay,�D.,� and� J.�Vickers.� 1987.�The�economics�of�market�dominance.�Oxford:�Basil
Blackwell.
Hensher,�D.�A.,�and�A.�M.�Brewer.�2001�Transport:�An�economics�and�management
perspective.�Oxford:�University�of�Oxford�Press.
Hensher,�D.�A.�and�A.�M.�Brewer.�2003.�Going� for�gold�at�the�Sydney�Olympics:
How�did�transport�perform?�Transport�Reviews�22(4):�381�399.
Contract�Areas�and�Service�Quality�Issues
41
Hensher,�D.�A.,�and�E.�Houghton.�2003.�Performance-based�contracts�for�the�bus
sector:�Delivering�social�and�commercial�value�for�money.�Transportation�Re-
search�B.
Hensher,�D.A.,�and�J.�K.�Stanley.�2003�Performance-based�contracts�and/or�com-
petitive�tendering�in�urban�bus�service�provision?�Transportation�Research�A.
Hibbs,�J.�2000.�Transport�policy:�The�myth�of�integrated�planning.�Hobart�Paper�140.
London:� Institute�of�Economic�Affairs.
Laube,�F.�1995.�Fully�integrated�transport�networks:�An�international�perspective
on�applied�solutions.�Paper�presented�at�Ticketing�Technologies�Conference.
Darling�Harbour.�5�6�April.
Preston,�J.�and��D.�van�de�Velde.�2002�Competitive�tendering�of�public�transport:
theme�A.�Transport�Reviews� (Thredbo�6�workshop�report).
Tye,�W.�B.�1987�Encouraging�cooperation�among�competitors.�New�York:�Quorum
Books.
Unknown�Author.�1993.�An� Investigation� into� the�effectiveness�o f�public� trans-
port�initiatives.�Prepared�for�Surrey�County�Council,�Surrey.
Walker,�T.�1997.�Recent�developments�in�automatic�fare�collection.�Southern�Cu-
bic�Pty�Ltd.
Williamson,�O.�E.�1987.�Antitrust�economics.�Oxford:�Basil�Blackwell.
White,�P.,�and�P.�Brocklebank.�1994.�Urban�travel�and�the�smartcard.�Paper�pre-
sented�at�Smartcard�Conference.�February.
About the Author
DAVID�HENSHER�([email protected])�is�professor�of�management�and�director
of�the�Institute�of�Transport�Studies:�The�Australian�Key�Centre�of�Teaching�and
Research� in�Transport�Management.�He� is� a� chaired�professor� in� the� faculty�of
economics�and�business�at�the�University�of�Sydney.
Prof.�Hensher�is�a�fellow�of�the�Academy�of�Social�Sciences�in�Australia,�immediate
past�president�of�the�International�Association�of�Travel�Behaviour�Research,�and
a�vice-chair�of�the�International�Scientific�Committee�of�the�World�Conference�of
Transport�Research.�He� is�on�the�editorial�boards�of�10�of�the� leading�transport
journals�and�area�editor�of�Transport�Reviews.�He�has�published�extensively�(more

Journal�of�Public�Transportation,�Vol.�6,�No.�3,�2003
42
than�270�papers)�in�the�leading�international�transport�journal s�and�key�journals
in�economics�and�has�authored�five�books.�His�most�recent�books�are�Transport:
An�Economics�and�Management�Perspective�(with�Ann�Brewer;�Oxford�University
Press),�and�Stated�Choice�Methods� (with�Jordan�Louviere�and�Joffre�Swait;�Cam-
bridge�University�Press.)


![Service PPP Contract service ppp contract.pdf · Service PPP Contract 1. PARTNERING CONTRACT FOR THE PROVISION OF ] SERVICES AT [LOCATION] INDEX CONDITION PAGE 1. ... performance](https://img.pdfslide.net/doc/110x75/602b8a7d3f2c4b09f72b6fbf/service-ppp-contract-service-ppp-service-ppp-contract-1-partnering-contract.jpg)


![CONTRACT FOR PROVISION OF [ ] SERVICES](https://img.pdfslide.net/doc/110x75/6292a3539f93056c75767a73/contract-for-provision-of-services.jpg)