Embed Size (px)
Citation preview
Contract no. 688320
MADFORWATER
Development and application of integrated technological and management solutions FOR
wastewater treatment and efficient reuse in agriculture tailored to the needs of Mediterra-
nean African Countries
Deliverable No. Deliverable 1.2
Deliverable Full title Water stress and Water Vulnerability indicators and maps
Work Package No. and Title WP1 - Water and water-related vulnerabilities in
Egypt, Morocco and Tunisia
Lead beneficiary (extended name
and acronym)
ALTER
Authors
(Acronyms of beneficiaries contrib-
uting to the deliverable)
Judit Snethlage, Angel de Miguel, Emma Daniels,
Jochen Froebrich (ALTER)
Planned delivery date 31/01/2018
Actual delivery date 15/12/2018
Dissemination level:
(PU = Public; PP = Restricted to
other program participants; RE =
Restricted to a group specified by
the consortium; CO = Confidential,
only for members of the consor-
tium)
PU
Project website www.madforwater.eu
Project start date and duration Start date of project: 01 June 2016 Duration: 48 months
The communication reflects only the author’s view and the Executive Agency for
Small and Medium-sized Enterprises is not responsible for any use that may be
made of the information it contains.

Table of Contents 1 Abstract .................................................................................................................... 8
2 Introduction ........................................................................................................... 10
3 Current Water Stress and Water Security ............................................................. 12
3.1 Approach for Characterising Water Stress and Water Security ..................... 12
3.1.1 Towards a nested approach ................................................................................... 12
3.1.2 Principle approach applied within this study......................................................... 17
3.1.3 Water Stress Indicators at Subnational scale ........................................................ 18
3.1.4 Calculating the Economic Water Security at National scale .................................. 22
3.1.5 Integration of results from analyses at sub-national and national scales ............. 27
3.2 Characterising Water Stress and Water Security in Morocco ........................ 28
3.2.1 Mapping Water Stress at Sub-national level ......................................................... 28
3.2.2 Assessing Economic Water Security at national scale ........................................... 33
3.2.3 Sub-Conclusion Morocco ....................................................................................... 34
3.3 Characterising Water Stress and Water Security in Tunisia ........................... 37
3.3.1 Mapping Water Stress at Sub-national level ......................................................... 37
3.3.2 Assessing Economic Water Security at national scale ........................................... 42
3.3.3 Sub-Conclusion Tunisia .......................................................................................... 42
3.4 Water stress and Water Security in Egypt ...................................................... 45
3.4.1 Mapping Water Stress at Subnational level .......................................................... 45
3.4.2 Assessing Economic Water Security at national scale ........................................... 48
3.4.3 Sub-Conclusion Egypt ............................................................................................. 48
3.5 General conclusion current state ................................................................... 49
4 Water Stress outlook 2050 .................................................................................... 51
4.1.1 Approach for estimating the water stress outlook for 2050. ................................ 51
4.2 Water stress outlook 2050 Morocco .............................................................. 53
4.2.1 Temporal reliability of water resources outlook 2050 .......................................... 53
4.2.2 Water Stress Outlook ............................................................................................. 54
4.2.3 Storage Drought Duration Length Index – SDL outlook......................................... 56
4.2.4 Sub-Conclusion Morocco ....................................................................................... 57
4.3 Water Stress outlook 2050 - Tunisia............................................................... 58
4.3.1 Temporal reliability of water resources ................................................................. 58
4.3.2 Water Stress Outlook ............................................................................................. 59
4.3.3 Sub-Conclusion Tunisia .......................................................................................... 62
4.4 Water Stress outlook 2050 Egypt ................................................................... 63
4.4.1 Temporal reliability of water resources ................................................................. 63
4.4.2 Water Stress Outlook ............................................................................................. 64
4.4.3 Storage Drought Duration Length Index – SDL outlook......................................... 65
4.4.4 Sub-Conclusion Egypt ............................................................................................. 65
5 Waste Water Reuse potential 2050 ....................................................................... 67
5.1 Approach Mapping Waste Water reuse Potential ......................................... 67
5.2 Mapping of Waste water reuse potential for irrigation in Morocco ............. 68
5.3 Mapping of Waste water reuse potential for irrigation in Tunisia ................. 70
5.4 Mapping of Waste water reuse potential for irrigation in Egypt ................... 72
5.5 Business Potential for the European Water Sector ........................................ 74
6 Bibliography ........................................................................................................... 77
List of abbreviations and symbols
ADB – Asian Development Bank AGc - Agricultural goods consumption
AGp - Agricultural good production AgrET: Agricultural evapotranspiration (km3) APWF - Asia-Pacific Water Forum AWDO 2016- Asian Water Development Outlook 2016 Ct: total storage capacity within a region of consideration (km3) Cv - Coefficient of variation Cv a- Coefficient of variation of rainfall (between years) Cv m- Coefficient of variation of rainfall within years DDM - Average hydrological drought duration (months) GAEZ - Global Agro- Ecological Zones GDP – Gross Domestic product GDPA : Agricultural gross domestic product (million $)
GDPI - Gross Development product in Industry ($ million dollar) IWMI - International Water Management Institute MENA- Middle East and North Africa MENA- Middle East and North Africa MPE - Minimum platform for electricity production PE - Electricity production (GWh) PIB - Product Brut Interieur, SADC - Southern African Development Community SDG – Sustainable Development Goal SDL- Total dam capacity/total freshwater withdrawal per month)/mean annual drought duration Data availability SLI - The storage drought-duration length
SPI - Standardized Precipitation Index SR- Storage ratio SSA - Self-sufficiency in agriculture TRWR – Total renewable water resources UN- United Nations WPA- Water productivity in the agriculture sector WPE - Water productivity of energy production WPI - Industrial water productivity WRE - Water resources consumed (km3) WRI - Water withdrawal for industrial consumption (km3) WS- Water Security WSt Water Stress
Ww : total annual freshwater withdrawal (km3) μ – Average monthly precipitation (mm) σ - Standard deviation
List of figures
Figure 1 Overview on the Key dimensions and it related Sub-Indicators of the 2016 AWDO assessment
framework. ............................................................................................................................. 15 Figure 2 combining the spatial distributed information to characterize Water Stress at subnational scale
............................................................................................................................................. 17 Figure 3: Index/ Sub-index Structure and calculation of the 2016 AWDO Key dimension II- Economic Water
Security (taken from AWDO, 2016) ............................................................................................ 23 Figure 4: Decision making tree to prioritise wastewater reuse interventions to increase Water Security 27 Figure 5: Inter-annual rainfall variability, Morocco, current conditions .............................................. 28 Figure 6: Intra-annual rainfall. Morocco, current conditions ............................................................ 29 Figure 7: Storage ratio, Morocco, current conditions ...................................................................... 29 Figure 8: Morocco Total Renewable Water Resources ..................................................................... 30 Figure 9: Water Withdrawal and location of irrigated areas, Morocco, current condition ...................... 31 Figure 10: Water Exploitation Index, Morocco, current condition ..................................................... 31 Figure 11: Morocco, current drought duration............................................................................... 32 Figure 12: Morocco Storage-Drought Duration Index ..................................................................... 32 Figure 13: Integration results from assessing Water Stress at subnational scale and Water Security at
national scale Morocco .............................................................................................................. 35 Figure 14: Tunisia, current inter-annual rainfall ............................................................................ 37 Figure 15: Tunisia Current intra-annual rainfall ............................................................................. 38 Figure 16: Tunisia, storage ratio ................................................................................................. 38 Figure 17: Total Renewable Water Resources, Tunisia, current conditions ......................................... 39 Figure 18: Tunisia, water withdrawal and location of irrigated areas, current conditions ...................... 40 Figure 19: Tunisia current Water Exploitation Index ...................................................................... 40 Figure 20: Tunisia current drought duration ................................................................................. 41 Figure 21: Tunisia Storage-Drought Duration Index ...................................................................... 41 Figure 22 : Integration results from assessing Water Stress at subnational scale and Water Security at
national scale Tunisia ............................................................................................................... 43 Figure 23: Egypt current inter-annual rainfall ............................................................................... 45 Figure 24: Egypt Current intra-annual rainfall............................................................................... 46 Figure 25: Egypt current Water Withdrawal and location of irrigated areas ....................................... 46 Figure 26: Egypt current drought duration ................................................................................... 47 Figure 27 climate change forecasting and estimations for the future water consumption towards a 2050
Water Stress outlook ................................................................................................................ 51 Figure 28: Morocco 2050 inter-annual rainfall (RCP 8.5) ................................................................ 53 Figure 28: Intra-annual rainfall (RCP 8.5), Morocco, Outlook 2050 .................................................. 53 Figure 29: Morocco 2050 Water Withdrawal (SSP3) ....................................................................... 54 Figure 30: Morocco 2050 Water Exploitation Index (RCP8.5/SSP3) .................................................. 55 Figure 31: Morocco 2050 Drought duration (RCP 8.5) .................................................................... 56 Figure 32: Morocco 2050 Storage-Drought Duration Index (RCP 8.5) ............................................... 56 Figure 34: Inter-annual rainfall (RCP 8.5), outlook 2050 Tunisia ..................................................... 58 Figure 35: Intra-annual rainfall (RCP 8.5), Tunisia, Outlook 2050 .................................................... 58 Figure 36: Tunisia 2050 Water Withdrawal (SSP3) ........................................................................ 59 Figure 37: Tunisia 2050 Water Exploitation Index (RCP8.5/SSP3) ................................................... 60 Figure 38: Tunisia 2050 Drought duration (RCP 8.5) ..................................................................... 61 Figure 39: Tunisia 2050 Storage-Drought Duration Index (RCP 8.5) ................................................ 61 Figure 40: Egypt 2050 inter-annual rainfall (RCP 8.5) .................................................................... 63 Figure 41: Egypt 2050 intra-annual rainfall (RCP 8.5) .................................................................... 64 Figure 42: Egypt 2050 Drought duration (RCP 8.5) ....................................................................... 65 Figure 43 Simplified approach to enable wastewater reuse potential mapping in Morocco, Tunisia, and
Egypt ..................................................................................................................................... 68 Figure 44 Morocco current Wastewater production divided by irrigated area at district level ................ 69
Figure 45: Morocco current location of wastewater production hotspots and location of irrigated areas . 70 Figure 46: Tunisia current Wastewater production divided by irrigated area at district level ................. 71 Figure 47: Tunisia current location of wastewater production hotspots and location of irrigated area .... 72 Figure 48: Egypt current Wastewater production divided by irrigated area at district level ................... 72 Figure 49: Egypt current location of wastewater production hotspots and location of irrigated areas ..... 74
List of Tables Table 1 Sub-indexes Economic Water Security .............................................................................. 22
Table 2. Final values calculated and score, Morocco, National Scale ................................................. 33
Table 3. Final values calculated and score, Tunisia, National Scale ................................................... 42
Table 4. Final values calculated and score, Egypt, National Scale..................................................... 48
Table 4 selected areas of raw wastewater reuse in agriculture (from Choukr Allah, 2005 with reference to
CSEC data from 1994) .............................................................................................................. 69
Table 6 SWOT Analysis of the Moroccan Wastewater Market (transferred from Dutch to European
perspective) ............................................................................................................................ 75
Disclaimer: The maps had been elaborated on the base of publicly available shape files. Depicting any political boarders
does not refer to any specific official recognition by the EU or any other political body.
1 Abstract Agricultural development plays an important role in the economies of the Mediterranean African Countries.
Food demand is increasing in the Mediterranean African Countries and consumption patterns are changing.
The countries face common challenges in their strategy to improve food security. The most significant
challenges are a rapid population growth, urbanisation, dependency on rainfed agriculture with fluctuating
yields, water scarcity, increased water demands, and challenges in water quality. Water scarcity has
reached a critical point in the region, and the dependency on rainfall makes the Mediterranean African
Countries extra vulnerable to climate changes.
The Mediterranean African Countries offers plenty of opportunities for agricultural development: Availability
of arable land, a temperate Mediterranean climate with year-round production possibilities, and a growing
consumer market.
A number of different efforts had been made in the past to quantify the Water Stress and Water Vulnera-
bility in the past. Within this study, the 2016 AWDO framework had been used to allow a more consistent
comparison of information both with previous and forthcoming international studies.
Water Security and Water Vulnerability are considered as interrelated terms, where the one is the inverse
of the other. Water Security had however gained over the recent decades a more prominent standing in
the international community or donors, scientists, and policy makers.
Depicting Water Security leads inevitably to the question, “ security for whom”? The 2016 AWDO frame-
work was developed within the Asian Water Development Outlook to offer a consistent approach for the
Household Water Security, the Economic Water Security, the Urban Water Security, the Environmental
Water Security and the Resilience to Water Related Disasters, referred to as the five key dimensions. By
this the framework follows the classical People, Planet, and Profit paradigm as being applied in determining
the sustainable development while adding a special focus on the urban situation and water risks. The full
AWDO 2016 framework requires a rather large amount of data. Concentrating on the dimension of the
Economic Water Security offers instead a good trade off, allowing to reduce the number of input data while
at the same time providing a sufficient diversity in the consideration of other sectors.
In this view, the Economic Water Security as defined in the 2016 AWDO framework has been used to
determine relevant aspects for the Water Security in Morocco, Tunisia, and Egypt. Water Stress is consid-
ered as the ratio of Total Withdrawal over Total Renewable Freshwater Resources.
A nested framework had been applied to depict first the Water Stress and other key information on the
water resource availability for all river basins in Tunisia and Morocco as well as for the different irrigation
areas in Egypt. The related results had been then aggregated at national scale in order to calculate the
Economic Water Security Index at national scale under the use of further socio economic statistics. This
aggregation had been necessary as the requested socio-economic background information could not been
provided at the scale of river basins (Morocco, Tunisia) or irrigation areas in Egypt.
In order to depict possible changes as a result of climate change and an increase in consumption, climate
model ensemble runs from the CORDEX data base have been used to elaborate future aspects on the
availability of water resources on the scale of catchments and in the case of Egypt on the irrigation areas
instead.
The results of this analysis are suited to provide a detailed insight on spatial variations of Water Stress.
There is a high variability of rainfall in the coastal areas of Morocco, distinct north south variations of water
availability in Tunisia, and a comparable uniform situation in Egypt because of distributing the Nile water
in irrigation channels up to the Nile river delta.
The score of the 2016 AWDO Economic Water Security is not affected by weighting factors and the results
of the study allow hence a comparison amongst the countries. Additionally, the results underline possible

pathways to use selected indicators of the AWDO framework as so-called anchor indicators and to route
relevant insights across the scales.
Future effort should be spent to investigate further the possible effects from the aggregation process and
to which extend the framework is suited to reflect pilots for introducing wastewater adequately.
For determining the wastewater reuse potentials in irrigation, different maps have been elaborated for
Morocco, Tunisia, and Egypt. As a result, priority areas are highlighted, where the close vicinity of
wastewater production and existing of irrigated areas would favour interventions to implement wastewater
reuse schemes.
The findings of this study indicate the added value of applying elements from the 2016 AWDO Framework
to allow a systematic reflection and comparison of key information to characterise water stress and Water
Security.
2 Introduction The presented deliverable report is related to the Task 1.2 – Analysis and mapping of Water Stress, Wa-
ter Vulnerability and potential for water reuse in Egypt, Morocco and Tunisia (M1-20). The aim of this
study is to provide a basis for assessing measures that can improve the agricultural water productivity
with a special focus on increasing the re-use of wastewater in agriculture.
The results of the analyses are presented in three distinct parts. The first part comprises the description
of selected Water Stress related indictors at subnational scale in order to provide a further insight on
possible variations of Water Security related information within the corresponding country. For this, the
inter- and intra-annual rainfall variability, the water exploitation index, and the storage drought duration
length index had been chosen as relevant indicators. In a subsequent step, these indicators were aggre-
gated and integrated into the calculation of the economic Water Security index at national scale. The sec-
ond part provides an outlook on how the same Water Stress related indicators might develop in future
times. The outlook was made on the base of climate model ensemble predictions until the year 2050. The
third part of the report deals with an indication of the wastewater reuse potential for the three countries
Morocco, Tunisia, and Algeria.
Water Stress and Water Vulnerability are terms that are commonly used in the language of scholars, the
development community, think tanks and donor organizations. Usually the intention is to highlight risks
and problems that centre on the trinity of the water challenge “too much – too little - too dirty”! While
there is since long, a common understanding for the sense of urgency, still today there is no unified defi-
nition how to measure Water Stress, Water Vulnerability, and Water Security. In particular when it
comes to the question, which sub-indicators should be considered, the literature offers a vast diversity of
definitions, approaches and assessment frameworks. Furthermore, there is a high diversity of scales at
which the different assessments had been applied.
Within the presented study, Water Stress , Water Vulnerability and Water Security are understood as in-
terrelated subjects (Box 1), where Water Stress is mainly depicting a mismatch between demand and
availability for a given moment. Beyond that, Water Vulnerability and Water Security include aspects of
risks and potentials to deal with unwanted shortfalls.
Water stress • Application quite strongly influenced by the Falkenmark index (available water volume per cap-
ita), and the water exploitation index (total abstraction / long-term renewable resources)1 • attempts to consider water quality aspects (not enough quantity in the demanded quality) but
this interpretation had not been endorsed widely and the necessary consequence • Status-oriented interpretation - does not consider adaptive capacity • Negative connotation
Water vulnerability
• Usually applied as a wider concept than Water Stress. • Includes elements as risk and adaptive capacity
• Not per se clear definition who is vulnerable (people, environment, water bodies)? • Less prominently applied and manifested in the international debate • Negative connotation
Water security
• Still emerging paradigm but increasing consolidation in its definition and high level peer re-viewed papers
• Covering relevant key dimensions and strongly linked to the Nexus debate • Recognized and used amongst others by UN, ADB, World Bank, World Economic Forum, GWP,
IUCN, OECD, IWMI, UNESCO-IHP • Security is the inverse of insecurity and hence related to vulnerability / stress
Box 1 Three major concepts linked
1As e.g. used in https://ec.europa.eu/eurostat/
Recent works in the international community increasingly focus on Water Security. Water Stress and Wa-
ter Vulnerability have a negative co-notation that makes it often difficult to mobilize support from stake-
holders and decision makers. Water Vulnerability and Water Security are considered in this study as in-
versely related. In this view, a low Water Security is synonym for a high vulnerability against Water
Stress and vice versa, high vulnerability demarks a low Water Security.
The presented deliverable investigates Water Stress related aspects as a relevant input into characteris-
ing Water Security. However, there is still a remarkable diversity in framing the term Water Security. De-
fining metrics for the quantification of Water Security depends to a large extend on the questions, “who
should be secured”, which data should be used for a reflection, and which data are accessible to realize
such.
The intention within the project Mad4water was not to create just another assessment framework, but to
seek ways how the results of the MADFORWATER project can be linked to an accepted debate in the in-
ternational research and development community.
In order to enable a better comparability, a consistency in recurring investigations, and to allow some
prediction of future developments, the 2016 AWDO assessment framework have been used to calculate
the Economic Water Security at national scale and the related sub-indices at subnational scale.
Similar to the developments for accessing Water Security, the scientific field of indicating the wastewater
re-use potential is still developing. The availability of data at the related spatial resolutions influences
strongly the assessment frameworks chosen. With the focus of this deliverable report to depict spatial
variations, the accessibility of distributed information had been perceived as the key constraint. In this
regard, the Waste Water Reuse Potential therefore has been elaborated by processing remote sensing
data to characterize proxy information for selected socio economic conditions.
3 Current Water Stress and Water Security
3.1 Approach for Characterising Water Stress and Water Security
3.1.1 Towards a nested approach
Recent developments in framing a Water Security
The United nations (UN)-Water Task Force on Water Security defines: “Water security as the capacity of a
population to safeguard sustainable access to adequate quantities of acceptable quality water for sustaining
livelihoods, human well-being, and socio-economic development, for ensuring protection against water-
borne pollution and water-related disasters, and for preserving ecosystems in a climate of peace and po-
litical stability “(UN Water, 2013).
Since the 1990s, “The concept of Water Security has served to articulate concern about issues such as
reliability, quality, quantity, safe and equitable access, and environmental provisioning of water supplies.”
(Gerlak et al., 2018). Water security has been increasingly employed in policy (and policy influencing)
circles, from the World Wildlife Fund and the World Economic Forum, OECD, IWMI, GWP, the World bank,
the Asian Development bank, as well as the United Nations (UN) (WWF, 2009; UNEP, 2009; WEF, 2011;
UN-Water, 2013; UNESCO, 2013) as well as to other relevant players as the World Economic Forum or
CDP.
80% of the world’s population is exposed to high levels of threat to Water Security, where 65% habitats
associated with 65% of continental discharge can be classified as moderately to highly threatened, and
there is a need to address both the dimensions of human Water Security and environmental Water Security
in an integrated way (Vörösmarty et al., 2010).
“Water security is simultaneously a condition to be measured, a framework for decision making, and a
policy objective” (Gerlak et al., 2018). Water security is according to Lee (2016) a wider concept than
Water Stress, water scarcity and water poverty, enabling a strong consideration of the economic impacts.
These can be a “robust concept in explaining economic nature of water, flood risk and the water-energy-
food nexus”.
Water security should be furthermore understood as a “dynamic continuum that will alter with changing
climates, growing economies and asset stocks, and resource degradation” and not as a static goal (Sadoff
et al., 2015).
“Water security encapsulates complex and interconnected challenges and highlights water’s centrality for
achieving a sense of security, sustainability, development and human well-being, from the local to the
international level. Many factors contribute to Water Security and range from biophysical to infrastructural,
institutional, political, social and financial – many of which lie outside the water realm. Water security,
therefore, lies at the centre of many security areas, each of which is intricately linked to water (Zeitoun,
2011. Therefore, addressing Water Security requires interdisciplinary collaboration across sectors, com-
munities and political borders, so that the potential for competition or conflicts over water resources, be-
tween sectors and between water users or states, is adequately managed (Wouters et al., 2009).” (UN-
Water, 2013).
“Water security has emerged as a major framing template in environmental governance and resource
management. The term and underlying concepts have attracted the attention of governmental and non-
governmental organizations, private industry, and the academy in policy and practice. Notwithstanding the
palpable rise in its use, a comprehensive understanding of how Water Security is conceptualized and em-
ployed in different contexts around the world is limited.” (Gerlak et al., 2018). A systematic analysis of
124 articles, books, and book chapters published between 2010-2015 had been performed by (Gerlak et
al., 2015) to identify how the term Water Security is defined, framed and applied in different hydrological
and socio economic environments. A “broad diffusion of Water Security across geographic regions and
scales, expansive framing of Water Security, and evolving approaches to indicator formulation” had been
found still. According to (Gerlak et al., 2018), the persistent diversity in perspectives and applications of
Water Security causes that “scholars adapt the concept to the contexts of the cases they are studying”.
This demands for incorporating the community context.
(Lautze and Manthrithilake, 2012) provided a multi-dimensional Water Security assessment covering five
different dimensions including a) Household needs, b) Food Production, c) Environmental Flows, d) Risk
management and e) the independence (as dependency from external water resources). Results are pro-
vided for the countries in the Asia Pacific region. They also share a critical reflection, stressing on the one
hand the need to define first on a clear set of key elements before actively pursuing the consideration of
Water Security in high profile debates. On the other hand concluding that as long assessment concepts
can be interpreted in multiple way, there is a less strong need to agree on a certain concept. Notwith-
standing noting a risk that emphasizing Water Security as a new header can lead to confusion and inflated
expectations, the benefits of using an overall score at country level is to trigger attention to certain areas
and in differentiating sub-components can help to obtain indications of the “factors explaining Water Se-
curity performance.”
Within their contribution to consolidate, indicators for a risk-based perspective in the Water Security as-
sessment, (Fischer et al., 2015) introduced the use of GDP per capita as proxy for economic-institutional
coping capacity. As well as ways to address the hydro-climatic complexity in terms of Total renewable
freshwater resources per capita, the ratio of total withdrawal to total renewable water resources, variability
of monthly runoff and the dependency share of external total renewable water resources.
(Sadoff et al., 2015) presented an attempt to link Water Security to sustainable growth, while considering
the interaction to four distinct principle risks (i) water scarcity, (ii) flooding, (iii) inadequate water supply
and sanitation, and (iv) the impact of water insecurity on the environment. The findings of (Sadoff et al.,
2015) underline that “water insecurity acts as a drag on global economic growth.” There should be policies
and infrastructure investments that can “enhance Water Security; to allocate water between alternative
uses; to deliver water at specific times, places, and prices; to ensure water quality; and to protect people
and assets from water-related hazards. “
An extensive analysis is performed of factors influencing the Water Security in the MENA region by the
World Bank (2017). For each MENA country an assessment was made to describe the relative impact of
water in-security in relation to the 1) Economic losses from inadequate water supply and sanitation (% of
GDP), 2) GDP exposure to Water Stress (% of GDP), 3) Expected annual property damage due to fluvial
and coastal flooding (% of GDP), 4) Percent deaths of children under five due to diarrhoea (share %), 5)
Population exposure to Water Stress (share %), 6) Total number of people affected by floods (1980–2016),
and 7) Water quality threat (%). Moreover, further indicators had been applied to describe the country
situation along three dimensions of Water Security related to (i) water resources, (ii) water services, and
(iii) water-related risks.
Within their reflection on paradigms in agricultural Water Security, (Malekian et al., 2017) emphasized that
the Water Security is not only multi-dimensional, but also very much dependent on the question “what is
acceptable”, which will be answered differently by engineers, scientists, farmers affected, and politicians.
Highlighting a differentiation between the developmental approach (“seeking to improve Water Security
over time”) and the risk-based approach (“seeking to manage risks and to reduce vulnerability to shocks
resulting from climate variability and water-related disasters”), (Beek and Arriens, 2014) postulated the
need for integrating. Moreover they presented a stepwise approach and a scorecard (based on the 2013
AWDO framework) to evaluate potential management scenarios.
Overall, Water Security must be understood as a rather comprehensive framework that includes relevant
aspects of Water Stress and Water Vulnerability. Ways should be explored to consolidate and harmonize
further the assessment methods.
The current debate and reporting emphasized the need to find ways to address the different dimensions
and perspectives of Water Security when it comes to the planning of interventions and measures. While there is an emerging consolidation within the literature to internalize and to frame the multidimen-
sional character in Water Security assessment, comparable little is reported on comprehensive approaches
to improve Water Security in its multi facet appearance.
Generally, a number of critical aspects revealed from the literature review, which need to be considered
when applying Water Security assessments at different spatial and temporal scales.
Reaching a consistency in terminology and the set of indicators used
For comparing results between territories, scales, and to account changes over time there is a
need to agree on a common terminology, a common framework, and a strict set of sub-indicators
related. On the other hand, choosing selected sub-indices will limit the ability to characterize the
wider system complexity.
Increasing the number of indicators in a specific context can elaborate more aspects to reflect a
specific situation better, but it often results in significant effort for the data collection. By that, it
is difficult to be repeated at other locations and hence it reduces the comparability of results.
Avoiding the participative determination of weighting factors
Many compound indicators e.g. such as proposed by (Strathatou et al., 2016) define the weighting
factors for integrating the indicator components in a participative way. While this is a widely ac-
cepted technique to increase the shared ownership of results, it is highly context specific and
depends on the composition of the stakeholder groups involved. A comparability of results is only
possible, if the same weighting factors are still being applied. As larger the spatial extension of
the investigation area is, as more likely will the different priorities and stakeholder perceptions
lead to different weighting factors.
In order to ensure a comparability of results, a preference to frameworks that avoid the use of
weighting factors should be given.
Assessing Water Security across different scales
The question at which scale the assessment frameworks should be applied, is not trivial. Many
studies investigate the Water Security at national level. At this level, aggregated data are available
from national statistic services and global databases.
When the impact of individual measures need to be evaluated, the assessment at a national scale
is insufficient. Analysing the specific local context of the intervention case is then a common prac-
tice. Applying a similar in-depth study at larger scales is usually hampered by the non-availability
of data and/ or would incur a disproportionately high effort and expense.
However, for an evaluation of possible impacts of wastewater reuse, it is still desired to transfer
results from local to larger scales. There is hence a need to harmonize the assessment at the
different scales and to create ways for exchanging findings between the different scales
Outlook on future developments
For a multi-decadal prediction of future Water Security, model studies can be available for some,
but not necessarily for all parameters. Future agricultural water consumption, energy demands,
or the discharge of pollutants is mainly influenced by human behaviour in a changing socio-eco-
nomic context, which is difficult to predict in numeric terms.
There is a need to find also a suited subset of indicators that can be calculated both for the baseline
as well as for future scenarios.
Considering these aspects, it becomes clear that there is no one-fits all solution. However, combining, a
standard set of indicators that can be consistently applied at all scales and regions with additional in-depth
studies focusing on specific interventions appears as a promising approach for future studies.
Advantage of using the AWDO 2016 Economic Water Security index as framework to assess Water Security
The 2016 AWDO assessment framework have been originally developed as part of the Asian Pacific Water
Development outlook (AWDO 2016 b) and as a multinational initiative to determine the Water Security in
all Asian and Pacific states.
Overall, the 2016 AWDO framework provides a comprehensive approach to cover the relevant aspects of
Water Security in a systematic way and along five distinct Key Dimensions.
Each Sub-indicator within the five Key Dimensions is again calculated on the base of individual sub-sub
indicators. By that, the overall effort for data acquisition even at the consideration at national scale is
reasonable high. Aiming at an elaboration of more detailed information at sub-national level, the required
effort is increasing correspondingly. Making use of the framework’s modular concept, a selection of a rel-
evant Key Dimension is hence of advantage when the investigation should entail analysis on variations
within a country (subnational scales).
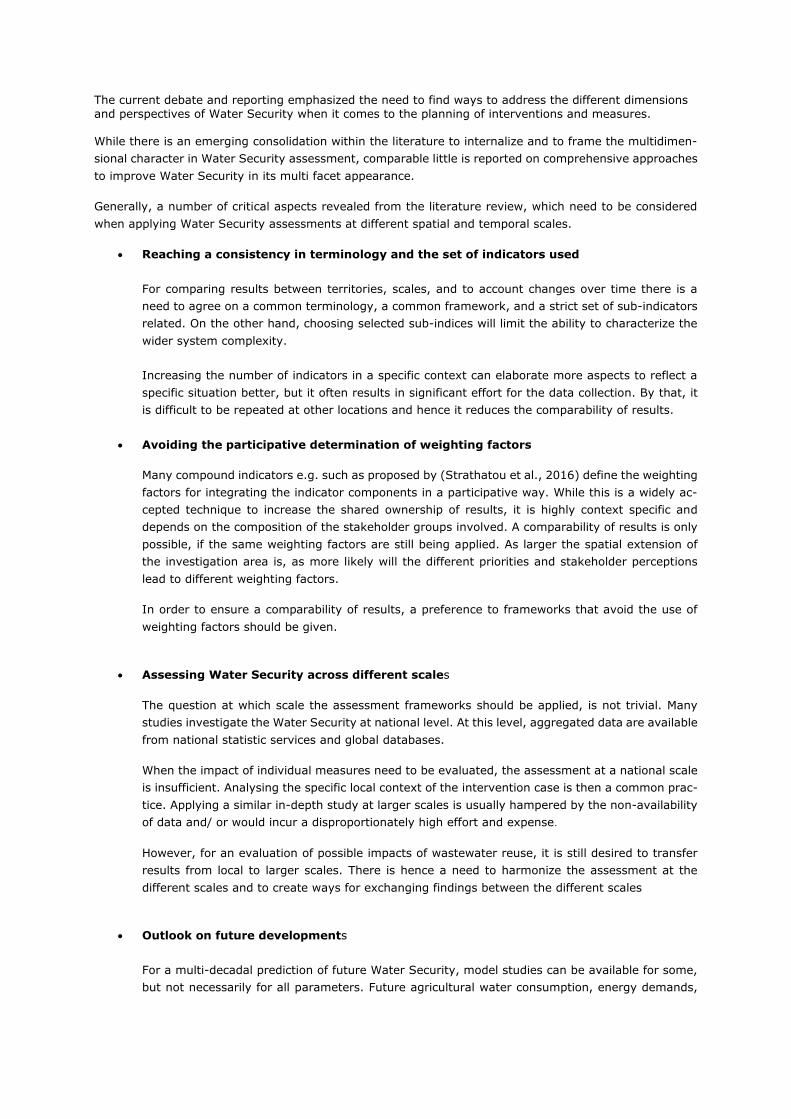
Figure 1 gives an overview on the related sub-indicators for each Key Dimension. Within this study, the
calculations are restricted to the determination of the Economic Water Security, as it provide key infor-
mation in the view of future wastewater reuse.
Figure 1 Overview on the Key dimensions and it related Sub-Indicators of the 2016 AWDO assessment framework.
Within this study, the calculations are restricted on the Economic Water Security.
The 2016 AWDO assessment framework is one of the very few frameworks that has not only received the
support from relevant international organisations such as the GWP, ADB, FAO and IWMI, but that also have
been applied in a recurrent way 2007, 2013, 2016 and 2020 (upcoming release) for all countries in the
Asian Pacific region.
The Key advantages considered of the 2016 AWDO framework are summarized in Box 2. The choice of
using it for the presented study is based on the fact that
each Key-Dimension can be assessed as a standalone indicator
the indicator can be calculated without associating stakeholder weightings to the sub-indices
the results of the Key dimensions can be compared with other studies and regions as long the
indicator subset remains complete
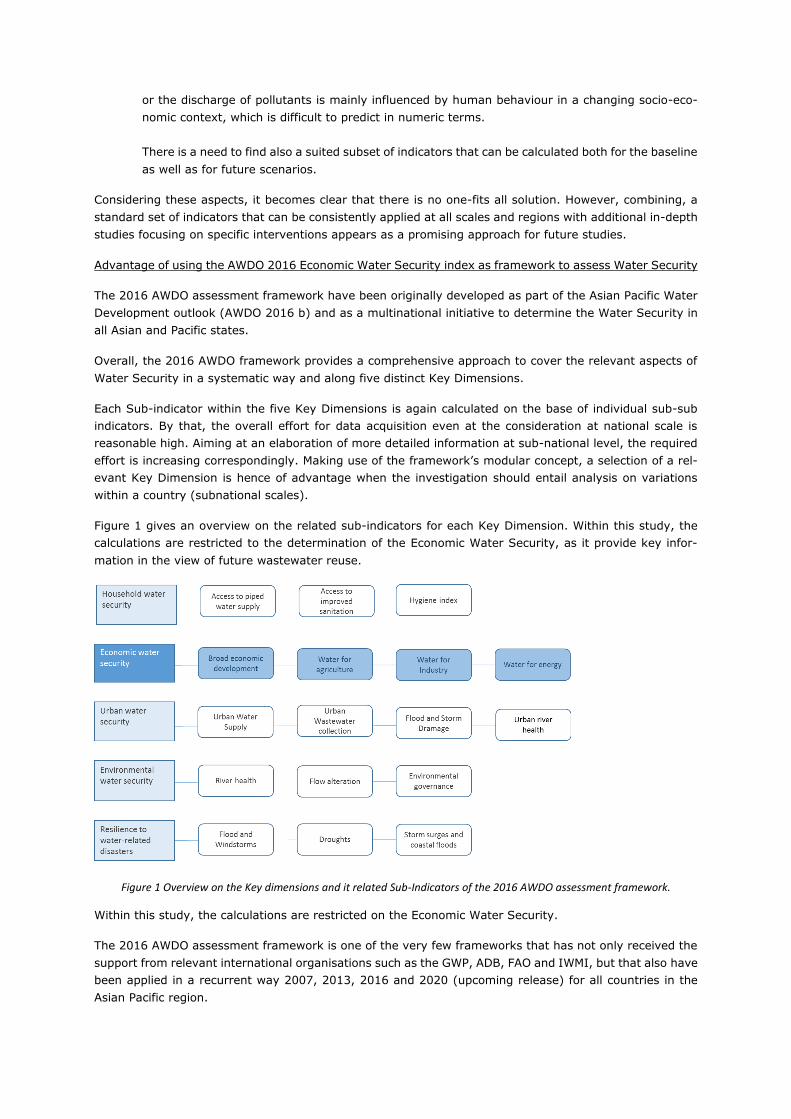
• Modular and straight forward approach
• No weighting factors that need to be specified/ agreed upon in a participative way
• Sensible differentiation of 5 dimensions following the People – Planet- Profit paradigm accom-
plished by the specific dimensions of Urban Water Security and Resilience
• The application of the assessment framework is not restricted to a certain scale
• It is up to now the only global framework that had been applied twice and officially endorsed
to monitor changes at continental scale. A new release is in prep for 2020.
• Clear development history and integration of experience of leading research institutes
Box 2 Key advantages of the 2016 AWDO assessment framework
Utilizing the modular concept of the 2016 AWDO approach allows the restriction on a single Key dimension.
The Key dimension 2 (economic Water Security) had been chosen for this study, as it offer a systematic
Water Stress characterization and provides the most relevant linkages to a potential wastewater ruse.
Within the Key dimension 2, Economic Water Security, the characterization of Water Stress is here an
intrinsic and explicit part of the assessment. Given the related and inverse nature of Water Security and
Water Vulnerability, a characterisation of Water Vulnerability is included implicitly.
A detailed description of the methodology can be found in AWDO (2016) and results of its application in
AWDO (2016 b).
Introducing the use of anchor indicators to enable a transfer of information across different scales
The scale at which Water Security should be analysed depends largely on the aim and the leading policy
question at hand. An analysis of hot spots and identifying priority areas for future interventions demands
detailed analyses within a country. A promotion of policies to stimulate the principle implementation of
measures requires instead an assessment of possible effects at national scale. A comparison between
countries at sub-national scale can be done, if the number of metrics to be compared remains small.
Understanding the complex nature of Water Security and the large number of sub-indicators to be included,
favours hence a comparison of aggregated information at national level.
In this context, Water security studies are implemented at a wide range of individual scales, and it is
difficult to route findings from one scale to the other. However, once there is a need for assessing the
impact of future wastewater reuse interventions at national scale (as policymaking relevant scale) ways
must be explored to combine analyses at the different scales and to
To enable a transfer of information gained from one scale to the other
To consider the different data availability and accessibility at the different scales.
Defining a subset of indicators as anchor indicators, which can be consistently applied at all relevant scales
can help to route information across the different scales. The challenge remains to deal with the different
availability of data for calculating such indicators. However, any indicator-set represents only partly the
reality. Following from the premise, there are no objections to concentrate the calculation on a restricted
number of anchor indicators. Where necessary, specific aspects can be then investigated in supplementary
analysis at each relevant scale. Nevertheless, more experiences need to be gained in utilising anchor indi-
cators for linking such heterogenic and context specific assessments. The 2016 AWDO assessment frame-
work with its modular set up offers a suitable outset to demonstrate the use of anchor indicators in a
nested approach.
3.1.2 Principle approach applied within this study
Nested approaches had been widely applied in science to overcome the challenges of dealing with different
information availability at temporal and spatial scales.
The characterization of Water Stress and Water Security as presented in this study follows a nested ap-
proach using selected indicators from the 2016 AWDO assessment framework. It combines both the elab-
oration of Water Stress related indicators at subnational scale as well as the subsequent aggregation of
information for describing the Economic Water Security at national scale.
In this context the intra-annual rainfall variability, the inter-annual rainfall variability, the drought duration
length index and the water exploitation index as being used within the 2016 AWDO framework had been
chosen as anchor indicators. Those indicators were used both at sub-national level to allow spatially dis-
tributed analyses, as well as at national scale to calculate the Economic Water Security Index.
In this way, information at sub-national scale are used to identify priority regions for future measures to
advance Water Security. Calculating the Water Security at national scale instead helps to relate the situa-
tion and possible measures to other relevant socio-economic information.
While the presented study is restricted on the Economic Water Security, the principle approach can be
applied to the investigation of other Key Dimensions. This would become relevant if the thematic context
differ from wastewater reuse and should instead give, more emphasize on social, urban or environmental
water challenges.
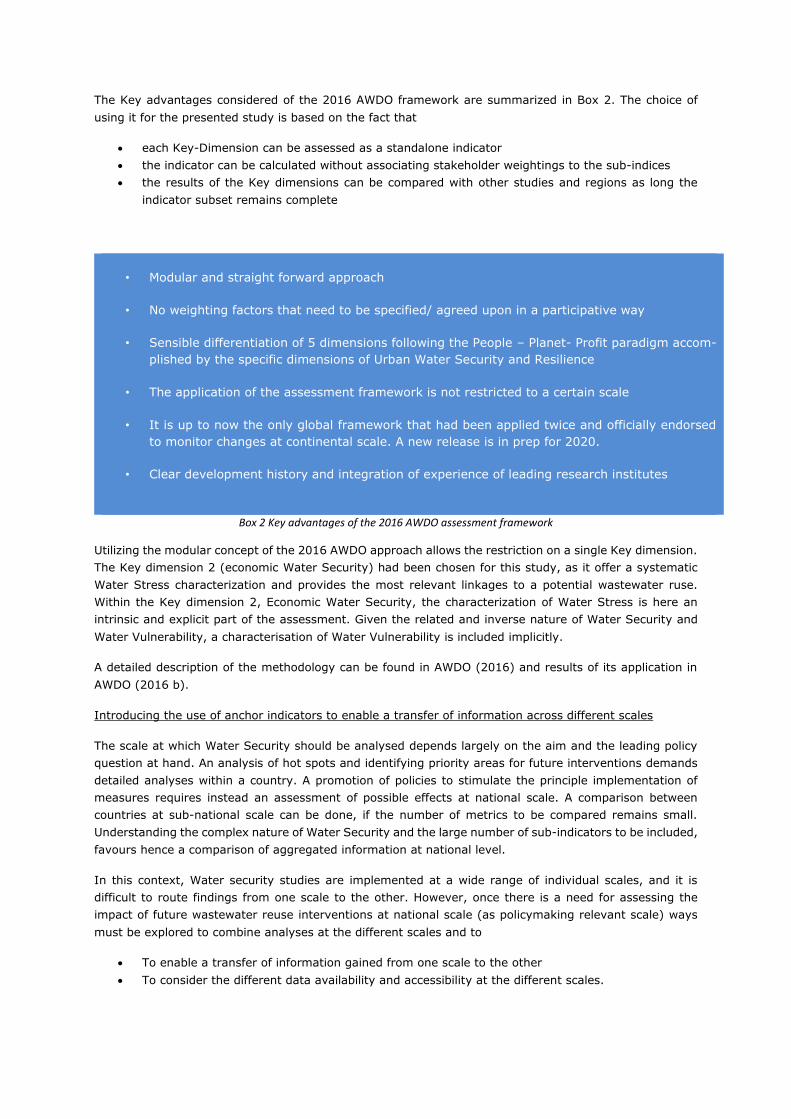
Figure 2: Combining the spatial distributed information to characterize Water Stress at subnational scale
For the calculation of the rainfall variability and the drought length, gridded information from global data-
bases were available. For the indication of total renewable fresh water resources and the total freshwater
withdrawal, information at the WRI database were globally available at river basin level. The indicators
intra-annual rainfall variability, the inter-annual rainfall variability; the drought duration length index and
the water exploitation index have been elaborated for all river basins in Morocco and Tunisia. Given the
particular hydrography in Egypt, the calculations in Egypt were done for major irrigation areas instead of
sub-catchments.
As an ensemble, these indicators provide already a basic characterization of the principle Water Stress
condition and depict relevant aspects for the Water Vulnerability (variability of rainfall, vulnerability against
droughts and the degree of water exploitation).
In a subsequent step, the results have been aggregated to an indicator at national scale using area
weighted means. The results had been fed into the calculation of the Economic Water Security at national
level. For the calculation of the Economic Water Security Index, the Agricultural Water Productivity, the
Industrial Water productivity, and the Energy Water productivity also is considered. At this stage, data for
the calculation of the Agricultural Productivity, the Industrial Water Productivity and the Energy Water
Productivity were not available at the level of river basins. Therefor their calculation was restricted to the
national scale using information from global databases.
At the end, the final Economic Water Security Index have been calculated using the 2016 AWDO score
tables as a single number at national scale.
In this way, the nested approach allowed both a spatially differentiated analysis of Water Stress relevant
information as well as the consideration of wider socio-economic factors for the characterisation of the
Water Security situation. As soon related socio-economic data could be also provided at the level of river
basins, a similar investigation at basin scale with the subsequent aggregation at national scale could be
realised.
3.1.3 Water Stress Indicators at Subnational scale
The hydrological catchments are extracted as vector data from the Global Drainage Basin Database (GDDB)
(Masutomi et.al, 2009). The catchments are defined as areas of land that drain to a single outlet point
(Gassert et.al, 2014). All basins within the specific country context are considered. The vector data is used
as input for the inter, intra-annual and drought duration.
In order to provide a clear overview about the historical variability of the rainfall pattern at subnational
scale, both inter and intra-annual rainfall are mapped for the three countries. Monthly and yearly rainfall
data are extracted from Climate Hazards Group InfraRed Precipitation with Station data CHIRPSv2.0 (Funk
et al., 2015) on a 0.05-degree resolution for the years 1981 up to date (2017) was used to estimate the
current Inter and Intra-annual rainfall variability. CHIRPS is a quasi-global rainfall dataset with more than
30 years of data. It incorporates satellite images with stations on the ground to create gridded rainfall time
series (Funk et al.,2015).
In all cases, data was processed with the software R.
3.1.3.1 Inter-annual rainfall variability
The Inter-annual variability is calculated by the coefficient of variation from long-term time series on mean
annual precipitation.
Cv,a = σmean annual precipitation /μ
Where Cv,a is the coefficient of variation; σ is standard deviation and μ is the mean annual precipitation
(mm) over the period to be considered. Subsequently, grid information was summarised at basin and
national level per country.
3.1.3.2 Intra-annual rainfall variability
The intra-annual variability is calculated by determining the variability between long-term average monthly
precipitation data. The same data source and method is used as for analysing the inter-annual rainfall. The
major difference is that the intra-annual rainfall, the variation within the year is collected and not between
the years.
Cv,m = σmonthly precipitation /μ
where:
CV is the coefficient of variation;
σ is standard deviation and
μ is the monthly precipitation (mm).
σ = √∑ (𝑃𝑖−𝜇)212
𝑖=1
𝜇
3.1.3.3 Storage ratio - Storage capacity related to the Total Renewable Water Resources
In the case of both a high inter-annual variability as well as a high intra-annual variability of rainfall, a
sufficient storage capacity contributes to a higher Water Security for economic uses. “A higher ratio of
storage to total renewable water resources indicates that a country is more resilient to changes. Con-
versely, a higher rainfall coefficient of variation and lower ratio of storage to total renewable water re-
sources indicate that a country is less prepared for water fluctuations (AWDO 2016)”
The storage ratio related to the total renewable water resources, SR is calculated as
SR = Ct / TRWR
with:
Ct: total storage capacity within a region of consideration (km3)
TRWR: total annual renewable freshwater resources within a region of consideration (km3)
Location and volume of major dams (bigger than 20 Mm3) is extracted from the Geo-referenced database
of Aquastat (FAO Aquastat, 2016). The location of some missing dams in the database was updated by
using Google Earth.
The principle design of the indicator allows the consideration of multiple types and scales of storage sys-
tems (large dams, small dams, drainage canals, aquifers, recharged groundwater), as it only considers the
total storage capacity within a unit. However, for the comparability of results between countries or at
different scales (national, watershed, and political unit) it is necessary to consider the type storage systems
in a consistent way. Unfortunately, studies on small dams are merely reported at few mostly smaller
research sub-catchments and often not for the entire country.
The 2016 AWDO report only considers the storage capacity of surface waters in larger dams available for
the respective country. The contribution of groundwater water resources as storage for rainfall is not con-
sidered. Likewise, using the FAO AQUASTAT (2015) data on the total country’s dam capacity does not
consider the contribution of small dams (e.g. barrages collinaires), which provide an important element at
local level to buffer intra-annual fluctuations in the water availability. In the case of reusing water from
drainage canals, such canals represent also systemic storage capacity in the water cycle and further in-
vestigation should be done to include such aspects in the assessment of Water Security as well.
One of the key challenges for a meaningful calculation is to consider the actual available storage volume.
In this view, siltation losses or dead volumes of large dams can sizably reduce the storage capacity in
comparison to the original design capacity or to the reported total volume from building contracts.
Due to the dynamic development and the building of new dams, even statistics at country level may differ
significantly from source to source.
The Total Renewable Water Resources (TRWR)2 (ressources en eau renouvelables) provides an estimate of
the maximum theoretical amount of water resources in a country(FAO Aquastat, 2016) and comprises the
average annual natural inflow and runoff that feed each hydro system (catchment area or aquifer). It
consists of the internal renewable water resources (km3/year) and the external renewable water resources,
flowing from outside into the unit of consideration.
The TRWR does not indicate how much water is actually available for a sustainable consumption. Water
resources for a sustainable consumption may remain after subtracting the amount that is required to
maintain the aquifer recharge, to maintain a minimum of ecosystem functioning, and to keep a certain
outflow related to the commitments made to downstream users.
Data from the AQUEDUCT database (Gassert et al., 2014) is used to derive TRWR at basin level. For this,
the total blue water, defined as natural river discharge at the outlet point of a basin, is considered.
In case of Egypt, TRWR and storage ratio have not been mapped at basin level. Around 96% of the TRWR
is contributed by the flow of the Nile river, which is according to the Nile Waters Agreement of 1959
between Egypt and Sudan 55,5 km3. The water, regulated by the Aswan reservoir, is subsequently distrib-
uted to the different irrigation districts. Having a uniformed value within the Nile valley, the calculation of
indicators at subnational level is not meaningful.
3.1.3.4 Water Exploitation Index
Within the 2016 AWDO framework, the total Water Stress on freshwater, is defined as the total amount of
water abstracted from freshwater sources for human use related to the TRWR. This ratio also known as
Water Exploitation index and in the further reporting referred to as WEI.
WEI = Ww / TRWR (-)
with:
Ww: total annual freshwater withdrawal (km3)
TRWR: total annual renewable freshwater resources within a region of consideration (km3)
While a high Water Stress implies risks in the Water Security, a lower fraction of abstracted water resources
reflects greater Water Security for economic growth and production.
The data for the TRWR is available at national scale at the World Bank. The data on the river basins and
Water Stress is available at the World Resources Institute WRI database.
A different approach is used for Egypt. Here the WEI is calculated on the base of the total agricultural
withdrawal for Egypt. Water withdrawal for agriculture is calculated at irrigation unit level by estimating
the average ET of major crops per unit and the water application efficiency. Subsequently, urban and
2 UNESCO IHP refers to Total Actual Renewable Water Resources- TARWR
industrial consumption is added to these units by multiplying the population located in each unit by the
national average water consumption per capita. These are mostly located alongside the Nile and the rest
of the irrigation units are fed by groundwater.
3.1.3.5 Storage – Drought (Duration) length index
The drought duration is calculated to give the average length (in months) of a drought that was moderate,
severely and/or extremely dry in intensity as given by the Standardized Precipitation Index (SPI) (Svoboda
et al., 2012). The Standardized Precipitation Index (SPI) is a widely used index to characterize temporal
aspects of meteorological droughts. The SPI values can be interpreted as the number of standard devia-
tions by which the observed anomaly deviates from the long-term mean, as is calculated as:
SPI = (P-P*) / σp
With
P: precipitation (mm)
P*: average precipitation (mm)
The occurrence of a drought event is referred to any time, where the SPI is continuously negative and
reaches an intensity of -1.0 or less. First, for every month, the 1-month SPI was calculated. Next, the
number and duration of droughts, when SPI was equal to or smaller than 1, was recorded. Finally, the
duration of droughts was averaged.
As for the inter and intra-annual variability, the drought duration is spatial-explicit calculated from the
rainfall information from the database CHIRPS v2.0 on a 0.05 degree resolution for the years 1981 up to
date (2017).
The AWDO framework adopted the storage drought-duration length (SDL) index from (Eriyagama et al.,
2009). This index expresses the capacity to cope with droughts. “A higher proportion of months with
reliable water supply indicates greater Water Security for economic activities.” (AWDO, 2016). It first
determines the duration how long the storage capacity in a country (Ct) is sufficient to supply average
monthly surface water withdrawals (Wm). This duration is then related to the average drought duration in
months.
The Storage-Drought duration length index SDL is calculated as
SDL = (Ct/ Wm)/ DDM (-)
With
Ct: Storage capacity in a country (km3)
Wm: average monthly withdrawal (km3/ month)
DDM: average hydrological drought duration (months)
This index can be understood as extending a merely meteorological consideration of droughts with relevant
managerial aspects. Concerning the storage capacity, the same remarks on actual available capacities, as
stated above, does apply are here as well. The other challenge in considering the storage capacities to
cope with droughts is that the Water Security depend to a large extend from the filling status of the
storages. Especially in periods of consecutive dry spells and repeating droughts, the water available in the
dams is at minimum and far from the reported minimum.
3.1.4 Calculating the Economic Water Security at National scale
As stated above, the Key Dimension 2 – Economic Water Security offers a suitable framework to depict
the interplay between Water Stress and efforts to increase the agricultural water productivity as e.g. by
the introduction of high value crops, efficient irrigation and the potential reuse of waste water. The ap-
proach for calculating the Economic Water Security as Key dimension 2 of the AWDO 2016 framework has
been developed by IWMI.
According to its composition, the index Economic Water Security can be usefully applied when the situation
to secure water for the agriculture, the electricity production and the industrial production should be as-
sessed against the threats and factors that potentially improve Water Security over time. The use of the
economic Water Security index system as a stand-alone assessment had been also demonstrated by
(Holmatov et al., 2017), who had applied the Economic Water Security to the countries of the SADC region.
The 2016 AWDO key dimension Economic Water security is based on the performance of four sub indica-
tors—a general one and three specific sector sub-indicators. Which can be seen in table 1. Each of this four
indicators is composed by other sub-indicators. In total, three levels of sub-indicator and the final score
AWDO could be identified (Figure 3).
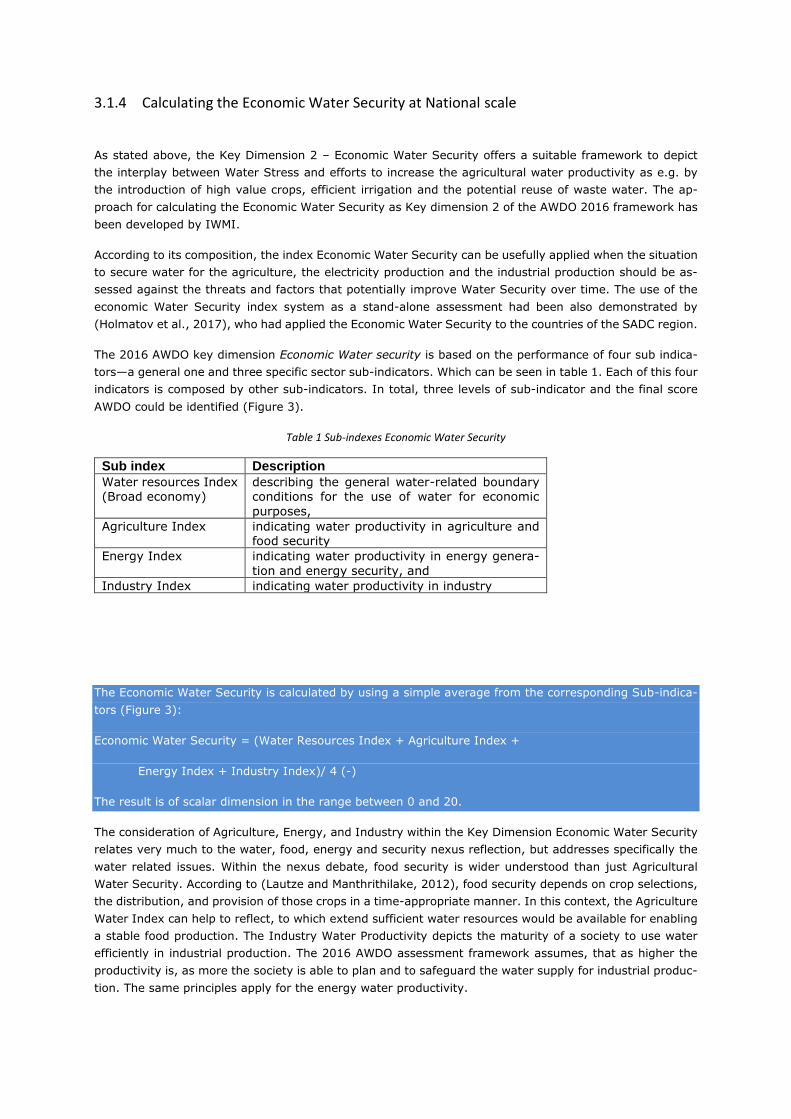
Table 1 Sub-indexes Economic Water Security
Sub index Description
Water resources Index (Broad economy)
describing the general water-related boundary conditions for the use of water for economic
purposes,
Agriculture Index indicating water productivity in agriculture and food security
Energy Index indicating water productivity in energy genera-
tion and energy security, and
Industry Index indicating water productivity in industry
The Economic Water Security is calculated by using a simple average from the corresponding Sub-indica-
tors (Figure 3):
Economic Water Security = (Water Resources Index + Agriculture Index +
Energy Index + Industry Index)/ 4 (-)
The result is of scalar dimension in the range between 0 and 20.
The consideration of Agriculture, Energy, and Industry within the Key Dimension Economic Water Security
relates very much to the water, food, energy and security nexus reflection, but addresses specifically the
water related issues. Within the nexus debate, food security is wider understood than just Agricultural
Water Security. According to (Lautze and Manthrithilake, 2012), food security depends on crop selections,
the distribution, and provision of those crops in a time-appropriate manner. In this context, the Agriculture
Water Index can help to reflect, to which extend sufficient water resources would be available for enabling
a stable food production. The Industry Water Productivity depicts the maturity of a society to use water
efficiently in industrial production. The 2016 AWDO assessment framework assumes, that as higher the
productivity is, as more the society is able to plan and to safeguard the water supply for industrial produc-
tion. The same principles apply for the energy water productivity.
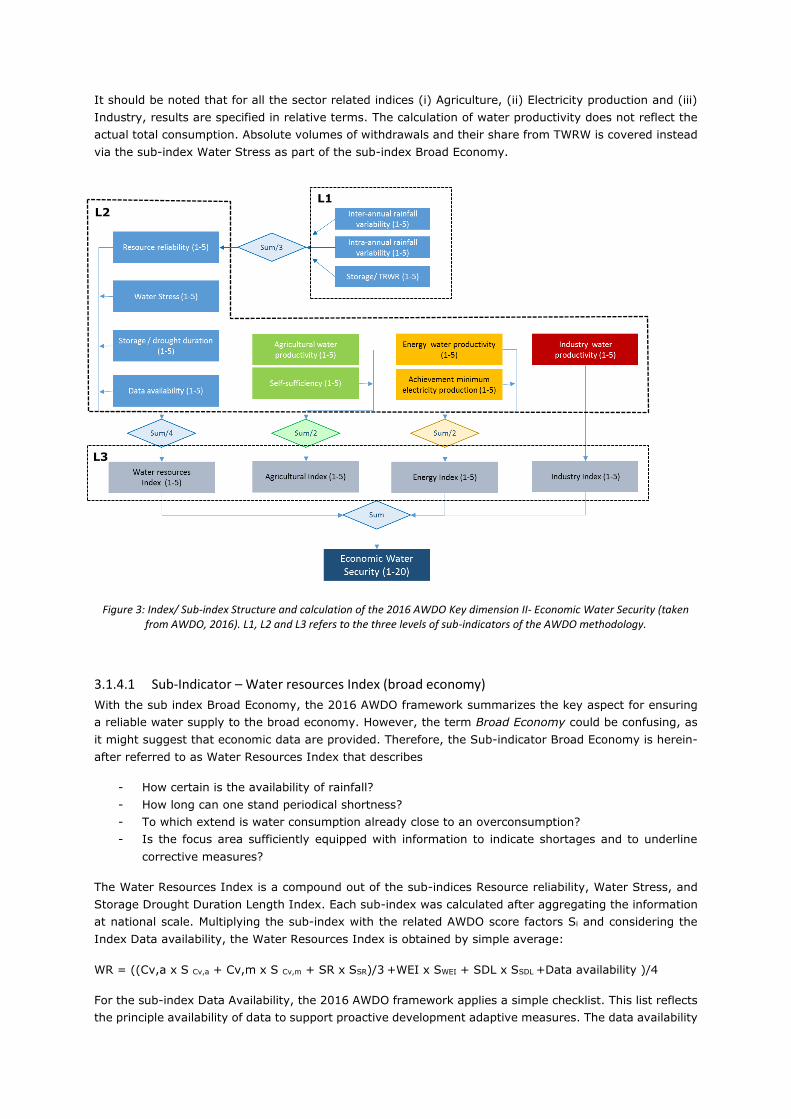
It should be noted that for all the sector related indices (i) Agriculture, (ii) Electricity production and (iii)
Industry, results are specified in relative terms. The calculation of water productivity does not reflect the
actual total consumption. Absolute volumes of withdrawals and their share from TWRW is covered instead
via the sub-index Water Stress as part of the sub-index Broad Economy.
Figure 3: Index/ Sub-index Structure and calculation of the 2016 AWDO Key dimension II- Economic Water Security (taken from AWDO, 2016). L1, L2 and L3 refers to the three levels of sub-indicators of the AWDO methodology.
3.1.4.1 Sub-Indicator – Water resources Index (broad economy)
With the sub index Broad Economy, the 2016 AWDO framework summarizes the key aspect for ensuring
a reliable water supply to the broad economy. However, the term Broad Economy could be confusing, as
it might suggest that economic data are provided. Therefore, the Sub-indicator Broad Economy is herein-
after referred to as Water Resources Index that describes
- How certain is the availability of rainfall?
- How long can one stand periodical shortness?
- To which extend is water consumption already close to an overconsumption?
- Is the focus area sufficiently equipped with information to indicate shortages and to underline
corrective measures?
The Water Resources Index is a compound out of the sub-indices Resource reliability, Water Stress, and
Storage Drought Duration Length Index. Each sub-index was calculated after aggregating the information
at national scale. Multiplying the sub-index with the related AWDO score factors Si and considering the
Index Data availability, the Water Resources Index is obtained by simple average:
WR = ((Cv,a x S Cv,a + Cv,m x S Cv,m + SR x SSR)/3 +WEI x SWEI + SDL x SSDL +Data availability )/4
For the sub-index Data Availability, the 2016 AWDO framework applies a simple checklist. This list reflects
the principle availability of data to support proactive development adaptive measures. The data availability
L1
L2
L3
is measured by the degree to which data were generally available to populate the economic Water Security
indicators. The checklist comprises eight specific data sets. The association to the scores consider the
availability of 4 out of 8 data sets as lowest and increase the score with any additional data set available
(see also AWDO, 2016).
3.1.4.2 Sub-indicator - Agricultural Index
The enormous relevance of water to secure the food production within a country is widely understood in
science and policymaking. Agriculture was a longer time not high on the agenda, but both the milestone
report Water for Food – Water for life as result of the comprehensive assessment of water in agriculture
and a series of food crisis underpinned the utmost importance of agricultural water management. Agricul-
ture is not only a strong backbone and a nucleus to advance national economies, but especially in rural
areas, a vitally factor to maintain employment and a quality of life.
Within the Sub-Indicator Agricultural Index, the 2016 AWDO framework considers two dimensions. Firstly,
the Agricultural Water productivity WPA, as the degree to which extend there is a readiness of the sector
to use the scarce resource in an efficient way. Secondly, the Self-sufficiency in Agriculture, depicting the
resilience of the agricultural sector against shocks and temporary production shortfalls. Within this study,
the calculation of the Self-sufficiency in Agriculture is omitted as the underlying assumption is somehow
incomprehensible. More evidence should be gathered that a higher self-sufficiency indeed would reduce
the resilience against water scarcity.
AWDO 2016 determines Agricultural Water Productivity by associating the agricultural gross domestic
product to water consumption for the agricultural production.
The water productivity in the agriculture sector is calculated as:
WPA = GDPA/ AgrET ($ million/ km3)
with:
GDPA : agricultural gross domestic product (million $)
AgrET: agricultural evapotranspiration (km3)
According to the AWDO 2016, higher agricultural water productivity indicates a higher Water Security.
Increasing the agricultural water productivity coincides with either increasing the production, which reflect
skills in farming and/ or in skills to reduce the unproductive losses.
At national scale, information of agricultural value-added can be obtained from databases such as provided
by the World Bank. Data on the Agricultural Gross domestic product AGDP are partly available at sub
national scale.
Within this study, reported figures on the Agricultural productivity had been obtained from the Aquastat
database.
Using the 2016 AWDO score tables, the Agricultural Index is simply obtained by multiplying the Agricultural
Water Productivity with its related score factor.
Agriculture Index = WPA x S WPA
3.1.4.3 Sub-Indicator - Energy Index (in terms of Electricity)
Until now, agriculture is frequently reported to be the biggest consumer or freshwater resources. However,
especially in North Africa there is a huge demand to increase the energy production for cooling, information
exchange, industrial processing and transport. A development that will be even further stimulated by the
ongoing digital development in societies.
The 2016 AWDO framework considers two aspects for defining the Energy related Water Security
- The estimation how efficient the water is used to produce energy (Energy Water Productivity) and - The estimation how far the energy production is already developed in comparison to other coun-
tries in the study region (Achievement of Minimum Platform for Electricity Production) The Energy Water Productivity WPE is measured according to the 2016 AWDO framework as the total
electricity production related to the quantity of water consumed in all categories to produce that electricity.
WPE = PE / WRE
with:
PE: Electricity production (GWh)
WRE: Water resources consumed (km3)
The 2016 AWDO framework used the IEA categories (IEA 2015) on country’s electricity production from
coal, oil, gas, biofuels, waste, nuclear, hydro, geothermal, solar photovoltaic, solar thermal, wind, tide and
the IEA 2012 data to determine the electricity production per category.
The water consumption to produce the electricity in each category had been determined at national scale.
For each category the median water consumption instead of extremes were considered. For calculating the
water consumption for producing electricity from both biofuels and biomass, data from (Gerbens-Leenes,
et al., 2008) were used.
The degree of development in power production related to the per capita average electricity production is
called within the AWDO 2016 framework “Minimum platform for electricity production”.
As higher, the spread to the average energy production in the region is, as lower, the Water Security is
assumed. According to AWDO 2016, regions with an electricity production lower than average electricity
production are likely to develop more capacities in the future, which would result in an increase of water
consumption correspondingly.
The Minimum platform for electricity production MPE is calculated as
𝑀𝑃𝐸 = 1 − (𝑃𝐸,𝑐𝑎𝑝̅̅ ̅̅ ̅̅ ̅̅ ̅−𝑃𝐸,𝑐𝑎𝑝
𝑃𝐸,𝑐𝑎𝑝̅̅ ̅̅ ̅̅ ̅̅ ̅) (-)
with:
PE,cap̅̅ ̅̅ ̅̅ ̅
: Average per capita electricity production in the region (Gwh/ cap)
PE,cap: Per capita electricity production in the specific location (Gwh/ cap)
It is important to note that this approach is assessing only water consumption food prints from the running
operations. Water consumption from establishing the plants are not considered here.
A relevant question to apply the Minimum platform for electricity production at national scale is to define,
which neighboured countries are chosen to define the average per capita production. Especially looking to
the Mediterranean African Countries, comparing Egypt, Libya, Morocco, Tunisia, and Algeria would result
into a different result than as extending the comparison to the MENA countries and hence including coun-
tries as Qatar and the United Arab Emirates. Yet, other results would be obtained when considering the
average of the Circum–Mediterranean group of countries, sharing similar climate and hydrological condi-
tions. More important than the absolute numbers, is to analyse to which extend there is a gap in energy
production according to the regional average and what is the likely future demand and development.
The final Energy Index is obtained by a simple average from both components and the AWDO scores
respectively
Energy Index = (WPE x S WPE + MPE x S MPE) / 2
3.1.4.4 Sub-Indicator – Industry Index
The industrial water consumption can make up a significant share in some industrial areas (even extending
the agricultural water use) while in other, often rural regions, it can be completely negligible.
The 2016 AWDO Framework is considering the Industrial Water Productivity only. The metric gives an
indication on the maturity of local industries to invest in water saving production processes, recycling or
the attraction of industrial sectors that are using less water anyway.
The industrial water productivity WPI can be calculated as
WPI = GDPI / WRI ($ million/km3)
with:
GDPI: Gross Development product in Industry ($ million dollar)
WRI: Water withdrawal for industrial consumption (km3)
Using the 2016 AWDO Score factors the Industry Index is obtained as follows
Industry Index = WPI x SWPI
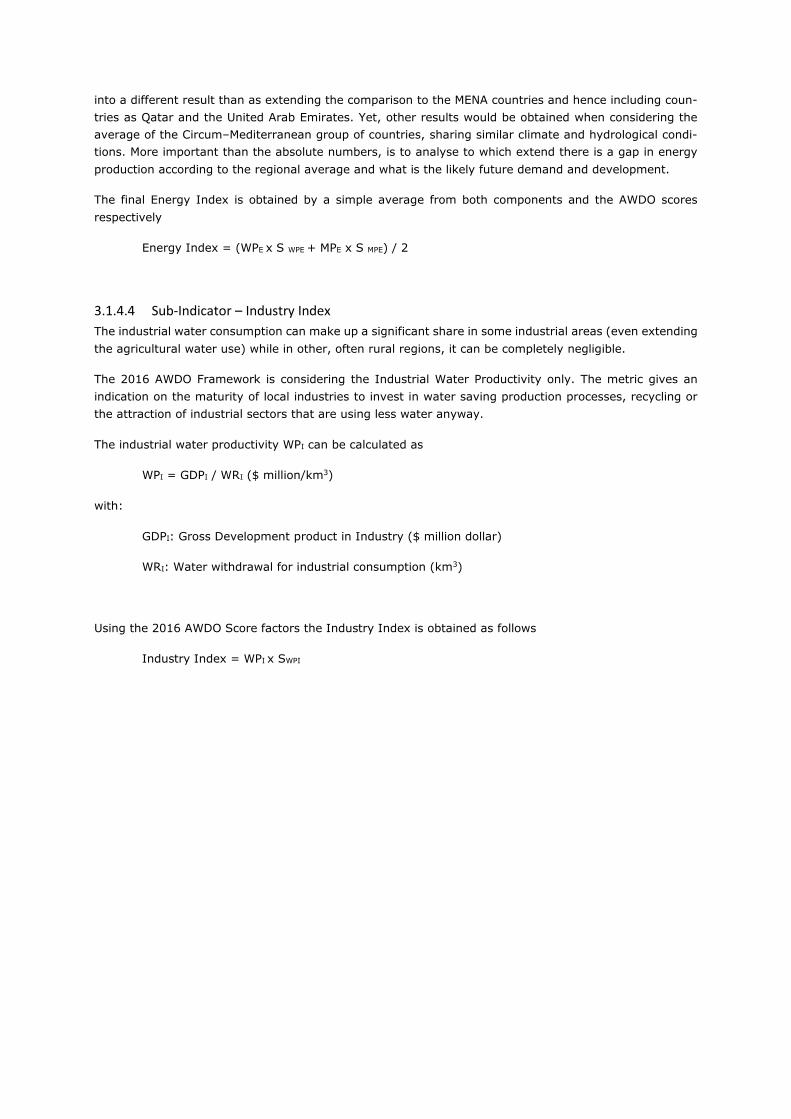
3.1.5 Integration of results from analyses at sub-national and national scales
The results from the detailed Water Stress evaluation at sub-national scale and the relative scores of the
2016 AWDO sub indicators can be used to embed decisions for prioritising wastewater ruse options into a
wider context.
Figure 4: Decision making tree to prioritise wastewater reuse interventions to increase Water Security
Figure 4 provides a stepwise decision support. In a first step, the basic availability of water resources in
terms of rainfall variability and storage capacities is assessed. This gives information to which extend the
further development of water resources is a reasonable option or not.
In the second step, one can assess the spatial variability on the water demand side. Here the AWDO scoring
can help to indicate a general severity of the situation, while the spatially differentiated analyses are used
to analyse the priority areas.
In a final step, the AWDO scores on the different sectors are used to embed the planning of interventions
first into a multi sector perspective. While additional in depth socio economic studies might be required to
get more insights that are specific. The general information that can be obtained from the AWDO framework
already gives a useful first orientation.
3.2 Characterising Water Stress and Water Security in Morocco
With a TRWR of around 29 km3/year (66% surface water, 34% groundwater), the total water withdrawal
of Morocco is estimated in around 10.6 km3/year, most of them dedicated to agriculture (86%), following
by the urban (10%) and industrial (4%) sectors (FAO, 2016). For the population an average of around
878.8 m3/year is available to satisfy their freshwater requirements. This figure is far lower than the world-
wide average, estimated in 6000 m3/year, but slightly higher than reported for the neighbouring countries,
estimated in 287 m3/year for Algeria and 98 m3/year for Mauritania (FAO, 2016).
3.2.1 Mapping Water Stress at Sub-national level
The national figures hardly reflect the unequal distribution of the water resources across the territory and
along the year. Within this section, relevant information to characterize the Water Stress at sub-national
level are provided. The information is depicted for the individual river basins of Morocco.
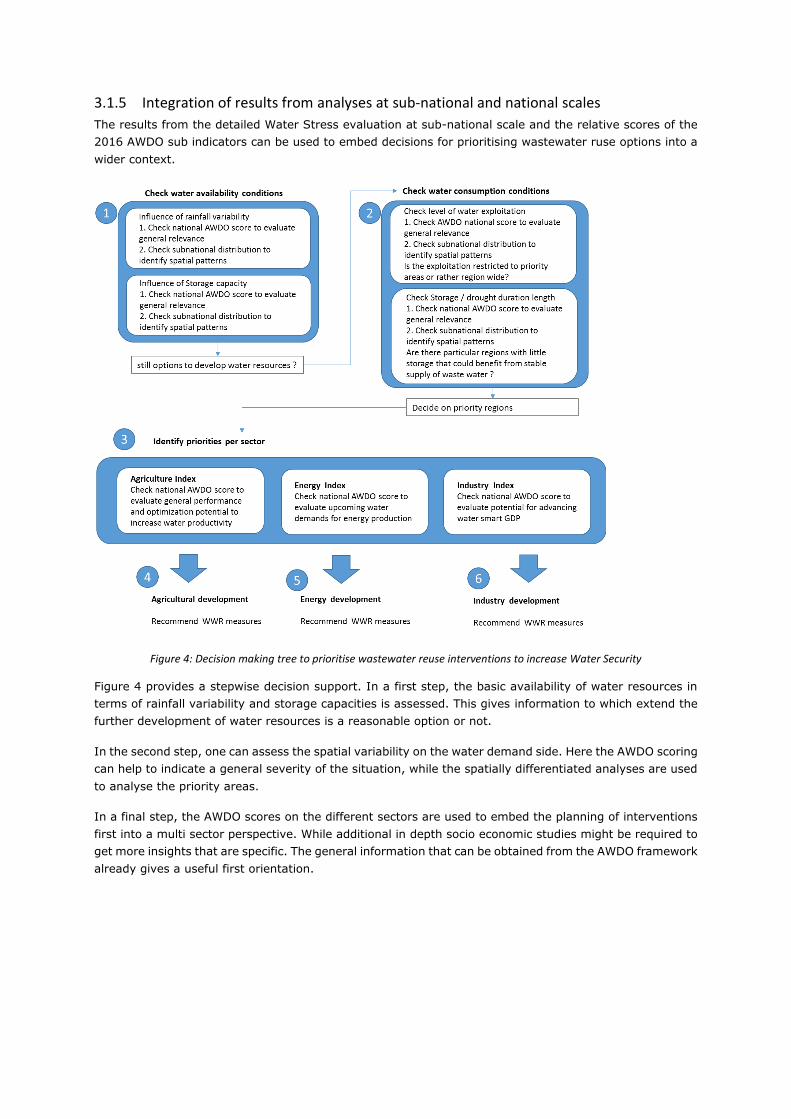
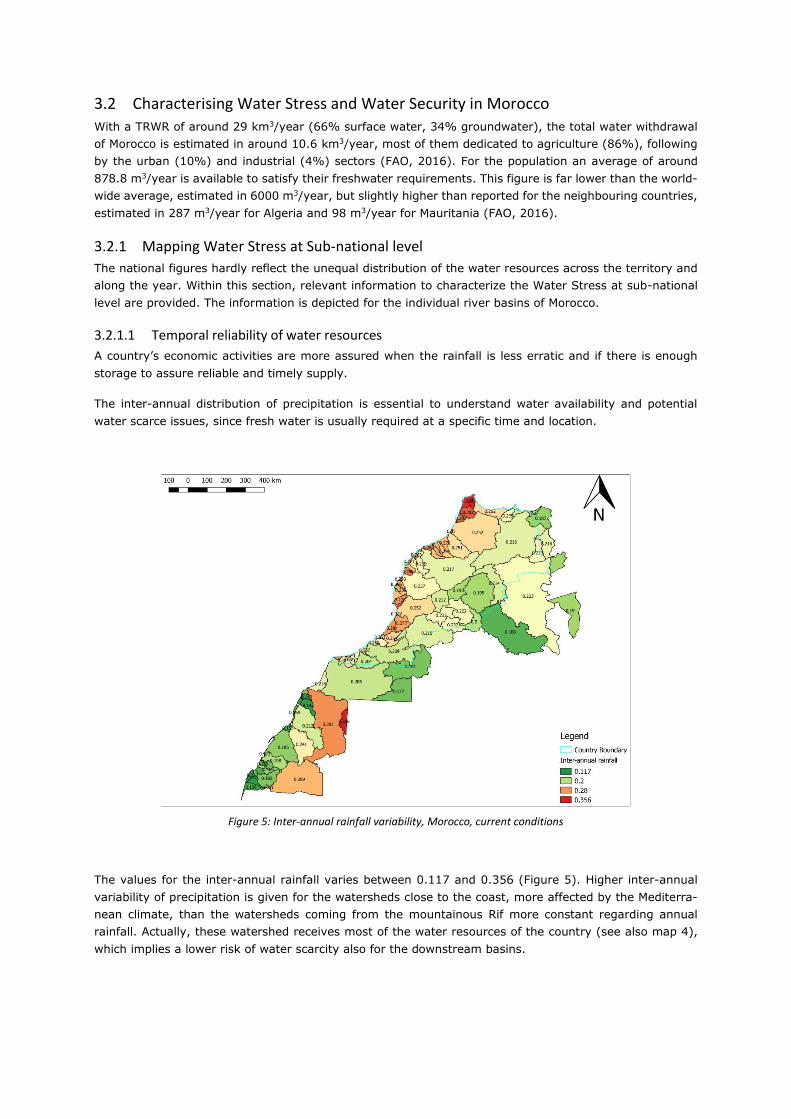
3.2.1.1 Temporal reliability of water resources
A country’s economic activities are more assured when the rainfall is less erratic and if there is enough
storage to assure reliable and timely supply.
The inter-annual distribution of precipitation is essential to understand water availability and potential
water scarce issues, since fresh water is usually required at a specific time and location.
Figure 5: Inter-annual rainfall variability, Morocco, current conditions
The values for the inter-annual rainfall varies between 0.117 and 0.356 (Figure 5). Higher inter-annual
variability of precipitation is given for the watersheds close to the coast, more affected by the Mediterra-
nean climate, than the watersheds coming from the mountainous Rif more constant regarding annual
rainfall. Actually, these watershed receives most of the water resources of the country (see also map 4),
which implies a lower risk of water scarcity also for the downstream basins.
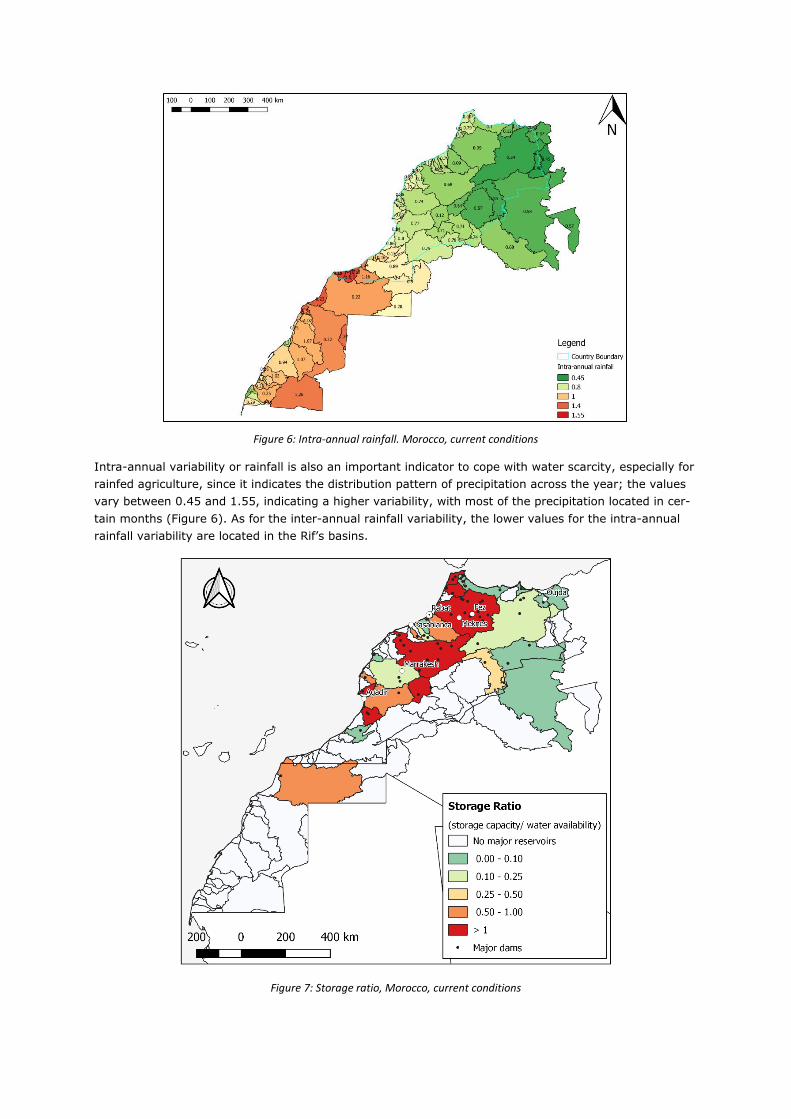
Figure 6: Intra-annual rainfall. Morocco, current conditions
Intra-annual variability or rainfall is also an important indicator to cope with water scarcity, especially for
rainfed agriculture, since it indicates the distribution pattern of precipitation across the year; the values
vary between 0.45 and 1.55, indicating a higher variability, with most of the precipitation located in cer-
tain months (Figure 6). As for the inter-annual rainfall variability, the lower values for the intra-annual
rainfall variability are located in the Rif’s basins.
Figure 7: Storage ratio, Morocco, current conditions
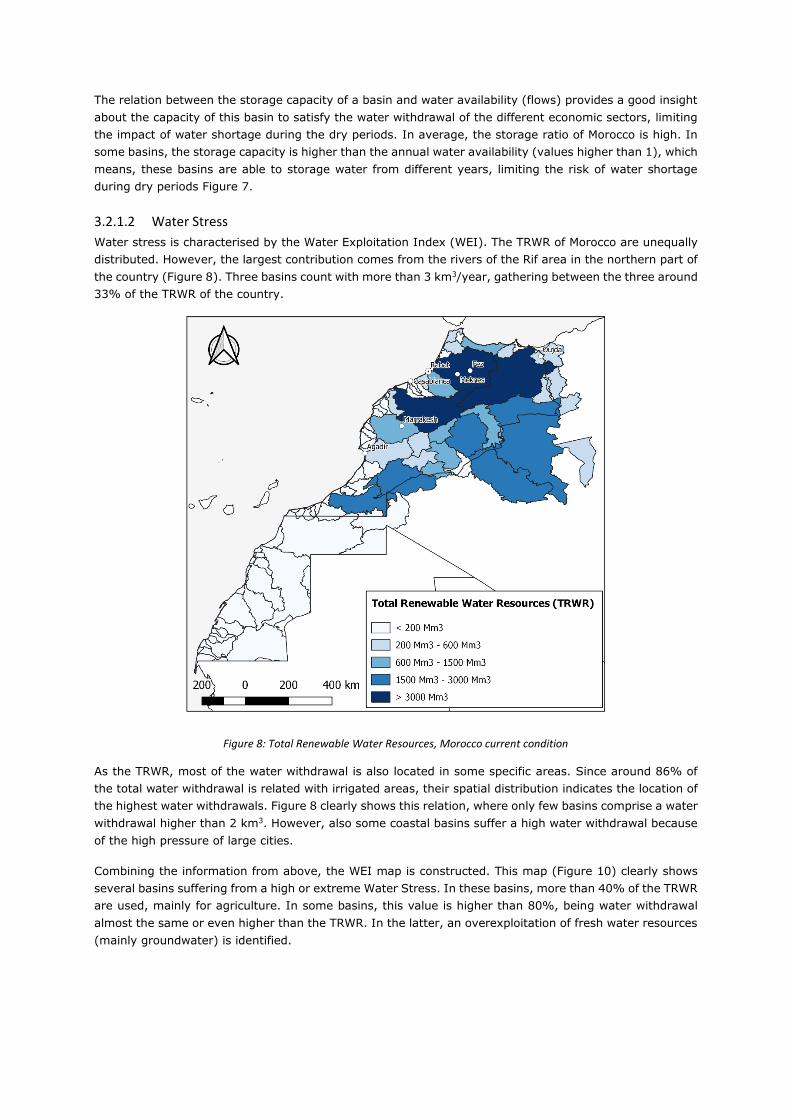
The relation between the storage capacity of a basin and water availability (flows) provides a good insight
about the capacity of this basin to satisfy the water withdrawal of the different economic sectors, limiting
the impact of water shortage during the dry periods. In average, the storage ratio of Morocco is high. In
some basins, the storage capacity is higher than the annual water availability (values higher than 1), which
means, these basins are able to storage water from different years, limiting the risk of water shortage
during dry periods Figure 7.
3.2.1.2 Water Stress
Water stress is characterised by the Water Exploitation Index (WEI). The TRWR of Morocco are unequally
distributed. However, the largest contribution comes from the rivers of the Rif area in the northern part of
the country (Figure 8). Three basins count with more than 3 km3/year, gathering between the three around
33% of the TRWR of the country.
Figure 8: Total Renewable Water Resources, Morocco current condition
As the TRWR, most of the water withdrawal is also located in some specific areas. Since around 86% of
the total water withdrawal is related with irrigated areas, their spatial distribution indicates the location of
the highest water withdrawals. Figure 8 clearly shows this relation, where only few basins comprise a water
withdrawal higher than 2 km3. However, also some coastal basins suffer a high water withdrawal because
of the high pressure of large cities.
Combining the information from above, the WEI map is constructed. This map (Figure 10) clearly shows
several basins suffering from a high or extreme Water Stress. In these basins, more than 40% of the TRWR
are used, mainly for agriculture. In some basins, this value is higher than 80%, being water withdrawal
almost the same or even higher than the TRWR. In the latter, an overexploitation of fresh water resources
(mainly groundwater) is identified.
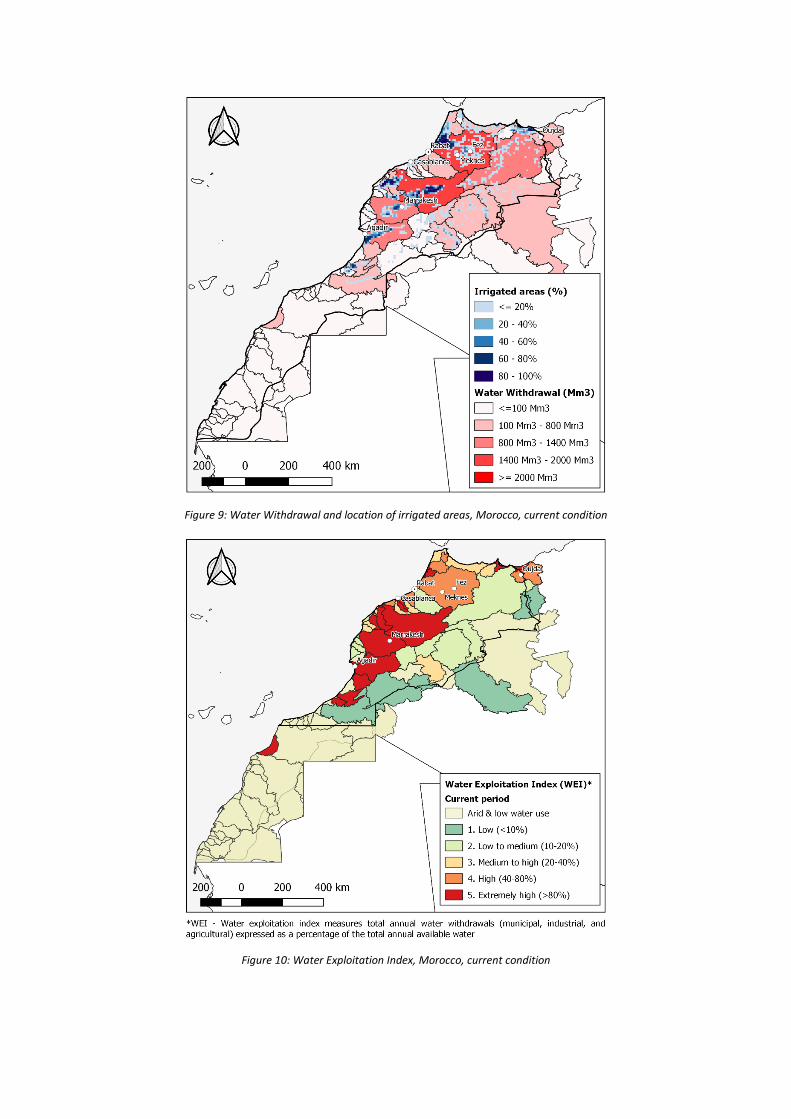
Figure 9: Water Withdrawal and location of irrigated areas, Morocco, current condition
Figure 10: Water Exploitation Index, Morocco, current condition
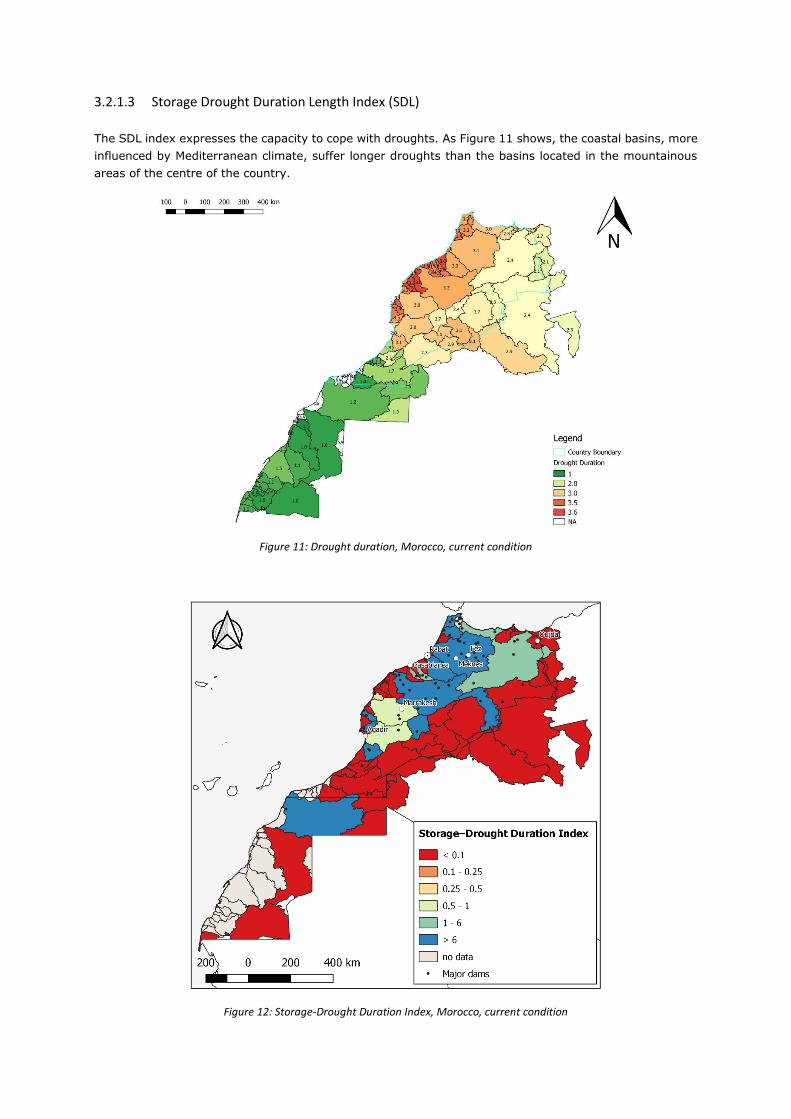
3.2.1.3 Storage Drought Duration Length Index (SDL)
The SDL index expresses the capacity to cope with droughts. As Figure 11 shows, the coastal basins, more
influenced by Mediterranean climate, suffer longer droughts than the basins located in the mountainous
areas of the centre of the country.
Figure 11: Drought duration, Morocco, current condition
Figure 12: Storage-Drought Duration Index, Morocco, current condition
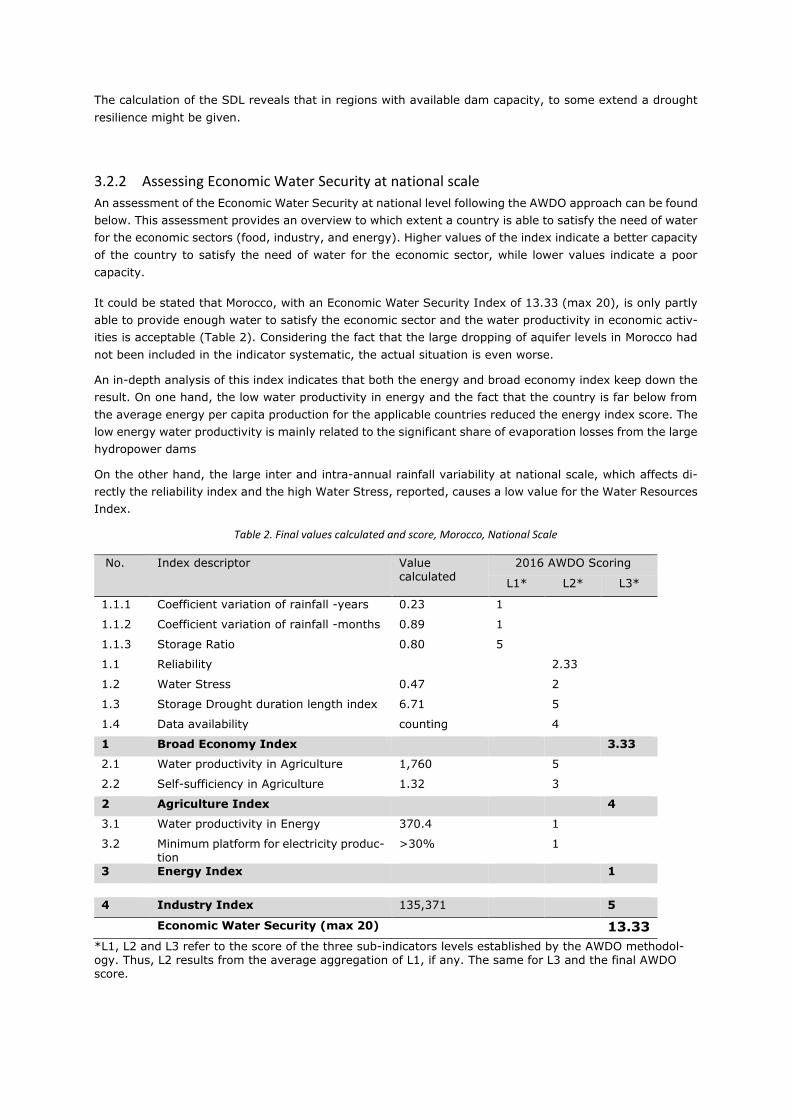
The calculation of the SDL reveals that in regions with available dam capacity, to some extend a drought
resilience might be given.
3.2.2 Assessing Economic Water Security at national scale
An assessment of the Economic Water Security at national level following the AWDO approach can be found
below. This assessment provides an overview to which extent a country is able to satisfy the need of water
for the economic sectors (food, industry, and energy). Higher values of the index indicate a better capacity
of the country to satisfy the need of water for the economic sector, while lower values indicate a poor
capacity.
It could be stated that Morocco, with an Economic Water Security Index of 13.33 (max 20), is only partly
able to provide enough water to satisfy the economic sector and the water productivity in economic activ-
ities is acceptable (Table 2). Considering the fact that the large dropping of aquifer levels in Morocco had
not been included in the indicator systematic, the actual situation is even worse.
An in-depth analysis of this index indicates that both the energy and broad economy index keep down the
result. On one hand, the low water productivity in energy and the fact that the country is far below from
the average energy per capita production for the applicable countries reduced the energy index score. The
low energy water productivity is mainly related to the significant share of evaporation losses from the large
hydropower dams
On the other hand, the large inter and intra-annual rainfall variability at national scale, which affects di-
rectly the reliability index and the high Water Stress, reported, causes a low value for the Water Resources
Index.
Table 2. Final values calculated and score, Morocco, National Scale
No. Index descriptor Value calculated
2016 AWDO Scoring
L1* L2* L3*
1.1.1 Coefficient variation of rainfall -years 0.23 1
1.1.2 Coefficient variation of rainfall -months 0.89 1
1.1.3 Storage Ratio 0.80 5
1.1 Reliability 2.33
1.2 Water Stress 0.47 2
1.3 Storage Drought duration length index 6.71 5
1.4 Data availability counting 4
1 Broad Economy Index 3.33
2.1 Water productivity in Agriculture 1,760 5
2.2 Self-sufficiency in Agriculture 1.32 3
2 Agriculture Index 4
3.1 Water productivity in Energy 370.4 1
3.2 Minimum platform for electricity produc-tion
>30% 1
3 Energy Index 1
4 Industry Index 135,371
5
Economic Water Security (max 20) 13.33
*L1, L2 and L3 refer to the score of the three sub-indicators levels established by the AWDO methodol-ogy. Thus, L2 results from the average aggregation of L1, if any. The same for L3 and the final AWDO score.
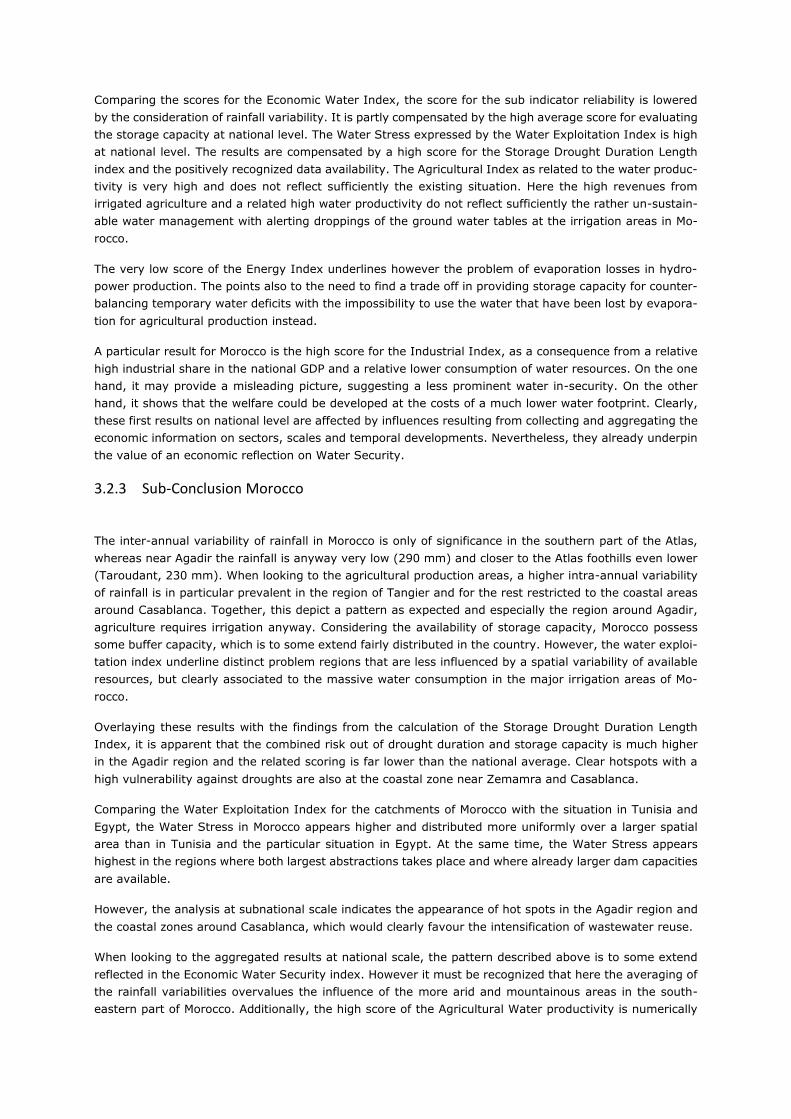
Comparing the scores for the Economic Water Index, the score for the sub indicator reliability is lowered
by the consideration of rainfall variability. It is partly compensated by the high average score for evaluating
the storage capacity at national level. The Water Stress expressed by the Water Exploitation Index is high
at national level. The results are compensated by a high score for the Storage Drought Duration Length
index and the positively recognized data availability. The Agricultural Index as related to the water produc-
tivity is very high and does not reflect sufficiently the existing situation. Here the high revenues from
irrigated agriculture and a related high water productivity do not reflect sufficiently the rather un-sustain-
able water management with alerting droppings of the ground water tables at the irrigation areas in Mo-
rocco.
The very low score of the Energy Index underlines however the problem of evaporation losses in hydro-
power production. The points also to the need to find a trade off in providing storage capacity for counter-
balancing temporary water deficits with the impossibility to use the water that have been lost by evapora-
tion for agricultural production instead.
A particular result for Morocco is the high score for the Industrial Index, as a consequence from a relative
high industrial share in the national GDP and a relative lower consumption of water resources. On the one
hand, it may provide a misleading picture, suggesting a less prominent water in-security. On the other
hand, it shows that the welfare could be developed at the costs of a much lower water footprint. Clearly,
these first results on national level are affected by influences resulting from collecting and aggregating the
economic information on sectors, scales and temporal developments. Nevertheless, they already underpin
the value of an economic reflection on Water Security.
3.2.3 Sub-Conclusion Morocco
The inter-annual variability of rainfall in Morocco is only of significance in the southern part of the Atlas,
whereas near Agadir the rainfall is anyway very low (290 mm) and closer to the Atlas foothills even lower
(Taroudant, 230 mm). When looking to the agricultural production areas, a higher intra-annual variability
of rainfall is in particular prevalent in the region of Tangier and for the rest restricted to the coastal areas
around Casablanca. Together, this depict a pattern as expected and especially the region around Agadir,
agriculture requires irrigation anyway. Considering the availability of storage capacity, Morocco possess
some buffer capacity, which is to some extend fairly distributed in the country. However, the water exploi-
tation index underline distinct problem regions that are less influenced by a spatial variability of available
resources, but clearly associated to the massive water consumption in the major irrigation areas of Mo-
rocco.
Overlaying these results with the findings from the calculation of the Storage Drought Duration Length
Index, it is apparent that the combined risk out of drought duration and storage capacity is much higher
in the Agadir region and the related scoring is far lower than the national average. Clear hotspots with a
high vulnerability against droughts are also at the coastal zone near Zemamra and Casablanca.
Comparing the Water Exploitation Index for the catchments of Morocco with the situation in Tunisia and
Egypt, the Water Stress in Morocco appears higher and distributed more uniformly over a larger spatial
area than in Tunisia and the particular situation in Egypt. At the same time, the Water Stress appears
highest in the regions where both largest abstractions takes place and where already larger dam capacities
are available.
However, the analysis at subnational scale indicates the appearance of hot spots in the Agadir region and
the coastal zones around Casablanca, which would clearly favour the intensification of wastewater reuse.
When looking to the aggregated results at national scale, the pattern described above is to some extend
reflected in the Economic Water Security index. However it must be recognized that here the averaging of
the rainfall variabilities overvalues the influence of the more arid and mountainous areas in the south-
eastern part of Morocco. Additionally, the high score of the Agricultural Water productivity is numerically
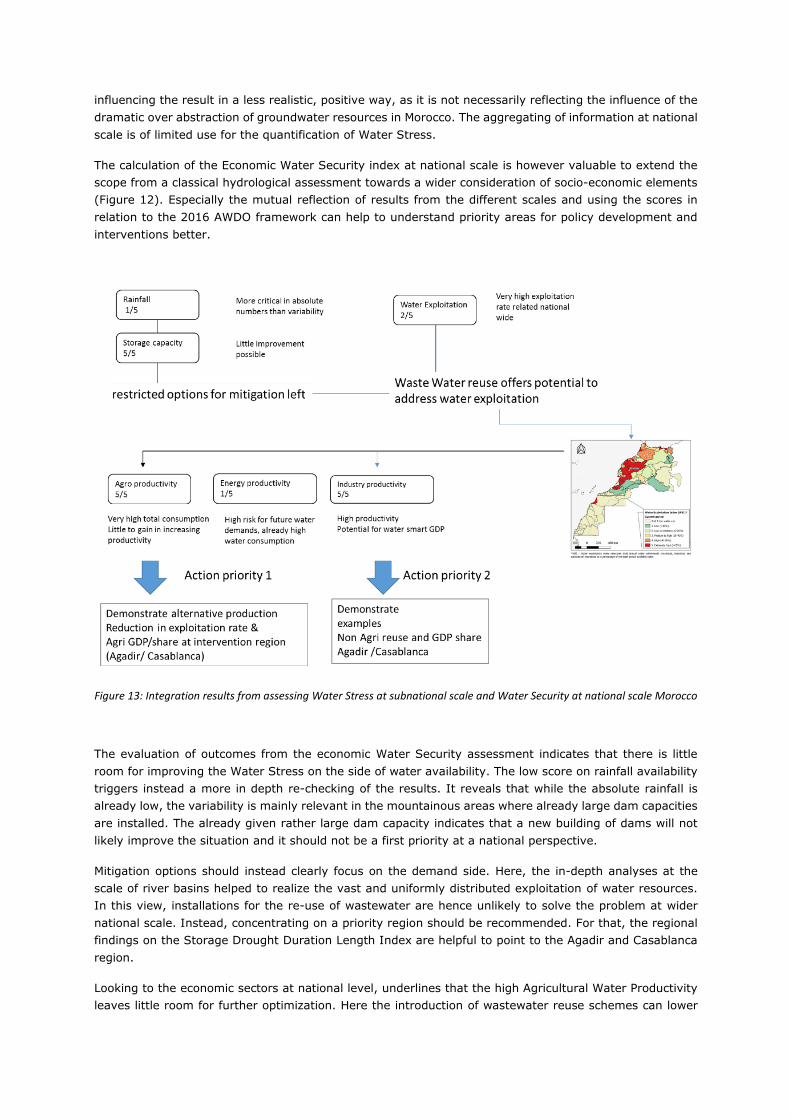
influencing the result in a less realistic, positive way, as it is not necessarily reflecting the influence of the
dramatic over abstraction of groundwater resources in Morocco. The aggregating of information at national
scale is of limited use for the quantification of Water Stress.
The calculation of the Economic Water Security index at national scale is however valuable to extend the
scope from a classical hydrological assessment towards a wider consideration of socio-economic elements
(Figure 12). Especially the mutual reflection of results from the different scales and using the scores in
relation to the 2016 AWDO framework can help to understand priority areas for policy development and
interventions better.
Figure 13: Integration results from assessing Water Stress at subnational scale and Water Security at national scale Morocco
The evaluation of outcomes from the economic Water Security assessment indicates that there is little
room for improving the Water Stress on the side of water availability. The low score on rainfall availability
triggers instead a more in depth re-checking of the results. It reveals that while the absolute rainfall is
already low, the variability is mainly relevant in the mountainous areas where already large dam capacities
are installed. The already given rather large dam capacity indicates that a new building of dams will not
likely improve the situation and it should not be a first priority at a national perspective.
Mitigation options should instead clearly focus on the demand side. Here, the in-depth analyses at the
scale of river basins helped to realize the vast and uniformly distributed exploitation of water resources.
In this view, installations for the re-use of wastewater are hence unlikely to solve the problem at wider
national scale. Instead, concentrating on a priority region should be recommended. For that, the regional
findings on the Storage Drought Duration Length Index are helpful to point to the Agadir and Casablanca
region.
Looking to the economic sectors at national level, underlines that the high Agricultural Water Productivity
leaves little room for further optimization. Here the introduction of wastewater reuse schemes can lower
the consumption of freshwater resources. A prerequisite remains however that the production will not just
be extended, but that alternative production schemes can be developed instead. Understanding the vast
spatial spread of high water exploitation, it is recommended to concentrate also the impact evaluation for
selected regions. Predicting and monitoring the effect of wastewater reuse on alternatively created value
share in GDP as well as to demonstrate the effective reduction on the water exploitation rate will finally
enable a back linking of results to the originally elaborated assessments.
The low Energy index highlights that for Morocco there is a strong increase in electricity production to be
expected. A related increase in water consumption must be avoided. Here the new building or extension
of hydropower dams is not a recommendable option and photovoltaic production or the use of wind-energy
has to be favoured from the water perspective. Wastewater reuse interventions might be of little effect in
a first glance, but the international tendency to recover energy from the wastewater treatment process
can be an interesting aspect to minimise at least a further related increase in energy demand.
The Industrial Water Productivity appears already reasonably high at national scale. This is rather inter-
esting and underlines that there is a principle high share of GDP with reasonable water consumption pos-
sible. Future interventions within Morocco to mitigate the Water Stress should hence favour measures that
can boost the development towards a more “water smart GDP”. In this view, wastewater reuse schemes,
utilizing the effluent from controlled industrial processes especially from food & beverage processing, offers
further opportunities to lower the water food print accordingly. Additional, detailed studies to map the role
of industrial production as well as to relate the outcomes to a more defined differentiation industrial GDP
and related water productivity can help to give a more complete picture after the implementation of Waste
water reuse interventions.
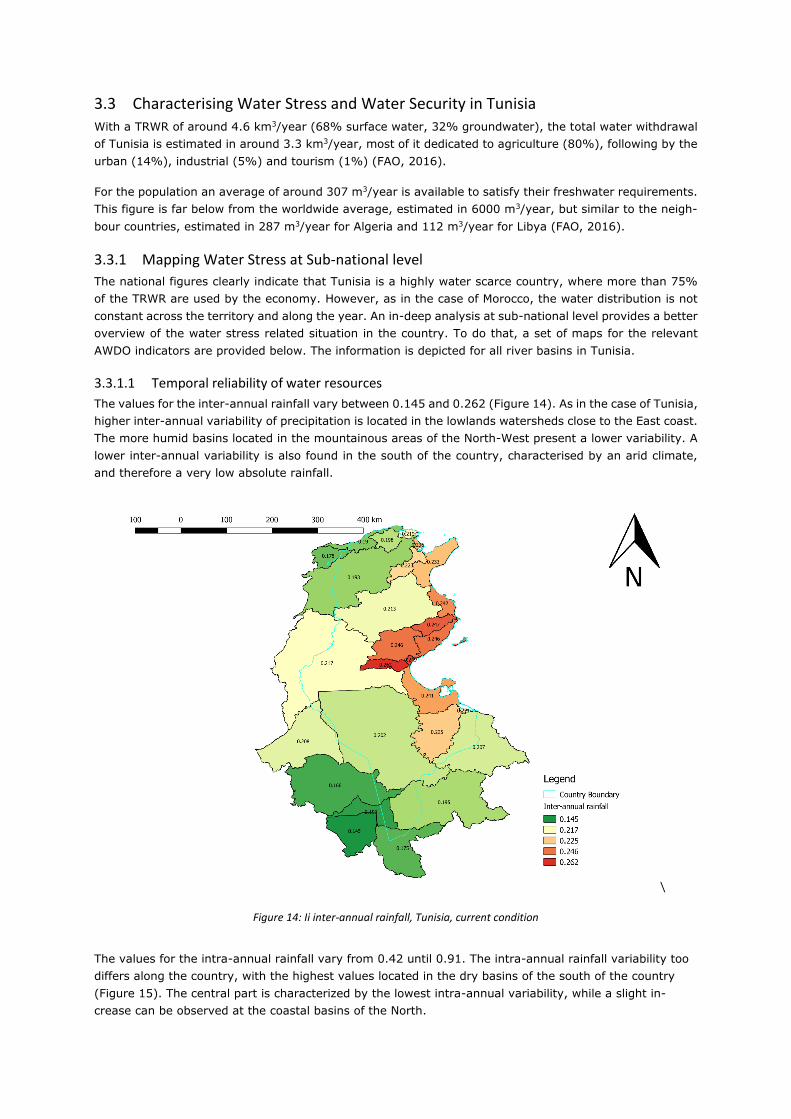
3.3 Characterising Water Stress and Water Security in Tunisia
With a TRWR of around 4.6 km3/year (68% surface water, 32% groundwater), the total water withdrawal
of Tunisia is estimated in around 3.3 km3/year, most of it dedicated to agriculture (80%), following by the
urban (14%), industrial (5%) and tourism (1%) (FAO, 2016).
For the population an average of around 307 m3/year is available to satisfy their freshwater requirements.
This figure is far below from the worldwide average, estimated in 6000 m3/year, but similar to the neigh-
bour countries, estimated in 287 m3/year for Algeria and 112 m3/year for Libya (FAO, 2016).
3.3.1 Mapping Water Stress at Sub-national level
The national figures clearly indicate that Tunisia is a highly water scarce country, where more than 75%
of the TRWR are used by the economy. However, as in the case of Morocco, the water distribution is not
constant across the territory and along the year. An in-deep analysis at sub-national level provides a better
overview of the water stress related situation in the country. To do that, a set of maps for the relevant
AWDO indicators are provided below. The information is depicted for all river basins in Tunisia.
3.3.1.1 Temporal reliability of water resources
The values for the inter-annual rainfall vary between 0.145 and 0.262 (Figure 14). As in the case of Tunisia,
higher inter-annual variability of precipitation is located in the lowlands watersheds close to the East coast.
The more humid basins located in the mountainous areas of the North-West present a lower variability. A
lower inter-annual variability is also found in the south of the country, characterised by an arid climate,
and therefore a very low absolute rainfall.
\
Figure 14: Ii inter-annual rainfall, Tunisia, current condition
The values for the intra-annual rainfall vary from 0.42 until 0.91. The intra-annual rainfall variability too
differs along the country, with the highest values located in the dry basins of the south of the country
(Figure 15). The central part is characterized by the lowest intra-annual variability, while a slight in-
crease can be observed at the coastal basins of the North.
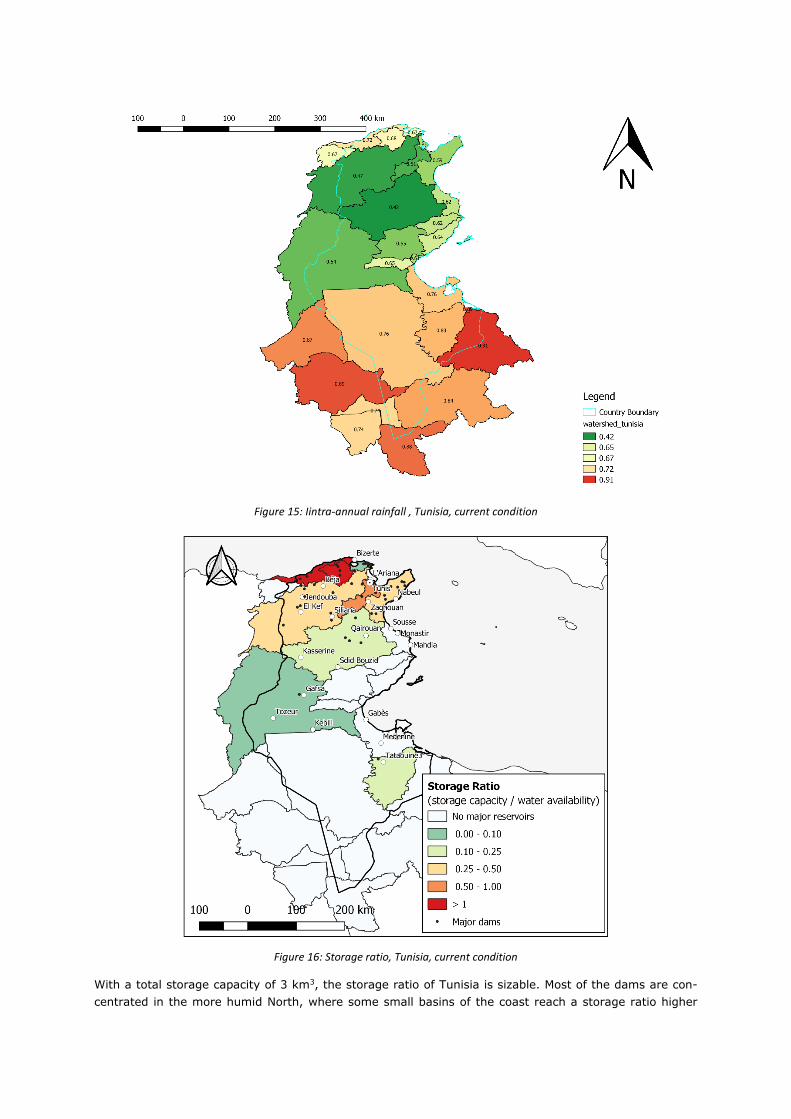
Figure 15: Iintra-annual rainfall , Tunisia, current condition
Figure 16: Storage ratio, Tunisia, current condition
With a total storage capacity of 3 km3, the storage ratio of Tunisia is sizable. Most of the dams are con-
centrated in the more humid North, where some small basins of the coast reach a storage ratio higher
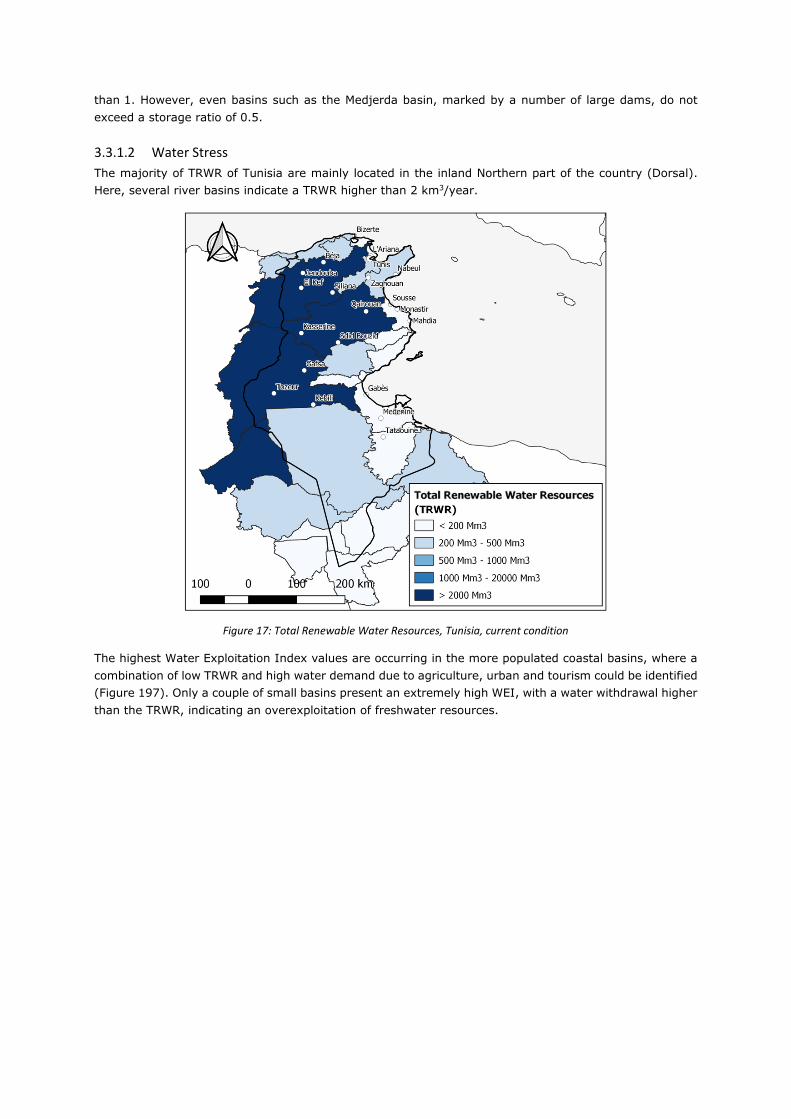
than 1. However, even basins such as the Medjerda basin, marked by a number of large dams, do not
exceed a storage ratio of 0.5.
3.3.1.2 Water Stress
The majority of TRWR of Tunisia are mainly located in the inland Northern part of the country (Dorsal).
Here, several river basins indicate a TRWR higher than 2 km3/year.
Figure 17: Total Renewable Water Resources, Tunisia, current condition
The highest Water Exploitation Index values are occurring in the more populated coastal basins, where a
combination of low TRWR and high water demand due to agriculture, urban and tourism could be identified
(Figure 197). Only a couple of small basins present an extremely high WEI, with a water withdrawal higher
than the TRWR, indicating an overexploitation of freshwater resources.
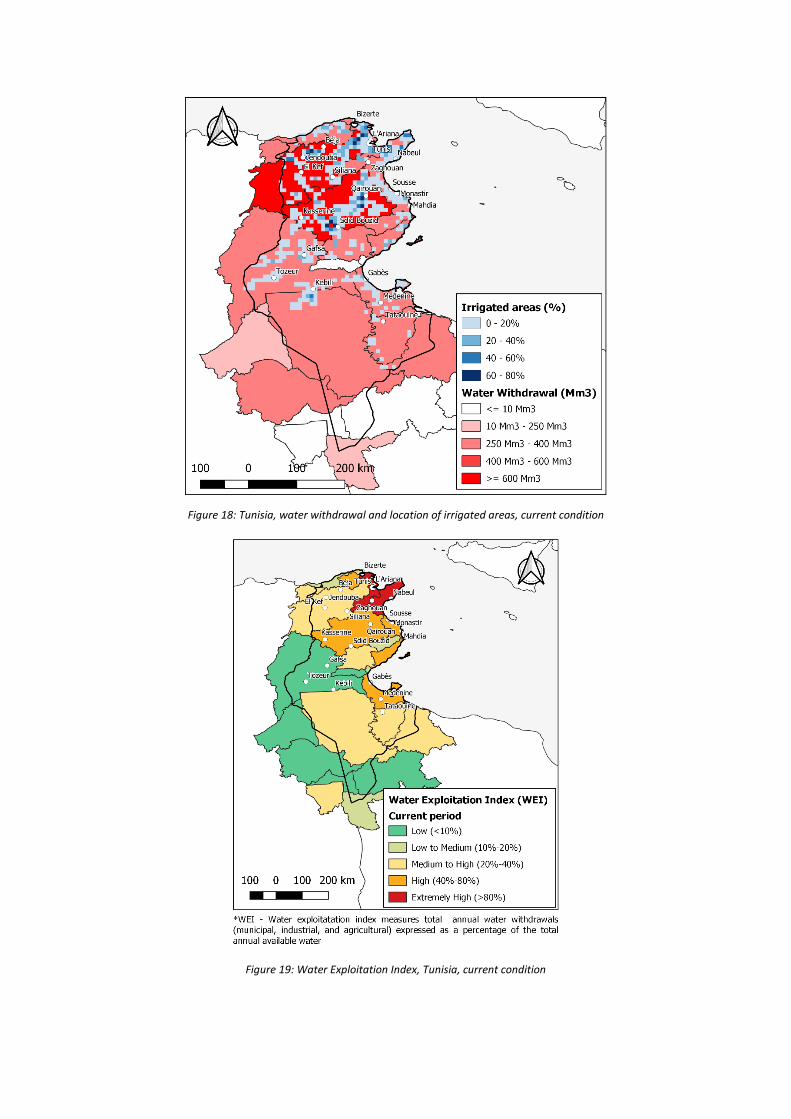
Figure 18: Tunisia, water withdrawal and location of irrigated areas, current condition
Figure 19: Water Exploitation Index, Tunisia, current condition
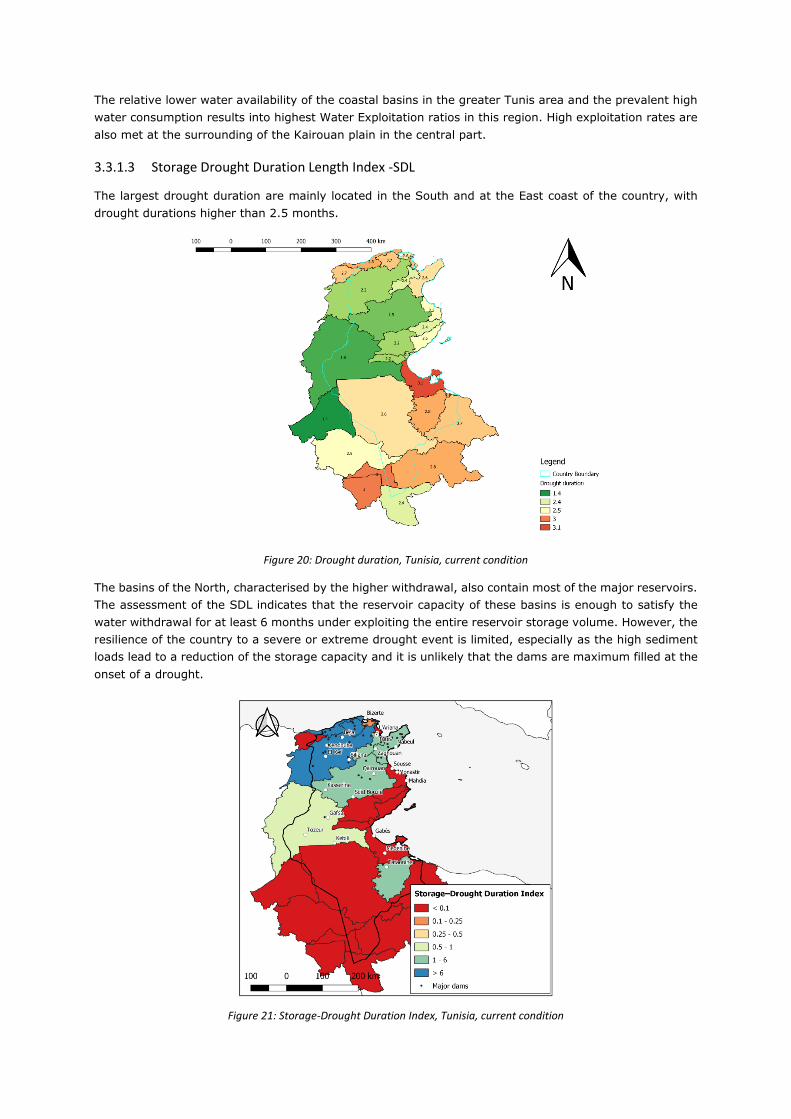
The relative lower water availability of the coastal basins in the greater Tunis area and the prevalent high
water consumption results into highest Water Exploitation ratios in this region. High exploitation rates are
also met at the surrounding of the Kairouan plain in the central part.
3.3.1.3 Storage Drought Duration Length Index -SDL
The largest drought duration are mainly located in the South and at the East coast of the country, with
drought durations higher than 2.5 months.
Figure 20: Drought duration, Tunisia, current condition
The basins of the North, characterised by the higher withdrawal, also contain most of the major reservoirs.
The assessment of the SDL indicates that the reservoir capacity of these basins is enough to satisfy the
water withdrawal for at least 6 months under exploiting the entire reservoir storage volume. However, the
resilience of the country to a severe or extreme drought event is limited, especially as the high sediment
loads lead to a reduction of the storage capacity and it is unlikely that the dams are maximum filled at the
onset of a drought.
Figure 21: Storage-Drought Duration Index, Tunisia, current condition
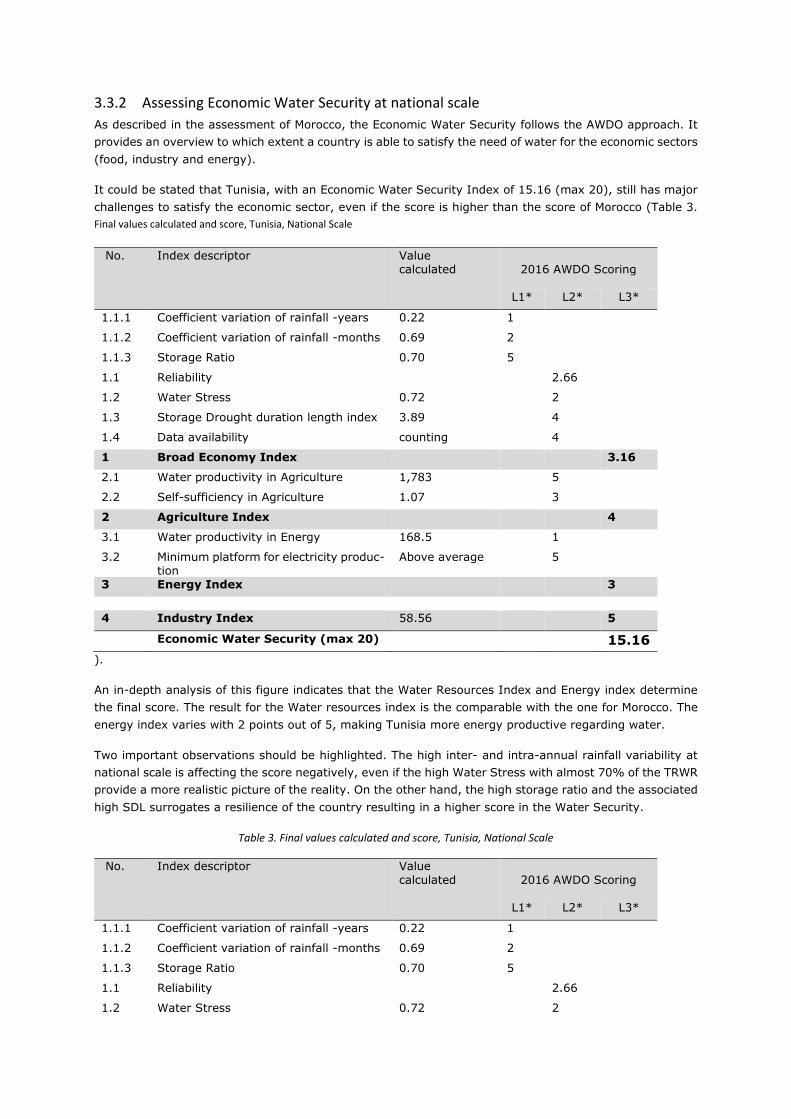
3.3.2 Assessing Economic Water Security at national scale
As described in the assessment of Morocco, the Economic Water Security follows the AWDO approach. It
provides an overview to which extent a country is able to satisfy the need of water for the economic sectors
(food, industry and energy).
It could be stated that Tunisia, with an Economic Water Security Index of 15.16 (max 20), still has major
challenges to satisfy the economic sector, even if the score is higher than the score of Morocco (Table 3.
Final values calculated and score, Tunisia, National Scale
No. Index descriptor Value calculated
2016 AWDO Scoring
L1* L2* L3*
1.1.1 Coefficient variation of rainfall -years 0.22 1
1.1.2 Coefficient variation of rainfall -months 0.69 2
1.1.3 Storage Ratio 0.70 5
1.1 Reliability 2.66
1.2 Water Stress 0.72 2
1.3 Storage Drought duration length index 3.89 4
1.4 Data availability counting 4
1 Broad Economy Index 3.16
2.1 Water productivity in Agriculture 1,783
5
2.2 Self-sufficiency in Agriculture 1.07
3
2 Agriculture Index
4
3.1 Water productivity in Energy 168.5 1
3.2 Minimum platform for electricity produc-tion
Above average 5
3 Energy Index 3
4 Industry Index 58.56
5
Economic Water Security (max 20) 15.16
).
An in-depth analysis of this figure indicates that the Water Resources Index and Energy index determine
the final score. The result for the Water resources index is the comparable with the one for Morocco. The
energy index varies with 2 points out of 5, making Tunisia more energy productive regarding water.
Two important observations should be highlighted. The high inter- and intra-annual rainfall variability at
national scale is affecting the score negatively, even if the high Water Stress with almost 70% of the TRWR
provide a more realistic picture of the reality. On the other hand, the high storage ratio and the associated
high SDL surrogates a resilience of the country resulting in a higher score in the Water Security.
Table 3. Final values calculated and score, Tunisia, National Scale
No. Index descriptor Value calculated
2016 AWDO Scoring
L1* L2* L3*
1.1.1 Coefficient variation of rainfall -years 0.22 1
1.1.2 Coefficient variation of rainfall -months 0.69 2
1.1.3 Storage Ratio 0.70 5
1.1 Reliability 2.66
1.2 Water Stress 0.72 2
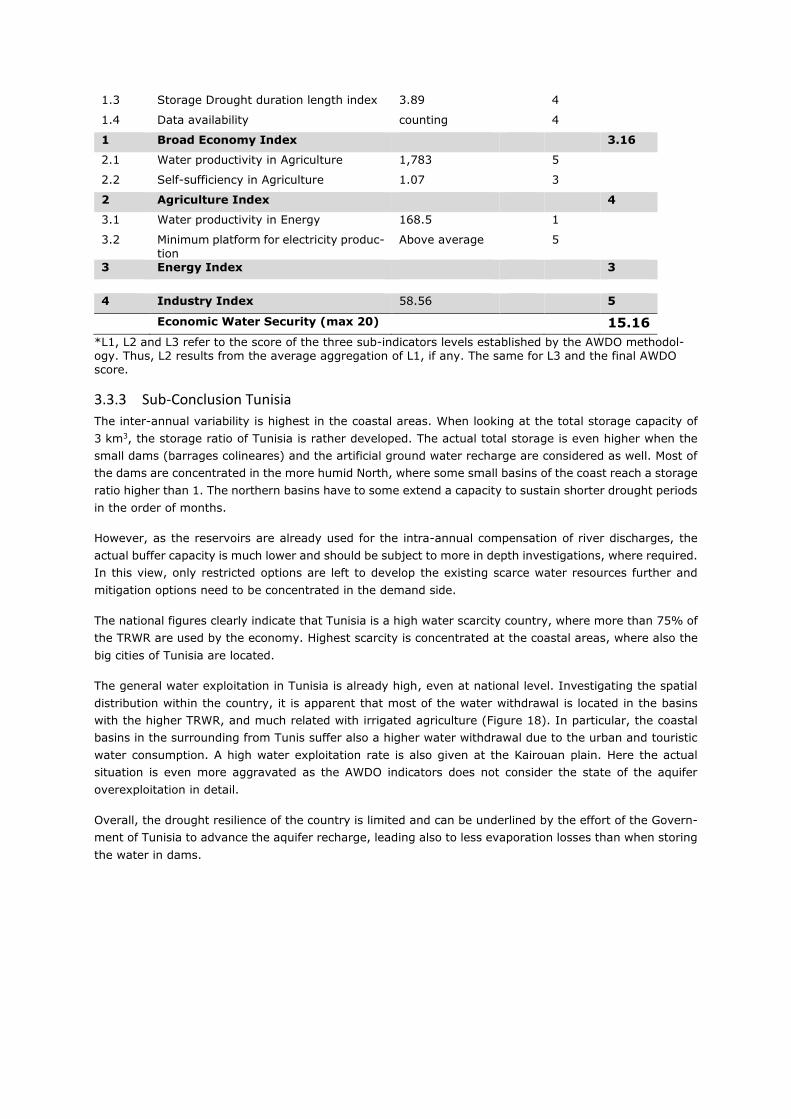
1.3 Storage Drought duration length index 3.89 4
1.4 Data availability counting 4
1 Broad Economy Index 3.16
2.1 Water productivity in Agriculture 1,783
5
2.2 Self-sufficiency in Agriculture 1.07
3
2 Agriculture Index
4
3.1 Water productivity in Energy 168.5 1
3.2 Minimum platform for electricity produc-
tion
Above average 5
3 Energy Index 3
4 Industry Index 58.56
5
Economic Water Security (max 20) 15.16
*L1, L2 and L3 refer to the score of the three sub-indicators levels established by the AWDO methodol-ogy. Thus, L2 results from the average aggregation of L1, if any. The same for L3 and the final AWDO score.
3.3.3 Sub-Conclusion Tunisia
The inter-annual variability is highest in the coastal areas. When looking at the total storage capacity of
3 km3, the storage ratio of Tunisia is rather developed. The actual total storage is even higher when the
small dams (barrages colineares) and the artificial ground water recharge are considered as well. Most of
the dams are concentrated in the more humid North, where some small basins of the coast reach a storage
ratio higher than 1. The northern basins have to some extend a capacity to sustain shorter drought periods
in the order of months.
However, as the reservoirs are already used for the intra-annual compensation of river discharges, the
actual buffer capacity is much lower and should be subject to more in depth investigations, where required.
In this view, only restricted options are left to develop the existing scarce water resources further and
mitigation options need to be concentrated in the demand side.
The national figures clearly indicate that Tunisia is a high water scarcity country, where more than 75% of
the TRWR are used by the economy. Highest scarcity is concentrated at the coastal areas, where also the
big cities of Tunisia are located.
The general water exploitation in Tunisia is already high, even at national level. Investigating the spatial
distribution within the country, it is apparent that most of the water withdrawal is located in the basins
with the higher TRWR, and much related with irrigated agriculture (Figure 18). In particular, the coastal
basins in the surrounding from Tunis suffer also a higher water withdrawal due to the urban and touristic
water consumption. A high water exploitation rate is also given at the Kairouan plain. Here the actual
situation is even more aggravated as the AWDO indicators does not consider the state of the aquifer
overexploitation in detail.
Overall, the drought resilience of the country is limited and can be underlined by the effort of the Govern-
ment of Tunisia to advance the aquifer recharge, leading also to less evaporation losses than when storing
the water in dams.
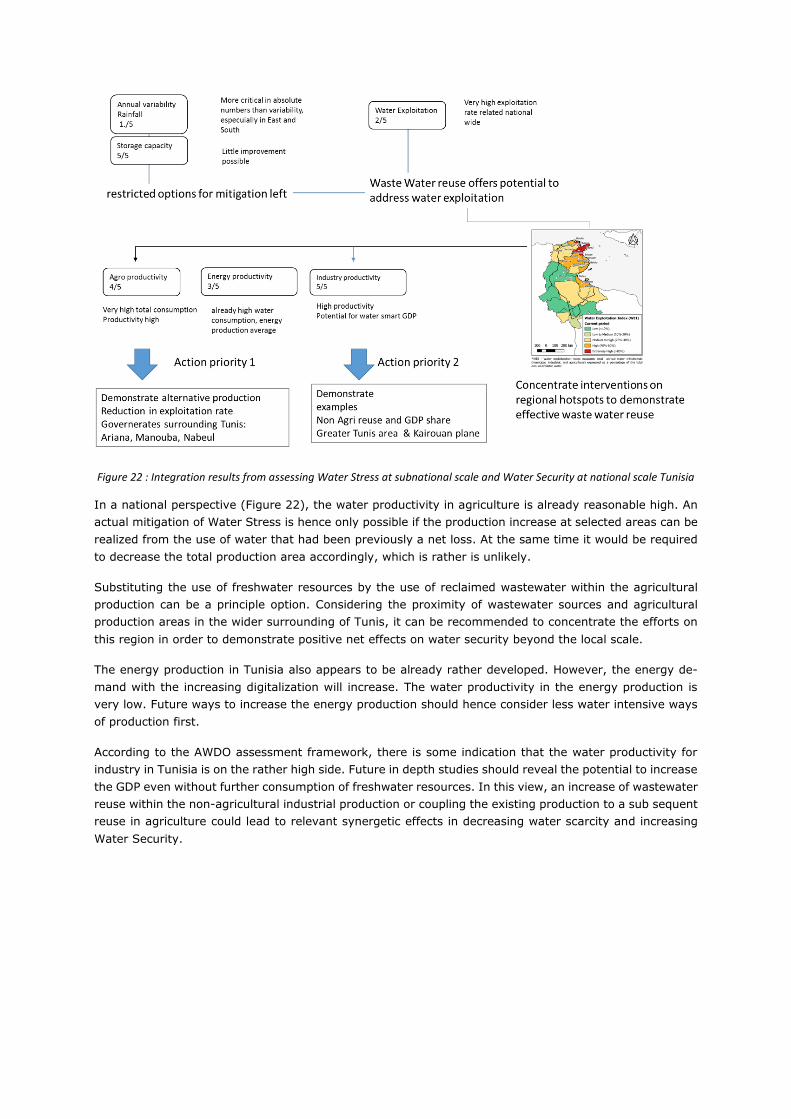
Figure 22 : Integration results from assessing Water Stress at subnational scale and Water Security at national scale Tunisia
In a national perspective (Figure 22), the water productivity in agriculture is already reasonable high. An
actual mitigation of Water Stress is hence only possible if the production increase at selected areas can be
realized from the use of water that had been previously a net loss. At the same time it would be required
to decrease the total production area accordingly, which is rather is unlikely.
Substituting the use of freshwater resources by the use of reclaimed wastewater within the agricultural
production can be a principle option. Considering the proximity of wastewater sources and agricultural
production areas in the wider surrounding of Tunis, it can be recommended to concentrate the efforts on
this region in order to demonstrate positive net effects on water security beyond the local scale.
The energy production in Tunisia also appears to be already rather developed. However, the energy de-
mand with the increasing digitalization will increase. The water productivity in the energy production is
very low. Future ways to increase the energy production should hence consider less water intensive ways
of production first.
According to the AWDO assessment framework, there is some indication that the water productivity for
industry in Tunisia is on the rather high side. Future in depth studies should reveal the potential to increase
the GDP even without further consumption of freshwater resources. In this view, an increase of wastewater
reuse within the non-agricultural industrial production or coupling the existing production to a sub sequent
reuse in agriculture could lead to relevant synergetic effects in decreasing water scarcity and increasing
Water Security.
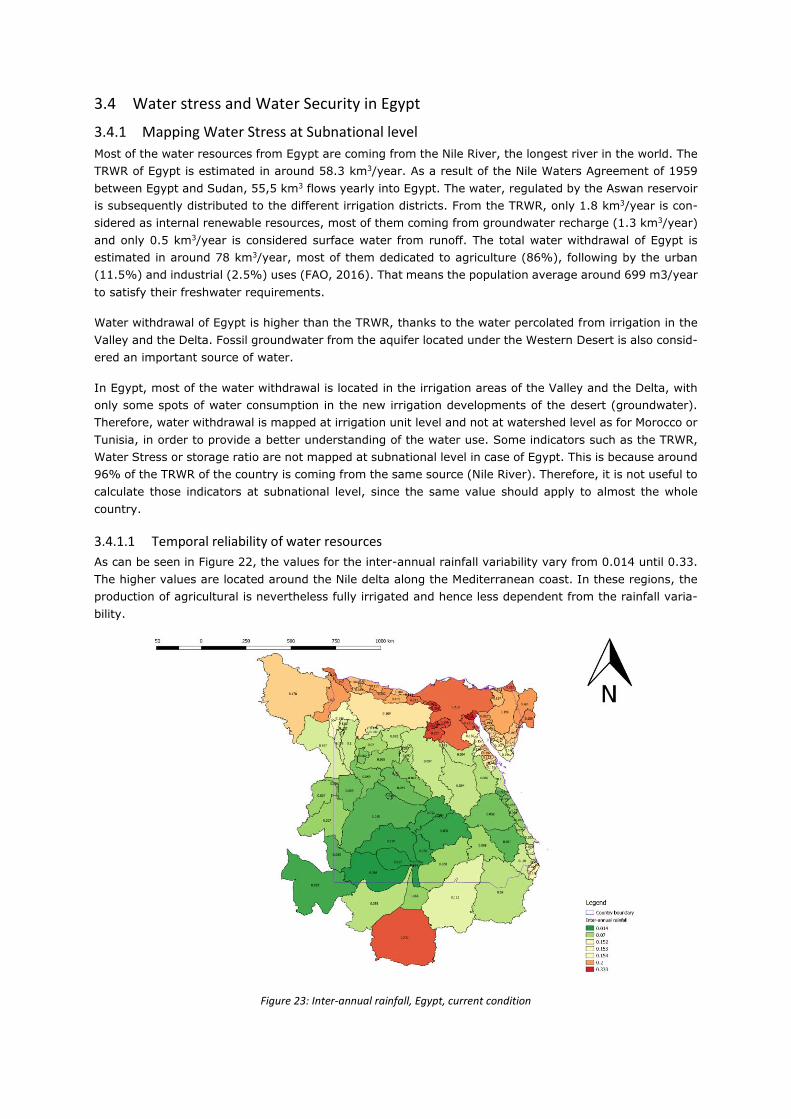
3.4 Water stress and Water Security in Egypt
3.4.1 Mapping Water Stress at Subnational level
Most of the water resources from Egypt are coming from the Nile River, the longest river in the world. The
TRWR of Egypt is estimated in around 58.3 km3/year. As a result of the Nile Waters Agreement of 1959
between Egypt and Sudan, 55,5 km3 flows yearly into Egypt. The water, regulated by the Aswan reservoir
is subsequently distributed to the different irrigation districts. From the TRWR, only 1.8 km3/year is con-
sidered as internal renewable resources, most of them coming from groundwater recharge (1.3 km3/year)
and only 0.5 km3/year is considered surface water from runoff. The total water withdrawal of Egypt is
estimated in around 78 km3/year, most of them dedicated to agriculture (86%), following by the urban
(11.5%) and industrial (2.5%) uses (FAO, 2016). That means the population average around 699 m3/year
to satisfy their freshwater requirements.
Water withdrawal of Egypt is higher than the TRWR, thanks to the water percolated from irrigation in the
Valley and the Delta. Fossil groundwater from the aquifer located under the Western Desert is also consid-
ered an important source of water.
In Egypt, most of the water withdrawal is located in the irrigation areas of the Valley and the Delta, with
only some spots of water consumption in the new irrigation developments of the desert (groundwater).
Therefore, water withdrawal is mapped at irrigation unit level and not at watershed level as for Morocco or
Tunisia, in order to provide a better understanding of the water use. Some indicators such as the TRWR,
Water Stress or storage ratio are not mapped at subnational level in case of Egypt. This is because around
96% of the TRWR of the country is coming from the same source (Nile River). Therefore, it is not useful to
calculate those indicators at subnational level, since the same value should apply to almost the whole
country.
3.4.1.1 Temporal reliability of water resources
As can be seen in Figure 22, the values for the inter-annual rainfall variability vary from 0.014 until 0.33.
The higher values are located around the Nile delta along the Mediterranean coast. In these regions, the
production of agricultural is nevertheless fully irrigated and hence less dependent from the rainfall varia-
bility.
Figure 23: Inter-annual rainfall, Egypt, current condition
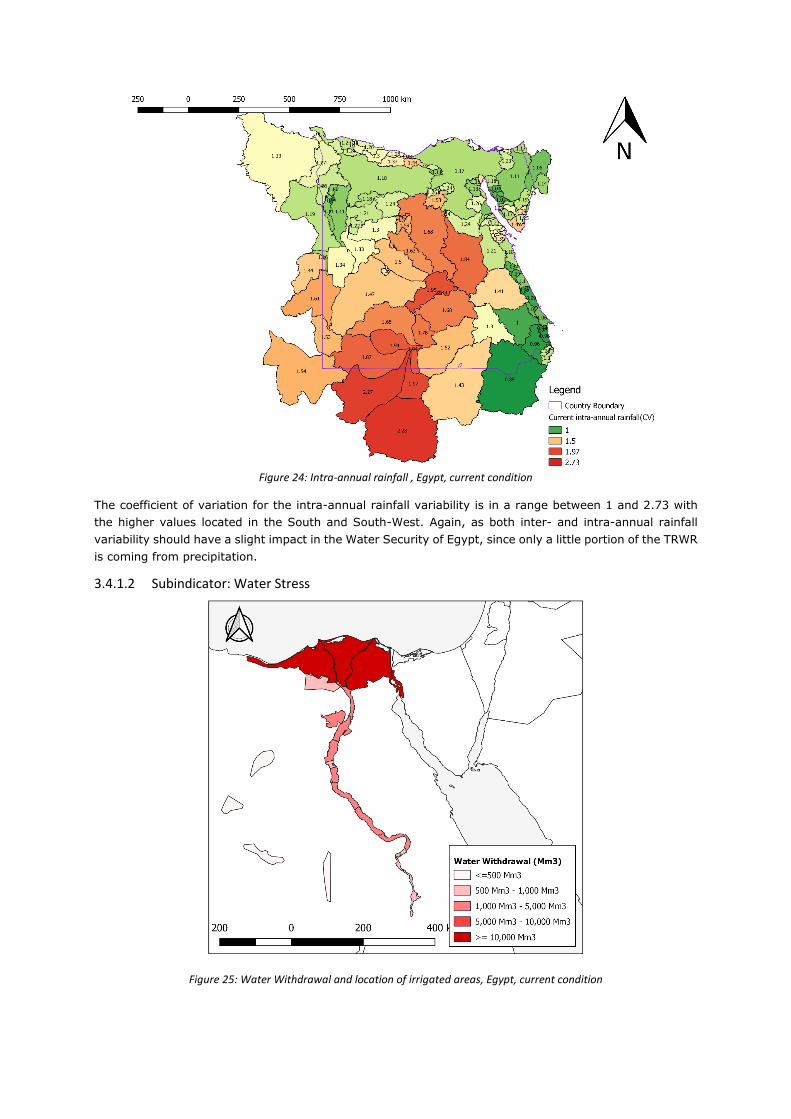
Figure 24: Intra-annual rainfall , Egypt, current condition
The coefficient of variation for the intra-annual rainfall variability is in a range between 1 and 2.73 with
the higher values located in the South and South-West. Again, as both inter- and intra-annual rainfall
variability should have a slight impact in the Water Security of Egypt, since only a little portion of the TRWR
is coming from precipitation.
3.4.1.2 Subindicator: Water Stress
Figure 25: Water Withdrawal and location of irrigated areas, Egypt, current condition
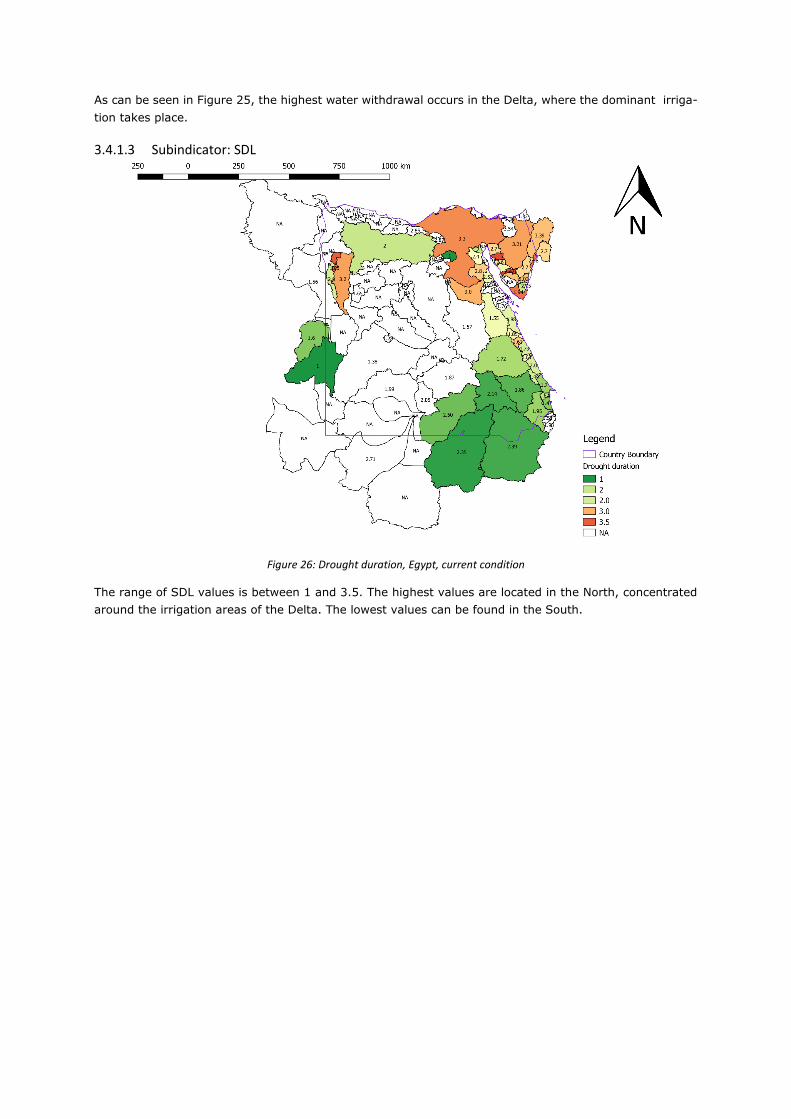
As can be seen in Figure 25, the highest water withdrawal occurs in the Delta, where the dominant irriga-
tion takes place.
3.4.1.3 Subindicator: SDL
Figure 26: Drought duration, Egypt, current condition
The range of SDL values is between 1 and 3.5. The highest values are located in the North, concentrated
around the irrigation areas of the Delta. The lowest values can be found in the South.
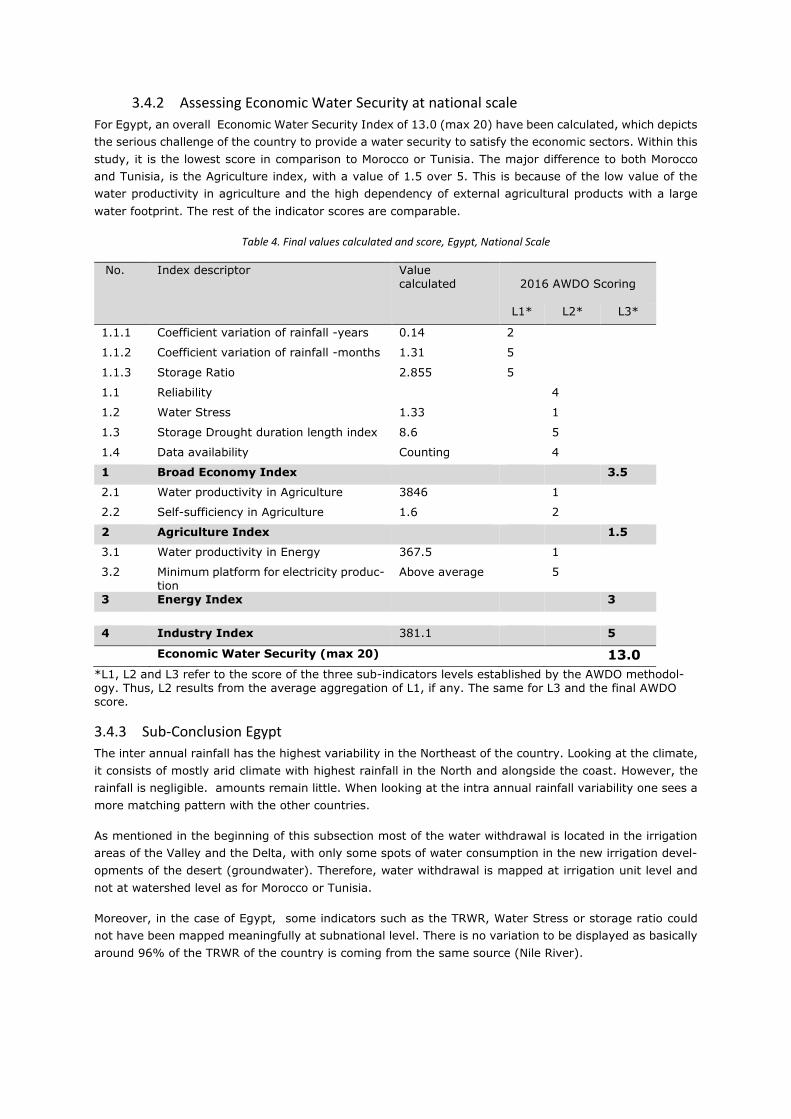
3.4.2 Assessing Economic Water Security at national scale
For Egypt, an overall Economic Water Security Index of 13.0 (max 20) have been calculated, which depicts
the serious challenge of the country to provide a water security to satisfy the economic sectors. Within this
study, it is the lowest score in comparison to Morocco or Tunisia. The major difference to both Morocco
and Tunisia, is the Agriculture index, with a value of 1.5 over 5. This is because of the low value of the
water productivity in agriculture and the high dependency of external agricultural products with a large
water footprint. The rest of the indicator scores are comparable.
Table 4. Final values calculated and score, Egypt, National Scale
No. Index descriptor Value calculated
2016 AWDO Scoring
L1* L2* L3*
1.1.1 Coefficient variation of rainfall -years 0.14 2
1.1.2 Coefficient variation of rainfall -months 1.31 5
1.1.3 Storage Ratio 2.855 5
1.1 Reliability 4
1.2 Water Stress 1.33 1
1.3 Storage Drought duration length index 8.6 5
1.4 Data availability Counting 4
1 Broad Economy Index 3.5
2.1 Water productivity in Agriculture 3846 1
2.2 Self-sufficiency in Agriculture 1.6 2
2 Agriculture Index
1.5
3.1 Water productivity in Energy 367.5
1
3.2 Minimum platform for electricity produc-tion
Above average 5
3 Energy Index 3
4 Industry Index 381.1
5
Economic Water Security (max 20) 13.0
*L1, L2 and L3 refer to the score of the three sub-indicators levels established by the AWDO methodol-ogy. Thus, L2 results from the average aggregation of L1, if any. The same for L3 and the final AWDO score.
3.4.3 Sub-Conclusion Egypt
The inter annual rainfall has the highest variability in the Northeast of the country. Looking at the climate,
it consists of mostly arid climate with highest rainfall in the North and alongside the coast. However, the
rainfall is negligible. amounts remain little. When looking at the intra annual rainfall variability one sees a
more matching pattern with the other countries.
As mentioned in the beginning of this subsection most of the water withdrawal is located in the irrigation
areas of the Valley and the Delta, with only some spots of water consumption in the new irrigation devel-
opments of the desert (groundwater). Therefore, water withdrawal is mapped at irrigation unit level and
not at watershed level as for Morocco or Tunisia.
Moreover, in the case of Egypt, some indicators such as the TRWR, Water Stress or storage ratio could
not have been mapped meaningfully at subnational level. There is no variation to be displayed as basically
around 96% of the TRWR of the country is coming from the same source (Nile River).
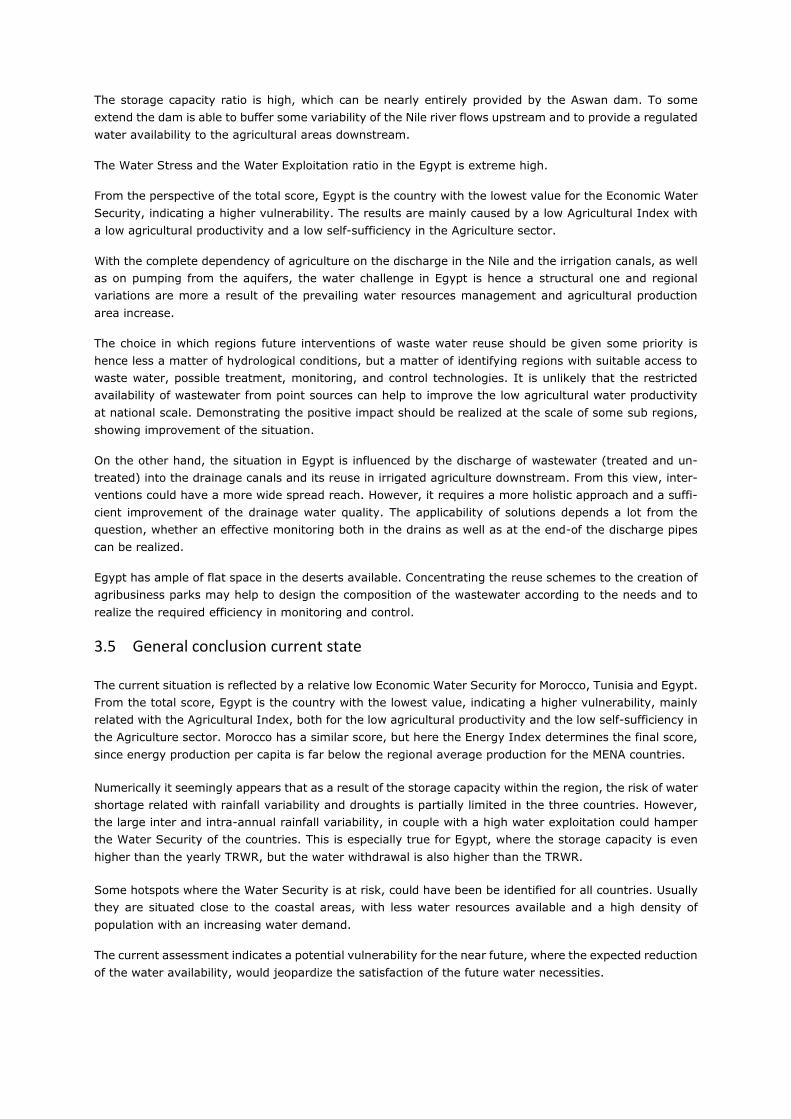
The storage capacity ratio is high, which can be nearly entirely provided by the Aswan dam. To some
extend the dam is able to buffer some variability of the Nile river flows upstream and to provide a regulated
water availability to the agricultural areas downstream.
The Water Stress and the Water Exploitation ratio in the Egypt is extreme high.
From the perspective of the total score, Egypt is the country with the lowest value for the Economic Water
Security, indicating a higher vulnerability. The results are mainly caused by a low Agricultural Index with
a low agricultural productivity and a low self-sufficiency in the Agriculture sector.
With the complete dependency of agriculture on the discharge in the Nile and the irrigation canals, as well
as on pumping from the aquifers, the water challenge in Egypt is hence a structural one and regional
variations are more a result of the prevailing water resources management and agricultural production
area increase.
The choice in which regions future interventions of waste water reuse should be given some priority is
hence less a matter of hydrological conditions, but a matter of identifying regions with suitable access to
waste water, possible treatment, monitoring, and control technologies. It is unlikely that the restricted
availability of wastewater from point sources can help to improve the low agricultural water productivity
at national scale. Demonstrating the positive impact should be realized at the scale of some sub regions,
showing improvement of the situation.
On the other hand, the situation in Egypt is influenced by the discharge of wastewater (treated and un-
treated) into the drainage canals and its reuse in irrigated agriculture downstream. From this view, inter-
ventions could have a more wide spread reach. However, it requires a more holistic approach and a suffi-
cient improvement of the drainage water quality. The applicability of solutions depends a lot from the
question, whether an effective monitoring both in the drains as well as at the end-of the discharge pipes
can be realized.
Egypt has ample of flat space in the deserts available. Concentrating the reuse schemes to the creation of
agribusiness parks may help to design the composition of the wastewater according to the needs and to
realize the required efficiency in monitoring and control.
3.5 General conclusion current state
The current situation is reflected by a relative low Economic Water Security for Morocco, Tunisia and Egypt.
From the total score, Egypt is the country with the lowest value, indicating a higher vulnerability, mainly
related with the Agricultural Index, both for the low agricultural productivity and the low self-sufficiency in
the Agriculture sector. Morocco has a similar score, but here the Energy Index determines the final score,
since energy production per capita is far below the regional average production for the MENA countries.
Numerically it seemingly appears that as a result of the storage capacity within the region, the risk of water
shortage related with rainfall variability and droughts is partially limited in the three countries. However,
the large inter and intra-annual rainfall variability, in couple with a high water exploitation could hamper
the Water Security of the countries. This is especially true for Egypt, where the storage capacity is even
higher than the yearly TRWR, but the water withdrawal is also higher than the TRWR.
Some hotspots where the Water Security is at risk, could have been be identified for all countries. Usually
they are situated close to the coastal areas, with less water resources available and a high density of
population with an increasing water demand.
The current assessment indicates a potential vulnerability for the near future, where the expected reduction
of the water availability, would jeopardize the satisfaction of the future water necessities.

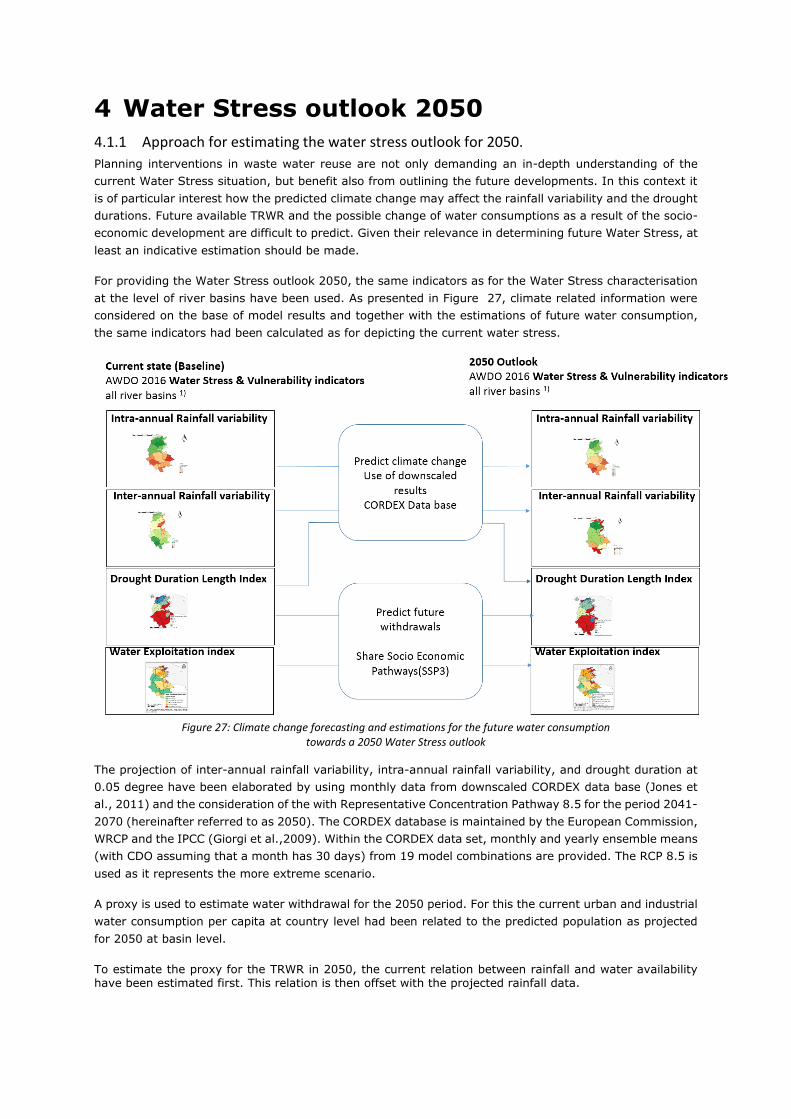
4 Water Stress outlook 2050
4.1.1 Approach for estimating the water stress outlook for 2050.
Planning interventions in waste water reuse are not only demanding an in-depth understanding of the
current Water Stress situation, but benefit also from outlining the future developments. In this context it
is of particular interest how the predicted climate change may affect the rainfall variability and the drought
durations. Future available TRWR and the possible change of water consumptions as a result of the socio-
economic development are difficult to predict. Given their relevance in determining future Water Stress, at
least an indicative estimation should be made.
For providing the Water Stress outlook 2050, the same indicators as for the Water Stress characterisation
at the level of river basins have been used. As presented in Figure 27, climate related information were
considered on the base of model results and together with the estimations of future water consumption,
the same indicators had been calculated as for depicting the current water stress.
Figure 27: Climate change forecasting and estimations for the future water consumption
towards a 2050 Water Stress outlook
The projection of inter-annual rainfall variability, intra-annual rainfall variability, and drought duration at
0.05 degree have been elaborated by using monthly data from downscaled CORDEX data base (Jones et
al., 2011) and the consideration of the with Representative Concentration Pathway 8.5 for the period 2041-
2070 (hereinafter referred to as 2050). The CORDEX database is maintained by the European Commission,
WRCP and the IPCC (Giorgi et al.,2009). Within the CORDEX data set, monthly and yearly ensemble means
(with CDO assuming that a month has 30 days) from 19 model combinations are provided. The RCP 8.5 is
used as it represents the more extreme scenario.
A proxy is used to estimate water withdrawal for the 2050 period. For this the current urban and industrial
water consumption per capita at country level had been related to the predicted population as projected
for 2050 at basin level.
To estimate the proxy for the TRWR in 2050, the current relation between rainfall and water availability have been estimated first. This relation is then offset with the projected rainfall data.

Information for growth population is extracted from the spatially explicit global population database devel-
oped by (Jones and O’Neill, 2016). Here, predictions on the population growth for the five Shared Socio-
economic Pathways are basically available (SSP1 to SSP5). For the further calculation the most extreme
scenario in terms of population growth, SSP3, have been considered.
As justified in section 3 there are less maps reconstructed for Egypt as for the other countries. As for the
current situation, Water Stress for 2050 of Egypt is not mapped at subnational level, since the value of
TRWR is reported only at national level.
In contrary to the calculation for Morocco and Tunisia, not all indicators could have been calculated at
subnational scale for Egypt. Water Stress for 2050 of Egypt is only indicated at national level, since the
TRWR were also only calculated at national level.
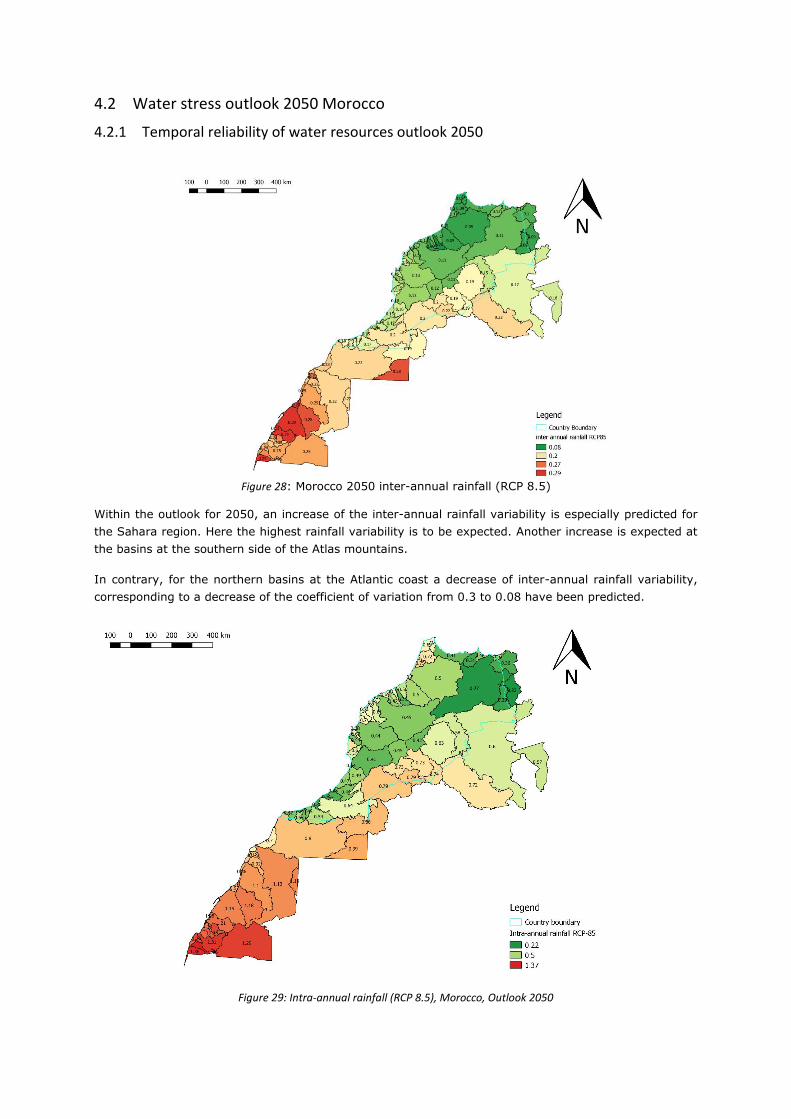
4.2 Water stress outlook 2050 Morocco
4.2.1 Temporal reliability of water resources outlook 2050
Figure 28: Morocco 2050 inter-annual rainfall (RCP 8.5)
Within the outlook for 2050, an increase of the inter-annual rainfall variability is especially predicted for
the Sahara region. Here the highest rainfall variability is to be expected. Another increase is expected at
the basins at the southern side of the Atlas mountains.
In contrary, for the northern basins at the Atlantic coast a decrease of inter-annual rainfall variability,
corresponding to a decrease of the coefficient of variation from 0.3 to 0.08 have been predicted.
Figure 29: Intra-annual rainfall (RCP 8.5), Morocco, Outlook 2050
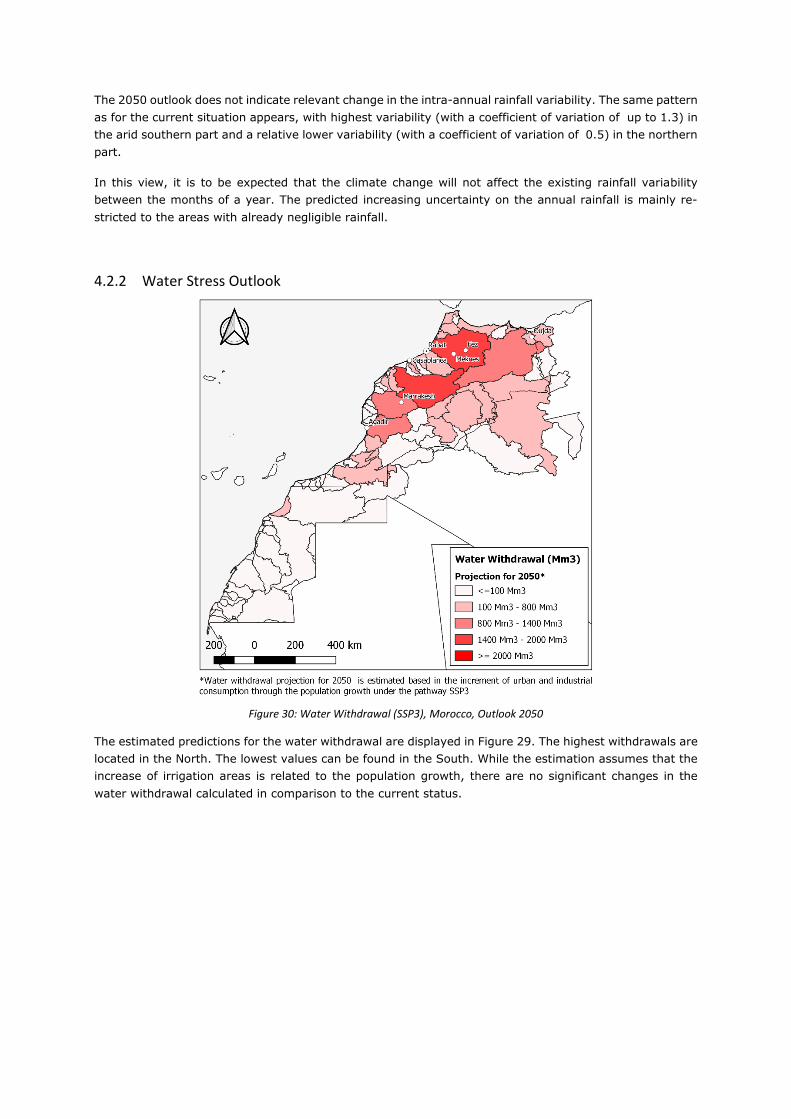
The 2050 outlook does not indicate relevant change in the intra-annual rainfall variability. The same pattern
as for the current situation appears, with highest variability (with a coefficient of variation of up to 1.3) in
the arid southern part and a relative lower variability (with a coefficient of variation of 0.5) in the northern
part.
In this view, it is to be expected that the climate change will not affect the existing rainfall variability
between the months of a year. The predicted increasing uncertainty on the annual rainfall is mainly re-
stricted to the areas with already negligible rainfall.
4.2.2 Water Stress Outlook
Figure 30: Water Withdrawal (SSP3), Morocco, Outlook 2050
The estimated predictions for the water withdrawal are displayed in Figure 29. The highest withdrawals are
located in the North. The lowest values can be found in the South. While the estimation assumes that the
increase of irrigation areas is related to the population growth, there are no significant changes in the
water withdrawal calculated in comparison to the current status.
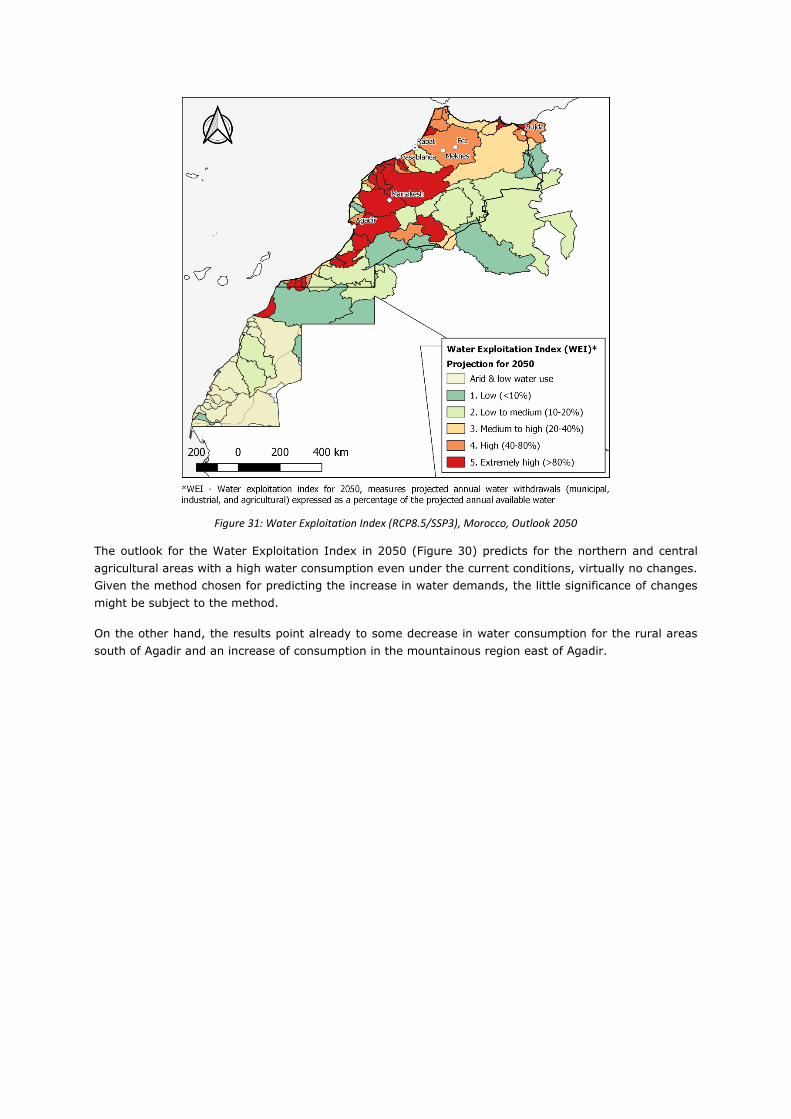
Figure 31: Water Exploitation Index (RCP8.5/SSP3), Morocco, Outlook 2050
The outlook for the Water Exploitation Index in 2050 (Figure 30) predicts for the northern and central
agricultural areas with a high water consumption even under the current conditions, virtually no changes.
Given the method chosen for predicting the increase in water demands, the little significance of changes
might be subject to the method.
On the other hand, the results point already to some decrease in water consumption for the rural areas
south of Agadir and an increase of consumption in the mountainous region east of Agadir.
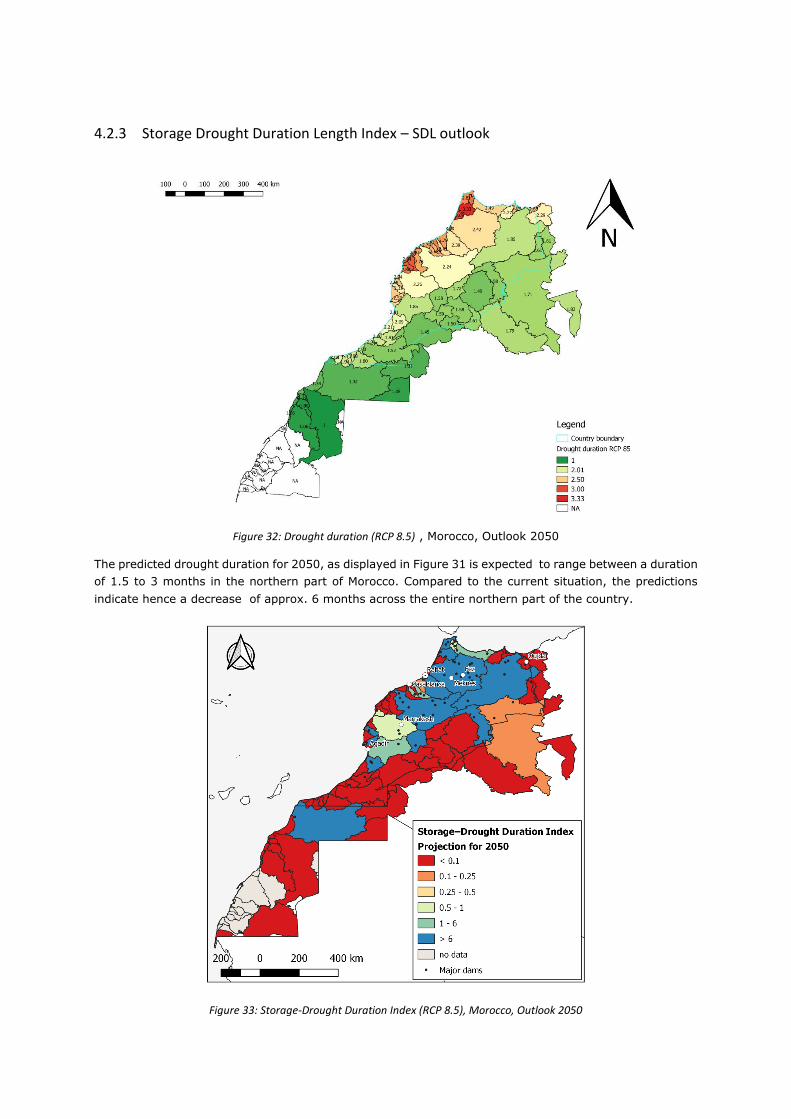
4.2.3 Storage Drought Duration Length Index – SDL outlook
Figure 32: Drought duration (RCP 8.5) , Morocco, Outlook 2050
The predicted drought duration for 2050, as displayed in Figure 31 is expected to range between a duration
of 1.5 to 3 months in the northern part of Morocco. Compared to the current situation, the predictions
indicate hence a decrease of approx. 6 months across the entire northern part of the country.
Figure 33: Storage-Drought Duration Index (RCP 8.5), Morocco, Outlook 2050
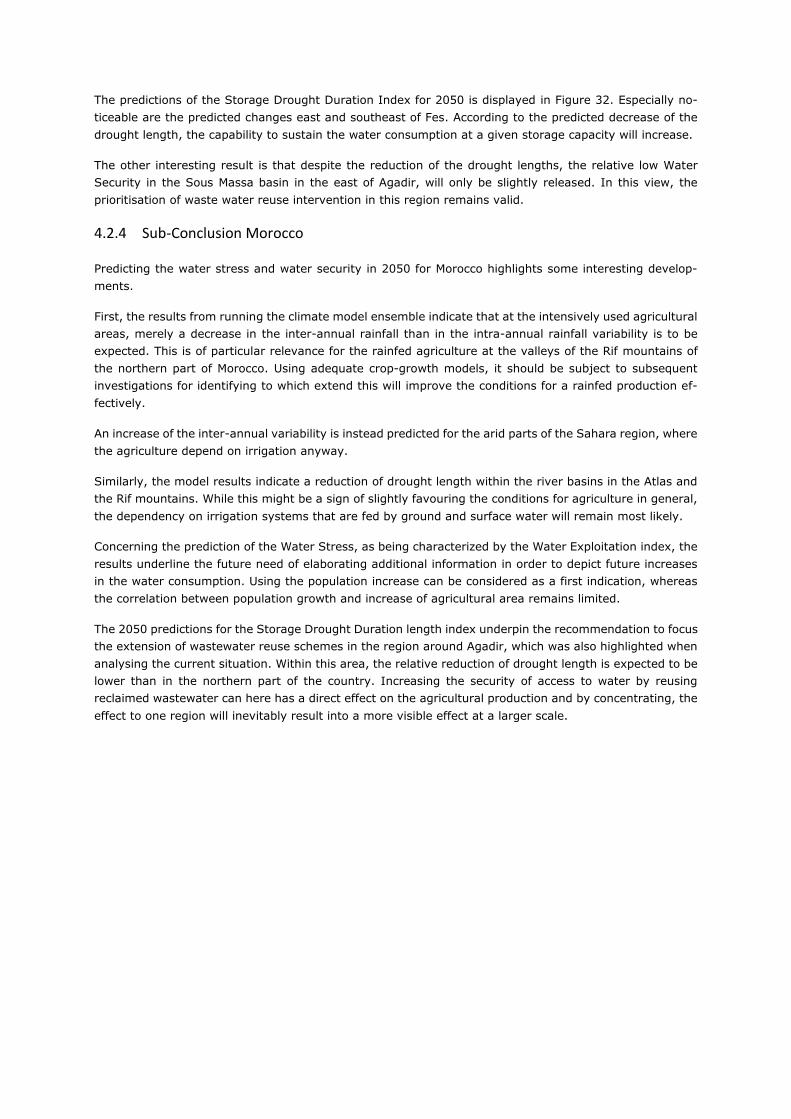
The predictions of the Storage Drought Duration Index for 2050 is displayed in Figure 32. Especially no-
ticeable are the predicted changes east and southeast of Fes. According to the predicted decrease of the
drought length, the capability to sustain the water consumption at a given storage capacity will increase.
The other interesting result is that despite the reduction of the drought lengths, the relative low Water
Security in the Sous Massa basin in the east of Agadir, will only be slightly released. In this view, the
prioritisation of waste water reuse intervention in this region remains valid.
4.2.4 Sub-Conclusion Morocco
Predicting the water stress and water security in 2050 for Morocco highlights some interesting develop-
ments.
First, the results from running the climate model ensemble indicate that at the intensively used agricultural
areas, merely a decrease in the inter-annual rainfall than in the intra-annual rainfall variability is to be
expected. This is of particular relevance for the rainfed agriculture at the valleys of the Rif mountains of
the northern part of Morocco. Using adequate crop-growth models, it should be subject to subsequent
investigations for identifying to which extend this will improve the conditions for a rainfed production ef-
fectively.
An increase of the inter-annual variability is instead predicted for the arid parts of the Sahara region, where
the agriculture depend on irrigation anyway.
Similarly, the model results indicate a reduction of drought length within the river basins in the Atlas and
the Rif mountains. While this might be a sign of slightly favouring the conditions for agriculture in general,
the dependency on irrigation systems that are fed by ground and surface water will remain most likely.
Concerning the prediction of the Water Stress, as being characterized by the Water Exploitation index, the
results underline the future need of elaborating additional information in order to depict future increases
in the water consumption. Using the population increase can be considered as a first indication, whereas
the correlation between population growth and increase of agricultural area remains limited.
The 2050 predictions for the Storage Drought Duration length index underpin the recommendation to focus
the extension of wastewater reuse schemes in the region around Agadir, which was also highlighted when
analysing the current situation. Within this area, the relative reduction of drought length is expected to be
lower than in the northern part of the country. Increasing the security of access to water by reusing
reclaimed wastewater can here has a direct effect on the agricultural production and by concentrating, the
effect to one region will inevitably result into a more visible effect at a larger scale.
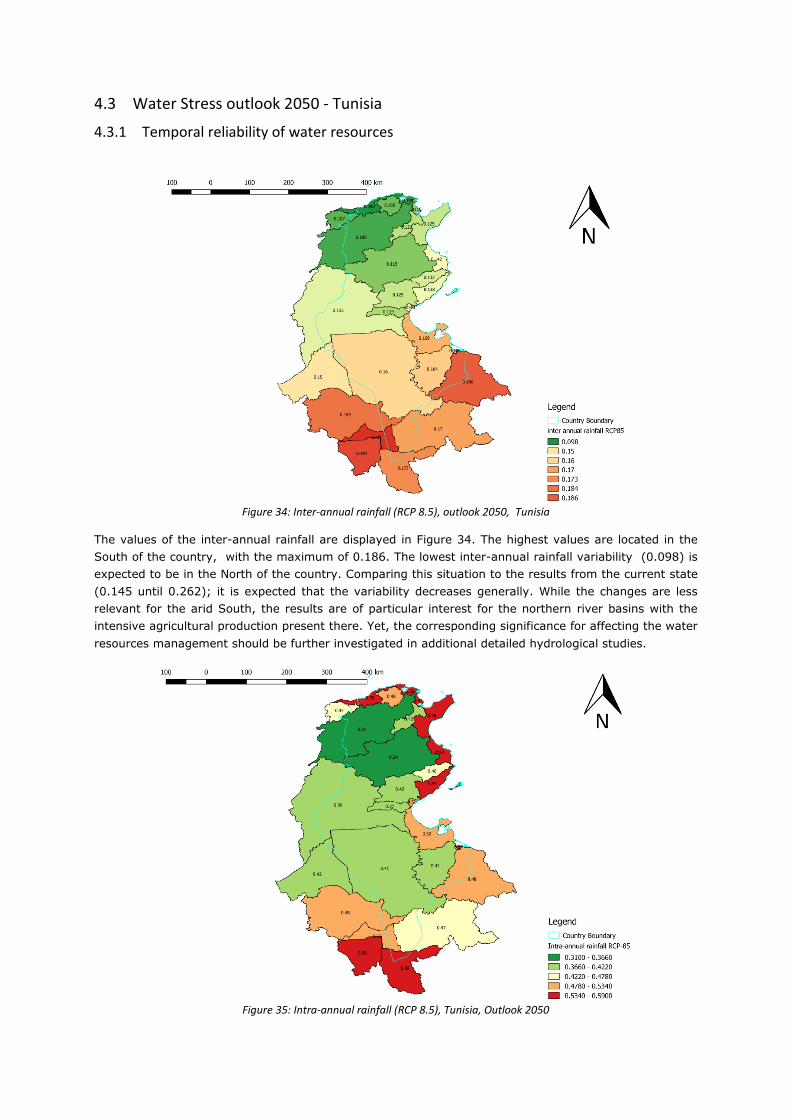
4.3 Water Stress outlook 2050 - Tunisia
4.3.1 Temporal reliability of water resources
Figure 34: Inter-annual rainfall (RCP 8.5), outlook 2050, Tunisia
The values of the inter-annual rainfall are displayed in Figure 34. The highest values are located in the
South of the country, with the maximum of 0.186. The lowest inter-annual rainfall variability (0.098) is
expected to be in the North of the country. Comparing this situation to the results from the current state
(0.145 until 0.262); it is expected that the variability decreases generally. While the changes are less
relevant for the arid South, the results are of particular interest for the northern river basins with the
intensive agricultural production present there. Yet, the corresponding significance for affecting the water
resources management should be further investigated in additional detailed hydrological studies.
Figure 35: Intra-annual rainfall (RCP 8.5), Tunisia, Outlook 2050
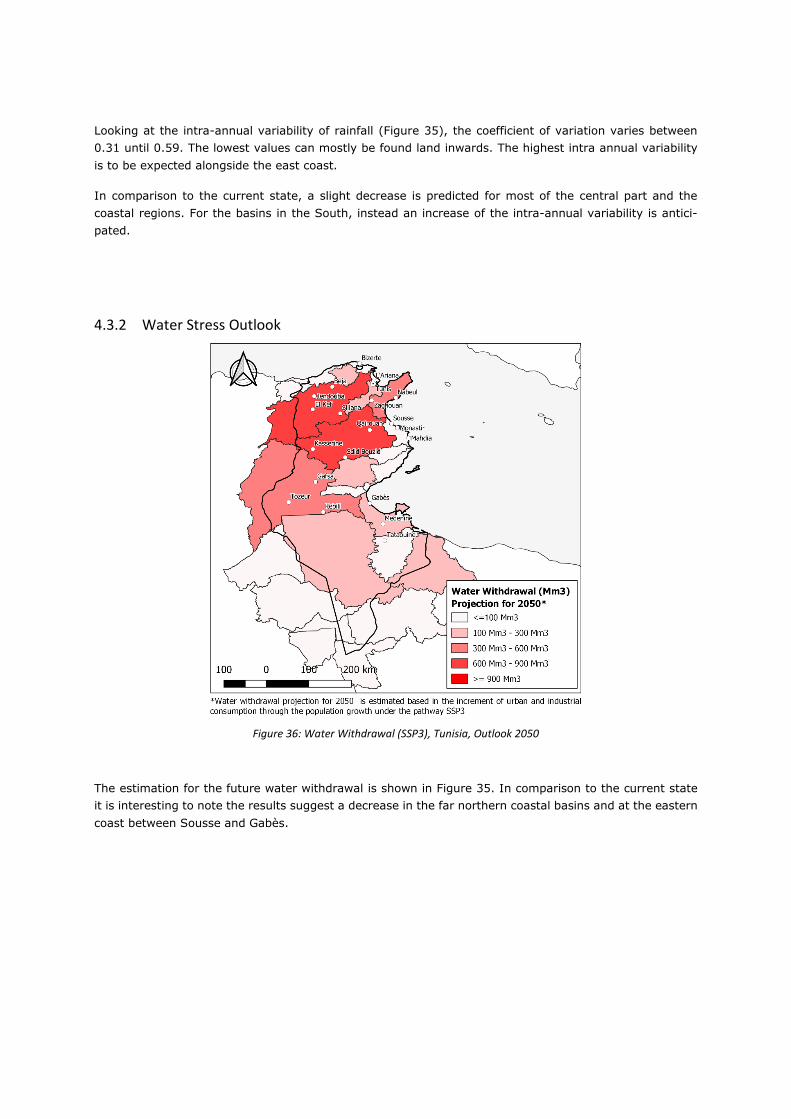
Looking at the intra-annual variability of rainfall (Figure 35), the coefficient of variation varies between
0.31 until 0.59. The lowest values can mostly be found land inwards. The highest intra annual variability
is to be expected alongside the east coast.
In comparison to the current state, a slight decrease is predicted for most of the central part and the
coastal regions. For the basins in the South, instead an increase of the intra-annual variability is antici-
pated.
4.3.2 Water Stress Outlook
Figure 36: Water Withdrawal (SSP3), Tunisia, Outlook 2050
The estimation for the future water withdrawal is shown in Figure 35. In comparison to the current state
it is interesting to note the results suggest a decrease in the far northern coastal basins and at the eastern
coast between Sousse and Gabès.
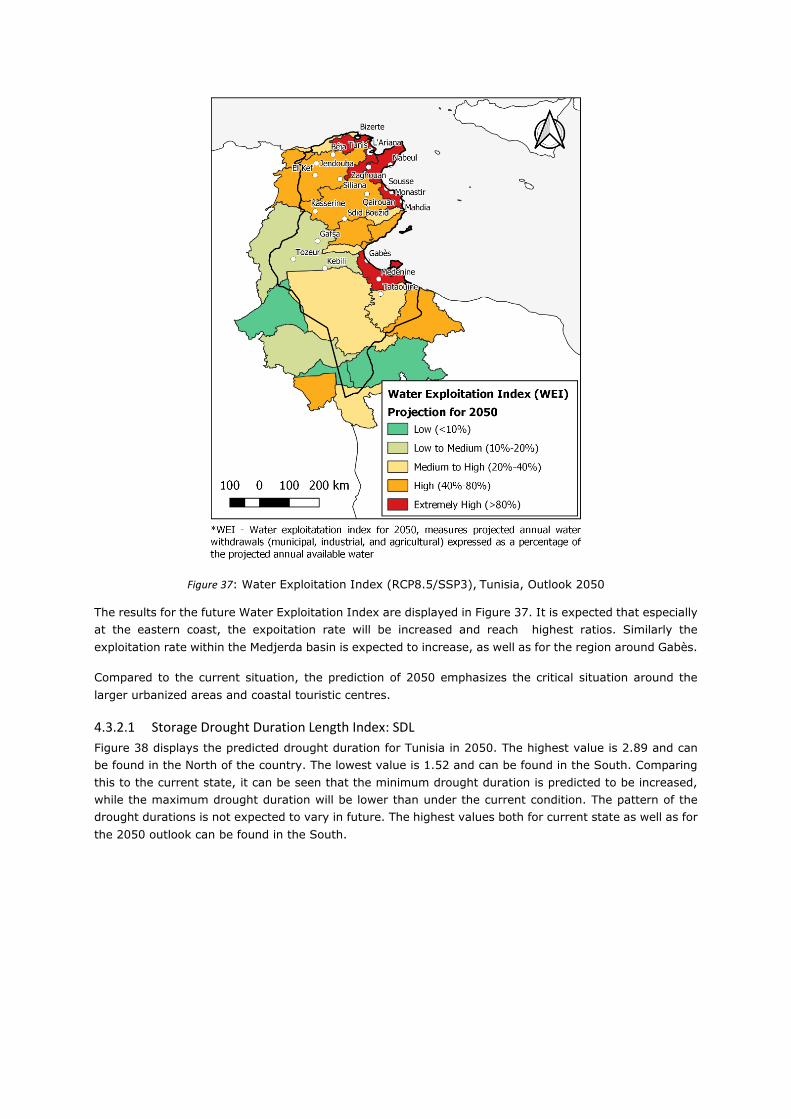
Figure 37: Water Exploitation Index (RCP8.5/SSP3), Tunisia, Outlook 2050
The results for the future Water Exploitation Index are displayed in Figure 37. It is expected that especially
at the eastern coast, the expoitation rate will be increased and reach highest ratios. Similarly the
exploitation rate within the Medjerda basin is expected to increase, as well as for the region around Gabès.
Compared to the current situation, the prediction of 2050 emphasizes the critical situation around the
larger urbanized areas and coastal touristic centres.
4.3.2.1 Storage Drought Duration Length Index: SDL
Figure 38 displays the predicted drought duration for Tunisia in 2050. The highest value is 2.89 and can
be found in the North of the country. The lowest value is 1.52 and can be found in the South. Comparing
this to the current state, it can be seen that the minimum drought duration is predicted to be increased,
while the maximum drought duration will be lower than under the current condition. The pattern of the
drought durations is not expected to vary in future. The highest values both for current state as well as for
the 2050 outlook can be found in the South.
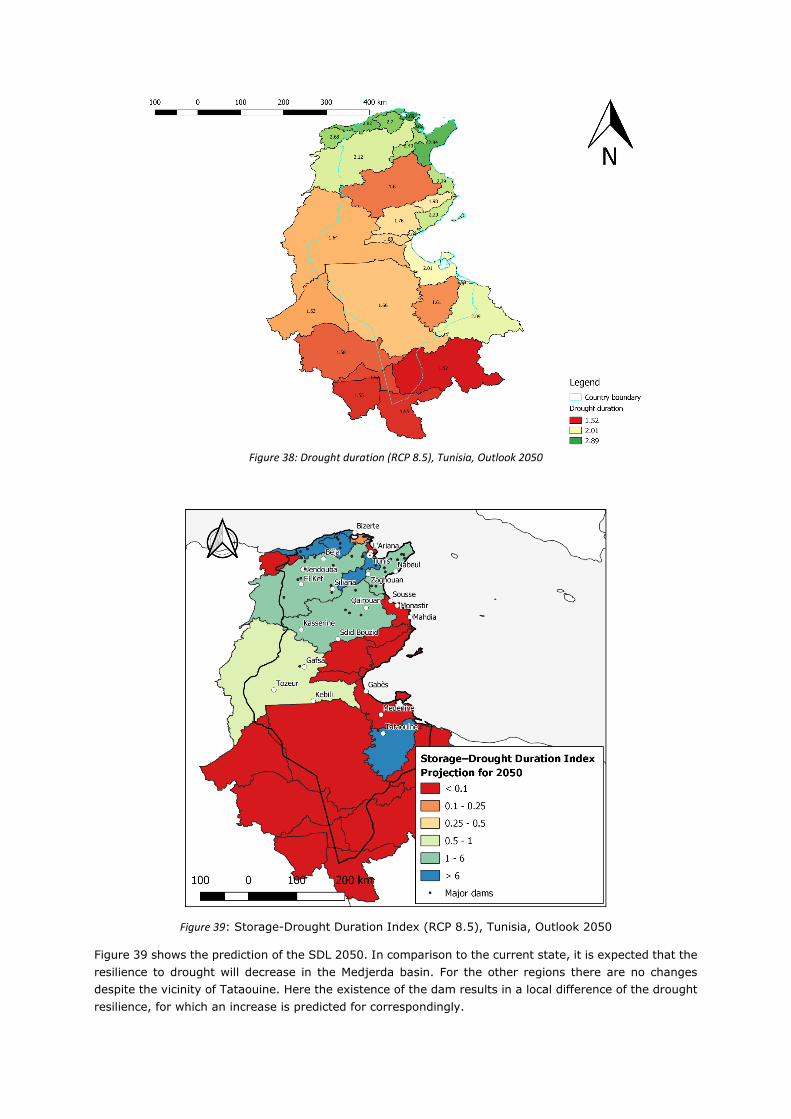
Figure 38: Drought duration (RCP 8.5), Tunisia, Outlook 2050
Figure 39: Storage-Drought Duration Index (RCP 8.5), Tunisia, Outlook 2050
Figure 39 shows the prediction of the SDL 2050. In comparison to the current state, it is expected that the
resilience to drought will decrease in the Medjerda basin. For the other regions there are no changes
despite the vicinity of Tataouine. Here the existence of the dam results in a local difference of the drought
resilience, for which an increase is predicted for correspondingly.
4.3.3 Sub-Conclusion Tunisia
The inter-annual rainfall variability is expected to decrease until 2050, with ranges of the coefficient of
variation between the 0.098 and 0.186. However, whether this decrease is of significance for the water
resources management or not, remains to be further investigated in detail. The prediction for the intra-
annual variability of rainfall indicates also a decrease, though it is expected that due to the low absolute
rainfall, these changes will be of limited effect for the practiced irrigated agriculture.
The estimations for the future water stress, expressed by the Water Exploitation index, indicate clearly an
increase at the East-coast. While basing the predictions on assuming a correlation between the population
growth and the increase of water consumption, it is more important to consider principle trends than
referring to the absolute numbers.
Predictions for the Storage –Drought Duration Length index in 2050 show mainly for the Medjerda basin
some decrease of the drought vulnerability. Here, the absolute numbers are also affected by the non-
consideration of reservoir capacity losses and storage levels at the onset of a drought period. Results
should be merely considered to depict a relative trend.
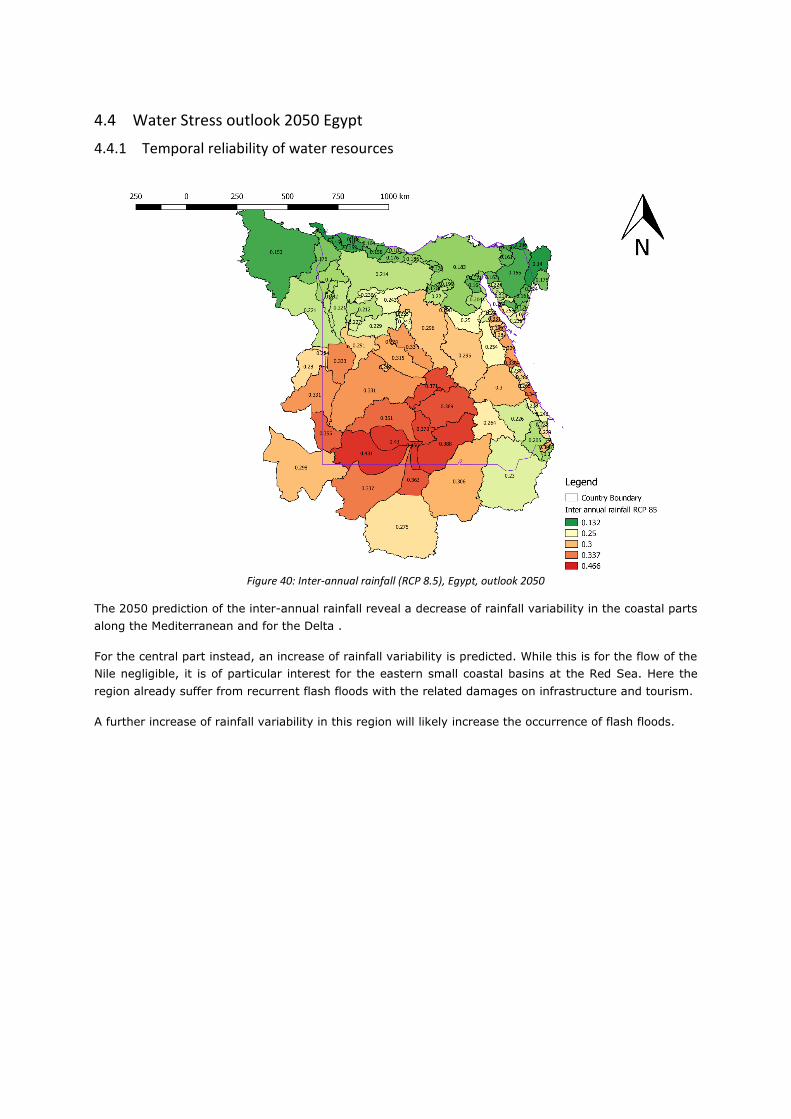
4.4 Water Stress outlook 2050 Egypt
4.4.1 Temporal reliability of water resources
Figure 40: Inter-annual rainfall (RCP 8.5), Egypt, outlook 2050
The 2050 prediction of the inter-annual rainfall reveal a decrease of rainfall variability in the coastal parts
along the Mediterranean and for the Delta .
For the central part instead, an increase of rainfall variability is predicted. While this is for the flow of the
Nile negligible, it is of particular interest for the eastern small coastal basins at the Red Sea. Here the
region already suffer from recurrent flash floods with the related damages on infrastructure and tourism.
A further increase of rainfall variability in this region will likely increase the occurrence of flash floods.
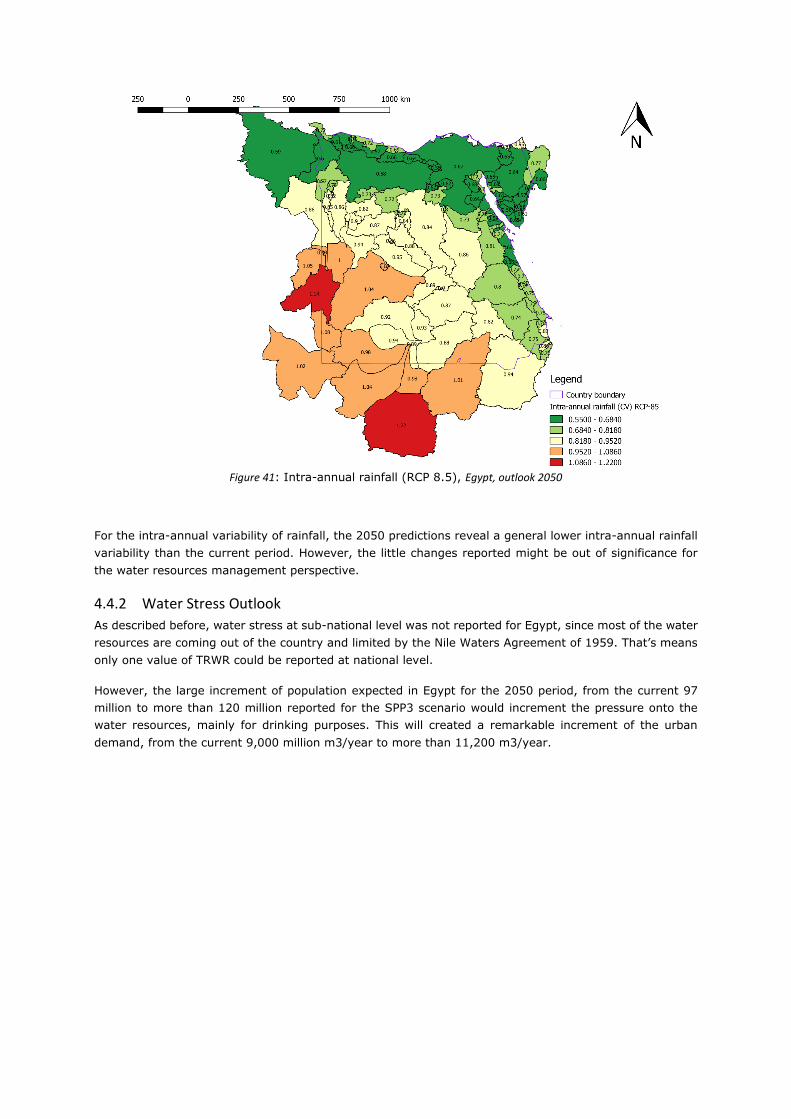
Figure 41: Intra-annual rainfall (RCP 8.5), Egypt, outlook 2050
For the intra-annual variability of rainfall, the 2050 predictions reveal a general lower intra-annual rainfall
variability than the current period. However, the little changes reported might be out of significance for
the water resources management perspective.
4.4.2 Water Stress Outlook
As described before, water stress at sub-national level was not reported for Egypt, since most of the water
resources are coming out of the country and limited by the Nile Waters Agreement of 1959. That’s means
only one value of TRWR could be reported at national level.
However, the large increment of population expected in Egypt for the 2050 period, from the current 97
million to more than 120 million reported for the SPP3 scenario would increment the pressure onto the
water resources, mainly for drinking purposes. This will created a remarkable increment of the urban
demand, from the current 9,000 million m3/year to more than 11,200 m3/year.
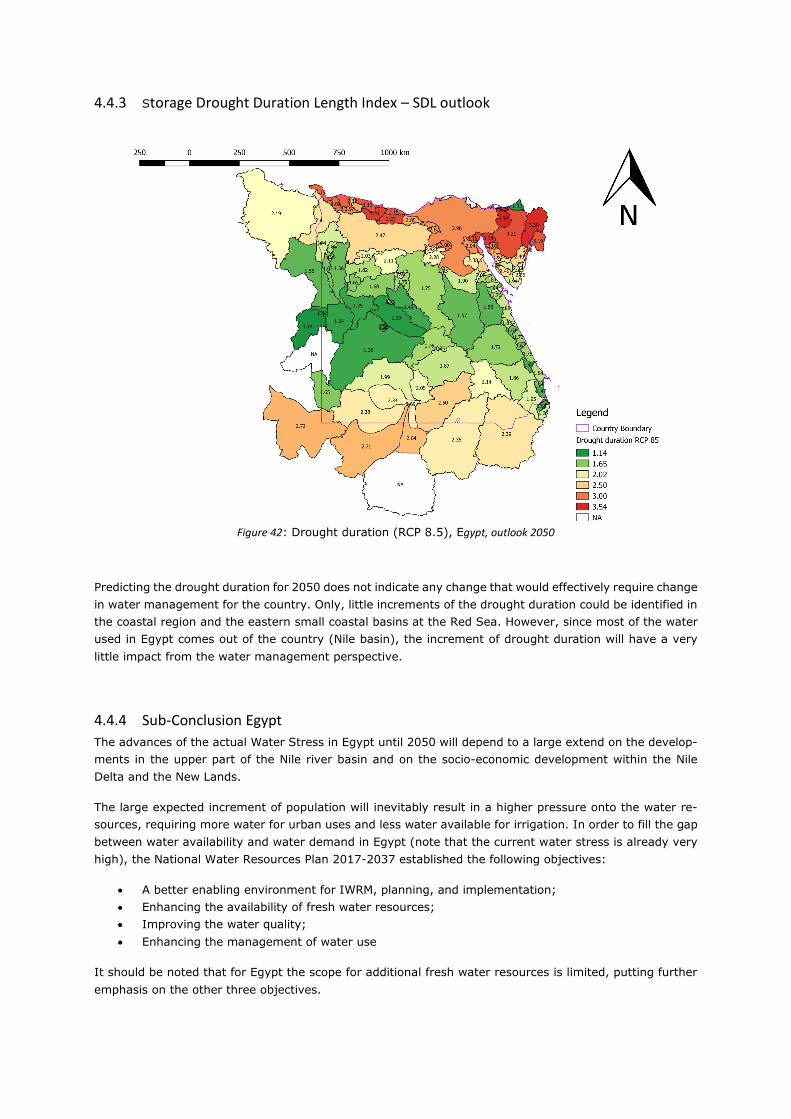
4.4.3 Storage Drought Duration Length Index – SDL outlook
Figure 42: Drought duration (RCP 8.5), Egypt, outlook 2050
Predicting the drought duration for 2050 does not indicate any change that would effectively require change
in water management for the country. Only, little increments of the drought duration could be identified in
the coastal region and the eastern small coastal basins at the Red Sea. However, since most of the water
used in Egypt comes out of the country (Nile basin), the increment of drought duration will have a very
little impact from the water management perspective.
4.4.4 Sub-Conclusion Egypt
The advances of the actual Water Stress in Egypt until 2050 will depend to a large extend on the develop-
ments in the upper part of the Nile river basin and on the socio-economic development within the Nile
Delta and the New Lands.
The large expected increment of population will inevitably result in a higher pressure onto the water re-
sources, requiring more water for urban uses and less water available for irrigation. In order to fill the gap
between water availability and water demand in Egypt (note that the current water stress is already very
high), the National Water Resources Plan 2017-2037 established the following objectives:
A better enabling environment for IWRM, planning, and implementation;
Enhancing the availability of fresh water resources;
Improving the water quality;
Enhancing the management of water use
It should be noted that for Egypt the scope for additional fresh water resources is limited, putting further
emphasis on the other three objectives.

Therefore, the expected increment on urban water requirement, accompanied by a higher (water related)
food demand should be addressed by improving the water efficiency in agriculture (more food per drop),
and by importation of food products Thanks to the technology, the increment of water availability from
other sources, including a remarkable increase of waste water reuse, should also alleviate the increased
water demand.
5 Waste Water Reuse potential 2050
5.1 Approach Mapping Waste Water reuse Potential A spatial differentiation of the wastewater reuse potential is of advantage to outline future areas. This
includes information on where additional effort should be concentrated to advance the wastewater reuse
and to transfer future findings of the MadForWater project. For that purpose, a set of maps to assess the
urban wastewater reuse potential for irrigation is developed for each country.
The potential of creating business with wastewater reuse in Agriculture depends largely on five factors:
- availability and access of waste water
- suitability of land for irrigated agriculture
- presence of entrepreneurs and capacity to take initiative
- logistics and transport options within the production value chain
- the wider political economy, enabling conditions and regulations.
When it comes to regulation and policy instruments, the enabling framework is more of a principle nature
and valid at the entire state. Other favouring conditions such as the availability of innovation partners, the
presence of business or technology clusters are more of a local nature.
In the presented approach, the issue of regulation barriers and availability of incentives is hence considered
to be uniform at national level and have not been included in the mapping.
The identification of innovation clusters and other favourable conditions at local scale would require a
detailed in situ stakeholder and infrastructure mapping. This currently cannot be done with the necessary
intensity at the entire area of all three Mediterranean African countries. The same applies for the consid-
eration of local available transport infrastructure. Instead, the proposed approach assumes that both the
business and transport infrastructure is principally favoured within urbanized areas. In this view, the as-
pects of logistics and sufficient entrepreneurial capacities can be indirectly described by the population
density.
The mapping of already existing irrigation areas identifies suitable land for wastewater reuse. This is based
on the understanding that in the Mediterranean African Countries, irrigated agriculture is already largely
developed. Moreover, there is little evidence that those other areas than the desert lands are remaining
for the extension of the agricultural activities. It is also assumed that the areas in northern Morocco and
Tunisia, which are currently under rainfed production, do not necessarily require irrigation.
The availability of domestic wastewater as a source is dependent on the population, and the way of col-
lecting wastewater. Wastewater from the Agro-Food Industry is also a high potential source. For simplicity,
the presented study however does not differentiate domestic and industrial wastewater in the estimation
of the potential availability, since in most of the cases, both effluents are discharged to the same point. It
is assumed that a high population density also represents areas of more intensive presence of the agro –
food industry and hence an availability of wastewater.
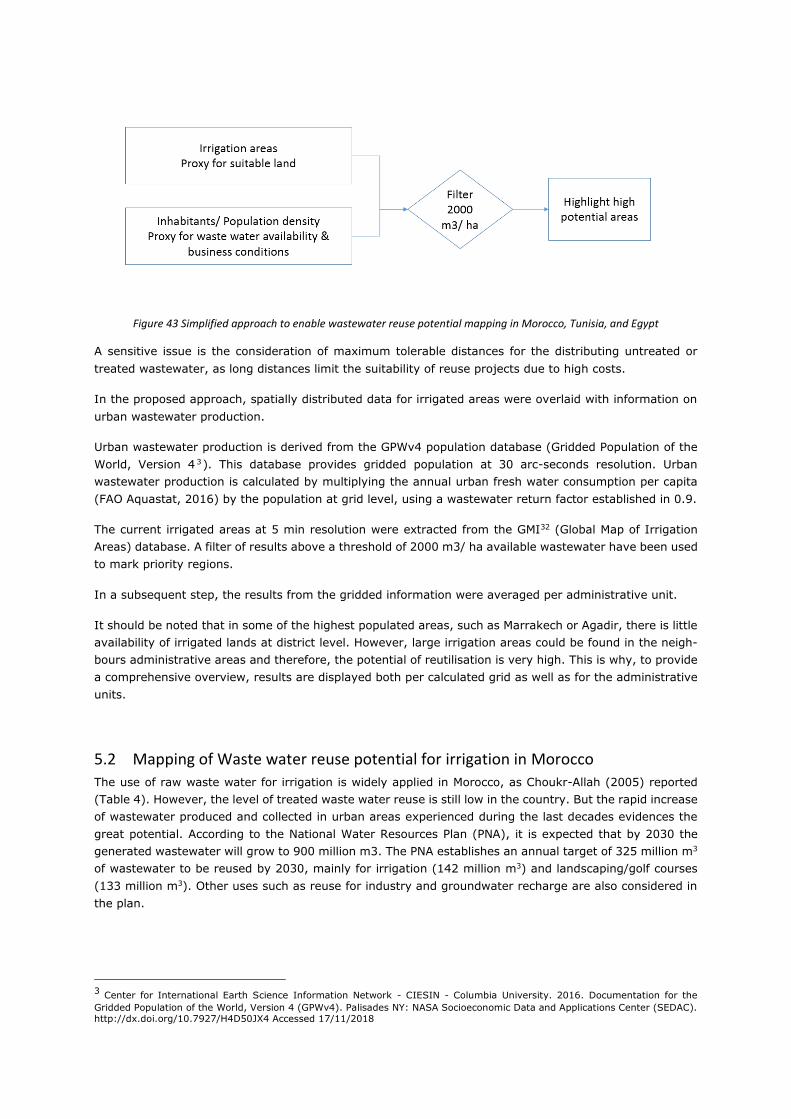
Figure 43 Simplified approach to enable wastewater reuse potential mapping in Morocco, Tunisia, and Egypt
A sensitive issue is the consideration of maximum tolerable distances for the distributing untreated or
treated wastewater, as long distances limit the suitability of reuse projects due to high costs.
In the proposed approach, spatially distributed data for irrigated areas were overlaid with information on
urban wastewater production.
Urban wastewater production is derived from the GPWv4 population database (Gridded Population of the
World, Version 4 3). This database provides gridded population at 30 arc-seconds resolution. Urban
wastewater production is calculated by multiplying the annual urban fresh water consumption per capita
(FAO Aquastat, 2016) by the population at grid level, using a wastewater return factor established in 0.9.
The current irrigated areas at 5 min resolution were extracted from the GMI32 (Global Map of Irrigation
Areas) database. A filter of results above a threshold of 2000 m3/ ha available wastewater have been used
to mark priority regions.
In a subsequent step, the results from the gridded information were averaged per administrative unit.
It should be noted that in some of the highest populated areas, such as Marrakech or Agadir, there is little
availability of irrigated lands at district level. However, large irrigation areas could be found in the neigh-
bours administrative areas and therefore, the potential of reutilisation is very high. This is why, to provide
a comprehensive overview, results are displayed both per calculated grid as well as for the administrative
units.
5.2 Mapping of Waste water reuse potential for irrigation in Morocco
The use of raw waste water for irrigation is widely applied in Morocco, as Choukr-Allah (2005) reported
(Table 4). However, the level of treated waste water reuse is still low in the country. But the rapid increase
of wastewater produced and collected in urban areas experienced during the last decades evidences the
great potential. According to the National Water Resources Plan (PNA), it is expected that by 2030 the
generated wastewater will grow to 900 million m3. The PNA establishes an annual target of 325 million m3
of wastewater to be reused by 2030, mainly for irrigation (142 million m3) and landscaping/golf courses
(133 million m3). Other uses such as reuse for industry and groundwater recharge are also considered in
the plan.
3 Center for International Earth Science Information Network - CIESIN - Columbia University. 2016. Documentation for the
Gridded Population of the World, Version 4 (GPWv4). Palisades NY: NASA Socioeconomic Data and Applications Center (SEDAC). http://dx.doi.org/10.7927/H4D50JX4 Accessed 17/11/2018
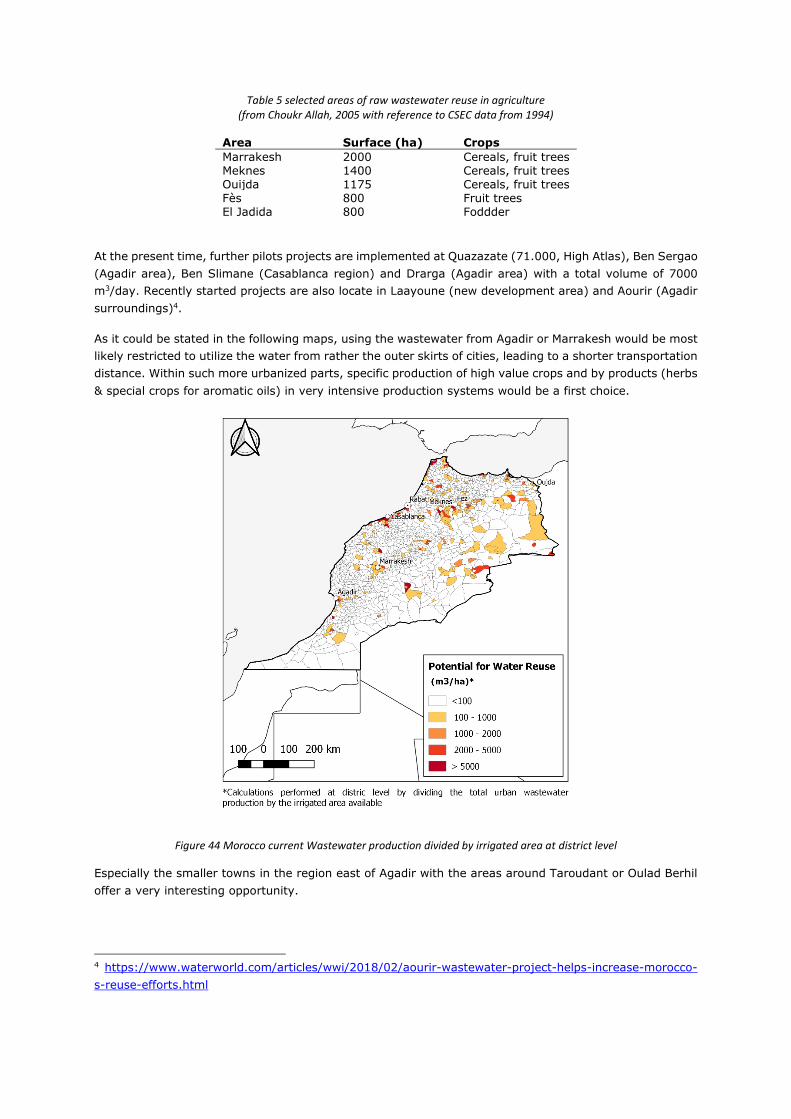
Table 5 selected areas of raw wastewater reuse in agriculture (from Choukr Allah, 2005 with reference to CSEC data from 1994)
Area Surface (ha) Crops
Marrakesh 2000 Cereals, fruit trees Meknes 1400 Cereals, fruit trees Ouijda 1175 Cereals, fruit trees Fès 800 Fruit trees El Jadida 800 Foddder
At the present time, further pilots projects are implemented at Quazazate (71.000, High Atlas), Ben Sergao
(Agadir area), Ben Slimane (Casablanca region) and Drarga (Agadir area) with a total volume of 7000
m3/day. Recently started projects are also locate in Laayoune (new development area) and Aourir (Agadir
surroundings)4.
As it could be stated in the following maps, using the wastewater from Agadir or Marrakesh would be most
likely restricted to utilize the water from rather the outer skirts of cities, leading to a shorter transportation
distance. Within such more urbanized parts, specific production of high value crops and by products (herbs
& special crops for aromatic oils) in very intensive production systems would be a first choice.
Figure 44 Morocco current Wastewater production divided by irrigated area at district level
Especially the smaller towns in the region east of Agadir with the areas around Taroudant or Oulad Berhil
offer a very interesting opportunity.
4 https://www.waterworld.com/articles/wwi/2018/02/aourir-wastewater-project-helps-increase-morocco-
s-reuse-efforts.html
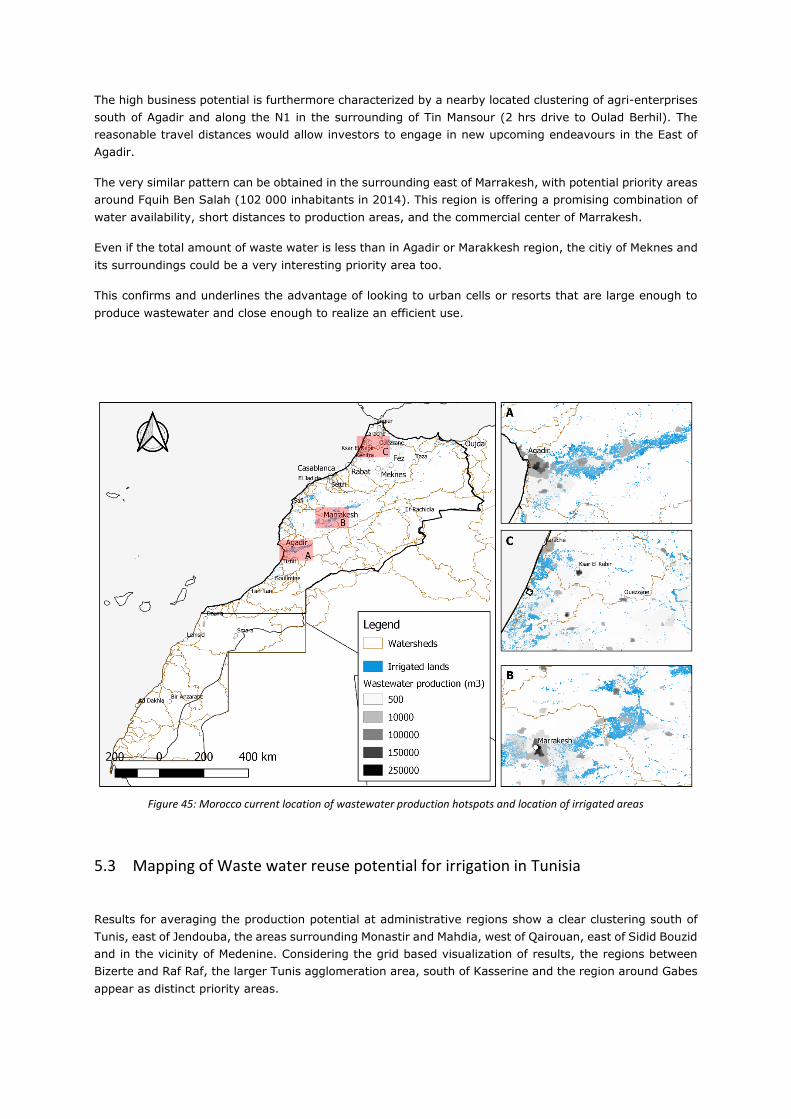
The high business potential is furthermore characterized by a nearby located clustering of agri-enterprises
south of Agadir and along the N1 in the surrounding of Tin Mansour (2 hrs drive to Oulad Berhil). The
reasonable travel distances would allow investors to engage in new upcoming endeavours in the East of
Agadir.
The very similar pattern can be obtained in the surrounding east of Marrakesh, with potential priority areas
around Fquih Ben Salah (102 000 inhabitants in 2014). This region is offering a promising combination of
water availability, short distances to production areas, and the commercial center of Marrakesh.
Even if the total amount of waste water is less than in Agadir or Marakkesh region, the citiy of Meknes and
its surroundings could be a very interesting priority area too.
This confirms and underlines the advantage of looking to urban cells or resorts that are large enough to
produce wastewater and close enough to realize an efficient use.
Figure 45: Morocco current location of wastewater production hotspots and location of irrigated areas
5.3 Mapping of Waste water reuse potential for irrigation in Tunisia
Results for averaging the production potential at administrative regions show a clear clustering south of
Tunis, east of Jendouba, the areas surrounding Monastir and Mahdia, west of Qairouan, east of Sidid Bouzid
and in the vicinity of Medenine. Considering the grid based visualization of results, the regions between
Bizerte and Raf Raf, the larger Tunis agglomeration area, south of Kasserine and the region around Gabes
appear as distinct priority areas.
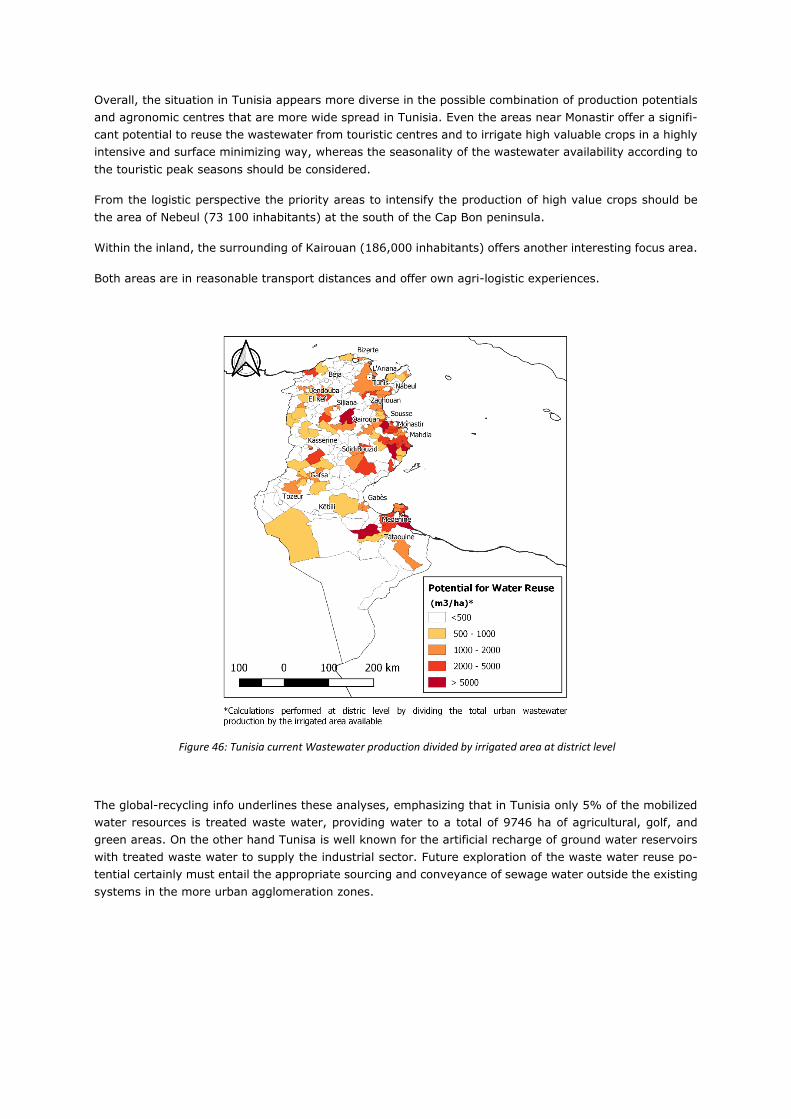
Overall, the situation in Tunisia appears more diverse in the possible combination of production potentials
and agronomic centres that are more wide spread in Tunisia. Even the areas near Monastir offer a signifi-
cant potential to reuse the wastewater from touristic centres and to irrigate high valuable crops in a highly
intensive and surface minimizing way, whereas the seasonality of the wastewater availability according to
the touristic peak seasons should be considered.
From the logistic perspective the priority areas to intensify the production of high value crops should be
the area of Nebeul (73 100 inhabitants) at the south of the Cap Bon peninsula.
Within the inland, the surrounding of Kairouan (186,000 inhabitants) offers another interesting focus area.
Both areas are in reasonable transport distances and offer own agri-logistic experiences.
Figure 46: Tunisia current Wastewater production divided by irrigated area at district level
The global-recycling info underlines these analyses, emphasizing that in Tunisia only 5% of the mobilized
water resources is treated waste water, providing water to a total of 9746 ha of agricultural, golf, and
green areas. On the other hand Tunisa is well known for the artificial recharge of ground water reservoirs
with treated waste water to supply the industrial sector. Future exploration of the waste water reuse po-
tential certainly must entail the appropriate sourcing and conveyance of sewage water outside the existing
systems in the more urban agglomeration zones.
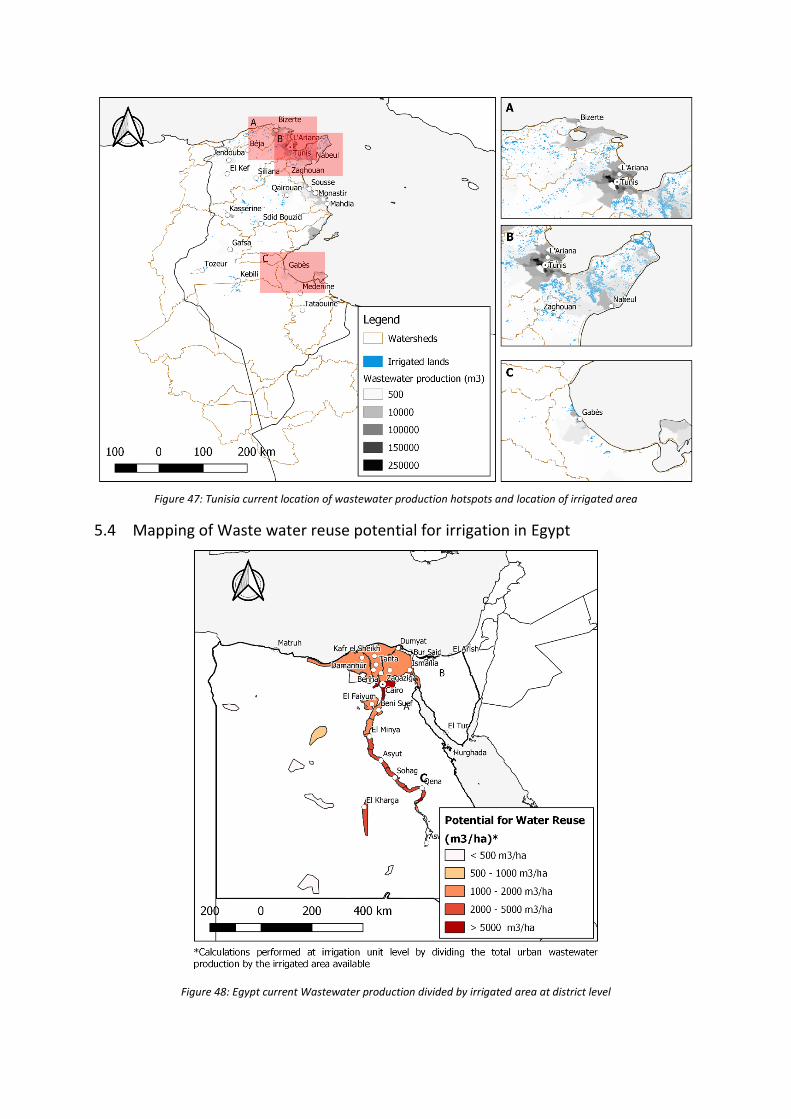
Figure 47: Tunisia current location of wastewater production hotspots and location of irrigated area
5.4 Mapping of Waste water reuse potential for irrigation in Egypt
Figure 48: Egypt current Wastewater production divided by irrigated area at district level
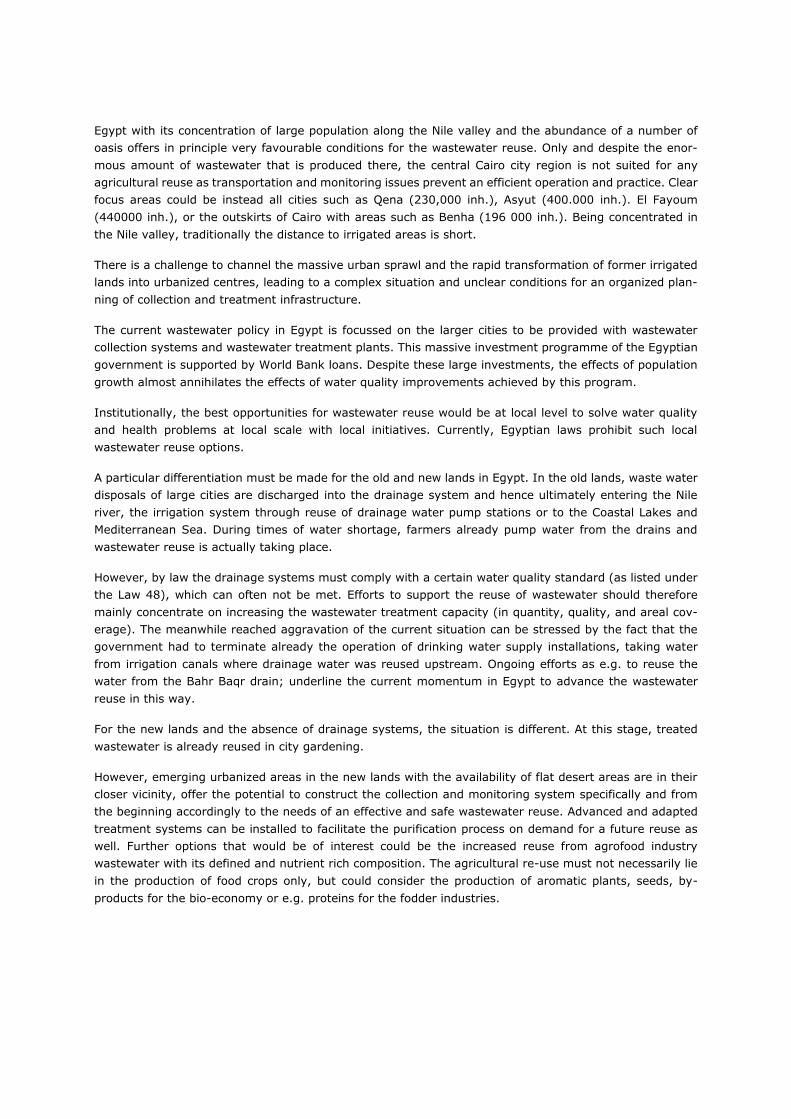
Egypt with its concentration of large population along the Nile valley and the abundance of a number of
oasis offers in principle very favourable conditions for the wastewater reuse. Only and despite the enor-
mous amount of wastewater that is produced there, the central Cairo city region is not suited for any
agricultural reuse as transportation and monitoring issues prevent an efficient operation and practice. Clear
focus areas could be instead all cities such as Qena (230,000 inh.), Asyut (400.000 inh.). El Fayoum
(440000 inh.), or the outskirts of Cairo with areas such as Benha (196 000 inh.). Being concentrated in
the Nile valley, traditionally the distance to irrigated areas is short.
There is a challenge to channel the massive urban sprawl and the rapid transformation of former irrigated
lands into urbanized centres, leading to a complex situation and unclear conditions for an organized plan-
ning of collection and treatment infrastructure.
The current wastewater policy in Egypt is focussed on the larger cities to be provided with wastewater
collection systems and wastewater treatment plants. This massive investment programme of the Egyptian
government is supported by World Bank loans. Despite these large investments, the effects of population
growth almost annihilates the effects of water quality improvements achieved by this program.
Institutionally, the best opportunities for wastewater reuse would be at local level to solve water quality
and health problems at local scale with local initiatives. Currently, Egyptian laws prohibit such local
wastewater reuse options.
A particular differentiation must be made for the old and new lands in Egypt. In the old lands, waste water
disposals of large cities are discharged into the drainage system and hence ultimately entering the Nile
river, the irrigation system through reuse of drainage water pump stations or to the Coastal Lakes and
Mediterranean Sea. During times of water shortage, farmers already pump water from the drains and
wastewater reuse is actually taking place.
However, by law the drainage systems must comply with a certain water quality standard (as listed under
the Law 48), which can often not be met. Efforts to support the reuse of wastewater should therefore
mainly concentrate on increasing the wastewater treatment capacity (in quantity, quality, and areal cov-
erage). The meanwhile reached aggravation of the current situation can be stressed by the fact that the
government had to terminate already the operation of drinking water supply installations, taking water
from irrigation canals where drainage water was reused upstream. Ongoing efforts as e.g. to reuse the
water from the Bahr Baqr drain; underline the current momentum in Egypt to advance the wastewater
reuse in this way.
For the new lands and the absence of drainage systems, the situation is different. At this stage, treated
wastewater is already reused in city gardening.
However, emerging urbanized areas in the new lands with the availability of flat desert areas are in their
closer vicinity, offer the potential to construct the collection and monitoring system specifically and from
the beginning accordingly to the needs of an effective and safe wastewater reuse. Advanced and adapted
treatment systems can be installed to facilitate the purification process on demand for a future reuse as
well. Further options that would be of interest could be the increased reuse from agrofood industry
wastewater with its defined and nutrient rich composition. The agricultural re-use must not necessarily lie
in the production of food crops only, but could consider the production of aromatic plants, seeds, by-
products for the bio-economy or e.g. proteins for the fodder industries.
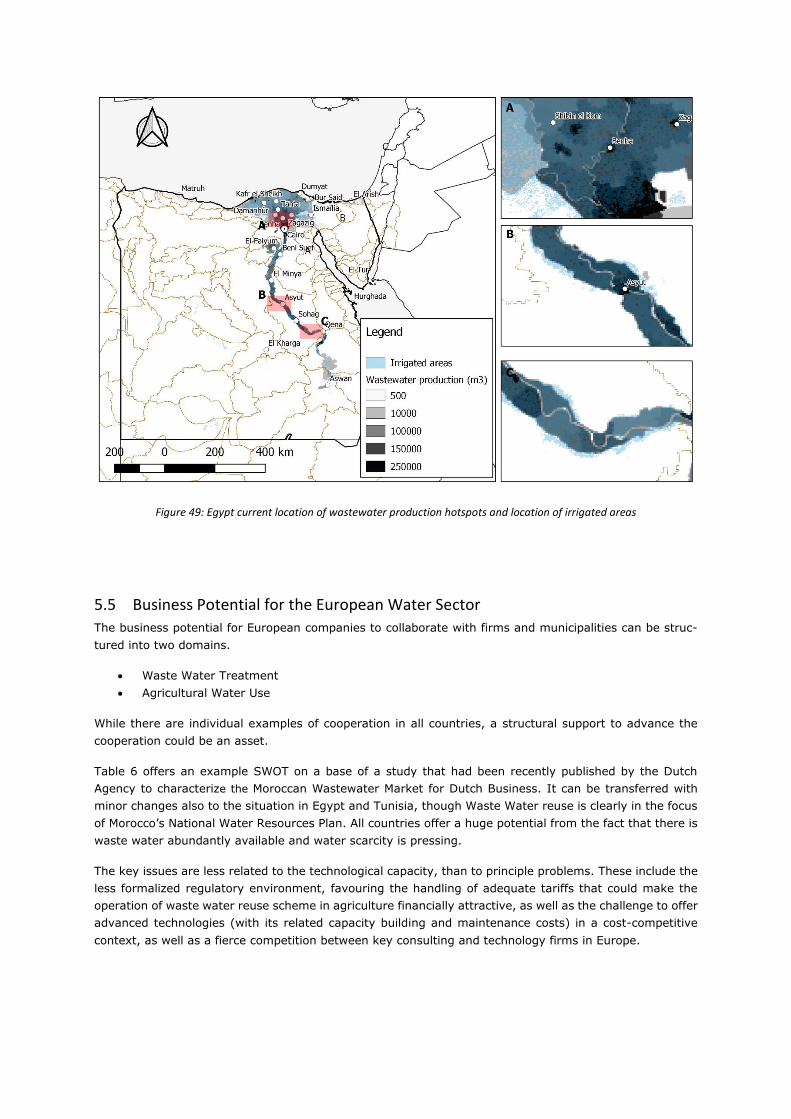
Figure 49: Egypt current location of wastewater production hotspots and location of irrigated areas
5.5 Business Potential for the European Water Sector
The business potential for European companies to collaborate with firms and municipalities can be struc-
tured into two domains.
Waste Water Treatment
Agricultural Water Use
While there are individual examples of cooperation in all countries, a structural support to advance the
cooperation could be an asset.
Table 6 offers an example SWOT on a base of a study that had been recently published by the Dutch
Agency to characterize the Moroccan Wastewater Market for Dutch Business. It can be transferred with
minor changes also to the situation in Egypt and Tunisia, though Waste Water reuse is clearly in the focus
of Morocco’s National Water Resources Plan. All countries offer a huge potential from the fact that there is
waste water abundantly available and water scarcity is pressing.
The key issues are less related to the technological capacity, than to principle problems. These include the
less formalized regulatory environment, favouring the handling of adequate tariffs that could make the
operation of waste water reuse scheme in agriculture financially attractive, as well as the challenge to offer
advanced technologies (with its related capacity building and maintenance costs) in a cost-competitive
context, as well as a fierce competition between key consulting and technology firms in Europe.
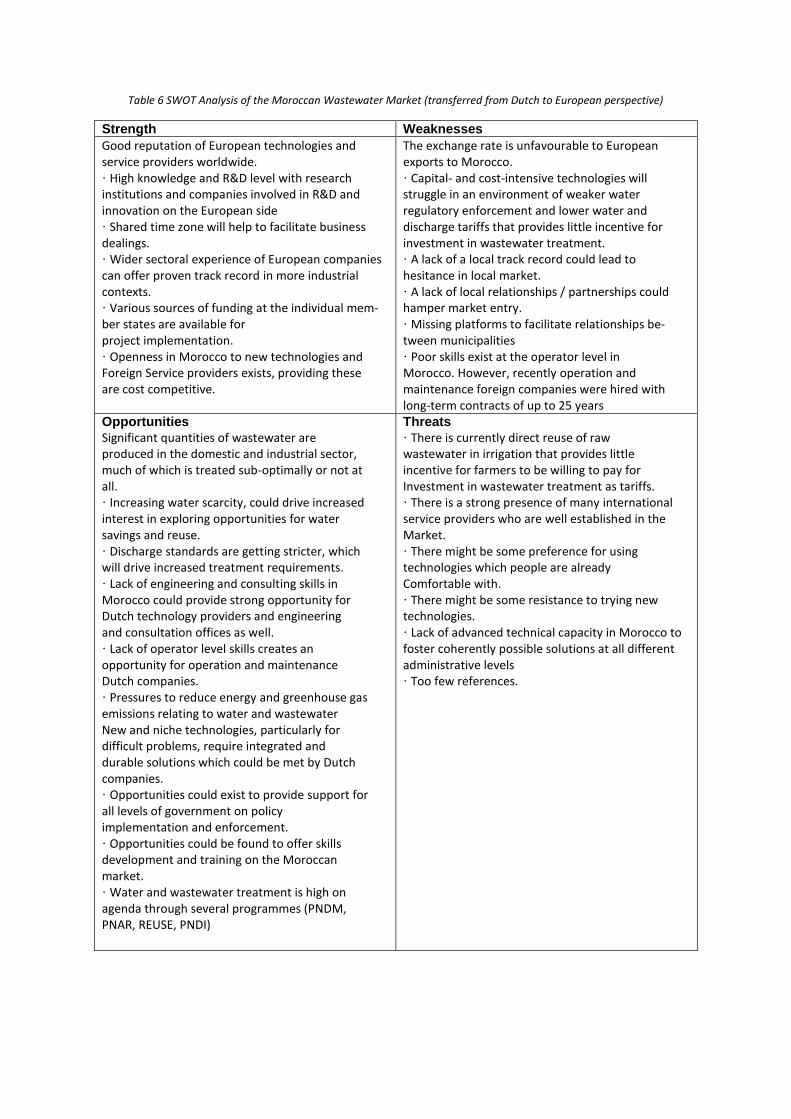
Table 6 SWOT Analysis of the Moroccan Wastewater Market (transferred from Dutch to European perspective)
Strength Weaknesses Good reputation of European technologies and service providers worldwide. · High knowledge and R&D level with research institutions and companies involved in R&D and innovation on the European side · Shared time zone will help to facilitate business dealings. · Wider sectoral experience of European companies can offer proven track record in more industrial contexts. · Various sources of funding at the individual mem-ber states are available for project implementation. · Openness in Morocco to new technologies and Foreign Service providers exists, providing these are cost competitive.
The exchange rate is unfavourable to European exports to Morocco. · Capital- and cost-intensive technologies will struggle in an environment of weaker water regulatory enforcement and lower water and discharge tariffs that provides little incentive for investment in wastewater treatment. · A lack of a local track record could lead to hesitance in local market. · A lack of local relationships / partnerships could hamper market entry. · Missing platforms to facilitate relationships be-tween municipalities · Poor skills exist at the operator level in Morocco. However, recently operation and maintenance foreign companies were hired with long-term contracts of up to 25 years
Opportunities
Significant quantities of wastewater are produced in the domestic and industrial sector, much of which is treated sub-optimally or not at all. · Increasing water scarcity, could drive increased interest in exploring opportunities for water savings and reuse. · Discharge standards are getting stricter, which will drive increased treatment requirements. · Lack of engineering and consulting skills in Morocco could provide strong opportunity for Dutch technology providers and engineering and consultation offices as well. · Lack of operator level skills creates an opportunity for operation and maintenance Dutch companies. · Pressures to reduce energy and greenhouse gas emissions relating to water and wastewater New and niche technologies, particularly for difficult problems, require integrated and durable solutions which could be met by Dutch companies. · Opportunities could exist to provide support for all levels of government on policy implementation and enforcement. · Opportunities could be found to offer skills development and training on the Moroccan market. · Water and wastewater treatment is high on agenda through several programmes (PNDM, PNAR, REUSE, PNDI)
Threats
· There is currently direct reuse of raw wastewater in irrigation that provides little incentive for farmers to be willing to pay for Investment in wastewater treatment as tariffs. · There is a strong presence of many international service providers who are well established in the Market. · There might be some preference for using technologies which people are already Comfortable with. · There might be some resistance to trying new technologies. · Lack of advanced technical capacity in Morocco to foster coherently possible solutions at all different administrative levels · Too few references.
Strengthening local capacities to plan, build, operate, and to maintain advanced waste water reuse
schemes in the Maghreb would hence be a clear asset that also can facilitate the building on networks and
long term partnerships.
Future effort should hence be concentrated on advancing the business landscape and the establishing of
Living Lab structures where the co-creation of innovation strategies can be fostered.
A pending issue that can hamper the efficient reuse of wastewater from municipality is the difficult pollution
control. This is in particular an issue in the urbanized areas with the conglomerate of manufactures, small
industries, and commercial zones representing a convoluted mix of sources and substances discharged.
Future solutions could be seen in the real time monitoring of incoming raw water at multiple locations in
the collection network and the bypassing from water that is not suited for wastewater reuse. The other
direction would be to favour the organized agglomeration of wastewater sources of distinct nature in com-
position and timings of discharge. Such could be effectively realized in future agro-business parks with and
without the connection of purely residential areas or tourist resorts.
6 Bibliography ALBERGEL, J. ; CLAUDE, J 2001 : Sécheresse et gestion des ressources en cas de pénurie dans les pays du Sud et de l'Est du bassin méditerranéen. In Séminaire Int. "Hydrologie des Régions Méditerranéennes" ; PHI-V / Documents Techniques en Hydrologie. UNESCO Paris France, pp 19-32 Armitage, D., de Loë, R. C., Morris, M., Edwards, T. W., Gerlak, A. K., Hall, R. I., ... & Mirumachi, N. (2015). Science–policy processes for transboundary water governance. Ambio, 44(5), 353-366. Bahri, A., 1999. Water resources development and management in Tunisia. Global Water Partnership, Tunisia Country Report. Chahed,J., Hamdane A. (2010): Water scarcity and food security: A global assessment of water potential-ity in Tunisia, Chapter 10, https://www.researchgate.net/publication/266479230 Chouchane, H., Hoekstra, A. Y., Krol, M. S., & Mekonnen, M. M. (2013). Water footprint of Tunisia from an economic perspective, value of water research report series no. 61. Comprehensive Assessment of Water Management in Agriculture (2007). Water for food, water for life: a comprehensive assessment of water management in agriculture." London: Earthscan, and Colombo: International Water Management Institute. Dickson, S. E., C. J. Schuster-Wallace and J. J. Newton (2016). "Water Security Assessment Indicators: The Rural Context." Water Resources Management 30(5): 1567-1604. Eriyagama, N., Smakhtin, V. Y., & Gamage, N. (2009). Mapping drought patterns and impacts: a global perspective (Vol. 133). Iwmi. FAO. 2016. AQUASTAT Main Database, Food and Agriculture Organization of the United Nations (FAO). Website accessed on [17/12/2018 9:35] Fischer, G., Hizsnyik, E., Tramberend, S., & Wiberg, D. (2015). Towards indicators for Water Security-A global hydro-economic classification of water challenges. Funk, C., Peterson, P., Landsfeld, M., Pedreros, D., Verdin, J., Shukla, S., ... & Michaelsen, J. (2015). The climate hazards infrared precipitation with stations—a new environmental record for monitoring extremes. Scientific data, 2, 150066. Garfin, G. M., C. A. Scott, M. Wilder, R. G. Varady and R. Merideth (2016). "Metrics for assessing adaptive capacity and Water Security: common challenges, diverging contexts, emerging consensus." Current Opinion in Environmental Sustainability 21: 86-89. Gassert, F., Landis, M., Luck, M., Reig, P., & Shiao, T. (2013). Aqueduct global maps 2.0. Water Resources Institute (WRI): Washington, DC, 202011-2012. Gassert, F., Luck, M., Landis, M., Reig, P., & Shiao, T. (2014). Aqueduct global maps 2.1: Constructing decision-relevant global water risk indicators. World Resources Institute. Gerbens-Leenes, W., Hoekstra, A. Y., & van der Meer, T. H. (2009). The water footprint of bioenergy. Proceedings of the National Academy of Sciences, 106(25), 10219-10223. Gerlak, A. K., L. House-Peters, R. G. Varady, T. Albrecht, A. Zúñiga-Terán, R. R. de Grenade, C. Cook and C. A. Scott (2018). "Water security: A review of place-based research." Environmental Science & Policy 82: 79-89. Giorgi, F., Jones, C., & Asrar, G. R. (2009). Addressing climate information needs at the regional level: the CORDEX framework. World Meteorological Organization (WMO) Bulletin, 58(3), 175.
Holmatov, B., Lautze, J., Manthrithilake, H., & Makin, I. (2017). Water security for productive economies: Applying an assessment framework in southern Africa. Physics and Chemistry of the Earth, Parts A/B/C, 100, 258-269. https://www.worldbank.org/en/topic/water/publication/beyond-scarcity-water-security-in-the-middle-east-and-north-africa , accessed 4/07/2018 James, L. D. and M. Shafiee-Jood (2017). "Interdisciplinary information for achieving Water Security." Water Security 2: 19-31. Jones, B., & O’Neill, B. C. (2016). Spatially explicit global population scenarios consistent with the Shared Socioeconomic Pathways. Environmental Research Letters, 11(8), 084003. Jones, C., Giorgi, F., & Asrar, G. (2011). The Coordinated Regional Downscaling Experiment: CORDEX–an international downscaling link to CMIP5. CLIVAR exchanges, 16(2), 34-40. Khlifi, S., M. Ameur, N. Mtimet, N. Ghazouani and N. Belhadj (2010). "Impacts of small hill dams on agricultural development of hilly land in the Jendouba region of northwestern Tunisia." Agricultural water management 97(1): 50-56. Kim, Y., I. Kong, H. Park, H. J. Kim, I. J. Kim, M.-J. Um, P. A. Green and C. J. Vörösmarty (2018). "Assessment of regional threats to human Water Security adopting the global framework: A case study in South Korea." Science of The Total Environment 637: 1413-1422. Lall, U., J. Davis, C. Scott, B. Merz and J. Lundqvist (2017). "Pursuing Water Security." Water Security 1: 1-2. Lautze, J. and H. Manthrithilake (2012). "Water security: Old concepts, new package, what value?" Natural Resources Forum 36(2): 76-87. Lautze, J., & Manthrithilake, H. (2012, May). Water security: old concepts, new package, what value?. In Natural Resources Forum (Vol. 36, No. 2, pp. 76-87). Oxford, UK: Blackwell Publishing Ltd. Malekian, A., Hayati, D., & Aarts, N. (2017). Conceptualizations of Water Security in the agricultural sector: Perceptions, practices, and paradigms. Journal of Hydrology, 544, 224-232. Masutomi, Y., Inui, Y., Takahashi, K., & Matsuoka, Y. (2009). Development of highly accurate global polygonal drainage basin data. Hydrological Processes: An International Journal, 23(4), 572-584. Mekonnen, M., & Hoekstra, A. Y. (2011). National water footprint accounts: the green, blue and grey water footprint of production and consumption. Milutinović, S., R. Laušević, J. Petersen-Perlman, M. Bartula, A. Solujić (2016). Local Water Security Assessment for Improved Water Management in Selected Countries in the Middle East and North Africa (MENA) Region. Technical report for theproject “Sustainable Use of Transboundary Water Resources and Water Security Management (WATER SUM)”, Component 2: Water and Security. Regional Envi-ronmental Center, Szentendre, Hungary. ISBN 978-963-9638-70-9 Oliver, J.E. Monthly precipitation distribution: A comparative index. Prof. Geogr. 1980, 32, 300–309. Praveen, K. (2015). "Hydrocomplexity: Addressing Water Security and emergent environmental risks." Water Resources Research 51(7): 5827-5838. Sadoff, C. W., Hall, J. W., Grey, D., Aerts, J. C. J. H., Ait-Kadi, M., Brown, C., ... & McCornick, P. (2015). Securing water, sustaining growth: Report of the GWP. Srinivasan, V., M. Konar and M. Sivapalan (2017). "A dynamic framework for Water Security." Water Security 1: 12-20. Stathatou, P. Μ., Kampragou, E., Grigoropoulou, H., Assimacopoulos, D., Karavitis, C., Porto, M. F. A., ... & Reyna, S. (2016). Vulnerability of water systems: a comprehensive framework for its assessment and identification of adaptation strategies. Desalination and Water Treatment, 57(5), 2243-2255.
Sulser, T. B., C. Ringler, T. Zhu, S. Msangi, E. Bryan and M. W. Rosegrant (2010). "Green and blue water accounting in the Ganges and Nile basins: Implications for food and agricultural policy." Journal of Hy-drology 384(3): 276-291. Svoboda, M., Hayes, M., & Wood, D. (2012). Standardized precipitation index user guide. World Meteorological Organization Geneva, Switzerland. Swatuk, D. Tickner, C. A. Scott, N. Mirumachi and N. Matthews (2016). "Reductionist and integrative research approaches to complex Water Security policy challenges." Global Environmental Change 39: 143-154. van Beek, E., & Arriens, W. L. (2014). Water security: Putting the concept into practice. Stockholm: Global Water Partnership. Veettil, A. V. and A. K. Mishra (2016). "Water security assessment using blue and green water footprint concepts." Journal of hydrology 542: 589-602. Vörösmarty, C.J., McIntyre, P.B., Gessner, M.O., Dudgeon, D., Prusevich, A., Green, P., Glidden, S., Bunn, S.E., Sullivan, C.A., Liermann, C.R. and Davies, P.M., 2010. Global threats to human Water Security and river biodiversity. Nature, 467(7315), p.555. Water, U. N. (2013). Water security and the global water agenda: a UN-water analytical brief. Hamilton, ON: UN University. World Bank. 2017. Beyond Scarcity: Water Security in the Middle East and North Africa. MENA Development Series. World Bank, Washington, DC. License: Creative Commons Attribution CC BY 3.0 IGO Wouters, P. (2010). Water security: Global, regional and local challenges. Zeitoun, M. (2011). The global web of national Water Security. Global Policy, 2(3), 286-296. Zeitoun, M., B. Lankford, T. Krueger, T. Forsyth, R. Carter, A. Y. Hoekstra, R. Taylor, O. Varis, F. Cleaver, R. Boelens, L.