Embed Size (px)
Citation preview
Contract No.: 282-98-0021MPR Reference No.: 8860-500
2002 Health Care Survey of DoD Beneficiaries: Adult Codebook and User’s Guide
November 2002Quarter III
Submitted to:
TRICARE Management Activity5111 Leesburg Pike, Suite 810Falls Church, VA 22041(703) 681-4263
Task Order Officer:Lt Col Michael Hartzell
Submitted by:
Mathematica Policy Research, Inc.600 Maryland Ave., SW, Suite 550Washington, DC 20024-2512(202) 484-9220
Project Director:Eric Schone, Ph. D.

2002 HEALTH CARE SURVEY OF DOD BENEFICIARIES – QUARTER III
PAGE IS INTENTIONALLY LEFT BLANK TO ALLOW FOR DOUBLE-SIDED COPYING
05/13/23 ii
2002 HEALTH CARE SURVEY OF DOD BENEFICIARIES – QUARTER III
Contents
Lists Page
Table of Variables............................................................................................................... v
Alphabetical Table of Variables............................................................................................xi
Chapters
1 Introduction........................................................................................................................1
2 Description of the Adult HCSDB Database............................................................................7
3 Programming Guide..........................................................................................................11
- How to Make a Table Using SAS.................................................................................11- How to Make a Table Using SPSS...............................................................................35- Calculating Variances of Estimates...............................................................................87
4 Codebook........................................................................................................................ 91
References................................................................................................................................. 211
Appendices
A Annotated Questionnaires – Quarter III..........................................................................A-1
B Crosswalk for 1994-1995, 1996, 1997, 1998, 1999, 2000 and 2002 Adult HCSDB – Quarter III...............................................................................................B-1
C Data Quality Coding Scheme and Coding Tables – Quarter III........................................C-1
D SAS Proc Contents -- Alphabetical 2002 Adult HCSDB – Quarter III...................................D-1
E SAS Proc Contents -- Positional 2002 Adult HCSDB – Quarter III.....................................E-1
F Response Rate Tables...................................................................................................F-1
05/13/23 iii
2002 HEALTH CARE SURVEY OF DOD BENEFICIARIES – QUARTER III
PAGE IS INTENTIONALLY LEFT BLANK TO ALLOW FOR DOUBLE-SIDED COPYING
05/13/23 iv
2002 HEALTH CARE SURVEY OF DOD BENEFICIARIES – QUARTER III
Table of Variables
Page
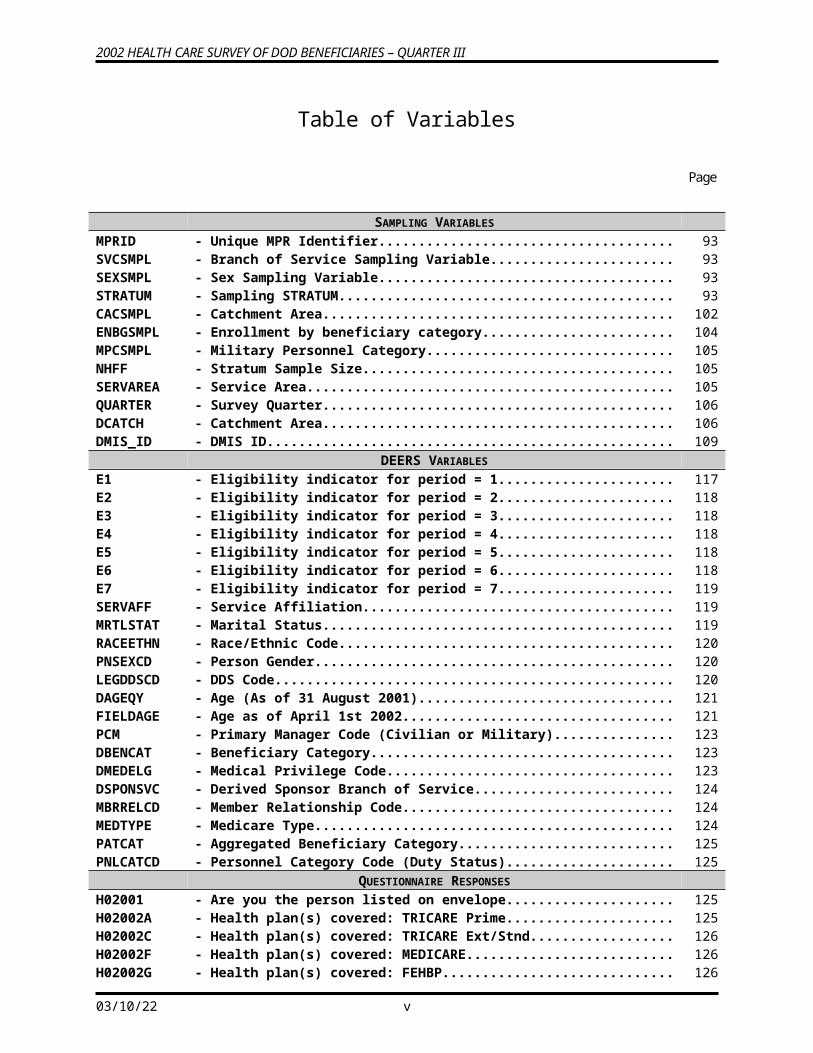
SAMPLING VARIABLESMPRID - Unique MPR Identifier..................................................................................... 93SVCSMPL - Branch of Service Sampling Variable............................................................. 93SEXSMPL - Sex Sampling Variable.................................................................................... 93STRATUM - Sampling STRATUM........................................................................................ 93CACSMPL - Catchment Area............................................................................................... 102ENBGSMPL - Enrollment by beneficiary category................................................................ 104MPCSMPL - Military Personnel Category............................................................................ 105NHFF - Stratum Sample Size....................................................................................... 105SERVAREA - Service Area..................................................................................................... 105QUARTER - Survey Quarter................................................................................................. 106DCATCH - Catchment Area............................................................................................... 106DMIS_ID - DMIS ID............................................................................................................. 109
DEERS VARIABLESE1 - Eligibility indicator for period = 1................................................................... 117E2 - Eligibility indicator for period = 2................................................................... 118E3 - Eligibility indicator for period = 3................................................................... 118E4 - Eligibility indicator for period = 4................................................................... 118E5 - Eligibility indicator for period = 5................................................................... 118E6 - Eligibility indicator for period = 6................................................................... 118E7 - Eligibility indicator for period = 7................................................................... 119SERVAFF - Service Affiliation............................................................................................ 119MRTLSTAT - Marital Status................................................................................................... 119RACEETHN - Race/Ethnic Code............................................................................................ 120PNSEXCD - Person Gender................................................................................................. 120LEGDDSCD - DDS Code......................................................................................................... 120DAGEQY - Age (As of 31 August 2001)............................................................................. 121FIELDAGE - Age as of April 1st 2002................................................................................... 121PCM - Primary Manager Code (Civilian or Military)................................................... 123DBENCAT - Beneficiary Category....................................................................................... 123DMEDELG - Medical Privilege Code.................................................................................... 123DSPONSVC - Derived Sponsor Branch of Service............................................................... 124MBRRELCD - Member Relationship Code............................................................................. 124MEDTYPE - Medicare Type.................................................................................................. 124PATCAT - Aggregated Beneficiary Category................................................................... 125PNLCATCD - Personnel Category Code (Duty Status)......................................................... 125
QUESTIONNAIRE RESPONSESH02001 - Are you the person listed on envelope........................................................... 125H02002A - Health plan(s) covered: TRICARE Prime........................................................ 125H02002C - Health plan(s) covered: TRICARE Ext/Stnd.................................................... 126H02002F - Health plan(s) covered: MEDICARE................................................................ 126H02002G - Health plan(s) covered: FEHBP....................................................................... 126H02002H - Health plan(s) covered: Medicaid................................................................... 126H02002I - Health plan(s) covered: Civilian HMO............................................................. 126H02002J - Health plan(s) covered: Other civilian............................................................ 127H02002K - Health plan(s) covered: USFHP....................................................................... 127H02002L - Health plan(s) covered: Not sure.................................................................... 127H02002M - Health plan(s) covered: Veterans.................................................................... 127H02002N - Health plan(s) covered: TRICARE Plus........................................................... 127H02003 - Currently Covered Medicare Part A................................................................ 128H02004 - Currently Covered Medicare Part B................................................................ 128
05/13/23 v
2002 HEALTH CARE SURVEY OF DOD BENEFICIARIES – QUARTER III
H02005 - Currently Covered Medicare Supplemental.................................................... 128H02006 - Which health plan did you use most in the past 12 months?....................... 129H02007 - Years in a row with health plan....................................................................... 129H02008 - When joined health plan received new personal Doctor............................... 130H02009 - Health plan: problem to get a personal doctor or nurse you are happy
with..................................................................................................................... 130H02010 - Have one person you think of as personal doctor......................................... 130H02011 - Rating of your personal doctor or nurse........................................................ 131H02012 - Currently enrolled in TRICARE Prime............................................................. 131H02013 - TRICARE member: Primary Care Manager(PCM) based in a military or
civilian facility.................................................................................................... 132H02014 - Know your PCM's name.................................................................................. 132H02015 - In last year: you or a doctor or nurse think you needed to see a specialist. 132H02016 - In last year: how much of a problem to get a referral to see a specialist..... 133H02017 - In last year: did you see a specialist............................................................... 133H02018 - Rating of specialist seen in last year.............................................................. 133H02019 - In last year: specialist saw was the same as personal doctor....................... 134H02020 - In last year: called a doctor's office or clinic during regular office hours to
get help or advice for yourself.......................................................................... 134H02021 - In last year: when you called during regular office hours how often got
help or advice you needed................................................................................ 134H02022 - In last year: made any appointment for regular or routine health care......... 135H02023 - In last year: how often made appointments for regular or routine health
care as soon as you wanted.............................................................................. 135H02024 - In last year: days between appointment for regular or routine care and
actually seeing a provider................................................................................. 135H02025 - In last year: illness/injury needed care right away......................................... 136H02026 - In last year: when needed care right away for an illness or injury got care
as soon as wanted............................................................................................. 136H02027 - In last year: wait between trying to get care and actually seeing a provider
for an illness or injury....................................................................................... 136H02028 - In last year: went to an emergency room for own care.................................. 137H02029 - In last year: went to a doctors office or clinic for yourself (not counting
times went to an emergency room)................................................................... 137H02030 - In last year: problem to get necessary care................................................... 137H02031 - In last year: problem with delays in healthcare while waiting for approval
from health plan................................................................................................. 138H02032 - In last year: wait more than 15 minutes past appointment time to see a
doctor................................................................................................................. 138H02033 - In last year: how often office staff at a doctor's office or clinic treat you
with courtesy and respect................................................................................. 138H02034 - In last year: how often office staff at a doctor's office or clinic as helpful
as expected........................................................................................................ 139H02035 - In last year: how often doctors or other health providers listen carefully
to you................................................................................................................. 139H02036 - In last year: how often doctors or other health providers explain things in
way you could understand................................................................................ 140H02037 - In last year: how often doctors or other health providers show respect for
what you had to say........................................................................................... 140H02038 - In last year: how often doctors or other health providers spend enough
time with you...................................................................................................... 141H02039 - Rating of all healthcare in last year................................................................ 141H02040 - In last year: prescriptions that were written by a civilian provider but were
filled at a military pharmacy.............................................................................. 142H02041 - In last year: facility used most for health care............................................... 142H02042 - Most important reason to use MTF................................................................. 143H02043 - In last year: sent in any claims to your health plan....................................... 143H02044 - In last year: health plan handled claims in a reasonable time...................... 144
05/13/23 vi
2002 HEALTH CARE SURVEY OF DOD BENEFICIARIES – QUARTER III
H02045 - In last year: how often health plan handled claims correctly........................ 144H02046 - In last year: before went for care know amount to pay.................................. 145H02047 - In last year: look for any information in written materials from health plan. 145H02048 - In last year: problem to find or understand information in the written
materials............................................................................................................. 145H02049 - In last year: called health plan's customer service to get information or
help..................................................................................................................... 146H02050 - In last year: problem to get the help you needed when called health
plan's customer service..................................................................................... 146H02051 - Called or written health plan with a complaint or problem........................... 146H02052 - How long for health plan to resolve complaint.............................................. 147H02053 - Complaint or problem settled to satisfaction................................................. 147H02054 - In last year: have any experiences with paperwork for your health plan...... 147H02055 - In last year: how much problems with paperwork for your health plan....... 148H02056 - Rating of all experience with health plan....................................................... 148H02057 - In next year: likely to disenroll in TRICARE Prime......................................... 149H02058 - Not sick/pregnant: last medical or physical exam or checkup...................... 149H02059 - Blood pressure: when last reading................................................................. 149H02060 - Blood pressure: know if blood pressure is too high or not.......................... 150H02061 - When did you last have a cholesterol screening........................................... 150H02062 - When did you last have a flu shot.................................................................. 150H02063 - Smoked at least 100 cigarettes in life............................................................. 151H02064 - Smoke everyday somedays or not at all......................................................... 151H02065 - How long since you quit smoking.................................................................. 151H02066 - Last year: number of visits advised to quit smoking..................................... 152H02067 - Are you male or female.................................................................................... 152H02068 - Last prostate disease exam or blood test...................................................... 152H02069 - Last have a Pap smear test............................................................................. 153H02070 - Are you under age 40...................................................................................... 153H02071 - Last time: breasts checked mammography................................................... 153H02072 - Last time: breast exam by professional.......................................................... 154H02073 - Been pregnant in last year or pregnant now.................................................. 154H02074 - In what trimester is your pregnancy............................................................... 154H02075 - Trimester first received prenatal care............................................................. 155H02076 - In general how would you rate your overall health........................................ 155H02077 - Are you Spanish/Hispanic/Latino................................................................... 155SREDA - Highest grade completed................................................................................ 156SRRACEA - Race: White...................................................................................................... 156SRRACEB - Race: Black or African American.................................................................... 156SRRACEC - Race: American Indian or Alaska Native........................................................ 156SRRACED - Race: Asian...................................................................................................... 157SRRACEE - Race: Native Hawaiian/other Pacific Islanders............................................... 157SRAGE - What is your age now?.................................................................................... 157S02D01 - Last 12 months: care from dentist's office or dental clinic........................... 157S02D02 - Last 12 months: number of times to dentist's office or clinic for self.......... 158S02D03 - Last 12 months: rating of dental care............................................................. 158S02M01 - Last 12 months: treatment or counseling for personal or family problem.. . 158S02M02 - Last 12 months: problem to get treatment or counseling needed................ 159S02M03 - Last 12 months: rating of treatment or counseling....................................... 159S02P01 - Last 12 months: new or refill prescription..................................................... 159S02P02 - Last 12 months: problem to get prescription medicine................................. 160S02P03 - Last 12 months: how often get prescription medicine needed..................... 160S02X01 - Rating of overall mental or emotional health................................................. 160S02X02 - Rating of life overall........................................................................................ 161
NRC SURVEY FIELDING VARIABLESFLAG_FIN - Final Disposition.............................................................................................. 161DUPFLAG - Multiple Response Indicator........................................................................... 161FNSTATUS - Final Status...................................................................................................... 161
05/13/23 vii
2002 HEALTH CARE SURVEY OF DOD BENEFICIARIES – QUARTER III
KEYCOUNT - Number of Key Questions Answered............................................................. 162CODING SCHEME FLAGS AND COUNTS
N1 - Coding Scheme Note 1.................................................................................... 162N2 - Coding Scheme Note 2.................................................................................... 162N3 - Coding Scheme Note 3.................................................................................... 163N4 - Coding Scheme Note 4.................................................................................... 163N5 - Coding Scheme Note 5.................................................................................... 163N6 - Coding Scheme Note 6.................................................................................... 163N7 - Coding Scheme Note 7.................................................................................... 164N8 - Coding Scheme Note 8.................................................................................... 164N9 - Coding Scheme Note 9.................................................................................... 164N10 - Coding Scheme Note 10.................................................................................. 165N11 - Coding Scheme Note 11.................................................................................. 165N12 - Coding Scheme Note 12.................................................................................. 165N13 - Coding Scheme Note 13.................................................................................. 166N14 - Coding Scheme Note 14.................................................................................. 166N15 - Coding Scheme Note 15.................................................................................. 166N16 - Coding Scheme Note 16.................................................................................. 167N17 - Coding Scheme Note 17.................................................................................. 167N18 - Coding Scheme Note 18.................................................................................. 167N19 - Coding Scheme Note 19.................................................................................. 168N24 - Coding Scheme Note 24.................................................................................. 168N25A - Coding Scheme Note 25A............................................................................... 169N25B - Coding Scheme Note 25B............................................................................... 169N25C - Coding Scheme Note 25C............................................................................... 169N26 - Coding Scheme Note 26.................................................................................. 170N27 - Coding Scheme Note 27.................................................................................. 170MISS_1 - Count of: Violates Skip Pattern....................................................................... 170MISS_4 - Count of: Incomplete grid error...................................................................... 170MISS_5 - Count of: Scalable response of Don't know................................................... 171MISS_6 - Count of: Not applicable - valid skip.............................................................. 171MISS_7 - Count of: Out-of-range error........................................................................... 172MISS_8 - Count of: Multiple response error................................................................... 172MISS_9 - Count of: No response - invalid skip.............................................................. 173MISS_TOT - Total number of missing responses............................................................... 174
CONSTRUCTED VARIABLESXENRLLMT - Enrollment in TRICARE Prime........................................................................ 175XENR_PCM - Enrollment by PCM type.................................................................................. 175XINS_COV - Insurance Coverage......................................................................................... 175XQENROLL - Enrollment according to questionnaire response......................................... 176XREGION - Region.............................................................................................................. 176CONUS - CONUS/OCONUS Indicator............................................................................. 176OUTCATCH - Out of Catchment Area Indicator.................................................................... 177XSEXA - Male or Female (Recode)................................................................................. 177XBNFGRP - Constructed Beneficiary Group...................................................................... 177KDISENRL - Intention to disenroll....................................................................................... 177KMILOFFC - Office wait of 15 min or more at Military facility............................................. 178KCIVOFFC - Office wait of 15 min or more at Civilian facility............................................ 178KBGPRB1 - Big problem getting referrals to specialist..................................................... 178KBGPRB2 - Big problem getting necessary care............................................................... 178KMILOPQY - Outpatient visits to Military facility................................................................. 179KCIVOPQY - Outpatient visits to Civilian facility................................................................. 179KCIVINS - Beneficiary covered by civilian insurance...................................................... 179KBRSTCR - Women age 40 and over ever had mammogram and breast exam................ 179HP_PRNTL - Pregnant in last year received care in 1st trimester....................................... 180HP_MAMOG - Women age 40 and over mammography in past 2 years............................... 180HP_MAM50 - Women age 50 and over mammography in past 2 years............................... 180HP_PAP - All women Pap smear in last 3 years.............................................................. 180
05/13/23 viii
2002 HEALTH CARE SURVEY OF DOD BENEFICIARIES – QUARTER III
HP_BP - Blood pressure check in last 2 years know results....................................... 181HP_FLU - Age 65 and older flu shot in last 12 months................................................... 181HP_PROS - Men age 50 or over prostrate exam in last 12 months................................... 181HP_GP - General physical exam in last 12 months....................................................... 181HP_BRST - Women age 40 and over breast exam in last 12 months............................... 182HP_CHOL - Cholesterol screening in last 5 years............................................................. 182HP_SMOKE - Advised to quit smoking in last 12 months.................................................... 182BWT - Basic Sampling Weight................................................................................... 182ADJ_CELL - Adjusted STRATUM cell.................................................................................. 183
WEIGHTSWRWT1 - Replicated/JackKnife Weight 1....................................................................... 190WRWT2 - Replicated/JackKnife Weight 2....................................................................... 190WRWT3 - Replicated/JackKnife Weight 3....................................................................... 190WRWT4 - Replicated/JackKnife Weight 4....................................................................... 191WRWT5 - Replicated/JackKnife Weight 5....................................................................... 191WRWT6 - Replicated/JackKnife Weight 6....................................................................... 191WRWT7 - Replicated/JackKnife Weight 7....................................................................... 192WRWT8 - Replicated/JackKnife Weight 8....................................................................... 192WRWT9 - Replicated/JackKnife Weight 9....................................................................... 192WRWT10 - Replicated/JackKnife Weight 10..................................................................... 193WRWT11 - Replicated/JackKnife Weight 11..................................................................... 193WRWT12 - Replicated/JackKnife Weight 12..................................................................... 193WRWT13 - Replicated/JackKnife Weight 13..................................................................... 194WRWT14 - Replicated/JackKnife Weight 14..................................................................... 194WRWT15 - Replicated/JackKnife Weight 15..................................................................... 194WRWT16 - Replicated/JackKnife Weight 16..................................................................... 195WRWT17 - Replicated/JackKnife Weight 17..................................................................... 195WRWT18 - Replicated/JackKnife Weight 18..................................................................... 195WRWT19 - Replicated/JackKnife Weight 19..................................................................... 196WRWT20 - Replicated/JackKnife Weight 20..................................................................... 196WRWT21 - Replicated/JackKnife Weight 21..................................................................... 196WRWT22 - Replicated/JackKnife Weight 22..................................................................... 197WRWT23 - Replicated/JackKnife Weight 23..................................................................... 197WRWT24 - Replicated/JackKnife Weight 24..................................................................... 197WRWT25 - Replicated/JackKnife Weight 25..................................................................... 198WRWT26 - Replicated/JackKnife Weight 26..................................................................... 198WRWT27 - Replicated/JackKnife Weight 27..................................................................... 198WRWT28 - Replicated/JackKnife Weight 28..................................................................... 199WRWT29 - Replicated/JackKnife Weight 29..................................................................... 199WRWT30 - Replicated/JackKnife Weight 30..................................................................... 199WRWT31 - Replicated/JackKnife Weight 31..................................................................... 200WRWT32 - Replicated/JackKnife Weight 32..................................................................... 200WRWT33 - Replicated/JackKnife Weight 33..................................................................... 200WRWT34 - Replicated/JackKnife Weight 34..................................................................... 201WRWT35 - Replicated/JackKnife Weight 35..................................................................... 201WRWT36 - Replicated/JackKnife Weight 36..................................................................... 201WRWT37 - Replicated/JackKnife Weight 37..................................................................... 202WRWT38 - Replicated/JackKnife Weight 38..................................................................... 202WRWT39 - Replicated/JackKnife Weight 39..................................................................... 202WRWT40 - Replicated/JackKnife Weight 40..................................................................... 203WRWT41 - Replicated/JackKnife Weight 41..................................................................... 203WRWT42 - Replicated/JackKnife Weight 42..................................................................... 203WRWT43 - Replicated/JackKnife Weight 43..................................................................... 204WRWT44 - Replicated/JackKnife Weight 44..................................................................... 204WRWT45 - Replicated/JackKnife Weight 45..................................................................... 204WRWT46 - Replicated/JackKnife Weight 46..................................................................... 205WRWT47 - Replicated/JackKnife Weight 47..................................................................... 205WRWT48 - Replicated/JackKnife Weight 48..................................................................... 205
05/13/23 ix
2002 HEALTH CARE SURVEY OF DOD BENEFICIARIES – QUARTER III
WRWT49 - Replicated/JackKnife Weight 49..................................................................... 206WRWT50 - Replicated/JackKnife Weight 50..................................................................... 206WRWT51 - Replicated/JackKnife Weight 51..................................................................... 206WRWT52 - Replicated/JackKnife Weight 52..................................................................... 207WRWT53 - Replicated/JackKnife Weight 53..................................................................... 207WRWT54 - Replicated/JackKnife Weight 54..................................................................... 207WRWT55 - Replicated/JackKnife Weight 55..................................................................... 208WRWT56 - Replicated/JackKnife Weight 56..................................................................... 208WRWT57 - Replicated/JackKnife Weight 57..................................................................... 208WRWT58 - Replicated/JackKnife Weight 58..................................................................... 209WRWT59 - Replicated/JackKnife Weight 59..................................................................... 209WRWT60 - Replicated/JackKnife Weight 60..................................................................... 209WRWT - Final Weight..................................................................................................... 210
05/13/23 x
2002 HEALTH CARE SURVEY OF DOD BENEFICIARIES – QUARTER III
Alphabetical Table of Variables
Page
ADJ_CELL - Adjusted STRATUM cell.................................................................................. 183BWT - Basic Sampling Weight................................................................................... 182CACSMPL - Catchment Area............................................................................................... 102CONUS - CONUS/OCONUS Indicator............................................................................. 176DAGEQY - Age (As of 31 August 2001)............................................................................. 121DBENCAT - Beneficiary Category....................................................................................... 123DCATCH - Catchment Area............................................................................................... 106DMEDELG - Medical Privilege Code.................................................................................... 123DMIS_ID - DMIS ID............................................................................................................. 109DSPONSVC - Derived Sponsor Branch of Service............................................................... 124DUPFLAG - Multiple Response Indicator........................................................................... 161E1 - Eligibility indicator for period = 1................................................................... 117E2 - Eligibility indicator for period = 2................................................................... 118E3 - Eligibility indicator for period = 3................................................................... 118E4 - Eligibility indicator for period = 4................................................................... 118E5 - Eligibility indicator for period = 5................................................................... 118E6 - Eligibility indicator for period = 6................................................................... 118E7 - Eligibility indicator for period = 7................................................................... 119ENBGSMPL - Enrollment by beneficiary category................................................................ 104FIELDAGE - Age as of April 1st 2002................................................................................... 121FLAG_FIN - Final Disposition.............................................................................................. 161FNSTATUS - Final Status...................................................................................................... 161H02001 - Are you the person listed on envelope........................................................... 125H02002A - Health plan(s) covered: TRICARE Prime........................................................ 125H02002C - Health plan(s) covered: TRICARE Ext/Stnd.................................................... 126H02002F - Health plan(s) covered: MEDICARE................................................................ 126H02002G - Health plan(s) covered: FEHBP....................................................................... 126H02002H - Health plan(s) covered: Medicaid................................................................... 126H02002I - Health plan(s) covered: Civilian HMO............................................................. 126H02002J - Health plan(s) covered: Other civilian............................................................ 127H02002K - Health plan(s) covered: USFHP....................................................................... 127H02002L - Health plan(s) covered: Not sure.................................................................... 127H02002M - Health plan(s) covered: Veterans.................................................................... 127H02002N - Health plan(s) covered: TRICARE Plus........................................................... 127H02003 - Currently Covered Medicare Part A................................................................ 128H02004 - Currently Covered Medicare Part B................................................................ 128H02005 - Currently Covered Medicare Supplemental.................................................... 128H02006 - Which health plan did you use most in the past 12 months?....................... 129H02007 - Years in a row with health plan....................................................................... 129H02008 - When joined health plan received new personal Doctor............................... 130H02009 - Health plan: problem to get a personal doctor or nurse you are happy
with..................................................................................................................... 130H02010 - Have one person you think of as personal doctor......................................... 130H02011 - Rating of your personal doctor or nurse........................................................ 131H02012 - Currently enrolled in TRICARE Prime............................................................. 131H02013 - TRICARE member: Primary Care Manager(PCM) based in a military or
civilian facility.................................................................................................... 132H02014 - Know your PCM's name.................................................................................. 132H02015 - In last year: you or a doctor or nurse think you needed to see a specialist. 132H02016 - In last year: how much of a problem to get a referral to see a specialist..... 133H02017 - In last year: did you see a specialist............................................................... 133
05/13/23 xi
2002 HEALTH CARE SURVEY OF DOD BENEFICIARIES – QUARTER III
H02018 - Rating of specialist seen in last year.............................................................. 133H02019 - In last year: specialist saw was the same as personal doctor....................... 134H02020 - In last year: called a doctor's office or clinic during regular office hours to
get help or advice for yourself.......................................................................... 134H02021 - In last year: when you called during regular office hours how often got
help or advice you needed................................................................................ 134H02022 - In last year: made any appointment for regular or routine health care......... 135H02023 - In last year: how often made appointments for regular or routine health
care as soon as you wanted.............................................................................. 135H02024 - In last year: days between appointment for regular or routine care and
actually seeing a provider................................................................................. 135H02025 - In last year: illness/injury needed care right away......................................... 136H02026 - In last year: when needed care right away for an illness or injury got care
as soon as wanted............................................................................................. 136H02027 - In last year: wait between trying to get care and actually seeing a provider
for an illness or injury....................................................................................... 136H02028 - In last year: went to an emergency room for own care.................................. 137H02029 - In last year: went to a doctors office or clinic for yourself (not counting
times went to an emergency room)................................................................... 137H02030 - In last year: problem to get necessary care................................................... 137H02031 - In last year: problem with delays in healthcare while waiting for approval
from health plan................................................................................................. 138H02032 - In last year: wait more than 15 minutes past appointment time to see a
doctor................................................................................................................. 138H02033 - In last year: how often office staff at a doctor's office or clinic treat you
with courtesy and respect................................................................................. 138H02034 - In last year: how often office staff at a doctor's office or clinic as helpful
as expected........................................................................................................ 139H02035 - In last year: how often doctors or other health providers listen carefully
to you................................................................................................................. 139H02036 - In last year: how often doctors or other health providers explain things in
way you could understand................................................................................ 140H02037 - In last year: how often doctors or other health providers show respect for
what you had to say........................................................................................... 140H02038 - In last year: how often doctors or other health providers spend enough
time with you...................................................................................................... 141H02039 - Rating of all healthcare in last year................................................................ 141H02040 - In last year: prescriptions that were written by a civilian provider but were
filled at a military pharmacy.............................................................................. 142H02041 - In last year: facility used most for health care............................................... 142H02042 - Most important reason to use MTF................................................................. 143H02043 - In last year: sent in any claims to your health plan....................................... 143H02044 - In last year: health plan handled claims in a reasonable time...................... 144H02045 - In last year: how often health plan handled claims correctly........................ 144H02046 - In last year: before went for care know amount to pay.................................. 145H02047 - In last year: look for any information in written materials from health plan. 145H02048 - In last year: problem to find or understand information in the written
materials............................................................................................................. 145H02049 - In last year: called health plan's customer service to get information or
help..................................................................................................................... 146H02050 - In last year: problem to get the help you needed when called health
plan's customer service..................................................................................... 146H02051 - Called or written health plan with a complaint or problem........................... 146H02052 - How long for health plan to resolve complaint.............................................. 147H02053 - Complaint or problem settled to satisfaction................................................. 147H02054 - In last year: have any experiences with paperwork for your health plan...... 147H02055 - In last year: how much problems with paperwork for your health plan....... 148H02056 - Rating of all experience with health plan....................................................... 148H02057 - In next year: likely to disenroll in TRICARE Prime......................................... 149
05/13/23 xii
2002 HEALTH CARE SURVEY OF DOD BENEFICIARIES – QUARTER III
H02058 - Not sick/pregnant: last medical or physical exam or checkup...................... 149H02059 - Blood pressure: when last reading................................................................. 149H02060 - Blood pressure: know if blood pressure is too high or not.......................... 150H02061 - When did you last have a cholesterol screening........................................... 150H02062 - When did you last have a flu shot.................................................................. 150H02063 - Smoked at least 100 cigarettes in life............................................................. 151H02064 - Smoke everyday somedays or not at all......................................................... 151H02065 - How long since you quit smoking.................................................................. 151H02066 - Last year: number of visits advised to quit smoking..................................... 152H02067 - Are you male or female.................................................................................... 152H02068 - Last prostate disease exam or blood test...................................................... 152H02069 - Last have a Pap smear test............................................................................. 153H02070 - Are you under age 40...................................................................................... 153H02071 - Last time: breasts checked mammography................................................... 153H02072 - Last time: breast exam by professional.......................................................... 154H02073 - Been pregnant in last year or pregnant now.................................................. 154H02074 - In what trimester is your pregnancy............................................................... 154H02075 - Trimester first received prenatal care............................................................. 155H02076 - In general how would you rate your overall health........................................ 155H02077 - Are you Spanish/Hispanic/Latino................................................................... 155HP_BP - Blood pressure check in last 2 years know results....................................... 181HP_BRST - Women age 40 and over breast exam in last 12 months............................... 182HP_CHOL - Cholesterol screening in last 5 years............................................................. 182HP_FLU - Age 65 and older flu shot in last 12 months................................................... 181HP_GP - General physical exam in last 12 months....................................................... 181HP_MAM50 - Women age 50 and over mammography in past 2 years............................... 180HP_MAMOG - Women age 40 and over mammography in past 2 years............................... 180HP_PAP - All women Pap smear in last 3 years.............................................................. 180HP_PRNTL - Pregnant in last year received care in 1st trimester....................................... 180HP_PROS - Men age 50 or over prostrate exam in last 12 months................................... 181HP_SMOKE - Advised to quit smoking in last 12 months.................................................... 182KBGPRB1 - Big problem getting referrals to specialist..................................................... 178KBGPRB2 - Big problem getting necessary care............................................................... 178KBRSTCR - Women age 40 and over ever had mammogram and breast exam................ 179KCIVINS - Beneficiary covered by civilian insurance...................................................... 179KCIVOFFC - Office wait of 15 min or more at Civilian facility............................................ 178KCIVOPQY - Outpatient visits to Civilian facility................................................................. 179KDISENRL - Intention to disenroll....................................................................................... 177KEYCOUNT - Number of Key Questions Answered............................................................. 162KMILOFFC - Office wait of 15 min or more at Military facility............................................. 178KMILOPQY - Outpatient visits to Military facility................................................................. 179LEGDDSCD - DDS Code......................................................................................................... 120MBRRELCD - Member Relationship Code............................................................................. 124MEDTYPE - Medicare Type.................................................................................................. 124MISS_1 - Count of: Violates Skip Pattern....................................................................... 170MISS_4 - Count of: Incomplete grid error...................................................................... 170MISS_5 - Count of: Scalable response of Don't know................................................... 171MISS_6 - Count of: Not applicable - valid skip.............................................................. 171MISS_7 - Count of: Out-of-range error........................................................................... 172MISS_8 - Count of: Multiple response error................................................................... 172MISS_9 - Count of: No response - invalid skip.............................................................. 173MISS_TOT - Total number of missing responses............................................................... 174MPCSMPL - Military Personnel Category............................................................................ 105MPRID - Unique MPR Identifier..................................................................................... 93MRTLSTAT - Marital Status................................................................................................... 119N1 - Coding Scheme Note 1.................................................................................... 162N10 - Coding Scheme Note 10.................................................................................. 165N11 - Coding Scheme Note 11.................................................................................. 165N12 - Coding Scheme Note 12.................................................................................. 165
05/13/23 xiii
2002 HEALTH CARE SURVEY OF DOD BENEFICIARIES – QUARTER III
N13 - Coding Scheme Note 13.................................................................................. 166N14 - Coding Scheme Note 14.................................................................................. 166N15 - Coding Scheme Note 15.................................................................................. 166N16 - Coding Scheme Note 16.................................................................................. 167N17 - Coding Scheme Note 17.................................................................................. 167N18 - Coding Scheme Note 18.................................................................................. 167N19 - Coding Scheme Note 19.................................................................................. 168N2 - Coding Scheme Note 2.................................................................................... 162N24 - Coding Scheme Note 24.................................................................................. 168N25A - Coding Scheme Note 25A............................................................................... 169N25B - Coding Scheme Note 25B............................................................................... 169N25C - Coding Scheme Note 25C............................................................................... 169N26 - Coding Scheme Note 26.................................................................................. 170N27 - Coding Scheme Note 27.................................................................................. 170N3 - Coding Scheme Note 3.................................................................................... 163N4 - Coding Scheme Note 4.................................................................................... 163N5 - Coding Scheme Note 5.................................................................................... 163N6 - Coding Scheme Note 6.................................................................................... 163N7 - Coding Scheme Note 7.................................................................................... 164N8 - Coding Scheme Note 8.................................................................................... 164N9 - Coding Scheme Note 9.................................................................................... 164NHFF - Stratum Sample Size....................................................................................... 105OUTCATCH - Out of Catchment Area Indicator.................................................................... 177PATCAT - Aggregated Beneficiary Category................................................................... 125PCM - Primary Manager Code (Civilian or Military)................................................... 123PNLCATCD - Personnel Category Code (Duty Status)......................................................... 125PNSEXCD - Person Gender................................................................................................. 120QUARTER - Survey Quarter................................................................................................. 106RACEETHN - Race/Ethnic Code............................................................................................ 120S02D01 - Last 12 months: care from dentist's office or dental clinic........................... 157S02D02 - Last 12 months: number of times to dentist's office or clinic for self.......... 158S02D03 - Last 12 months: rating of dental care............................................................. 158S02M01 - Last 12 months: treatment or counseling for personal or family problem.. . 158S02M02 - Last 12 months: problem to get treatment or counseling needed................ 159S02M03 - Last 12 months: rating of treatment or counseling....................................... 159S02P01 - Last 12 months: new or refill prescription..................................................... 159S02P02 - Last 12 months: problem to get prescription medicine................................. 160S02P03 - Last 12 months: how often get prescription medicine needed..................... 160S02X01 - Rating of overall mental or emotional health................................................. 160S02X02 - Rating of life overall........................................................................................ 161SERVAFF - Service Affiliation............................................................................................ 119SERVAREA - Service Area..................................................................................................... 105SEXSMPL - Sex Sampling Variable.................................................................................... 93SRAGE - What is your age now?.................................................................................... 157SREDA - Highest grade completed................................................................................ 156SRRACEA - Race: White...................................................................................................... 156SRRACEB - Race: Black or African American.................................................................... 156SRRACEC - Race: American Indian or Alaska Native........................................................ 156SRRACED - Race: Asian...................................................................................................... 157SRRACEE - Race: Native Hawaiian/other Pacific Islanders............................................... 157STRATUM - Sampling STRATUM........................................................................................ 93SVCSMPL - Branch of Service Sampling Variable............................................................. 93WRWT - Final Weight..................................................................................................... 210WRWT1 - Replicated/JackKnife Weight 1....................................................................... 190WRWT10 - Replicated/JackKnife Weight 10..................................................................... 193WRWT11 - Replicated/JackKnife Weight 11..................................................................... 193WRWT12 - Replicated/JackKnife Weight 12..................................................................... 193WRWT13 - Replicated/JackKnife Weight 13..................................................................... 194WRWT14 - Replicated/JackKnife Weight 14..................................................................... 194
05/13/23 xiv
2002 HEALTH CARE SURVEY OF DOD BENEFICIARIES – QUARTER III
WRWT15 - Replicated/JackKnife Weight 15..................................................................... 194WRWT16 - Replicated/JackKnife Weight 16..................................................................... 195WRWT17 - Replicated/JackKnife Weight 17..................................................................... 195WRWT18 - Replicated/JackKnife Weight 18..................................................................... 195WRWT19 - Replicated/JackKnife Weight 19..................................................................... 196WRWT2 - Replicated/JackKnife Weight 2....................................................................... 190WRWT20 - Replicated/JackKnife Weight 20..................................................................... 196WRWT21 - Replicated/JackKnife Weight 21..................................................................... 196WRWT22 - Replicated/JackKnife Weight 22..................................................................... 197WRWT23 - Replicated/JackKnife Weight 23..................................................................... 197WRWT24 - Replicated/JackKnife Weight 24..................................................................... 197WRWT25 - Replicated/JackKnife Weight 25..................................................................... 198WRWT26 - Replicated/JackKnife Weight 26..................................................................... 198WRWT27 - Replicated/JackKnife Weight 27..................................................................... 198WRWT28 - Replicated/JackKnife Weight 28..................................................................... 199WRWT29 - Replicated/JackKnife Weight 29..................................................................... 199WRWT3 - Replicated/JackKnife Weight 3....................................................................... 190WRWT30 - Replicated/JackKnife Weight 30..................................................................... 199WRWT31 - Replicated/JackKnife Weight 31..................................................................... 200WRWT32 - Replicated/JackKnife Weight 32..................................................................... 200WRWT33 - Replicated/JackKnife Weight 33..................................................................... 200WRWT34 - Replicated/JackKnife Weight 34..................................................................... 201WRWT35 - Replicated/JackKnife Weight 35..................................................................... 201WRWT36 - Replicated/JackKnife Weight 36..................................................................... 201WRWT37 - Replicated/JackKnife Weight 37..................................................................... 202WRWT38 - Replicated/JackKnife Weight 38..................................................................... 202WRWT39 - Replicated/JackKnife Weight 39..................................................................... 202WRWT4 - Replicated/JackKnife Weight 4....................................................................... 191WRWT40 - Replicated/JackKnife Weight 40..................................................................... 203WRWT41 - Replicated/JackKnife Weight 41..................................................................... 203WRWT42 - Replicated/JackKnife Weight 42..................................................................... 203WRWT43 - Replicated/JackKnife Weight 43..................................................................... 204WRWT44 - Replicated/JackKnife Weight 44..................................................................... 204WRWT45 - Replicated/JackKnife Weight 45..................................................................... 204WRWT46 - Replicated/JackKnife Weight 46..................................................................... 205WRWT47 - Replicated/JackKnife Weight 47..................................................................... 205WRWT48 - Replicated/JackKnife Weight 48..................................................................... 205WRWT49 - Replicated/JackKnife Weight 49..................................................................... 206WRWT5 - Replicated/JackKnife Weight 5....................................................................... 191WRWT50 - Replicated/JackKnife Weight 50..................................................................... 206WRWT51 - Replicated/JackKnife Weight 51..................................................................... 206WRWT52 - Replicated/JackKnife Weight 52..................................................................... 207WRWT53 - Replicated/JackKnife Weight 53..................................................................... 207WRWT54 - Replicated/JackKnife Weight 54..................................................................... 207WRWT55 - Replicated/JackKnife Weight 55..................................................................... 208WRWT56 - Replicated/JackKnife Weight 56..................................................................... 208WRWT57 - Replicated/JackKnife Weight 57..................................................................... 208WRWT58 - Replicated/JackKnife Weight 58..................................................................... 209WRWT59 - Replicated/JackKnife Weight 59..................................................................... 209WRWT6 - Replicated/JackKnife Weight 6....................................................................... 191WRWT60 - Replicated/JackKnife Weight 60..................................................................... 209WRWT7 - Replicated/JackKnife Weight 7....................................................................... 192WRWT8 - Replicated/JackKnife Weight 8....................................................................... 192WRWT9 - Replicated/JackKnife Weight 9....................................................................... 192XBNFGRP - Constructed Beneficiary Group...................................................................... 177XENR_PCM - Enrollment by PCM type.................................................................................. 175XENRLLMT - Enrollment in TRICARE Prime........................................................................ 175XINS_COV - Insurance Coverage......................................................................................... 175XQENROLL - Enrollment according to questionnaire response......................................... 176
05/13/23 xv
2002 HEALTH CARE SURVEY OF DOD BENEFICIARIES – QUARTER III
XREGION - Region.............................................................................................................. 176XSEXA - Male or Female (Recode)................................................................................. 177
05/13/23 xvi
2002 HEALTH CARE SURVEY OF DOD BENEFICIARIES – QUARTER III
PAGE IS INTENTIONALLY LEFT BLANK TO ALLOW FOR DOUBLE-SIDED COPYING
05/13/23 xvii
2002 HEALTH CARE SURVEY OF DOD BENEFICIARIES – QUARTER III
IntroductionThis Codebook and Users’ Guide provides a tool for programmers and analysts to assist them in creating cross-tabulations and basic statistical estimates from the 2002 Adult Health Care Survey of DoD Beneficiaries (HCSDB). It is intended to facilitate users in creating tables and generating analyses above and beyond those associated with this project.
This version of the Codebook and User’s Guide describes the third quarter data set. It presents the frequency counts of all variables from the third quarter survey.
Users interested in recreating specific tables or charts from MPR’s analytic report should refer to “The 2002 Health Care Survey of DoD Beneficiaries: Adult Technical Manual.” That document defines the procedures required to reproduce the TRICARE Consumer Reports and charts presented in the National Executive Summary Report, using HCSDB data.
This chapter explains how to use this guide, reviews the survey, briefly describes the sample design, and concludes with a list of other documents on the HCSDB data that may be useful for policymakers, administrators, and other users.
How to Use This Guide
Chapter 2 describes the database conventions and types of variables in the database. Furthermore, it explains the relationship between the raw survey data and the cleaned and constructed variables preferred for data analyses.
Chapter 3 provides table-making instructions in both SAS and SPSS and clearly demonstrates the basic computer programming code necessary to tabulate the data in SAS and the interactive steps involved in generating tables in SPSS (either statistical package may be used). While we assume that most users have some knowledge of computer systems and statistical processing, examples of how to create tables and the resulting output are provided in order to simplify the process of data tabulation. Due to the complexity of the sample design, we suggest that users interested in measuring the precision of their results use a statistical package capable of calculating standard errors for survey estimates, such as SUDAANTM or WesVar PC®. Sample programming code is included to estimate standard errors using appropriate methods to accommodate the complex sample design.
The codebook is presented in Chapter 4, where we describe each variable in the database, including a list of all possible values of the variable, weighted and unweighted frequency counts and percent occurrences for each value, and the values’ interpretation or formatting. The codebook helps users assess the availability of certain measures, specify variables of interest, and identify all possible values of a variable. The variables are listed in the order of their position on the data file, and they are grouped by source as follows:
Sampling variables used to place beneficiaries in the appropriate strata
05/13/23 1
Chapter

2002 HEALTH CARE SURVEY OF DOD BENEFICIARIES – QUARTER III
Information from the Defense Enrollment Eligibility Reporting System (DEERS) at the time of sampling
Questionnaire responses: cleaned and recoded
Variables created during the fielding of the survey
Coding Scheme flags and missing value counts
Constructed variables for analysis
In addition, users may refer to the Table of Variables, which follows directly after the Table of Contents), for an alphabetical quick-reference list intended to assist users in locating each variable.
Users interested in learning more about the technical aspects of the database creation, construction of new variables, or MPR’s report production procedures may refer to “The 2002 Health Care Survey of DoD Beneficiaries: Adult Technical Manual,” available from the TRICARE Management Activity Office.
What is the HCSDB?
The HCSDB is a health care survey of active duty military personnel, retirees, and their adult family members. It is comprised of an adult and a child survey, both fielded to a representative sample of beneficiaries. The adult survey is fielded every quarter, whereas the child survey is fielded only in the third quarter of each year. Results from each quarter are presented as a web-based report. The survey is sponsored by the Assistant Secretary of Defense (Health Affairs) [OASD (HA)], under authority of the National Defense Authorization Act for Fiscal Year 1993 (P.L. 102-484). The surveys collect data on beneficiaries’ satisfaction with, and access to, health care, knowledge of the TRICARE system, and use of preventive and other health care services.
Fielded annually from 1994 to 2000, the HCSDB now is fielded quarterly and consists of a fixed core questionnaire complemented by quarterly supplements intended to address topics of emerging interest. Users should note that, prior to 2000, the title of the HCSDB corresponded to the reference year that respondents were asked to think about when responding to questions. For example, although the 2000 HCSDB was fielded in 2001, beneficiaries responded to questions according to the reference period 12 months prior. Under the new naming convention the survey title refers to the year the questionnaires are fielded, so, for example, this year's survey is the 2002 HSCDB. Users should further note that, due to this change, there will be no survey with the title "2001" survey, even though the questionnaire has been administered continuously throughout each quarter of 2001 and 2002.
The annotated questionnaire appears as Appendix A. A crosswalk between the 2002 questions and the questions from the 1994-1995, 1996, 1997, 1998, 1999, 2000 and 2002 surveys appears as Appendix B.
The HCSDB fixed questionnaire covers the following topics:
Health Plan. This section collects data on TRICARE Prime enrollment and the use of supplemental insurance and/or other private insurance.
Your Personal Doctor or Nurse. In this section, respondents are asked about their relationship with their personal doctor or nurse. They are asked to rate their personal doctor or nurse on a scale from 0 to 10, where 0 is the lowest rating and 10 is the highest rating.
05/13/23 2
2002 HEALTH CARE SURVEY OF DOD BENEFICIARIES – QUARTER III
Getting Health Care from a Specialist. This section collects information about respondents’ need for and access to care from specialists. Respondents rate the specialist that they see most frequently on a scale from 0 to 10, where 0 is the lowest rating and 10 is the highest rating.
Calling Doctors’ Offices. Questions in this section ask beneficiaries whether they were able to access care and obtain information by telephone from their doctor’s office or clinic.
Your Health Care in the Last 12 Months. This section collects information on where DoD beneficiaries received the majority of their care in the past 12 months, that is, from a military or civilian facility. It also covers topics such as the availability of providers and their staff, convenience, and courtesy and respect shown by providers and their staff. For comparison purposes, the questions are similar in content and format to questions used in the Consumer Assessment of Health Plans Survey (CAHPS). CAHPS is a survey program sponsored by the Agency for Health Care Research and Quality, U.S. Department of Health and Human Service, and the Picker Institute, which is designed to monitor beneficiaries’ satisfaction with their civilian health care plan and access to health care services.
Your Health Plan. This section is designed to measure beneficiaries’ satisfaction with their primary health plan. Respondents are asked to rate their health plan on a scale of 0 to where 0 is the lowest rating and 10 is the highest rating. TRICARE Prime enrollees are asked about their satisfaction with Prime and about their likelihood of possibly disenrolling. Beneficiaries not currently enrolled in Prime are asked if they intend to enroll in the next 12 months. All respondents are asked about out-of-pocket expenses for medical care and health insurance coverage. Additionally, respondents are asked questions about any problems they may have encountered with claims processing, accessing and comprehending written materials, customer service, processing paperwork, and resolving complaints.
Your Preventive Health Care. This section collects information on the use of preventive health care services, including routine physical examination, blood pressure readings, cholesterol screening, and flu shots. All women are asked about Pap smears; women that are or have been pregnant within the past 12 months are questioned about prenatal care. Women age 40 and over are asked about mammography and breast examination by a health care professional. Men are asked about prostate examinations. All respondents are asked whether they smoke. Smokers are asked whether they have received smoking cessation counseling from a health care professional.
Quarter III Supplements
Behavioral Health. Questions in this supplement pertain to beneficiaries’ experience with treatment and counseling for personal or family problems. Respondents are asked to identify the extent to which they needed treatment and counseling services, their experience with accessing needed services, and how they rate these services.
Prescription Medicine. This supplement examines: whether beneficiaries obtained new or refilled prescriptions; how much of a problem it was to obtain the medicine; and how often beneficiaries were successful in obtaining the prescription medicine they needed through their health plan.
Dental Care. Questions in this supplement focus on whether beneficiaries received care from a dentist’s office or dental clinic, and if so, how many times they visited the office or clinic specifically to receive dental care.
05/13/23 3
2002 HEALTH CARE SURVEY OF DOD BENEFICIARIES – QUARTER III
State of Mind. Questions in this section ask about beneficiaries’ mental and emotional health and a rating of life overall.
Sample Design Overview
The sample of beneficiaries for the HCSDB was drawn from an extract file of the DEERS database of military health system (MHS) beneficiaries with a reference date. The DEERS extract file includes all eligible MHS beneficiaries as follows:
Everyone in the Uniformed Services and on active duty (Army, Air Force, Navy, Marine Corps, Coast Guard, the Commissioned Corps of the Public Health Service, National Oceanic and Atmospheric Administration, Guard/Reserve personnel who are activated for a period in excess of 30 days, and other special categories of people who qualify for benefits)
Those who retired from military careers
Immediate family members of people in the previous two categories
Surviving family members.
A stratified probability sample design was used to select DoD health care beneficiaries for the Quarter III 2002 Adult HCSDB. Strata were defined by a combination of enrollment status groups, and beneficiary groups, and geographic areas. Specific information on the sample design appears in, “The 2000 Health Care Survey of DoD Beneficiaries: 2001 Adult Sample Design” 1, Mathematica Policy Research, Washington, D.C.
We examined response rates to identify patterns across different domains or characteristics. While analysts prefer weighted rates that reflect the estimated proportion of respondents among all beneficiaries, operational staff is often interested in getting unweighted measures. All tables include unweighted and weighted values under columns headed “Unweighted” and “Weighted”, respectively. In the following, we focus on discussing unweighted response rates for domains of interest.
Table 1.1 below provides data regarding response rates for the 2002 Adult HCSDB for the third quarter, by beneficiary groups, and by enrollment status.
Overall: The overall unweighted response rate for the third quarter of 2002 Adult HCSDB was about 30 percent, unchanged from the second quarter of 2002.
Beneficiary group and enrollment status: Response rates across beneficiary groups and enrollment status show similar patterns as the 2001 survey: we achieved our highest response rate from beneficiaries 65 years and older and our lowest response rate from active duty beneficiaries.2
Table 1.1
Response Rates Overall and by Enrollee Beneficiary Group For Quarter III, 2002
1 This report was completed before the change in the survey’s naming convention and refers to the sample design for the current 2002 Adult HCSDB.2 However, response patterns vary considerably across beneficiary and enrollment groups. The relatively low level of response for active duty persons and their family members could be due to frequent relocations and our inability to receive new addresses in a timely manner.
05/13/23 4
2002 HEALTH CARE SURVEY OF DOD BENEFICIARIES – QUARTER III
RR1
(%)RRw
2
(%)Overall 29.6 44.0Active duty 18.0 17.1Active duty family, Prime enrollee 30.6 31.6Active duty family, non-enrollee 20.2 21.6Retired, <65,enrollee 55.5 56.6Retired, <65,non-enrollee 44.2 48.7Retired, 65+ 70.2 70.0
For domains of special interest, Appendix F (Response Rate Tables) contains tables showing response rates and weighted response rates for the quarter. Below we briefly summarize response rate results for selected domains, as follows:
Regions: Response rates across regions range from 14.1 percent for Western Pacific Command to 36.7 percent for Golden Gate (Table F.1).
Sex: Response rate for men is 25.6 percent as compared to 34.8 percent for women. (Table F.2).
CONUS: Response rate for CONUS is 32.3 percent as compared to 15.3 percent for OCONUS. (Table F.3).
Catchment areas: Combined response rates across catchment areas range from 10.2 percent for Okinawa to 45.6 percent for Randolph AFB. (Table F.4).
Beneficiary groups by sex: Women responded at a higher rate than men for both and active duty beneficiaries and family members: 21.6 percent versus 17.3 percent and 28.2 percent versus 16.2 percent, respectively. Interestingly, the opposite pattern emerges for retirees, survivors and family members 65 and older, and for retirees younger than 65. (Table F.5).
Beneficiary group by service affiliation (Army, Navy, Air Force, Marine Corps, Coast Guard): Across service affiliations, we achieved our highest combined response of 82.1 percent from Cost Guard beneficiaries over 65 and our lowest combined response rate of 10 percent from active duty beneficiaries in the Marine Corps (Table F.6).
Other Documents on the 2002 HCSDB
This document is intended for programmers and analysts using the 2002 Adult HCSDB data. The following is a list of other documents that may be requested from the TRICARE Management Activity Office:
The 2000 Health Care Survey of DoD Beneficiaries: 2001 Adult Sample Design3
The 2002 Health Care Survey of DoD Beneficiaries: Adult Technical Manual
The 2002 Health Care Survey of DoD Beneficiaries: National Executive Summary Report
1 Final Response Rate
2 Final Weighted Response Rate
3 This report was completed before the change in the survey’s naming convention and refers to the sample design for the current 2002 Adult HCSDB.
05/13/23 5
2002 HEALTH CARE SURVEY OF DOD BENEFICIARIES – QUARTER III
PAGE IS INTENTIONALLY LEFT BLANK TO ALLOW FOR DOUBLE-SIDED COPYING
05/13/23 6
2002 HEALTH CARE SURVEY OF DOD BENEFICIARIES – QUARTER III
Description of the Adult HCSDB DatabaseThis chapter presents the procedures for developing the database, and presents the database file layout.
Variable Naming Conventions
The conventions used to name variables on the 2002 Adult HCSDB data file are listed below and summarized in Table 2.1. The naming conventions will remain constant across the four quarters of the 2002 HCSDB.
Survey Variables. Core survey variable names consist of up to eight alphanumeric characters that start with an alpha character ("H" for Adult survey variables), followed by a year designation (“02”) and ending with three numbers and, if necessary, one alpha character to identify the relevant survey question. Recoded variables have the same names as on the survey. The original variables are suffixed with “_O”; these will not be on the public release file.
Supplemental Question Variables. Each quarter, the questionnaire includes a battery of questions on specific health care topics concerning services offered to MHS beneficiaries. The supplements in the second quarter contained questions relating to the management of beneficiaries’ chronic health problems and the eye care they receive at military facilities. Like the core questions, supplemental questions also include eight alphanumeric characters; each variable begins with an “S” to distinguish it as a supplemental question, followed by the year designation (“02”). The variable ends with an alpha character and the question number in the supplemental series. For example, the variable for the first supplemental question would be S02C01. In Quarter III, the supplemental question variables have a “D,” “M,” “P” or “X” in the fourth position; for example, S02D03 asks beneficiaries to rate their dental care.
Self-Reported Data. Defense Manpower Data Center (DMDC) standard demographic self-reporting variables on the adult survey are prefixed with “SR.” Survey variables with this naming convention include SRRACE (race/ethnicity) and SREDA (education).
Coding Scheme Flags and Counts. Coding Scheme flags, variables N1-N30, reference the notes in the Coding Scheme for Adult Survey. N2, for example, is set when checking the values of H02008 and H02009. See Appendix C for the Coding Scheme for Quarter III for more information. Coding Scheme counts are sums of missing value responses for each questionnaire; each of these variable names begins with the 4 characters “MISS”.
Constructed Independent Variables. Independent variables are prefixed with an "X." These include original survey variables modified as a result of data cleaning or recoding and newly constructed variables that did not previously exist on the survey file. For example, since the variable SRSEX was modified as a result of data cleaning and recoding, it was renamed XSEXA.
05/13/23 7
Chapter
2
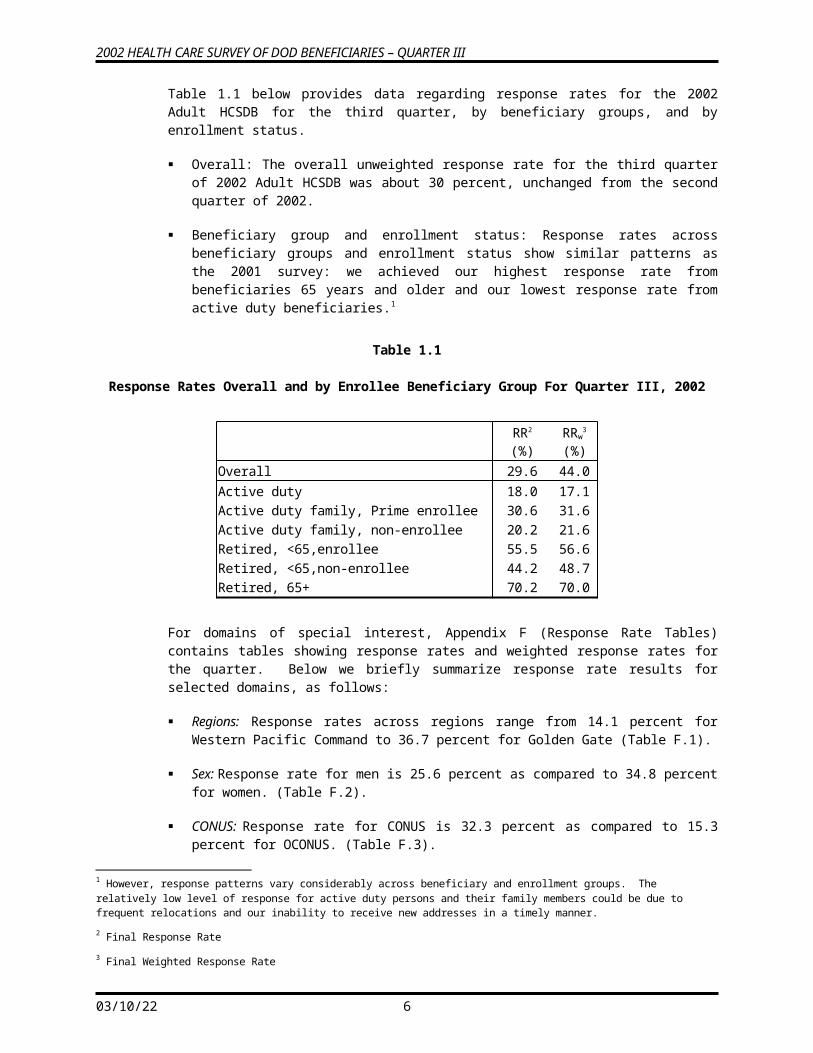
2002 HEALTH CARE SURVEY OF DOD BENEFICIARIES – QUARTER III
Constructed Dependent Variables. Dependent variables are given different prefixes depending on function. Healthy People 2010 variables, for example, are prefixed with an "HP,” and all other newly constructed dependent variables are prefixed with a "K."
Weighting Variables. Quarterly weighting variables are prefixed with a "W."
TABLE 2.1
NAMING CONVENTIONS FOR 2002 HCSDB VARIABLES – QUARTER III
1st Character:Survey Type
2nd – 3rd Characters:Survey Year
4th – 6th Characters:Question #
Additional Characters:Additional Information
H= HealthBeneficiaries (18 andolder, Adult Questionnaire)
----------------------------------S = Supplemental
Question
02 001 to 077
D01-D03–Supplemental questions about dental care
M01-M03–Supplemental questions about treatment for behavioral health
P01-P03–Supplemental questions about prescription drugs
X01-X02–Supplemental questions about state of mind
A to O are used to label responses associated with a multiple response question
_O denotes an original version of a recoded variable--------------------------------
1st Characters:Variable Group
Additional Characters:Additional Information
SR=Self-reported demographic data Descriptive text, e.g., SREDA
N=Coding scheme notes Number referring to Note, e.g., N2
X=Constructed independent variable Descriptive text, e.g., XREGION
HP=Constructed Healthy People2010 variable
Descriptive text, e.g., HP_BP (had blood pressure screening in past two years and know the results)
K=Constructed dependent variables Descriptive text, e.g., KMILOPQY (total number of outpatient visits to military facility)
Cleaning and Editing Conventions
Data quality procedures are found in the Coding Scheme tables. The complete Coding Scheme appears in Appendix C. It contains detailed instructions for all editing procedures used to correct
05/13/23 8
2002 HEALTH CARE SURVEY OF DOD BENEFICIARIES – QUARTER III
data inconsistencies and errors. Editing procedures check for appropriate response values and consistent responses throughout the questionnaire. The steps to insure data quality include the following:
Initial Cleaning. Missing value flags were encoded when NRC created the SAS dataset:
- Skipped items were encoded with SAS missing value code of ‘.’.
- Multiple responses, where there should be a single response, were encoded with SAS missing value ‘.A’.
Data Cleaning and Recoding of Variables – Implementation of the Coding Scheme. Skip patterns were checked for consistency, and questions that were skipped legitimately were recoded with the SAS missing value of “.N”; questions that were answered, but should have been skipped, were recoded with a SAS missing value of “.C”. When possible, variables were backward coded or forward coded to make all responses consistent within a sequence. Numeric values were checked, and values that were out of range were flagged with the SAS missing value of “.O”.
Frequency Checks. Formatted and unformatted frequency tables for all variables in the 2002 Adult HCSDB Quarter III data file appear in Chapter 4 of this document. These frequency tables and other relevant cross tabulations were used to examine the range of values recorded for each data item to determine the type and magnitude of missing values. All value labels have been checked for accuracy.
Record Selection Criteria
Blank returns, nonrespondents, and any respondents found to be ineligible for MHS benefits were removed from the database. In addition, among eligible respondents with a non-blank questionnaire, a questionnaire must be “complete” to be included in the database.
To determine if a questionnaire is “complete”, 29 key questions were chosen. These key questions were adapted from the complete questionnaire rule developed by AHRQ for CAHPS surveys. At least 50 percent of these key items (fifteen or more) must be answered for a questionnaire to be accepted as a complete questionnaire. The key survey variables are: H02006, H02008, H02009, H02010, H02011, H02012, H02013, H02015, H02017, H02018, H02020, H02021, H02022, H02025, H02026, H02028, H02029, H02030, H02032, H02039, H02041, H02047, H02049, H02054, H02056, H02077, SREDA, H02076 and SRRACEA-SRRACEE.
Weighting Procedures
The analysis of survey data from complex sample designs, such as the 2002 Adult HCSDB, requires weights to do the following:
Compensate for variable probabilities of selection
Adjust for differential response rates
Improve the precision of the survey-based estimates through post-stratification [for details, see Brick and Kalton (1996) and references cited therein].
Sampling weights are equivalent to the reciprocal of the probability of each respondent’s selection into the sample. Sampling weights are further adjusted for nonresponse within classes defined by sampling strata: a cross-classification of enrollment status, geographic area, and beneficiary group.
05/13/23 9
2002 HEALTH CARE SURVEY OF DOD BENEFICIARIES – QUARTER III
These nonresponse-adjusted weights are then ratio-adjusted to population counts from the DEERS files to compensate for variations from the estimated population counts. Chapter 4 contains the weighted and unweighted frequencies for each variable in the first quarter.
05/13/23 10
2002 HEALTH CARE SURVEY OF DOD BENEFICIARIES – QUARTER III
PAGE IS INTENTIONALLY LEFT BLANK TO ALLOW FOR DOUBLE-SIDED COPYING
05/13/23 11
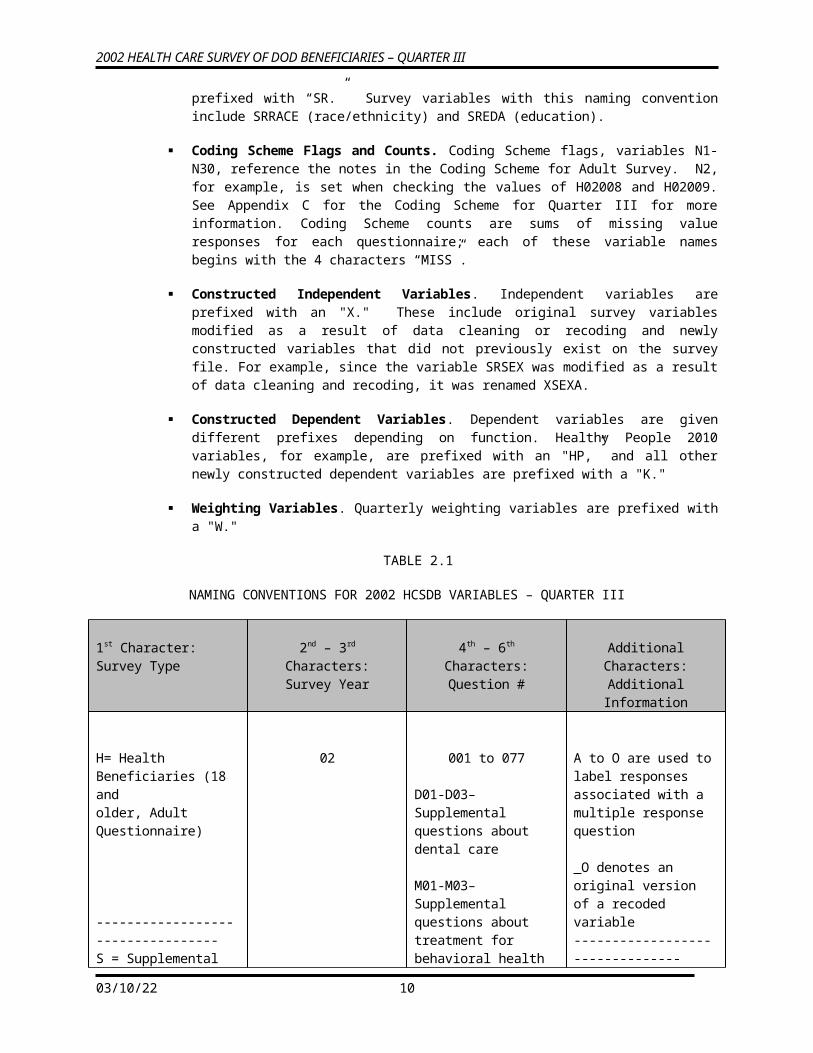
2002 HEALTH CARE SURVEY OF DOD BENEFICIARIES – QUARTER III
Programming GuideThis chapter is designed to help users create tables and variance estimates. Procedures for using SAS, SPSS, SUDAAN, and WesVarPC to create estimates are explained. Examples provided in the text are based on the first quarter of data from the 2002 HCSDB.
How To Make a Table Using SAS
The 2002 Adult HCSDB dataset is provided in a Statistical Analysis System (SAS) 6.0 format. SAS is a computer software system used for data management, summarization, and analysis. Later versions of SAS can also read version 6 datasets. A format library for the adult database is included along with the dataset. SAS can be run interactively or non-interactively (in batch mode), and the sample programs presented here can be run using either method. Special instructions are given later in the chapter for working interactively with the SAS Display Manager System in a Windows environment. All SAS programs generate a LOG and a LST file. The LOG file shows how SAS interprets your program and flags SAS syntax errors. The LST file shows the requested output.
File References, Libraries, and Options
SAS recognizes two types of datasets -- permanent and temporary. Permanent datasets, such as the HCSDB, are located through a LIBNAME that references the directory where the data is stored. For example, if the adult dataset for Quarter III is located on a CD-ROM in the subdirectory HCSDB02\FORMA\Q3, your LIBNAME statement must look like this:
LIBNAME INFORMA 'F:\HCSDB02\FORMA\Q3’;
The adult dataset can then be referred to as INFORMA.HCSDB02, where INFORMA is the location of the file HCSDB02.
A format library requires a LIBNAME LIBRARY statement that shows the location of the format library. For example, if the adult format library is stored on your hard drive in a FMTLIB subdirectory, the LIBNAME statement should look like this:
LIBNAME LIBRARY 'C:\HCSDB02\FORMA\Q3\FMTLIB';
The OPTIONS statement controls page format and line length. A table with a “portrait” orientation might have this statement:
OPTIONS PS=79 LS=132;
A table with a “landscape” orientation that is left justified would have this OPTIONS statement:
OPTIONS PS=50 LS=175 NOCENTER;
05/13/23 12
Chapter
3
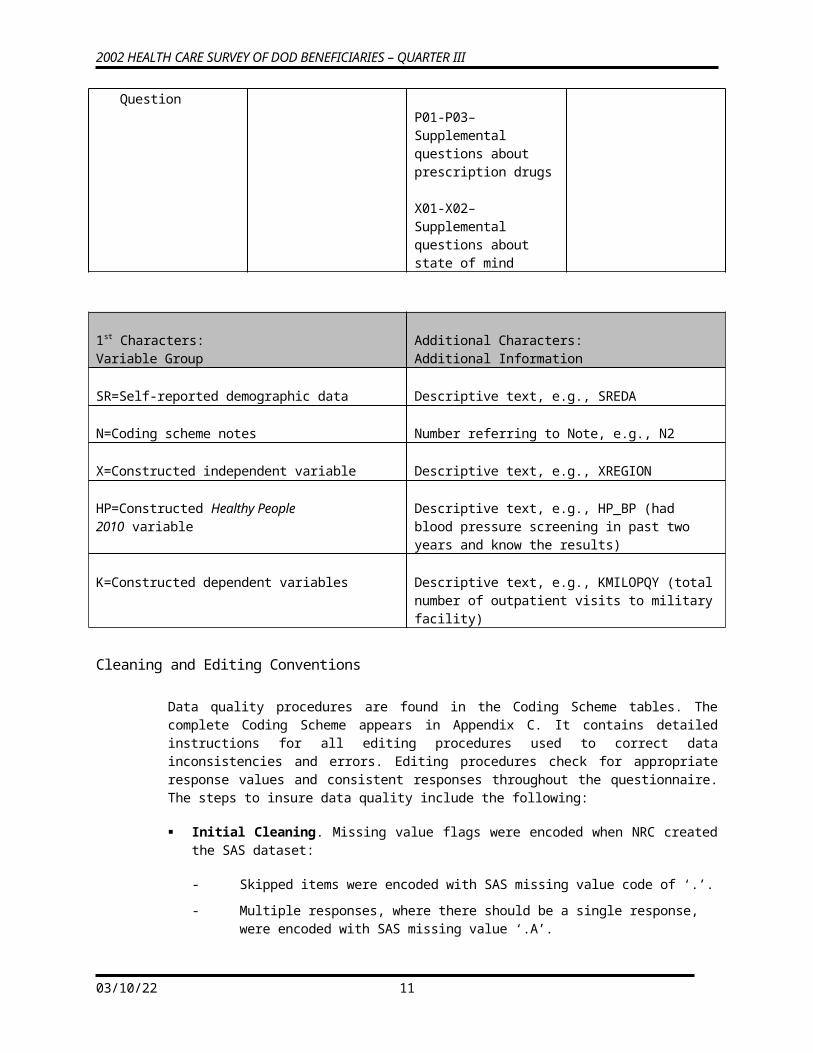
2002 HEALTH CARE SURVEY OF DOD BENEFICIARIES – QUARTER III
DATA StepThe DATA step is used to create permanent or temporary datasets. It is also used to create new variables, modify existing variables, and limit the number of variables or observations. In a DATA step, you can do any or all of the following activities:
Construct new variables. For example, to construct a variable of active duty by sex:
/* Active duty males */IF XSEXA = 1 AND XBNFGRP = 1 THEN XSEX_AD = 1; * Active duty females;ELSE IF XSEXA = 2 and XBNFGRP = 1 THEN XSEX_AD = 2;ELSE XSEX_AD = .; /* missing value */
[Note: the two methods to insert comments: enclosed within /* */ or beginning with * and ending with a semicolon]
Modify existing variables. For example, if the respondent is in region 7, the respondent will be placed in the combined region 7/8:
IF XREGION = 7 THEN XREGION = 8
Limit the number of variables. Use a KEEP statement:
KEEP XREGION CACSMPL H02056 H02017;
Limit the number of observations. Use a subsetting IF:
/* Keep only region 3 observations */IF XREGION = 3;
Create a new temporary dataset. For example, CAC_1 is a temporary file of observations for only those respondents in catchment area 1:
LIBNAME INFORMA 'F:\HCSDB02\FORMA';DATA CAC_1;/* Input file is HCSDB02 */SET INFORMA.HCSDB02;IF CACSMPL = 1;RUN;
Create a new permanent dataset. For example, OUT.CAC_9901 is a permanent dataset only of Region 1 out-of-catchment respondents:
LIBNAME INFORMA 'F:\HCSDB02\FORMA';LIBNAME OUT 'C:\HCSDB02\FORMA';DATA OUT.CAC_9901;SET INFORMA.HCSDB02;IF CACSMPL = 9901;RUN;
05/13/23 13
2002 HEALTH CARE SURVEY OF DOD BENEFICIARIES – QUARTER III
PROC TABULATE
PROC TABULATE produces summary statistics in a table layout. The table can have up to three dimensions: page, row, and column. Within any dimension, multiple variables can be reported one after another or hierarchically. Useful statistics that are available in PROC TABULATE include:
N number of observations with nonmissing values
NMISS number of observations with missing values
MEAN the arithmetic mean
SUM the sum
PCTN percent that one frequency represents of another frequency
PCTSUM percent that one sum represents of another sum
The essential elements to execute PROC TABULATE are outlined below (items within < > are not required):
PROC TABULATE DATA=your dataset <option list>;CLASS class variables;VAR analysis variables;TABLE << page expression, > row expression, > column expression </ table
options >;WEIGHT CWRWT;RUN;
If the input file is to be limited to a specific population, a separate DATA step can precede the TABULATE, or a WHERE statement can be used within the TABULATE procedure. For example, to create a table from only respondents in catchment area 1, you would use the following statement after the PROC TABULATE statement:
WHERE CACSMPL = 1;
CLASS variables are any variables that are used for grouping; variables such as XREGION, XSEXA, and CACSMPL are good examples of class variables. Class variables can be either character or numeric and typically have a discrete number of values. Unless MISSING is specified in the options list in the PROC TABULATE state, any observations with a missing CLASS variable will be dropped from the table.
The VAR statement identifies all analysis variables for a table. Analysis variables must be numeric and can be either discrete or continuous. SAS excludes missing values when computing statistics such as means and percentages.
The WEIGHT statement identifies the numeric variable whose value is used for weighting each analysis variable. In the HCSDB for 2002, the weight variable is WRWT.
The TABLE statement defines the table features. Every variable listed in this statement must be classified as either a class variable or an analysis variable in the CLASS or VAR statements. A comma separates each table dimension (page, row, and column). If there are three dimensions, the first is the page, the second is the row, and the last is the column. If there are only two dimensions, the first is the row and the second is the column. Tables with only one dimension are in column form. Each dimension expression is composed of the same following elements:
05/13/23 14
2002 HEALTH CARE SURVEY OF DOD BENEFICIARIES – QUARTER III
Analysis variables
Class variables
The universal class variable ALL, which summarizes the class variables in the same group or dimension
Keyword for the statistic to be performed, such as MEAN, SUM, or PCTSUM
A format modifier, which defines how to format values in cells. For example, F=8.2 will present values with a maximum of 8 positions and 2 digits to the right of the decimal.
Labels, which temporarily replace variable names and statistic keywords. These labels have the form ='label'; for example, XREGION='Region' or MEAN=' ' (to eliminate the word MEAN from the headings).
Crossing operator * (asterisk). The asterisk is used to cross elements within the same dimension. For example, you would use XENRLLMT*XSEXA to cross enrollment status by sex. The asterisk is also used to connect the statistic (e.g., MEAN, SUM) to the appropriate dimension; for example, to calculate the mean of respondents’ satisfaction with all health care in the last 12 months, you would use H02039 *MEAN.
Denominator definitions are enclosed by < > (brackets).
Concatenation operator is a single space between elements in a dimension. For example, to concatenate satisfaction with all health care in the last 12 months with satisfaction with health plan, you would use H02039 H02056.
Grouping is accomplished with parentheses. Below is an example of grouping, concatenation, and crossing within a single dimension:
(XBNFGRP ALL)*XSEXA
The SAS Display Manager System
The SAS Display Manager system provides an interactive tool for running SAS commands, like those given above, in the Windows environment. Double clicking the SAS icon on the desktop begins the SAS session. When you first enter the system, the following screen opens.
05/13/23 15
2002 HEALTH CARE SURVEY OF DOD BENEFICIARIES – QUARTER III
The screen is divided into three windows, each corresponding to an aspect of your SAS session. The Program Editor is the window where you compose, edit, and run your SAS commands. The Log window displays messages from the SAS system as well as your SAS statements as they are executed. Any error messages appear in the Log. The Output window displays the output tables requested in procedure commands written in the Program Editor. Toggling among the windows is accomplished by clicking anywhere in a given window. The cursor will jump to the selected window. Below are some options for customizing these screens by defining Preferences.
Clicking on Options results in the following screen.
05/13/23 16
2002 HEALTH CARE SURVEY OF DOD BENEFICIARIES – QUARTER III
Click on Preferences as highlighted above, and the following screen will open.
Many of these settings are system default options. To add a command line to the three windows, you would click in the box opposite Command Line, causing a check mark to appear in the box. Your screen should resemble the screen above. Click on Save and the screen will change to the following.
05/13/23 17
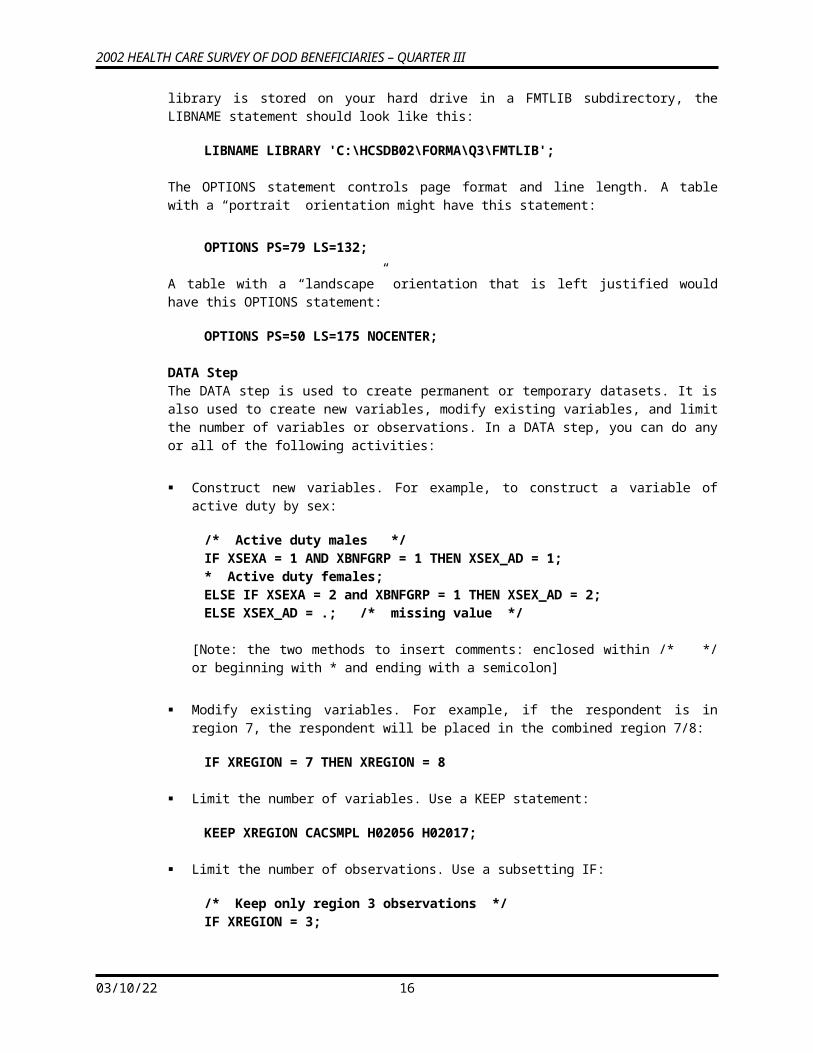
2002 HEALTH CARE SURVEY OF DOD BENEFICIARIES – QUARTER III
Each window shows the word Command followed by an arrow. Commands may be typed at this location. To arrive at the command line, depress the Home button on your keyboard. The cursor will appear opposite the arrow.
Toggling among the windows may be accomplished by typing the desired window name at the command line and pressing Enter. SAS recognizes Pgm as the abbreviated reference to the Program Editor and Out as a shortened name for the Output window. A few keystrokes allows you to navigate among the windows. For example, the command line lets you continue to customize our SAS session as follows.
In order to more easily distinguish between the SAS windows, it may be preferable to change the background color of selected windows. As an example, set the background color of the Log window to pink and the Output window to gray. Press the Home key to arrive at the command line. Type Log opposite the arrow to toggle to the Log window. Type the command, color back pink (or some other color) on the command line. Your screen will resemble the following.
Press Enter to process the commands and the window will shade to pink. Toggle to the Output window by typing Out and keying Enter. Type color back gray and key Enter. These changes make it easier to distinguish between the windows at a glance. The screen looks like the following.
05/13/23 18
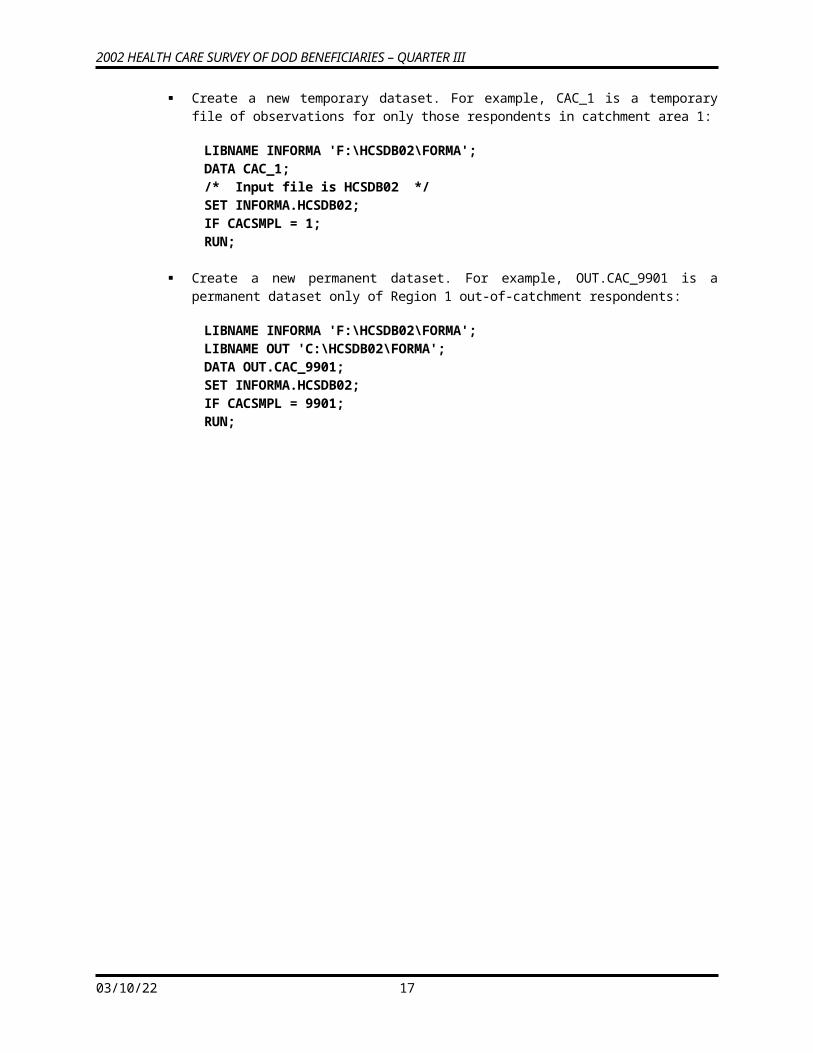
2002 HEALTH CARE SURVEY OF DOD BENEFICIARIES – QUARTER III
All SAS statements for building and processing SAS datasets are typed into the Program editor. A SAS session may involve typing statements like the ones above for library reference, computing new variables, data steps, etc. Entering a long series of statements in such a small space may be awkward, so another arrangement for the windows may be preferable.
Cascading the windows is one option. To cascade the windows, open the Window menu, and choose Cascade as indicated in the following.
The following option also uses color to distinguish between windows.
05/13/23 19
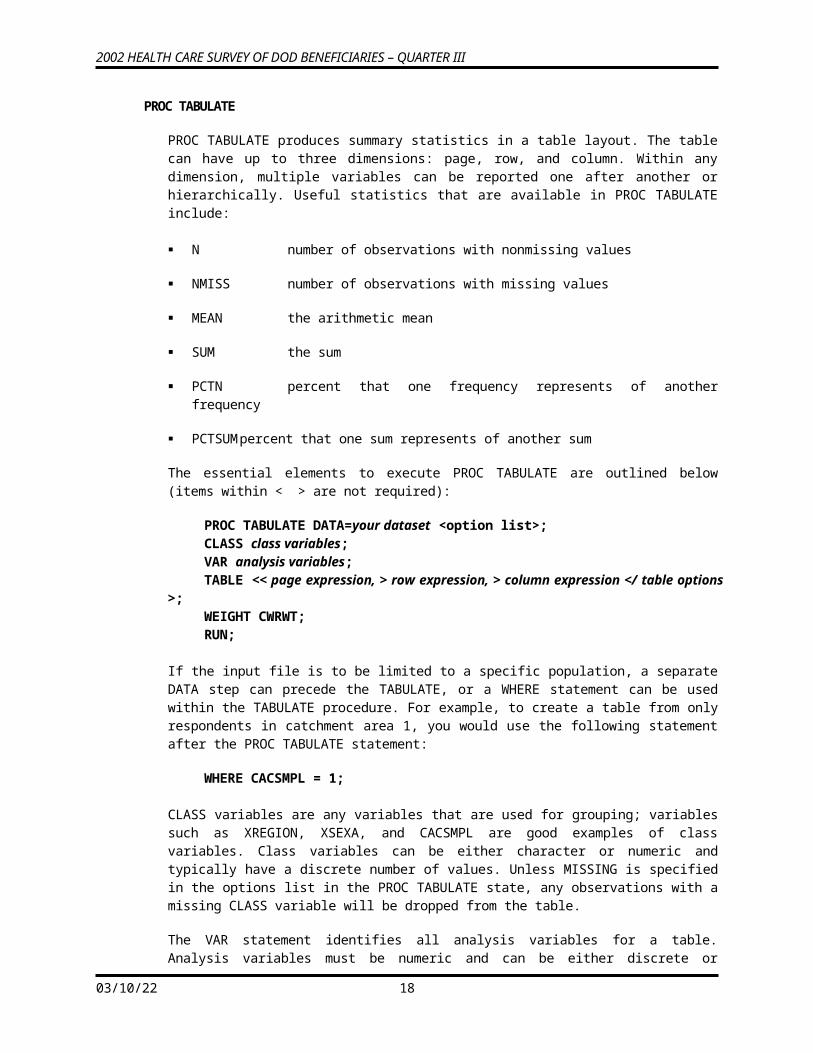
2002 HEALTH CARE SURVEY OF DOD BENEFICIARIES – QUARTER III
Clicking the option Cascade produces the following result.
Each window is partly superimposed on the other. The colors distinguish between windows at a glance. With the Program Editor in front, SAS statements may be typed there with relative ease.
05/13/23 20
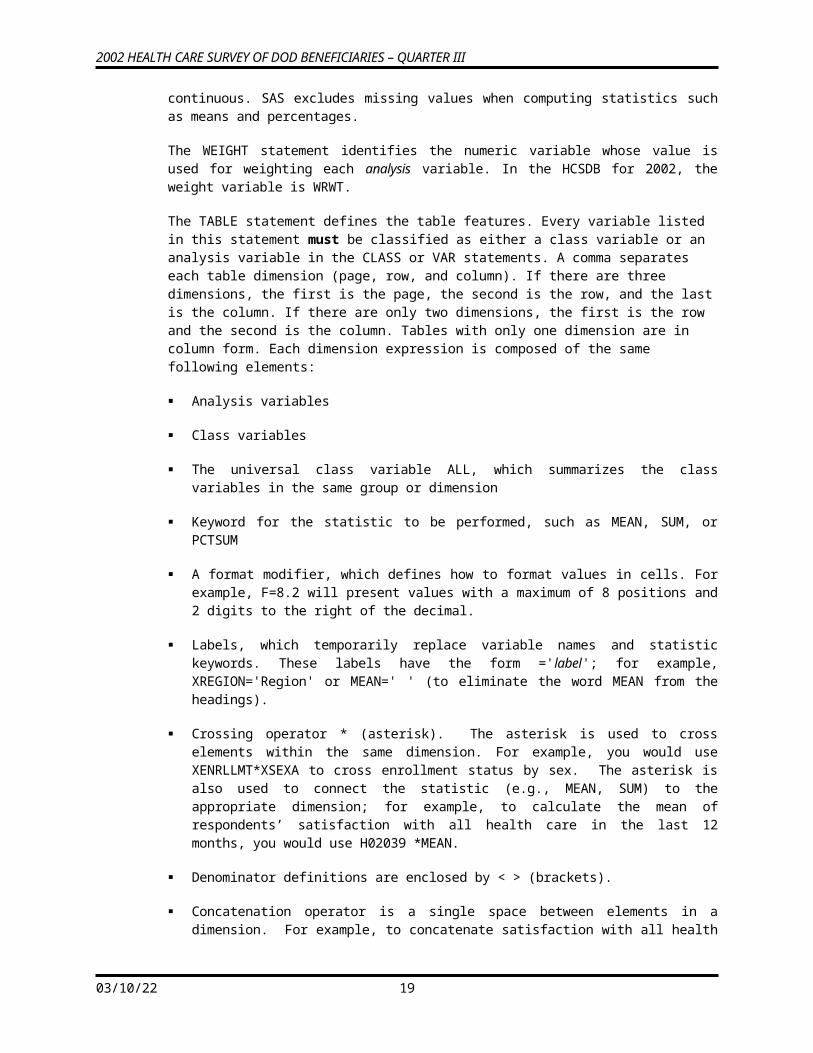
2002 HEALTH CARE SURVEY OF DOD BENEFICIARIES – QUARTER III
As a final option, you can enlarge the Program Editor to fill the entire screen. At the command line, type zoom as in the following:
The window changes to fill the screen.
One more option for customizing screens is explained below. This involves adding line numbers to the editing environment in the Program Window. After adding the line numbers, many useful line-editing commands become available (see the SAS Manual). On the Edit menu choose Options and Numbers as in the following screen.
05/13/23 21
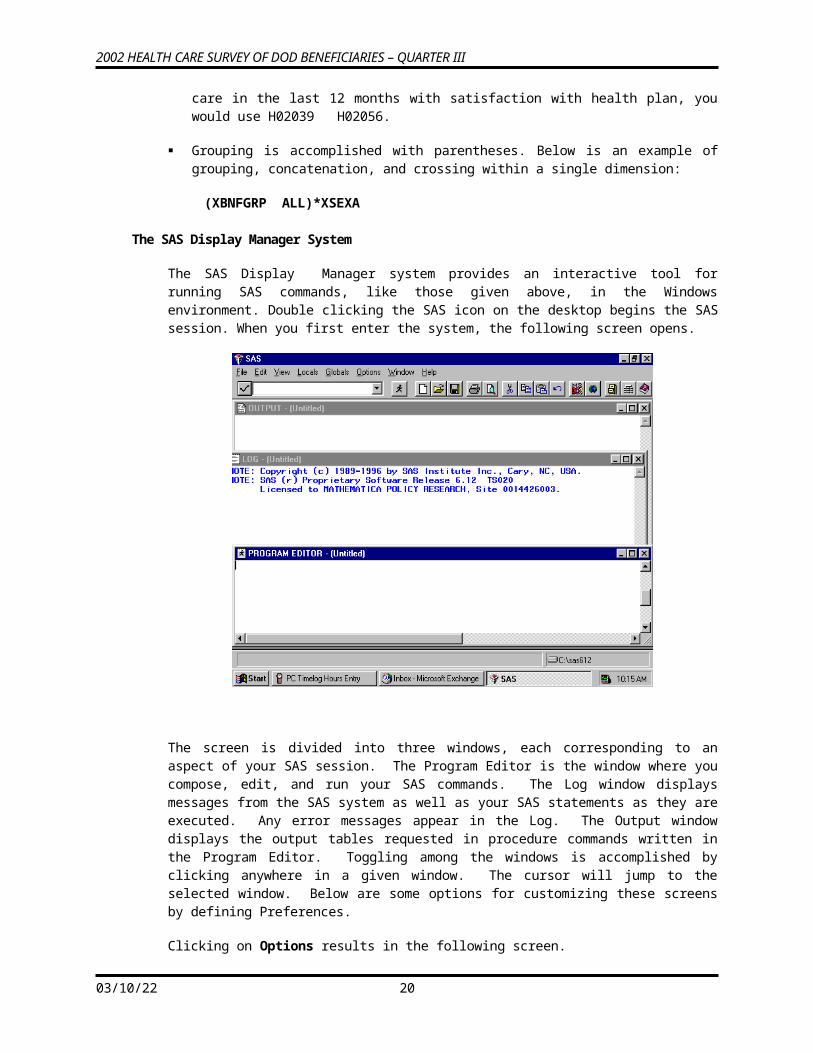
2002 HEALTH CARE SURVEY OF DOD BENEFICIARIES – QUARTER III
The line numbers appear at the left of the full screen Program Editor as in the screen below, and the SAS statements can be typed into the screen and edited.
Below is an example of a PROC TABULATE to construct a table of health care variables by beneficiary group by gender for respondents in Region 3. Beneficiary group (XBNFGRP) and sex
05/13/23 22
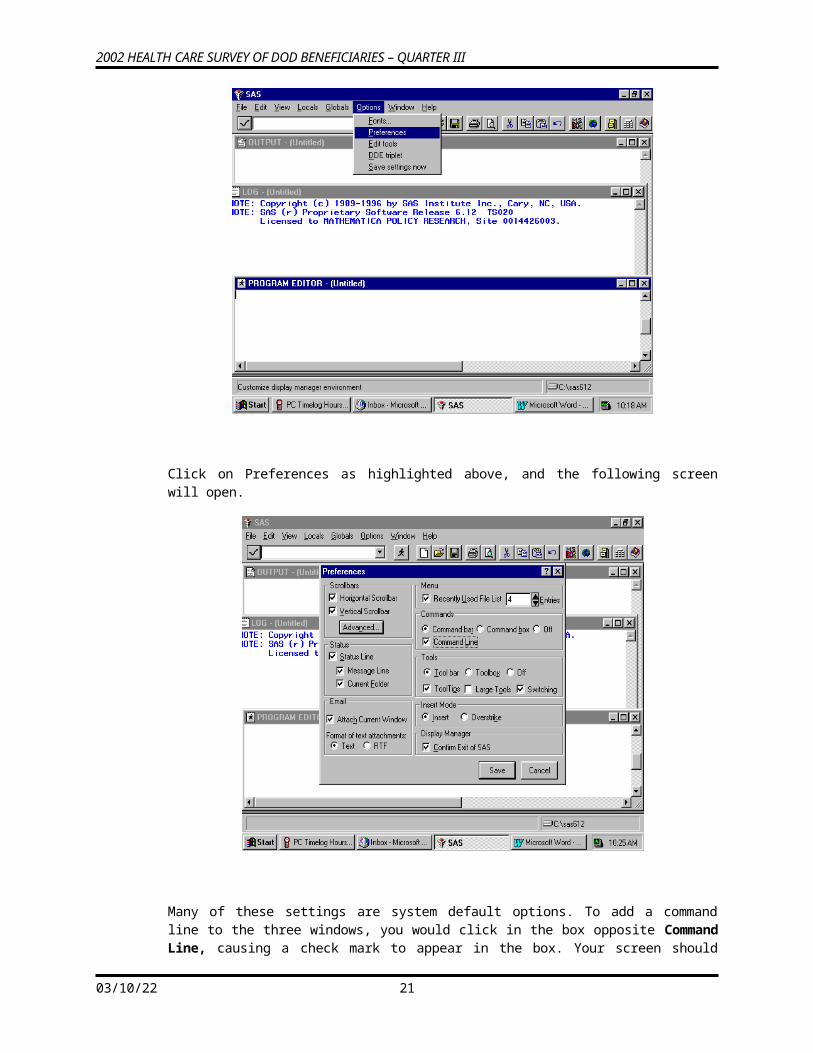
2002 HEALTH CARE SURVEY OF DOD BENEFICIARIES – QUARTER III
(XSEXA) are both class variables with a discrete number of values. The columns of the table are beneficiary group broken out by sex, a total for each beneficiary group, and a region total. The health care variables (H02056 and H02076) are the analysis variables appearing as the rows of the table. The statistic that we want to see is the weighted mean of these variables for each group in the table and for the entire region as a whole.
Enter the following SAS statements into the Program Editor.
OPTIONS PS=79 LS=95;LIBNAME IN 'C:\FILES\DoD\DATA 2002';LIBNAME LIBRARY ‘C:\FILES\DoD\DATA 2002\FMTLIB’;PROC TABULATE DATA=IN.HCS023_1;WHERE XREGION = 3; /* limit to Region 3 */CLASS XBNFGRP XSEXA;VAR H02056 H02076;WEIGHT CWRWT;TABLE (H02056 H02076)*MEAN, /* Row Dimension */
XBNFGRP*(XSEXA ALL) ALL; /* Column Dimension */TITLE “Table III-1”;TITLE2’ Constructed Beneficiary Group by Gender for Region 3';RUN;
Key Home and type the command SUBMIT on the Command Line. Submit instructs the SAS system to process the commands written in the Program Editor. Your screen should resemble the following.
Enter the Submit command, and the SAS statements disappear from the Program Editor.If a table is successfully produced, the Output window will open and the table will be displayed. If no output is produced, then SAS has encountered an error. SAS statements about the error can be seen and evaluated in the Log window. In all cases, the Log window should be carefully examined after SAS statements are processed. SAS may produce a table even if there are errors in the program, so the table may not be correct.
05/13/23 23
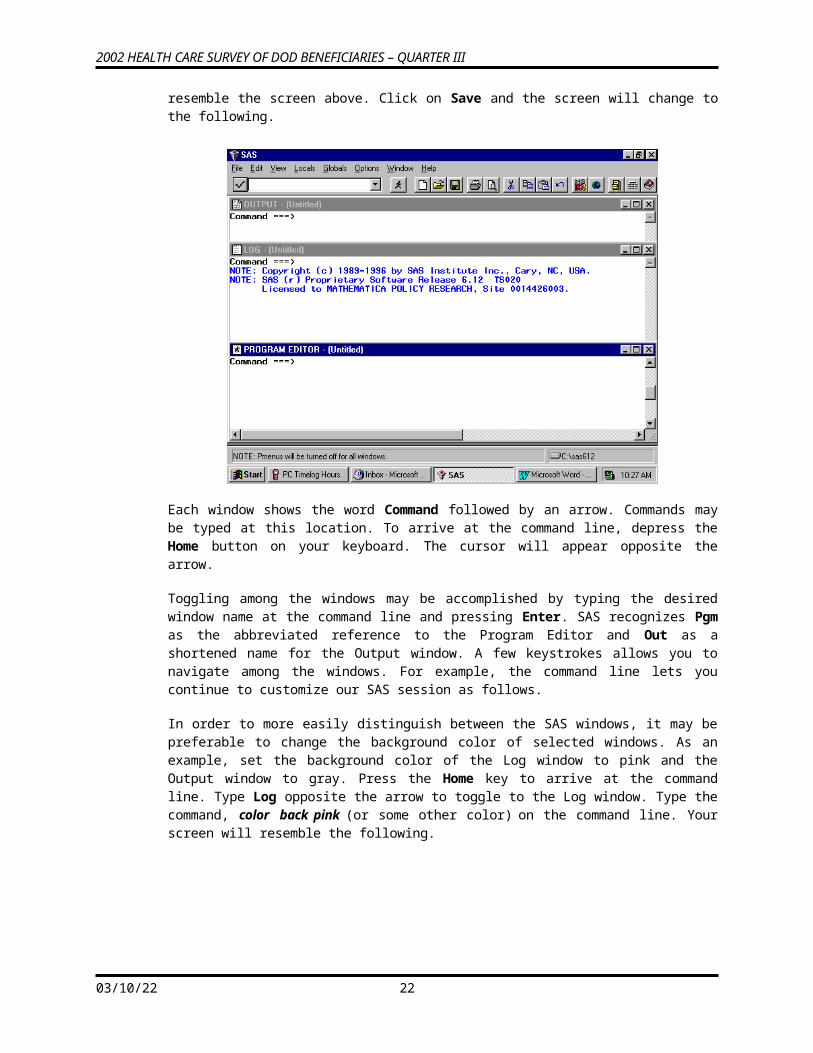
2002 HEALTH CARE SURVEY OF DOD BENEFICIARIES – QUARTER III
No table was produced for this run. The error is indicated in the Log Window as shown below.
The variable CWRWT was not found in the dataset. Type Pgm on the Command line to return to the Program Editor. Type Recall on the Command line and the program statements will reappear in the window.
You can correct the error by entering WRWT, the correct variable name, in the weight statement. Then, rerunning the procedure.
The corrected program produces the following output.
The result of this process is Table III.1.
05/13/23 24
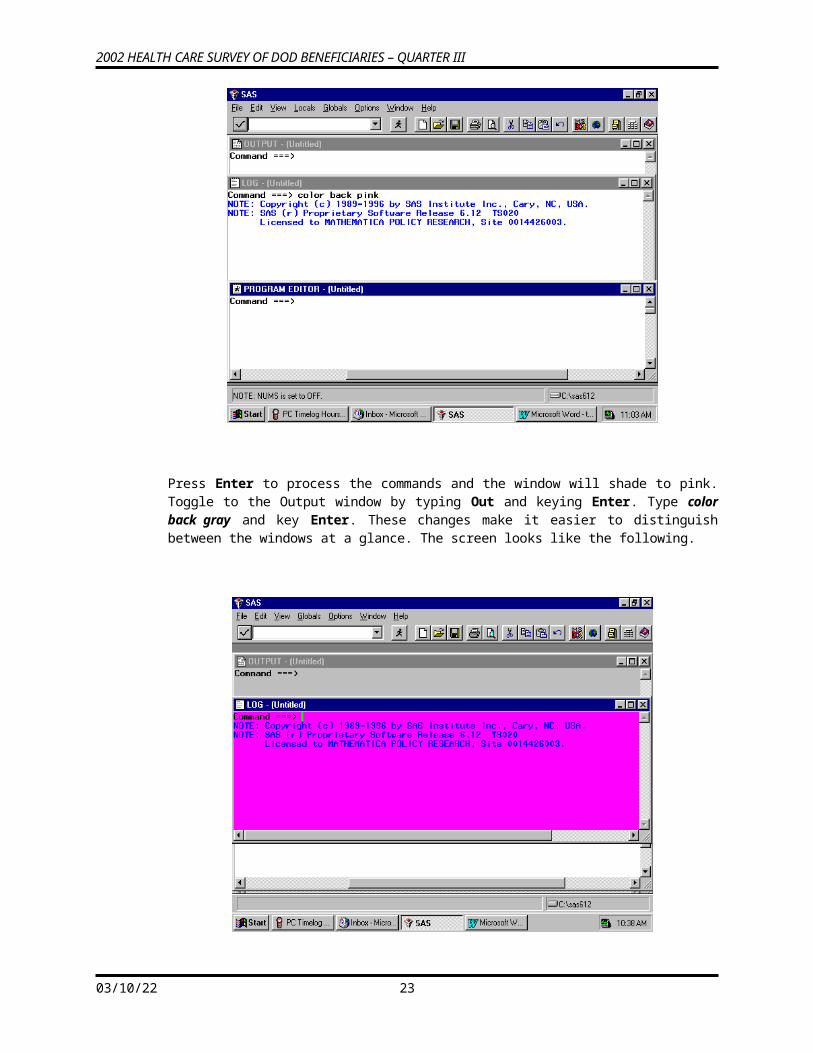
2002 HEALTH CARE SURVEY OF DOD BENEFICIARIES – QUARTER III
Note that the TITLE statement defines the heading for each page. Titles of more than one line are entered as TITLE, TITLE2, etc.
Using FormatsThe format library is the key to interpreting values of discrete variables. For example, in the program above, the format library found at C:\FILES\DoD\DATA 2002\FMTLIB indicates that a Value of 1 for XSEXA means male, and a value of 2 for XSEXA means female. Similarly, if XBNFGRP equals 1, the respondent is active duty; if XBNFGRP equals 2, the respondent is a family member of active duty personnel; if XBNFGRP equals 3, the respondent is an under-65 retiree or a survivor or one of their family members; if XBNFGRP equals 4, the respondent is a 65-or-over retiree, survivor, or one of their family members.
Since formats are associated with the variables in the HCSDB, formatting is automatic as long as SAS can locate the format library. Error messages will result if the LIBNAME LIBRARY statement is not present. If the format library is not available for some reason, use the statement
FORMAT _ALL_;
within the PROC TABULATE to prevent SAS from searching for the missing format library. The default formats in the format library were used to produce the table described in the previous section.
Table AppearanceFormat modifiers and temporary labels improve the appearance of a table. In Table III.1, the values of the statistics are of the form x.xx. If each cell is defined to be six positions wide with two positions to the right of the decimal, there is adequate space plus some extra room to keep the table from looking crowded. This is done by crossing the statistic with the format modifier:
MEAN*F=6.2
Labels are attached to all variables in the HCSDB. You can use temporary labels to override the label within the SAS dataset. It is not always necessary to use both the variable label and the formatted values for each value of a class variable. In the previous example, the formatted values of XBNFGRP are active duty, family members of active duty, etc. which we know to be beneficiary groups; the title also tells you that these are beneficiary groups. The table can be made attractive by deleting the heading for XBNFGRP by including a blank for the temporary label:
XBNFGRP=’ ‘
Similarly, because the statistic being reported here is a mean, you do not need MEAN on each row. You can add or eliminate a label and include a format modifier to the same variable:
MEAN=’ ‘*F=6.2
The headings for XSEXA and ALL can be improved:
XSEXA=’Gender’ALL=’Group Total’ for the ALL that is crossed with XBNFGRPALL=’Total’ for the Region 3 total
05/13/23 25
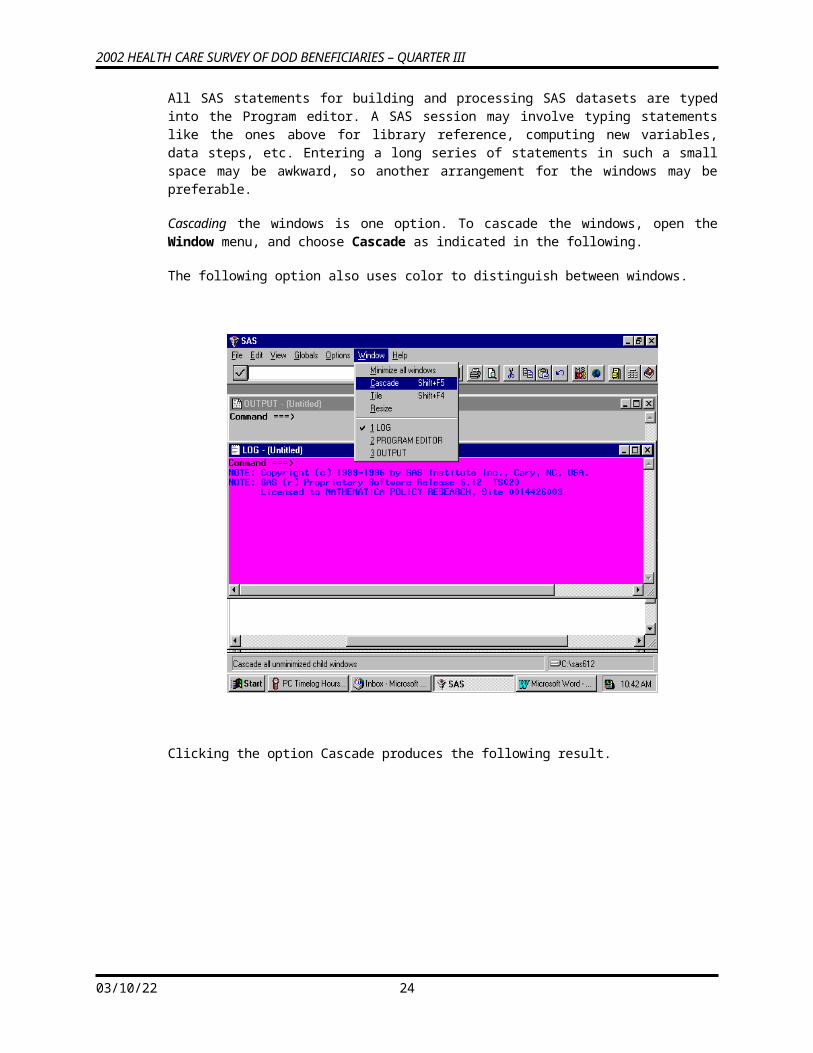
2002 HEALTH CARE SURVEY OF DOD BENEFICIARIES – QUARTER III
Table III.1 Constructed Beneficiary Group by Gender for Region 3
--------------------------------------------------------------------------------------- | | Constructed Beneficiary Group | | |----------------------------------------------------------------| | | Active Duty | Family of Active | | |--------------------------------------+-------------------------| | | Male or Female - R | | Male or Female - R | | |-------------------------| |-------------------------| | | Male | Female | ALL | Male | Female | |--------------------+------------+------------+------------+------------+------------| |Rating of|MEAN | | | | | | |all | | | | | | | |experien-| | | | | | | |ce with | | | | | | | |hlth plan| | 6.79| 6.77| 6.79| 7.30| 6.95| |---------+----------+------------+------------+------------+------------+------------| |In gnrl, |MEAN | | | | | | |how would| | | | | | | |you rate | | | | | | | |ovrall | | | | | | | |hlth | | 3.73| 3.51| 3.68| 3.55| 3.60| ---------------------------------------------------------------------------------------
(CONTINUED) Table III.1 Constructed Beneficiary Group by Gender for Region 3
--------------------------------------------------------------------------------------- | | Constructed Beneficiary Group | | |----------------------------------------------------------------| | | | |Ret/Surv/Fam| | | | | 65+ | | | | Ret/Surv/Fam <65 |------------| | | Family of |--------------------------------------| Male or | | | Active | Male or Female - R | |Female - R | | |------------+-------------------------| |------------| | | ALL | Male | Female | ALL | Male | |--------------------+------------+------------+------------+------------+------------| |Rating of|MEAN | | | | | | |all | | | | | | | |experien-| | | | | | | |ce with | | | | | | | |hlth plan| | 6.97| 7.51| 7.66| 7.58| 8.65| |---------+----------+------------+------------+------------+------------+------------| |In gnrl, |MEAN | | | | | | |how would| | | | | | | |you rate | | | | | | | |ovrall | | | | | | | |hlth | | 3.60| 3.21| 3.41| 3.31| 3.08| ---------------------------------------------------------------------------------------
(CONTINUED) Table III.1 Constructed Beneficiary Group by Gender for Region 3
------------------------------------------------------------- | | Constructed Beneficiary | | | | Group | | | |-------------------------| | | | Ret/Surv/Fam 65+ | | | |-------------------------| | | | Male or | | | | |Female - R | | | | |------------| | | | | Female | ALL | ALL | |--------------------+------------+------------+------------| |Rating of|MEAN | | | | |all | | | | | |experien-| | | | | |ce with | | | | | |hlth plan| | 8.80| 8.73| 7.73| |---------+----------+------------+------------+------------|
05/13/23 26
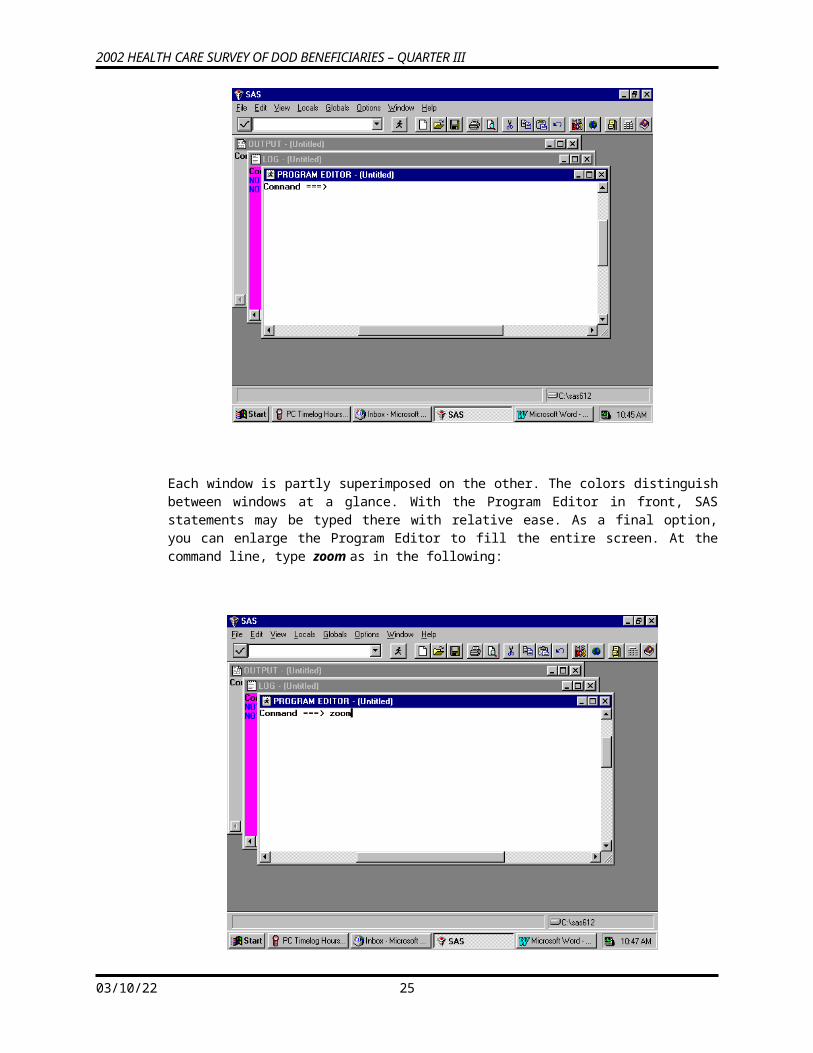
2002 HEALTH CARE SURVEY OF DOD BENEFICIARIES – QUARTER III
|In gnrl, |MEAN | | | | |how would| | | | | |you rate | | | | | |ovrall | | | | | |hlth | | 2.98| 3.03| 3.32| -------------------------------------------------------------
The new program looks like this:
OPTIONS PS=79 LS=95;LIBNAME IN 'C:\FILES\DoD\DATA 2002';LIBNAME LIBRARY ‘C:\FILES\DoD\DATA 2002\FMTLIB’;PROC TABULATE DATA=IN.HCS023_1;WHERE XREGION = 3; /* limit to Region 3 */CLASS XBNFGRP XSEXA;VAR H02056 H02076;WEIGHT WRWT;TABLE (H02056 H02076)*MEAN=’ ‘*F=6.2, /* Row Dimension */
/* Column Dimension */XBNFGRP=’ ‘*(XSEXA=’Gender’ ALL=’Group Total’) ALL=’Total’;
TITLE “Table III.2”;TITLE2 ‘Constructed Beneficiary Group by Gender for Region 3';RUN;
Typing these statements into the Program Window produces the following screen.
After the Submit command is entered, the following table is displayed in the Output window.
05/13/23 27
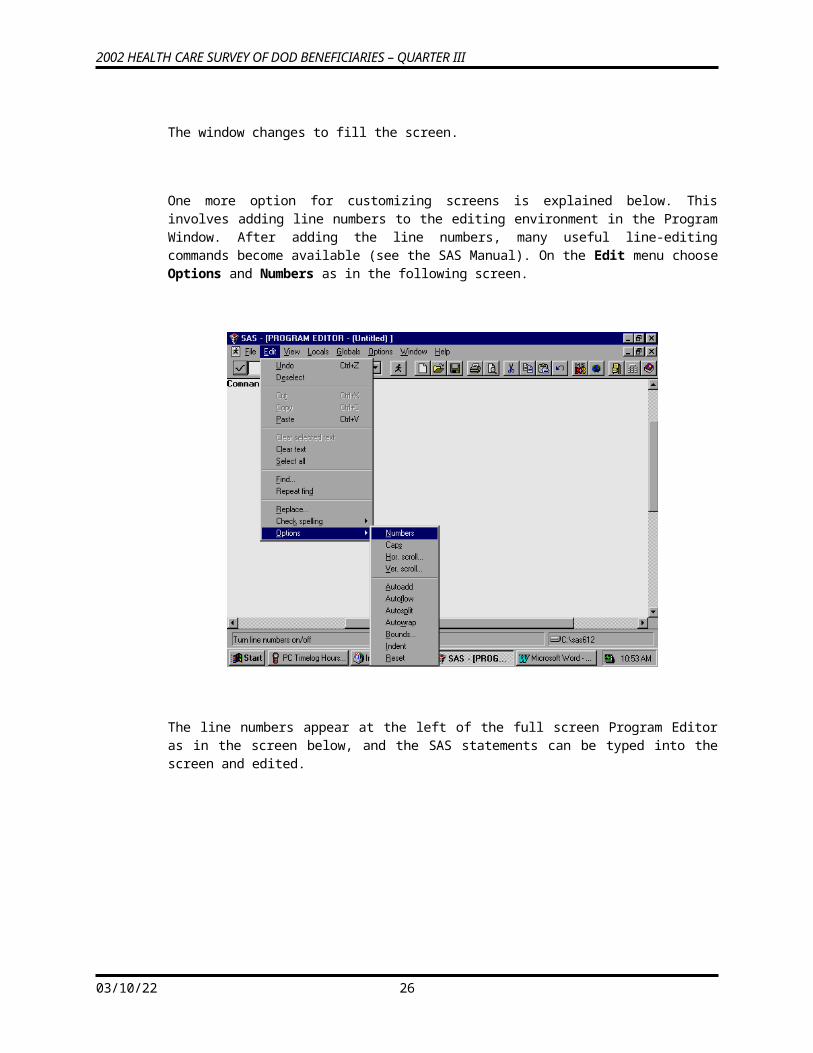
2002 HEALTH CARE SURVEY OF DOD BENEFICIARIES – QUARTER III
The resulting output is in Table III.2.
Table III.2 Constructed Beneficiary Group by Gender for Region 3
------------------------------------------------------------------------------------- | | Active Duty | Family of Active | Ret/Surv/Fam <65 | | |--------------------+--------------------+--------------------| | | Gender | | Gender | | Gender | | | |-------------|Group |-------------|Group |-------------|Group | | | Male |Female|Total | Male |Female|Total | Male |Female|Total | |--------------------+------+------+------+------+------+------+------+------+------| |Rating of| | | | | | | | | | | |all | | | | | | | | | | | |experien-| | | | | | | | | | | |ce with | | | | | | | | | | | |hlth plan| | 6.79| 6.77| 6.79| 7.30| 6.95| 6.97| 7.51| 7.66| 7.58| |---------+----------+------+------+------+------+------+------+------+------+------| |In gnrl, | | | | | | | | | | | |how would| | | | | | | | | | | |you rate | | | | | | | | | | | |ovrall | | | | | | | | | | | |hlth | | 3.73| 3.51| 3.68| 3.55| 3.60| 3.60| 3.21| 3.41| 3.31| -------------------------------------------------------------------------------------
(CONTINUED) Table III.2 Constructed Beneficiary Group by Gender for Region 3
-------------------------------------------------- | | Ret/Surv/Fam 65+ | | | |--------------------| | | | Gender | | | | |-------------|Group | | | | Male |Female|Total |Total | |--------------------+------+------+------+------| |Rating of| | | | | | |all | | | | | | |experien-| | | | | | |ce with | | | | | | |hlth plan| | 8.65| 8.80| 8.73| 7.73| |---------+----------+------+------+------+------| |In gnrl, | | | | | | |how would| | | | | | |you rate | | | | | |
05/13/23 28
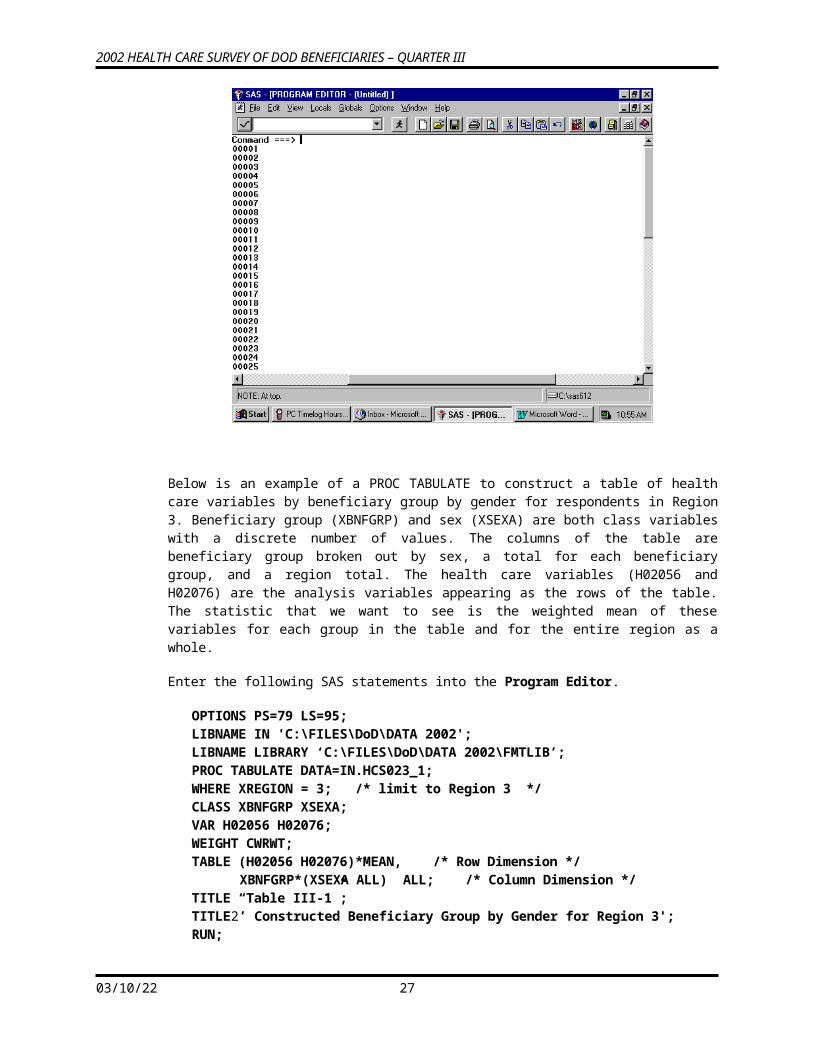
2002 HEALTH CARE SURVEY OF DOD BENEFICIARIES – QUARTER III
|ovrall | | | | | | |hlth | | 3.08| 2.98| 3.03| 3.32| --------------------------------------------------
Although the label for MEAN is deleted, there is still a space in the table for this label. You can eliminate this blank space by using the TABLE option of ROW=FLOAT. SAS row headings are automatically allocated; you can override this by using the TABLE option of RTS=n where n is an integer value specifying the number of print positions to be used for row headings. If you decide that we don’t need the label ‘Gender’ for XSEXA because ‘male’ and ‘female’ are self-explanatory, the revised program is as follows:
OPTIONS PS=79 LS=95;LIBNAME IN ‘C:\FILES\DoD\DATA 2002’;LIBNAME LIBRARY ‘C:\FILES\DoD\DATA 2002\FMTLIB’;PROC TABULATE DATA=IN.HCS023_1;WHERE XREGION = 3; /* limit to Region 3 */CLASS XBNFGRP XSEXA;VAR H02056 H02076;WEIGHT WRWT;TABLE (H02056 H02076)*MEAN=’ ‘*F=6.2, /* Row Dimension *//* Column Dimension */XBNFGRP=’ ‘*(XSEXA=’ ’ ALL=’Group Total’) ALL=’Total’ / ROW=FLOAT RTS=32; Title “Table III.3”;
TITLE2’ Constructed Beneficiary Group by Gender for Region 3';RUN;
Typed into the Program Window, the revised program appears as follows.
The output table is displayed in the Output Window as follows.
05/13/23 29
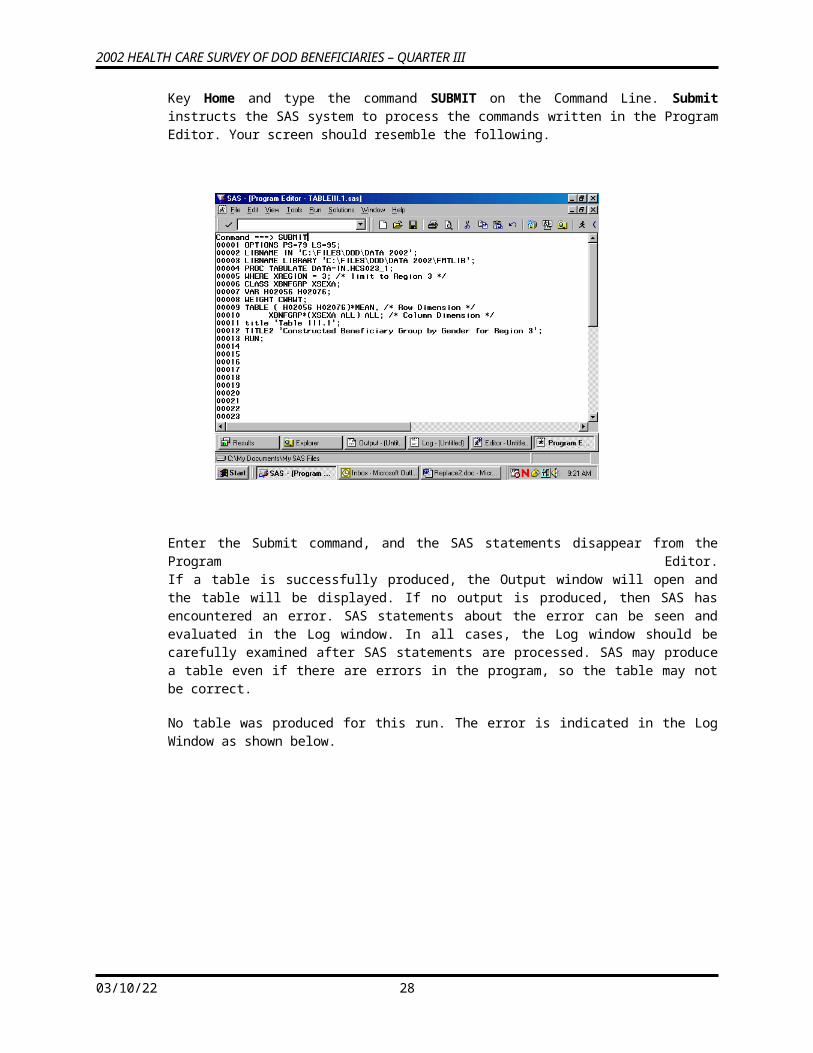
2002 HEALTH CARE SURVEY OF DOD BENEFICIARIES – QUARTER III
The result is Table III.3.
Table III.3 Constructed Beneficiary Group by Gender for Region 3
---------------------------------------------------------------------------------------- | | Active Duty | Family of Active |Ret/Surv/Fam | | |--------------------+--------------------| <65 | | | | |Group | | |Group |-------------| | | Male |Female|Total | Male |Female|Total | Male |Female| |------------------------------+------+------+------+------+------+------+------+------| |Rating of all experience with | | | | | | | | | |hlth plan | 6.79| 6.77| 6.79| 7.30| 6.95| 6.97| 7.51| 7.66| |------------------------------+------+------+------+------+------+------+------+------| |In gnrl, how would you rate | | | | | | | | | |ovrall hlth | 3.73| 3.51| 3.68| 3.55| 3.60| 3.60| 3.21| 3.41| ----------------------------------------------------------------------------------------
(CONTINUED) Table III.3 Constructed Beneficiary Group by Gender for Region 3
------------------------------------------------------------------- | |Ret/S-| | | | |urv/F-| | | | |am <65| Ret/Surv/Fam 65+ | | | |------+--------------------| | | |Group | | |Group | | | |Total | Male |Female|Total |Total | |------------------------------+------+------+------+------+------| |Rating of all experience with | | | | | | |hlth plan | 7.58| 8.65| 8.80| 8.73| 7.73| |------------------------------+------+------+------+------+------| |In gnrl, how would you rate | | | | | | |ovrall hlth | 3.31| 3.08| 2.98| 3.03| 3.32| -------------------------------------------------------------------
05/13/23 30
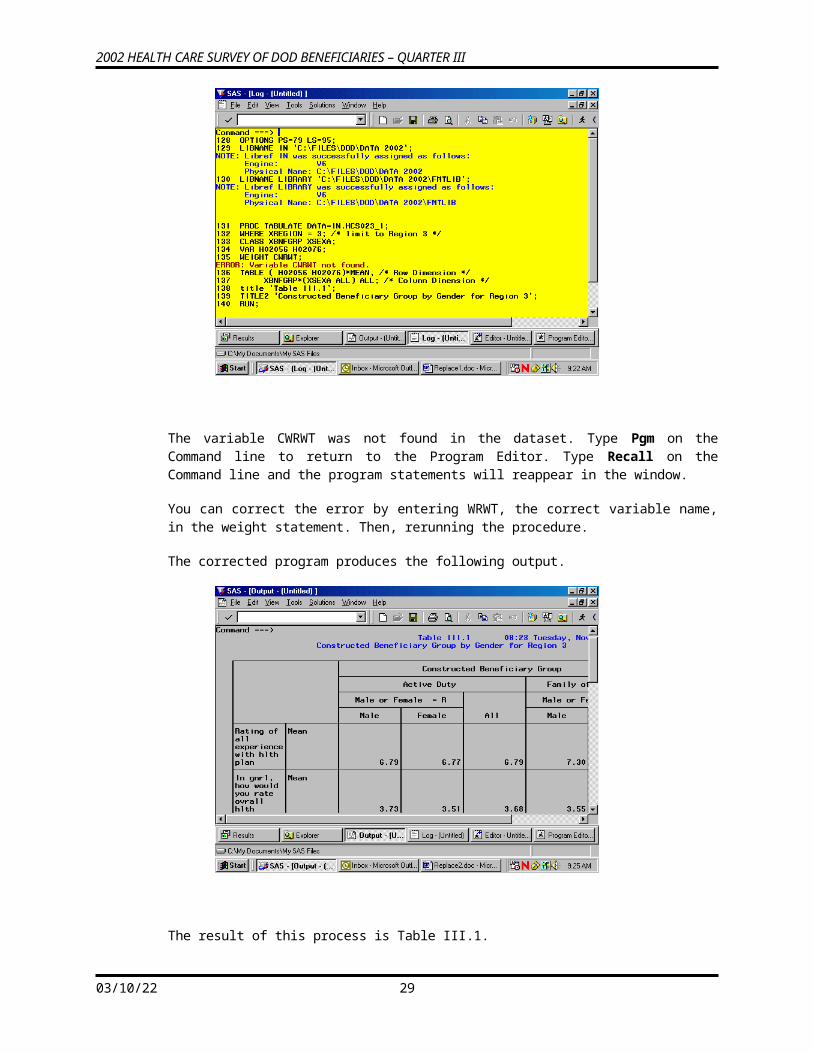
2002 HEALTH CARE SURVEY OF DOD BENEFICIARIES – QUARTER III
Calculating PercentsWhen calculating percentages, it is necessary to appropriately define the denominator. To calculate a column percentage, the denominator definition must include all class variables that define the row. For example, if you want to look at the percentage of people in your region and each of the catchment areas who answered yes (or no) to question 17, ‘In the last 12 months, did you see a specialist?', your TABLE statement in the TABULATE procedure would look like this:
WHERE XREGION = 6;
TABLE H02017 ALL=’Total’,
(All=’Region Total’ CACSMPL)*PCTN<H02017 ALL>=’Percent’;
Table III.4 includes a program and its output for calculating column percentages. The program statements in the Program Editor appear as follows.
The submitted statements produce the following output.
05/13/23 31
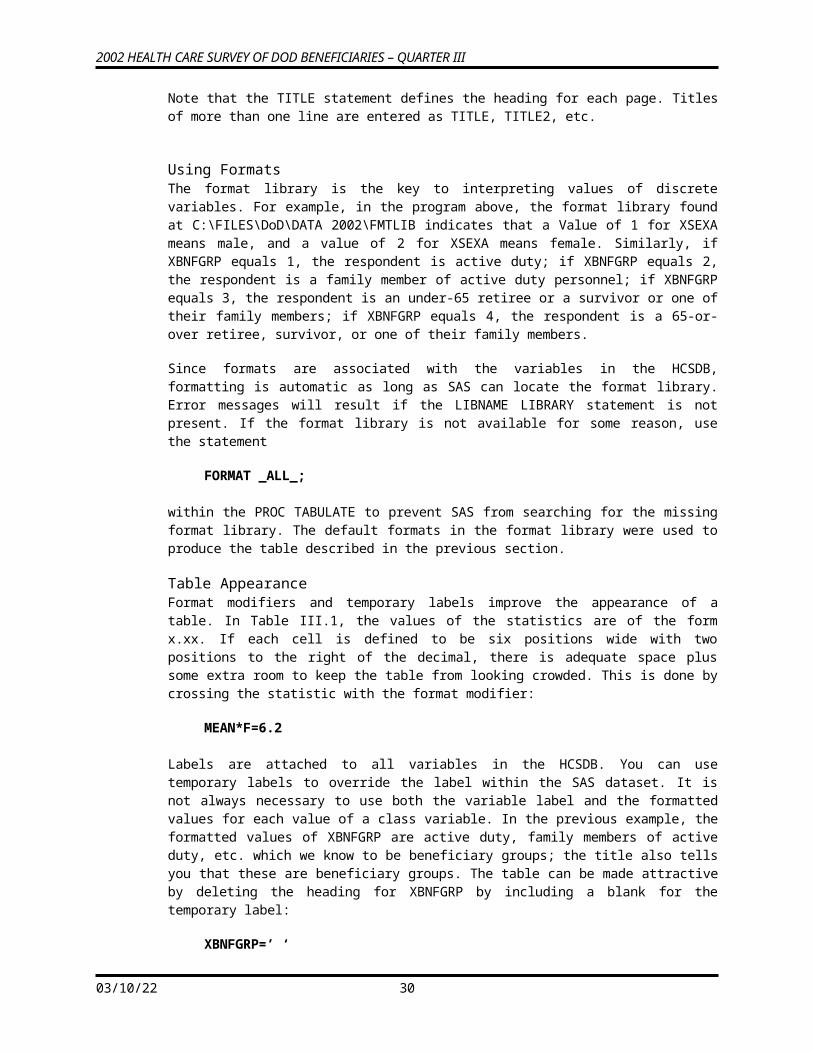
2002 HEALTH CARE SURVEY OF DOD BENEFICIARIES – QUARTER III
Table III.4 People Who Saw a Specialist in the Last 12 Months for Region 6 Catchment Areas
------------------------------------------------------------------------------------------| | |Little Rock | Barksdale | | || |Region Total| AFB | AFB | Ft. Polk | Tinker AFB || |------------+------------+------------+------------+------------|| | # | % | # | % | # | % | # | % | # | % ||-----------------------+-----+------+-----+------+-----+------+-----+------+-----+------||In lst yr:did you see a| | | | | | | | | | ||specialist | | | | | | | | | | ||-----------------------| | | | | | | | | | ||Yes | 871| 54.03| 62| 55.36| 37| 42.53| 34| 44.16| 65| 52.85||-----------------------+-----+------+-----+------+-----+------+-----+------+-----+------||No | 741| 45.97| 50| 44.64| 50| 57.47| 43| 55.84| 58| 47.15||-----------------------+-----+------+-----+------+-----+------+-----+------+-----+------||Total | 1612|100.00| 112|100.00| 87|100.00| 77|100.00| 123|100.00|------------------------------------------------------------------------------------------
(CONTINUED) Table III.4 People Who Saw a Specialist in the Last 12 Months for Region 6 Catchment Areas
------------------------------------------------------------------------------------------| | | Brooke AMC-| | | Laughlin || | | Ft. Sam | | |AFB/Sheppard|| | Ft. Sill | Houston | Ft. Hood | Dyess AFB | AFB || |------------+------------+------------+------------+------------|| | # | % | # | % | # | % | # | % | # | % ||-----------------------+-----+------+-----+------+-----+------+-----+------+-----+------||In lst yr:did you see a| | | | | | | | | | ||specialist | | | | | | | | | | ||-----------------------| | | | | | | | | | ||Yes | 54| 55.67| 81| 51.92| 82| 50.93| 46| 42.20| 55| 55.56||-----------------------+-----+------+-----+------+-----+------+-----+------+-----+------||No | 43| 44.33| 75| 48.08| 79| 49.07| 63| 57.80| 44| 44.44||-----------------------+-----+------+-----+------+-----+------+-----+------+-----+------||Total | 97|100.00| 156|100.00| 161|100.00| 109|100.00| 99|100.00|------------------------------------------------------------------------------------------
05/13/23 32
2002 HEALTH CARE SURVEY OF DOD BENEFICIARIES – QUARTER III
(CONTINUED) Table III.4 People Who Saw a Specialist in the Last 12 Months for Region 6 Catchment Areas
----------------------------------------------------------------------------- | | | NH Corpus | |Out/Area-Reg| | |Lackland AFB| Christi |Randolph AFB| 6 | | |------------+------------+------------+------------| | | # | % | # | % | # | % | # | % | |-----------------------+-----+------+-----+------+-----+------+-----+------| |In lst yr:did you see a| | | | | | | | | |specialist | | | | | | | | | |-----------------------| | | | | | | | | |Yes | 71| 55.47| 47| 48.45| 78| 62.90| 159| 65.70| |-----------------------+-----+------+-----+------+-----+------+-----+------| |No | 57| 44.53| 50| 51.55| 46| 37.10| 83| 34.30| |-----------------------+-----+------+-----+------+-----+------+-----+------| |Total | 128|100.00| 97|100.00| 124|100.00| 242|100.00| -----------------------------------------------------------------------------
The statistic N is included with PCTN to make it easier to verify that the denominator definitions have been set up properly. After you check to see that the percentages are accurate, the N statistic can be removed. Note that the output for Table III.4 is unweighted. The N statistic (and PCTN statistic) is always unweighted even if a WEIGHT statement is included.
Similarly, if you want to look at the percentage of TRICARE enrollees (and non-enrollees) by gender who answered yes to question 17, this would be a row percentage. To calculate a row percentage, the denominator definition must include all class variables that define the column. Your TABLE statement would look like this:
TABLE H02017 ALL=’Total’,XENRLLMT *(XSEXA=’ ‘ All=’Group Total’)*PCTN<XENRLLMT*XSEXA XENRLLMT*ALL>=’Percent’;
Notice that there are no parentheses used in the denominator definition. Because parenthetical groupings are not allowed in the denominator definition, all crossings and concatenations must be included. As noted above, the N and PCTN statistic are unweighted counts of CLASS variables. If you want to produce a weighted count and percentage for this table, you would include WRWT (the 2002 weight variable) as an analysis variable in the VAR statement and in the column crossing of the TABLE statement; the statistics to be generated should be specified as SUM and PCTSUM. A program and output to demonstrate weighted row percentages appears in Table III.5.
05/13/23 33
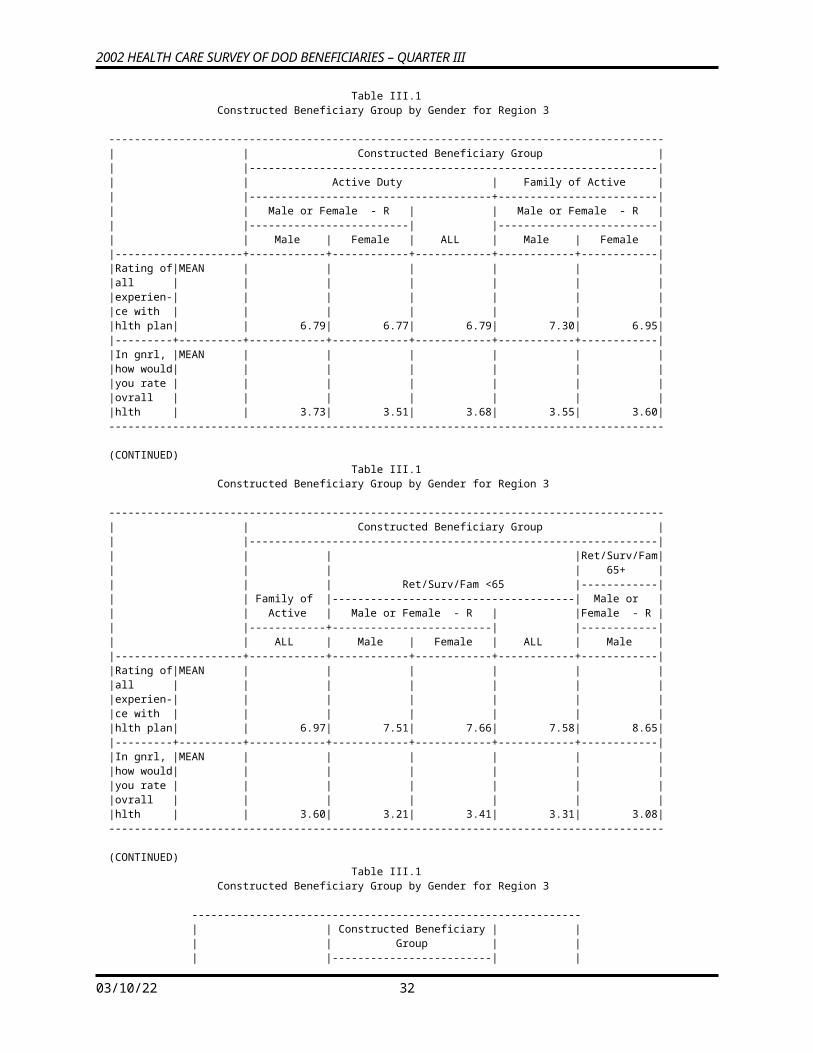
2002 HEALTH CARE SURVEY OF DOD BENEFICIARIES – QUARTER III
The following screen shows the new program typed into the Program Editor.
These commands produce the following output.
Here, as above, the SUM statistic is included to help determine the accuracy of the denominator definition.
05/13/23 34
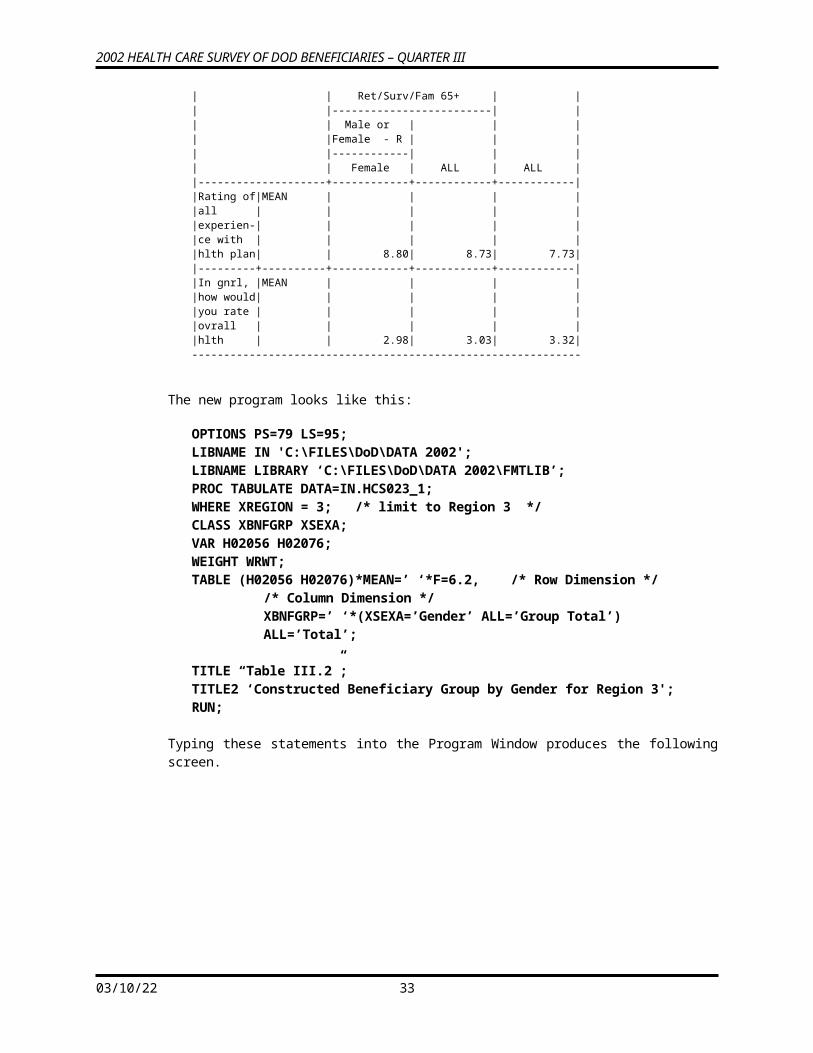
2002 HEALTH CARE SURVEY OF DOD BENEFICIARIES – QUARTER III
Additional information about running SAS is available from the SAS Institute. Please consult the appropriate manuals for more detailed information.
See Table III.5 to view the entire table.
Table III.5 People Who Saw a Specialist in the Last 12 Months by TRICARE Prime Enrollment and Gender Region 6 Only
---------------------------------------------------------------------------------------- | | | Enrolled - under 65 | | | Active Duty - under 65 |--------------------------------| | |--------------------------------------| | |Group | | | Male | Female |Group Total | Male | Female |Total | | |------------+------------+------------+------------+------------+------| | | # | % | # | % | # | % | # | % | # | % | # | |--------------+------+-----+------+-----+------+-----+------+-----+------+-----+------| |In lst yr:did | | | | | | | | | | | | |you see a | | | | | | | | | | | | |specialist | | | | | | | | | | | | |--------------| | | | | | | | | | | | |Yes | 49853|10.87| 19211| 4.19| 69064|15.05| 38105| 8.31| 72798|15.87|110903| |--------------+------+-----+------+-----+------+-----+------+-----+------+-----+------| |No | 87622|26.76| 16983| 5.19|104605|31.95| 30819| 9.41| 66242|20.23| 97061| |--------------+------+-----+------+-----+------+-----+------+-----+------+-----+------| |Total |137476|17.49| 36194| 4.60|173669|22.09| 68924| 8.77|139040|17.69|207964| ----------------------------------------------------------------------------------------
(CONTINUED) Table III.5 People Who Saw a Specialist in the Last 12 Months by TRICARE Prime Enrollment and Gender Region 6 Only
--------------------------------------------------------------------------------------- | |Enro-| | | | |lled | | | | |under| | | | | 65 | | | | |-----| Not enrolled - under 65 |Not enrolled - 65 or over| | |Group|--------------------------------------+-------------------------| | |Total| Male | Female |Group Total | Male | Female | | |-----+------------+------------+------------+------------+------------| | | % | # | % | # | % | # | % | # | % | # | % | |--------------+-----+------+-----+------+-----+------+-----+------+-----+------+-----| |In lst yr:did | | | | | | | | | | | | |you see a | | | | | | | | | | | | |specialist | | | | | | | | | | | | |--------------| | | | | | | | | | | | |Yes |24.17| 56653|12.35| 74981|16.34|131635|28.69| 72991|15.91| 74157|16.17| |--------------+-----+------+-----+------+-----+------+-----+------+-----+------+-----| |No |29.65| 34467|10.53| 33413|10.21| 67880|20.73| 27909| 8.52| 29956| 9.15| |--------------+-----+------+-----+------+-----+------+-----+------+-----+------+-----| |Total |26.45| 91120|11.59|108394|13.79|199515|25.38|100900|12.83|104113|13.24| ---------------------------------------------------------------------------------------
(CONTINUED) Table III.5 People Who Saw a Specialist in the Last 12 Months by TRICARE Prime Enrollment and Gender Region 6 Only
----------------------------- | |Not enrolled| | | 65 or over | | |------------| | |Group Total | | |------------| | | # | % | |--------------+------+-----| |In lst yr:did | | | |you see a | | |
05/13/23 35
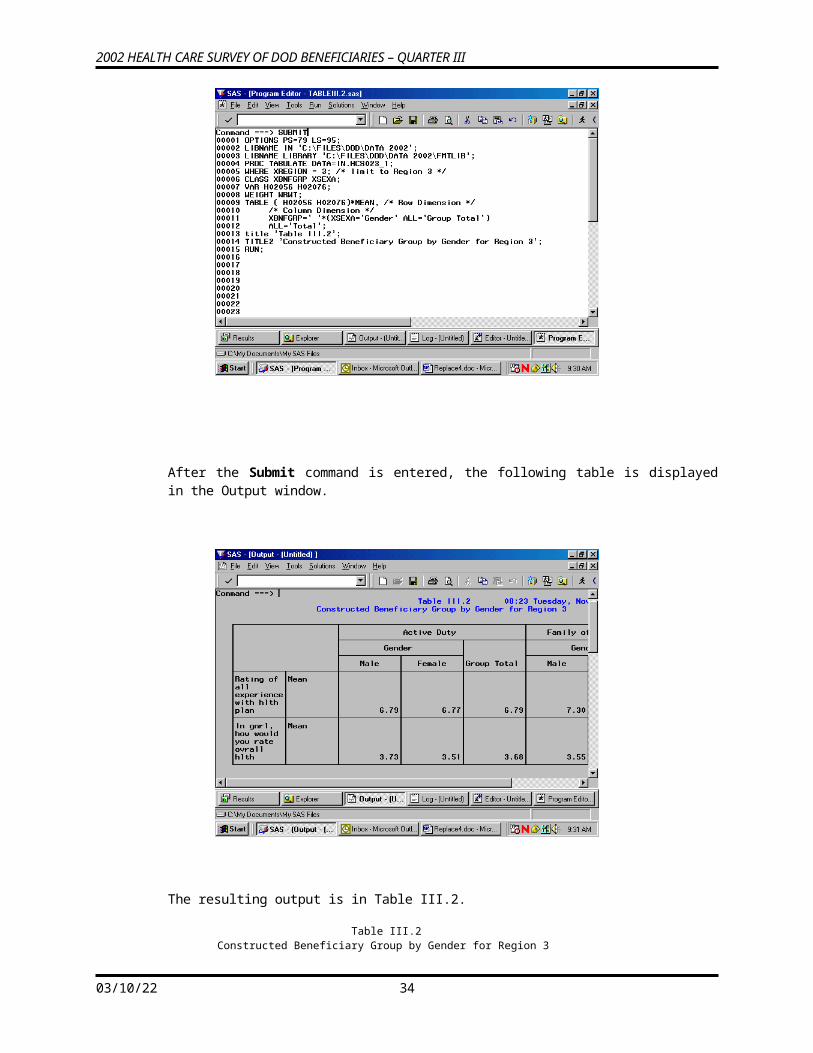
2002 HEALTH CARE SURVEY OF DOD BENEFICIARIES – QUARTER III
|specialist | | | |--------------| | | |Yes |147148|32.08| |--------------+------+-----| |No | 57865|17.67| |--------------+------+-----| |Total |205013|26.08| -----------------------------
How to Make a Table Using SPSS
The 2002 Adult HCSDB dataset is in an SPSS format. SPSS is a computer software system used for data management, summarization, and analysis. SPSS can be run interactively, using menus, or in batch mode, using syntax commands. This guide instructs users on how to use SPSS dialog boxes to:
Construct new variables
Recode existing variables
Select cases for analysis
Weight cases for analysis
Create customized tables
As you use the dialog boxes, you generate syntax automatically. This syntax may be pasted into a syntax file for future use or for modification.
Locating and opening the data file
To begin an SPSS session, double click on the SPSS icon on your desktop. The Data Editor window will open and present a blank spreadsheet like the following screen:
Click on File in the upper left corner to open the following menu:
05/13/23 36
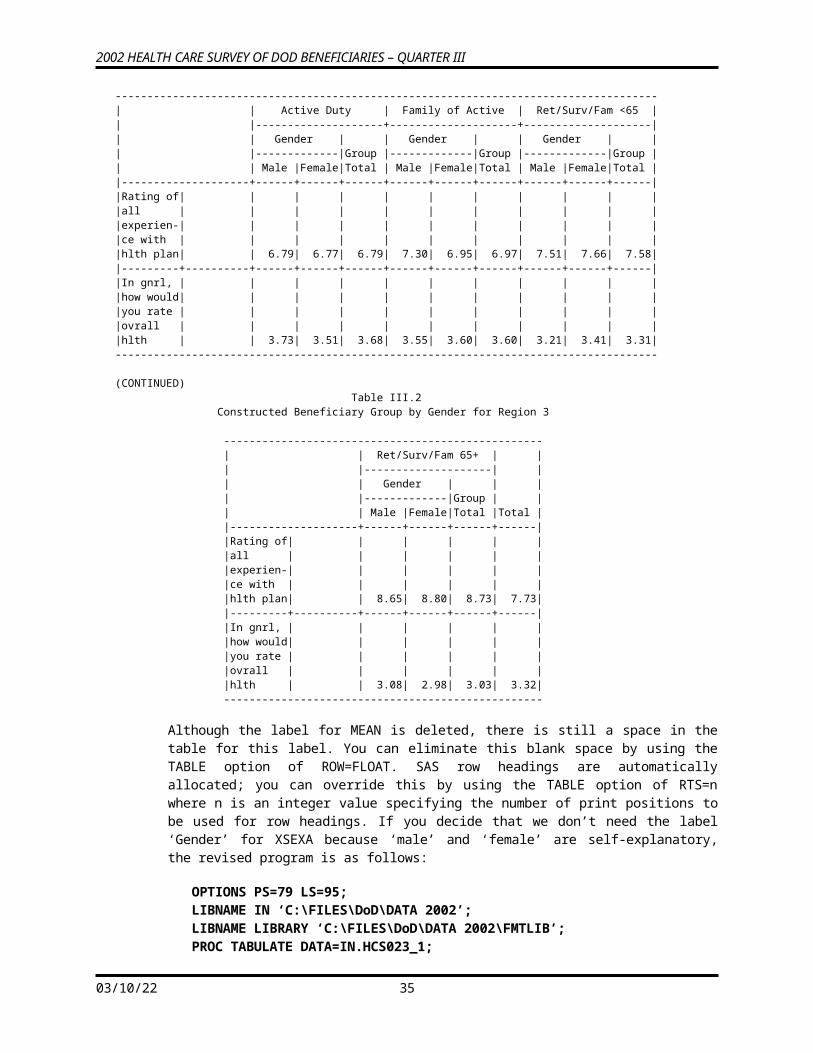
2002 HEALTH CARE SURVEY OF DOD BENEFICIARIES – QUARTER III
Select the Open option or choose a file from the list displayed. Open produces the following screen:
If the file is not in this directory, navigate through your folders until you locate it. Mark the file and click Open. You will be returned to the spreadsheet Data Editor with the file on view. The 2002 Adult HCSDB dataset has been opened and is displayed below.
05/13/23 37
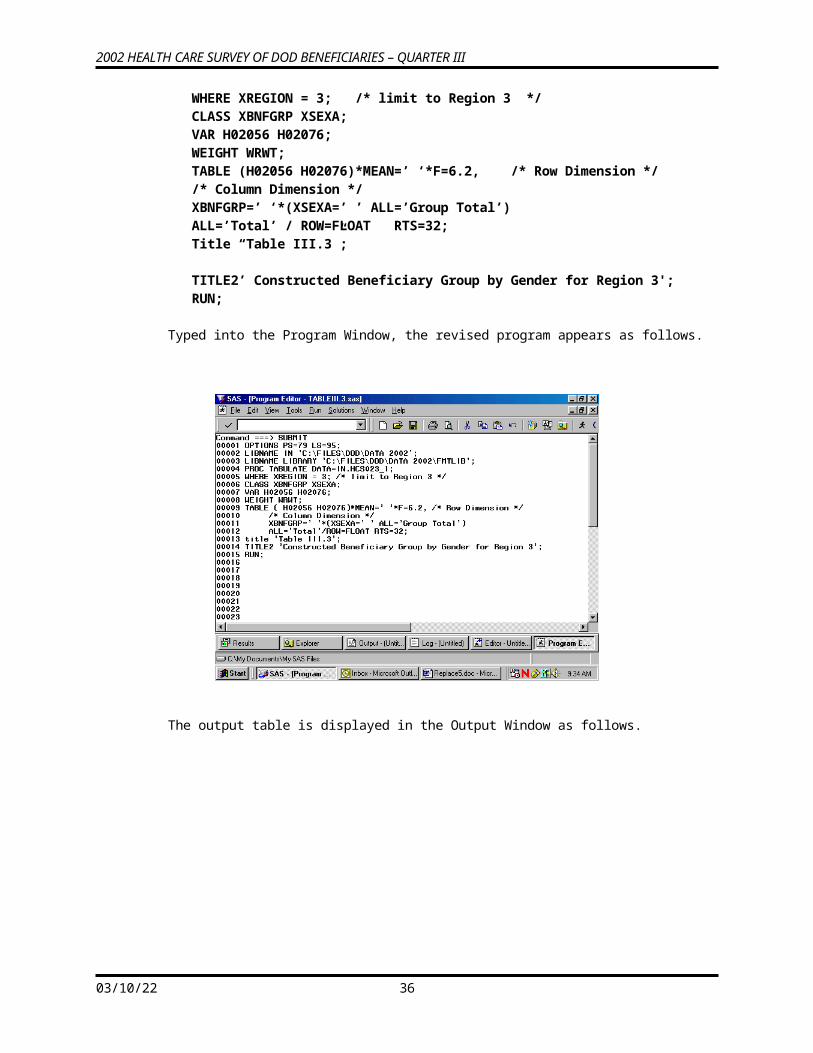
2002 HEALTH CARE SURVEY OF DOD BENEFICIARIES – QUARTER III
Constructing new variables
Data can be evaluated from many different aspects. It is sometimes useful to build new variables from combinations of the existing ones and to examine their distributions.
For example, the variable in the file for beneficiary group at the time of sampling is called xbnfgrp, and the variable for sex is xsexa. The value 1 for xbnfgrp indicates that the individual is on active duty. The relationships for constructing a new variable of active duty by sex are:
Active-duty-males: xsexa=1 and XBNFGRP=1
Active-duty-females: xsexa=2 and XBNFGRP=1
Open the Transform menu and select Compute as in the following:
05/13/23 38
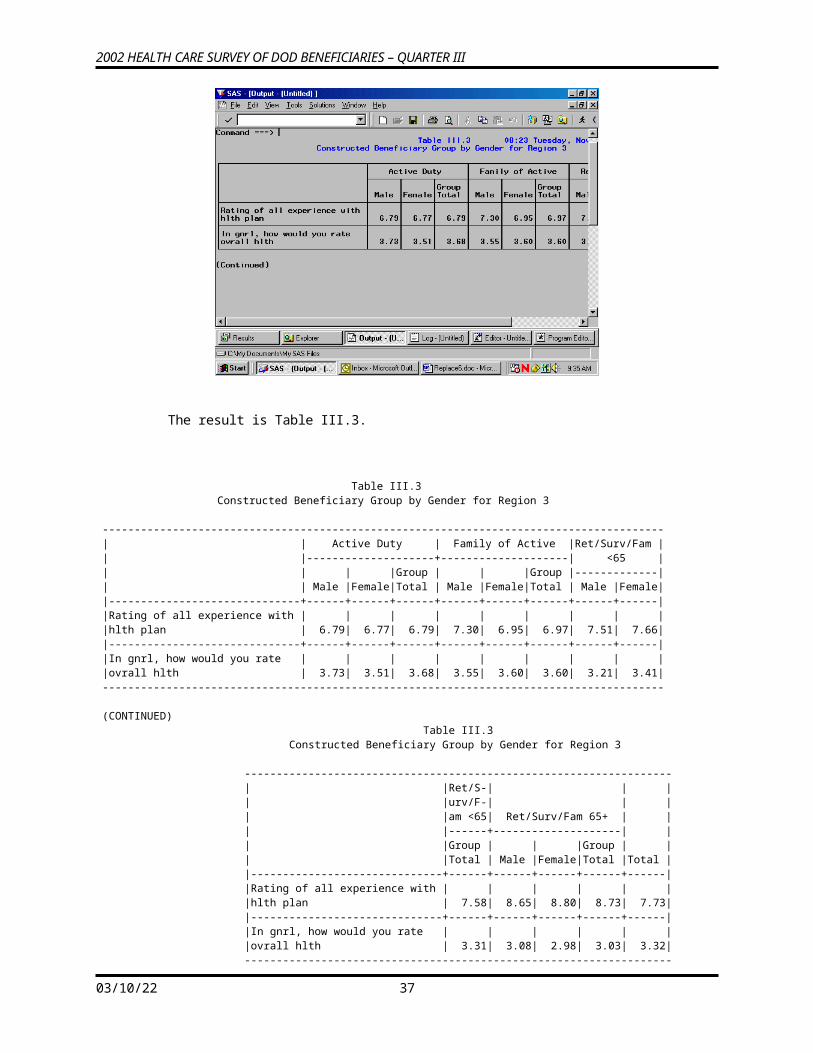
2002 HEALTH CARE SURVEY OF DOD BENEFICIARIES – QUARTER III
The following dialog box will open:
You can build the new variable in two steps to express the two conditions. The first task is to give the new variable a name and its first value. Enter the Target Variable slot and name the new variable sex_ad. Next, assign the value 1 to sex_ad by entering it into the slot for Numeric Expression. Your screen should look like the following:
05/13/23 39
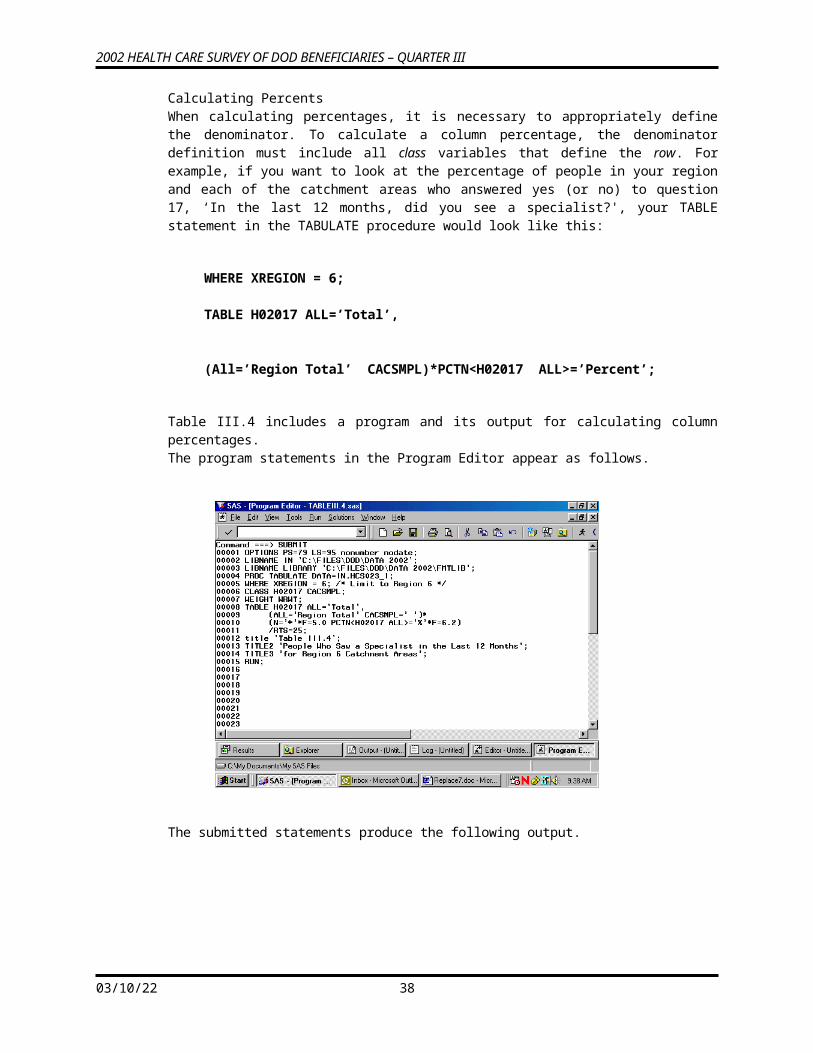
2002 HEALTH CARE SURVEY OF DOD BENEFICIARIES – QUARTER III
Once you we have assigned the value 1 to sex_ad, you can build the condition that qualifies the assignment. Click on If..and open the following dialog box:
Click on the circle indicating Include if case satisfies condition, and the black dot will move to that circle. The slot underneath will open, ready for your input. Build the “if” condition. Write it directly into the slot or move the elements into the slot from the given options. Add the elements xsexa = 1 & xbnfgrp = 1.
The screen should resemble the following:
05/13/23 40
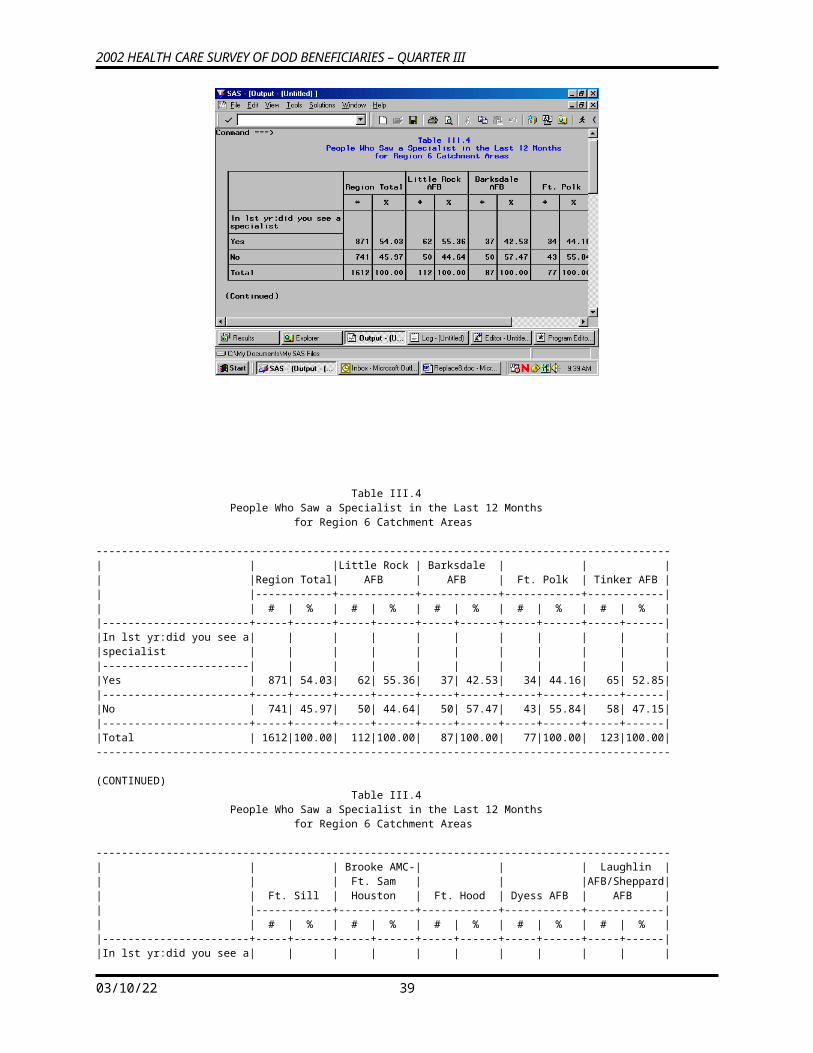
2002 HEALTH CARE SURVEY OF DOD BENEFICIARIES – QUARTER III
Click on Continue and return to the previous screen, which will now look like this:
Your condition will be written next to the If button. Click on OK to exit the dialog box, and the variable sex_ad will be created with its value set to 1.
The next step is to build the second condition for the new variable, which will set it to the value 2. Reopen the Compute dialog box. The commands you just gave still appear in the dialog box. Simply assign the value 2 to sex_ad, press If, and enter the new condition to identify active duty females. Click Continue, and finish with OK. The condition, if xsexa = 2 and xbnfgrp = 1, will be added to the new variable sex_ad.
05/13/23 41
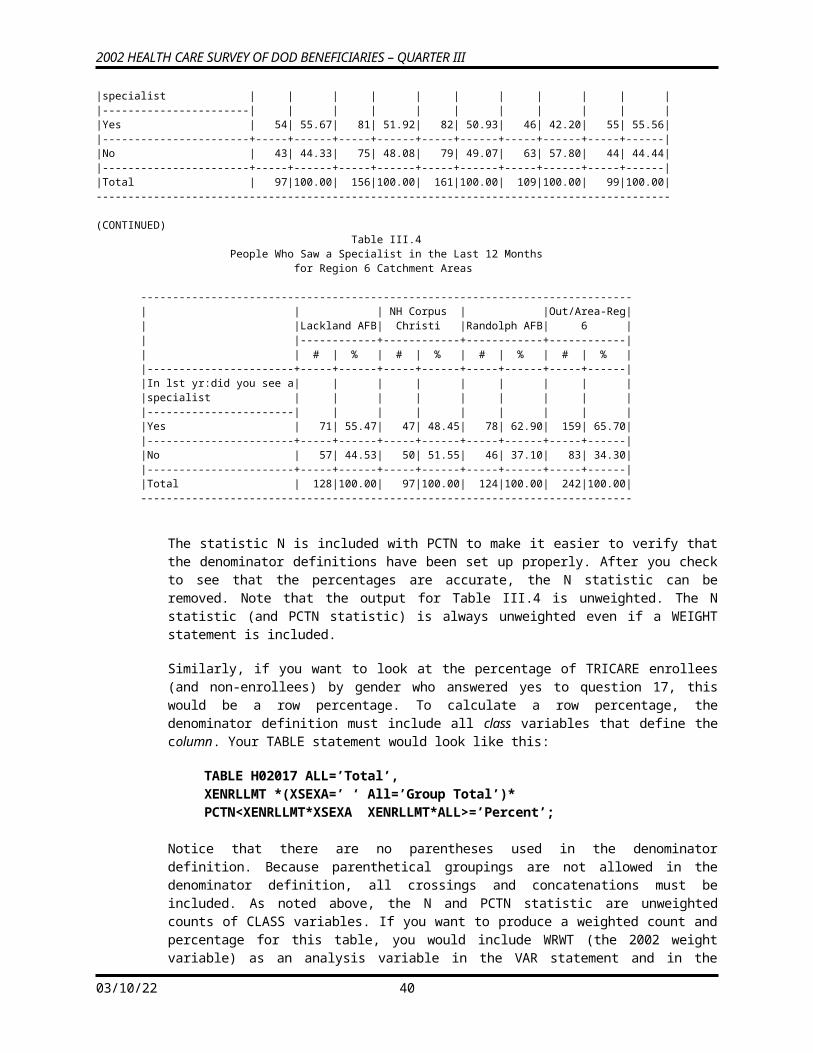
2002 HEALTH CARE SURVEY OF DOD BENEFICIARIES – QUARTER III
Once you have created a new variable, you may want to add it permanently to the dataset. The new variable is computed for each case in the file and added to the view in the Data Window after the last variable in the dataset. The variable name is the column heading.
Since the HCSDB data set carries Read-Only status to protect it from corruption, changes to it cannot be saved. At the end of the day, when the work session ends and you exit SPSS, the file will revert to its former status and the new variables will be lost. The solution is to save the dataset under a new name when you exit. Choose the Save As option on the File menu, and you will be prompted to name the file and to save it in a folder of your choosing. Give the file a new name and save it. Open the new expanded file anytime for processing.
Suppose you do not want to use up your disk space for expanded copies of the dataset. Another option is to save the syntax you have generated in a file that can be run as it is needed. Syntax is a written instruction generated by the commands you give in a dialog box. These “sentences” can be saved in a file and executed when needed. This is the batch mode of processing syntax commands. Syntax files take up very little space.
Experienced SPSS programmers, who have mastered SPSS syntax, often prefer to work only in batch mode. This option is available to users who have not mastered the syntax language. You can paste the commands, generated interactively in the dialog box, onto a syntax file.
Recall the compute example for the new variable sex_ad. The screen below is the result of assigning 1 to sex_ad according to an If condition. You clicked on OK to set the value. Returning to the screen and clicking on Paste writes the command to a syntax file.
Click on the Paste button, and the syntax window below will open with the syntax written in it.
05/13/23 42
2002 HEALTH CARE SURVEY OF DOD BENEFICIARIES – QUARTER III
Now return to the compute dialog box.
Assign the value 2 to sex_ad as in the diagram above. Select Paste, and these commands will be appended to the syntax file.
05/13/23 43
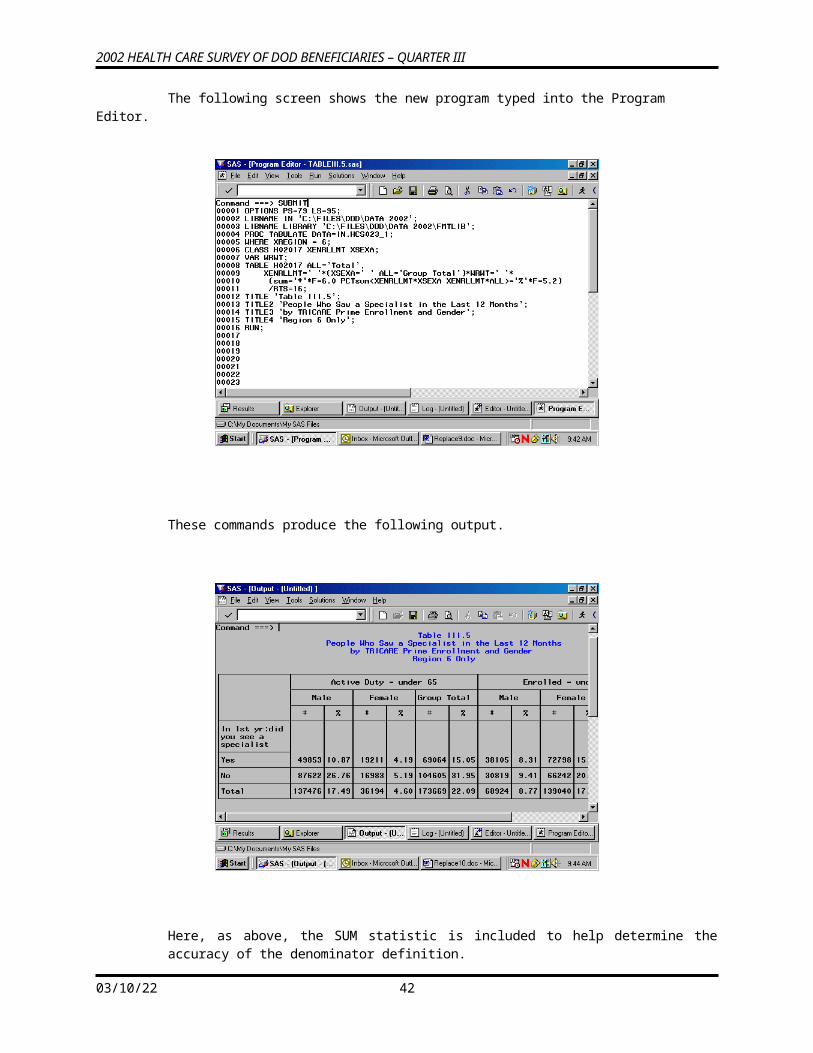
2002 HEALTH CARE SURVEY OF DOD BENEFICIARIES – QUARTER III
The results appear in the screen above. SPSS gives default names to syntax files, such as Syntax1, Syntax2, etc., as they are created. It is a good idea to save the syntax, re-naming the file using the Save As option on the File menu. Use a name that has some meaning to you, e.g., New_computes. The file will automatically receive the suffix .sps.
Another option for adding new variables to the dataset is to Recode existing variables into new variables. A common example involves grouping an age variable into age categories as shown below, using the variable DAGEQY, which exists on our dataset. DAGEQY is coded in years from 18 to 97, which can be grouped into four age categories:
18 to 34 = 1 - label: “young adult”
35 to 49 = 2 - label: “mature adult”
50 to 65 = 3 – label: “middle-age”
66 to 97 = 4 – label: “senior citizen”
The new variable is called age_grp.
DAGEQY is a string variable. In order for it to be recoded using grouping criteria, it must be converted to a numeric variable. In the data window go to the column for the variable DAGEQY and click in the gray area at the top of the column causing the variable to be selected as the following screen indicates.
05/13/23 44
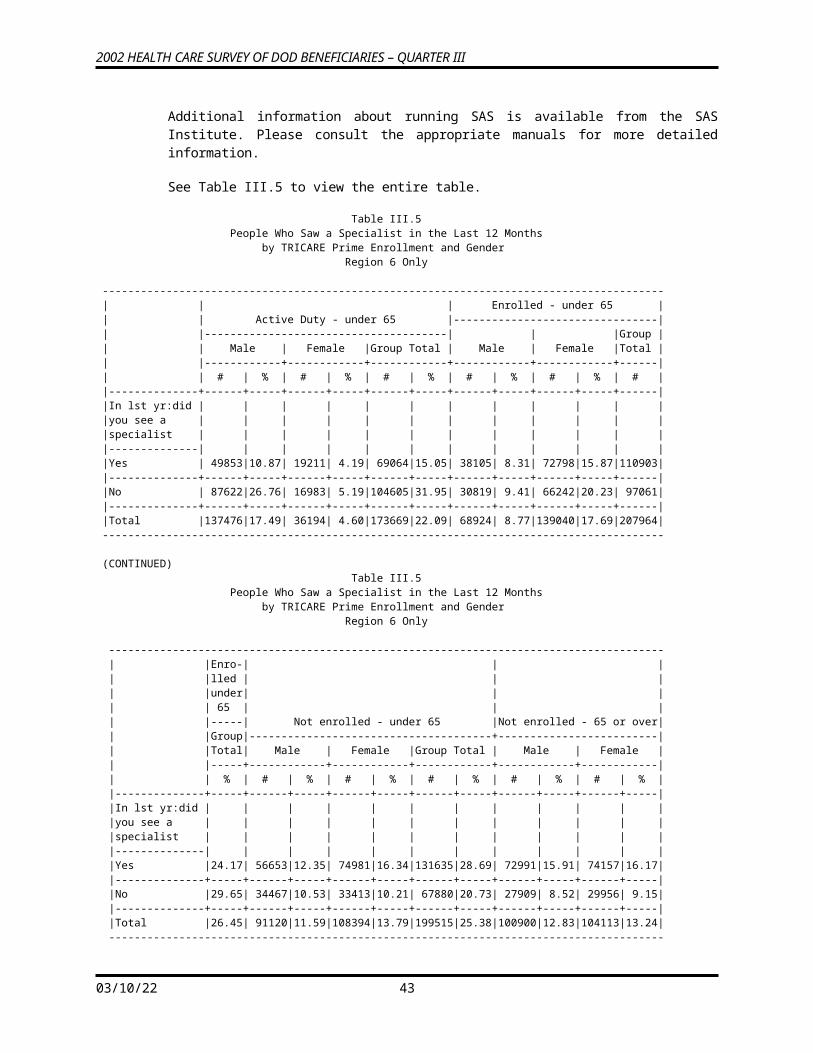
2002 HEALTH CARE SURVEY OF DOD BENEFICIARIES – QUARTER III
Open the Data menu and select Define Variable as follows:
The following menu will open.
05/13/23 45
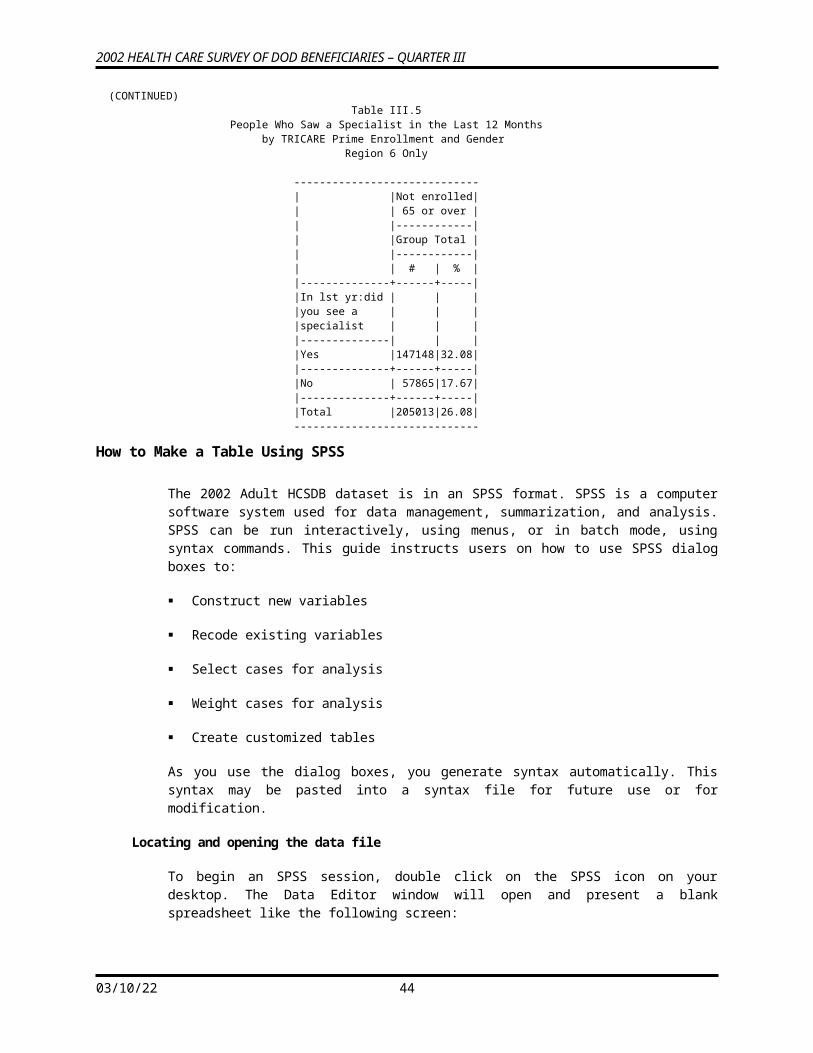
2002 HEALTH CARE SURVEY OF DOD BENEFICIARIES – QUARTER III
Click on Type and on Numeric, transferring the black dot from String to Numeric as follows:
Click on Continue to return to the original screen. Click on OK to set the changes.
Now from the Transform menu, choose Recode and Into Different Variables as pictured below:
05/13/23 46
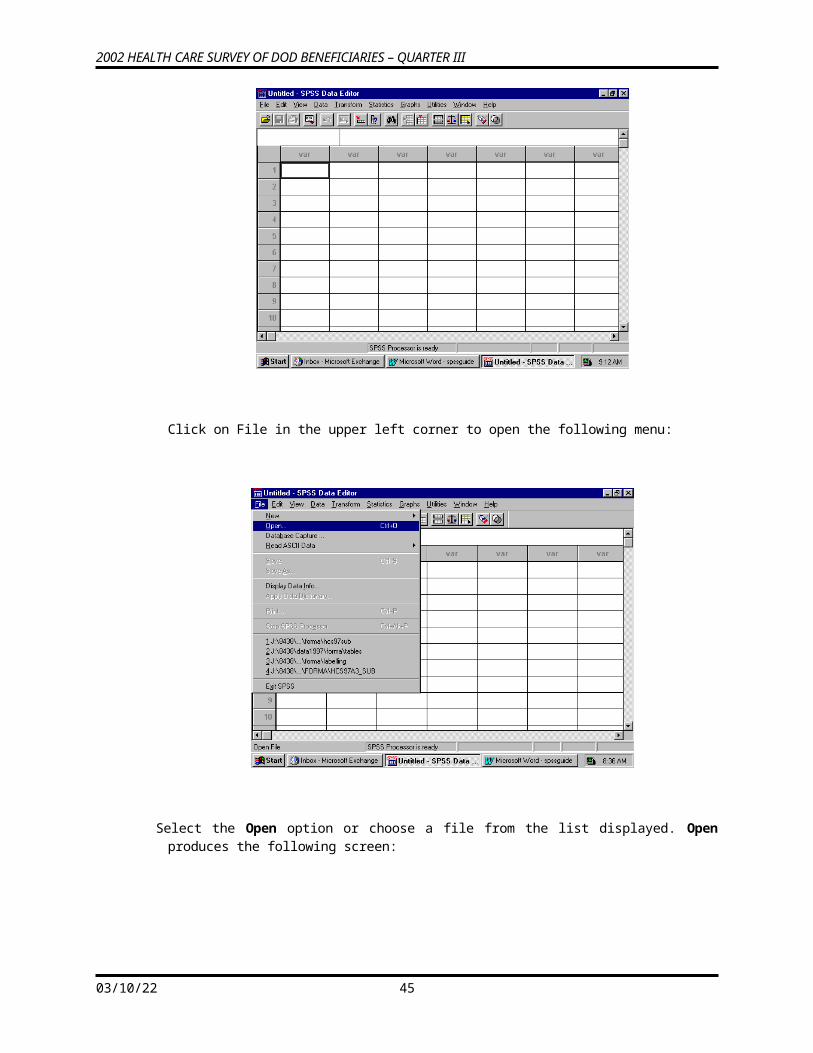
2002 HEALTH CARE SURVEY OF DOD BENEFICIARIES – QUARTER III
The following dialog box will open:
Move DAGEQY from the variable list on the left to the box labeled Input Variable -> Output Variable. In the Name slot, enter the new variable name age_grp. Enter Age Categories, the variable label, in the Label slot. Click on Change. The dialog box should look like the one below.
05/13/23 47
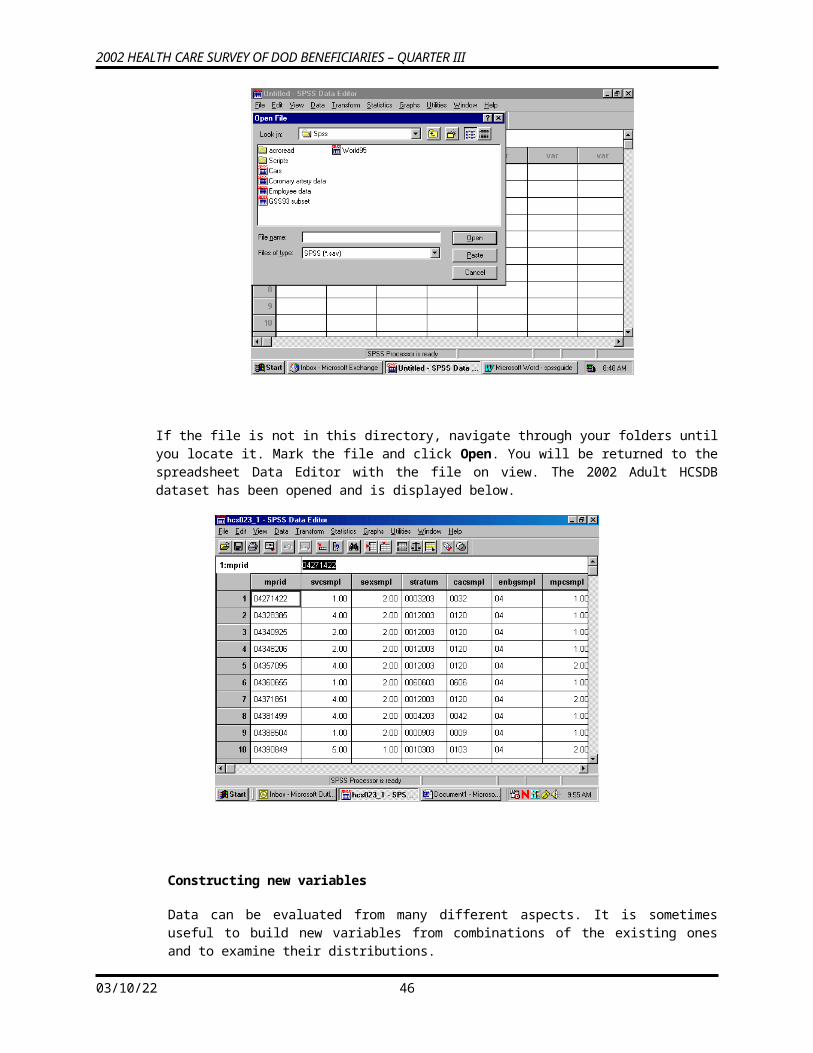
2002 HEALTH CARE SURVEY OF DOD BENEFICIARIES – QUARTER III
Click on Old and New Values, and the following dialog box will open:
The next step in grouping the age variable is to specify the existing values of Age to be recoded. To do this, click on the Range circle under Old Value.
05/13/23 48
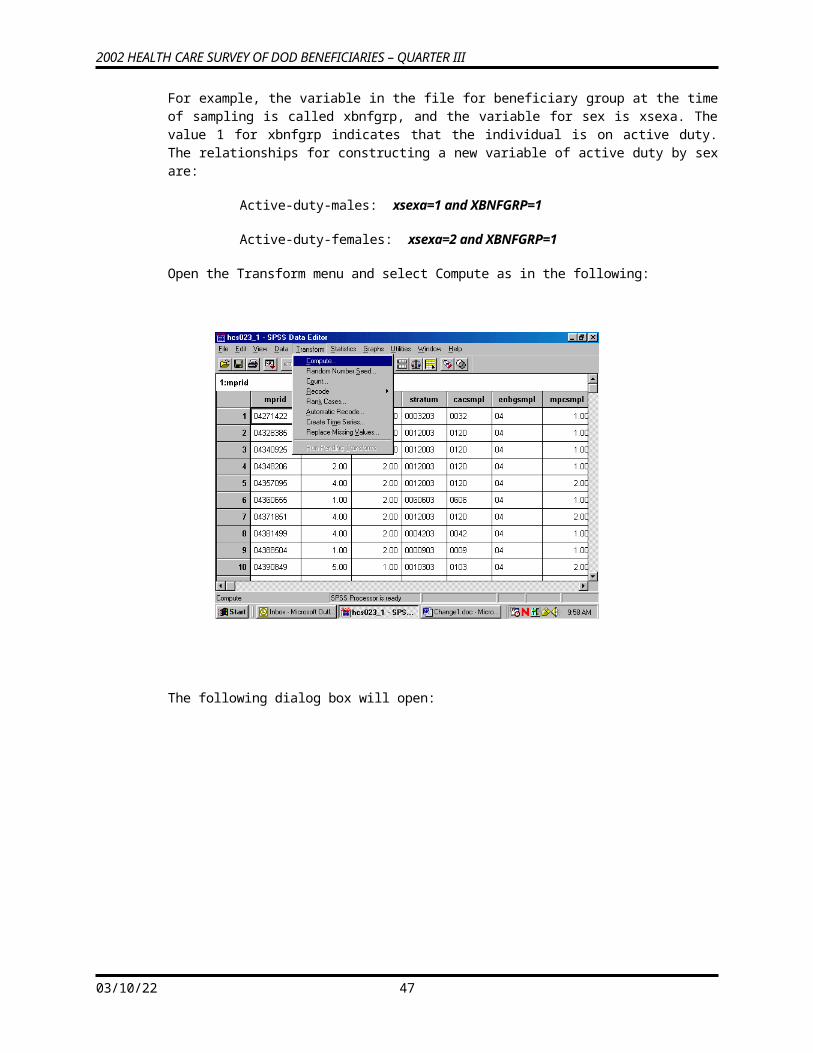
2002 HEALTH CARE SURVEY OF DOD BENEFICIARIES – QUARTER III
Once the appropriate slots are open, you have four ranges to enter.
First, enter 18 through 34 in the slots provided under Range. Next, enter the value 1 in the Value slot under New Value. Add is now illuminated.
Clicking on Add produces the following result:
05/13/23 49
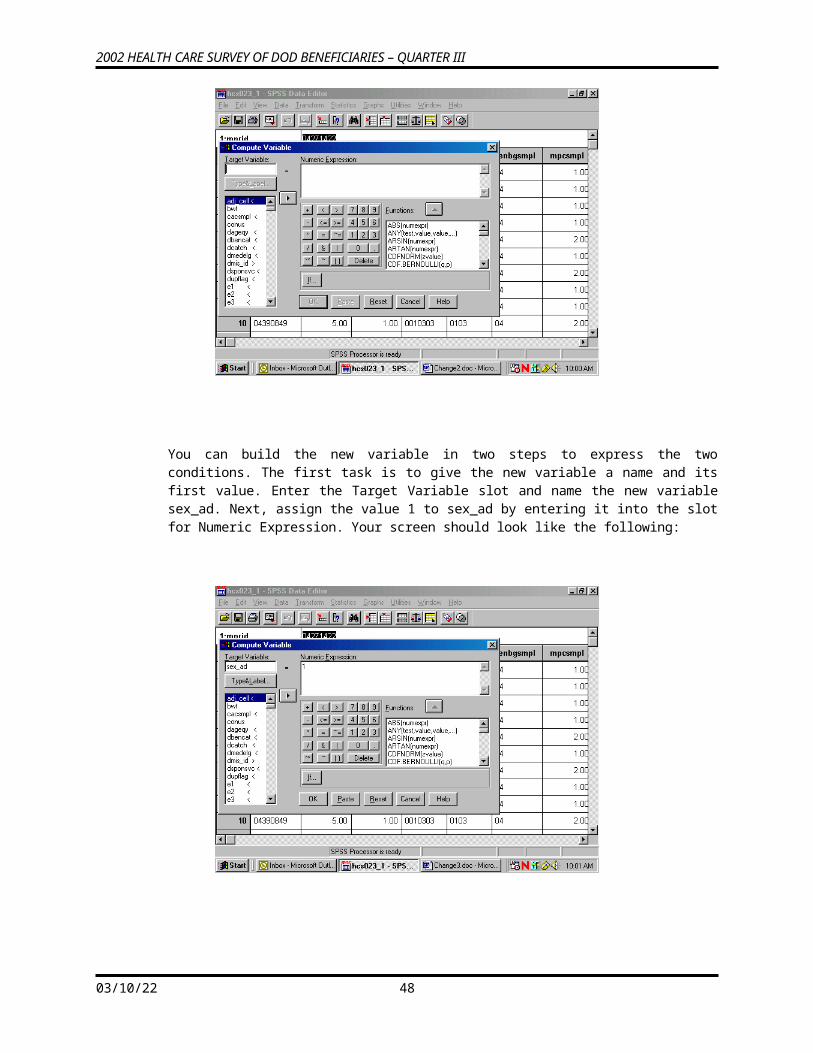
2002 HEALTH CARE SURVEY OF DOD BENEFICIARIES – QUARTER III
The specified range appears in the box labeled Old -> New, and the Range and Value slots have been cleared to permit additional entries.
The three remaining ranges are built in the same manner, adding each specification, until the dialog box looks like the one below.
Click on Continue and return to the previous screen.
05/13/23 50
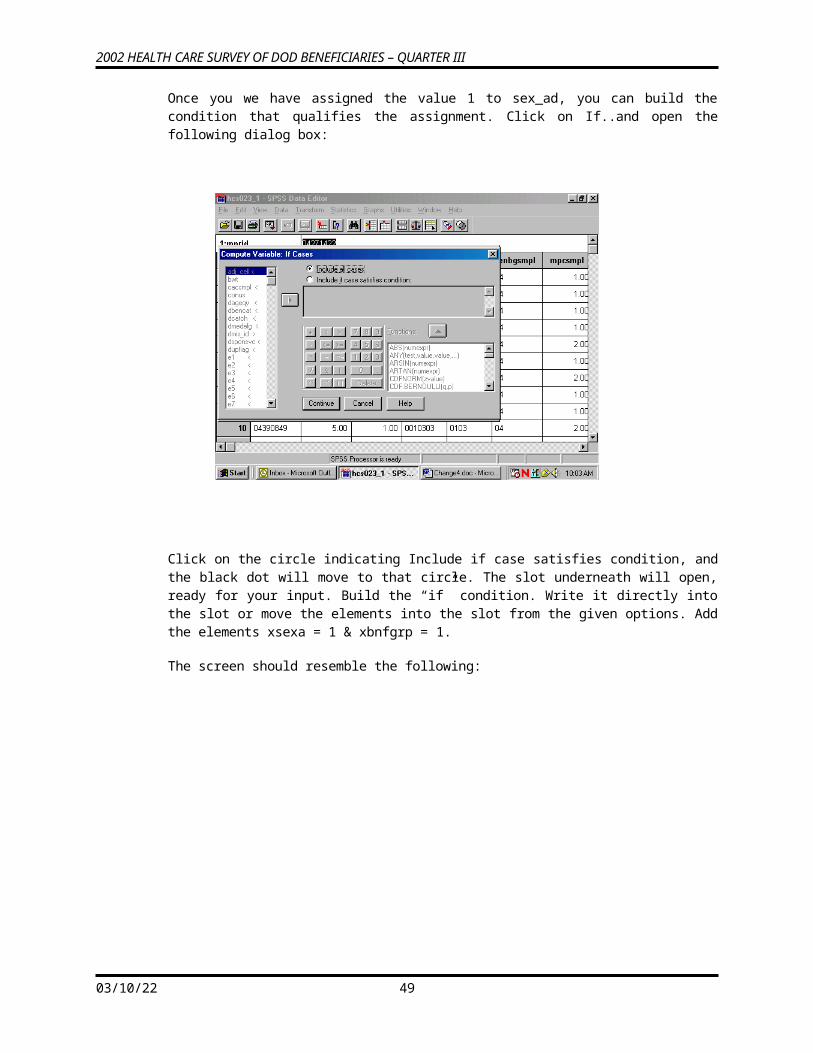
2002 HEALTH CARE SURVEY OF DOD BENEFICIARIES – QUARTER III
Click on OK to exit the screen. The new variable age_grp has been created. The Recode syntax can be pasted to a syntax file.
The final task is to create the value labels for the new variable age_grp. Labeling variables makes output from statistical reporting procedures much clearer and more elegant.
In the Data Window, go to the column for the new variable age_grp and click in the gray area containing the variable name. The entire column will darken indicating that it has been selected.
05/13/23 51
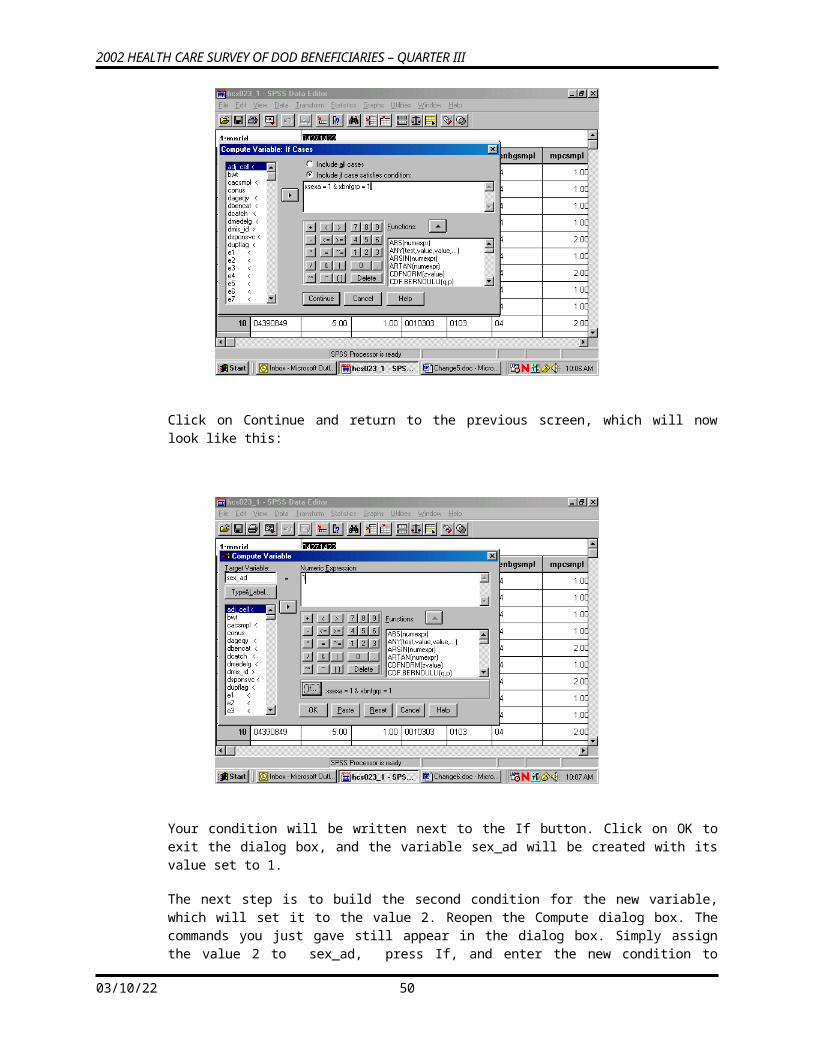
2002 HEALTH CARE SURVEY OF DOD BENEFICIARIES – QUARTER III
Click on the Data menu at the top of the screen to open the following dialog box.
Click on Define Variable to get to the following dialog box:
The characteristics of age_grp are displayed in this dialog box. Information about the variable type, its label, and its missing values appears here. Click on Labels to get to the following screen:
05/13/23 52
2002 HEALTH CARE SURVEY OF DOD BENEFICIARIES – QUARTER III
In the slot marked Variable Label is the label Age Categories, which was specified during the Recode process. If there is no label for the variable, enter one in this slot.
You can then begin to label the values of age_grp. Enter 1 in the slot marked Value, and enter the label Young Adult in the slot marked Value Label. The screen will look like the following:
05/13/23 53
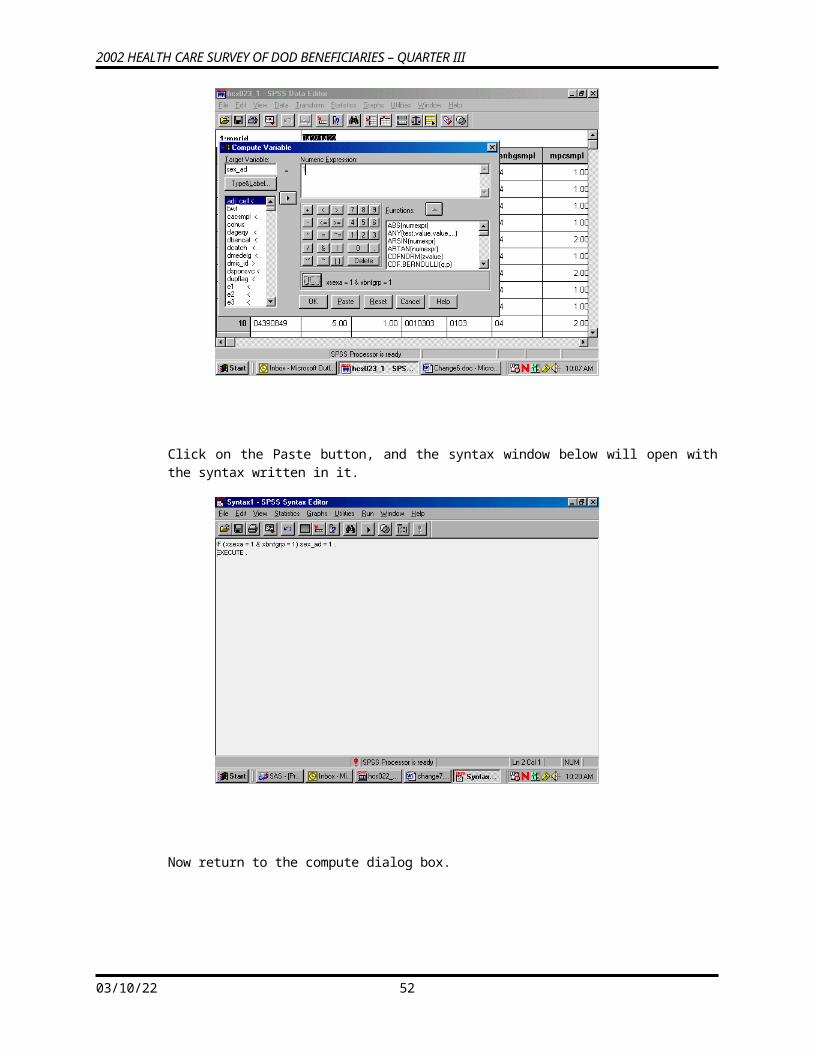
2002 HEALTH CARE SURVEY OF DOD BENEFICIARIES – QUARTER III
Add is now illuminated. Click on Add and the text of your command will appear in the central box, clearing the slots for further entries, as in the next screen.
Build the other three labels until the screen looks like the following:
Click continue, and return to the first screen.
05/13/23 54
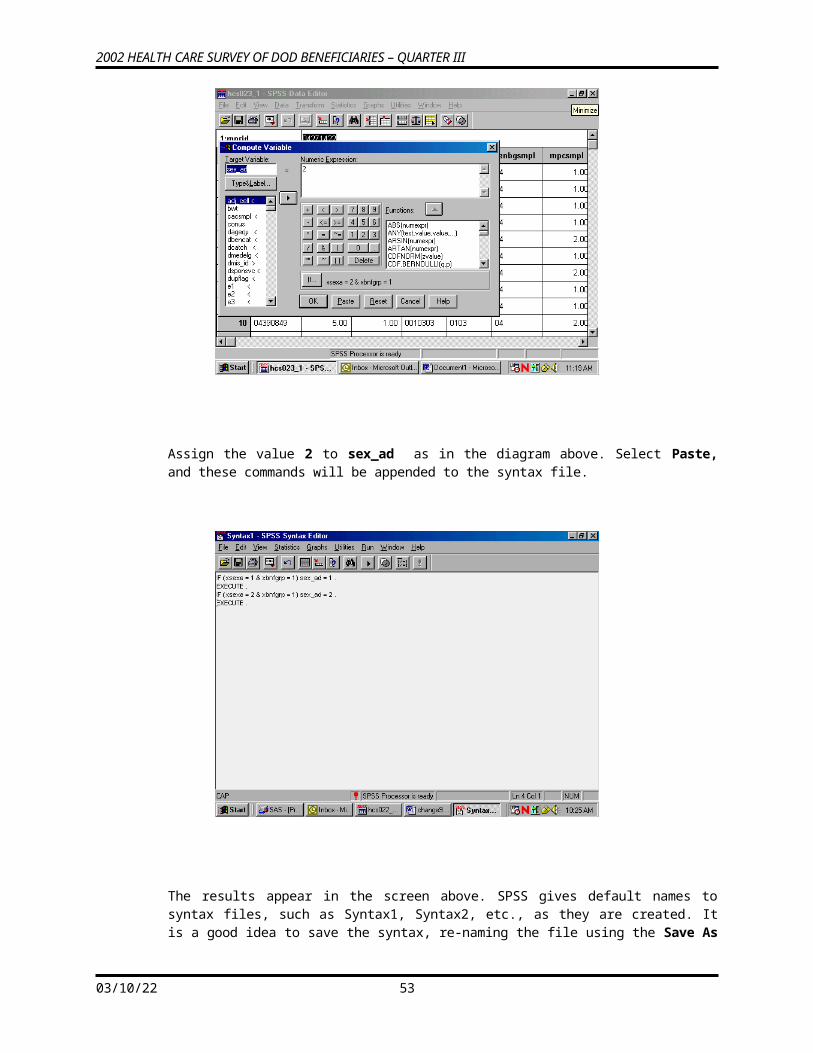
2002 HEALTH CARE SURVEY OF DOD BENEFICIARIES – QUARTER III
Click on OK to exit. The labels have been added.
Limiting the Number of Variables
The HCSDB dataset contains many variables. To speed up software performance time, it may be desirable to limit the number of variables for analysis. There are ways to do this.
The first is to Save a subset of variables in a new file with a new name. This option is available only through syntax. The Keep or Drop command lets you save a subset of variables. The choice of Keep or Drop is dependent on which list is shorter to write.
For example, suppose you want to run some procedures to evaluate the rating of all experiences with the health plan as it relates to the beneficiaries’ state of health. You are also interested in the differences between military and civilian services, and in differences within these groupings by gender. Moreover, you want to look at regional differences and differences among catchment areas. You can do all the work on a subset of only nine variables, saving them in a separate file.
To write the syntax, open a syntax window. If you want to create a new syntax file, choose New, Syntax on the File menu as in the following:
05/13/23 55
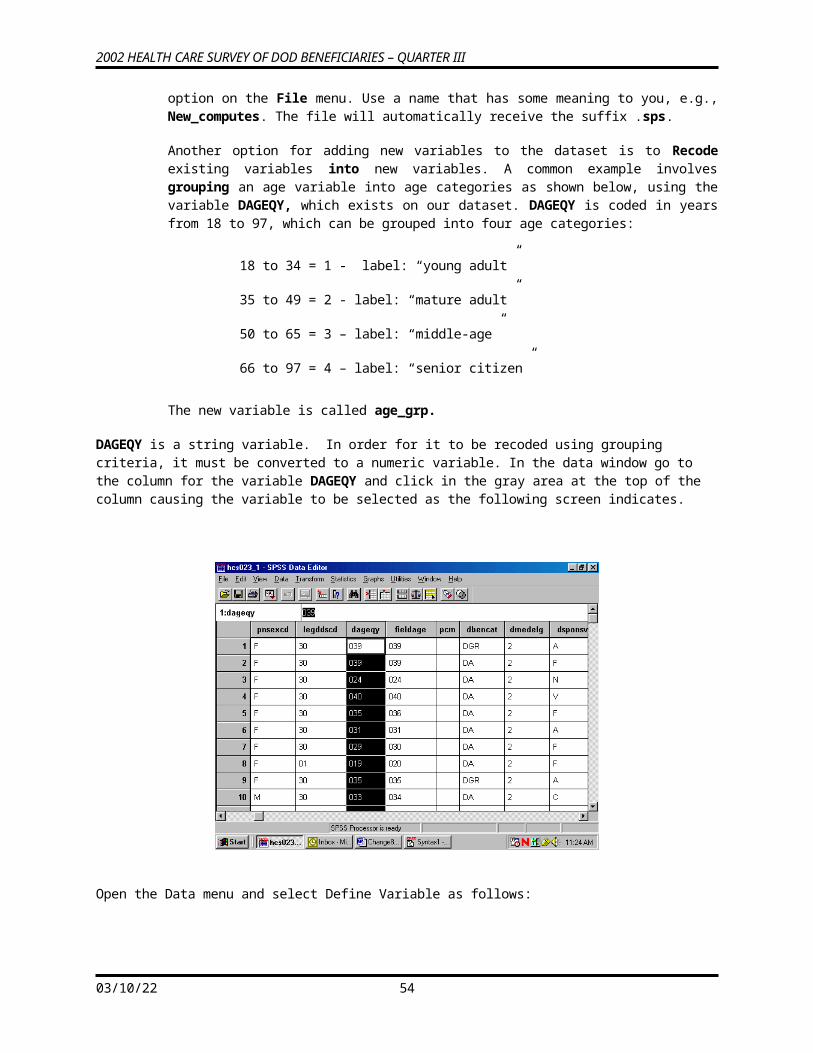
2002 HEALTH CARE SURVEY OF DOD BENEFICIARIES – QUARTER III
A blank syntax window will open.
Write the following command, substituting the file name and directory specification:
SAVE OUTFILE=’C:\MYFILES\HELTHCARE.SAV’/KEEP=XREGION XSEXA XENRLLMT CACSMPL WRWT XBNFGRP H02017 H02056 H02076. as in the following:
Upper case is optional. Be sure to enclose the entire file name in single quotes and to type a period at the end of the command.
05/13/23 56
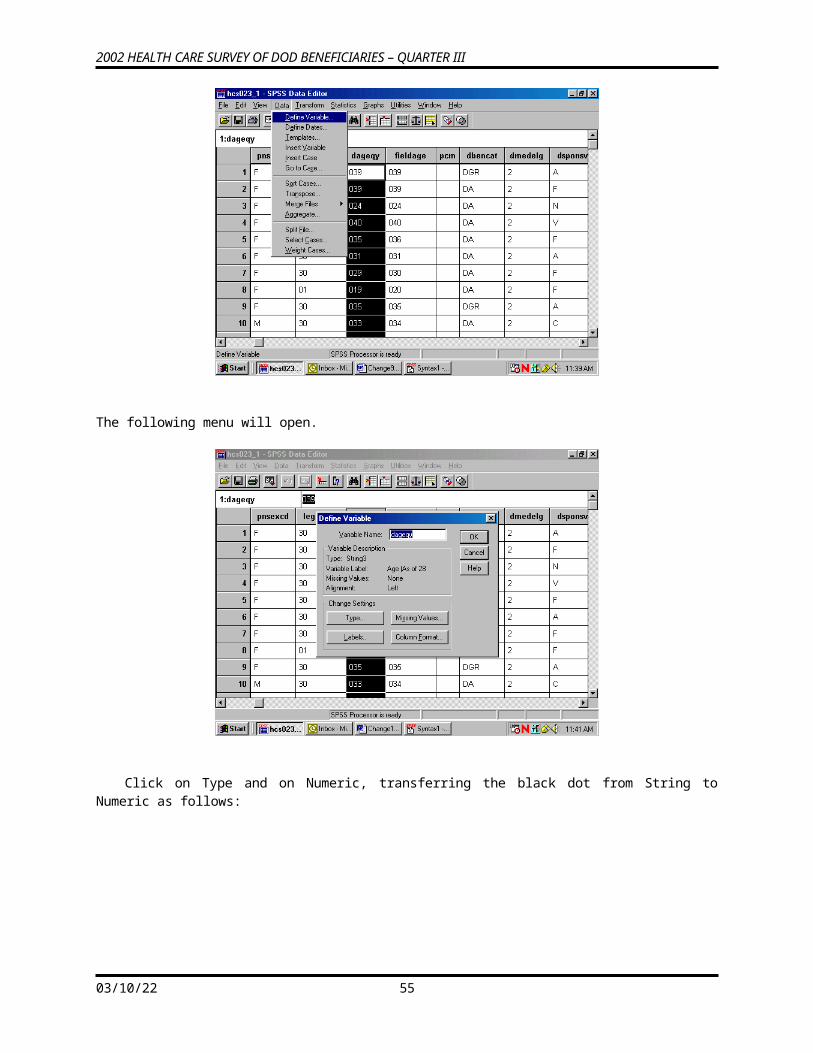
2002 HEALTH CARE SURVEY OF DOD BENEFICIARIES – QUARTER III
Run the command by choosing the Run menu and selecting All from the choices.
Open the new file according to the specifications at the beginning of this chapter.
The second way to limit the number of variables for analysis is to define a subset of variables that will appear in the dialog boxes for procedures. Using the Utility menu, define a subset of variables as in the following:
05/13/23 57
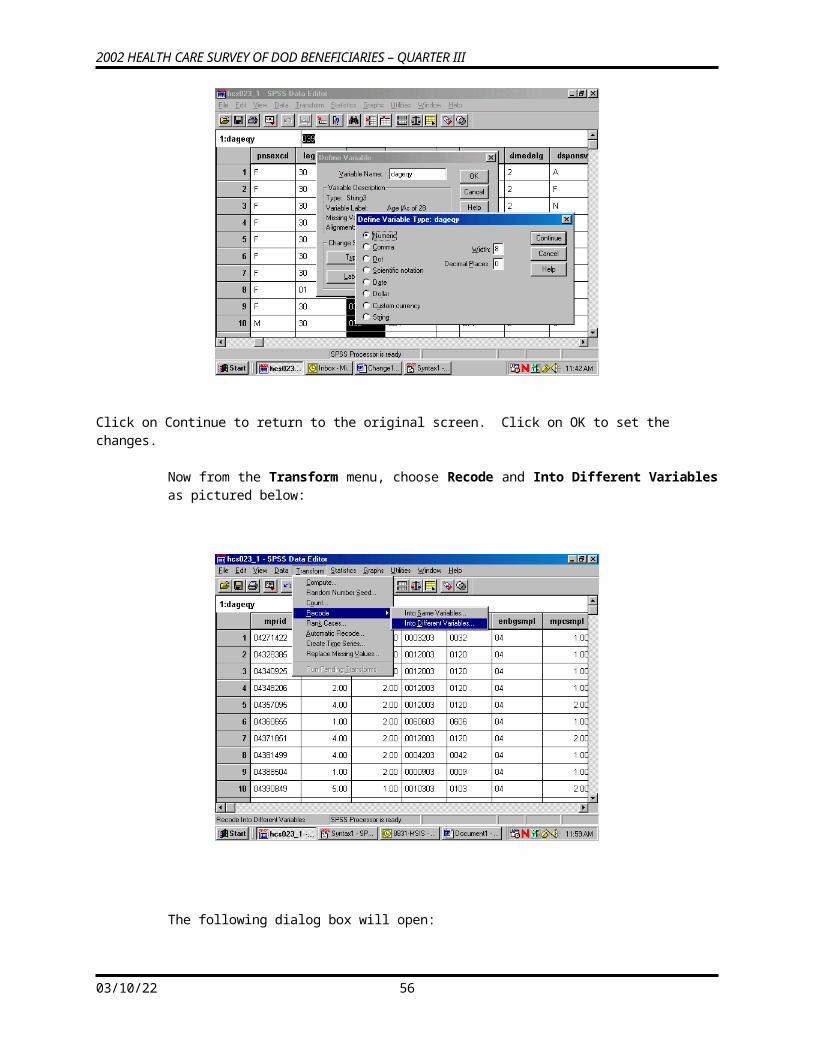
2002 HEALTH CARE SURVEY OF DOD BENEFICIARIES – QUARTER III
Select Define Sets.
Insert a name for the subset of variables in the slot labeled Set Name. Move the variables you want to subset from the list on the left to the slot marked Variables in Set. By way of illustration, we will move the nine variables selected for the day’s processing.
The screen should look like the following:
05/13/23 58
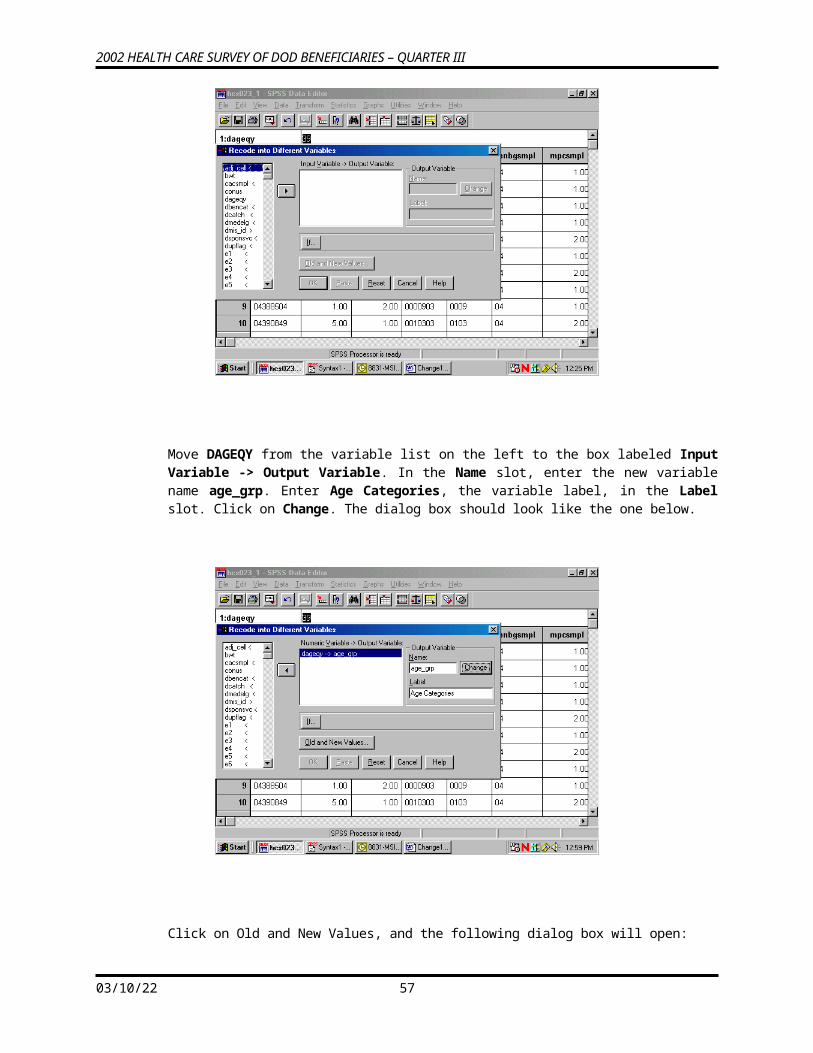
2002 HEALTH CARE SURVEY OF DOD BENEFICIARIES – QUARTER III
Click on Add Set to save the set specifications. The screen will change to the following:
The set is now available for use. To use the set, Close the dialog box, reopen the Utilities menu, choose Use Sets…, and receive this screen:
.
05/13/23 59
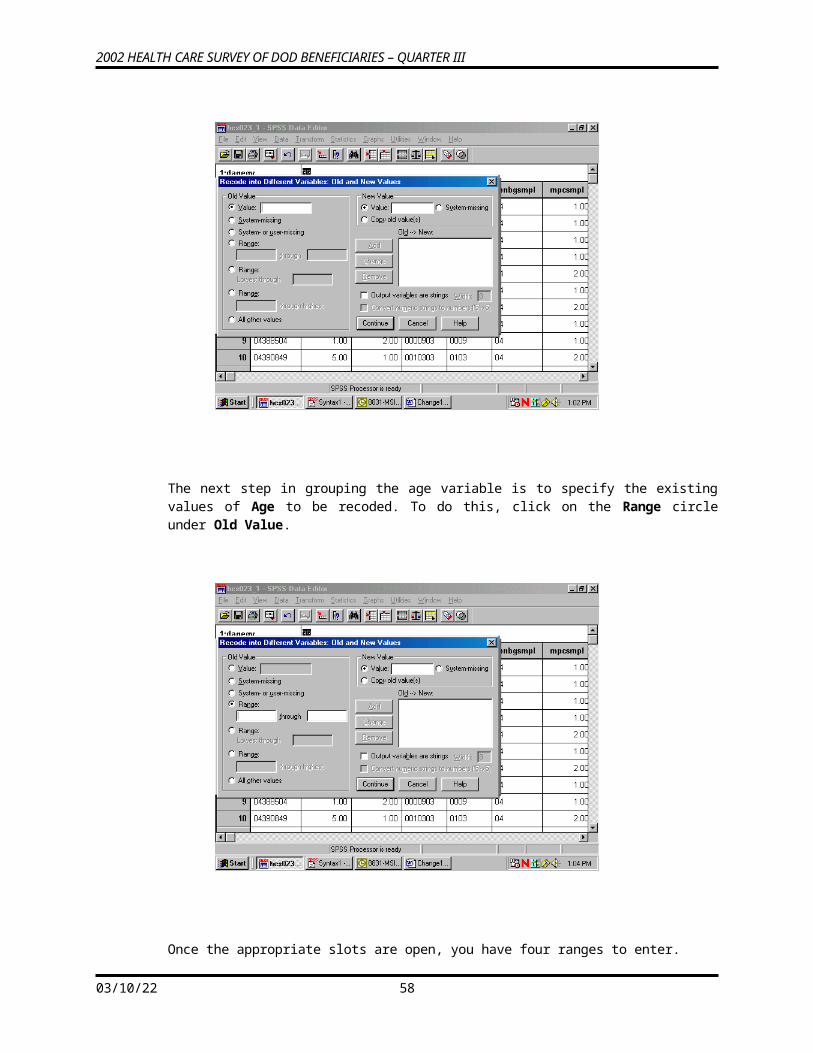
2002 HEALTH CARE SURVEY OF DOD BENEFICIARIES – QUARTER III
Move HLTHCARE from the left slot to the right slot, which is labeled Sets in Use. Transfer ALLVARIABLES from the right to the left slot. Leave NEWVARIABLES where it is. OK saves this change.
Until you change this specification, only nine original variables and any new variables will appear in the dialog boxes associated with procedures.
Limiting the Number of Observations
There are many ways to limit the number of observations available to statistical reporting procedures. The method illustrated here involves using filter variables with a menu-driven Filter By option. Using filters deactivates but does not delete cases from the file. A diagonal line appears next to the filtered cases in the Data Window.
The first task is to compute a filter variable for all the cases in the file.
A filter variable has two values: 0 and 1. The 1 indicates that the case will be included for procedures. The 0 flags the case for removal.
For example, suppose you want to produce a table for people who live in the Southeast, i.e., cases for which the variable xregion = 3. You would build a filter variable named filtr_3, which has the value 1 associated with the cases in the Southeast and 0 for all the other cases in the file. The logic is: if xregion = 3, then filtr_3 = 1, else filtr_3 = 0.
The screen below shows the final step in computing the filter variable. The variable was first initialized to 0. Then, the “If” condition was built for setting the filter variable to 1. You are now working with a subset of variables, allowing the dialog boxes to be used more efficiently.
05/13/23 60
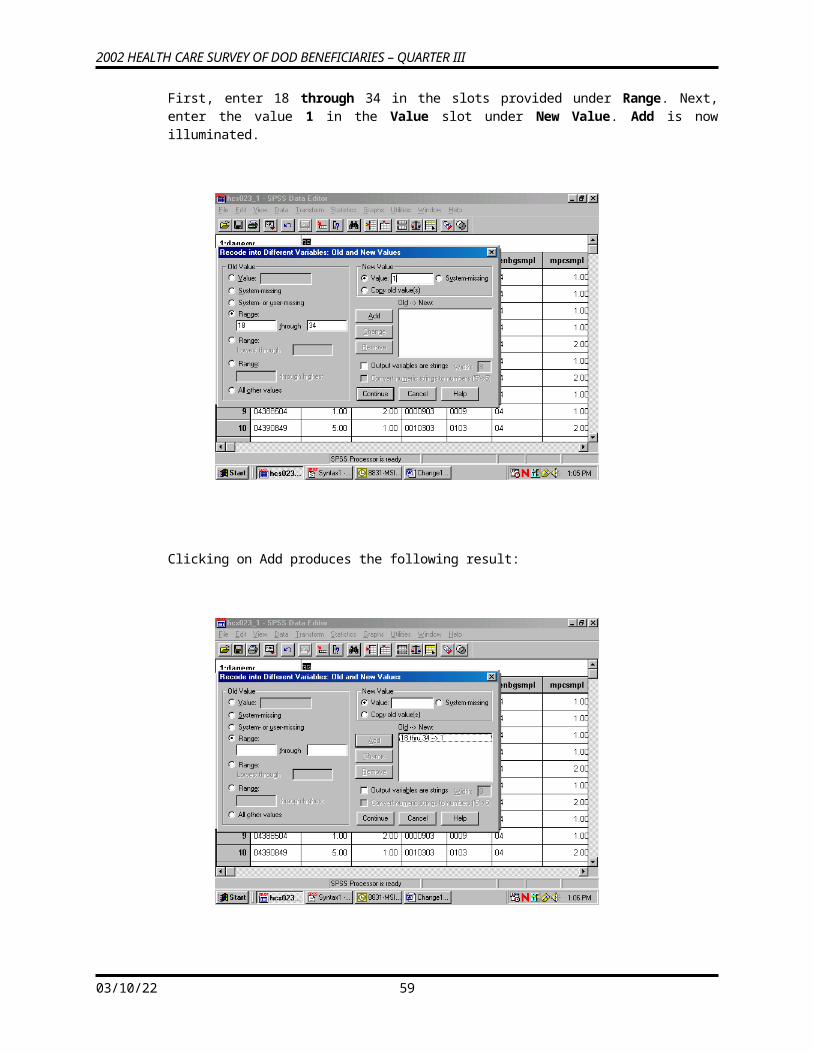
2002 HEALTH CARE SURVEY OF DOD BENEFICIARIES – QUARTER III
The screen that follows shows the syntax that was generated as you built the variable filtr_3.
Once you build the filter variable, you can apply it for analyzing only those people from the Southeast.
Using the Data menu, choose Select Cases.
05/13/23 61
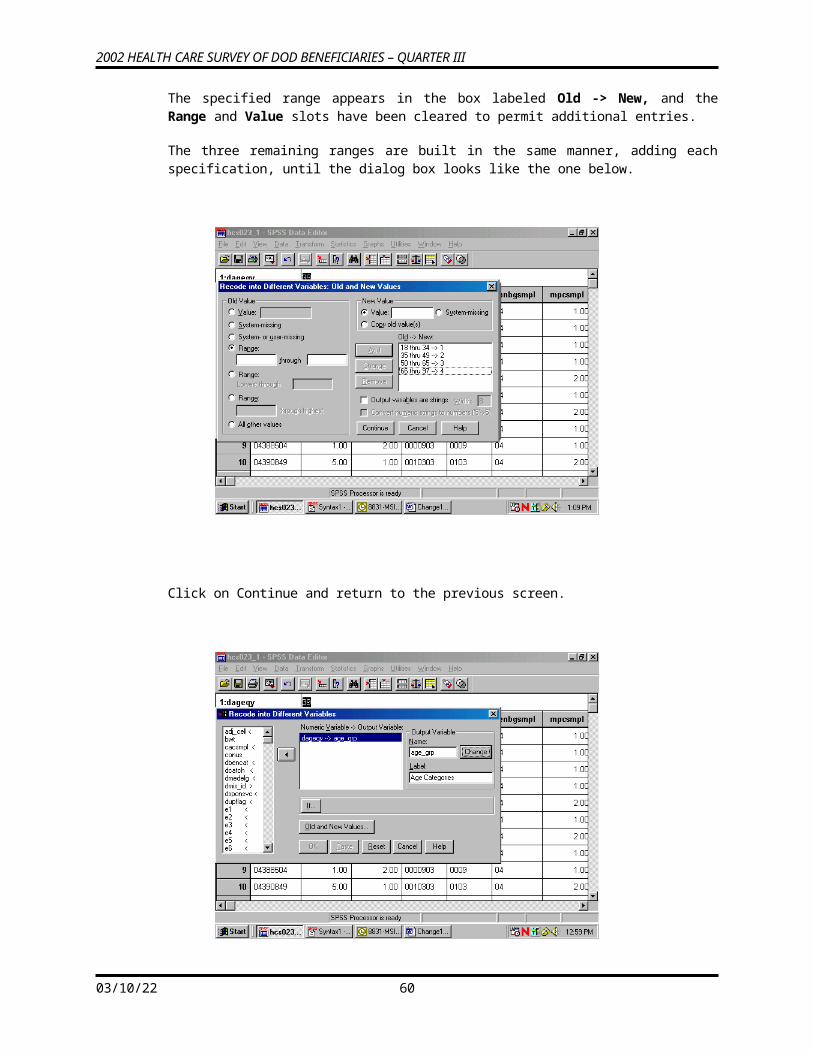
2002 HEALTH CARE SURVEY OF DOD BENEFICIARIES – QUARTER III
In the dialog box, check Use filter variable. Move the variable filtr_3 from the variable list on the left side of the dialog box into the slot provided, as indicated below. Check that the option Filtered is checked under Unselected Cases Are. This is the default option.
Click OK and exit the dialog box.
When you return to the Data Window, notice the slanting line next to some of the cases in the file. Those cases have been filtered out.
05/13/23 62
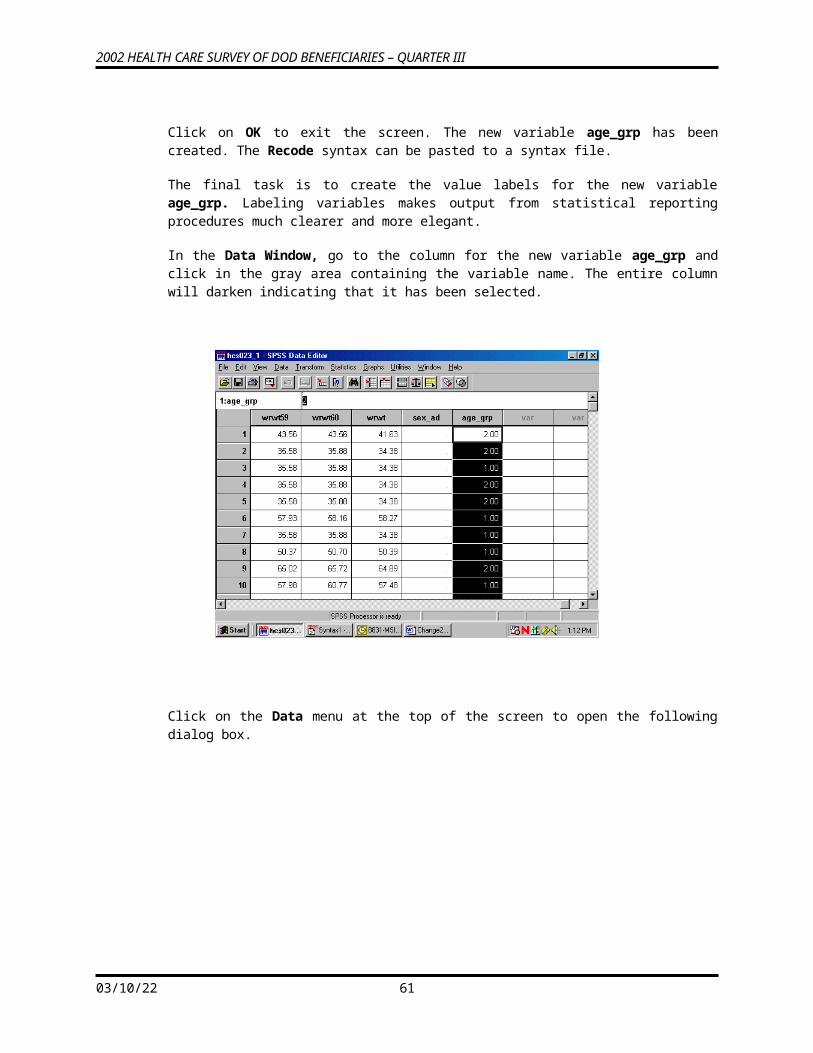
2002 HEALTH CARE SURVEY OF DOD BENEFICIARIES – QUARTER III
You can now produce tables for the subset of cases.
When using filter variables, it is important to check the filter status and to adjust it to fit the present need. Filtered cases are not available for procedures. Moreover, a filter is in effect until it is turned off or until another filter is activated. Check the status line at the bottom of the Data Editor window to see if a filter is activated. In the example above, Filter On is indicated on the status line. To see which filter is active, you must re-enter the Select Cases dialog box. There you can deactivate the filter or activate a new one.
To deactivate a filter, choose All cases and OK as in the screen below.
05/13/23 63
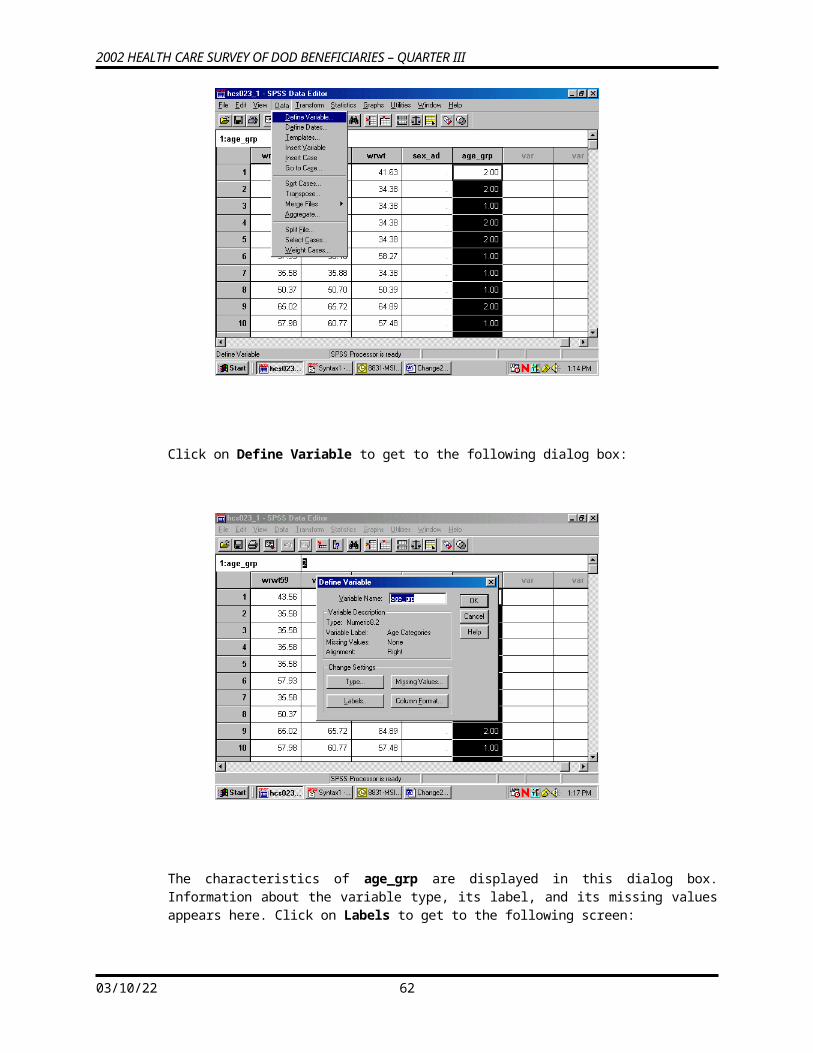
2002 HEALTH CARE SURVEY OF DOD BENEFICIARIES – QUARTER III
Weighting Data
The data file includes a weighting variable, WRWT, which should be applied to all procedure runs. Again, using the Data menu, choose Weight Cases. In the dialog box, choose Weight cases by. Move the weight variable from the list on the left into the slot labeled Frequency Variable on the right as shown below:
Click on OK and exit the dialog box. The indication that the data is weighted appears on the status line near the bottom of the screen. As in the following screen, Weight On is specified there.
05/13/23 64
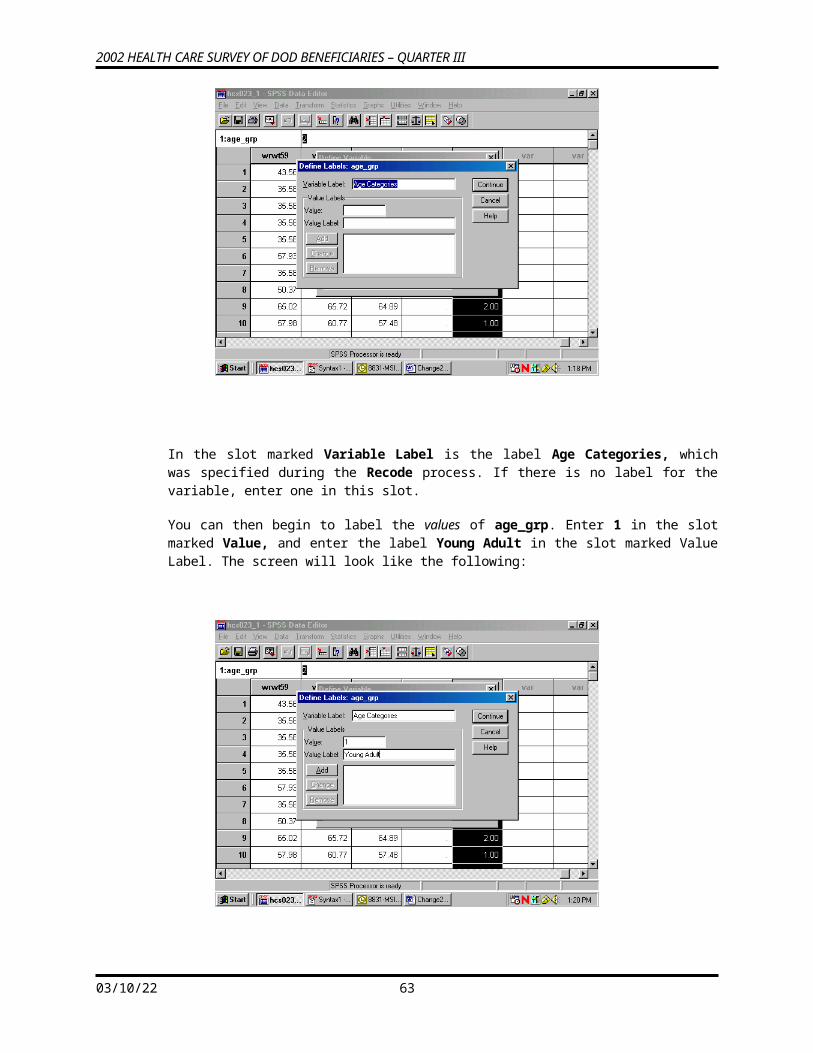
2002 HEALTH CARE SURVEY OF DOD BENEFICIARIES – QUARTER III
The status line indicates if the data is weighted. Which weight variable is in effect can only be checked by re-entering the Weight Cases dialog box. Weighting stays in effect until it is canceled or until another weight variable is activated.
BUILDING TABLES
Building tables starts with creating a new subset of variables that includes H02017, H02056, H02076, cacsmpl, xbnfgrp, xsexa, xregion, xenrllmt, wrwt, and filtr_3. The procedures Means and Crosstabs will probably meet most of your statistical reporting needs. SPSS also offers many options for editing the output tables themselves. Some of these options are explained here.
Calculating Means
As an example, suppose you want to analyze the health care variables and you want to focus on the Southeast (xregion = 3). Suppose you are also interested in overall differences in the mean rating for care received in a military facility as it relates to the beneficiary’s self-evaluation of his health for the Southeast region. Within this grouping, you want to examine the effects of the beneficiary group, xbnfgrp, and sex, xsexa.
The health care variables are H02056 – rating of the health plan, and H02076 – assessment of the state of health. The statistic you want to see is the mean of the health care variables for each group in our breakdown.
For this analysis, you can use the subset of variables defined above. The subset includes the weight variable, wrwt, which you would activate for procedure runs. The subset also includes the new variable, filtr_3, which allows us to select only those cases in the Southeast.
Open the Data menu in the Data Window. In the Weight Cases dialog box, activate the weight variable wrwt. Reopen the Data menu and, in the Select Cases dialog box, activate the filter variable, filtr_3. On the status line, Filter On and Weight On should appear.
Open the Statistics menu in the Data Window. Choose Compare Means and Means from the options as illustrated below.
The dialog box for the Means procedure will open as in the following screen:
05/13/23 65
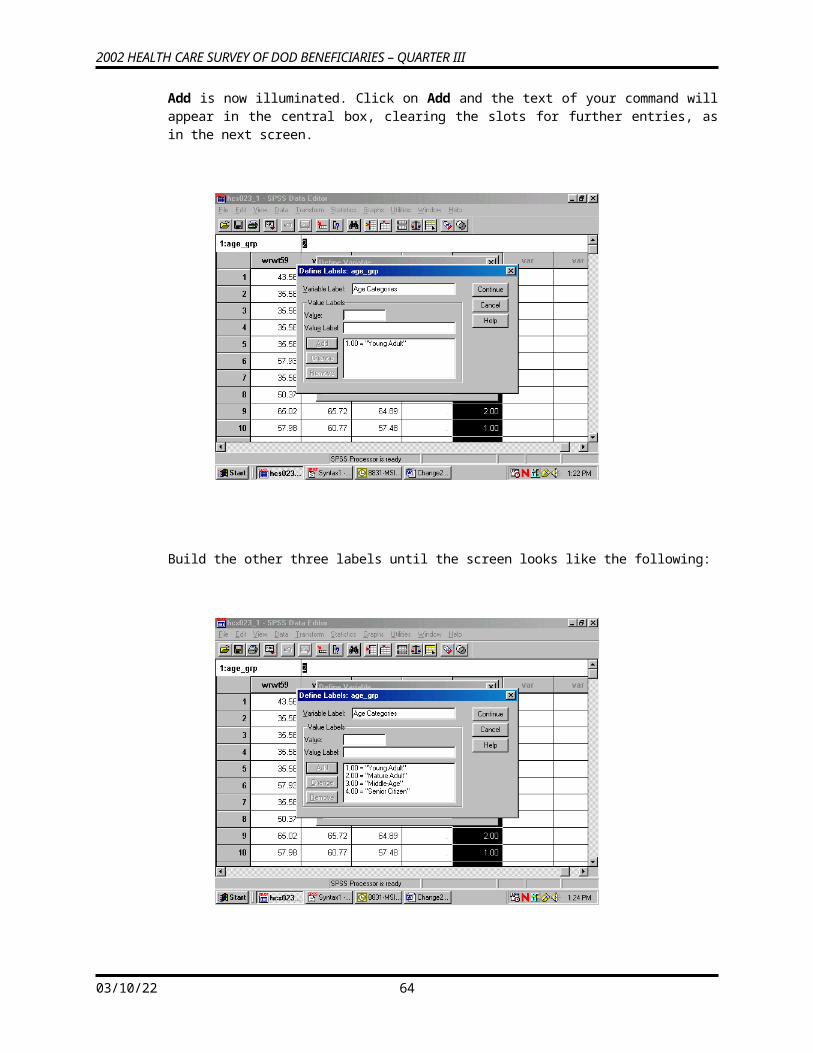
2002 HEALTH CARE SURVEY OF DOD BENEFICIARIES – QUARTER III
Move the health care variables H02056 and H02076, from the variable list on the left to the box underneath Dependent List. These are the two analysis variables. Notice that Layer 1 of 1 is specified in the middle of the dialog box. Move xbnfgrp from the variable list on the left into the box under Independent List. xbnfgrp is the first grouping variable. The screen should look like the following:
Click on Next in the center of the box to create a second layer. The following screen will open:
05/13/23 66
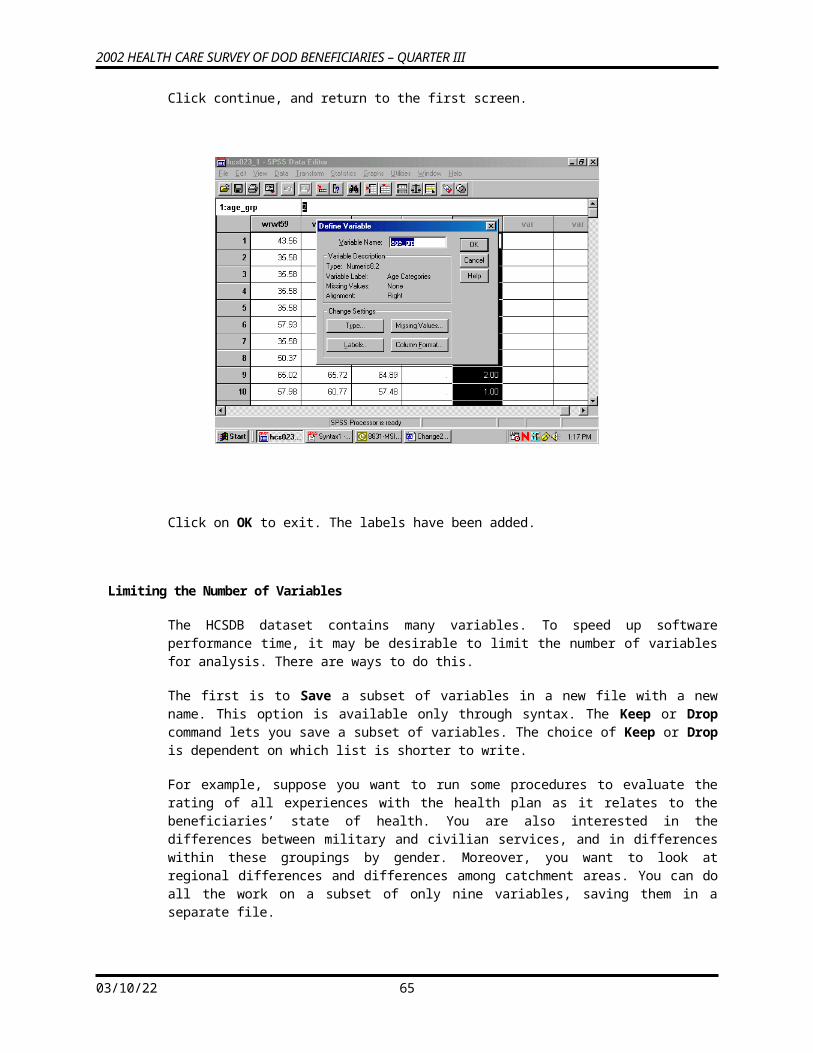
2002 HEALTH CARE SURVEY OF DOD BENEFICIARIES – QUARTER III
Notice that Layer 2 of 2 is specified in the middle of the dialog box. Move xsexa from the variable list on the left into the box under Independent List. Xsexa is the second grouping variable. The screen should look like the following:
To set some options, click on Options and the following dialog box will open:
05/13/23 67
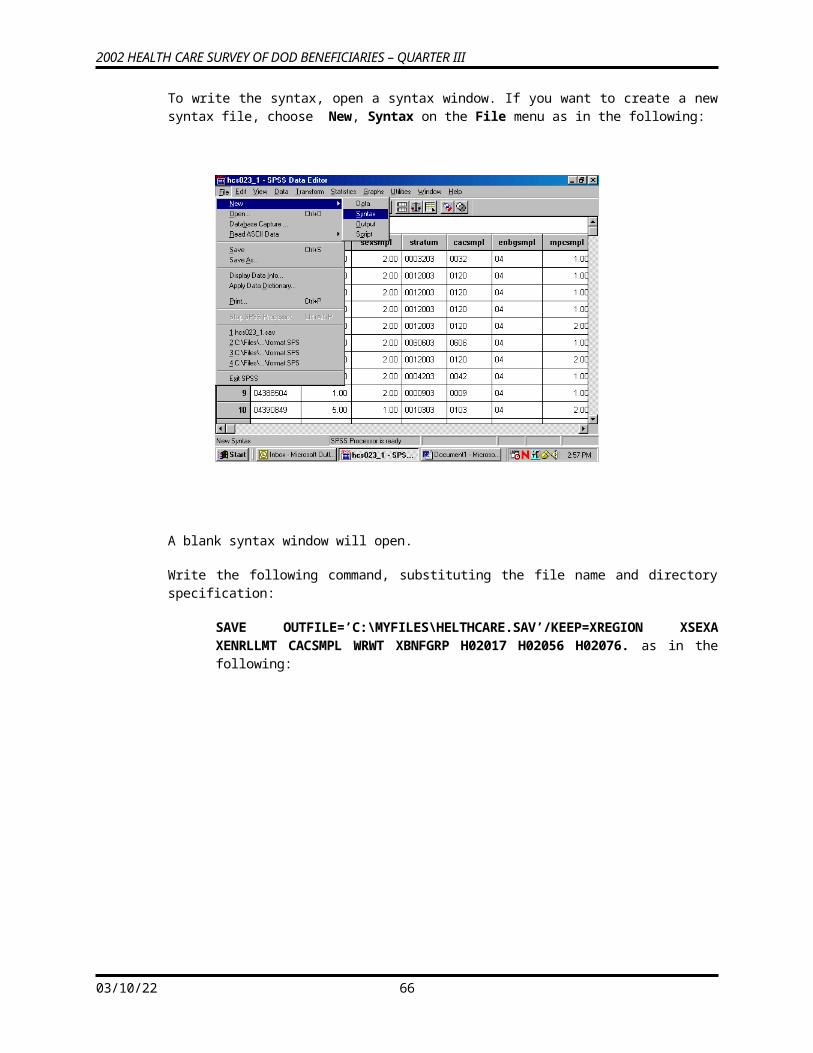
2002 HEALTH CARE SURVEY OF DOD BENEFICIARIES – QUARTER III
On the left of the box is a list of statistics, under Statistics. These are all the possible options for statistical output. In the box under Cell Statistics are the default output statistics for the analysis. In this case, Mean is the statistic of interest. Highlight Number of Cases and Standard Deviation and move them to the box at the left, removing them from the analysis, as follows:
Click on Continue and return to the previous screen. Click OK. The Means procedure will run. On the status line, Running Means will appear, and a counter for the number of cases processed will be activated.
05/13/23 68
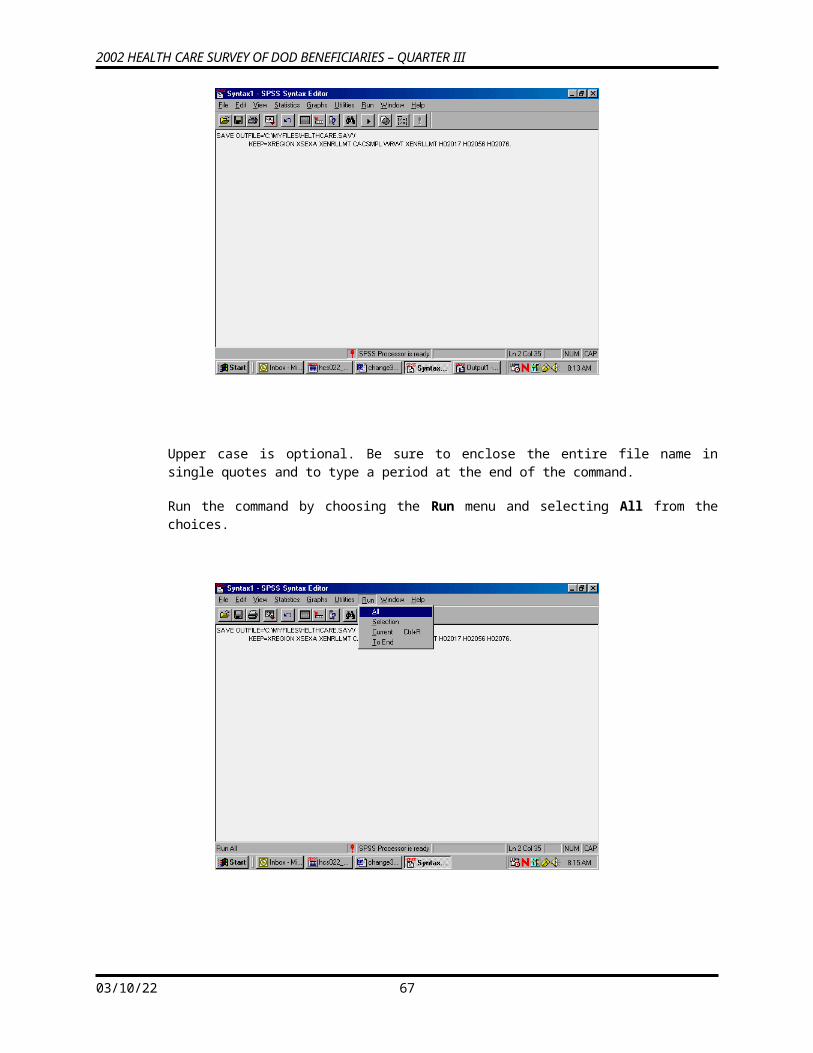
2002 HEALTH CARE SURVEY OF DOD BENEFICIARIES – QUARTER III
When Means has finished processing, the Output Navigator window will open automatically. As the name suggests, the output window is not just for looking at output. A number of options are available for navigating through output, moving tables, and even editing the tables themselves.
The output is organized into two sections. On the left side is a navigating tool, which lists the components of the right side, the actual output. In the left pane, Means is indicated, and indented under it appear Title, Notes, Case Processing Summary, and Report. Clicking on Means highlights and selects all the elements. Lines appear around these elements in the right pane. The indenting indicates that the elements are hierarchically organized, with Means at the top. Clicking on any of the sub-elements selects just that element.
A closer look at the left pane reveals another feature. Hiding underneath the element icons are book icons. The books are either open or closed. If a book is closed, the element is hidden. Notice that the book under the Notes icon is closed. This is a default SPSS option. Double-clicking the icon will open the book, and the Notes will appear in the output. Double-clicking an open book will close it, and the physical element will disappear from the output. Closing a book and hiding the element does not delete the element.
It is possible to select elements in the right pane of the output. Simply click anywhere inside of the actual output element, and that element will be selected.
The output may contain many different procedures. The procedure name will be at the top of the list for each section in the left pane. The procedure name does not actually parallel physical output but indicates the category of the output elements.
As you click on each element in the left pane, you will notice that the screen jumps to the actual output of the element, in the right pane. When you click on the procedure name, you jump to the beginning of the next procedure output. This is a quick way to scroll through your output. It also lets you delete, move, and edit selected elements.
To Edit the Title element, Means, to create a more appropriate title, select the table title by clicking once on the Title icon in the left pane. A box now surrounds the title in the right pane. Double-click anywhere within this box, and a box appears around Means, as shown in the following screen.
05/13/23 69
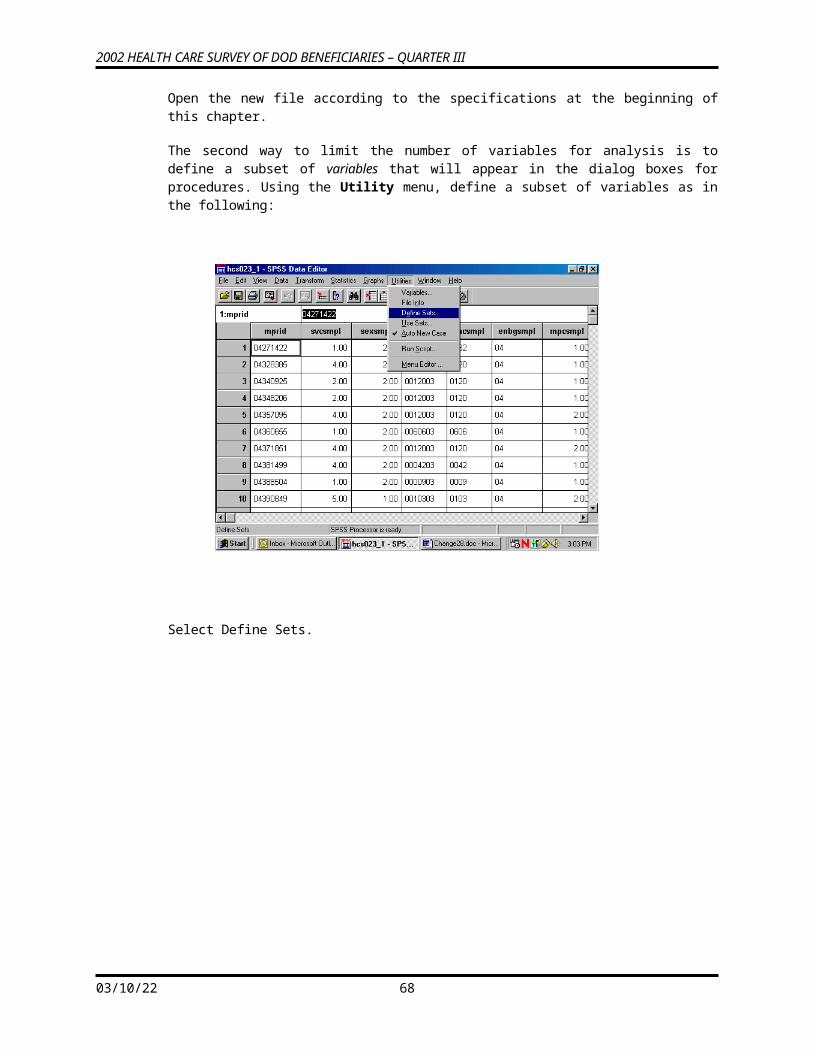
2002 HEALTH CARE SURVEY OF DOD BENEFICIARIES – QUARTER III
You have entered the edit mode for this element, and the cursor appears inside the box. You can delete the word Means and write a title that relates to the information in the table. A possible title appears in the next screen. To exit edit mode, click anywhere outside the box. The change you made will be saved.
If you navigate to the next element, Notes, you see a closed book. Double-click this item, and the notes will appear as follows:
05/13/23 70
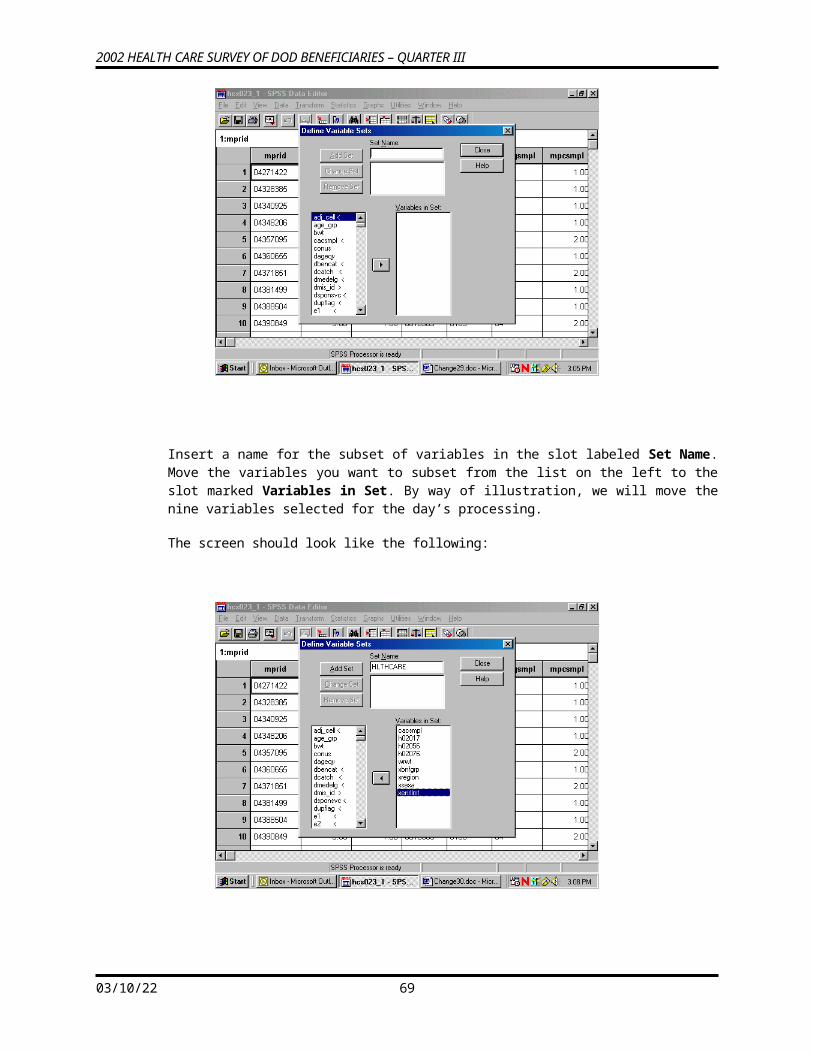
2002 HEALTH CARE SURVEY OF DOD BENEFICIARIES – QUARTER III
Decide if you want this information to appear in your report. If not, simply double-click the Notes icon, and the notes will again become hidden.
Navigate to Case Processing Summary. The table gives useful information about the number of cases included in and the number of cases excluded from a given procedure. This information is important for the researcher but probably not necessary for the report, so you would double click this item to hide it.
Navigate to Report to see the actual table output from the procedure Means. You can view this table by scrolling through the output. If the table is large, however, scrolling in the output window can be problematic. A better way to review the table is to open it as a Pivot Table Object in a special editor.
Select the table by clicking the Report icon or by clicking inside the table itself. A box will appear around the table. Insert the mouse pointer inside the table and right-click, opening the following dialog box:
05/13/23 71
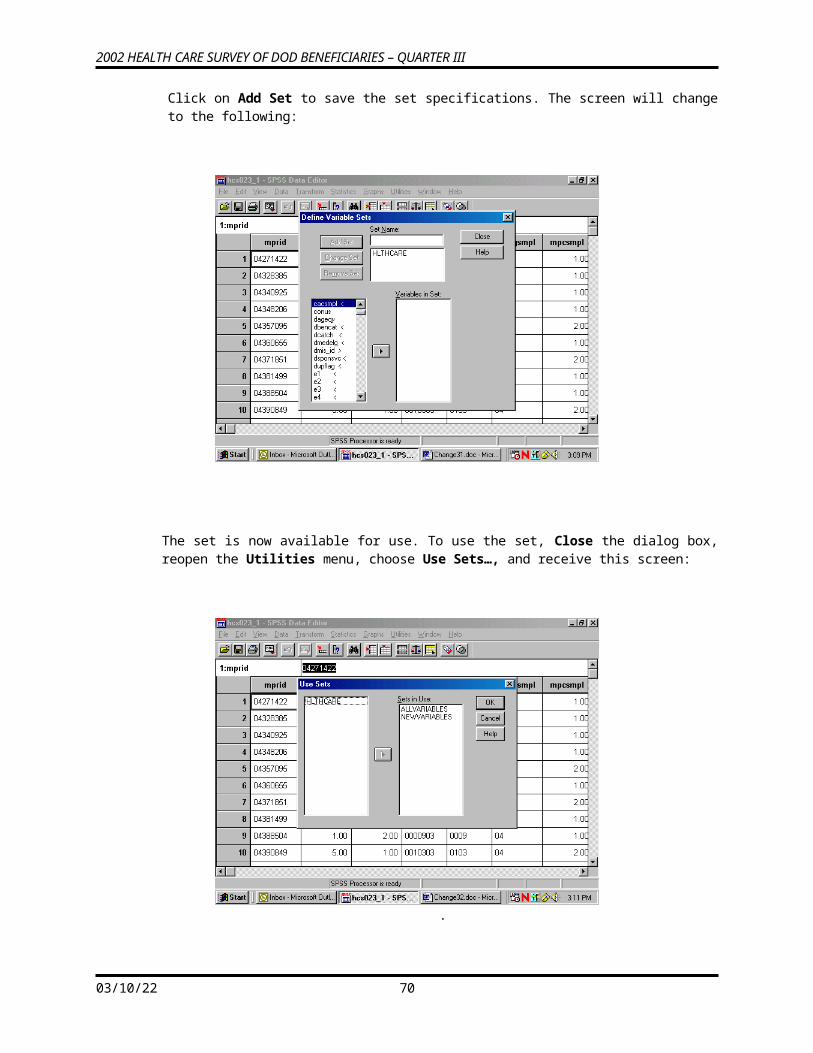
2002 HEALTH CARE SURVEY OF DOD BENEFICIARIES – QUARTER III
Select SPSS Pivot Table Object and Open as pictured below:
The table will appear in a new screen superimposed on the output. Maximize this screen as shown below.
05/13/23 72
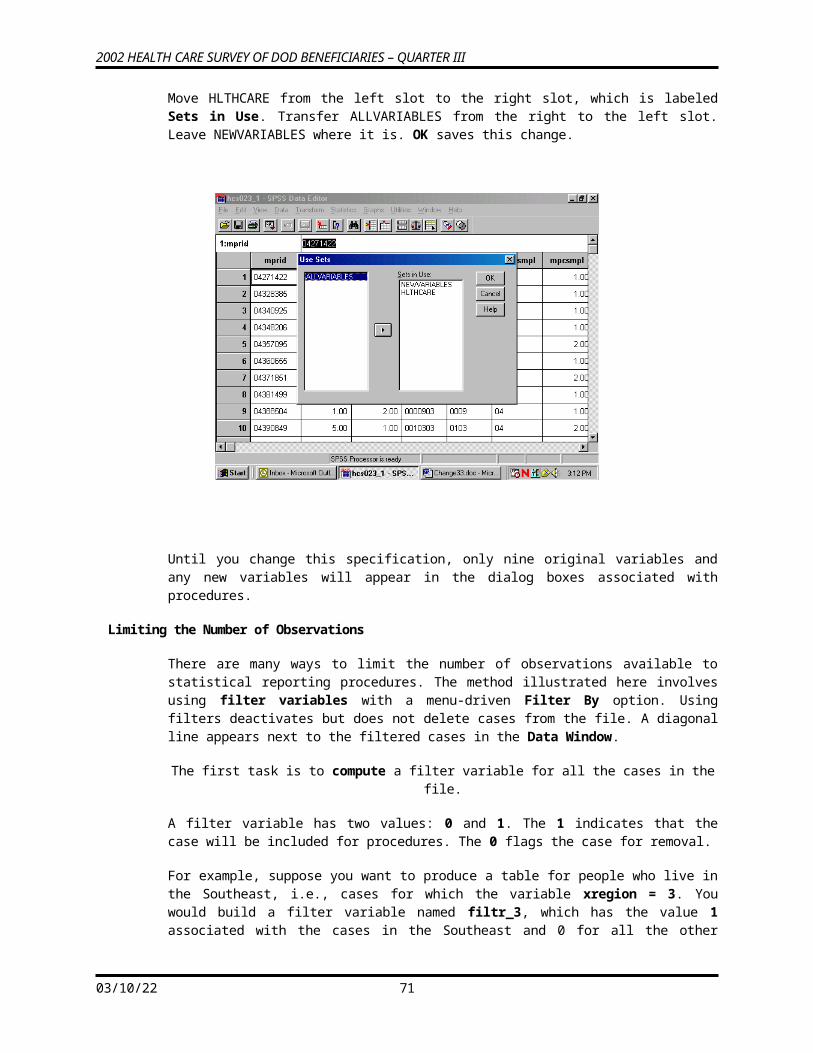
2002 HEALTH CARE SURVEY OF DOD BENEFICIARIES – QUARTER III
In this special editor, there are many options for formatting the table.
Suppose you want to change the table format from vertical to horizontal. Open the Pivot menu in the tool bar and choose Transpose Rows and Columns as shown below:
The rows and columns will be reversed as shown in the following screen. Though the table appears too wide in the viewer, it will fit the page when printed. You can do all the table editing in the left section of the table, and the changes will spread through the entire table.
05/13/23 73
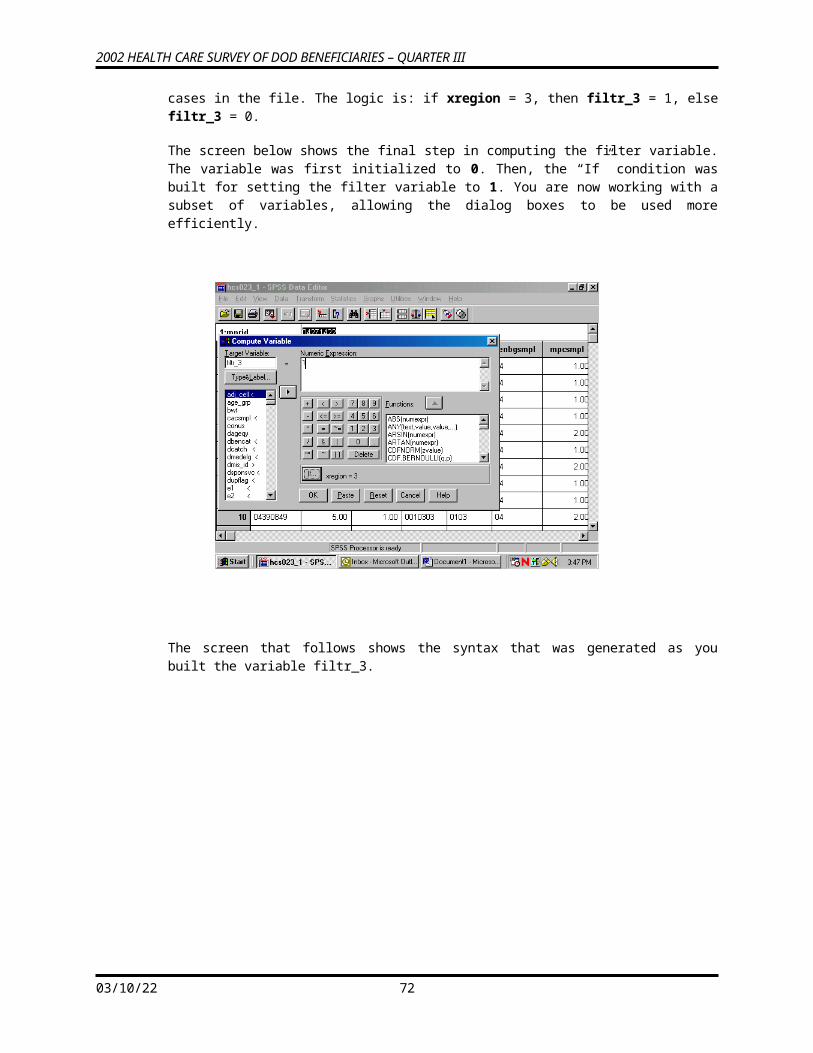
2002 HEALTH CARE SURVEY OF DOD BENEFICIARIES – QUARTER III
You would then notice that certain labels are redundant. The labels, Constructed Beneficiary Group and MALE or FEMALE -R are the Variable Labels for the variables. The information in these labels is echoed in the Value Labels, which are also reproduced in the table. You would delete the Variable Labels as follows.
Click inside the section of the table where the label, Constructed Beneficiary Group, appears. Right-click to open a dialog box, choosing Hide Dimension Label, as illustrated below.
Click inside the table section labeled MALE or FEMALE -R and repeat the above procedure. An improved table is shown in the following screen.
05/13/23 74
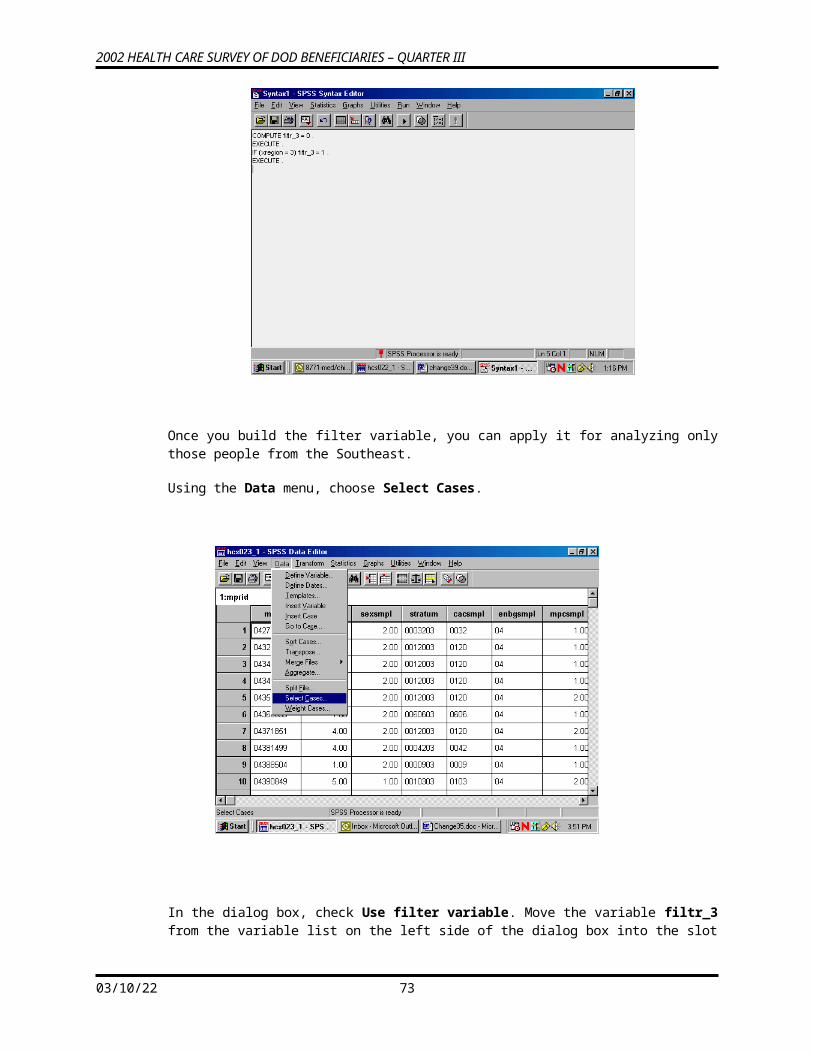
2002 HEALTH CARE SURVEY OF DOD BENEFICIARIES – QUARTER III
The mean values reported are formatted to allow space for the labels of the satisfaction variables. The spaces between the values are not pleasing to the eye. You can shorten these labels and add the lost information in another place, according to the following procedures:
Double-click on the label for health state. Delete the text, entering only the word, Health State. Do the same for the health care label, entering only the words, Plan Rating.
Double-click on the word, Report, in the center at the top of the table, right-click, and choose Delete from the dialog box.
05/13/23 75
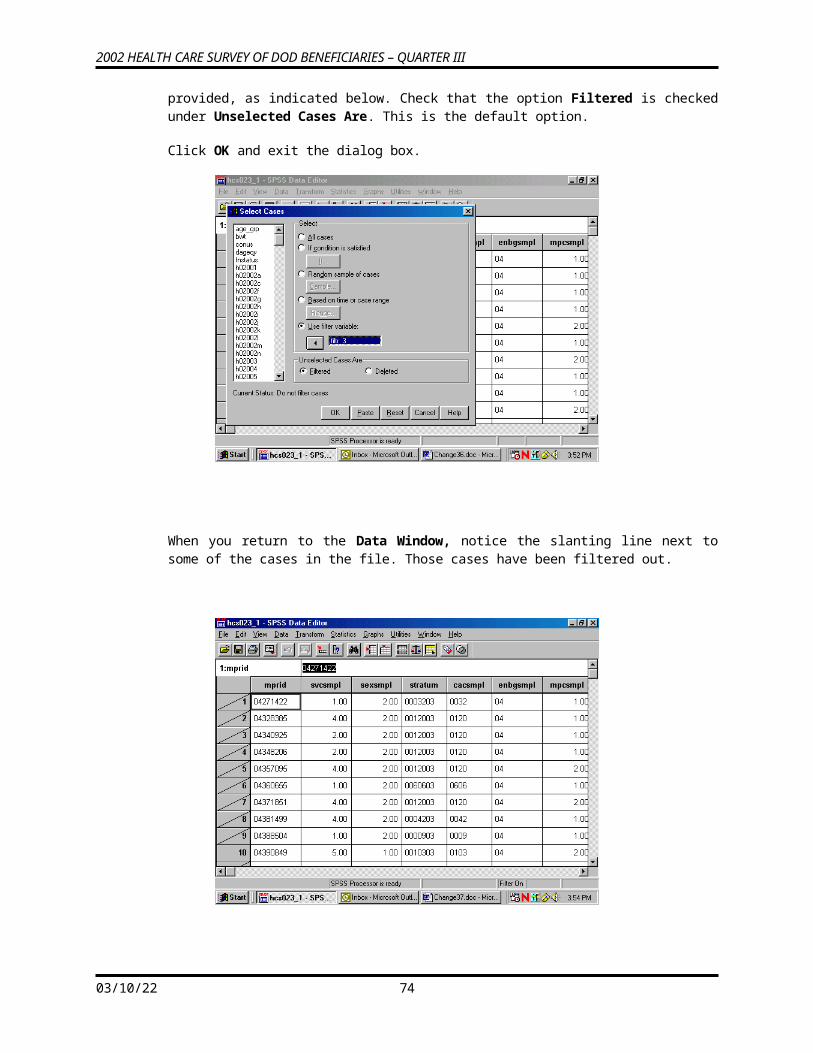
2002 HEALTH CARE SURVEY OF DOD BENEFICIARIES – QUARTER III
The resulting table is much more readable. You can then add the deleted information to clarify the table output. Double-click on the label Mean at the top left corner of the table, opening the line for editing. Type in a new title for the table. The final result appears below.
After all the editing changes have been made, exit the Pivot Table editor and return to the output navigator. Click on the File menu and choose Print Preview. Zoom in on the page and review the appearance of the report. The page will appear as the page below.
05/13/23 76
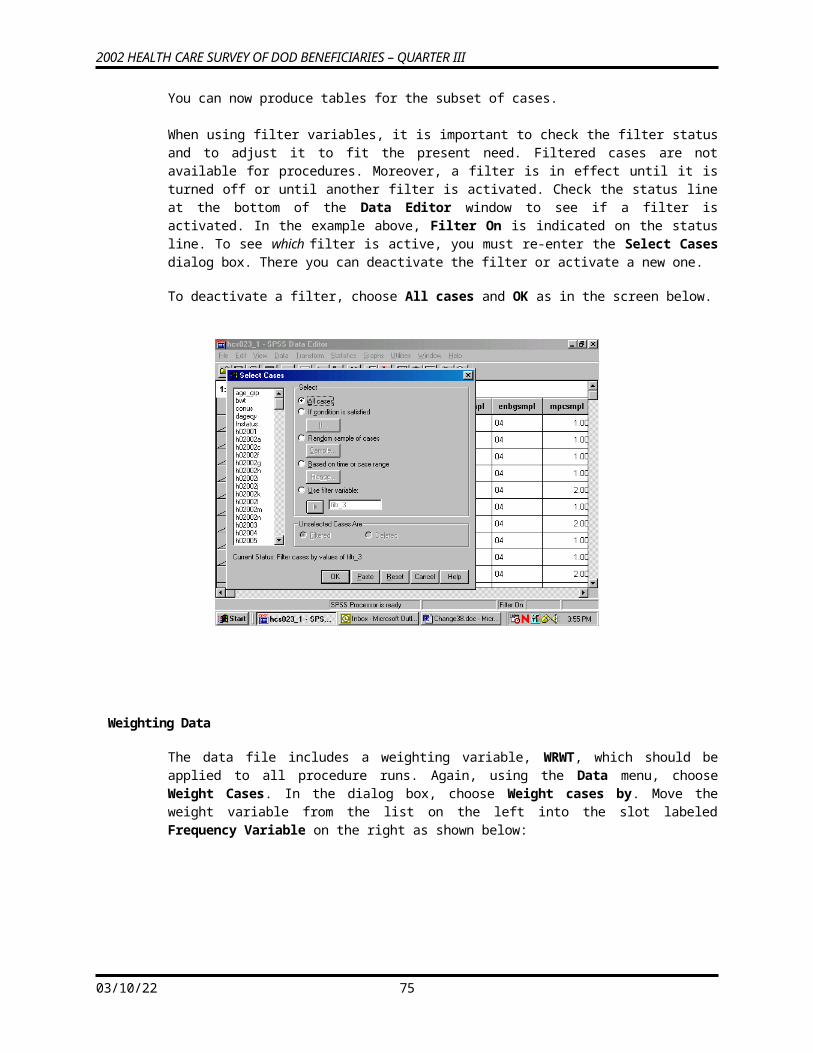
2002 HEALTH CARE SURVEY OF DOD BENEFICIARIES – QUARTER III
Calculating Percents
The Crosstabs procedure offers many options for analyzing data. The distribution of cases resulting from “crossing” one variable with another is often of interest. The number of cases, row percentages, column percentages, total percentages, and residuals are easily reproduced by Crosstabs. A full array of statistics is also available.
The examples given here involve examining relationships between variables, with a view toward the number of cases and the percent of cases in cells produced by “crossing” the variables.
For example, suppose you want to see the percentage of people in the Southwest catchment areas who answered “yes” or “no” to the question, “Did you see a specialist in the last 12 months?” The variables in this analysis are cacsmpl – the catchment area, and H02017 – the question variable. The cases for the analysis are from the Southwest only.
The first task is to build a new filter variable, assigning 1 to the variable when xregion = 6. You would call the variable filtr_6 and build it the same way you built the filter, filtr_3. Cases from the Southwest are selected when you activate the filter, and the other cases are filtered out. Check the status line for Filter On.
Next, open the Statistics menu in the Data Window, choosing Summarize and Crosstabs , as shown below.
05/13/23 77
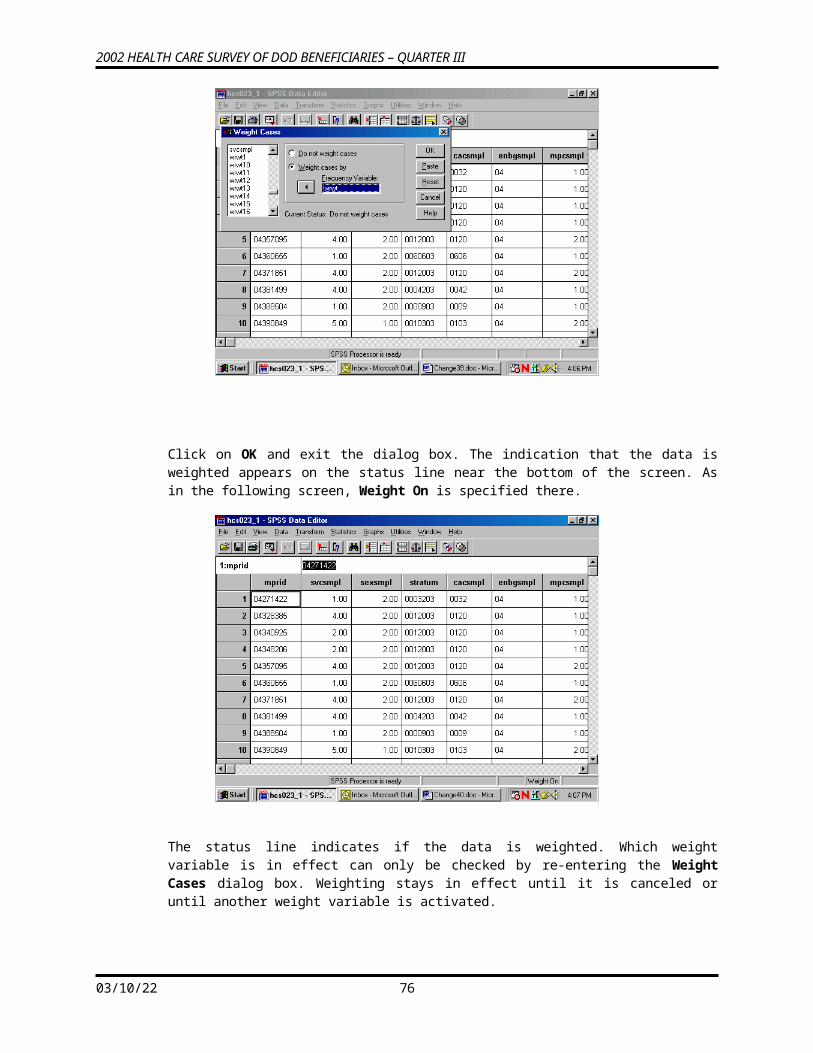
2002 HEALTH CARE SURVEY OF DOD BENEFICIARIES – QUARTER III
The Crosstabs dialog box will open as follows:
Move H02017 from the variable list on the left into the box marked Row(s):, and move the variable cacsmpl into the box marked Column(s):. The screen will resemble the following:
For this analysis, there are no Layer variables, so you can proceed to format the table cells.
Click on Cells... and open the following dialog box.
05/13/23 78
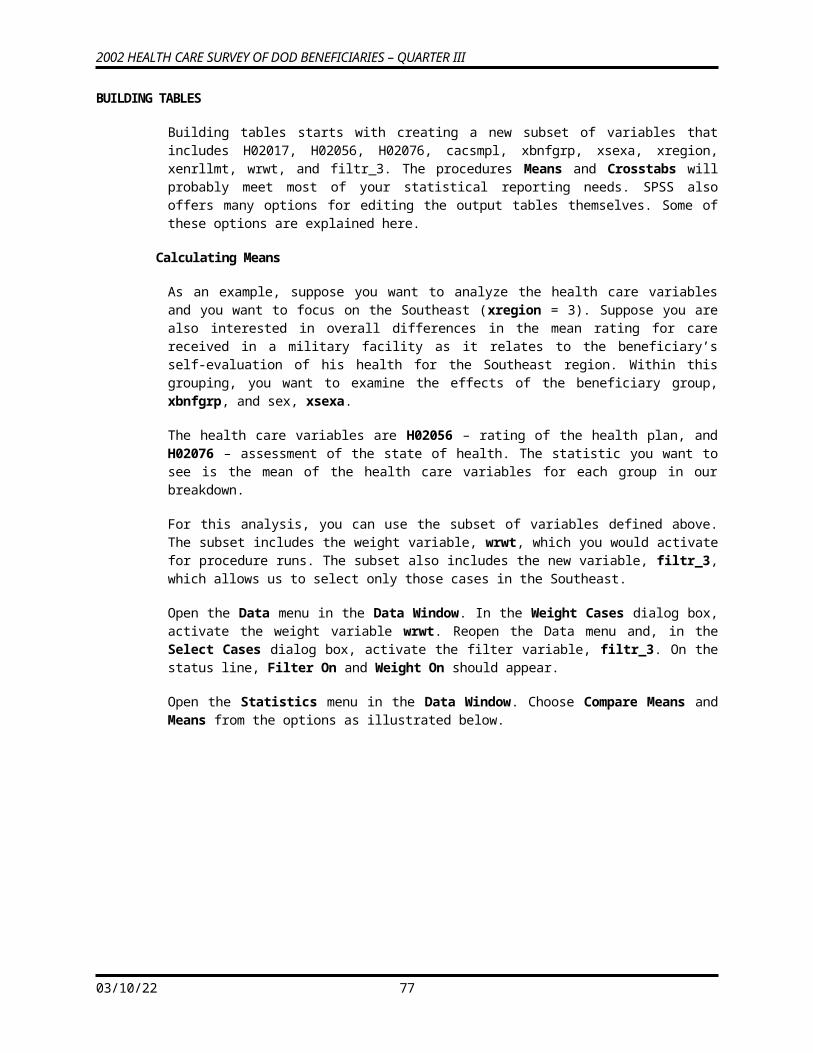
2002 HEALTH CARE SURVEY OF DOD BENEFICIARIES – QUARTER III
Under Counts, Observed is checked. This refers to the cell count, a statistic you want to see, so you would leave it checked. Under Percentages, check Column because you are interested in the percentage of people in each catchment area. Click Continue and return to the original screen.
Suppose you also want to see the chi-square statistic. Click on Statistics, and the following screen will open:
05/13/23 79
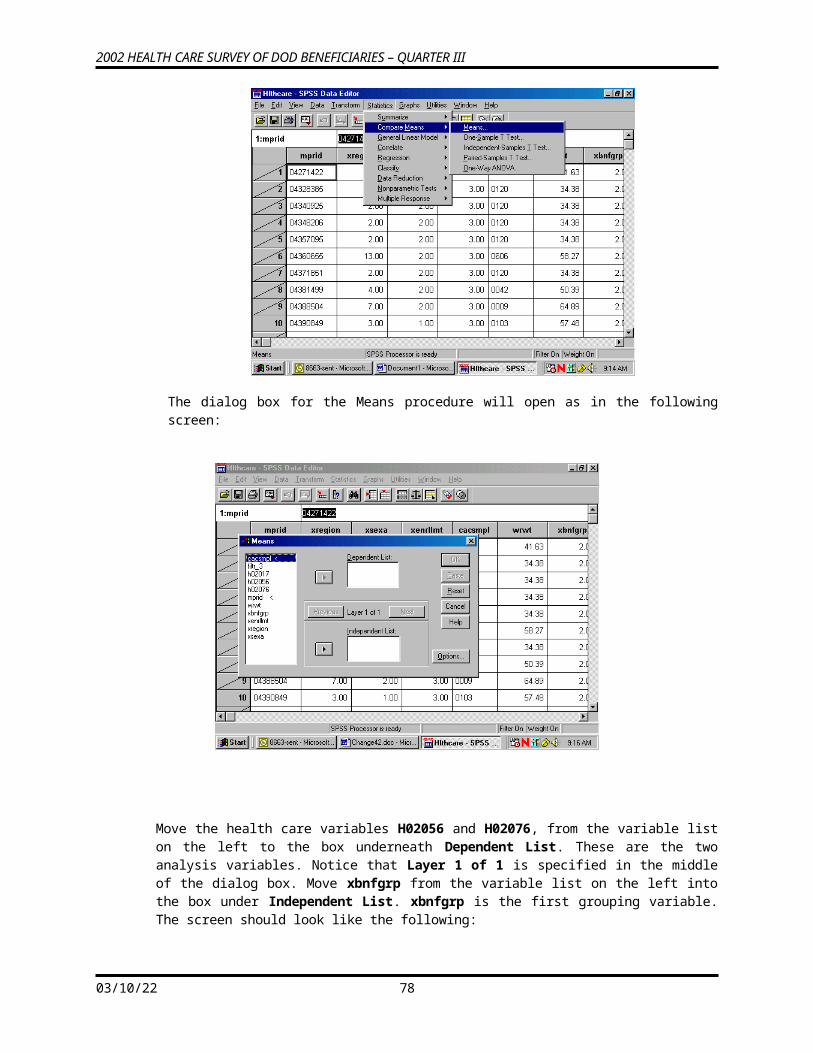
2002 HEALTH CARE SURVEY OF DOD BENEFICIARIES – QUARTER III
Check Chi-square as in the screen above, click Continue to return to the first screen, and click OK to run the procedure. Running Crosstabs will appear on the status line, together with the case counter.
When the run is completed, the output window will open, and you can proceed to reformat the table. For a given work session, SPSS appends new output to previous output--in our case, the Means procedure. As shown in the next screen, a second section now appears in the left pane, headed by the word Crosstabs. Navigate to the Title section and double-click inside the title box to change the text in the box to fit the table, as in the example below.
As you did for the Means procedure, you would again evaluate the Notes and examine the Case Processing Summary. Hide the Notes and delete the Case Processing Summary as you did before.
Navigate to the procedure icon. Follow the procedure for opening an SPSS Pivot Table Object, open the table in the special editor and maximize the screen as in the following:
05/13/23 80
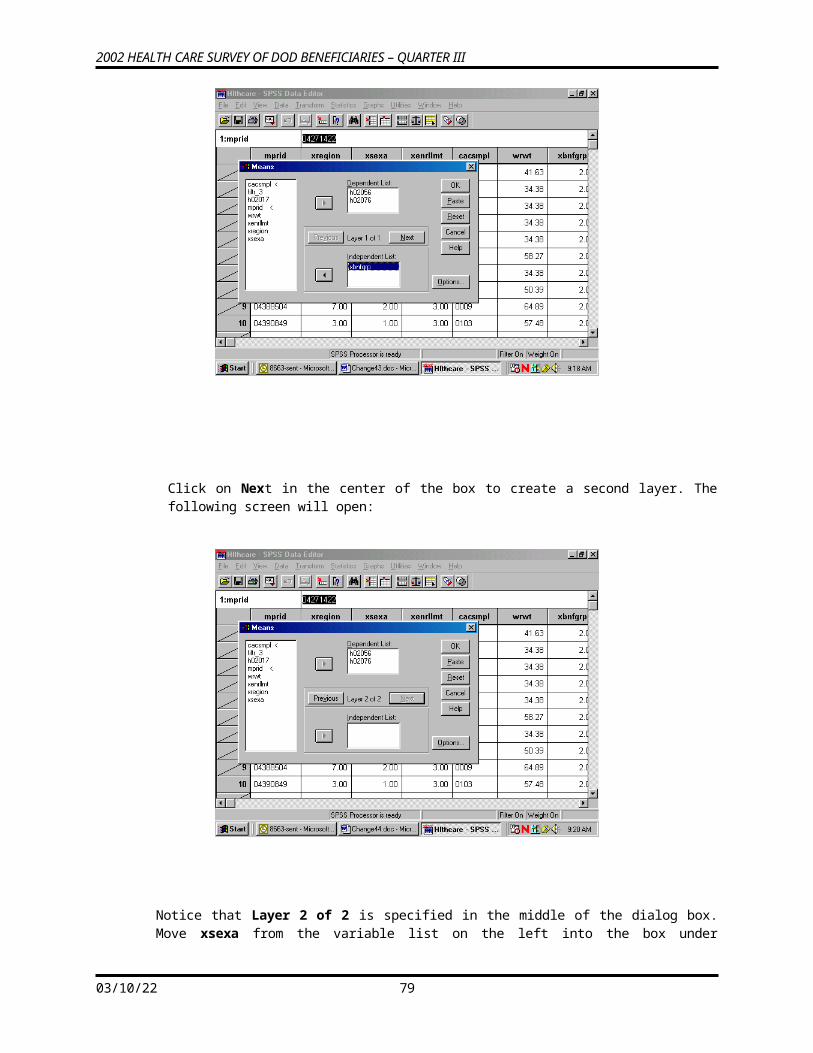
2002 HEALTH CARE SURVEY OF DOD BENEFICIARIES – QUARTER III
The information you requested is in the table, but the table is hard to read. The first possibility is to realign the percent statistic, bringing it into the row dimension. To do this, open the Pivot menu and choose Pivoting Trays, as in the following screen:
The pivoting tool will appear:
05/13/23 81
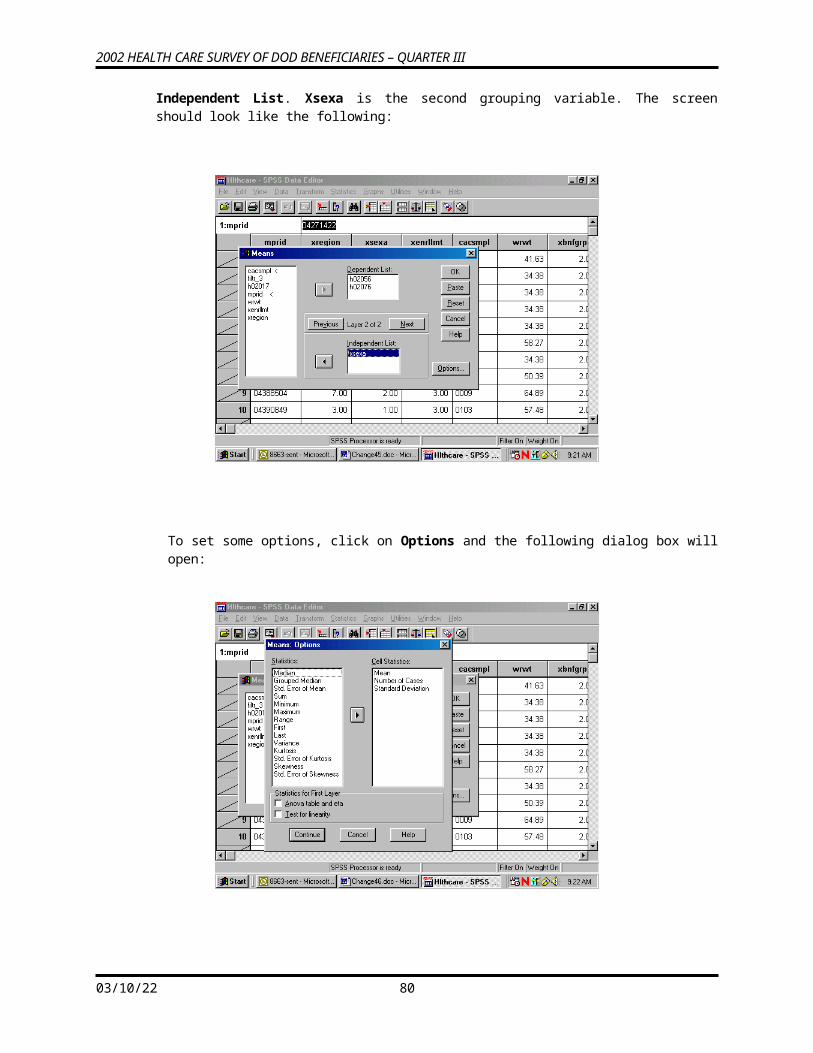
2002 HEALTH CARE SURVEY OF DOD BENEFICIARIES – QUARTER III
This tool reflects the table structure: rows, columns, and layers. The icons in the margins of the pivoting trays represent the table elements: the variables and the cell statistics. Place the mouse pointer on each icon and notice the element name appear. In this example, on the ROW axis, you would find the variable, H02017 – saw specialist in the last 12 months, and Statistics – the percent of people in each catchment area. On the column axis is the variable, cacsmpl – the catchment area.
Place the mouse pointer on the Statistics icon. Click and drag the icon from the ROW to the COLUMN dimension. The table immediately reformats as in the following screen:
05/13/23 82
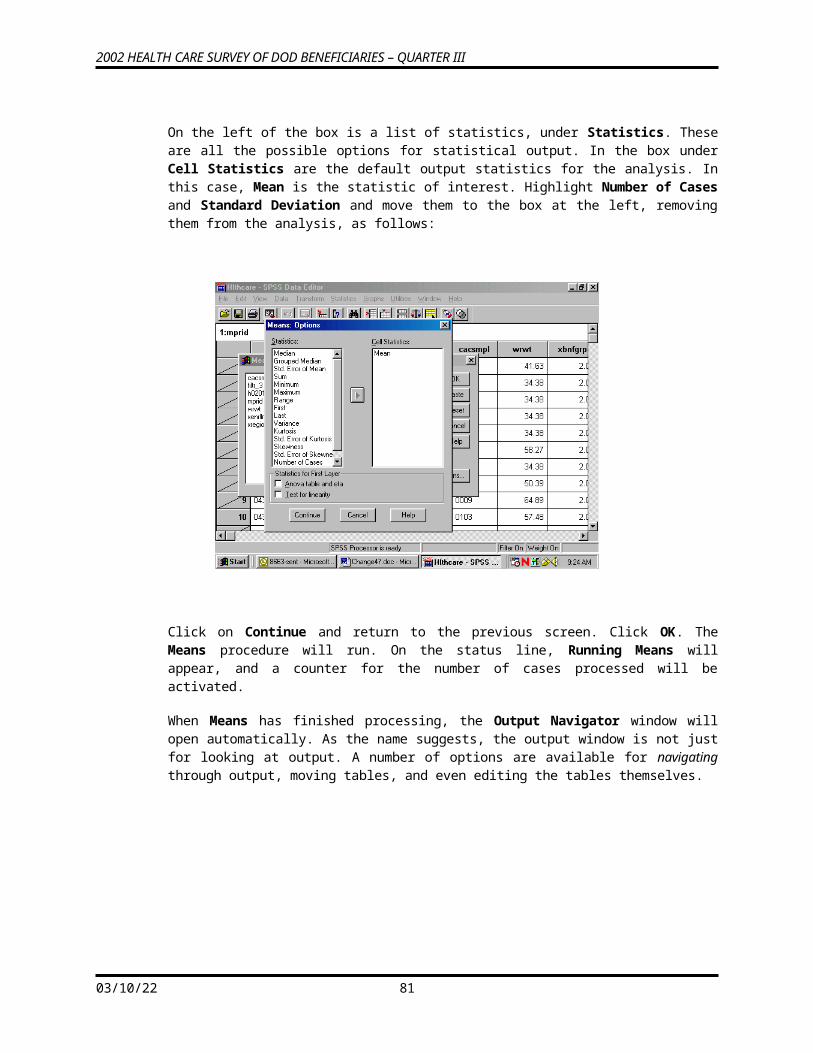
2002 HEALTH CARE SURVEY OF DOD BENEFICIARIES – QUARTER III
Close the pivoting tool and scroll from side to side in the table. Again, the table appears too wide, but the report will print properly. Notice that the table is much more readable.
The label at the top of the table is the Variable Label for cacsmpl. Select it by double-clicking and edit it for clarity (see the screen below).
The table is now formatted to accommodate the long percent label, creating a lot of wasted space. Double-click this element, delete the text, and replace it with the word, “Percent”. The empty space disappears and the table appears as follows:
Next, notice that the label for H02017 is awkward. Select and clear it.
Last, edit the text in the table label so that it better expresses the content of the table. The finished table appears as follows:
05/13/23 83
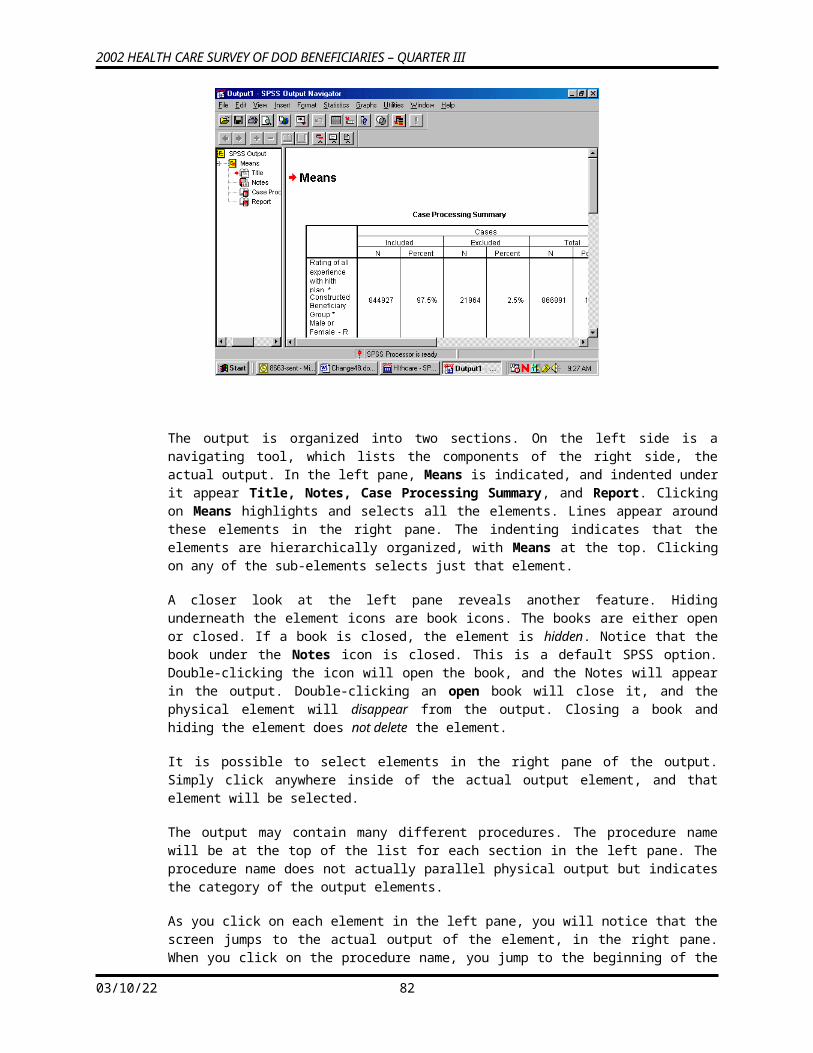
2002 HEALTH CARE SURVEY OF DOD BENEFICIARIES – QUARTER III
Check Print Preview to see if the table is acceptable.
The last example shows you how to add a Layer dimension to a Crosstabs analysis. Using the same row variable, H02017, suppose you want to look at the percentage of people by their enrollment status in TRICARE Prime, xenrllmt, who saw a specialist in the past 12 months. Suppose you are also interested in sex differences, xsexa, among the groupings. Xsexa is the Layer variable. You want to remain in the Southwest region, using filtr_6 as the filter variable. The cases will be weighted by wrwt.
The status line indicates Weight On and Filter On. Verify that both the weight and the filter variables are appropriate.
Once more, open the Crosstabs dialog box, enter the analysis variables, and set the Cells options, checking Column under Percentages until the dialog box looks like the following:
05/13/23 84
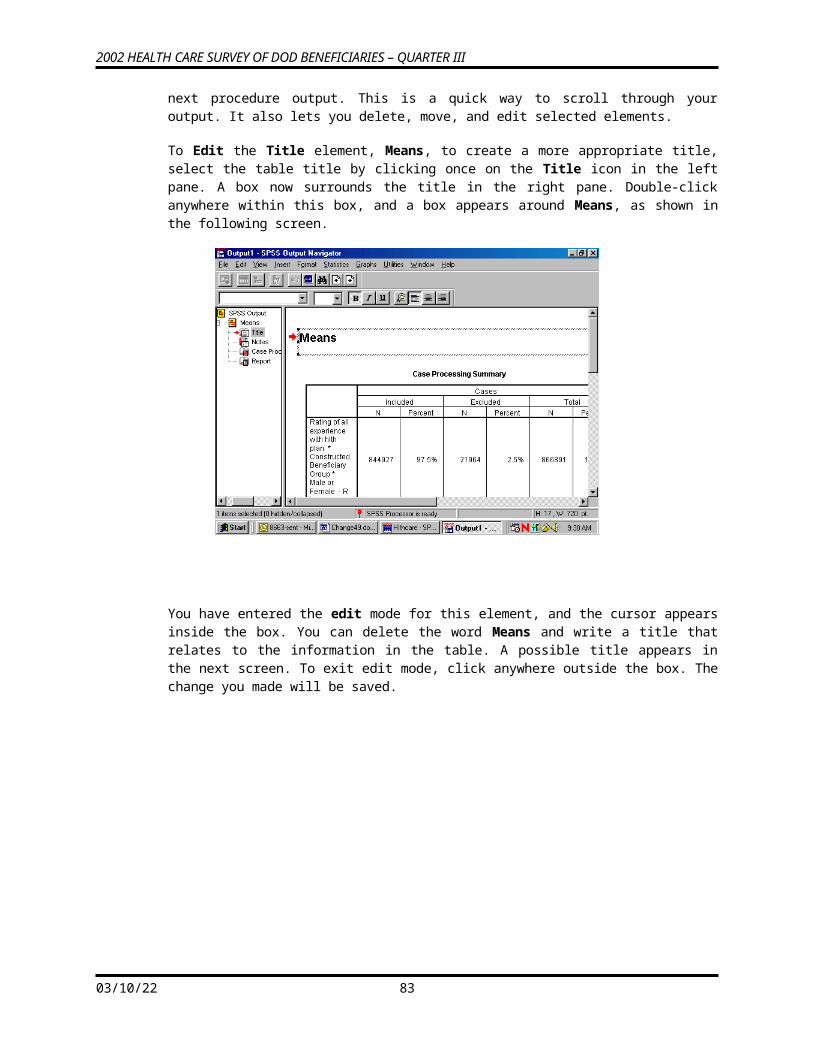
2002 HEALTH CARE SURVEY OF DOD BENEFICIARIES – QUARTER III
Do the following:
Run Crosstabs.
Edit the Title element in the Output Navigator.
Examine Notes and the Case Processing Summary to verify that the crosstab ran as expected.
Open the table as an SPSS Pivot Table Object, and the following will appear:
The table is difficult to read, but you can improve it by doing the following.
Select the Pivot menu to activate the Pivoting Trays. The table structure is reproduced in the tool as follows:
05/13/23 85
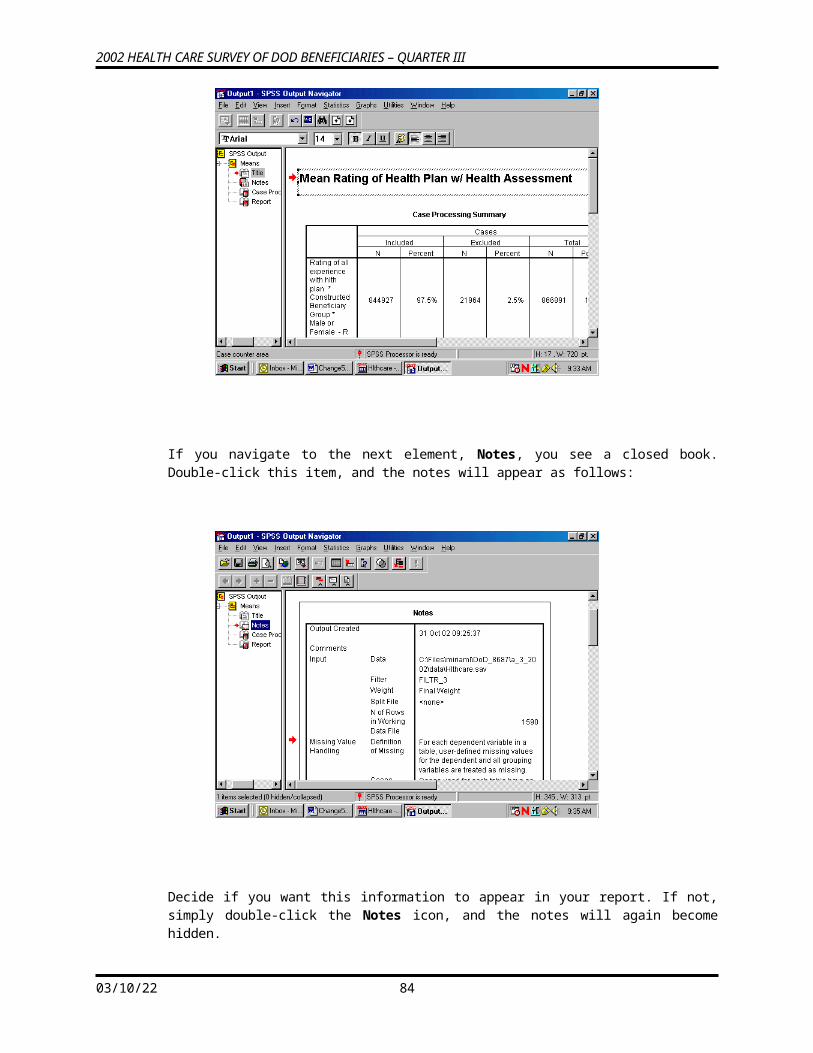
2002 HEALTH CARE SURVEY OF DOD BENEFICIARIES – QUARTER III
Place the mouse pointer on each small icon to find the second grouping variable, labeled MALE OR FEMALE-R, in the ROW dimension. Move it to the COLUMN dimension, and the table changes to the following:
Then drag the Statistics icon to the COLUMN dimension to produce the following change:
05/13/23 86
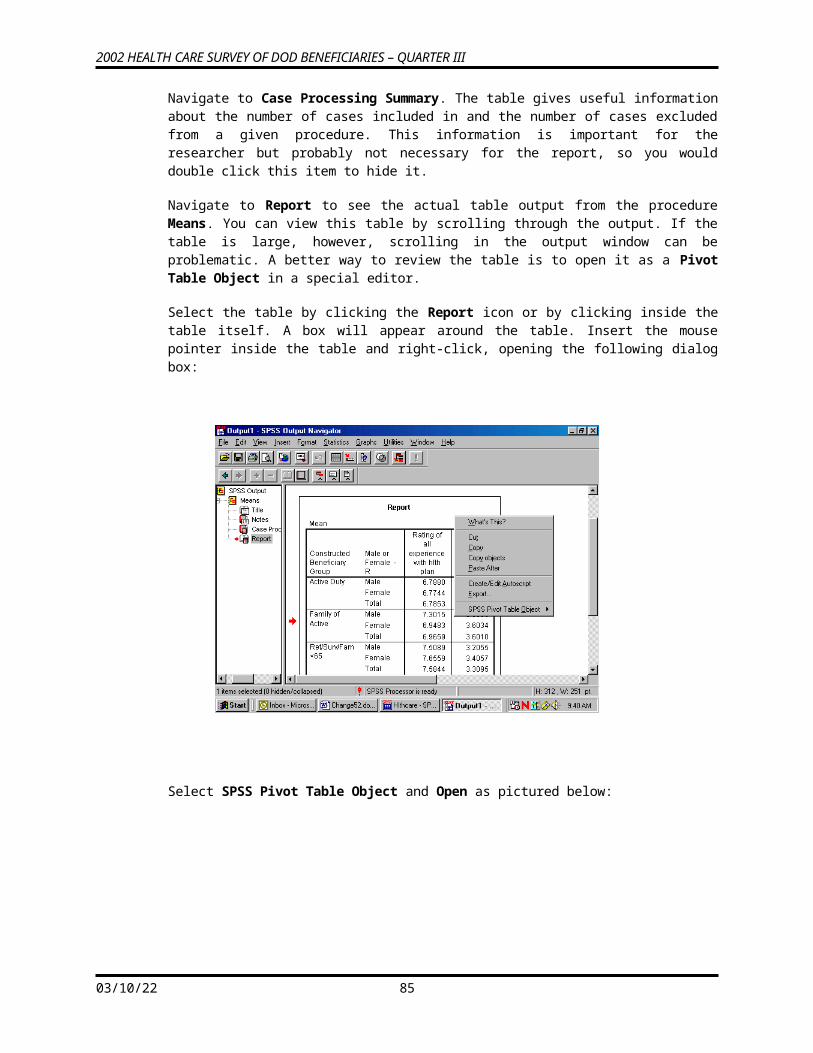
2002 HEALTH CARE SURVEY OF DOD BENEFICIARIES – QUARTER III
Close the Pivoting Trays and hide the dimension label, MALE OR FEMALE-R, in the table. Then, change the percent label to “Percent” and delete the label for H02017 in the row dimension. Last, revise the label above the table to make it more informative.
The resulting table is both clear and informative.
The Print Preview, as in the view below, shows how the report will print.
05/13/23 87
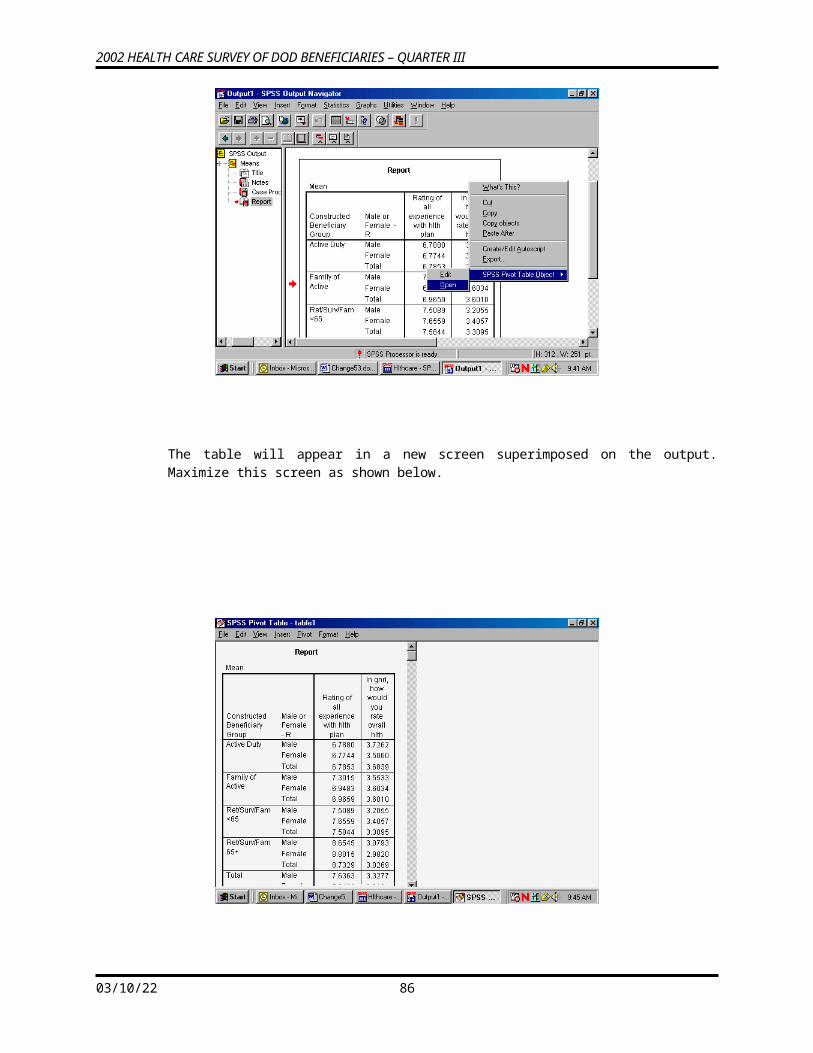
2002 HEALTH CARE SURVEY OF DOD BENEFICIARIES – QUARTER III
CALCULATING VARIANCES OF ESTIMATES
Sampling error occurs when estimates are derived from a sample rather than a complete census of the population. The sample used for a particular survey is only one of a large number of possible samples of the same size and design that could have been selected. Even if the same questionnaire and instructions were used, the estimates from each sample would differ from the others. The standard error (or square root of the variance) indicates the magnitude of the sampling error and thus measures the precision expected from a particular sample.
It is desirable to assess the accuracy of an estimate. The standard error of a survey estimate measures the precision with which an estimate from one sample approximates the true population value. The standard error can be used to construct confidence intervals for survey parameters, within which the true parameter lies within a measurable degree of certainty.
This section explains how to estimate standard errors or variances for estimators computed from the 2002 Adult HCSDB. For a full discussion of variance estimation methods, see Wolter (1985) and references cited therein.
Variance Estimation Methods
To account for the sample design,1 it is customary to use either Taylor series linearization or a resampling method for variance estimation. Neither variance estimation method, in general, is better so the choice of one or the other is largely a matter of convenience. To help users to estimate standard errors using Taylor series linearization or jackknife replication, the public release files for the Quarter III 2002 Adult HCSDB include the following variables:
The stratum variable and the final annual (ADJ_CELL and WRWT) weight for the Taylor series linearization method
Quarterly final weight (WRWT) and jackknife replicate weights (WRWT01 to WRWT60)
Two popular software packages are available for performing Taylor series linearization or the jackknife replication method: SUDAANTM (Shah et al. 1997) and WesVarPC (Brick et al. 1996), respectively.2 The discussion below explains how SUDAAN and WesVarPC are used to calculate variance estimates using Taylor series linearization and jackknife replication methods.
1The 2002 HCSDB uses a stratified sampling design. For details, see N.A. Clusen and D.S. Jang. “The 2000 Health Care Survey of DoD Beneficiaries: 2001 Adult Sample Design.” Washington, DC: Mathematica Policy Research, November 2001.
2The latest version for SUDAAN 7.5 and SAS 8.0 can be used for replication methods including jackknife variance estimation.
05/13/23 88
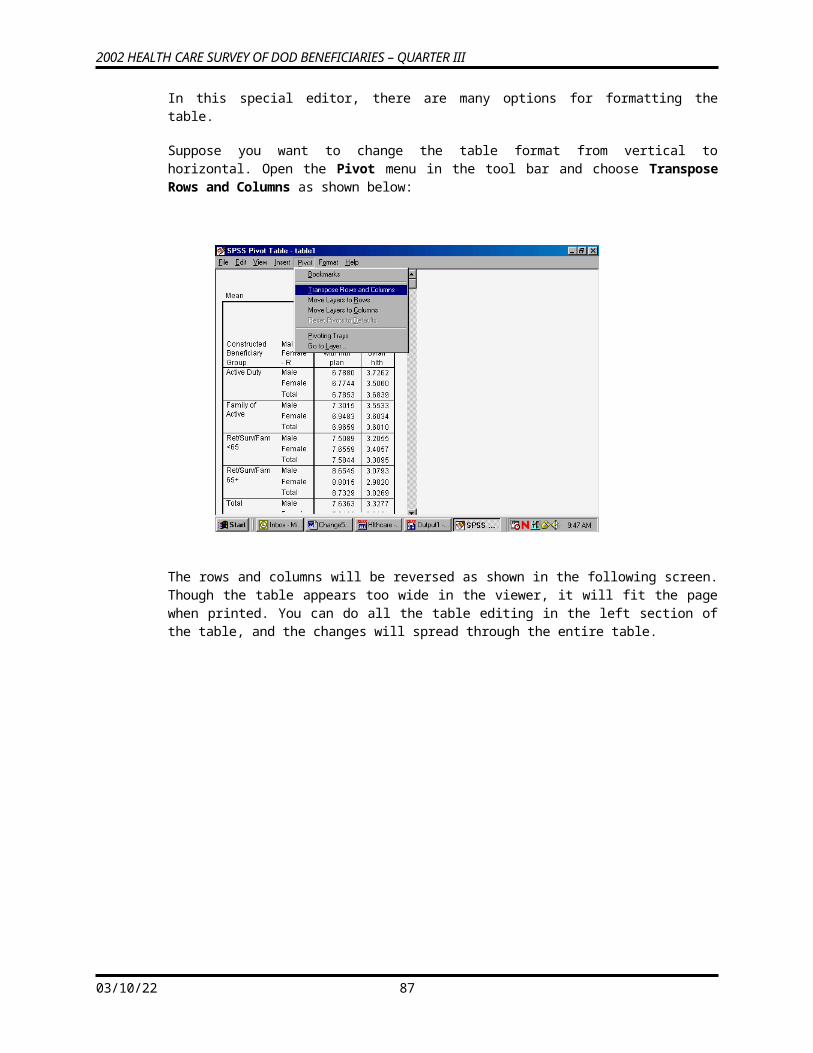
2002 HEALTH CARE SURVEY OF DOD BENEFICIARIES – QUARTER III
Taylor Series Linearization Method
For most sample designs (including the 2002 Adult HCSDB), design-based variance estimates for linear estimators of totals or means can be obtained with explicit formulas. However, nonlinear functions such as ratios do not have exact expressions for the variance. The Taylor series linearization method approximates the variance of a nonlinear estimator with the variances of the linear terms from the Taylor series expansion. Woodruff (1971) presented applications of this technique to sample surveys. Details on this method can also be found in “The 2002 Health Care Survey of DoD Beneficiaries: Adult Technical Manual”.
To calculate variance estimates based on Taylor series linearization method with HCSDB’s stratified sampling design, both the stratum variable (ADJ_CELL) and the final weight (WRWT) specified for each data record are needed.
SUDAAN incorporates the final analysis weight and the survey design to obtain estimates and their sampling errors. With a small overall sampling rate of about 1 percent, you can use the with-replacement design procedure (STRWR) in calculating standard errors.
All SUDAAN procedures require the following:
The specification of sampling designs. The terminology for the stratified with-replacement sample design is DESIGN = STRWR.
The data file sorted by the variable specified in the NEST statement. For the Quarter II 2002 Adult HCSDB, the data file for adults must be sorted by ADJ_CELL before using any SUDAAN procedure.
A FILE TYPE appropriate for SUDAAN, if you use a stand-alone SUDAAN program. For example, some SUDAAN PC versions under Windows or MS-DOS accept only V6.02 through V6.04 SAS files, and FILE TYPE must be specified as SAS. SAS-callable SUDAAN is also available and can be invoked directly in a SAS program with any available SAS file as input; FILE TYPE is not needed here.
The WEIGHT variable is WRWT
The following program is an example of how to use SUDAAN to calculate variance estimates for a mean statistic. Suppose you want to estimate:
H02018 among all beneficiaries in the past 12 months who saw a specialist (H02017=1) for each region (XREGION)
PROC DESCRIPT DATA=HCSDB /*FILETYPE=SAS*/ DESIGN=STRWR;WEIGHT WRWT;NEST ADJ_CELL;SUBPOPN H02017=1;SUBGROUP XREGION;LEVELS 16;VAR H02018;
The following program is an example of how to use SUDAAN to calculate variance estimates for column percentages or row percentages. Suppose you want to estimate:
05/13/23 89
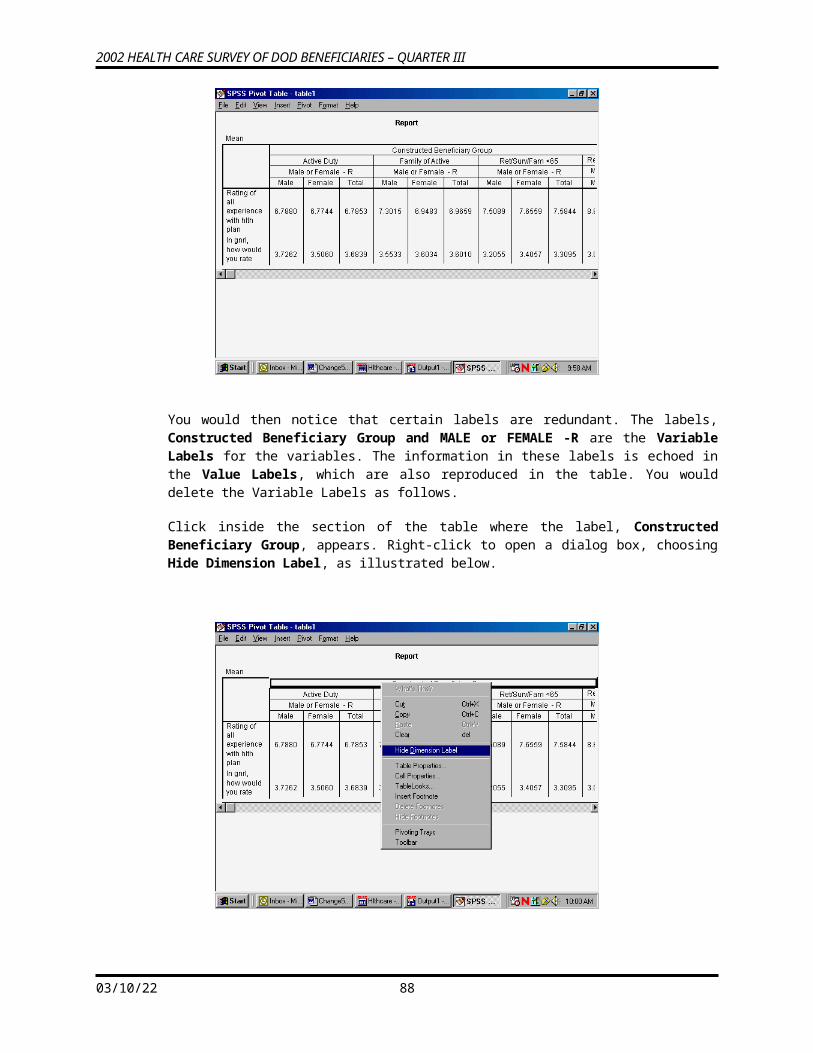
2002 HEALTH CARE SURVEY OF DOD BENEFICIARIES – QUARTER III
A cross tabulation of respondents in Region 3 who last had a blood pressure reading less than 12 months ago, 1 to 2 years ago, and more than 2 years ago (H02059) by TRICARE enrollment (XENRLLMT).
PROC CROSSTAB DATA=HCSDB /*FILETYPE=SAS*/ DESIGN=STRWR;WEIGHT WRWT;NEST ADJ_CELL;SUBPOPN XREGION = 3;SUBGROUP H02059 XENRLLMT;LEVELS 3 5;TABLES H02059 *XENRLLMT;
From the above examples, users should note that:
PROC DESCRIPT can be used to compute estimates of means and the corresponding standard errors.
PROC CROSSTAB can be used to compute estimates of proportions and the corresponding standard errors.
For a more detailed and complete discussion of how to use SUDAAN, see Shah et al. (1997).
Jackknife Replication Method
Another popular way to estimate the variance is to use a resampling method such as jack -knife replication, balanced repeated replication, random groups, or the bootstrap method. Like other replication methods, jackknife replication constructs a number of subsamples (replicates) from the full sample and computes the statistics of interest for each replicate (with the same formula as the full sample estimate). The mean square error of the replicate estimates around their corresponding full estimate provides an estimate of the sampling vari-ance of the statistic of interest regardless of the functional form of the statistic.
There are 60 replicate weights (WRWT01-WRWT60) for the 2002 Adult HCSDB in the Quarter 3 file. Construction of these weights is described in the Adult Technical Manual. With the replicate weights, you can produce jackknife standard errors using in-house or custom written software, or you can use a publicly available software package such as WesVarPC or SUDAAN 7.5. Because WesVarPC 2.02 is available as freeware on the World Wide Web (http://www.westat.com/wesvarpc/index.html), the following example explains how it is used to produce jackknife variance estimates for statistics from the 2002 Adult HCSDB.
Suppose you want to estimate the mean rating of specialists (H02018) by beneficiaries who went to a specialist in the past 12 months (H02017=1) for each region (XREGION). You would use WesVarPc as follows.
Create a SAS V6.04 file, SAS Transport file, or ASCII file. WesVarPC has a restriction for the input data format. All files must be converted to one of these three types of files before being imported to WesVarPC.
Create a WesVarPC data file. From the Prep menu, choose the Import Data Files screen and import all variables for the analysis. For this example, input H02017, and XREGION into the Variables box, WRWT01-WRWT60 into the Replicates box, and MPRID into the ID box. Also specify the replication method as JK1 on this screen.
Create a data file for the subpopulation. Specify the subpopulation by choosing the Subpop WesVarPC Data File from the Prep menu: H02017=1.
05/13/23 90
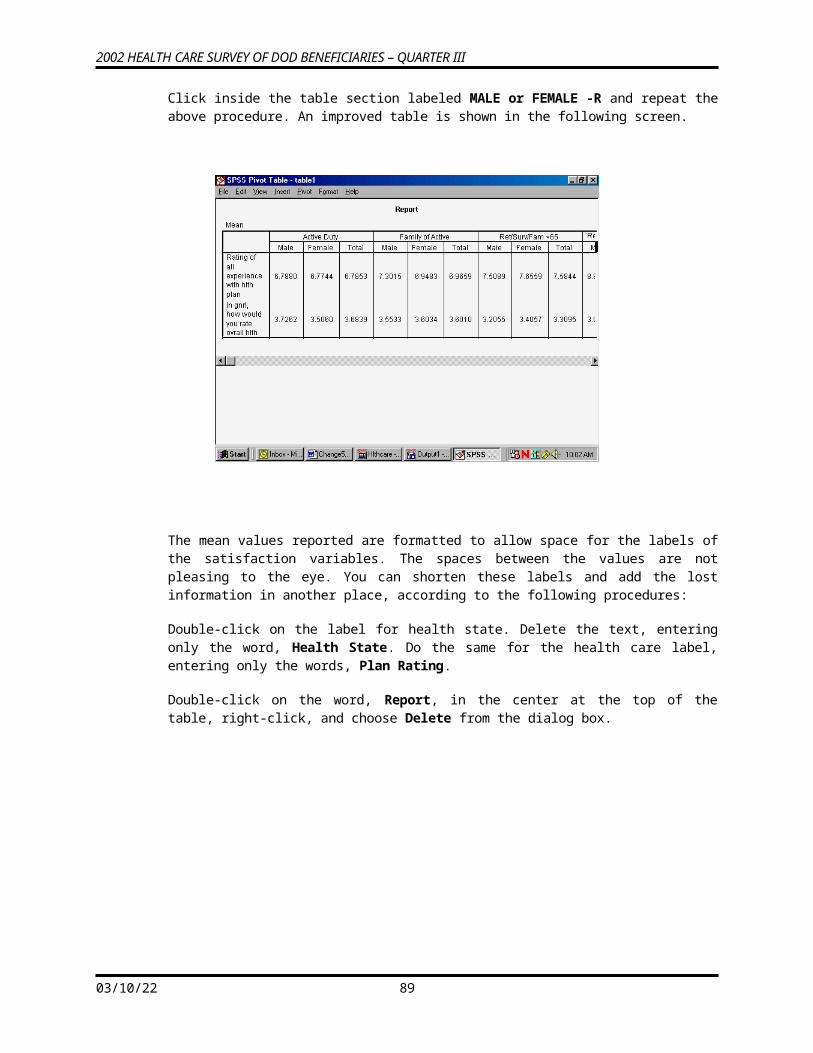
2002 HEALTH CARE SURVEY OF DOD BENEFICIARIES – QUARTER III
Calculate estimates. From the Tables menu, choose New and select the file created from the above procedure. Then, from the Table Request screen, specify H02018 as the Analysis variable, MEAN (H02018) as the Compute Statistics, and XREGION as the Table.
The above steps can also be followed to produce standard errors. The WesVarPC user’s manual (Brick et al. 1996) provides other possible methods for producing standard errors. The latest WesVarPC 4.0 is no longer freeware and can be purchased from Westat.
05/13/23 91
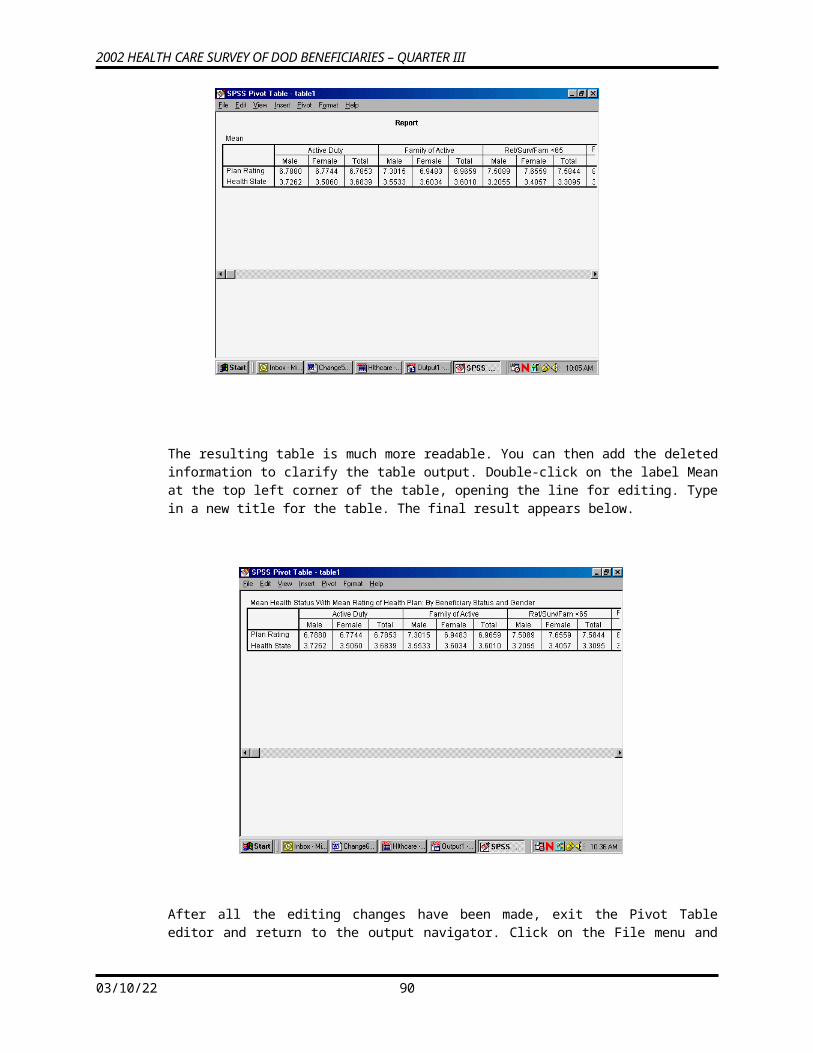
2002 HEALTH CARE SURVEY OF DOD BENEFICIARIES – QUARTER III
CodebookThis chapter describes every variable in the database. This codebook will also be helpful in identifying which data are available for various analyses, and what, if any, recoding of variables will meet your needs. It may also be useful in reviewing output.
The variables are in order based on their order in the database. An alphabetical listing (see Table of Contents) is provided to assist in locating variables.
The codebook contains frequency distributions for both discrete and continuous variables. A discrete variable is one that has only a few values. A continuous variable may have many possible values.
Below are two examples of the presentation of variables in the codebook. For each variable, we include the variable name, definition, weighted and unweighted frequency distributions, and the format value for each value. The first example contains a frequency distribution for a discrete variable.
H02009 -Health plan: problem to get a personal doctor or nurse you are happy with
Unweighted WeightedValue Count Percent Count Percent Formatted Value
. 980 7.40 441557.80 6.55 Did not answerN 3985 30.10 2266533.00 33.60 Didn't get a new personal
doctor/nurseA 10 0.08 5879.41 0.09 Invalid multiple responsesC 764 5.77 447040.80 6.63 Should be skipped1 916 6.92 443190.60 6.57 A big problem2 1591 12.02 730629.50 10.83 A small problem3 4993 37.71 2411245.00 35.74 Not a problem
92
Chapter
4
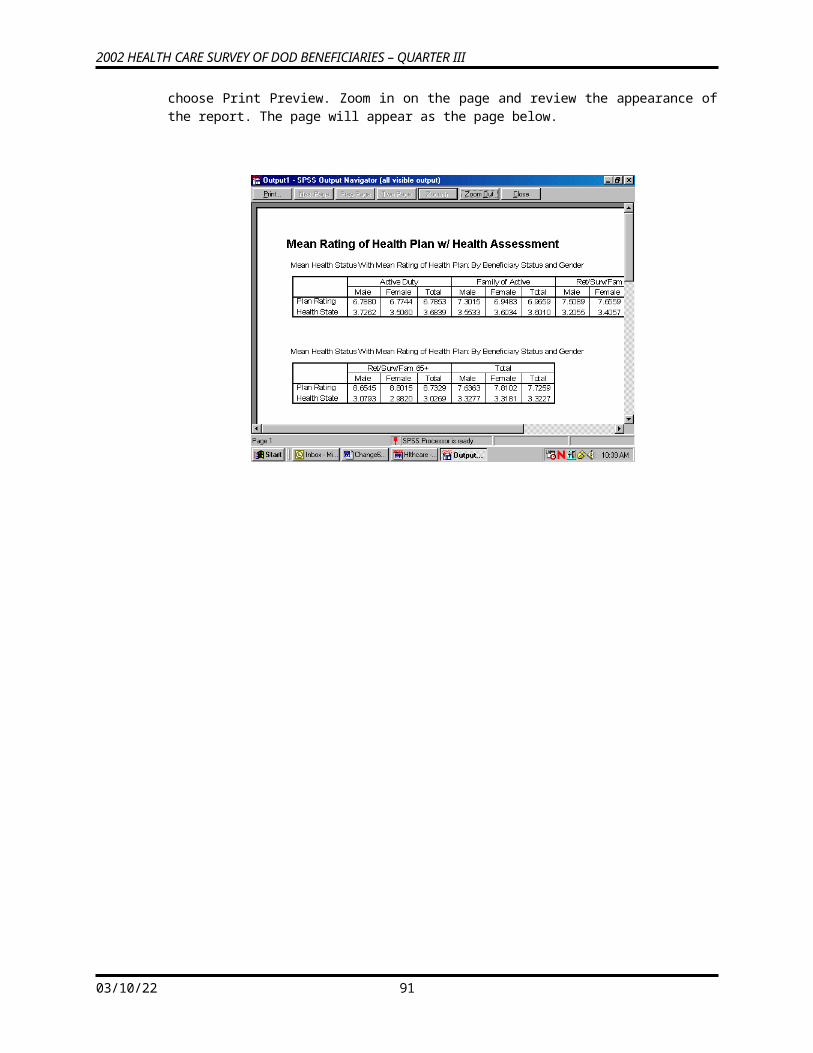
2002 HEALTH CARE SURVEY OF DOD BENEFICIARIES – QUARTER III
The table below contains an example of a frequency distribution for a continuous variable: age. The frequency does not list every possible value of age individually but instead shows several age ranges that together cover all possible values of age. You will notice that the last range representing ages “75 years and older” includes 492 respondents age 75 and older.
DAGEQY -Age (As of 31 August 2001)
Unweighted WeightedValue Count Percent Count Percent Formatted Value
018 -- 034 3845 29.04 1525768.00 22.62 018--034035 -- 044 3137 23.70 1209183.00 17.92 035--044045 -- 054 2214 16.72 1090521.00 16.17 045--054055 -- 064 2053 15.51 1259739.00 18.67 055--064065 -- 074 1232 9.31 1009611.00 14.97 065--074075 -- 097 758 5.73 651254.00 9.65 075 yrs and older
05/13/23 93
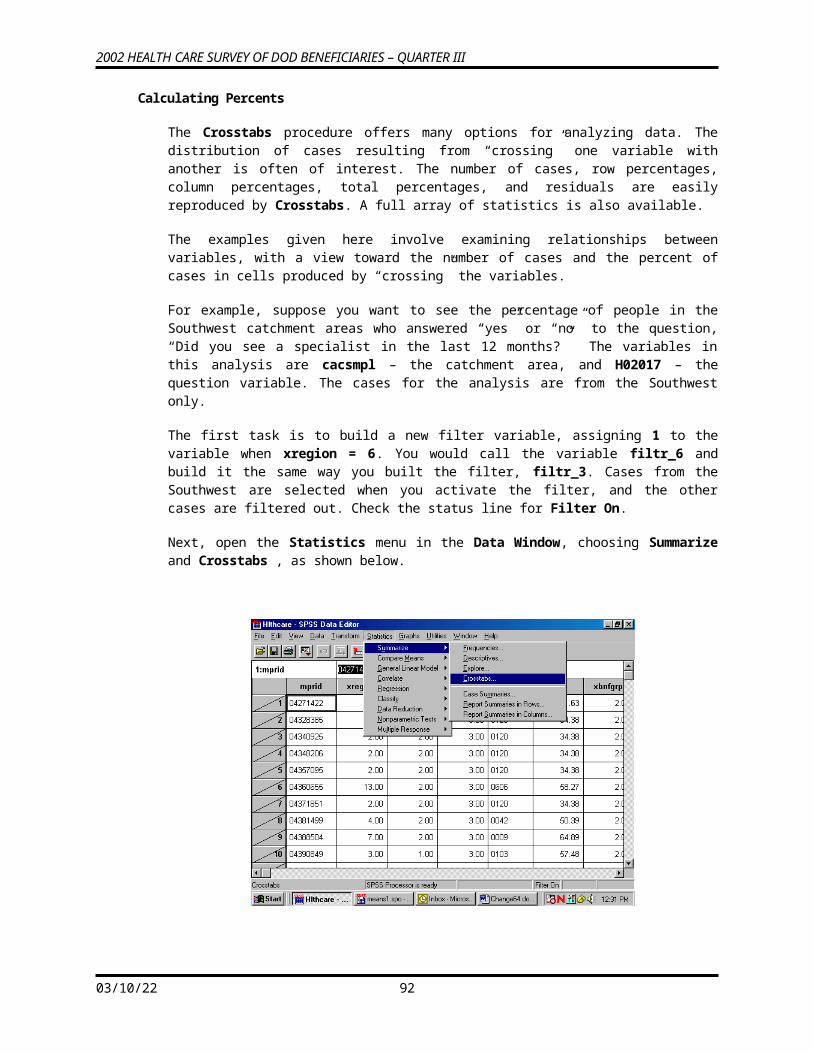
2002 HEALTH CARE SURVEY OF DOD BENEFICIARIES – QUARTER III
MPRID -Unique MPR Identifier
Unweighted WeightedValue Count Percent Count Percent Formatted Value
04271422 -- 07745819 13239 100.00 6746077.00 100.00 00000001--99999999
SVCSMPL -Branch of Service Sampling Variable
Unweighted WeightedValue Count Percent Count Percent Formatted Value
1 4248 32.09 2371317.00 35.15 Army2 2612 19.73 1622300.00 24.05 Navy3 830 6.27 438776.30 6.50 Marine Corps4 5223 39.45 2144939.00 31.80 Air Force5 249 1.88 128796.80 1.91 Coast Guard6 77 0.58 39947.89 0.59 Other/Unknown
SEXSMPL -Sex Sampling Variable
Unweighted WeightedValue Count Percent Count Percent Formatted Value
1 6520 49.25 3489366.00 51.72 Male2 6719 50.75 3256711.00 48.28 Female
STRATUM -Sampling STRATUM
Unweighted WeightedValue Count Percent Count Percent Formatted Value
101 36 0.27 3799.00 0.06 101.00102 22 0.17 1955.00 0.03 102.00104 53 0.40 5766.00 0.09 104.00301 20 0.15 4557.00 0.07 301.00302 17 0.13 3384.89 0.05 302.00304 22 0.17 3202.00 0.05 304.00305 25 0.19 7098.00 0.11 305.00306 21 0.16 5744.00 0.09 306.00401 53 0.40 3899.00 0.06 401.00402 34 0.26 3194.00 0.05 402.00404 31 0.23 3861.00 0.06 404.00501 38 0.29 11832.00 0.18 501.00502 14 0.11 4671.00 0.07 502.00504 17 0.13 2038.63 0.03 504.00505 13 0.10 1446.37 0.02 505.00
05/13/23 94
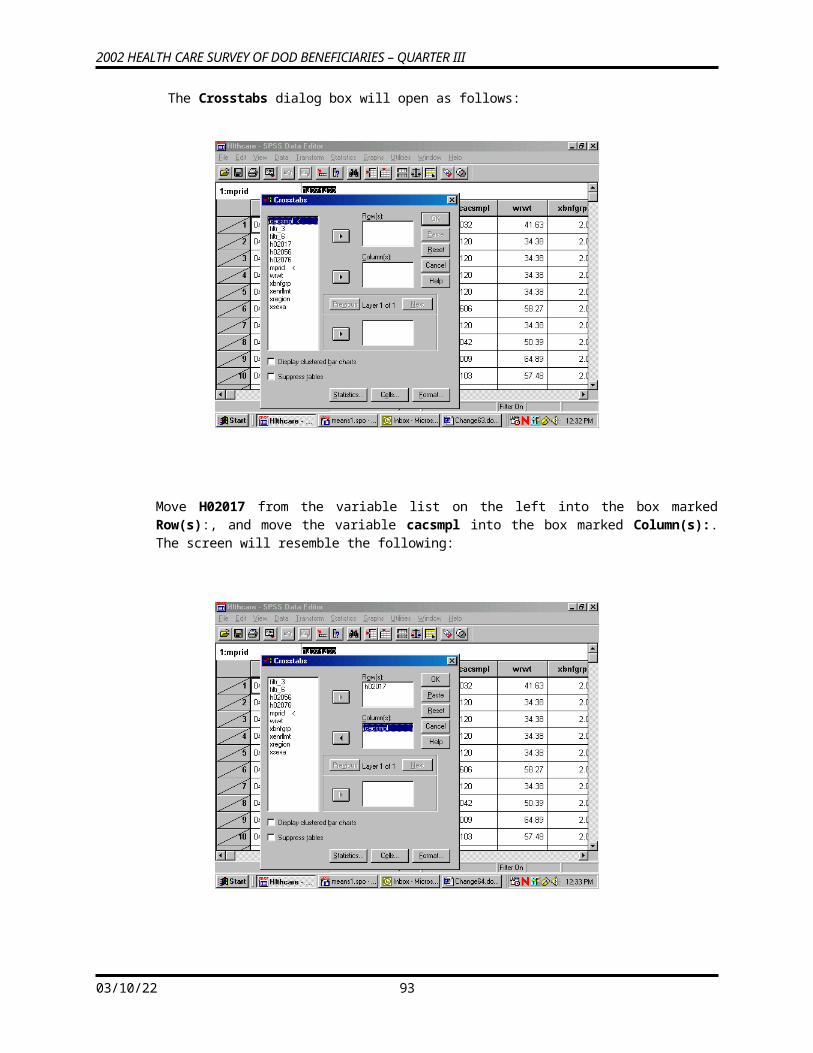
2002 HEALTH CARE SURVEY OF DOD BENEFICIARIES – QUARTER III
601 39 0.29 7671.00 0.11 601.00602 22 0.17 6622.00 0.10 602.00604 20 0.15 5492.00 0.08 604.00605 13 0.10 3382.29 0.05 605.00606 16 0.12 3635.49 0.05 606.00801 46 0.35 4099.00 0.06 801.00802 18 0.14 2489.00 0.04 802.00804 38 0.29 3740.00 0.06 804.00901 26 0.20 7566.00 0.11 901.00902 17 0.13 4822.20 0.07 902.00903 19 0.14 1232.91 0.02 903.00904 28 0.21 12791.00 0.19 904.00905 35 0.26 18107.00 0.27 905.00906 47 0.36 23416.16 0.35 906.001001 38 0.29 6534.00 0.10 1001.001002 25 0.19 3777.00 0.06 1002.001004 47 0.36 6721.00 0.10 1004.001301 56 0.42 4997.00 0.07 1301.001302 28 0.21 2798.00 0.04 1302.001304 28 0.21 3211.00 0.05 1304.001401 33 0.25 16027.00 0.24 1401.001402 13 0.10 4034.80 0.06 1402.001403 12 0.09 586.51 0.01 1403.001404 34 0.26 22147.94 0.33 1404.001405 35 0.26 15859.86 0.24 1405.001406 48 0.36 25774.62 0.38 1406.001901 49 0.37 9044.00 0.13 1901.001902 29 0.22 4933.00 0.07 1902.001904 24 0.18 4879.00 0.07 1904.002401 38 0.29 39534.00 0.59 2401.002402 32 0.24 18838.55 0.28 2402.002403 19 0.14 2156.45 0.03 2403.002404 23 0.17 16128.72 0.24 2404.002405 17 0.13 10187.28 0.15 2405.002406 36 0.27 20522.00 0.30 2406.002801 15 0.11 6891.00 0.10 2801.002802 13 0.10 4447.00 0.07 2802.002804 24 0.18 3424.00 0.05 2804.002805 20 0.15 3613.00 0.05 2805.002806 22 0.17 3344.64 0.05 2806.002901 42 0.32 74478.00 1.10 2901.002902 22 0.17 24976.00 0.37 2902.002903 19 0.14 6821.00 0.10 2903.002904 27 0.20 25766.00 0.38 2904.002905 23 0.17 21961.67 0.33 2905.002906 32 0.24 47526.33 0.70 2906.003001 22 0.17 12844.00 0.19 3001.003002 20 0.15 3837.00 0.06 3002.003004 21 0.16 2116.16 0.03 3004.003005 22 0.17 1185.84 0.02 3005.003006 17 0.13 2663.00 0.04 3006.003201 23 0.17 15532.00 0.23 3201.003202 21 0.16 8092.46 0.12 3202.003203 20 0.15 832.54 0.01 3203.003204 17 0.13 8604.00 0.13 3204.003205 15 0.11 3882.20 0.06 3205.00
05/13/23 95
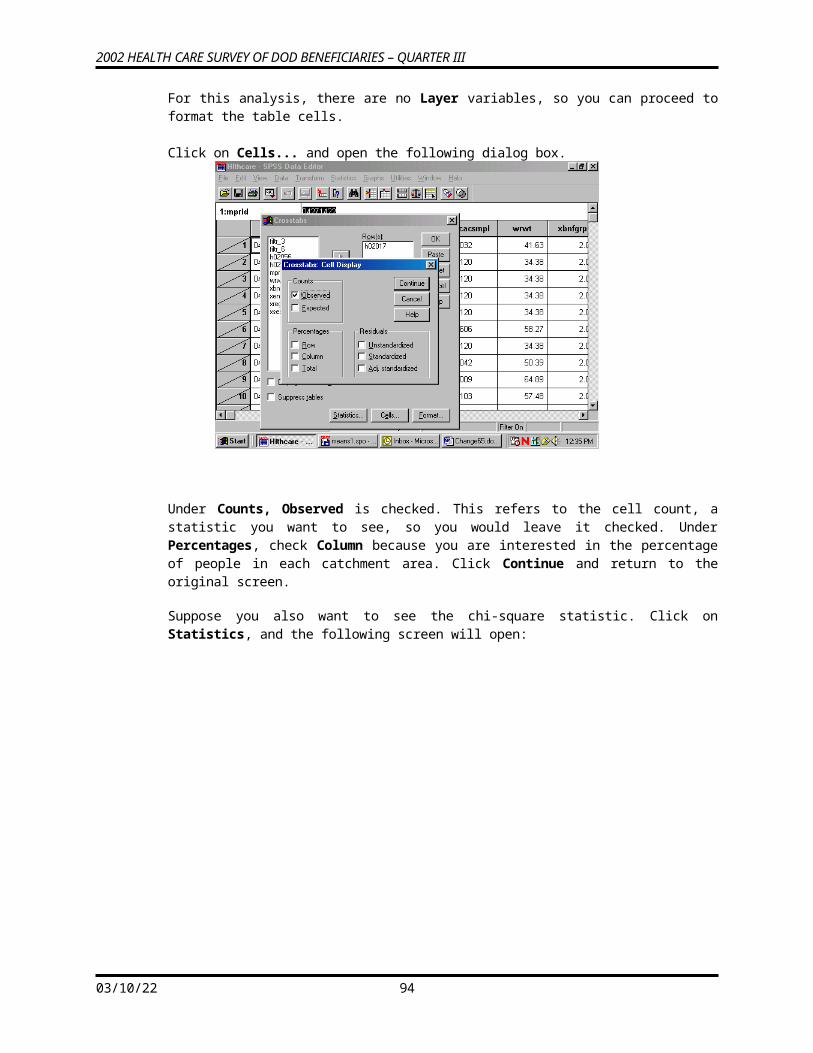
2002 HEALTH CARE SURVEY OF DOD BENEFICIARIES – QUARTER III
3206 21 0.16 9783.80 0.15 3206.003301 44 0.33 14417.00 0.21 3301.003302 26 0.20 7656.00 0.11 3302.003304 29 0.22 13367.00 0.20 3304.003305 25 0.19 7434.16 0.11 3305.003306 26 0.20 11847.84 0.18 3306.003501 45 0.34 12310.00 0.18 3501.003502 24 0.18 4528.00 0.07 3502.003504 24 0.18 3581.00 0.05 3504.003601 46 0.35 3850.00 0.06 3601.003602 23 0.17 2176.00 0.03 3602.003604 18 0.14 2055.14 0.03 3604.003606 24 0.18 1912.86 0.03 3606.003701 50 0.38 18406.00 0.27 3701.003702 23 0.17 2546.41 0.04 3702.003703 22 0.17 2310.59 0.03 3703.003704 13 0.10 5907.00 0.09 3704.003705 27 0.20 10336.32 0.15 3705.003706 31 0.23 18281.68 0.27 3706.003801 44 0.33 27004.27 0.40 3801.003802 21 0.16 8047.39 0.12 3802.003803 19 0.14 877.61 0.01 3803.003804 30 0.23 10907.00 0.16 3804.003805 30 0.23 13284.00 0.20 3805.003806 23 0.17 12504.96 0.19 3806.003901 38 0.29 35488.00 0.53 3901.003902 29 0.22 17746.53 0.26 3902.003903 25 0.19 2942.47 0.04 3903.003904 32 0.24 21025.00 0.31 3904.003905 35 0.26 24692.31 0.37 3905.003906 22 0.17 17104.33 0.25 3906.004201 21 0.16 9815.00 0.15 4201.004202 20 0.15 6362.26 0.09 4202.004203 25 0.19 1259.74 0.02 4203.004204 16 0.12 9651.00 0.14 4204.004205 34 0.26 13703.00 0.20 4205.004206 23 0.17 11521.92 0.17 4206.004301 42 0.32 3487.00 0.05 4301.004302 22 0.17 2290.00 0.03 4302.004304 44 0.33 4511.00 0.07 4304.004501 25 0.19 7919.00 0.12 4501.004502 20 0.15 5612.16 0.08 4502.004503 19 0.14 1119.84 0.02 4503.004504 37 0.28 16027.82 0.24 4504.004505 49 0.37 21599.20 0.32 4505.004506 69 0.52 31810.00 0.47 4506.004601 25 0.19 2549.00 0.04 4601.004602 17 0.13 1907.00 0.03 4602.004604 69 0.52 7863.00 0.12 4604.004701 46 0.35 16487.00 0.24 4701.004702 19 0.14 8906.00 0.13 4702.004704 37 0.28 13672.21 0.20 4704.004705 15 0.11 8428.00 0.12 4705.004706 24 0.18 8664.00 0.13 4706.004801 20 0.15 22817.00 0.34 4801.004802 15 0.11 7396.77 0.11 4802.00
05/13/23 96
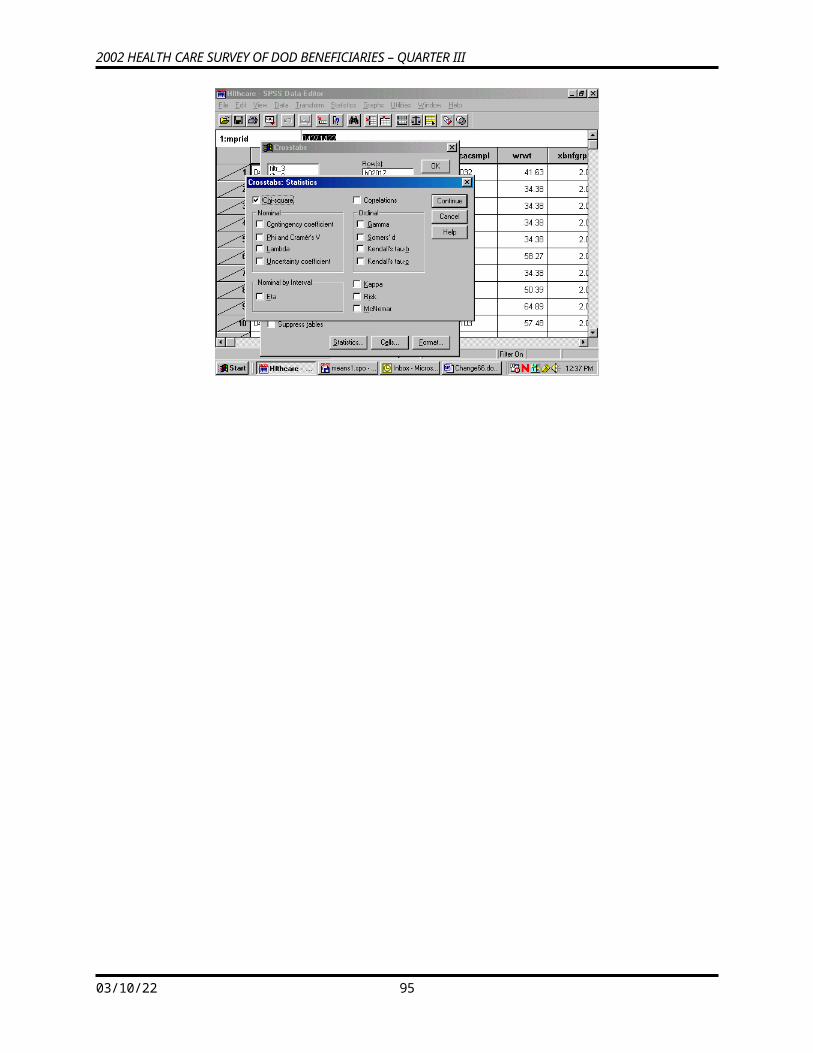
2002 HEALTH CARE SURVEY OF DOD BENEFICIARIES – QUARTER III
4803 15 0.11 948.23 0.01 4803.004804 22 0.17 8773.00 0.13 4804.004805 15 0.11 8233.13 0.12 4805.004806 23 0.17 9666.00 0.14 4806.004901 21 0.16 20289.00 0.30 4901.004902 17 0.13 9916.51 0.15 4902.004903 17 0.13 1409.49 0.02 4903.004904 11 0.08 6654.00 0.10 4904.004905 15 0.11 5191.66 0.08 4905.004906 18 0.14 5624.34 0.08 4906.005101 51 0.39 5224.00 0.08 5101.005102 32 0.24 3125.00 0.05 5102.005104 27 0.20 4497.00 0.07 5104.005201 35 0.26 29804.00 0.44 5201.005202 15 0.11 11007.35 0.16 5202.005203 22 0.17 3679.65 0.05 5203.005204 12 0.09 3757.02 0.06 5204.005205 17 0.13 10117.00 0.15 5205.005206 22 0.17 11547.00 0.17 5206.005301 33 0.25 4452.00 0.07 5301.005302 20 0.15 2409.00 0.04 5302.005304 21 0.16 2198.00 0.03 5304.005305 27 0.20 1733.00 0.03 5305.005501 28 0.21 8577.00 0.13 5501.005502 26 0.20 5550.48 0.08 5502.005503 19 0.14 700.64 0.01 5503.005504 18 0.14 8453.00 0.13 5504.005505 31 0.23 12318.00 0.18 5505.005506 21 0.16 8638.00 0.13 5506.005601 28 0.21 28729.00 0.43 5601.005602 18 0.14 4701.16 0.07 5602.005603 17 0.13 1338.84 0.02 5603.005604 18 0.14 3213.99 0.05 5604.005605 25 0.19 10193.01 0.15 5605.005606 16 0.12 7655.00 0.11 5606.005701 21 0.16 10031.00 0.15 5701.005702 15 0.11 5825.00 0.09 5702.005704 20 0.15 3213.33 0.05 5704.005705 19 0.14 2367.88 0.04 5705.005706 16 0.12 2347.39 0.03 5706.005801 59 0.45 7335.00 0.11 5801.005802 30 0.23 4858.00 0.07 5802.005804 29 0.22 5428.00 0.08 5804.005901 41 0.31 4271.00 0.06 5901.005902 23 0.17 2456.00 0.04 5902.005904 28 0.21 2968.00 0.04 5904.006001 29 0.22 25203.00 0.37 6001.006002 29 0.22 13570.46 0.20 6002.006003 13 0.10 873.65 0.01 6003.006004 22 0.17 7176.00 0.11 6004.006005 18 0.14 7516.61 0.11 6005.006006 18 0.14 6018.11 0.09 6006.006101 26 0.20 13949.00 0.21 6101.006102 15 0.11 5409.34 0.08 6102.006103 12 0.09 792.66 0.01 6103.006104 23 0.17 6074.88 0.09 6104.00
05/13/23 97
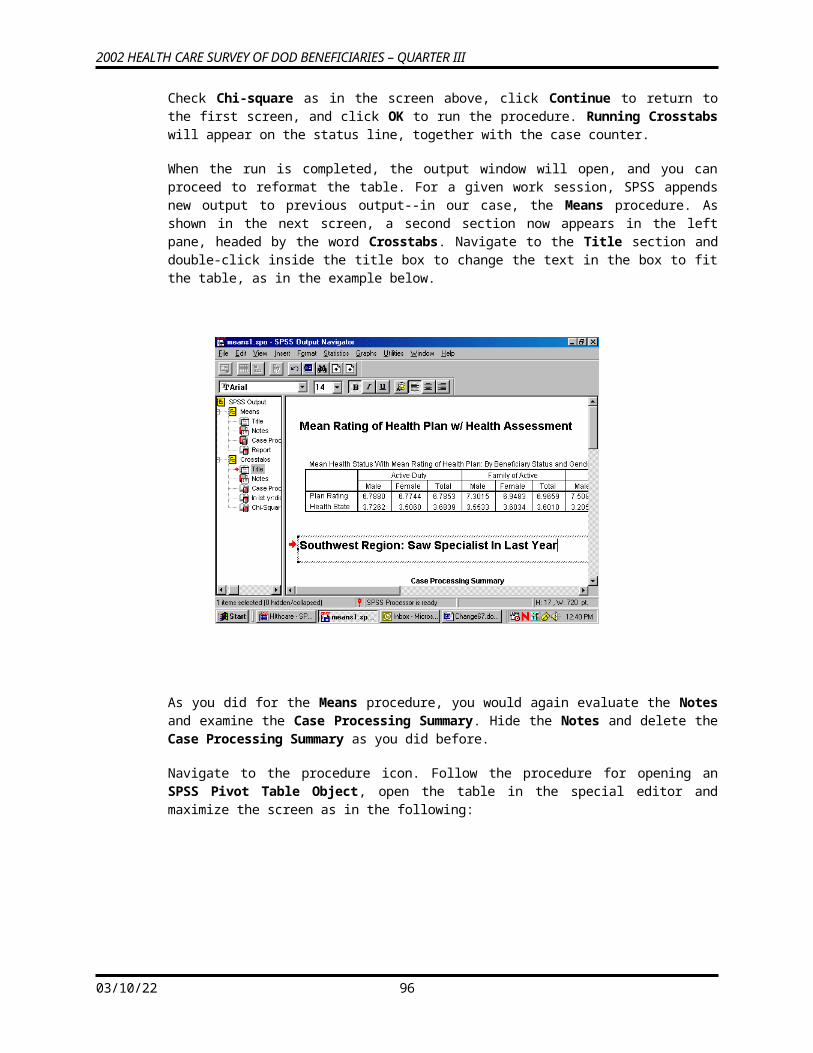
2002 HEALTH CARE SURVEY OF DOD BENEFICIARIES – QUARTER III
6105 24 0.18 11120.00 0.16 6105.006106 23 0.17 8087.00 0.12 6106.006201 43 0.32 5505.00 0.08 6201.006202 16 0.12 2737.00 0.04 6202.006204 30 0.23 3239.00 0.05 6204.006401 25 0.19 9148.00 0.14 6401.006402 11 0.08 4239.58 0.06 6402.006404 16 0.12 3309.00 0.05 6404.006405 8 0.06 911.76 0.01 6405.006406 17 0.13 2989.24 0.04 6406.006601 40 0.30 16909.00 0.25 6601.006602 22 0.17 9711.80 0.14 6602.006603 21 0.16 1330.48 0.02 6603.006604 25 0.19 12427.00 0.18 6604.006605 31 0.23 12871.77 0.19 6605.006606 19 0.14 11948.18 0.18 6606.006701 48 0.36 23104.00 0.34 6701.006702 22 0.17 6173.36 0.09 6702.006703 30 0.23 2990.64 0.04 6703.006704 23 0.17 9235.00 0.14 6704.006705 33 0.25 18609.09 0.28 6705.006706 26 0.20 16369.38 0.24 6706.006901 53 0.40 17511.00 0.26 6901.006902 26 0.20 8360.00 0.12 6902.006904 38 0.29 10305.37 0.15 6904.007301 26 0.20 12881.56 0.19 7301.007302 14 0.11 5925.00 0.09 7302.007304 22 0.17 8170.00 0.12 7304.007305 17 0.13 4029.37 0.06 7305.007306 24 0.18 10927.63 0.16 7306.007501 30 0.23 10958.00 0.16 7501.007502 21 0.16 3906.00 0.06 7502.007504 18 0.14 4682.00 0.07 7504.007505 19 0.14 1607.39 0.02 7505.007506 21 0.16 3271.61 0.05 7506.007801 33 0.25 8173.00 0.12 7801.007802 20 0.15 5502.00 0.08 7802.007804 20 0.15 6991.00 0.10 7804.007805 31 0.23 8461.00 0.13 7805.007806 24 0.18 5624.00 0.08 7806.007901 16 0.12 7716.00 0.11 7901.007902 12 0.09 5713.00 0.08 7902.007904 28 0.21 10656.00 0.16 7904.007905 36 0.27 16828.00 0.25 7905.007906 38 0.29 14063.00 0.21 7906.008301 53 0.40 7400.00 0.11 8301.008302 22 0.17 4523.00 0.07 8302.008304 32 0.24 7229.00 0.11 8304.008601 16 0.12 8834.00 0.13 8601.008602 21 0.16 2704.70 0.04 8602.008603 22 0.17 1193.30 0.02 8603.008604 17 0.13 2576.04 0.04 8604.008605 20 0.15 5720.96 0.08 8605.008606 28 0.21 7727.00 0.11 8606.008901 55 0.42 47124.00 0.70 8901.008902 45 0.34 23854.67 0.35 8902.00
05/13/23 98
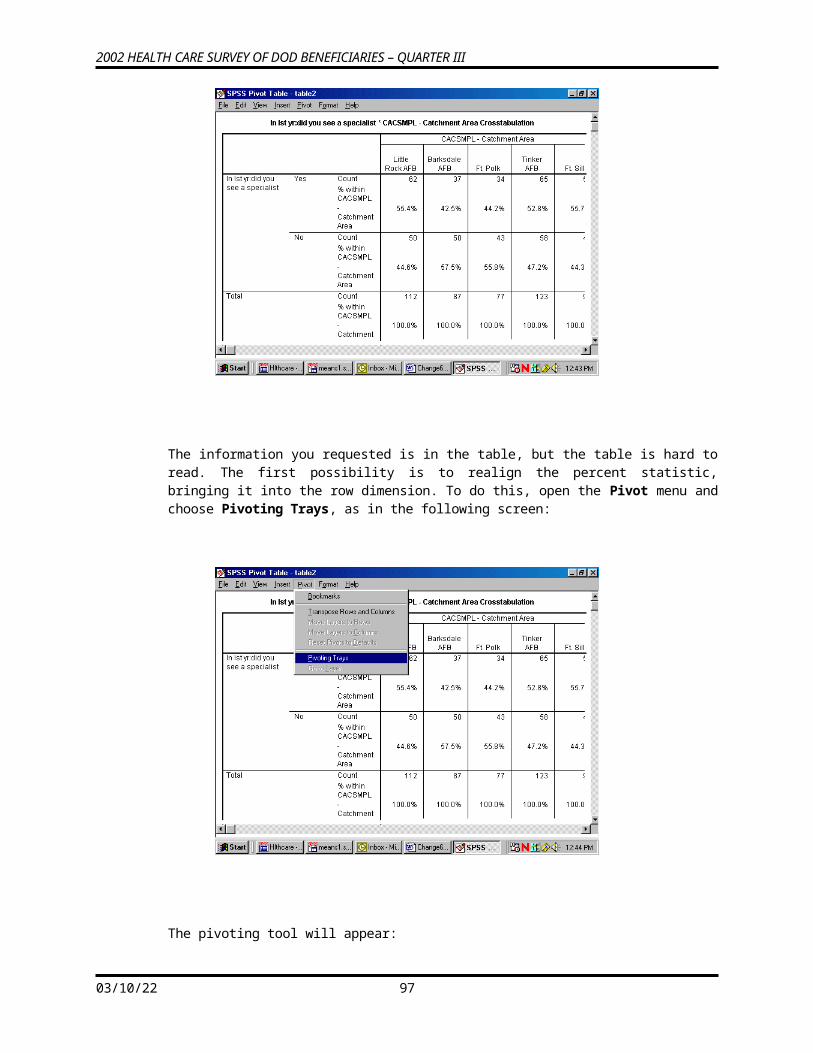
2002 HEALTH CARE SURVEY OF DOD BENEFICIARIES – QUARTER III
8903 18 0.14 1907.33 0.03 8903.008904 18 0.14 13539.00 0.20 8904.008905 27 0.20 21339.00 0.32 8905.008906 16 0.12 12087.00 0.18 8906.009001 43 0.32 4386.00 0.07 9001.009002 24 0.18 2377.00 0.04 9002.009004 33 0.25 2973.00 0.04 9004.009101 23 0.17 33298.00 0.49 9101.009102 24 0.18 11699.52 0.17 9102.009103 17 0.13 2818.00 0.04 9103.009104 18 0.14 5820.35 0.09 9104.009105 18 0.14 6775.65 0.10 9105.009106 18 0.14 3873.00 0.06 9106.009201 17 0.13 8348.00 0.12 9201.009202 12 0.09 4822.00 0.07 9202.009204 20 0.15 2632.03 0.04 9204.009205 22 0.17 3520.10 0.05 9205.009206 21 0.16 4028.87 0.06 9206.009501 26 0.20 7062.00 0.10 9501.009502 20 0.15 5382.00 0.08 9502.009504 26 0.20 11213.00 0.17 9504.009505 23 0.17 9335.13 0.14 9505.009506 27 0.20 9328.50 0.14 9506.009601 61 0.46 14593.00 0.22 9601.009602 34 0.26 7685.00 0.11 9602.009604 28 0.21 7720.00 0.11 9604.009801 29 0.22 15357.00 0.23 9801.009802 22 0.17 7691.00 0.11 9802.009804 13 0.10 7008.00 0.10 9804.009805 17 0.13 3835.02 0.06 9805.009806 16 0.12 6200.98 0.09 9806.0010101 28 0.21 5998.00 0.09 10101.0010102 16 0.12 3133.00 0.05 10102.0010104 17 0.13 3369.00 0.05 10104.0010105 16 0.12 3735.00 0.06 10105.0010106 18 0.14 3406.00 0.05 10106.0010301 26 0.20 13583.56 0.20 10301.0010302 17 0.13 4715.60 0.07 10302.0010303 24 0.18 1379.40 0.02 10303.0010304 22 0.17 8493.00 0.13 10304.0010305 32 0.24 13043.00 0.19 10305.0010306 14 0.11 9406.00 0.14 10306.0010401 20 0.15 10661.00 0.16 10401.0010402 23 0.17 3703.00 0.05 10402.0010404 20 0.15 2075.20 0.03 10404.0010405 18 0.14 1551.09 0.02 10405.0010406 23 0.17 4348.71 0.06 10406.0010501 25 0.19 11715.41 0.17 10501.0010502 20 0.15 4285.71 0.06 10502.0010504 18 0.14 7775.00 0.12 10504.0010505 19 0.14 9043.00 0.13 10505.0010506 24 0.18 9659.00 0.14 10506.0010801 22 0.17 14583.00 0.22 10801.0010802 19 0.14 8544.05 0.13 10802.0010803 17 0.13 802.95 0.01 10803.0010804 24 0.18 13158.22 0.20 10804.00
05/13/23 99
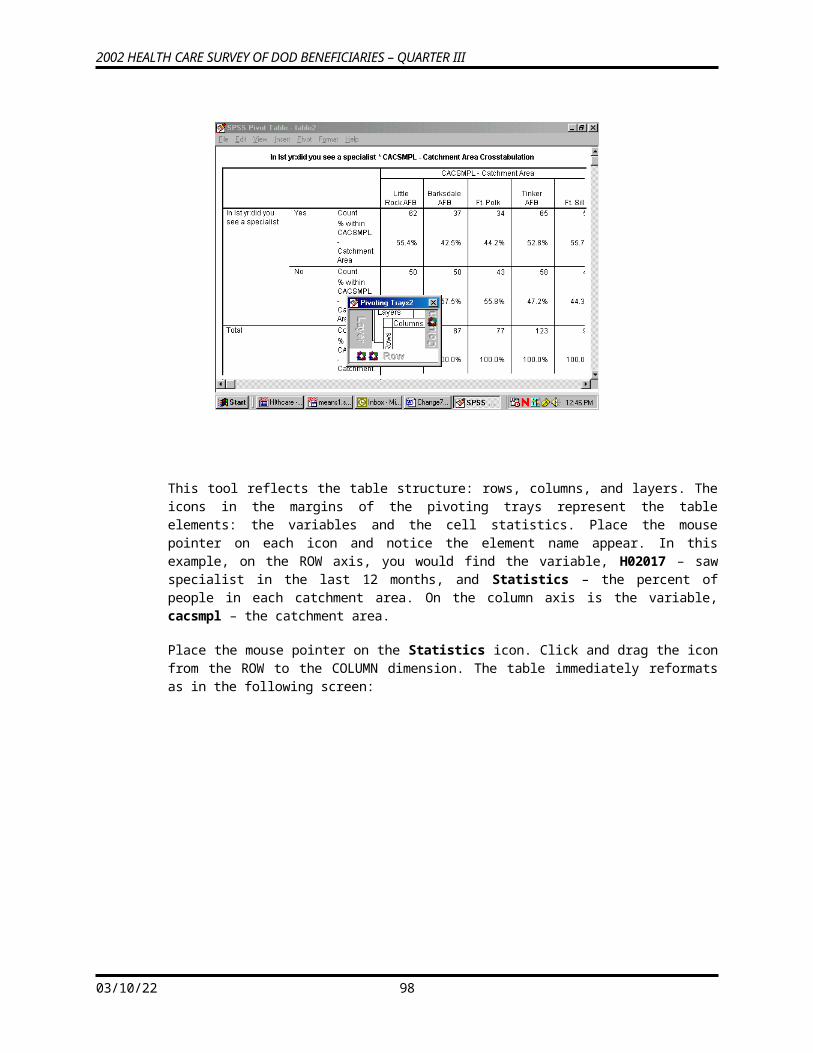
2002 HEALTH CARE SURVEY OF DOD BENEFICIARIES – QUARTER III
10805 15 0.11 5019.78 0.07 10805.0010806 20 0.15 10282.00 0.15 10806.0010901 19 0.14 9592.00 0.14 10901.0010902 23 0.17 5843.89 0.09 10902.0010903 21 0.16 1213.11 0.02 10903.0010904 29 0.22 14871.00 0.22 10904.0010905 26 0.20 10345.20 0.15 10905.0010906 40 0.30 24781.02 0.37 10906.0011001 61 0.46 43998.00 0.65 11001.0011002 28 0.21 20502.88 0.30 11002.0011003 13 0.10 2045.84 0.03 11003.0011004 23 0.17 14105.00 0.21 11004.0011005 16 0.12 13566.00 0.20 11005.0011006 20 0.15 8616.00 0.13 11006.0011201 51 0.39 6728.00 0.10 11201.0011202 33 0.25 3737.00 0.06 11202.0011204 25 0.19 3718.00 0.06 11204.0011301 20 0.15 7341.90 0.11 11301.0011302 14 0.11 2881.20 0.04 11302.0011304 24 0.18 3078.00 0.05 11304.0011305 22 0.17 1847.45 0.03 11305.0011306 20 0.15 3560.55 0.05 11306.0011701 36 0.27 28325.00 0.42 11701.0011702 17 0.13 8557.61 0.13 11702.0011704 30 0.23 18630.00 0.28 11704.0011705 17 0.13 5810.35 0.09 11705.0011706 30 0.23 20118.48 0.30 11706.0011801 45 0.34 5314.00 0.08 11801.0011802 27 0.20 3396.00 0.05 11802.0011804 25 0.19 3630.00 0.05 11804.0011901 58 0.44 8774.00 0.13 11901.0011902 33 0.25 4911.00 0.07 11902.0011904 22 0.17 4747.00 0.07 11904.0012001 36 0.27 12782.00 0.19 12001.0012002 26 0.20 7487.54 0.11 12002.0012003 27 0.20 928.23 0.01 12003.0012004 15 0.11 4384.69 0.06 12004.0012005 28 0.21 9218.01 0.14 12005.0012006 18 0.14 6264.94 0.09 12006.0012101 20 0.15 12274.00 0.18 12101.0012102 15 0.11 7828.08 0.12 12102.0012103 26 0.20 2024.92 0.03 12103.0012104 18 0.14 9648.00 0.14 12104.0012105 27 0.20 9124.32 0.14 12105.0012106 22 0.17 8868.57 0.13 12106.0012301 43 0.32 15764.00 0.23 12301.0012302 32 0.24 13505.00 0.20 12302.0012303 25 0.19 4317.00 0.06 12303.0012304 45 0.34 21020.00 0.31 12304.0012305 53 0.40 32075.80 0.48 12305.0012306 36 0.27 18337.62 0.27 12306.0012401 54 0.41 80742.00 1.20 12401.0012402 30 0.23 28135.00 0.42 12402.0012403 30 0.23 13454.97 0.20 12403.0012404 15 0.11 17506.00 0.26 12404.0012405 36 0.27 46123.00 0.68 12405.00
05/13/23 100
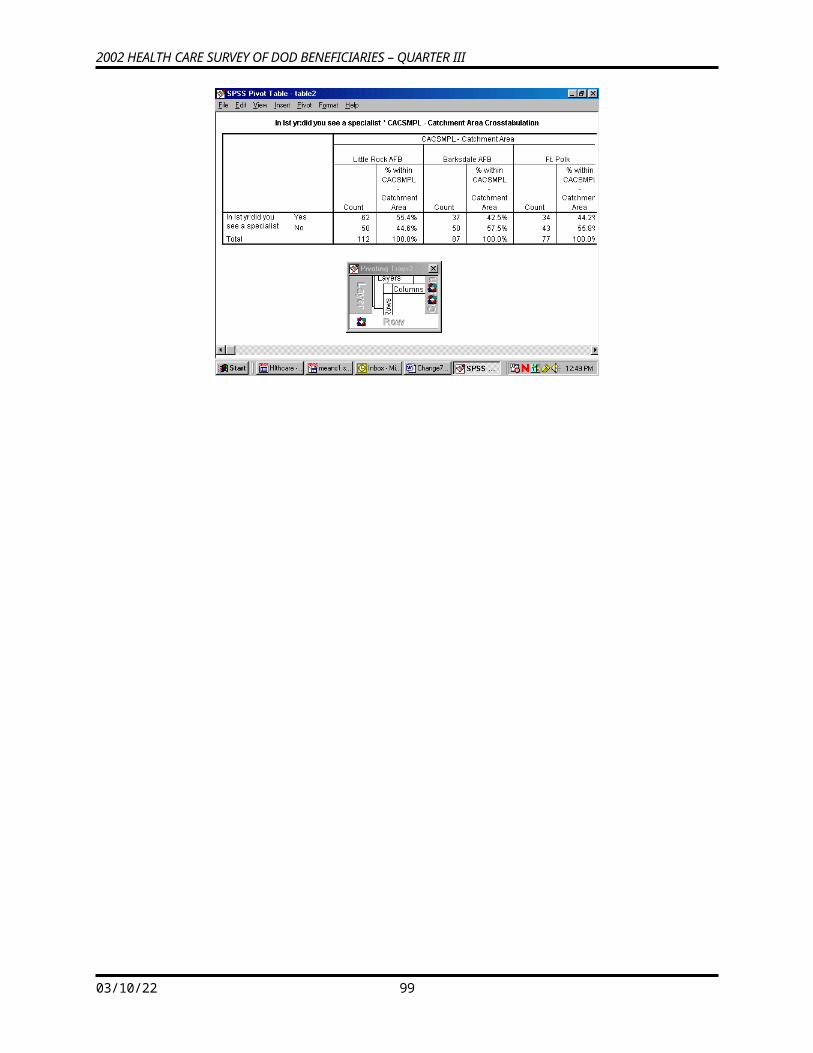
2002 HEALTH CARE SURVEY OF DOD BENEFICIARIES – QUARTER III
12406 18 0.14 22141.89 0.33 12406.0012501 37 0.28 29716.00 0.44 12501.0012502 24 0.18 14774.07 0.22 12502.0012503 15 0.11 1369.93 0.02 12503.0012504 44 0.33 21533.00 0.32 12504.0012505 26 0.20 13862.43 0.21 12505.0012506 39 0.29 31856.69 0.47 12506.0012601 27 0.20 13663.00 0.20 12601.0012602 19 0.14 9143.00 0.14 12602.0012604 24 0.18 7952.00 0.12 12604.0012605 17 0.13 4646.67 0.07 12605.0012606 21 0.16 6696.00 0.10 12606.0012701 20 0.15 7974.00 0.12 12701.0012702 20 0.15 4214.00 0.06 12702.0012704 19 0.14 3149.00 0.05 12704.0012705 14 0.11 1966.46 0.03 12705.0012706 16 0.12 3368.54 0.05 12706.0012801 29 0.22 3648.00 0.05 12801.0012802 20 0.15 1995.00 0.03 12802.0012804 45 0.34 4149.00 0.06 12804.0012901 55 0.42 9562.00 0.14 12901.0012902 22 0.17 3603.00 0.05 12902.0012904 22 0.17 3646.00 0.05 12904.0013101 40 0.30 4679.00 0.07 13101.0013102 15 0.11 2716.00 0.04 13102.0013105 19 0.14 2047.00 0.03 13105.0028001 41 0.31 7539.00 0.11 28001.0028002 46 0.35 8022.00 0.12 28002.0028004 16 0.12 2050.00 0.03 28004.0028701 77 0.58 4995.00 0.07 28701.0028702 35 0.26 2882.00 0.04 28702.0028704 18 0.14 1207.00 0.02 28704.0032101 73 0.55 9426.00 0.14 32101.0032102 26 0.20 2474.00 0.04 32102.0032104 20 0.15 1788.00 0.03 32104.0032601 59 0.45 6200.00 0.09 32601.0032602 18 0.14 2880.00 0.04 32602.0032604 21 0.16 1526.00 0.02 32604.0033001 36 0.27 9238.00 0.14 33001.0033002 30 0.23 5392.00 0.08 33002.0036601 37 0.28 3854.00 0.06 36601.0036602 30 0.23 3269.00 0.05 36602.0036604 57 0.43 7690.00 0.11 36604.0038501 32 0.24 7626.00 0.11 38501.0038502 33 0.25 4382.00 0.06 38502.0038504 23 0.17 3951.00 0.06 38504.0060601 31 0.23 21452.00 0.32 60601.0060602 19 0.14 10657.39 0.16 60602.0060603 6 0.05 349.63 0.01 60603.0060605 7 0.05 4070.98 0.06 60605.0060701 49 0.37 18053.00 0.27 60701.0060702 20 0.15 7043.70 0.10 60702.0060705 15 0.11 5085.30 0.08 60705.0060901 46 0.35 27316.00 0.40 60901.0060902 31 0.23 12558.09 0.19 60902.0060903 2 0.02 78.34 0.00 60903.00
05/13/23 101
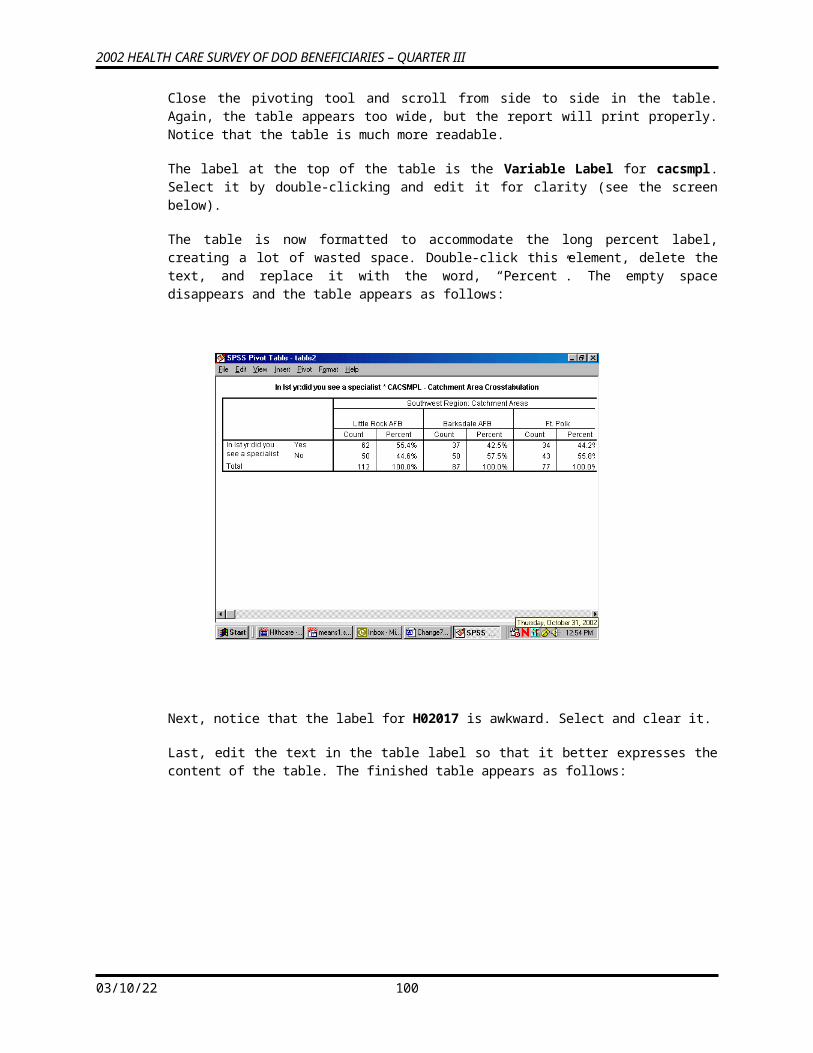
2002 HEALTH CARE SURVEY OF DOD BENEFICIARIES – QUARTER III
60905 12 0.09 2023.57 0.03 60905.0061201 56 0.42 29123.00 0.43 61201.0061202 10 0.08 1940.72 0.03 61202.0061205 8 0.06 2296.28 0.03 61205.0061601 22 0.17 4039.00 0.06 61601.0061602 12 0.09 1081.24 0.02 61602.0061605 15 0.11 2031.91 0.03 61605.0061606 14 0.11 1894.85 0.03 61606.0061701 37 0.28 17885.00 0.27 61701.0061702 12 0.09 7064.21 0.10 61702.0061705 6 0.05 1832.79 0.03 61705.0062001 35 0.26 5782.00 0.09 62001.0062002 11 0.08 2985.00 0.04 62002.0062005 16 0.12 3835.39 0.06 62005.0062101 28 0.21 17207.00 0.26 62101.0062102 8 0.06 4660.55 0.07 62102.0062105 8 0.06 1369.45 0.02 62105.0062201 35 0.26 19835.00 0.29 62201.0062202 9 0.07 5027.54 0.07 62202.0062203 13 0.10 1965.28 0.03 62203.0063301 41 0.31 11744.00 0.17 63301.0063302 16 0.12 5311.61 0.08 63302.0063305 12 0.09 3259.39 0.05 63305.0063801 54 0.41 9911.71 0.15 63801.0063805 7 0.05 2119.29 0.03 63805.0064001 40 0.30 9383.00 0.14 64001.0064002 15 0.11 4485.21 0.07 64002.0064005 10 0.08 1776.79 0.03 64005.0080401 45 0.34 7270.00 0.11 80401.0080402 21 0.16 3854.00 0.06 80402.0080501 50 0.38 5916.00 0.09 80501.0080502 28 0.21 3950.00 0.06 80502.0080601 46 0.35 10015.00 0.15 80601.0080602 20 0.15 5141.00 0.08 80602.00713901 55 0.42 6975.00 0.10 713901.00713902 42 0.32 3659.00 0.05 713902.00999001 8 0.06 23732.36 0.35 999001.00999002 13 0.10 5193.06 0.08 999002.00999003 9 0.07 7141.94 0.11 999003.00999004 8 0.06 1798.91 0.03 999004.00999005 7 0.05 47185.64 0.70 999005.00999006 4 0.03 40684.09 0.60 999006.00999101 38 0.29 88152.00 1.31 999101.00999102 26 0.20 22076.89 0.33 999102.00999103 74 0.56 50512.00 0.75 999103.00999104 23 0.17 44833.00 0.66 999104.00999105 223 1.68 373863.20 5.54 999105.00999106 146 1.10 302510.00 4.48 999106.00999201 34 0.26 51531.00 0.76 999201.00999202 13 0.10 20855.00 0.31 999202.00999203 28 0.21 30481.00 0.45 999203.00999204 47 0.36 75573.00 1.12 999204.00999205 186 1.40 264114.10 3.92 999205.00999206 181 1.37 304822.60 4.52 999206.00999301 39 0.29 68222.00 1.01 999301.00999302 21 0.16 20620.00 0.31 999302.00
05/13/23 102
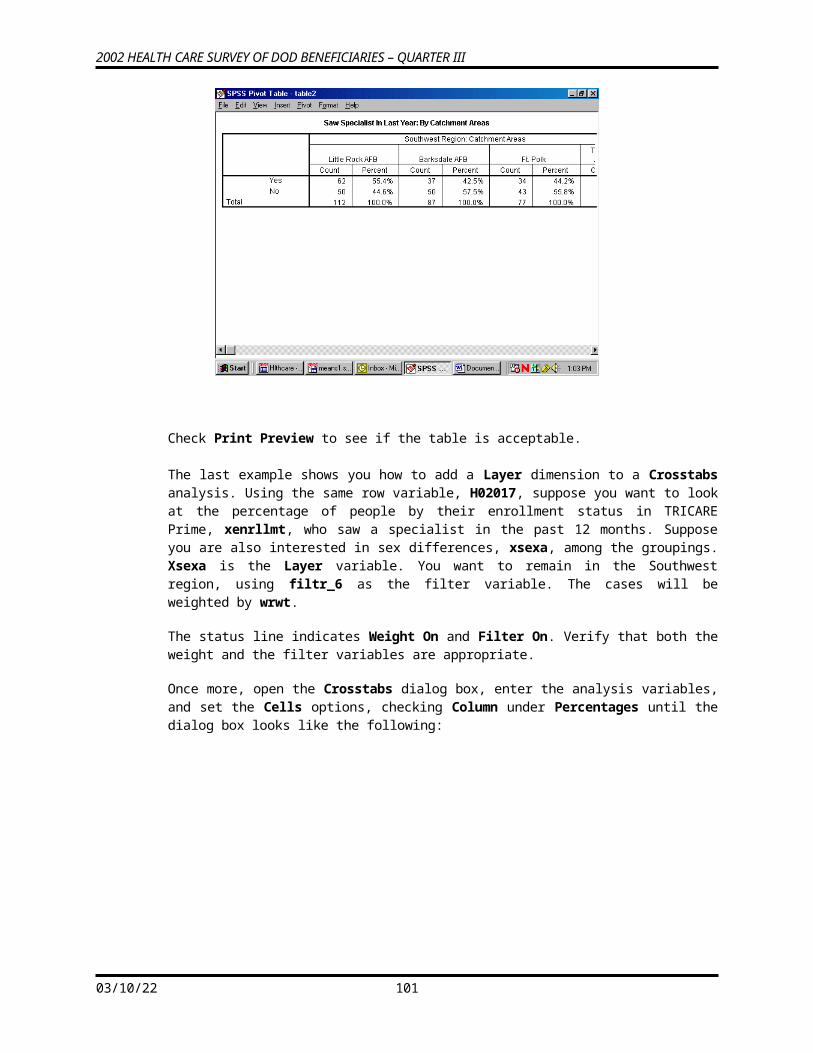
2002 HEALTH CARE SURVEY OF DOD BENEFICIARIES – QUARTER III
999303 60 0.45 47042.00 0.70 999303.00999304 33 0.25 66803.00 0.99 999304.00999305 208 1.57 412122.10 6.11 999305.00999306 174 1.31 373033.00 5.53 999306.00
CACSMPL -Catchment Area
Unweighted WeightedValue Count Percent Count Percent Formatted Value
1 111 0.84 11520.00 0.17 Redstone Ars/Ft McClellan
3 105 0.79 23985.89 0.36 Ft. Rucker4 118 0.89 10954.00 0.16 Maxwell AFB5 82 0.62 19988.00 0.30 Ft Wainwright6 110 0.83 26802.78 0.40 Elmendorf AFB/Ft
Wainwright8 102 0.77 10328.00 0.15 Ft. Huachuca9 172 1.30 67935.27 1.01 Luke AFB10 110 0.83 17032.00 0.25 Davis-Monthan AFB13 112 0.85 11006.00 0.16 Little Rock AFB14 175 1.32 84430.73 1.25 Travis AFB19 102 0.77 18856.00 0.28 Edwards AFB24 165 1.25 107367.00 1.59 NH Camp Pendleton/Ft
Irwin28 94 0.71 21719.64 0.32 NH LeMoore29 165 1.25 201529.00 2.99 NMC San Diego30 102 0.77 22646.00 0.34 NH 29-Palms32 117 0.88 46727.00 0.69 Evans ACH-Ft. Carson33 150 1.13 54722.00 0.81 USAF Acad. Hospital35 93 0.70 20419.00 0.30 NACC Groton36 111 0.84 9994.00 0.15 Dover AFB37 166 1.25 57788.00 0.86 Walter Reed AMC38 167 1.26 72625.23 1.08 NH Pensacola39 181 1.37 118998.60 1.76 NH Jacksonville/Key
West42 139 1.05 52312.92 0.78 Eglin AFB43 108 0.82 10288.00 0.15 Tyndall AFB45 219 1.65 84088.02 1.25 MacDill AFB46 111 0.84 12319.00 0.18 Patrick AFB47 141 1.07 56157.21 0.83 Ft. Gordon48 110 0.83 57834.13 0.86 Ft. Benning49 99 0.75 49085.00 0.73 Ft. Stewart51 110 0.83 12846.00 0.19 Robins AFB52 123 0.93 69912.02 1.04 Tripler AMC53 101 0.76 10792.00 0.16 Mountain Home AFB55 143 1.08 44237.12 0.66 Scott AFB56 122 0.92 55831.00 0.83 NH Great Lakes57 91 0.69 23784.60 0.35 Ft. Riley58 118 0.89 17621.00 0.26 Ft. Leavenworth59 92 0.69 9695.00 0.14 McConnell AFB60 129 0.97 60357.83 0.89 Ft. Campbell61 123 0.93 45432.88 0.67 Ft. Knox62 89 0.67 11481.00 0.17 Barksdale AFB
05/13/23 103
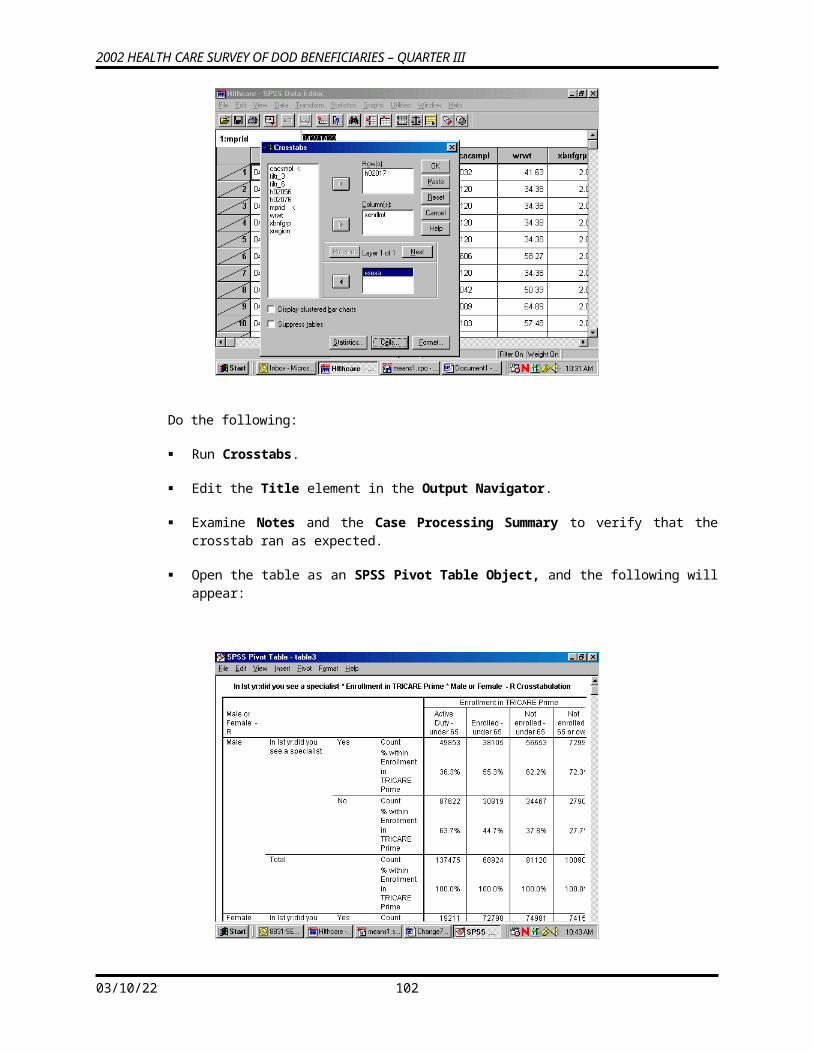
2002 HEALTH CARE SURVEY OF DOD BENEFICIARIES – QUARTER III
64 77 0.58 20597.58 0.31 Ft. Polk66 158 1.19 65198.24 0.97 Andrews AFB67 182 1.37 76481.47 1.13 NNMC Bethesda69 117 0.88 36176.37 0.54 Ft. Meade73 103 0.78 41933.56 0.62 Keesler AFB75 109 0.82 24425.00 0.36 Ft. Leonard Wood78 128 0.97 34751.00 0.52 Offutt AFB79 130 0.98 54976.00 0.81 Nellis AFB83 107 0.81 19152.00 0.28 Kirtland AFB86 124 0.94 28756.00 0.43 West Point89 179 1.35 119851.00 1.78 Ft. Bragg90 100 0.76 9736.00 0.14 Seymour Johnson AFB91 118 0.89 64284.52 0.95 NH Camp Lejeune92 92 0.69 23351.00 0.35 NH Cherry Point95 122 0.92 42320.63 0.63 Wright Patterson AFB96 123 0.93 29998.00 0.44 Tinker AFB98 97 0.73 40092.00 0.59 Ft. Sill101 95 0.72 19641.00 0.29 Shaw AFB103 135 1.02 50620.56 0.75 NH Charleston104 104 0.79 22339.00 0.33 NH Beaufort105 106 0.80 42478.12 0.63 Ft. Jackson108 117 0.88 52390.00 0.78 Ft. Bliss109 158 1.19 66646.21 0.99 Brooke AMC-Ft. Sam
Houston110 161 1.22 102833.70 1.52 Ft. Hood112 109 0.82 14183.00 0.21 Dyess AFB113 100 0.76 18709.10 0.28 Laughlin AFB/Sheppard
AFB117 130 0.98 81441.44 1.21 Lackland AFB118 97 0.73 12340.00 0.18 NH Corpus Christi119 113 0.85 18432.00 0.27 Hill AFB120 150 1.13 41065.40 0.61 Langley AFB121 128 0.97 49767.88 0.74 Ft. Eustis123 234 1.77 105019.40 1.56 Ft. Belvoir124 183 1.38 208102.90 3.08 NMC Portsmouth125 185 1.40 113112.10 1.68 Madigan AMC-Ft. Lewis126 108 0.82 42100.67 0.62 NH Bremerton127 89 0.67 20672.00 0.31 NH Oak Harbor128 94 0.71 9792.00 0.15 Fairchild AFB129 99 0.75 16811.00 0.25 F.E. Warren AFB131 74 0.56 9442.00 0.14 Ft. Irwin280 103 0.78 17611.00 0.26 Pearl Harbor287 130 0.98 9084.00 0.13 NMCL Pearl
Harbor/Hickam321 119 0.90 13688.00 0.20 NACC Portsmouth New
Hamp.326 98 0.74 10606.00 0.16 McGuire AFB/Ft. Dix330 66 0.50 14630.00 0.22 Ft. Drum366 124 0.94 14813.00 0.22 Randolph AFB385 88 0.66 15959.00 0.24 NMCL Quantico606 63 0.48 36530.00 0.54 Landstuhl AMC/other
German607 84 0.63 30182.00 0.45 Landstuhl609 91 0.69 41976.00 0.62 Wuerzburg612 74 0.56 33360.00 0.49 Seoul616 63 0.48 9047.00 0.13 NH
05/13/23 104
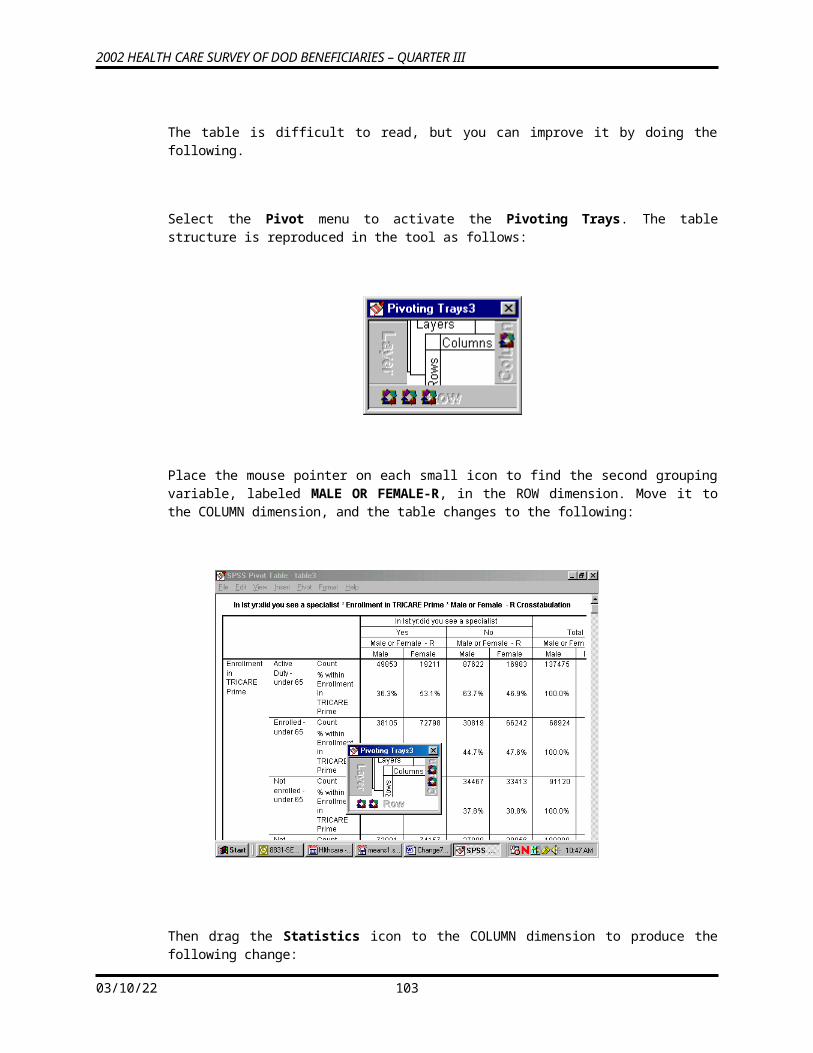
2002 HEALTH CARE SURVEY OF DOD BENEFICIARIES – QUARTER III
Guantanamo/Roosevelt Rds
617 55 0.42 26782.00 0.40 Naples620 62 0.47 12602.39 0.19 Agana621 44 0.33 23237.00 0.34 Okinawa622 57 0.43 26827.82 0.40 NH Yokosuka/other
Asian633 69 0.52 20315.00 0.30 RAF Lakenheath/other
Europe638 61 0.46 12031.00 0.18 Kunsan AB/Osan AB640 65 0.49 15645.00 0.23 Yokota AB804 66 0.50 11124.00 0.16 Kadena AFB805 78 0.59 9866.00 0.15 Spangdahlem AB806 66 0.50 15156.00 0.22 Spangdahlem/Ramstein
AFB7139 97 0.73 10634.00 0.16 Hurlburt Field9901 256 1.93 420229.10 6.23 Out/Area-Reg 19902 92 0.69 163940.90 2.43 Out/Area-Reg 29903 179 1.35 340484.50 5.05 Out/Area-Reg 39904 131 0.99 235972.80 3.50 Out/Area-Reg 49905 182 1.37 297777.10 4.41 Out/Area-Reg 59906 243 1.84 369652.50 5.48 Out/Area-Reg 69907 56 0.42 107443.20 1.59 Out/Area-Reg 79908 169 1.28 303941.70 4.51 Out/Area-Reg 89909 84 0.63 129275.70 1.92 Out/Area-Reg 99910 74 0.56 114458.70 1.70 Out/Area-Reg 109911 78 0.59 119469.20 1.77 Out/Area-Reg 119912 10 0.08 14520.66 0.22 Out/Area-Reg 129913 12 0.09 26798.72 0.40 Out/Area-Europe9914 4 0.03 1597.87 0.02 Out/Area-Pacific9915 23 0.17 59424.90 0.88 Out/Area-Latin America &
Can9999 10 0.08 37914.52 0.56 Missing
ENBGSMPL -Enrollment by beneficiary category
Unweighted WeightedValue Count Percent Count Percent Formatted Value
1 3945 29.80 1679865.00 24.90 Active duty2 127 0.96 91885.17 1.36 Active duty fam3 2075 15.67 602655.20 8.93 Active duty fam4 860 6.50 221344.00 3.28 Active duty fam5 300 2.27 275133.10 4.08 Retired6 1977 14.93 557306.40 8.26 Retired7 1990 15.03 1662805.00 24.65 Retired10 1965 14.84 1655083.00 24.53 Retired
05/13/23 105
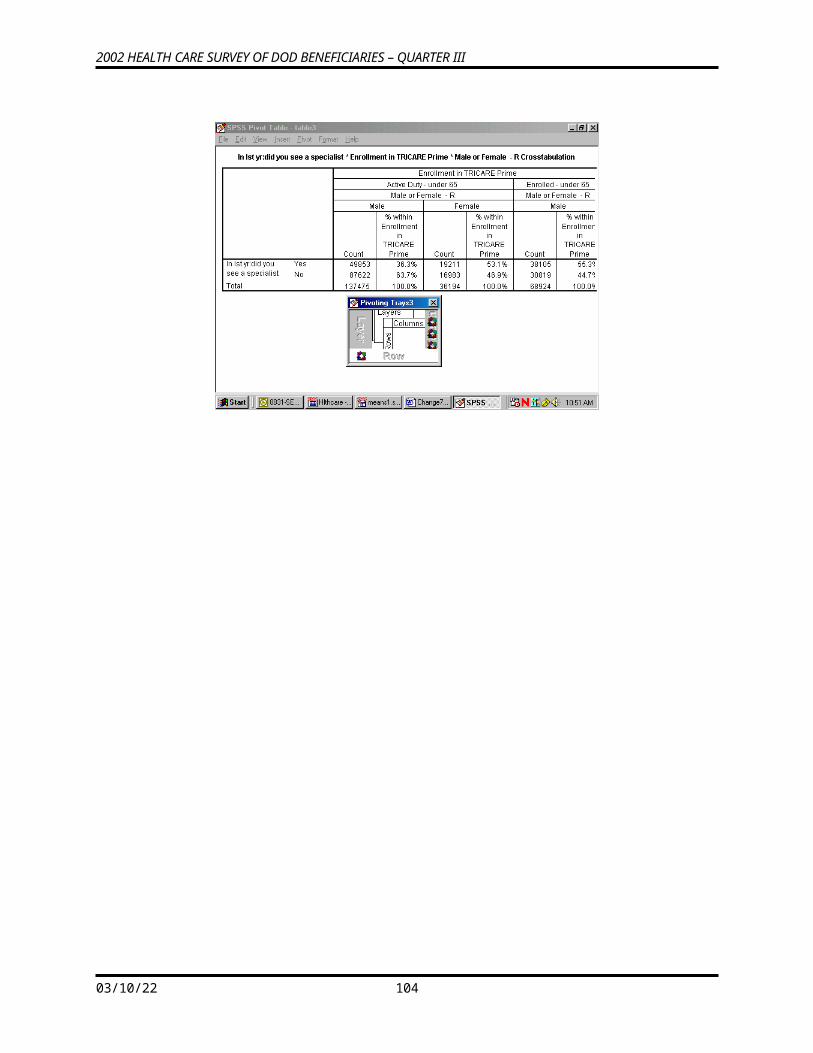
2002 HEALTH CARE SURVEY OF DOD BENEFICIARIES – QUARTER III
MPCSMPL -Military Personnel Category
Unweighted WeightedValue Count Percent Count Percent Formatted Value
1 9210 69.57 4685195.00 69.45 Enlisted/Unknown2 3614 27.30 1834833.00 27.20 Officer3 415 3.13 226049.20 3.35 Warrant officer
NHFF -Stratum Sample Size
Unweighted WeightedValue Count Percent Count Percent Formatted Value
27 -- 441 13239 100.00 6746077.00 100.00 0--9999
SERVAREA -Service Area
Unweighted WeightedValue Count Percent Count Percent Formatted Value
11535 87.13 6045674.00 89.62 Missing1 146 1.10 109174.70 1.62 Serv area1
(Pendleton/San Diego)2 110 0.83 34663.93 0.51 Serv area2
(Carson/USAF)3 354 2.67 149778.50 2.22 Serv area3
(DC/Andrews/Bethesda/Belvoir)
4 154 1.16 53151.22 0.79 Serv area4 (Pensacola/Eglin)
5 163 1.23 42275.70 0.63 Serv area5 (Stewart/Charleston/Beaufort)
6 99 0.75 22221.12 0.33 Serv area6 (Lejeune/Cherry Point)
7 77 0.58 15855.60 0.24 Serv area7 (Sill/Sheppard)
8 82 0.62 26895.96 0.40 Serv area8 (Shaw/Jackson)
9 137 1.03 63778.32 0.95 Serv area9 (Sam Houston/Lackland)
10 232 1.75 118148.80 1.75 Serv area10 (Langley/Eustis/Portsmouth)
11 150 1.13 64458.63 0.96 Serv area11 (Lewis/Bremerton/Oak Harbor)
05/13/23 106
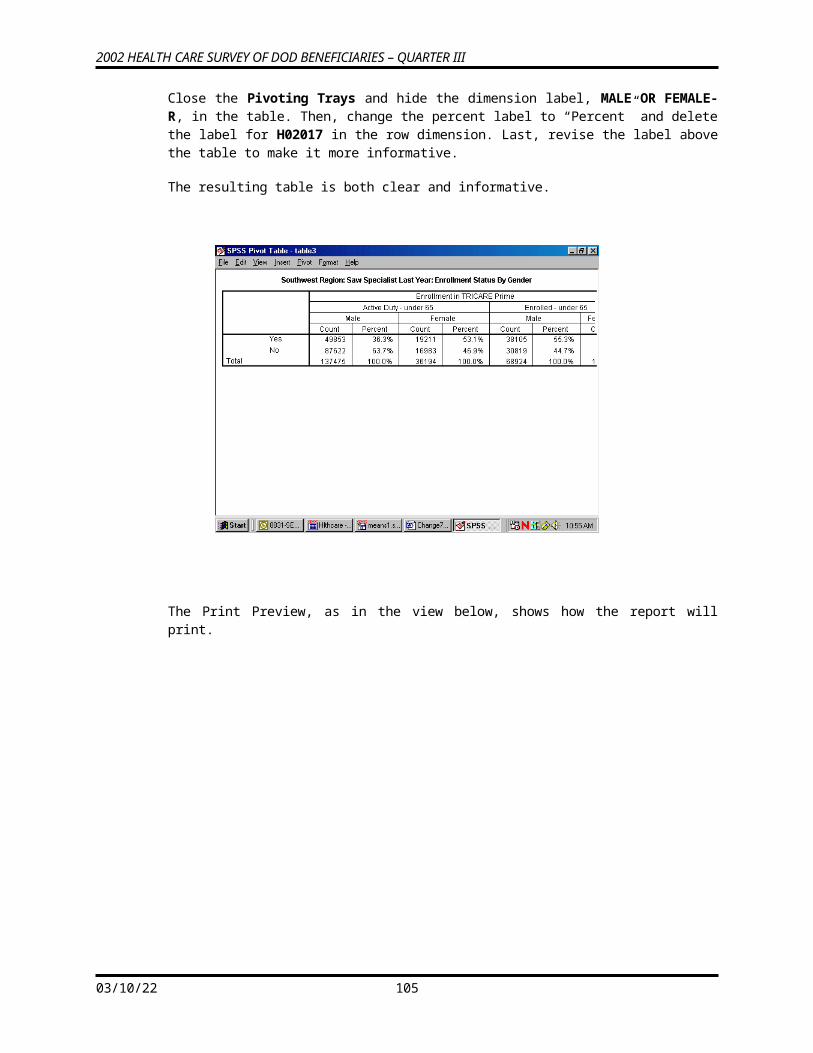
2002 HEALTH CARE SURVEY OF DOD BENEFICIARIES – QUARTER III
QUARTER -Survey Quarter
Unweighted WeightedValue Count Percent Count Percent Formatted Value
Q3 2002 13239 100.00 6746077.00 100.00 Q3 2002
DCATCH -Catchment Area
Unweighted WeightedValue Count Percent Count Percent Formatted Value
3 106 0.80 26058.49 0.39 3.005 64 0.48 15573.42 0.23 5.006 80 0.60 21184.99 0.31 6.009 169 1.28 66630.23 0.99 9.0014 157 1.19 73810.96 1.09 14.0024 148 1.12 91517.66 1.36 24.0028 90 0.68 22585.57 0.33 28.0029 172 1.30 195537.00 2.90 29.0030 91 0.69 19261.13 0.29 30.0032 113 0.85 43623.04 0.65 32.0033 153 1.16 54639.73 0.81 33.0037 207 1.56 69953.64 1.04 37.0038 143 1.08 58986.90 0.87 38.0039 160 1.21 98397.54 1.46 39.0042 236 1.78 63085.34 0.94 42.0045 213 1.61 81693.64 1.21 45.0047 105 0.79 42749.45 0.63 47.0048 112 0.85 55751.72 0.83 48.0049 100 0.76 49014.80 0.73 49.0052 354 2.67 99770.93 1.48 52.0053 87 0.66 9671.44 0.14 53.0055 139 1.05 42879.29 0.64 55.0056 120 0.91 55448.61 0.82 56.0057 89 0.67 23175.18 0.34 57.0060 129 0.97 56857.32 0.84 60.0061 119 0.90 43173.99 0.64 61.0064 72 0.54 19160.54 0.28 64.0066 201 1.52 74858.40 1.11 66.0067 211 1.59 85541.05 1.27 67.0073 111 0.84 41886.78 0.62 73.0075 106 0.80 24822.77 0.37 75.0078 122 0.92 33327.71 0.49 78.0079 129 0.97 53601.37 0.79 79.0086 108 0.82 25520.09 0.38 86.0089 184 1.39 117311.30 1.74 89.0091 121 0.91 64270.31 0.95 91.0092 91 0.69 23291.48 0.35 92.0095 117 0.88 40004.13 0.59 95.0098 85 0.64 34533.38 0.51 98.00101 87 0.66 17944.74 0.27 101.00103 131 0.99 49302.97 0.73 103.00
05/13/23 107
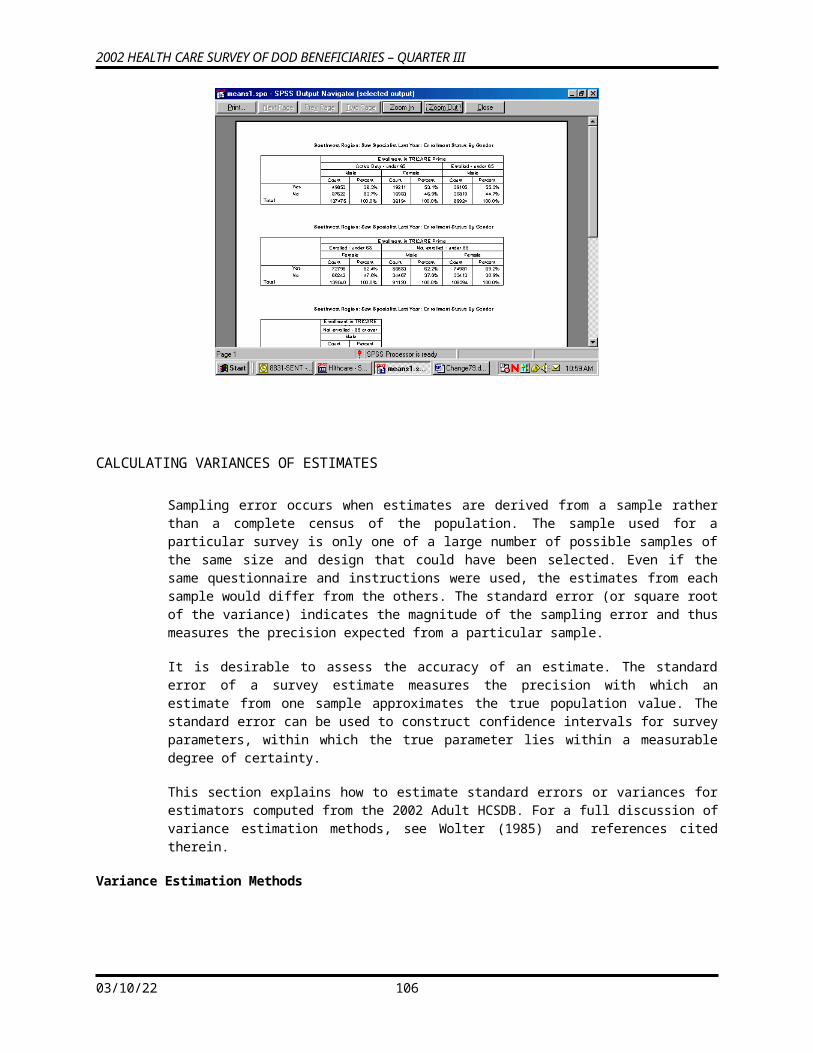
2002 HEALTH CARE SURVEY OF DOD BENEFICIARIES – QUARTER III
104 103 0.78 22190.37 0.33 104.00105 108 0.82 43944.33 0.65 105.00108 97 0.73 40666.30 0.60 108.00109 264 1.99 78307.07 1.16 109.00110 155 1.17 97245.98 1.44 110.00113 100 0.76 18363.74 0.27 113.00117 145 1.10 77820.49 1.15 117.00120 141 1.07 39366.13 0.58 120.00121 117 0.88 42296.68 0.63 121.00123 271 2.05 102876.90 1.52 123.00124 219 1.65 211962.80 3.14 124.00125 188 1.42 110920.40 1.64 125.00126 101 0.76 38353.18 0.57 126.00127 89 0.67 21072.71 0.31 127.00131 63 0.48 8461.42 0.13 131.00606 59 0.45 28144.53 0.42 606.00607 102 0.77 29777.98 0.44 607.00609 47 0.36 20003.22 0.30 609.00612 48 0.36 21672.76 0.32 612.00615 2 0.02 273.69 0.00 615.00616 49 0.37 7293.63 0.11 616.00617 14 0.11 6362.10 0.09 617.00618 11 0.08 5244.55 0.08 618.00620 48 0.36 11296.65 0.17 620.00621 98 0.74 31551.21 0.47 621.00622 45 0.34 20035.35 0.30 622.00623 5 0.04 1981.13 0.03 623.00624 5 0.04 2605.53 0.04 624.00629 5 0.04 2238.98 0.03 629.00633 37 0.28 10614.71 0.16 633.00635 7 0.05 3238.43 0.05 635.00637 16 0.12 2930.58 0.04 637.00638 34 0.26 7543.65 0.11 638.00639 23 0.17 5753.61 0.09 639.00640 35 0.26 8140.55 0.12 640.00781 7 0.05 7658.78 0.11 781.00782 11 0.08 17492.58 0.26 782.00783 6 0.05 5980.37 0.09 783.00784 93 0.70 67027.43 0.99 784.00785 227 1.71 66555.29 0.99 785.00786 16 0.12 9971.76 0.15 786.00788 12 0.09 15591.82 0.23 788.00789 2 0.02 3748.50 0.06 789.00805 49 0.37 6327.09 0.09 805.00808 19 0.14 8251.67 0.12 808.00901 246 1.86 113555.50 1.68 901.00902 18 0.14 9600.39 0.14 902.00904 149 1.13 75120.30 1.11 904.00906 43 0.32 56058.53 0.83 906.00907 49 0.37 35889.17 0.53 907.00908 110 0.83 18660.21 0.28 908.00911 224 1.69 151279.10 2.24 911.00912 6 0.05 7624.83 0.11 912.00914 34 0.26 48735.46 0.72 914.00915 28 0.21 33436.46 0.50 915.00917 142 1.07 57768.66 0.86 917.00
05/13/23 108
2002 HEALTH CARE SURVEY OF DOD BENEFICIARIES – QUARTER III
918 17 0.13 24856.56 0.37 918.00920 58 0.44 41244.49 0.61 920.00921 45 0.34 36038.08 0.53 921.00922 83 0.63 39178.74 0.58 922.00923 46 0.35 66793.99 0.99 923.00924 23 0.17 39492.23 0.59 924.00925 64 0.48 44083.42 0.65 925.00927 52 0.39 30046.98 0.45 927.00928 9 0.07 14191.41 0.21 928.00929 25 0.19 26868.21 0.40 929.00930 24 0.18 28217.70 0.42 930.00931 147 1.11 80680.10 1.20 931.00932 155 1.17 78777.48 1.17 932.00933 118 0.89 79159.91 1.17 933.00934 158 1.19 107859.30 1.60 934.00935 55 0.42 14639.61 0.22 935.00936 45 0.34 67308.13 1.00 936.00937 143 1.08 85612.07 1.27 937.00938 34 0.26 46286.65 0.69 938.00939 101 0.76 114460.10 1.70 939.00940 48 0.36 22476.92 0.33 940.00941 32 0.24 50071.59 0.74 941.00942 47 0.36 15893.61 0.24 942.00943 57 0.43 80766.81 1.20 943.00945 86 0.65 36786.65 0.55 945.00946 5 0.04 5679.54 0.08 946.00948 137 1.03 81748.25 1.21 948.00950 27 0.20 41933.95 0.62 950.00951 44 0.33 20467.47 0.30 951.00953 24 0.18 49505.94 0.73 953.00957 62 0.47 44124.58 0.65 957.00960 12 0.09 5206.83 0.08 960.00961 4 0.03 1875.57 0.03 961.00965 5 0.04 2274.29 0.03 965.00966 1 0.01 588.68 0.01 966.00967 3 0.02 1665.89 0.02 967.00968 27 0.20 7844.89 0.12 968.00970 1 0.01 657.03 0.01 970.00971 5 0.04 6565.20 0.10 971.00972 1 0.01 933.89 0.01 972.00973 11 0.08 6777.38 0.10 973.00974 22 0.17 12816.71 0.19 974.00975 3 0.02 3590.87 0.05 975.00976 2 0.02 948.61 0.01 976.00977 8 0.06 4920.38 0.07 977.00978 4 0.03 2132.29 0.03 978.00979 6 0.05 1768.30 0.03 979.00982 17 0.13 5459.00 0.08 982.00983 1 0.01 399.47 0.01 983.00985 104 0.79 129642.80 1.92 985.00986 210 1.59 157661.60 2.34 986.00987 226 1.71 206754.10 3.06 987.00988 112 0.85 24757.76 0.37 988.00989 23 0.17 24654.41 0.37 989.00990 104 0.79 40408.99 0.60 990.00993 373 2.82 255036.00 3.78 993.00
05/13/23 109
2002 HEALTH CARE SURVEY OF DOD BENEFICIARIES – QUARTER III
995 13 0.10 14772.80 0.22 995.00996 56 0.42 78821.41 1.17 996.00999 40 0.30 48596.77 0.72 999.00
DMIS_ID -DMIS ID
Unweighted WeightedValue Count Percent Count Percent Formatted Value
1 65 0.49 6730.14 0.10 1.003 103 0.78 23480.59 0.35 3.004 118 0.89 10954.00 0.16 4.005 54 0.41 12093.28 0.18 5.006 111 0.84 27891.39 0.41 6.008 102 0.77 10328.00 0.15 8.009 152 1.15 61775.45 0.92 9.0010 110 0.83 17032.00 0.25 10.0013 112 0.85 11006.00 0.16 13.0014 152 1.15 73770.71 1.09 14.0015 8 0.06 3700.48 0.05 15.0018 31 0.23 5782.96 0.09 18.0019 35 0.26 6508.49 0.10 19.0024 100 0.76 57955.03 0.86 24.0026 13 0.10 10249.11 0.15 26.0028 72 0.54 15683.52 0.23 28.0029 114 0.86 116425.60 1.73 29.0030 82 0.62 17085.16 0.25 30.0032 90 0.68 34825.20 0.52 32.0033 100 0.76 36471.62 0.54 33.0034 2 0.02 547.11 0.01 34.0035 35 0.26 6933.29 0.10 35.0036 111 0.84 9994.00 0.15 36.0037 109 0.82 38777.14 0.57 37.0038 104 0.79 43829.77 0.65 38.0039 107 0.81 64464.87 0.96 39.0042 136 1.03 52241.31 0.77 42.0043 108 0.82 10288.00 0.15 43.0045 185 1.40 74488.24 1.10 45.0046 111 0.84 12319.00 0.18 46.0047 99 0.75 40242.74 0.60 47.0048 89 0.67 41006.79 0.61 48.0049 69 0.52 27362.61 0.41 49.0050 13 0.10 10022.26 0.15 50.0051 110 0.83 12846.00 0.19 51.0052 89 0.67 49715.04 0.74 52.0053 100 0.76 10687.33 0.16 53.0055 136 1.03 43532.94 0.65 55.0056 117 0.88 52378.01 0.78 56.0057 79 0.60 18675.97 0.28 57.0058 64 0.48 9526.39 0.14 58.0059 70 0.53 7372.16 0.11 59.0060 95 0.72 34666.65 0.51 60.0061 110 0.83 41271.56 0.61 61.0062 89 0.67 11481.00 0.17 62.00
05/13/23 110
2002 HEALTH CARE SURVEY OF DOD BENEFICIARIES – QUARTER III
64 75 0.57 19985.30 0.30 64.0066 125 0.94 51113.61 0.76 66.0067 146 1.10 63206.45 0.94 67.0068 12 0.09 5426.28 0.08 68.0069 51 0.39 15923.94 0.24 69.0073 97 0.73 39281.28 0.58 73.0074 41 0.31 4262.22 0.06 74.0075 110 0.83 25107.59 0.37 75.0076 40 0.30 5952.26 0.09 76.0077 41 0.31 6760.66 0.10 77.0078 121 0.91 32453.05 0.48 78.0079 128 0.97 54119.35 0.80 79.0081 16 0.12 2763.08 0.04 81.0083 79 0.60 14197.12 0.21 83.0084 19 0.14 10756.55 0.16 84.0085 28 0.21 4954.88 0.07 85.0086 86 0.65 21796.60 0.32 86.0089 80 0.60 53466.24 0.79 89.0090 100 0.76 9736.00 0.14 90.0091 93 0.70 36561.89 0.54 91.0092 84 0.63 19781.99 0.29 92.0093 19 0.14 4588.81 0.07 93.0094 36 0.27 8649.49 0.13 94.0095 121 0.91 41889.36 0.62 95.0096 68 0.51 16759.70 0.25 96.0097 10 0.08 4765.16 0.07 97.0098 82 0.62 32885.93 0.49 98.00100 48 0.36 10750.15 0.16 100.00101 95 0.72 19511.69 0.29 101.00103 89 0.67 32925.04 0.49 103.00104 89 0.67 14223.46 0.21 104.00105 99 0.75 39697.81 0.59 105.00106 44 0.33 7418.75 0.11 106.00107 12 0.09 6212.18 0.09 107.00108 66 0.50 27620.98 0.41 108.00109 131 0.99 58696.32 0.87 109.00110 80 0.60 46205.90 0.68 110.00112 76 0.57 9898.79 0.15 112.00113 98 0.74 18375.05 0.27 113.00114 6 0.05 3988.19 0.06 114.00117 97 0.73 52170.95 0.77 117.00118 42 0.32 5431.16 0.08 118.00119 72 0.54 11671.34 0.17 119.00120 131 0.99 38096.65 0.56 120.00121 96 0.73 38809.05 0.58 121.00122 14 0.11 8083.22 0.12 122.00123 137 1.03 64986.85 0.96 123.00124 137 1.03 128482.40 1.90 124.00125 137 1.03 79486.81 1.18 125.00126 78 0.59 28258.85 0.42 126.00127 72 0.54 14879.40 0.22 127.00128 91 0.69 9414.62 0.14 128.00129 40 0.30 6784.44 0.10 129.00130 6 0.05 1868.21 0.03 130.00131 64 0.48 8263.59 0.12 131.00190 36 0.27 18379.20 0.27 190.00
05/13/23 111
2002 HEALTH CARE SURVEY OF DOD BENEFICIARIES – QUARTER III
191 4 0.03 8042.49 0.12 191.00192 3 0.02 4823.81 0.07 192.00193 7 0.05 6183.21 0.09 193.00194 18 0.14 18338.14 0.27 194.00196 4 0.03 6584.08 0.10 196.00197 3 0.02 4899.98 0.07 197.00198 5 0.04 9869.03 0.15 198.00199 2 0.02 2921.10 0.04 199.00203 18 0.14 4781.03 0.07 203.00204 4 0.03 1245.47 0.02 204.00206 5 0.04 639.73 0.01 206.00208 4 0.03 4161.47 0.06 208.00210 5 0.04 4298.51 0.06 210.00212 10 0.08 3122.05 0.05 212.00217 2 0.02 2080.74 0.03 217.00231 11 0.08 17592.10 0.26 231.00232 4 0.03 5636.14 0.08 232.00233 4 0.03 6455.13 0.10 233.00247 4 0.03 3212.54 0.05 247.00248 36 0.27 6564.56 0.10 248.00252 46 0.35 15906.59 0.24 252.00256 30 0.23 10786.19 0.16 256.00260 6 0.05 3682.40 0.05 260.00261 5 0.04 2357.45 0.03 261.00262 5 0.04 3068.67 0.05 262.00265 7 0.05 3315.11 0.05 265.00266 8 0.06 7471.16 0.11 266.00269 6 0.05 3983.89 0.06 269.00272 14 0.11 9491.71 0.14 272.00273 24 0.18 8911.41 0.13 273.00275 2 0.02 1545.84 0.02 275.00280 65 0.49 11045.87 0.16 280.00281 13 0.10 2156.75 0.03 281.00284 2 0.02 367.76 0.01 284.00285 21 0.16 3672.87 0.05 285.00287 130 0.98 9084.00 0.13 287.00290 1 0.01 536.50 0.01 290.00297 5 0.04 2357.45 0.03 297.00299 38 0.29 4577.94 0.07 299.00306 14 0.11 4385.94 0.07 306.00308 14 0.11 4193.41 0.06 308.00309 11 0.08 3557.44 0.05 309.00310 60 0.45 6545.85 0.10 310.00313 4 0.03 2146.00 0.03 313.00316 1 0.01 363.57 0.01 316.00317 5 0.04 2587.98 0.04 317.00319 8 0.06 2091.53 0.03 319.00321 8 0.06 885.60 0.01 321.00322 1 0.01 481.33 0.01 322.00326 94 0.71 10185.66 0.15 326.00327 1 0.01 662.86 0.01 327.00328 8 0.06 2188.44 0.03 328.00330 31 0.23 5648.61 0.08 330.00335 11 0.08 7686.69 0.11 335.00337 13 0.10 9011.34 0.13 337.00338 22 0.17 2322.84 0.03 338.00
05/13/23 112
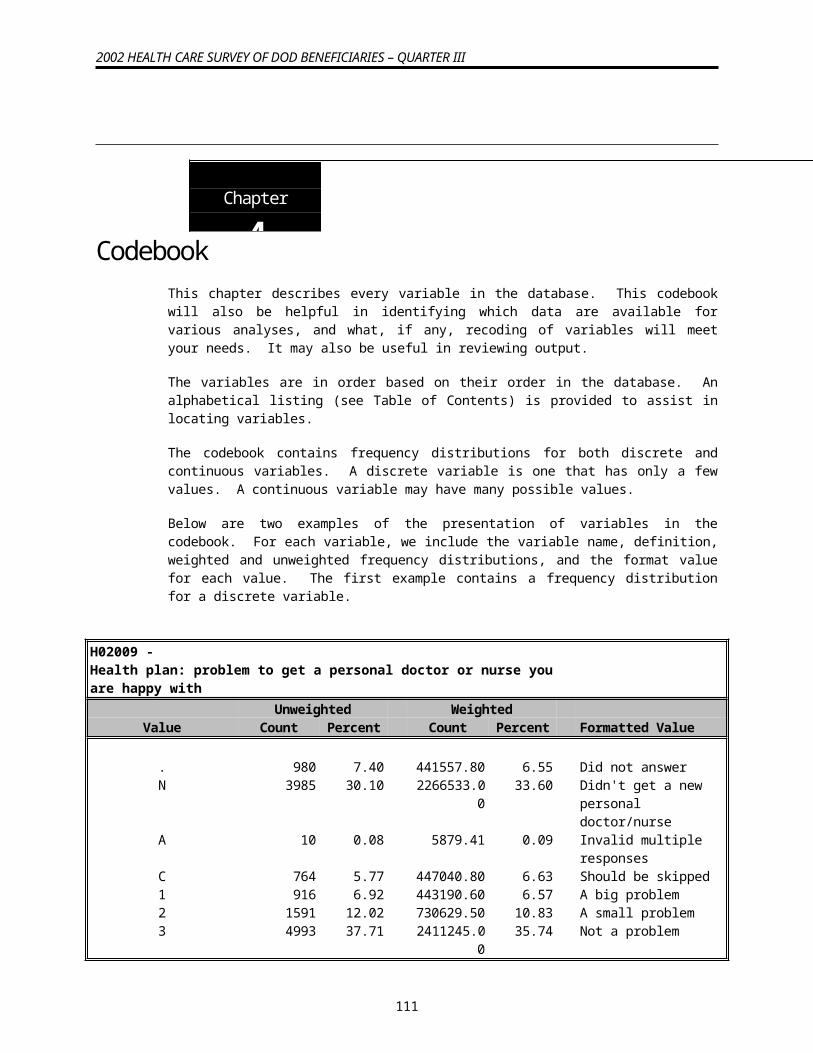
2002 HEALTH CARE SURVEY OF DOD BENEFICIARIES – QUARTER III
347 5 0.04 2406.67 0.04 347.00352 26 0.20 7785.24 0.12 352.00356 17 0.13 6810.14 0.10 356.00358 10 0.08 5330.50 0.08 358.00360 1 0.01 533.05 0.01 360.00363 9 0.07 3791.30 0.06 363.00364 33 0.25 4284.21 0.06 364.00365 10 0.08 6969.61 0.10 365.00366 124 0.94 14813.00 0.22 366.00369 16 0.12 2114.00 0.03 369.00370 19 0.14 2243.69 0.03 370.00372 2 0.02 1149.70 0.02 372.00378 15 0.11 16427.37 0.24 378.00381 1 0.01 1495.22 0.02 381.00382 1 0.01 1495.22 0.02 382.00385 83 0.63 14767.44 0.22 385.00386 6 0.05 2527.65 0.04 386.00387 12 0.09 14171.26 0.21 387.00390 21 0.16 9639.31 0.14 390.00395 22 0.17 13593.74 0.20 395.00398 1 0.01 506.04 0.01 398.00401 2 0.02 761.94 0.01 401.00405 13 0.10 8547.78 0.13 405.00407 5 0.04 8047.44 0.12 407.00413 16 0.12 7042.83 0.10 413.00416 5 0.04 527.64 0.01 416.00418 2 0.02 971.33 0.01 418.00419 1 0.01 651.41 0.01 419.00420 1 0.01 368.12 0.01 420.00423 1 0.01 365.92 0.01 423.00425 5 0.04 645.62 0.01 425.00426 8 0.06 1032.99 0.02 426.00428 4 0.03 420.34 0.01 428.00432 7 0.05 2485.39 0.04 432.00433 1 0.01 355.06 0.01 433.00435 1 0.01 506.04 0.01 435.00436 1 0.01 613.73 0.01 436.00437 9 0.07 5762.93 0.09 437.00508 15 0.11 21870.94 0.32 508.00511 26 0.20 10913.37 0.16 511.00513 1 0.01 613.73 0.01 513.00517 4 0.03 2904.99 0.04 517.00519 1 0.01 1495.22 0.02 519.00522 1 0.01 481.33 0.01 522.00534 12 0.09 10218.51 0.15 534.00545 1 0.01 330.40 0.00 545.00606 28 0.21 14801.40 0.22 606.00607 28 0.21 10184.17 0.15 607.00609 20 0.15 6326.53 0.09 609.00610 8 0.06 1819.70 0.03 610.00611 9 0.07 3283.37 0.05 611.00612 24 0.18 5862.43 0.09 612.00614 5 0.04 1809.66 0.03 614.00615 3 0.02 363.80 0.01 615.00616 51 0.39 7311.35 0.11 616.00617 4 0.03 1788.30 0.03 617.00
05/13/23 113

2002 HEALTH CARE SURVEY OF DOD BENEFICIARIES – QUARTER III
618 12 0.09 5833.24 0.09 618.00620 30 0.23 6572.84 0.10 620.00621 13 0.10 2892.01 0.04 621.00622 42 0.32 18262.57 0.27 622.00623 5 0.04 2522.20 0.04 623.00624 6 0.05 3005.58 0.04 624.00625 3 0.02 1700.14 0.03 625.00629 5 0.04 2238.98 0.03 629.00633 50 0.38 15145.96 0.22 633.00635 8 0.06 3721.81 0.06 635.00637 16 0.12 3056.01 0.05 637.00638 46 0.35 9028.72 0.13 638.00639 28 0.21 7259.95 0.11 639.00640 32 0.24 8337.38 0.12 640.00653 3 0.02 890.03 0.01 653.00656 20 0.15 2551.16 0.04 656.00701 5 0.04 8866.43 0.13 701.00703 4 0.03 1925.33 0.03 703.00781 4 0.03 6107.61 0.09 781.00782 11 0.08 17492.58 0.26 782.00783 2 0.02 2108.86 0.03 783.00784 33 0.25 57157.86 0.85 784.00785 18 0.14 34407.35 0.51 785.00786 3 0.02 4788.17 0.07 786.00788 7 0.05 10277.52 0.15 788.00789 3 0.02 4532.54 0.07 789.00799 20 0.15 2525.66 0.04 799.00800 7 0.05 1563.35 0.02 800.00802 17 0.13 3233.05 0.05 802.00804 66 0.50 11124.00 0.16 804.00805 58 0.44 7340.34 0.11 805.00806 59 0.45 13592.65 0.20 806.00808 17 0.13 8301.02 0.12 808.00814 6 0.05 1749.35 0.03 814.00825 2 0.02 1072.06 0.02 825.00851 3 0.02 363.80 0.01 851.00852 3 0.02 1700.14 0.03 852.00853 9 0.07 5068.03 0.08 853.00855 1 0.01 483.38 0.01 855.00862 14 0.11 8603.50 0.13 862.00871 10 0.08 1758.16 0.03 871.00872 3 0.02 495.60 0.01 872.00901 45 0.34 79824.87 1.18 901.00902 6 0.05 7743.63 0.11 902.00904 36 0.27 55103.69 0.82 904.00906 27 0.20 43847.32 0.65 906.00907 16 0.12 25089.95 0.37 907.00908 8 0.06 9649.82 0.14 908.00911 57 0.43 96324.39 1.43 911.00912 5 0.04 7459.63 0.11 912.00914 24 0.18 42841.13 0.64 914.00915 18 0.14 27414.75 0.41 915.00917 25 0.19 42022.73 0.62 917.00918 11 0.08 15266.73 0.23 918.00920 15 0.11 23513.76 0.35 920.00921 14 0.11 17333.33 0.26 921.00
05/13/23 114
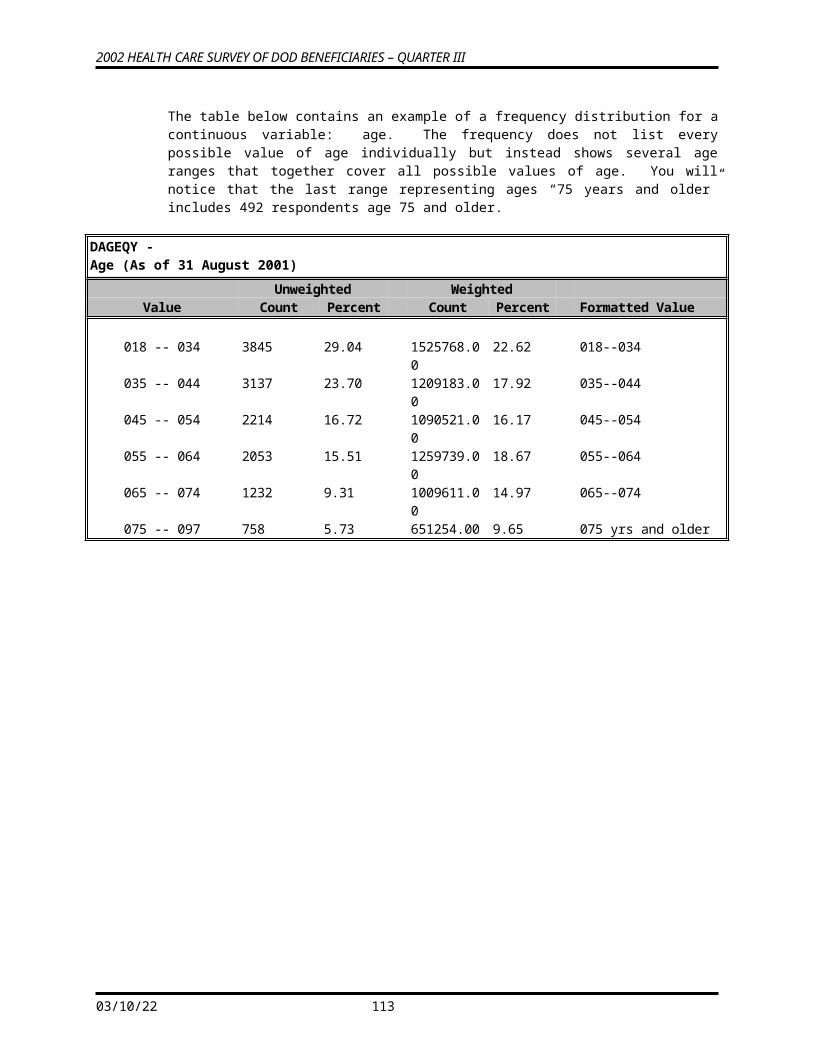
2002 HEALTH CARE SURVEY OF DOD BENEFICIARIES – QUARTER III
922 18 0.14 26292.55 0.39 922.00923 31 0.23 50018.49 0.74 923.00924 19 0.14 33211.50 0.49 924.00925 13 0.10 26732.70 0.40 925.00927 12 0.09 23229.00 0.34 927.00928 8 0.06 13434.81 0.20 928.00929 8 0.06 14633.04 0.22 929.00930 12 0.09 21892.56 0.32 930.00931 33 0.25 57259.86 0.85 931.00932 26 0.20 47230.76 0.70 932.00933 36 0.27 51817.30 0.77 933.00934 51 0.39 84991.39 1.26 934.00935 2 0.02 2533.32 0.04 935.00936 27 0.20 47628.27 0.71 936.00937 39 0.29 56420.15 0.84 937.00938 21 0.16 32556.33 0.48 938.00939 60 0.45 97253.02 1.44 939.00940 9 0.07 13688.76 0.20 940.00941 22 0.17 44017.63 0.65 941.00942 4 0.03 8018.37 0.12 942.00943 39 0.29 69272.16 1.03 943.00945 11 0.08 13675.68 0.20 945.00946 2 0.02 2359.11 0.03 946.00948 37 0.28 53227.31 0.79 948.00950 25 0.19 37044.06 0.55 950.00951 7 0.05 14194.52 0.21 951.00953 17 0.13 46221.43 0.69 953.00957 7 0.05 20380.27 0.30 957.00958 1 0.01 117.70 0.00 958.00960 2 0.02 899.51 0.01 960.00965 1 0.01 66.06 0.00 965.00971 3 0.02 8899.63 0.13 971.00973 3 0.02 4524.04 0.07 973.00974 6 0.05 9493.49 0.14 974.00975 2 0.02 3366.01 0.05 975.00977 1 0.01 2966.54 0.04 977.00978 1 0.01 99.69 0.00 978.00979 1 0.01 167.26 0.00 979.00982 3 0.02 1939.28 0.03 982.00983 4 0.03 1597.87 0.02 983.00985 70 0.53 102761.40 1.52 985.00986 75 0.57 104829.20 1.55 986.00987 77 0.58 143857.00 2.13 987.00988 6 0.05 10157.10 0.15 988.00989 14 0.11 18923.89 0.28 989.00990 18 0.14 28133.55 0.42 990.00993 113 0.85 162778.10 2.41 993.00995 6 0.05 11245.51 0.17 995.00996 40 0.30 65462.68 0.97 996.00999 5 0.04 36790.20 0.55 999.001003 8 0.06 4880.58 0.07 1003.001013 8 0.06 3995.70 0.06 1013.001014 3 0.02 1404.03 0.02 1014.001015 7 0.05 3401.88 0.05 1015.001016 5 0.04 2591.68 0.04 1016.001017 7 0.05 3590.60 0.05 1017.00
05/13/23 115
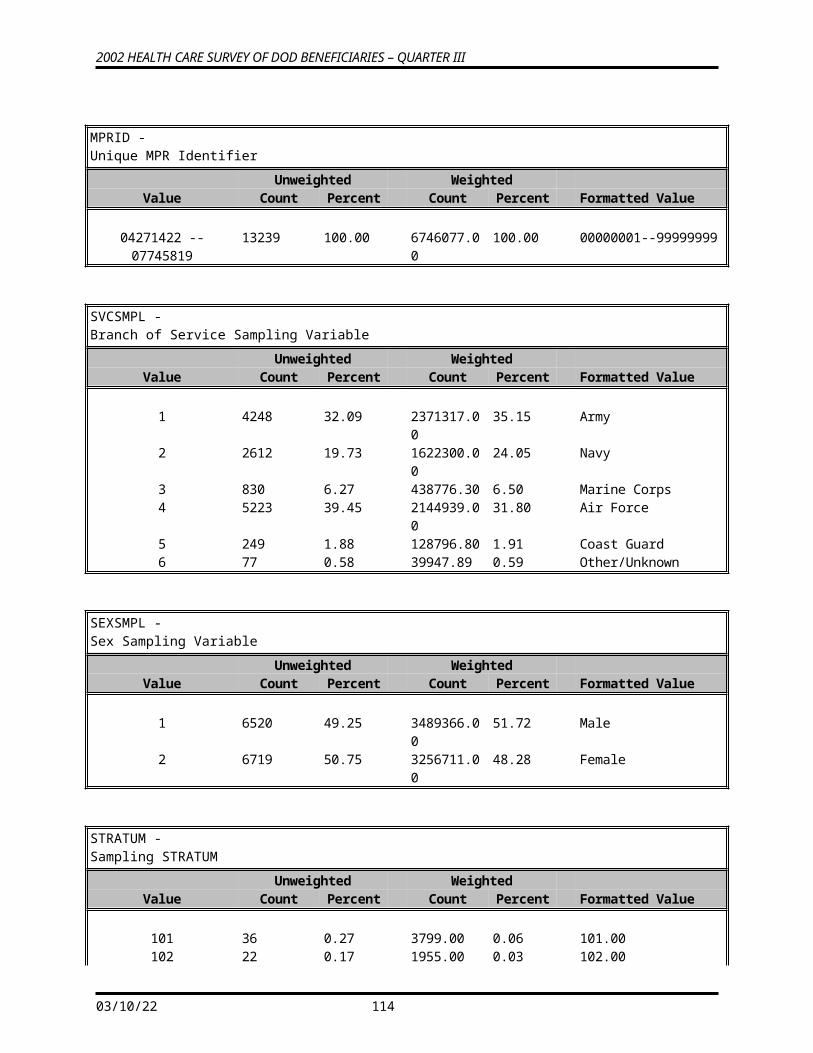
2002 HEALTH CARE SURVEY OF DOD BENEFICIARIES – QUARTER III
1019 8 0.06 4184.43 0.06 1019.001124 7 0.05 3590.60 0.05 1124.001126 16 0.12 5800.47 0.09 1126.001127 5 0.04 2591.68 0.04 1127.001128 6 0.05 2151.75 0.03 1128.001144 3 0.02 1944.92 0.03 1144.001145 1 0.01 560.92 0.01 1145.001147 11 0.08 3990.82 0.06 1147.001153 11 0.08 5633.08 0.08 1153.001154 1 0.01 339.02 0.01 1154.001156 8 0.06 4160.43 0.06 1156.001157 13 0.10 6434.71 0.10 1157.001158 4 0.03 2080.21 0.03 1158.001170 1 0.01 483.38 0.01 1170.001179 2 0.02 572.88 0.01 1179.001235 4 0.03 1997.85 0.03 1235.001269 7 0.05 4205.85 0.06 1269.001307 1 0.01 506.04 0.01 1307.001316 8 0.06 4884.51 0.07 1316.001506 5 0.04 4345.34 0.06 1506.001550 2 0.02 716.83 0.01 1550.001551 8 0.06 9126.80 0.14 1551.001552 2 0.02 2281.70 0.03 1552.001560 2 0.02 891.89 0.01 1560.001562 2 0.02 1932.29 0.03 1562.001563 4 0.03 3864.57 0.06 1563.001564 7 0.05 5997.36 0.09 1564.001592 32 0.24 23038.70 0.34 1592.001593 12 0.09 8655.34 0.13 1593.001597 4 0.03 2885.11 0.04 1597.001599 3 0.02 2163.84 0.03 1599.001617 21 0.16 11886.94 0.18 1617.001646 7 0.05 5621.95 0.08 1646.001649 2 0.02 1606.27 0.02 1649.001656 10 0.08 4961.06 0.07 1656.001657 4 0.03 4161.47 0.06 1657.001659 1 0.01 1040.37 0.02 1659.001660 1 0.01 1026.04 0.02 1660.001663 1 0.01 1447.74 0.02 1663.001670 1 0.01 238.31 0.00 1670.001671 4 0.03 953.25 0.01 1671.001745 24 0.18 18316.50 0.27 1745.001815 4 0.03 2208.50 0.03 1815.001959 3 0.02 3078.11 0.05 1959.001975 1 0.01 1040.37 0.02 1975.001976 2 0.02 1891.91 0.03 1976.001978 1 0.01 1040.37 0.02 1978.001980 1 0.01 1040.37 0.02 1980.001987 2 0.02 367.76 0.01 1987.001990 1 0.01 613.73 0.01 1990.001992 1 0.01 1447.74 0.02 1992.003031 1 0.01 933.89 0.01 3031.005197 2 0.02 367.18 0.01 5197.006200 39 0.29 17491.29 0.26 6200.006201 26 0.20 11165.24 0.17 6201.006207 5 0.04 4952.46 0.07 6207.00
05/13/23 116
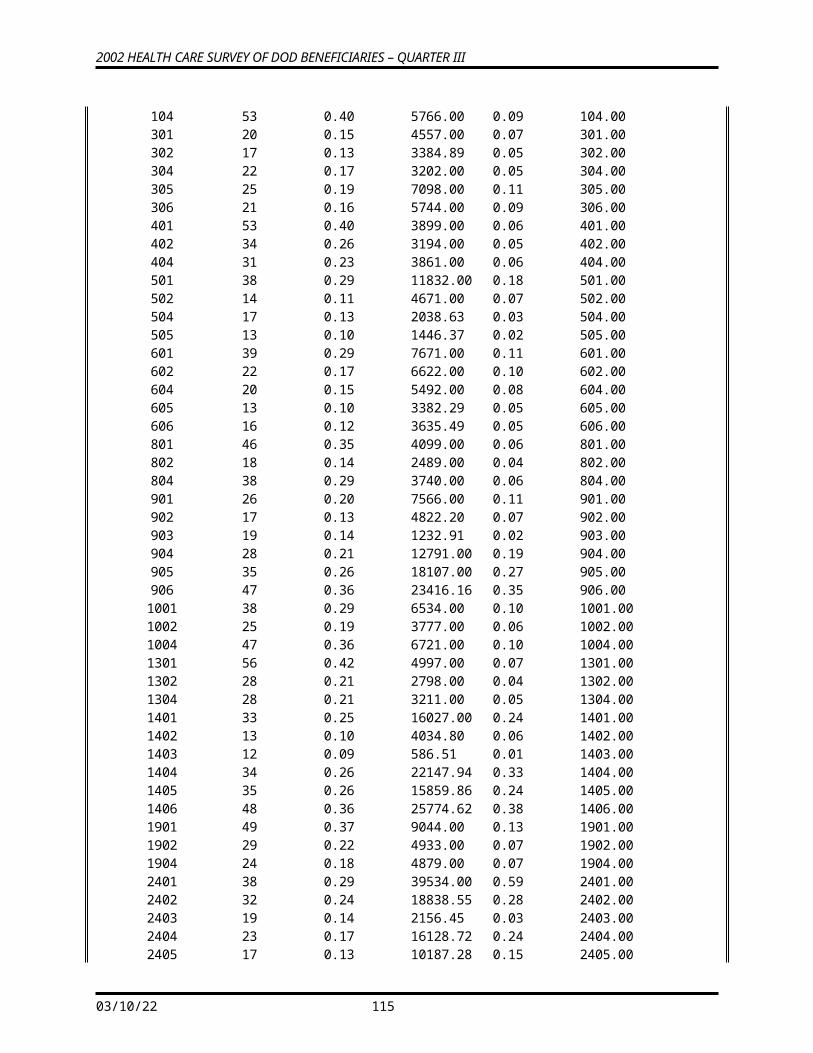
2002 HEALTH CARE SURVEY OF DOD BENEFICIARIES – QUARTER III
6214 11 0.08 11462.33 0.17 6214.006215 4 0.03 4541.09 0.07 6215.006216 10 0.08 6431.12 0.10 6216.006221 8 0.06 7961.13 0.12 6221.006301 5 0.04 5660.88 0.08 6301.006302 2 0.02 484.74 0.01 6302.006303 10 0.08 16440.90 0.24 6303.006304 4 0.03 2335.27 0.03 6304.006305 1 0.01 2319.79 0.03 6305.006307 6 0.05 5980.31 0.09 6307.006309 1 0.01 2319.79 0.03 6309.006311 18 0.14 25163.89 0.37 6311.006312 8 0.06 3804.02 0.06 6312.006314 1 0.01 522.44 0.01 6314.006315 5 0.04 3066.09 0.05 6315.006317 1 0.01 1495.22 0.02 6317.006318 3 0.02 1518.11 0.02 6318.006319 12 0.09 4784.40 0.07 6319.006903 77 0.58 68923.89 1.02 6903.006904 26 0.20 23402.22 0.35 6904.006906 61 0.46 55349.43 0.82 6906.006907 22 0.17 17007.31 0.25 6907.006908 24 0.18 20538.31 0.30 6908.006909 48 0.36 40105.47 0.59 6909.006910 19 0.14 11118.51 0.16 6910.006911 17 0.13 14950.67 0.22 6911.006912 6 0.05 1776.13 0.03 6912.007032 6 0.05 3591.31 0.05 7032.007033 5 0.04 3072.68 0.05 7033.007042 3 0.02 550.77 0.01 7042.007043 1 0.01 851.54 0.01 7043.007045 3 0.02 377.38 0.01 7045.007048 1 0.01 933.89 0.01 7048.007083 1 0.01 485.67 0.01 7083.007113 35 0.26 8981.39 0.13 7113.007138 8 0.06 3899.34 0.06 7138.007139 97 0.73 10634.00 0.16 7139.007143 19 0.14 12032.15 0.18 7143.007152 2 0.02 1384.00 0.02 7152.007197 2 0.02 716.83 0.01 7197.007200 15 0.11 2607.82 0.04 7200.007234 4 0.03 1191.29 0.02 7234.007236 18 0.14 12605.78 0.19 7236.007239 8 0.06 3087.95 0.05 7239.007286 22 0.17 16236.03 0.24 7286.007289 12 0.09 5732.00 0.08 7289.007293 10 0.08 6753.04 0.10 7293.007294 30 0.23 22469.17 0.33 7294.007297 14 0.11 2142.36 0.03 7297.007298 6 0.05 2208.72 0.03 7298.007300 6 0.05 3882.64 0.06 7300.007307 22 0.17 19119.52 0.28 7307.007903 5 0.04 5217.84 0.08 7903.007904 7 0.05 11461.84 0.17 7904.007906 7 0.05 10588.93 0.16 7906.007908 14 0.11 18222.81 0.27 7908.00
05/13/23 117
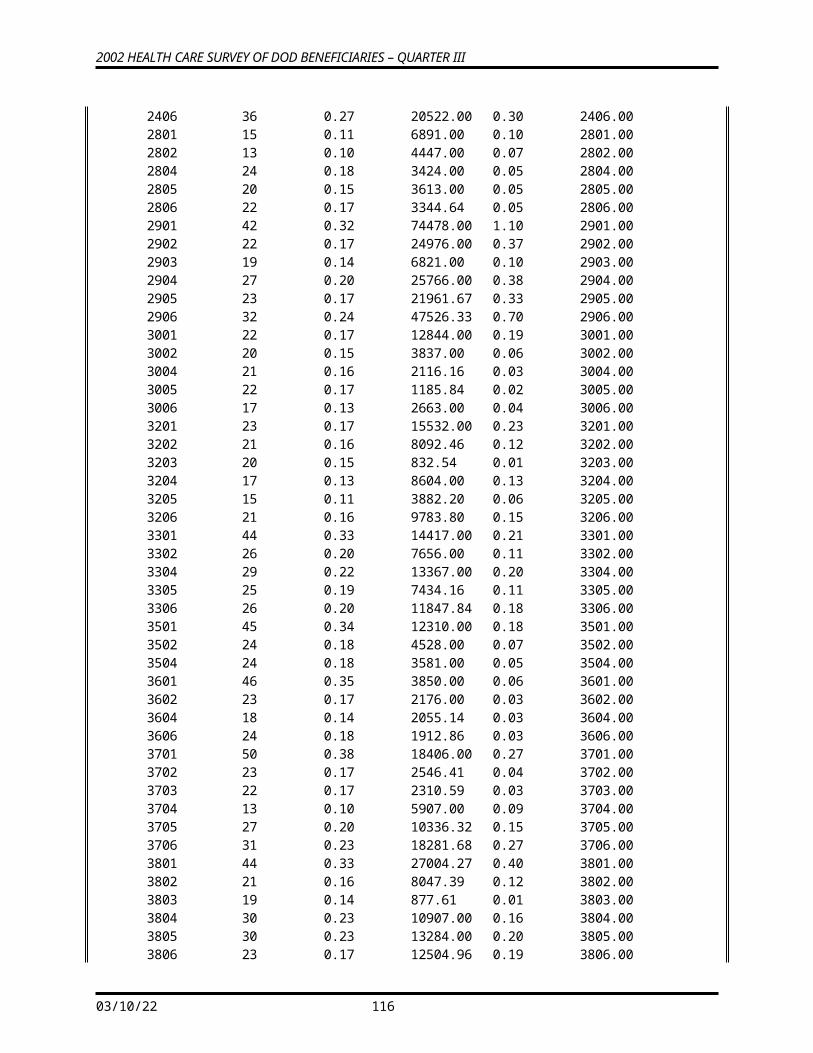
2002 HEALTH CARE SURVEY OF DOD BENEFICIARIES – QUARTER III
7909 1 0.01 1040.37 0.02 7909.007910 8 0.06 7962.38 0.12 7910.007911 5 0.04 5174.01 0.08 7911.007912 1 0.01 851.54 0.01 7912.008001 9 0.07 15666.26 0.23 8001.008002 7 0.05 4942.91 0.07 8002.008003 13 0.10 18813.09 0.28 8003.008004 11 0.08 9198.77 0.14 8004.008005 6 0.05 6109.51 0.09 8005.008006 11 0.08 13770.89 0.20 8006.008007 4 0.03 1785.79 0.03 8007.008008 3 0.02 2610.97 0.04 8008.008009 11 0.08 8804.74 0.13 8009.008010 7 0.05 6360.30 0.09 8010.008011 1 0.01 2319.79 0.03 8011.008012 1 0.01 849.11 0.01 8012.008015 4 0.03 1471.12 0.02 8015.008016 7 0.05 7071.38 0.10 8016.008018 5 0.04 5824.59 0.09 8018.008903 7 0.05 2988.41 0.04 8903.008907 6 0.05 2142.38 0.03 8907.008910 2 0.02 1040.11 0.02 8910.008912 3 0.02 1094.12 0.02 8912.008916 13 0.10 6760.70 0.10 8916.008917 2 0.02 1040.11 0.02 8917.008921 1 0.01 520.05 0.01 8921.008924 6 0.05 2481.45 0.04 8924.008931 5 0.04 1448.08 0.02 8931.008977 1 0.01 339.02 0.01 8977.008987 4 0.03 2526.48 0.04 8987.008992 6 0.05 2178.08 0.03 8992.008995 8 0.06 5273.83 0.08 8995.008996 4 0.03 2505.83 0.04 8996.008998 5 0.04 3218.48 0.05 8998.00
E1 -Eligibility indicator for period = 1
Unweighted WeightedValue Count Percent Count Percent Formatted Value
N 1666 12.58 823266.60 12.20 NY 11573 87.42 5922810.00 87.80 Y
05/13/23 118
2002 HEALTH CARE SURVEY OF DOD BENEFICIARIES – QUARTER III
E2 -Eligibility indicator for period = 2
Unweighted WeightedValue Count Percent Count Percent Formatted Value
N 1449 10.94 702706.60 10.42 NY 11790 89.06 6043370.00 89.58 Y
E3 -Eligibility indicator for period = 3
Unweighted WeightedValue Count Percent Count Percent Formatted Value
N 1314 9.93 665120.10 9.86 NY 11925 90.07 6080957.00 90.14 Y
E4 -Eligibility indicator for period = 4
Unweighted WeightedValue Count Percent Count Percent Formatted Value
N 1123 8.48 566442.00 8.40 NY 12116 91.52 6179635.00 91.60 Y
E5 -Eligibility indicator for period = 5
Unweighted WeightedValue Count Percent Count Percent Formatted Value
N 838 6.33 423978.60 6.28 NY 12401 93.67 6322098.00 93.72 Y
E6 -Eligibility indicator for period = 6
Unweighted WeightedValue Count Percent Count Percent Formatted Value
N 389 2.94 190384.20 2.82 NY 12850 97.06 6555693.00 97.18 Y
E7 -Eligibility indicator for period = 7
Unweighted Weighted
05/13/23 119
2002 HEALTH CARE SURVEY OF DOD BENEFICIARIES – QUARTER III
Value Count Percent Count Percent Formatted Value
Y 13239 100.00 6746077.00 100.00 Y
SERVAFF -Service Affiliation
Unweighted WeightedValue Count Percent Count Percent Formatted Value
A 3466 26.18 1394404.00 20.67 ArmyC 55 0.42 14311.61 0.21 Coast GuardF 5149 38.89 1251047.00 18.54 Air ForceM 448 3.38 419290.90 6.22 Support ContractorN 2603 19.66 1228364.00 18.21 NavyS 1436 10.85 2358618.00 34.96 NoncatchmentT 82 0.62 80041.03 1.19 USTF
MRTLSTAT -Marital Status
Unweighted WeightedValue Count Percent Count Percent Formatted Value
4828 36.47 2484455.00 36.83 MissingA 3 0.02 808.32 0.01 AnnulledD 401 3.03 185402.80 2.75 DivorcedL 4 0.03 3536.32 0.05 Legally separatedM 5804 43.84 3055005.00 45.29 MarriedN 918 6.93 453036.60 6.72 Never MarriedW 49 0.37 30928.89 0.46 Widow(er)Z 1232 9.31 532904.00 7.90 Unknown
05/13/23 120
2002 HEALTH CARE SURVEY OF DOD BENEFICIARIES – QUARTER III
RACEETHN -Race/Ethnic Code
Unweighted WeightedValue Count Percent Count Percent Formatted Value
6822 51.53 3874968.00 57.44 MissingA 43 0.32 18670.48 0.28 American Indian or
Alaskan NativeB 228 1.72 105413.30 1.56 Asian or Pacific IslanderC 737 5.57 339576.10 5.03 Black(not Hispanic)D 3996 30.18 1708241.00 25.32 White(not Hispanic)E 245 1.85 121293.80 1.80 HispanicX 97 0.73 36122.99 0.54 OtherZ 1071 8.09 541790.50 8.03 Unknown
PNSEXCD -Person Gender
Unweighted WeightedValue Count Percent Count Percent Formatted Value
F 6719 50.75 3256711.00 48.28 FemaleM 6520 49.25 3489366.00 51.72 Male
LEGDDSCD -DDS Code
Unweighted WeightedValue Count Percent Count Percent Formatted Value
1 378 2.86 169226.90 2.51 Dependent Child20 6984 52.75 3708402.00 54.97 Sponsor30 5825 44.00 2853194.00 42.29 Spouse of Sponsor40 30 0.23 8691.87 0.13 Mother of Sponsor45 4 0.03 634.88 0.01 Father of Sponsor50 15 0.11 4971.31 0.07 Mother in law of Sponsor55 3 0.02 955.81 0.01 Father in law of Sponsor
05/13/23 121
2002 HEALTH CARE SURVEY OF DOD BENEFICIARIES – QUARTER III
DAGEQY -Age (As of 31 August 2001)
Unweighted WeightedValue Count Percent Count Percent Formatted Value
018 -- 034 3845 29.04 1525768.00 22.62 018--034035 -- 044 3137 23.70 1209183.00 17.92 035--044045 -- 054 2214 16.72 1090521.00 16.17 045--054055 -- 064 2053 15.51 1259739.00 18.67 055--064065 -- 074 1232 9.31 1009611.00 14.97 065--074075 -- 097 758 5.73 651254.00 9.65 075 yrs and older
FIELDAGE -Age as of April 1st 2002
Unweighted WeightedValue Count Percent Count Percent Formatted Value
18 102 0.77 52586.17 0.78 18.0019 178 1.34 81268.54 1.20 19.0020 228 1.72 92817.35 1.38 20.0021 227 1.71 90768.28 1.35 21.0022 208 1.57 81092.75 1.20 22.0023 212 1.60 88558.29 1.31 23.0024 222 1.68 89624.64 1.33 24.0025 217 1.64 85261.78 1.26 25.0026 239 1.81 93713.06 1.39 26.0027 236 1.78 90616.15 1.34 27.0028 199 1.50 80761.93 1.20 28.0029 208 1.57 79925.31 1.18 29.0030 216 1.63 89435.96 1.33 30.0031 264 1.99 95360.89 1.41 31.0032 259 1.96 105875.60 1.57 32.0033 253 1.91 92782.73 1.38 33.0034 268 2.02 99888.61 1.48 34.0035 318 2.40 113558.50 1.68 35.0036 308 2.33 121612.10 1.80 36.0037 353 2.67 127358.90 1.89 37.0038 361 2.73 124120.60 1.84 38.0039 326 2.46 141890.40 2.10 39.0040 342 2.58 129181.60 1.91 40.0041 336 2.54 120511.50 1.79 41.0042 290 2.19 115476.50 1.71 42.0043 260 1.96 98982.60 1.47 43.0044 267 2.02 112170.60 1.66 44.0045 254 1.92 117306.80 1.74 45.0046 218 1.65 105973.00 1.57 46.0047 219 1.65 107327.80 1.59 47.0048 230 1.74 100530.20 1.49 48.0049 209 1.58 98952.38 1.47 49.0050 221 1.67 108313.20 1.61 50.0051 198 1.50 95869.25 1.42 51.0052 224 1.69 110920.30 1.64 52.00
05/13/23 122
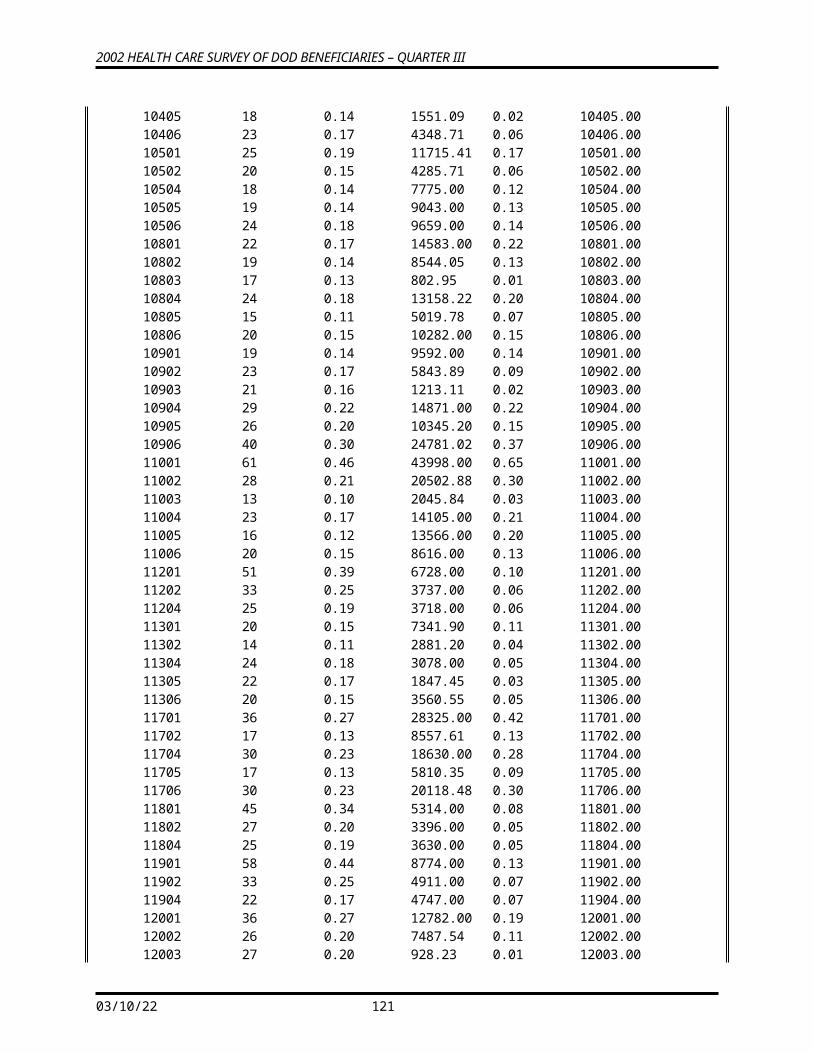
2002 HEALTH CARE SURVEY OF DOD BENEFICIARIES – QUARTER III
53 212 1.60 116402.20 1.73 53.0054 220 1.66 116796.20 1.73 54.0055 237 1.79 136054.90 2.02 55.0056 177 1.34 98752.73 1.46 56.0057 179 1.35 107253.30 1.59 57.0058 185 1.40 98451.59 1.46 58.0059 223 1.68 157803.80 2.34 59.0060 190 1.44 116866.10 1.73 60.0061 203 1.53 123189.50 1.83 61.0062 201 1.52 147817.10 2.19 62.0063 225 1.70 130924.00 1.94 63.0064 258 1.95 156437.30 2.32 64.0065 170 1.28 117387.70 1.74 65.0066 145 1.10 126084.40 1.87 66.0067 140 1.06 108956.90 1.62 67.0068 130 0.98 93517.67 1.39 68.0069 132 1.00 103030.80 1.53 69.0070 122 0.92 98784.21 1.46 70.0071 123 0.93 106938.70 1.59 71.0072 111 0.84 91357.97 1.35 72.0073 111 0.84 104630.70 1.55 73.0074 93 0.70 75212.84 1.11 74.0075 92 0.69 71355.32 1.06 75.0076 76 0.57 64262.69 0.95 76.0077 85 0.64 76073.69 1.13 77.0078 89 0.67 81353.65 1.21 78.0079 83 0.63 69224.46 1.03 79.0080 74 0.56 76657.94 1.14 80.0081 60 0.45 46338.11 0.69 81.0082 61 0.46 48421.89 0.72 82.0083 33 0.25 27474.91 0.41 83.0084 31 0.23 24191.51 0.36 84.0085 27 0.20 22015.26 0.33 85.0086 21 0.16 17669.28 0.26 86.0087 11 0.08 12471.87 0.18 87.0088 12 0.09 8140.05 0.12 88.0089 4 0.03 5561.69 0.08 89.0090 9 0.07 10222.03 0.15 90.0091 3 0.02 1401.65 0.02 91.0092 4 0.03 4211.78 0.06 92.0093 2 0.02 1767.08 0.03 93.0094 1 0.01 2143.87 0.03 94.0095 2 0.02 865.71 0.01 95.0096 1 0.01 670.62 0.01 96.0097 1 0.01 536.97 0.01 97.00
05/13/23 123
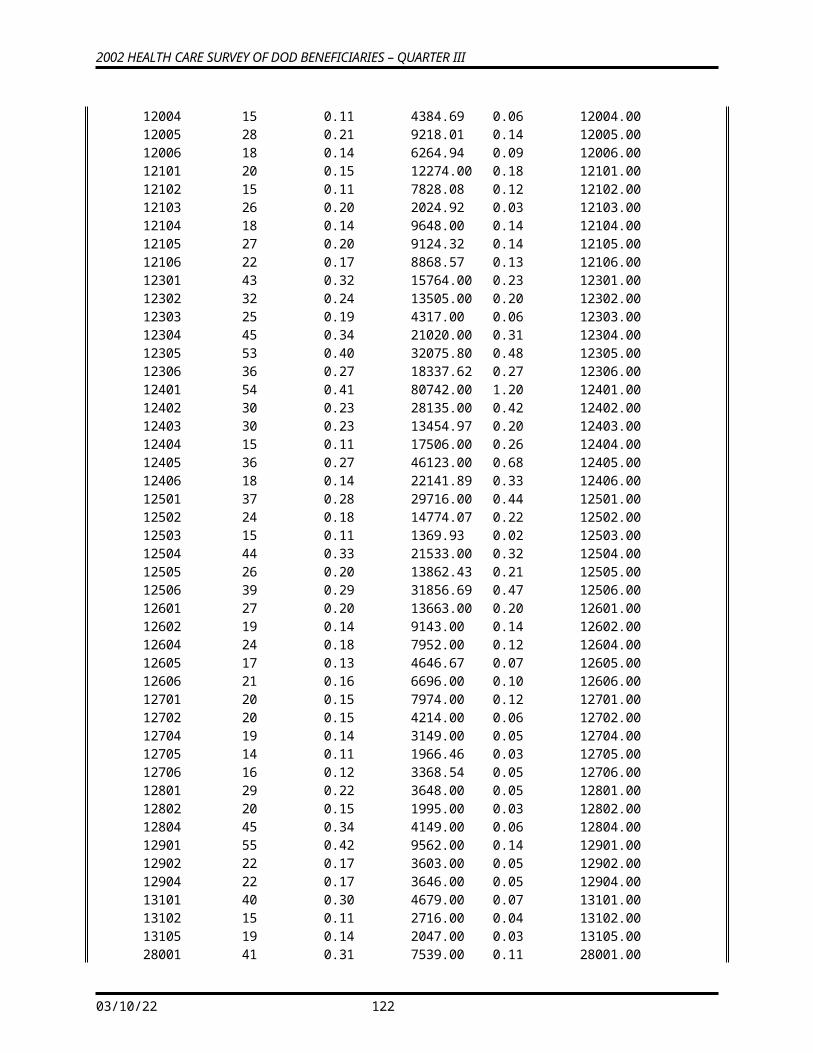
2002 HEALTH CARE SURVEY OF DOD BENEFICIARIES – QUARTER III
PCM -Primary Manager Code (Civilian or Military)
Unweighted WeightedValue Count Percent Count Percent Formatted Value
4807 36.31 3708112.00 54.97 Missing/UnknownCIV 530 4.00 499331.90 7.40 TRICARE enrollee w/civ
PCMMTF 7902 59.69 2538633.00 37.63 TRICARE enrollee w/mil
PCM
DBENCAT -Beneficiary Category
Unweighted WeightedValue Count Percent Count Percent Formatted Value
ACT 3489 26.35 1416237.00 20.99 Active DutyDA 2615 19.75 768133.50 11.39 Dependent of Active Duty
DGR 447 3.38 147751.00 2.19 Dependent of Guard/Reserve
DR 2675 20.21 1689741.00 25.05 Dependent of RetireeDS 518 3.91 432048.80 6.40 Survivor
GRD 456 3.44 263627.60 3.91 Guard/ReserveOTH 1 0.01 84.60 0.00 OtherRET 3038 22.95 2028453.00 30.07 Retiree
DMEDELG -Medical Privilege Code
Unweighted WeightedValue Count Percent Count Percent Formatted Value
1 3978 30.05 1688220.00 25.03 Direct Care Only2 7217 54.51 3345547.00 49.59 Direct Care and
CHAMPUS5 3 0.02 234.71 0.00 Transitional Direct Care
and CHAMPUS7 1959 14.80 1630626.00 24.17 Direct Care and MedicareU 82 0.62 81449.17 1.21 Unknown
05/13/23 124
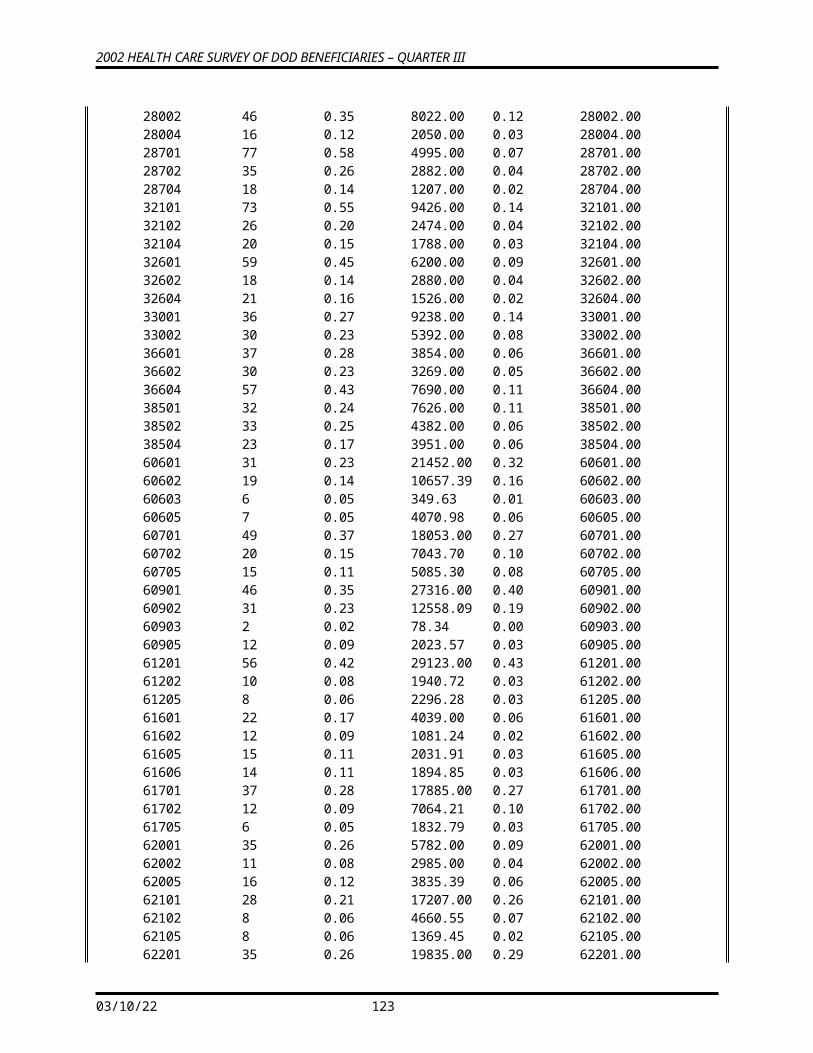
2002 HEALTH CARE SURVEY OF DOD BENEFICIARIES – QUARTER III
DSPONSVC -Derived Sponsor Branch of Service
Unweighted WeightedValue Count Percent Count Percent Formatted Value
A 4248 32.09 2371317.00 35.15 ArmyC 249 1.88 128796.80 1.91 Coast GuardF 5223 39.45 2144939.00 31.80 Air ForceM 830 6.27 438776.30 6.50 Marine CorpsN 2239 16.91 1392618.00 20.64 NavyV 373 2.82 229682.50 3.40 Navy AfloatX 77 0.58 39947.89 0.59 Other
MBRRELCD -Member Relationship Code
Unweighted WeightedValue Count Percent Count Percent Formatted Value
A 6984 52.75 3708402.00 54.97 SelfB 5266 39.78 2400266.00 35.58 SpouseC 376 2.84 169025.20 2.51 Child or stepchildE 2 0.02 201.64 0.00 Ward (court ordered)F 52 0.39 15253.87 0.23 Dependent parent or
stepparentG 503 3.80 422152.30 6.26 Surviving spouseH 49 0.37 28048.64 0.42 Former spouse
(20/20/20)I 6 0.05 2649.61 0.04 Former spouse
(20/20/15)J 1 0.01 77.88 0.00 Former spouse
(10/20/10)
MEDTYPE -Medicare Type
Unweighted WeightedValue Count Percent Count Percent Formatted Value
11173 84.39 5038333.00 74.69 Neither A nor B applyA 136 1.03 98273.01 1.46 Eligible for Medicare AB 1930 14.58 1609470.00 23.86 Eligible for Medicare B
05/13/23 125
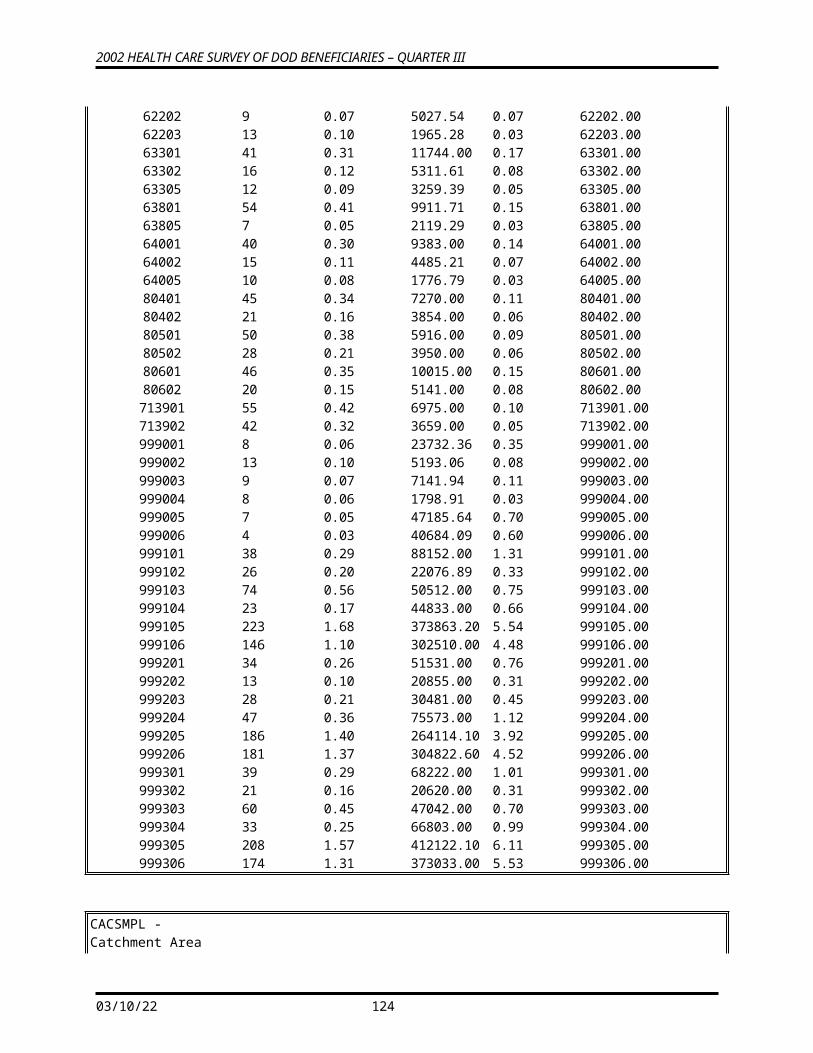
2002 HEALTH CARE SURVEY OF DOD BENEFICIARIES – QUARTER III
PATCAT -Aggregated Beneficiary Category
Unweighted WeightedValue Count Percent Count Percent Formatted Value
ACTDTY 3945 29.80 1679865.00 24.90 Active Duty and Guard/Reserve
DEPACT 3062 23.13 915884.40 13.58 Dependent of Active Duty & Guard/Reserve
NADD65+ 1965 14.84 1655083.00 24.53 Retiree/Depend of Retir/Surviv/Other 65+
NADD<65 4267 32.23 2495245.00 36.99 Retiree/Depend of Retir/Surviv/Other <65
PNLCATCD -Personnel Category Code (Duty Status)
Unweighted WeightedValue Count Percent Count Percent Formatted Value
A 6124 46.26 2204536.00 32.68 Active dutyJ 12 0.09 4929.34 0.07 Academy studentN 461 3.48 234321.30 3.47 National GuardQ 1 0.01 705.49 0.01 Reserve retireeR 6198 46.82 4121238.00 61.09 RetiredV 443 3.35 180346.90 2.67 Reserve
H02001 -Are you the person listed on envelope
Unweighted WeightedValue Count Percent Count Percent Formatted Value
. 233 1.76 132140.40 1.96 Did not answerA 8 0.06 3722.23 0.06 Invalid multiple responses1 12953 97.84 6585026.00 97.61 Yes2 45 0.34 25188.30 0.37 No
H02002A -Health plan(s) covered: TRICARE Prime
Unweighted WeightedValue Count Percent Count Percent Formatted Value
1 8838 66.76 3528156.00 52.30 Marked2 4401 33.24 3217921.00 47.70 Not Marked
H02002C -Health plan(s) covered: TRICARE Ext/Stnd
05/13/23 126
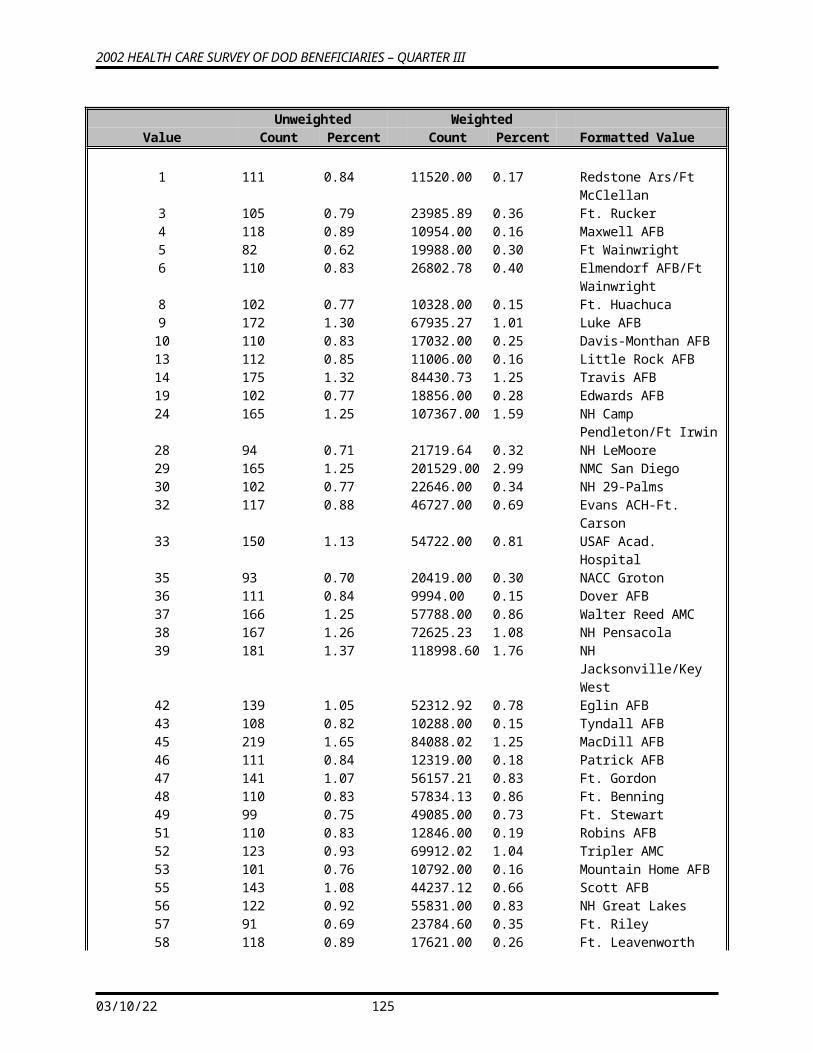
2002 HEALTH CARE SURVEY OF DOD BENEFICIARIES – QUARTER III
Unweighted WeightedValue Count Percent Count Percent Formatted Value
1 2310 17.45 1654086.00 24.52 Marked2 10929 82.55 5091990.00 75.48 Not Marked
H02002F -Health plan(s) covered: MEDICARE
Unweighted WeightedValue Count Percent Count Percent Formatted Value
1 2043 15.43 1629350.00 24.15 Marked2 11196 84.57 5116727.00 75.85 Not Marked
H02002G -Health plan(s) covered: FEHBP
Unweighted WeightedValue Count Percent Count Percent Formatted Value
1 494 3.73 336619.50 4.99 Marked2 12745 96.27 6409457.00 95.01 Not Marked
H02002H -Health plan(s) covered: Medicaid
Unweighted WeightedValue Count Percent Count Percent Formatted Value
1 129 0.97 77610.35 1.15 Marked2 13110 99.03 6668467.00 98.85 Not Marked
H02002I -Health plan(s) covered: Civilian HMO
Unweighted WeightedValue Count Percent Count Percent Formatted Value
1 561 4.24 423384.30 6.28 Marked2 12678 95.76 6322693.00 93.72 Not Marked
H02002J -Health plan(s) covered: Other civilian
Unweighted WeightedValue Count Percent Count Percent Formatted Value
1 1655 12.50 1151293.00 17.07 Marked
05/13/23 127
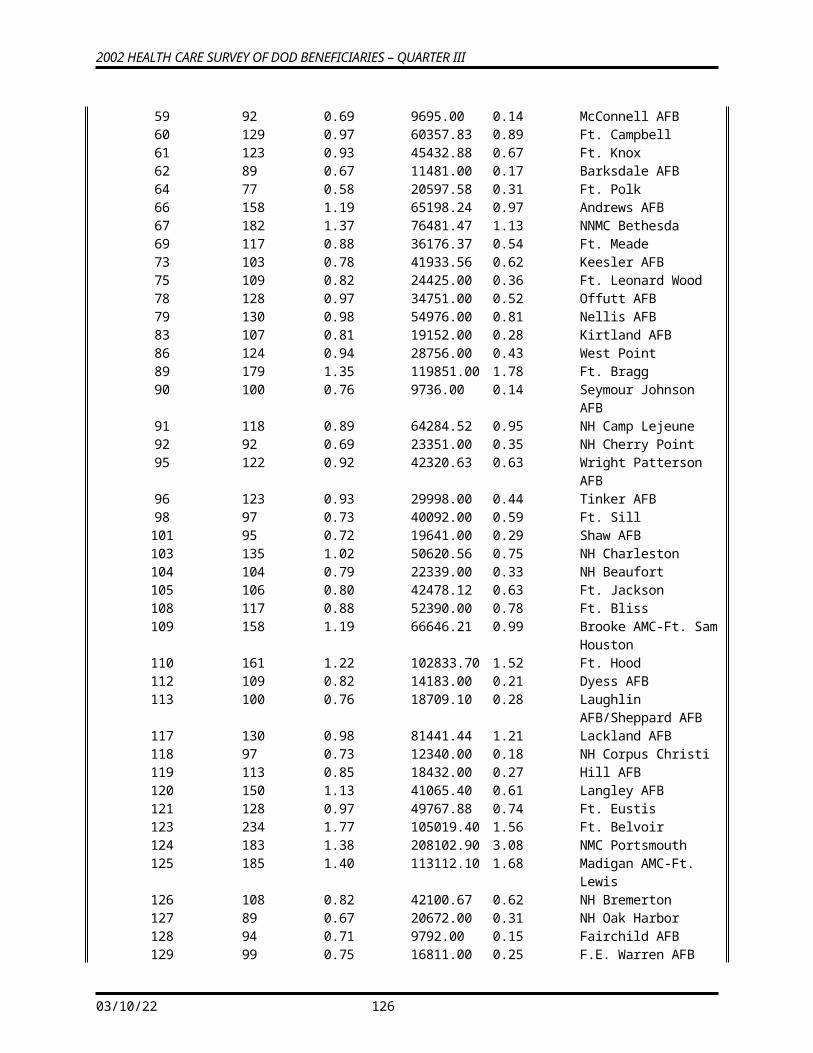
2002 HEALTH CARE SURVEY OF DOD BENEFICIARIES – QUARTER III
2 11584 87.50 5594784.00 82.93 Not Marked
H02002K -Health plan(s) covered: USFHP
Unweighted WeightedValue Count Percent Count Percent Formatted Value
1 125 0.94 87846.91 1.30 Marked2 13114 99.06 6658230.00 98.70 Not Marked
H02002L -Health plan(s) covered: Not sure
Unweighted WeightedValue Count Percent Count Percent Formatted Value
1 1894 14.31 833370.60 12.35 Marked2 11345 85.69 5912706.00 87.65 Not Marked
H02002M -Health plan(s) covered: Veterans
Unweighted WeightedValue Count Percent Count Percent Formatted Value
1 869 6.56 557229.60 8.26 Marked2 12370 93.44 6188847.00 91.74 Not Marked
H02002N -Health plan(s) covered: TRICARE Plus
Unweighted WeightedValue Count Percent Count Percent Formatted Value
1 501 3.78 322626.10 4.78 Marked2 12738 96.22 6423451.00 95.22 Not Marked
05/13/23 128
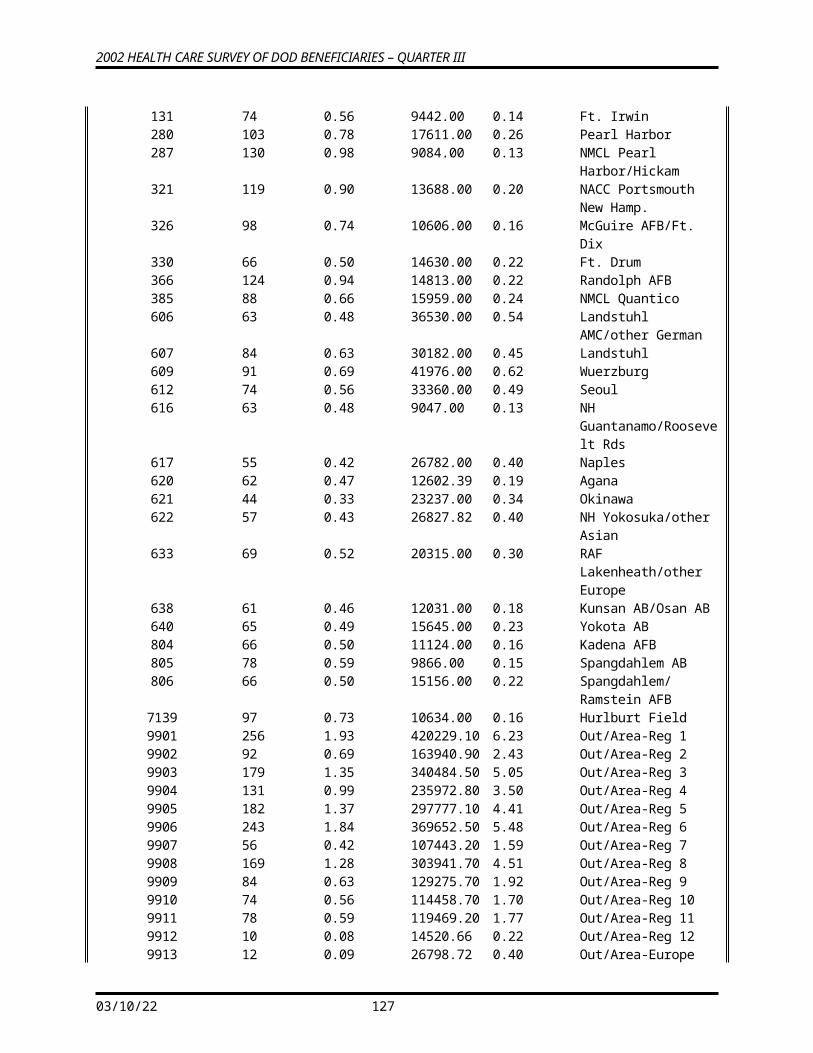
2002 HEALTH CARE SURVEY OF DOD BENEFICIARIES – QUARTER III
H02003 -Currently Covered Medicare Part A
Unweighted WeightedValue Count Percent Count Percent Formatted Value
A 9 0.07 4600.58 0.07 Invalid multiple responses. 193 1.46 91449.39 1.36 Missing/Unknown1 2282 17.24 1814233.00 26.89 Yes2 10755 81.24 4835794.00 71.68 No
H02004 -Currently Covered Medicare Part B
Unweighted WeightedValue Count Percent Count Percent Formatted Value
A 3 0.02 1422.20 0.02 Invalid multiple responses. 206 1.56 91349.08 1.35 Missing/Unknown1 2140 16.16 1736085.00 25.73 Yes2 10890 82.26 4917221.00 72.89 No
H02005 -Currently Covered Medicare Supplemental
Unweighted WeightedValue Count Percent Count Percent Formatted Value
A 3 0.02 661.16 0.01 Invalid multiple responses. 309 2.33 177702.80 2.63 Missing/Unknown1 402 3.04 335838.70 4.98 Yes2 12525 94.61 6231874.00 92.38 No
05/13/23 129
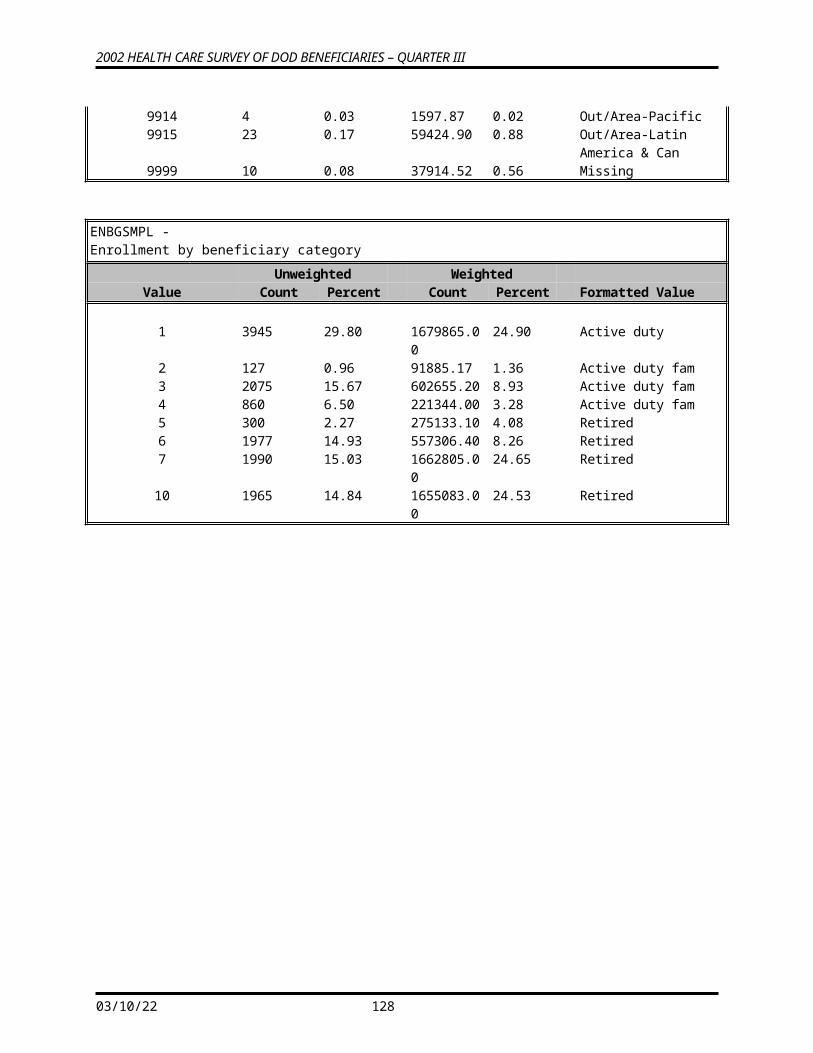
2002 HEALTH CARE SURVEY OF DOD BENEFICIARIES – QUARTER III
H02006 -Which health plan did you use most in the past 12 months?
Unweighted WeightedValue Count Percent Count Percent Formatted Value
. 113 0.85 63584.04 0.94 Did not answerN 562 4.25 315759.60 4.68 Did not use any health
plan in last 12 mA 430 3.25 294018.50 4.36 Invalid multiple responsesD 268 2.02 135529.30 2.01 Not sure1 7589 57.32 2813458.00 41.71 TRICARE Prime3 965 7.29 591678.70 8.77 TRICARE Extra or
Standard(CHAMPUS)4 950 7.18 824967.50 12.23 Medicare5 320 2.42 214021.60 3.17 Federal Employees
Health Benefit Program6 17 0.13 8241.87 0.12 Medicaid7 462 3.49 373498.00 5.54 A civilian HMO8 1057 7.98 751789.20 11.14 Other civilian health
insurance9 79 0.60 75935.57 1.13 Uniformed Services
Family Health Plan10 263 1.99 196626.30 2.91 The Veterans
Administration11 164 1.24 86968.38 1.29 TRICARE Plus
H02007 -Years in a row with health plan
Unweighted WeightedValue Count Percent Count Percent Formatted Value
. 531 4.01 289161.10 4.29 Did not answerA 39 0.29 27639.83 0.41 Invalid multiple responsesC 153 1.16 88274.38 1.31 Should be skippedN 409 3.09 227485.20 3.37 Valid skip1 249 1.88 125922.80 1.87 Less than 6 months2 1064 8.04 575700.80 8.53 6 up to 12 months3 1240 9.37 613594.10 9.10 12 up to 24 months4 3663 27.67 1672612.00 24.79 2 up to 5 years5 3048 23.02 1394651.00 20.67 5 up to 10 years6 2843 21.47 1731035.00 25.66 10 or more years
05/13/23 130
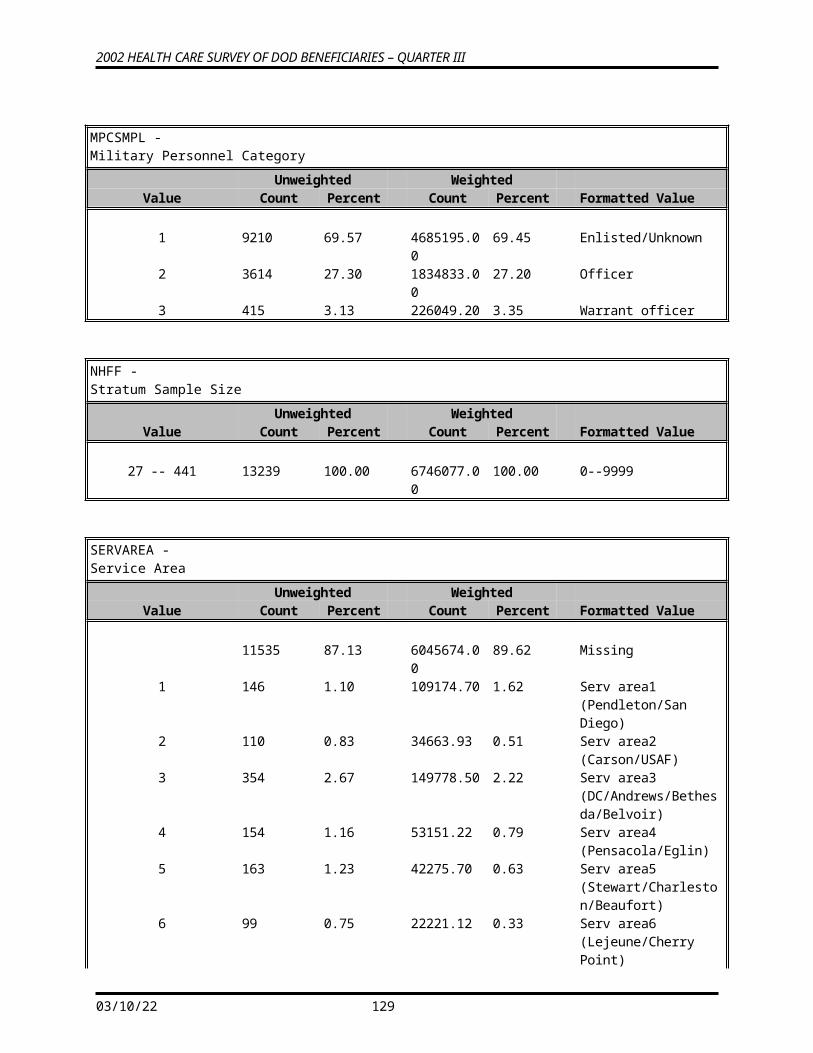
2002 HEALTH CARE SURVEY OF DOD BENEFICIARIES – QUARTER III
H02008 -When joined health plan received new personal Doctor
Unweighted WeightedValue Count Percent Count Percent Formatted Value
. 221 1.67 128322.40 1.90 Did not answer1 8269 62.46 3904180.00 57.87 Yes2 4749 35.87 2713574.00 40.22 No
H02009 -Health plan: problem to get a personal doctor or nurse you are happy with
Unweighted WeightedValue Count Percent Count Percent Formatted Value
. 980 7.40 441557.80 6.55 Did not answerN 3985 30.10 2266533.00 33.60 Didn't get a new personal
doctor/nurseA 10 0.08 5879.41 0.09 Invalid multiple responsesC 764 5.77 447040.80 6.63 Should be skipped1 916 6.92 443190.60 6.57 A big problem2 1591 12.02 730629.50 10.83 A small problem3 4993 37.71 2411245.00 35.74 Not a problem
H02010 -Have one person you think of as personal doctor
Unweighted WeightedValue Count Percent Count Percent Formatted Value
. 188 1.42 106036.50 1.57 Did not answer1 8246 62.29 4553741.00 67.50 Yes2 4805 36.29 2086299.00 30.93 No
05/13/23 131
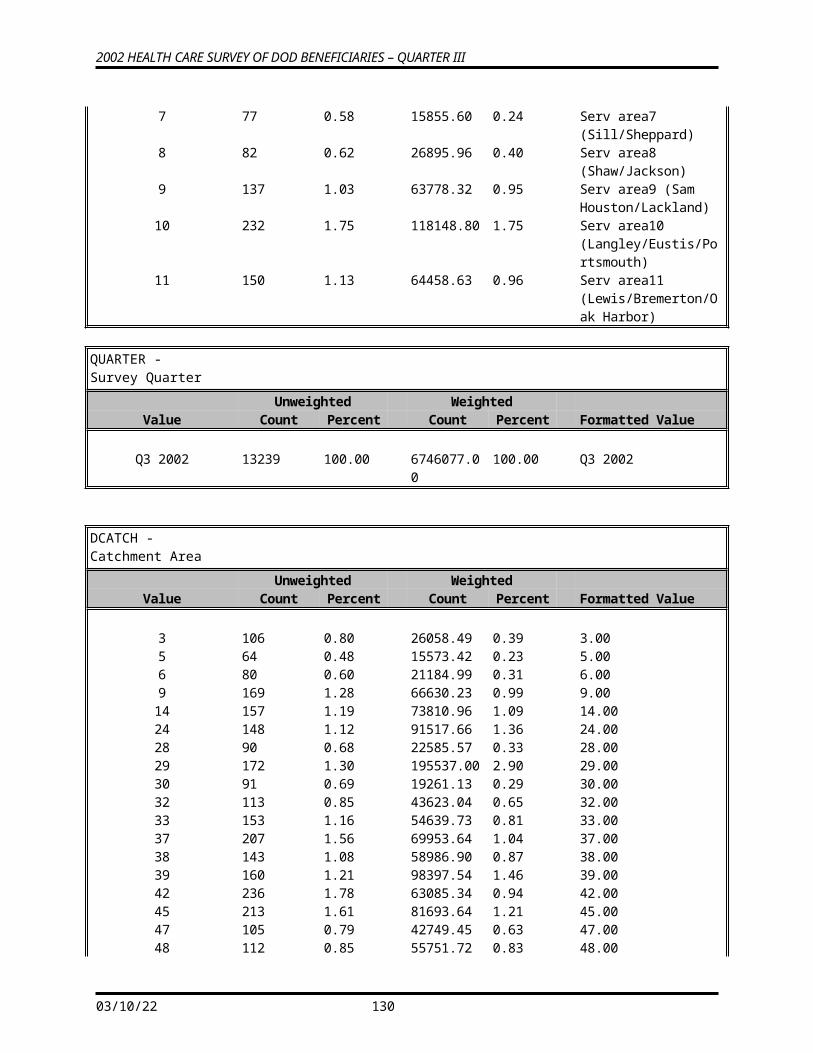
2002 HEALTH CARE SURVEY OF DOD BENEFICIARIES – QUARTER III
H02011 -Rating of your personal doctor or nurse
Unweighted WeightedValue Count Percent Count Percent Formatted Value
. 763 5.76 489073.10 7.25 Did not answerN 4288 32.39 1822237.00 27.01 Don't have a personal
doctor or nurseA 34 0.26 16503.33 0.24 Invalid multiple responsesC 517 3.91 264062.60 3.91 Should be skipped0 48 0.36 23388.24 0.35 01 33 0.25 18190.08 0.27 12 56 0.42 24393.99 0.36 23 118 0.89 60072.02 0.89 34 123 0.93 73288.52 1.09 45 546 4.12 255835.10 3.79 56 432 3.26 227335.50 3.37 67 999 7.55 492366.00 7.30 78 1616 12.21 859146.30 12.74 89 1323 9.99 723652.10 10.73 910 2343 17.70 1396533.00 20.70 10
H02012 -Currently enrolled in TRICARE Prime
Unweighted WeightedValue Count Percent Count Percent Formatted Value
. 283 2.14 220628.40 3.27 Did not answer1 9266 69.99 3845994.00 57.01 Yes2 3690 27.87 2679454.00 39.72 No
05/13/23 132
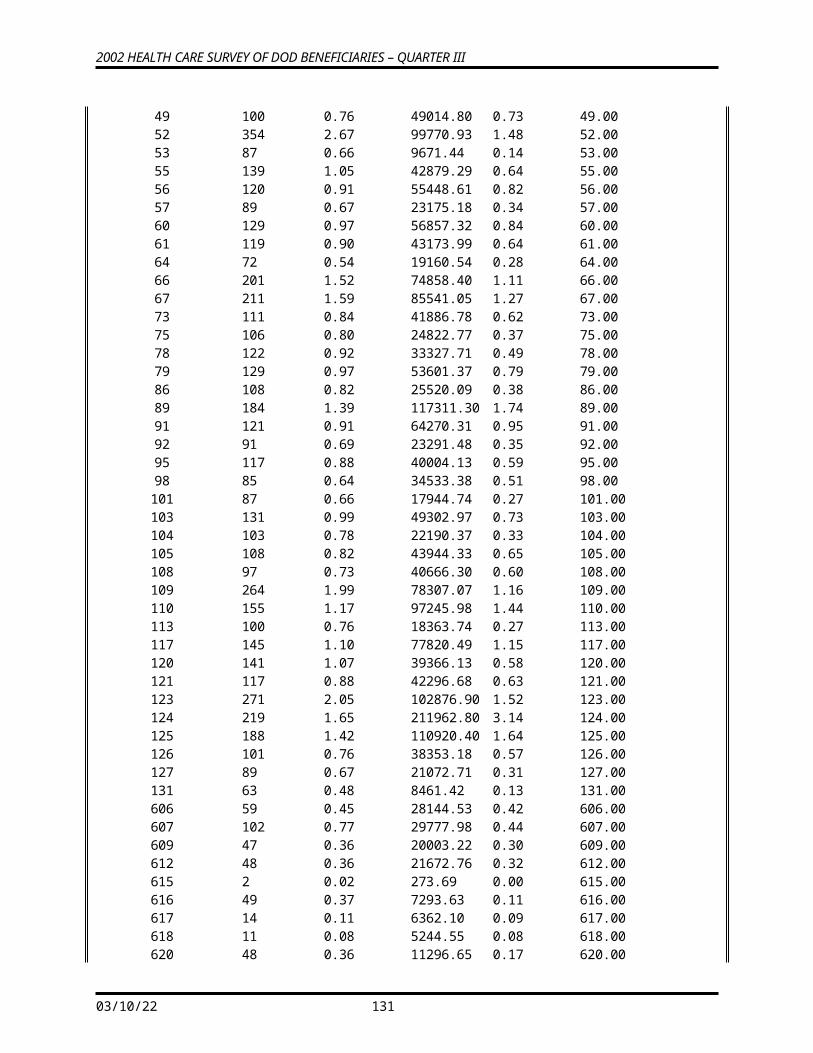
2002 HEALTH CARE SURVEY OF DOD BENEFICIARIES – QUARTER III
H02013 -TRICARE member: Primary Care Manager(PCM) based in a military or civilian facility
Unweighted WeightedValue Count Percent Count Percent Formatted Value
. 1339 10.11 697199.50 10.33 Did not answerA 27 0.20 15357.09 0.23 Invalid multiple responsesN 3524 26.62 2534456.00 37.57 Not member of TRICARE
Prime/Senior PrimeC 272 2.05 223736.60 3.32 Should be skipped1 5935 44.83 1891086.00 28.03 A primary care manager
at military facil2 789 5.96 621763.90 9.22 A primary care manager
at civilian facil3 1353 10.22 762477.80 11.30 Not sure
H02014 -Know your PCM's name
Unweighted WeightedValue Count Percent Count Percent Formatted Value
. 1354 10.23 678027.80 10.05 Did not answerA 3 0.02 2753.52 0.04 Invalid multiple responsesC 424 3.20 262467.30 3.89 Should be skippedN 4725 35.69 3258203.00 48.30 Valid skip1 4435 33.50 1704849.00 25.27 Yes2 2298 17.36 839776.30 12.45 No
H02015 -In last year: you or a doctor or nurse think you needed to see a specialist
Unweighted WeightedValue Count Percent Count Percent Formatted Value
. 133 1.00 83399.65 1.24 Did not answerA 3 0.02 1040.03 0.02 Invalid multiple responses1 7048 53.24 3738474.00 55.42 Yes2 6055 45.74 2923163.00 43.33 No
05/13/23 133
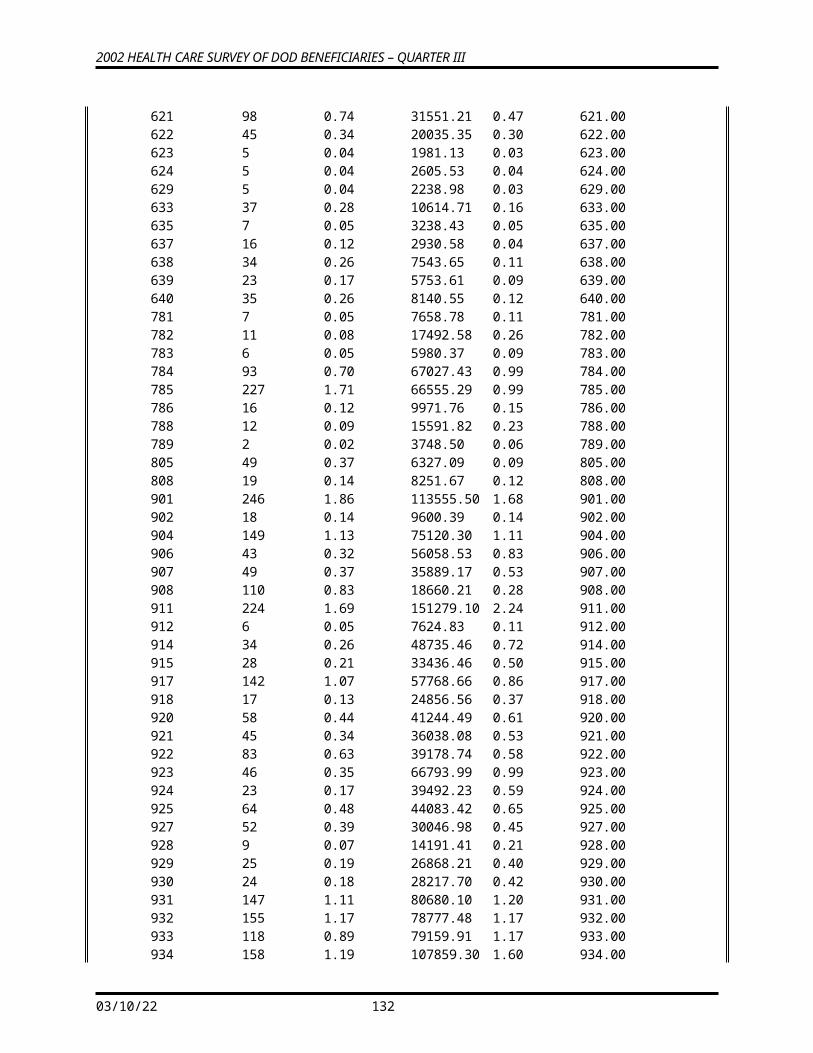
2002 HEALTH CARE SURVEY OF DOD BENEFICIARIES – QUARTER III
H02016 -In last year: how much of a problem to get a referral to see a specialist
Unweighted WeightedValue Count Percent Count Percent Formatted Value
. 512 3.87 325878.00 4.83 Did not answerN 4687 35.40 2196937.00 32.57 Didn't need to see
specialist last 12 moA 11 0.08 7007.08 0.10 Invalid multiple responsesC 1368 10.33 726225.80 10.77 Should be skipped1 765 5.78 347804.40 5.16 A big problem2 1172 8.85 524928.60 7.78 A small problem3 4724 35.68 2617296.00 38.80 Not a problem
H02017 -In last year: did you see a specialist
Unweighted WeightedValue Count Percent Count Percent Formatted Value
. 34 0.26 16753.95 0.25 Did not answer1 7135 53.89 3882236.00 57.55 Yes2 6070 45.85 2847087.00 42.20 No
H02018 -Rating of specialist seen in last year
Unweighted WeightedValue Count Percent Count Percent Formatted Value
. 508 3.84 321650.20 4.77 Did not answerN 5618 42.44 2638256.00 39.11 Didn't see a specialist in
last 12 monA 24 0.18 13989.05 0.21 Invalid multiple responsesC 577 4.36 289922.70 4.30 Should be skipped0 39 0.29 17719.26 0.26 01 33 0.25 13744.88 0.20 12 78 0.59 36649.62 0.54 23 122 0.92 52521.77 0.78 34 110 0.83 56817.08 0.84 45 411 3.10 213277.40 3.16 56 369 2.79 173229.30 2.57 67 728 5.50 378955.70 5.62 78 1332 10.06 696888.70 10.33 89 1298 9.80 668027.30 9.90 910 1992 15.05 1174428.00 17.41 10
H02019 -In last year: specialist saw was the same as personal doctor
Unweighted Weighted
05/13/23 134
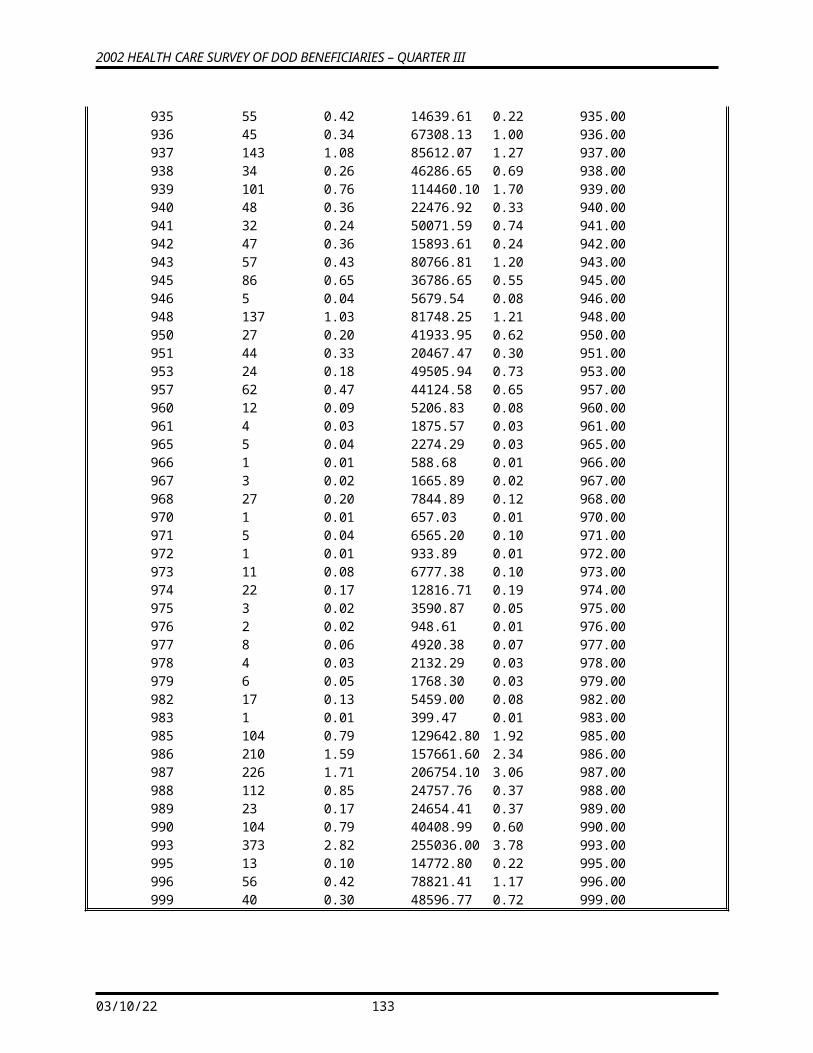
2002 HEALTH CARE SURVEY OF DOD BENEFICIARIES – QUARTER III
Value Count Percent Count Percent Formatted Value
. 428 3.23 271603.20 4.03 Did not answerN 5632 42.54 2638182.00 39.11 Don't have a personal
doctorA 25 0.19 14554.39 0.22 Invalid multiple responsesC 701 5.29 357738.20 5.30 Should be skipped1 991 7.49 572294.10 8.48 Yes2 5462 41.26 2891705.00 42.86 No
H02020 -In last year: called a doctor's office or clinic during regular office hours to get help or advice for yourself
Unweighted WeightedValue Count Percent Count Percent Formatted Value
. 162 1.22 102152.70 1.51 Did not answerA 2 0.02 1575.76 0.02 Invalid multiple responses1 7739 58.46 3959527.00 58.69 Yes2 5336 40.31 2682821.00 39.77 No
H02021 -In last year: when you called during regular office hours how often got help or advice you needed
Unweighted WeightedValue Count Percent Count Percent Formatted Value
. 542 4.09 316806.40 4.70 Did not answerN 4456 33.66 2209207.00 32.75 Didn't call for help/advice
in last 12 mA 13 0.10 8983.70 0.13 Invalid multiple responsesC 880 6.65 473614.20 7.02 Should be skipped1 294 2.22 118356.60 1.75 Never2 1374 10.38 586869.90 8.70 Sometimes3 2368 17.89 1174363.00 17.41 Usually4 3312 25.02 1857876.00 27.54 Always
05/13/23 135
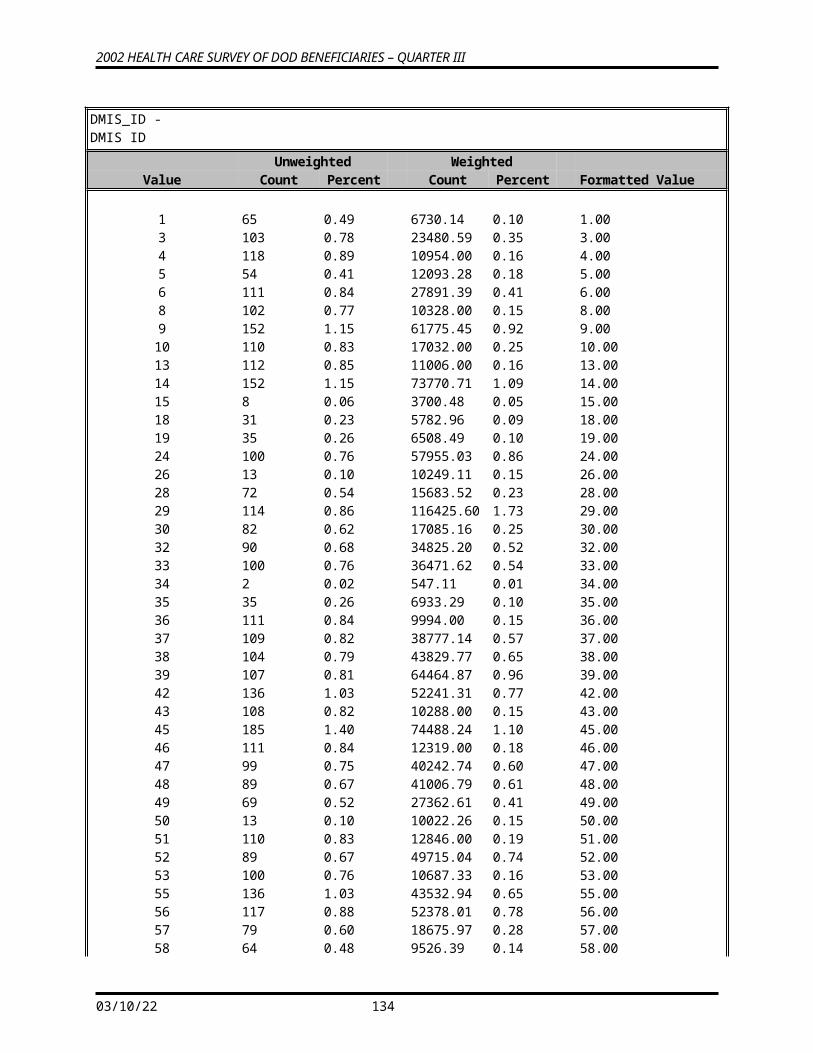
2002 HEALTH CARE SURVEY OF DOD BENEFICIARIES – QUARTER III
H02022 -In last year: made any appointment for regular or routine health care
Unweighted WeightedValue Count Percent Count Percent Formatted Value
. 129 0.97 80814.54 1.20 Did not answer1 10667 80.57 5415046.00 80.27 Yes2 2443 18.45 1250216.00 18.53 No
H02023 -In last year: how often made appointments for regular or routine health care as soon as you wanted
Unweighted WeightedValue Count Percent Count Percent Formatted Value
. 666 5.03 385887.00 5.72 Did not answerN 2159 16.31 1089563.00 16.15 Didn't need an
appointment in last 12 moA 16 0.12 12831.72 0.19 Invalid multiple responsesC 358 2.70 194063.40 2.88 Should be skipped1 677 5.11 276534.50 4.10 Never2 1875 14.16 808569.60 11.99 Sometimes3 3823 28.88 1879425.00 27.86 Usually4 3665 27.68 2099203.00 31.12 Always
H02024 -In last year: days between appointment for regular or routine care and actually seeing a provider
Unweighted WeightedValue Count Percent Count Percent Formatted Value
. 727 5.49 428465.00 6.35 Did not answerN 2171 16.40 1117981.00 16.57 Didn't need an
appointment in last 12 moA 92 0.69 36956.38 0.55 Invalid multiple responsesC 351 2.65 191126.40 2.83 Should be skipped1 903 6.82 529001.80 7.84 Same day2 867 6.55 470158.30 6.97 1 day3 1738 13.13 932579.10 13.82 2 to 3 days4 2188 16.53 1091496.00 16.18 4 to 7 days5 2029 15.33 884908.30 13.12 8 to 14 days6 1563 11.81 719546.00 10.67 15 to 30 days7 520 3.93 303316.40 4.50 31 days or longer8 90 0.68 40542.41 0.60 Tried but could not get an
appointment
H02025 -In last year: illness/injury needed care right away
Unweighted WeightedValue Count Percent Count Percent Formatted Value
05/13/23 136
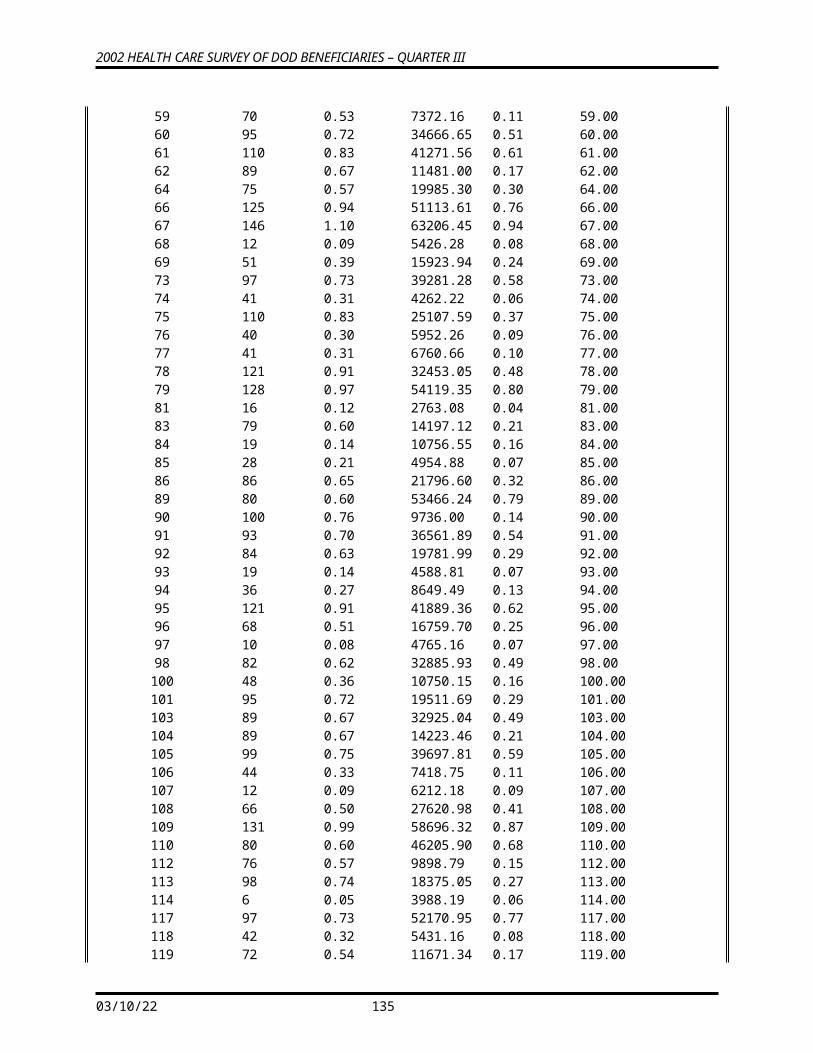
2002 HEALTH CARE SURVEY OF DOD BENEFICIARIES – QUARTER III
. 121 0.91 73107.36 1.08 Did not answer1 6280 47.44 3190417.00 47.29 Yes2 6838 51.65 3482552.00 51.62 No
H02026 -In last year: when needed care right away for an illness or injury got care as soon as wanted
Unweighted WeightedValue Count Percent Count Percent Formatted Value
. 508 3.84 290791.50 4.31 Did not answerN 6434 48.60 3244448.00 48.09 Didn't need care right
away in last 12 mA 18 0.14 14224.57 0.21 Invalid multiple responsesC 729 5.51 393526.70 5.83 Should be skipped1 364 2.75 170238.70 2.52 Never2 768 5.80 332253.20 4.93 Sometimes3 1577 11.91 790227.60 11.71 Usually4 2841 21.46 1510367.00 22.39 Always
H02027 -In last year: wait between trying to get care and actually seeing a provider for an illness or injury
Unweighted WeightedValue Count Percent Count Percent Formatted Value
. 488 3.69 285945.40 4.24 Did not answerN 6168 46.59 3115144.00 46.18 Didn't need care right
away in last 12 mA 62 0.47 28240.93 0.42 Invalid multiple responsesC 730 5.51 396890.30 5.88 Should be skipped1 2488 18.79 1305871.00 19.36 Same day2 921 6.96 464063.10 6.88 1 day3 571 4.31 280323.80 4.16 2 days4 380 2.87 204246.30 3.03 3 days5 693 5.23 322611.40 4.78 4 to 7 days6 388 2.93 171183.40 2.54 8 to 14 days7 350 2.64 171557.40 2.54 15 days or longer
05/13/23 137
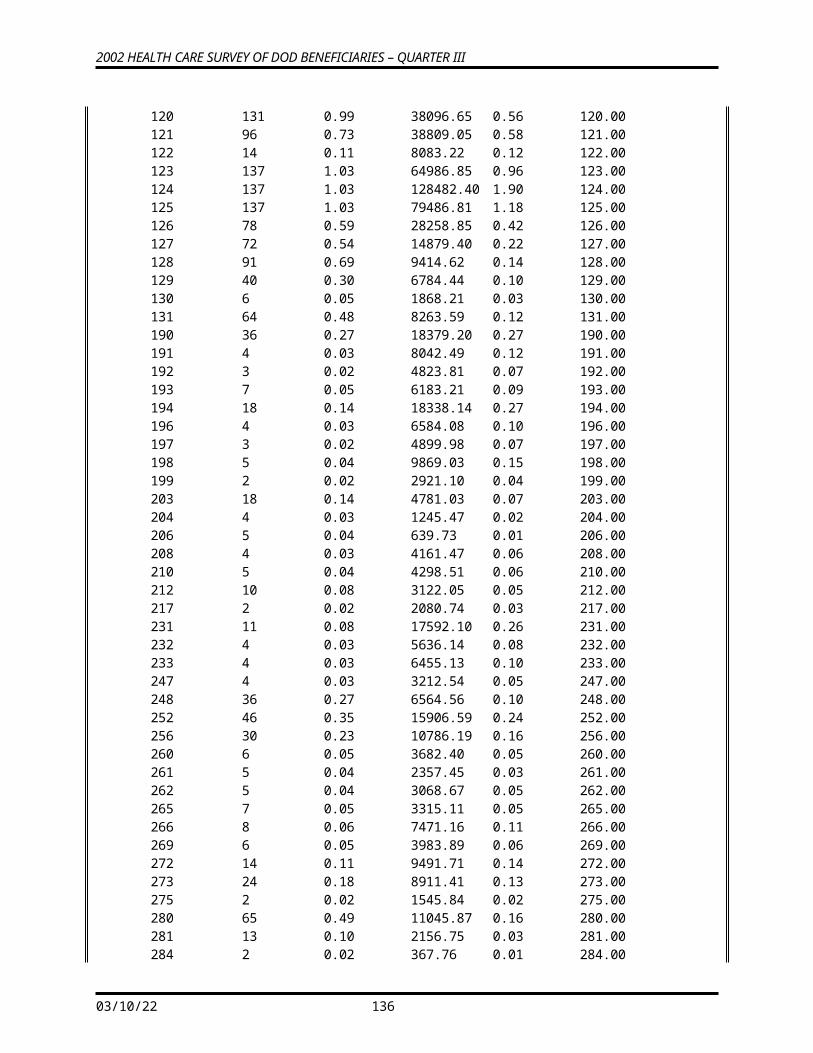
2002 HEALTH CARE SURVEY OF DOD BENEFICIARIES – QUARTER III
H02028 -In last year: went to an emergency room for own care
Unweighted WeightedValue Count Percent Count Percent Formatted Value
. 186 1.40 111439.60 1.65 Did not answerA 14 0.11 7484.49 0.11 Invalid multiple responses1 9531 71.99 4914712.00 72.85 None2 2266 17.12 1108074.00 16.43 1 visit3 1067 8.06 521154.50 7.73 2 to 3 visits4 136 1.03 63412.33 0.94 4 to 6 visits5 39 0.29 19799.75 0.29 More than 6 visits
H02029 -In last year: went to a doctors office or clinic for yourself (not counting times went to an emergency room)
Unweighted WeightedValue Count Percent Count Percent Formatted Value
. 183 1.38 118515.30 1.76 Did not answerA 27 0.20 13171.19 0.20 Invalid multiple responses1 1892 14.29 956612.00 14.18 None2 1470 11.10 726812.40 10.77 13 2299 17.37 1120331.00 16.61 24 2172 16.41 1060584.00 15.72 35 1726 13.04 922441.20 13.67 46 2374 17.93 1226622.00 18.18 5 to 97 1096 8.28 600988.50 8.91 10 or more
H02030 -In last year: problem to get necessary care
Unweighted WeightedValue Count Percent Count Percent Formatted Value
. 228 1.72 150306.90 2.23 Did not answerN 1112 8.40 549521.90 8.15 I had no visits in the last
12 monthsA 6 0.05 2051.63 0.03 Invalid multiple responsesC 798 6.03 415198.10 6.15 Should be skipped1 629 4.75 279585.20 4.14 A big problem2 2093 15.81 925222.10 13.71 A small problem3 8373 63.24 4424191.00 65.58 Not a problem
H02031 -In last year: problem with delays in healthcare while waiting for approval from health plan
Unweighted WeightedValue Count Percent Count Percent Formatted Value
05/13/23 138
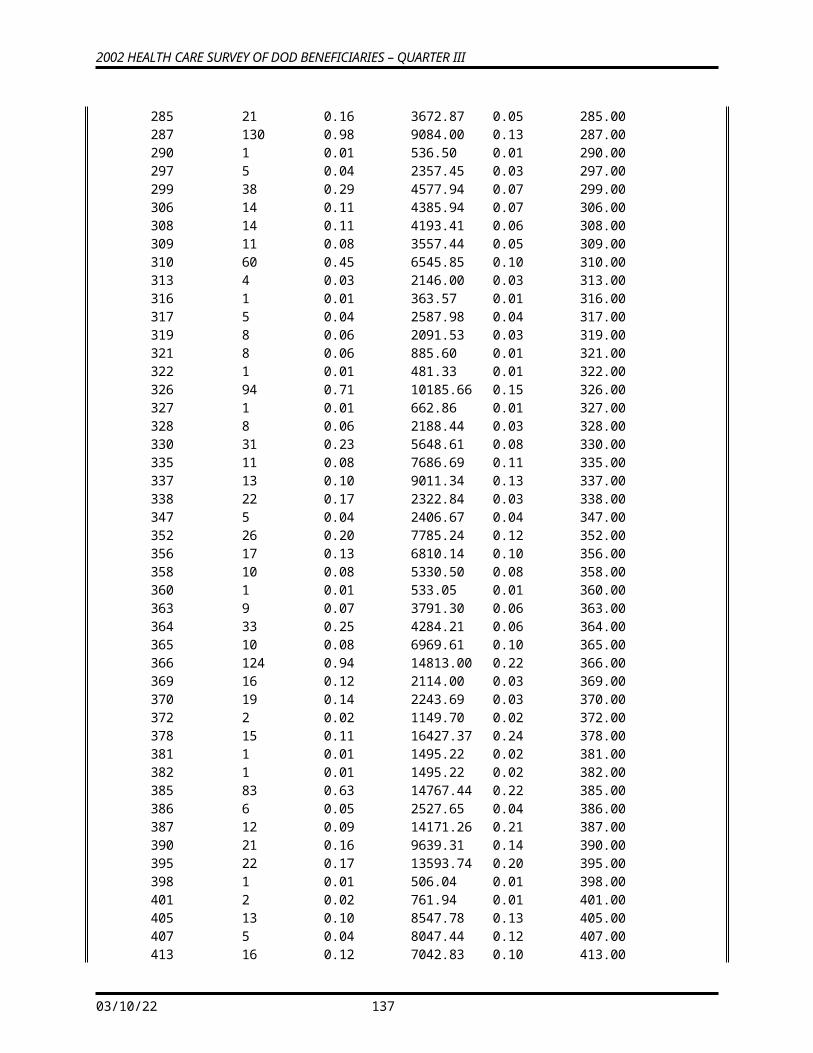
2002 HEALTH CARE SURVEY OF DOD BENEFICIARIES – QUARTER III
. 294 2.22 196961.70 2.92 Did not answerN 1221 9.22 616547.60 9.14 I had no visits in the last
12 monthsA 6 0.05 2376.72 0.04 Invalid multiple responsesC 781 5.90 407189.00 6.04 Should be skipped1 519 3.92 248440.20 3.68 A big problem2 1392 10.51 621545.00 9.21 A small problem3 9026 68.18 4653017.00 68.97 Not a problem
H02032 -In last year: wait more than 15 minutes past appointment time to see a doctor
Unweighted WeightedValue Count Percent Count Percent Formatted Value
. 217 1.64 145300.60 2.15 Did not answerN 1140 8.61 581188.10 8.62 I had no visits in the last
12 monthsA 16 0.12 9915.14 0.15 Invalid multiple responsesC 772 5.83 401834.10 5.96 Should be skipped1 2403 18.15 1141365.00 16.92 Never2 5121 38.68 2617207.00 38.80 Sometimes3 2068 15.62 1056709.00 15.66 Usually4 1502 11.35 792557.70 11.75 Always
H02033 -In last year: how often office staff at a doctor's office or clinic treat you with courtesy and respect
Unweighted WeightedValue Count Percent Count Percent Formatted Value
. 216 1.63 144239.00 2.14 Did not answerN 1137 8.59 568738.60 8.43 I had no visits in the last
12 monthsA 13 0.10 4568.72 0.07 Invalid multiple responsesC 774 5.85 403366.10 5.98 Should be skipped1 88 0.66 43038.41 0.64 Never2 704 5.32 320859.00 4.76 Sometimes3 2956 22.33 1370516.00 20.32 Usually4 7351 55.53 3890752.00 57.67 Always
H02034 -In last year: how often office staff at a doctor's office or clinic as helpful as expected
Unweighted WeightedValue Count Percent Count Percent Formatted Value
. 214 1.62 144708.60 2.15 Did not answerN 1152 8.70 576207.80 8.54 I had no visits in the last
05/13/23 139
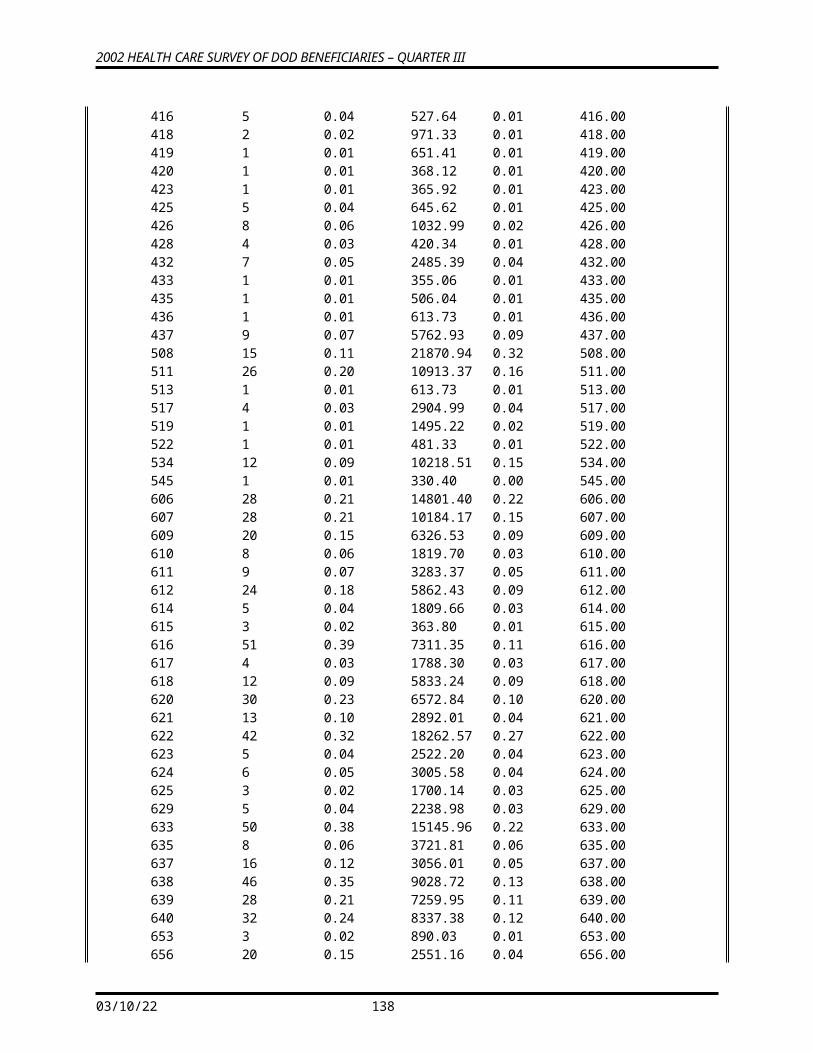
2002 HEALTH CARE SURVEY OF DOD BENEFICIARIES – QUARTER III
12 monthsA 8 0.06 4023.04 0.06 Invalid multiple responsesC 760 5.74 396228.20 5.87 Should be skipped1 167 1.26 77134.75 1.14 Never2 1324 10.00 565127.00 8.38 Sometimes3 4245 32.06 2095096.00 31.06 Usually4 5369 40.55 2887551.00 42.80 Always
H02035 -In last year: how often doctors or other health providers listen carefully to you
Unweighted WeightedValue Count Percent Count Percent Formatted Value
. 211 1.59 141873.40 2.10 Did not answerN 1152 8.70 576843.90 8.55 I had no visits in the last
12 monthsA 9 0.07 3070.77 0.05 Invalid multiple responsesC 760 5.74 395592.10 5.86 Should be skipped1 136 1.03 64020.36 0.95 Never2 1242 9.38 540428.00 8.01 Sometimes3 4041 30.52 1989695.00 29.49 Usually4 5688 42.96 3034554.00 44.98 Always
05/13/23 140
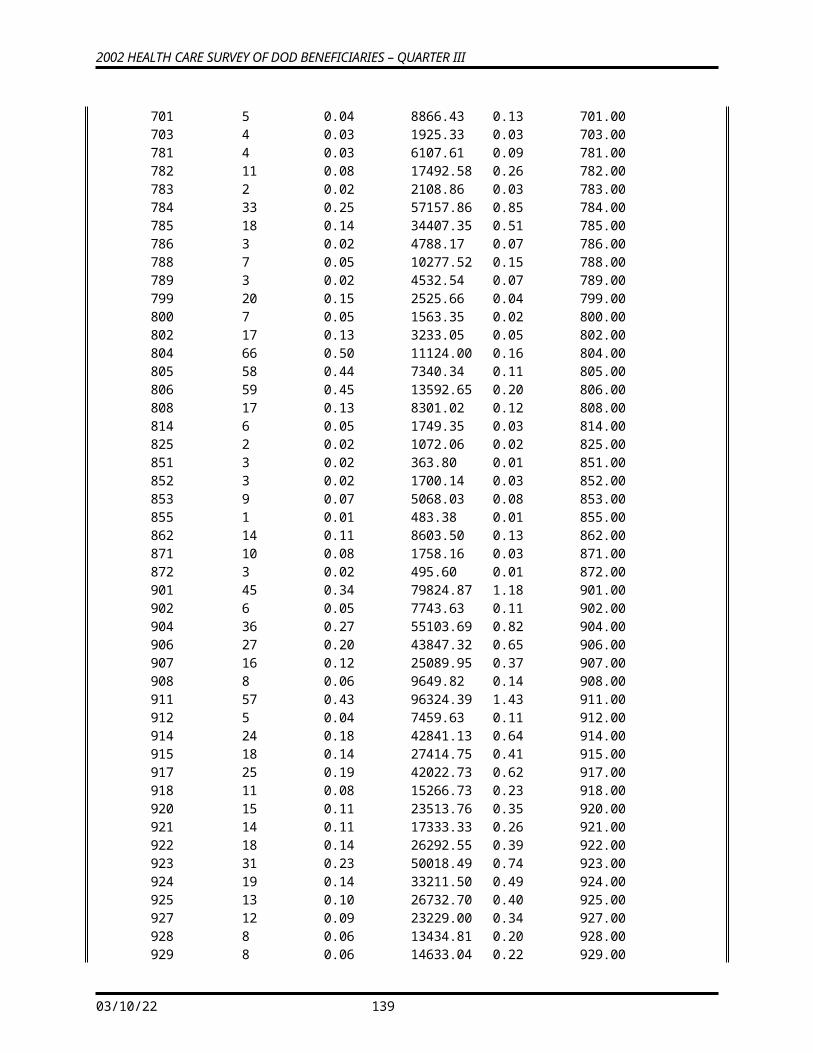
2002 HEALTH CARE SURVEY OF DOD BENEFICIARIES – QUARTER III
H02036 -In last year: how often doctors or other health providers explain things in way you could understand
Unweighted WeightedValue Count Percent Count Percent Formatted Value
. 213 1.61 143746.10 2.13 Did not answerN 1157 8.74 577649.90 8.56 I had no visits in the last
12 monthsA 12 0.09 6313.54 0.09 Invalid multiple responsesC 755 5.70 394786.00 5.85 Should be skipped1 76 0.57 42664.79 0.63 Never2 822 6.21 380784.10 5.64 Sometimes3 3719 28.09 1859047.00 27.56 Usually4 6485 48.98 3341085.00 49.53 Always
H02037 -In last year: how often doctors or other health providers show respect for what you had to say
Unweighted WeightedValue Count Percent Count Percent Formatted Value
. 211 1.59 143169.20 2.12 Did not answerN 1154 8.72 576796.00 8.55 I had no visits in the last
12 monthsA 8 0.06 2666.71 0.04 Invalid multiple responsesC 757 5.72 394968.20 5.85 Should be skipped1 129 0.97 55859.10 0.83 Never2 1049 7.92 450092.40 6.67 Sometimes3 3771 28.48 1882170.00 27.90 Usually4 6160 46.53 3240355.00 48.03 Always
05/13/23 141
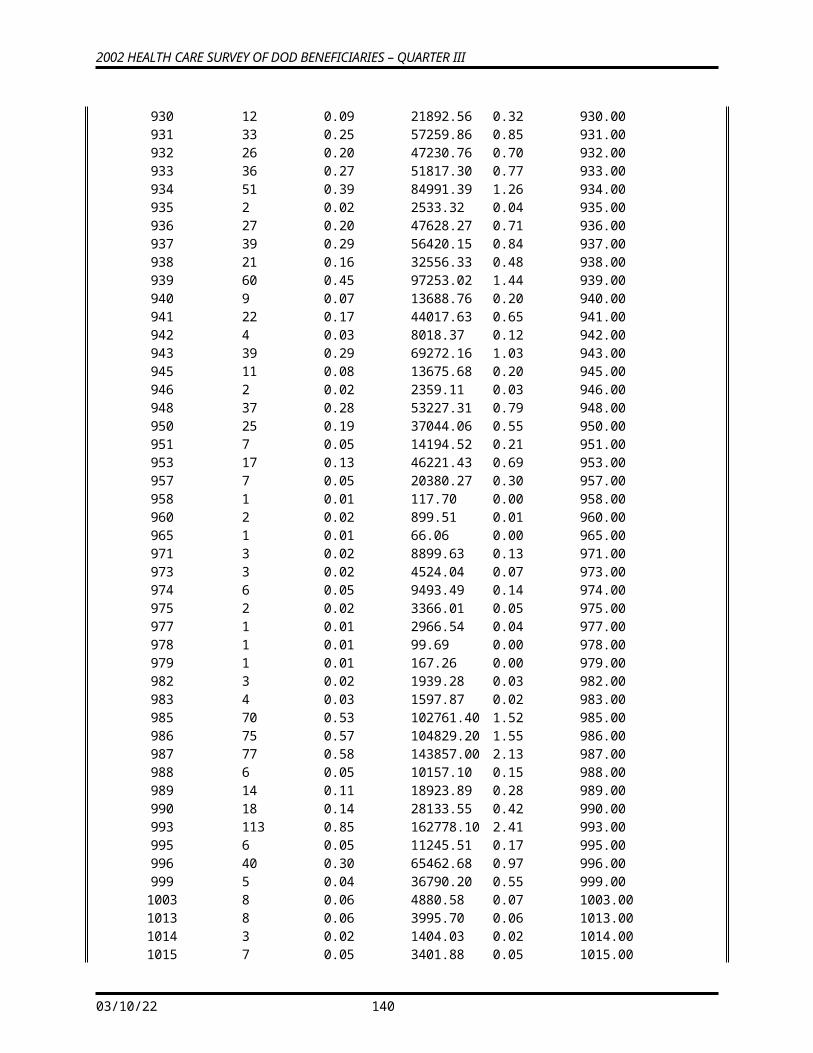
2002 HEALTH CARE SURVEY OF DOD BENEFICIARIES – QUARTER III
H02038 -In last year: how often doctors or other health providers spend enough time with you
Unweighted WeightedValue Count Percent Count Percent Formatted Value
. 160 1.21 105270.80 1.56 Did not answerN 1153 8.71 577178.70 8.56 I had no visits in the last
12 monthsA 11 0.08 4704.54 0.07 Invalid multiple responsesC 769 5.81 402760.70 5.97 Should be skipped1 295 2.23 138066.50 2.05 Never2 1569 11.85 712610.90 10.56 Sometimes3 4540 34.29 2303875.00 34.15 Usually4 4742 35.82 2501610.00 37.08 Always
H02039 -Rating of all healthcare in last year
Unweighted WeightedValue Count Percent Count Percent Formatted Value
. 216 1.63 135670.90 2.01 Did not answerN 1159 8.75 572474.20 8.49 I had no visits in the last
12 monthsA 49 0.37 29325.37 0.43 Invalid multiple responsesC 747 5.64 395310.60 5.86 Should be skipped0 69 0.52 44350.51 0.66 01 71 0.54 29284.49 0.43 12 137 1.03 65553.40 0.97 23 242 1.83 94926.47 1.41 34 346 2.61 159019.80 2.36 45 808 6.10 364929.00 5.41 56 804 6.07 382103.20 5.66 67 1599 12.08 749072.90 11.10 78 2546 19.23 1221658.00 18.11 89 2211 16.70 1142608.00 16.94 910 2235 16.88 1359791.00 20.16 10
05/13/23 142
2002 HEALTH CARE SURVEY OF DOD BENEFICIARIES – QUARTER III
H02040 -In last year: prescriptions that were written by a civilian provider but were filled at a military pharmacy
Unweighted WeightedValue Count Percent Count Percent Formatted Value
. 295 2.23 176304.10 2.61 Did not answerA 15 0.11 8998.11 0.13 Invalid multiple responsesN 1896 14.32 909887.90 13.49 Valid skip1 7403 55.92 3889047.00 57.65 None2 2315 17.49 993176.50 14.72 1 to 53 605 4.57 335795.90 4.98 6 to 104 279 2.11 164893.00 2.44 11 to 155 431 3.26 267974.80 3.97 More than 15
H02041 -In last year: facility used most for health care
Unweighted WeightedValue Count Percent Count Percent Formatted Value
. 138 1.04 75640.69 1.12 Did not answerA 56 0.42 30803.25 0.46 Invalid multiple responses1 7542 56.97 2651954.00 39.31 A military facility2 4351 32.87 3207858.00 47.55 A civilian facility3 85 0.64 81632.59 1.21 Uniformed Services Fam
Health Plan facil4 344 2.60 278412.60 4.13 Veterans Affairs (VA)
clinic or hospital5 723 5.46 419775.60 6.22 Went to none of listed
types of facility
05/13/23 143
2002 HEALTH CARE SURVEY OF DOD BENEFICIARIES – QUARTER III
H02042 -Most important reason to use MTF
Unweighted WeightedValue Count Percent Count Percent Formatted Value
. 1126 8.51 840502.20 12.46 Did not answerA 132 1.00 71931.05 1.07 Invalid multiple responses1 3782 28.57 1708923.00 25.33 Cost to you2 2197 16.59 1482880.00 21.98 Convenience of location3 1657 12.52 761574.70 11.29 Quality of healthcare4 26 0.20 17180.36 0.25 Convenience of
telephone access5 253 1.91 124310.20 1.84 Timeliness of
appointments6 280 2.11 118640.00 1.76 Military courtesy7 659 4.98 394395.60 5.85 Relationship with a
personal physician8 184 1.39 73698.40 1.09 Co-location of services in
a MTF9 288 2.18 113707.40 1.69 Lack of paperwork/claims10 2655 20.05 1038335.00 15.39 Active duty
H02043 -In last year: sent in any claims to your health plan
Unweighted WeightedValue Count Percent Count Percent Formatted Value
D 1301 9.83 544672.10 8.07 Don't Know1 11389 86.03 5953725.00 88.25 Yes2 549 4.15 247679.90 3.67 No
05/13/23 144
2002 HEALTH CARE SURVEY OF DOD BENEFICIARIES – QUARTER III
H02044 -In last year: health plan handled claims in a reasonable time
Unweighted WeightedValue Count Percent Count Percent Formatted Value
. 4587 34.65 2086449.00 30.93 Did not answerD 851 6.43 452332.00 6.71 Don't KnowA 24 0.18 16269.31 0.24 Invalid multiple responsesN 1250 9.44 537013.90 7.96 No claims were sent for
me in last 12 moC 649 4.90 288947.60 4.28 Should be skipped1 273 2.06 130907.50 1.94 Never2 696 5.26 370818.70 5.50 Sometimes3 2427 18.33 1448036.00 21.46 Usually4 2482 18.75 1415302.00 20.98 Always
H02045 -In last year: how often health plan handled claims correctly
Unweighted WeightedValue Count Percent Count Percent Formatted Value
. 4595 34.71 2096602.00 31.08 Did not answerD 939 7.09 510376.30 7.57 Don't KnowA 30 0.23 18245.50 0.27 Invalid multiple responsesN 1280 9.67 549058.30 8.14 No claims were sent for
me in last 12 moC 623 4.71 278776.20 4.13 Should be skipped1 173 1.31 77253.76 1.15 Never2 622 4.70 312977.90 4.64 Sometimes3 2235 16.88 1351659.00 20.04 Usually4 2742 20.71 1551128.00 22.99 Always
05/13/23 145
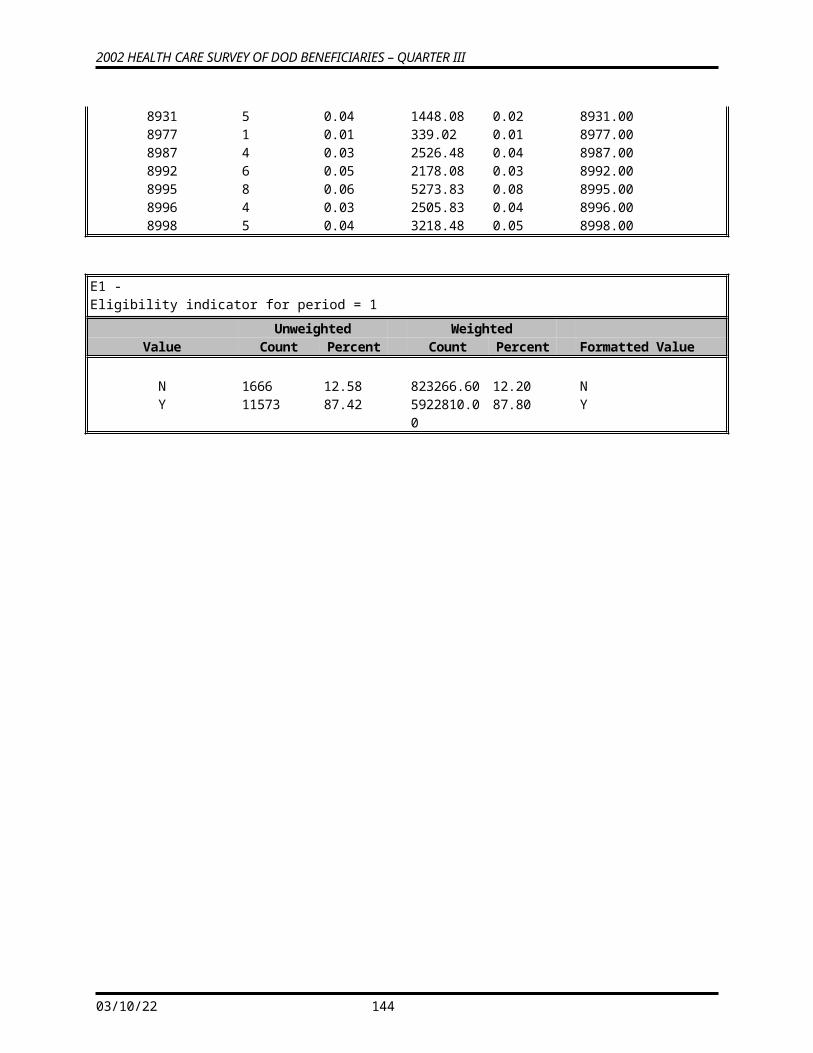
2002 HEALTH CARE SURVEY OF DOD BENEFICIARIES – QUARTER III
H02046 -In last year: before went for care know amount to pay
Unweighted WeightedValue Count Percent Count Percent Formatted Value
. 4602 34.76 2102641.00 31.17 Did not answerD 748 5.65 436643.40 6.47 Don't KnowA 21 0.16 14107.44 0.21 Invalid multiple responsesN 1357 10.25 600652.80 8.90 No claims were sent for
me in last 12 moC 643 4.86 279777.00 4.15 Should be skipped1 2019 15.25 1173278.00 17.39 Never2 570 4.31 313187.60 4.64 Sometimes3 1209 9.13 680155.70 10.08 Usually4 2070 15.64 1145634.00 16.98 Always
H02047 -In last year: look for any information in written materials from health plan
Unweighted WeightedValue Count Percent Count Percent Formatted Value
. 256 1.93 134105.50 1.99 Did not answer1 4710 35.58 2569801.00 38.09 Yes2 8273 62.49 4042171.00 59.92 No
H02048 -In last year: problem to find or understand information in the written materials
Unweighted WeightedValue Count Percent Count Percent Formatted Value
. 394 2.98 226699.80 3.36 Did not answerN 7524 56.83 3623312.00 53.71 Didn't look for information
in last 12 mA 1 0.01 129.12 0.00 Invalid multiple responsesC 749 5.66 418858.40 6.21 Should be skipped1 536 4.05 268045.90 3.97 A big problem2 1509 11.40 800530.70 11.87 A small problem3 2526 19.08 1408500.00 20.88 Not a problem
05/13/23 146
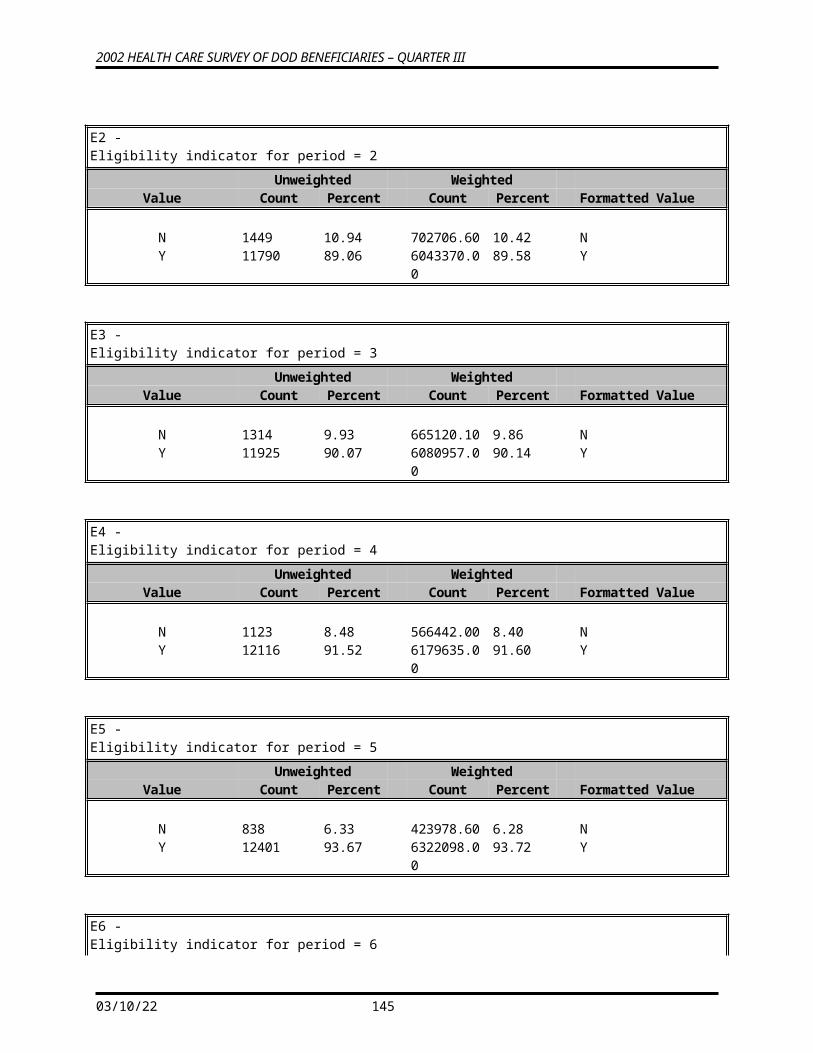
2002 HEALTH CARE SURVEY OF DOD BENEFICIARIES – QUARTER III
H02049 -In last year: called health plan's customer service to get information or help
Unweighted WeightedValue Count Percent Count Percent Formatted Value
. 145 1.10 87009.16 1.29 Did not answerA 2 0.02 861.44 0.01 Invalid multiple responses1 5283 39.90 2723455.00 40.37 Yes2 7809 58.98 3934751.00 58.33 No
H02050 -In last year: problem to get the help you needed when called health plan's customer service
Unweighted WeightedValue Count Percent Count Percent Formatted Value
. 259 1.96 155415.90 2.30 Did not answerN 6837 51.64 3375429.00 50.04 Didn't call customer
service in last 12A 11 0.08 4895.94 0.07 Invalid multiple responsesC 972 7.34 559322.10 8.29 Should be skipped1 848 6.41 411760.00 6.10 A big problem2 1437 10.85 718312.40 10.65 A small problem3 2875 21.72 1520941.00 22.55 Not a problem
H02051 -Called or written health plan with a complaint or problem
Unweighted WeightedValue Count Percent Count Percent Formatted Value
. 138 1.04 75583.41 1.12 Did not answer1 2228 16.83 1226449.00 18.18 Yes2 10873 82.13 5444044.00 80.70 No
05/13/23 147
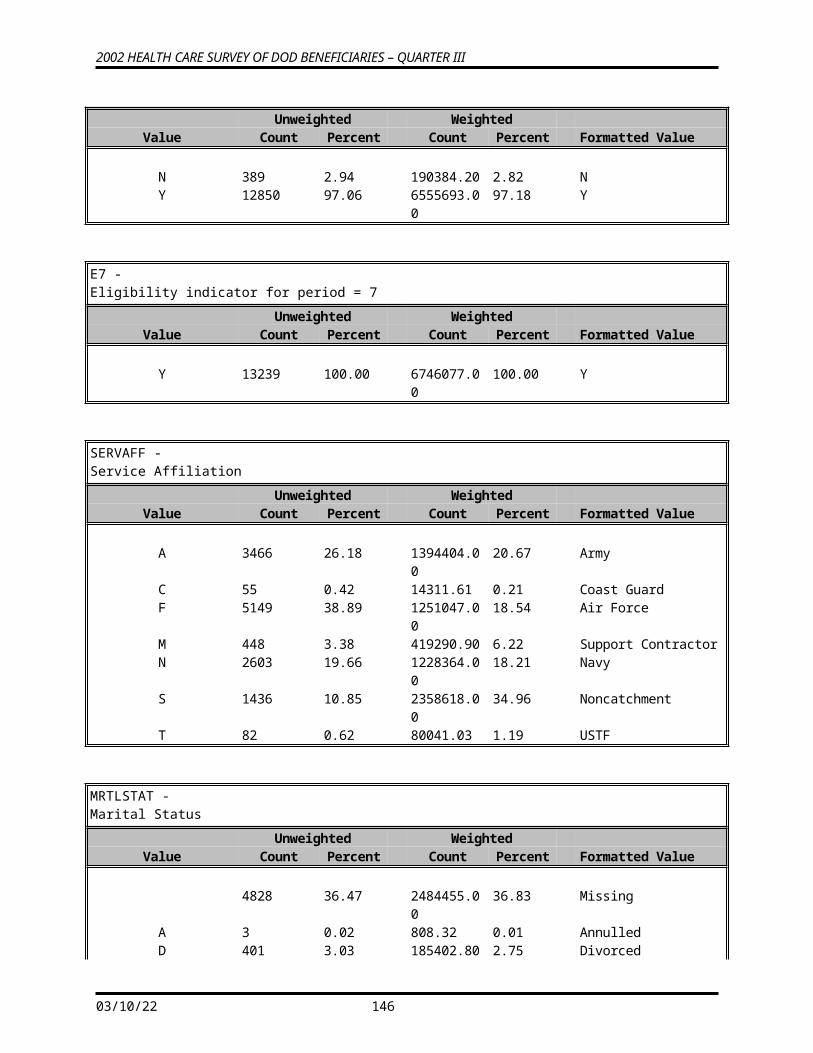
2002 HEALTH CARE SURVEY OF DOD BENEFICIARIES – QUARTER III
H02052 -How long for health plan to resolve complaint
Unweighted WeightedValue Count Percent Count Percent Formatted Value
. 210 1.59 118947.60 1.76 Did not answerN 9814 74.13 4902372.00 72.67 Haven't reported a
complaint or problemA 15 0.11 10211.90 0.15 Invalid multiple responsesC 1110 8.38 575684.40 8.53 Should be skipped1 494 3.73 293606.60 4.35 Same day2 228 1.72 115056.40 1.71 1 week3 171 1.29 93748.91 1.39 2 weeks4 124 0.94 79148.22 1.17 3 weeks5 434 3.28 230246.30 3.41 4 or more weeks6 639 4.83 327054.70 4.85 Still waiting for it to be
settled
H02053 -Complaint or problem settled to satisfaction
Unweighted WeightedValue Count Percent Count Percent Formatted Value
. 188 1.42 105780.90 1.57 Did not answerN 9795 73.99 4881693.00 72.36 Haven't reported a
complaint or problemA 49 0.37 21747.78 0.32 Invalid multiple responsesC 1088 8.22 566355.80 8.40 Should be skipped1 1192 9.00 694861.20 10.30 Yes2 407 3.07 199830.90 2.96 No3 520 3.93 275807.00 4.09 Still waiting for it to be
settled
H02054 -In last year: have any experiences with paperwork for your health plan
Unweighted WeightedValue Count Percent Count Percent Formatted Value
. 152 1.15 76135.46 1.13 Did not answer1 4187 31.63 2110974.00 31.29 Yes2 8900 67.23 4558968.00 67.58 No
05/13/23 148
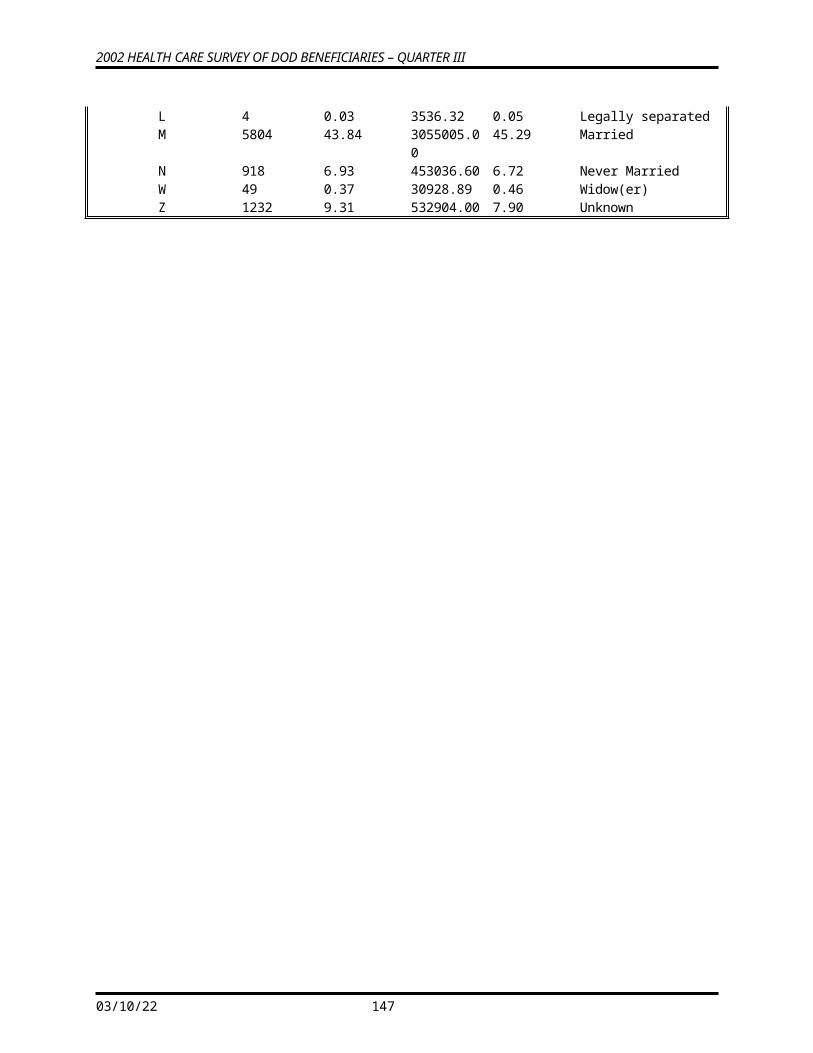
2002 HEALTH CARE SURVEY OF DOD BENEFICIARIES – QUARTER III
H02055 -In last year: how much problems with paperwork for your health plan
Unweighted WeightedValue Count Percent Count Percent Formatted Value
. 230 1.74 122255.10 1.81 Did not answerN 7939 59.97 4037320.00 59.85 Didn't have any
experiences with paperwk
A 7 0.05 5467.50 0.08 Invalid multiple responsesC 961 7.26 521648.10 7.73 Should be skipped1 629 4.75 288449.70 4.28 A big problem2 1329 10.04 682569.50 10.12 A small problem3 2144 16.19 1088367.00 16.13 Not a problem
H02056 -Rating of all experience with health plan
Unweighted WeightedValue Count Percent Count Percent Formatted Value
. 386 2.92 196904.30 2.92 Did not answerA 38 0.29 21356.64 0.32 Invalid multiple responses0 155 1.17 95522.73 1.42 01 111 0.84 44903.24 0.67 12 238 1.80 104635.10 1.55 23 344 2.60 185718.40 2.75 34 396 2.99 190415.90 2.82 45 1360 10.27 637603.80 9.45 56 1103 8.33 520923.10 7.72 67 2015 15.22 943104.60 13.98 78 2810 21.23 1375832.00 20.39 89 2128 16.07 1152400.00 17.08 910 2155 16.28 1276757.00 18.93 10
05/13/23 149
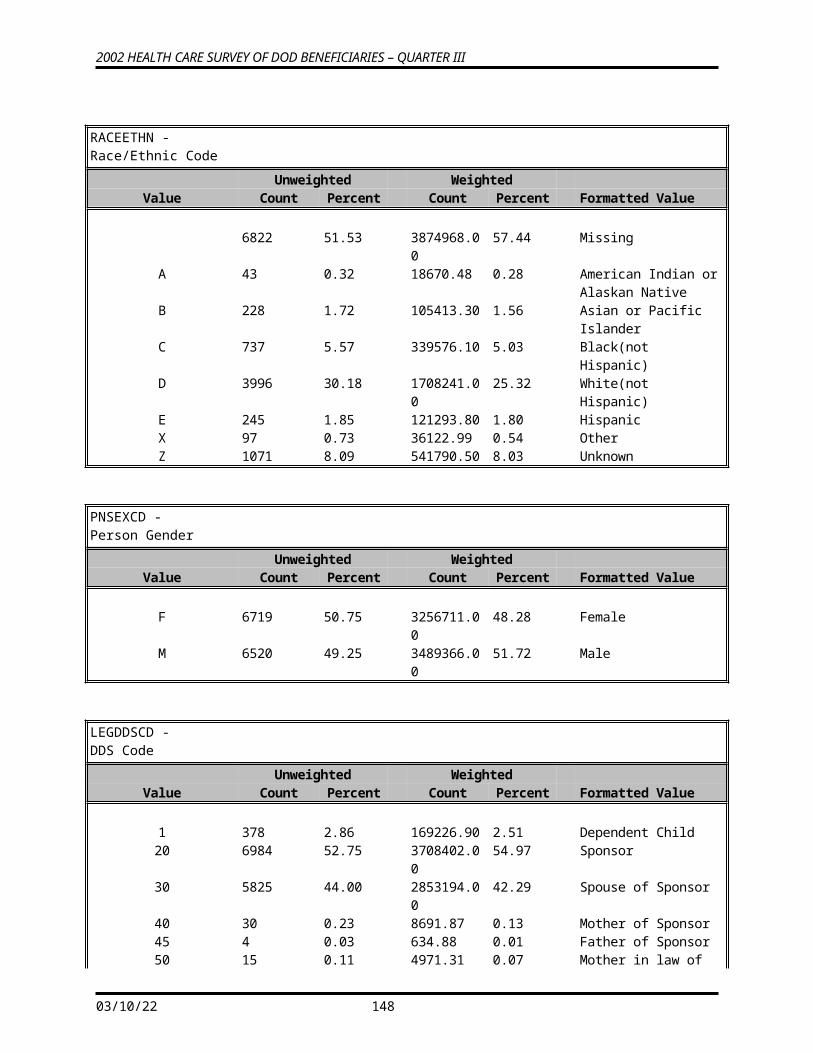
2002 HEALTH CARE SURVEY OF DOD BENEFICIARIES – QUARTER III
H02057 -In next year: likely to disenroll in TRICARE Prime
Unweighted WeightedValue Count Percent Count Percent Formatted Value
. 758 5.73 553735.30 8.21 Did not answerA 29 0.22 16727.34 0.25 Invalid multiple responsesN 3272 24.71 2351347.00 34.86 Not currently enrolled in
TRICARE PrimeD 1012 7.64 533246.70 7.90 Not sure1 5345 40.37 2138377.00 31.70 Very unlikely2 1831 13.83 736886.00 10.92 Unlikely3 478 3.61 203221.00 3.01 Neither likely nor unlikely4 221 1.67 90613.67 1.34 Likely5 293 2.21 121922.60 1.81 Very likely
H02058 -Not sick/pregnant: last medical or physical exam or checkup
Unweighted WeightedValue Count Percent Count Percent Formatted Value
. 146 1.10 79683.02 1.18 Did not answerA 15 0.11 8286.48 0.12 Invalid multiple responses1 396 2.99 175840.80 2.61 Never had a general
physical or checkup2 1019 7.70 499207.70 7.40 5 or more years ago3 1565 11.82 767741.80 11.38 More than 2 but less than
5 years ago4 2922 22.07 1473731.00 21.85 1 to 2 years ago5 7176 54.20 3741586.00 55.46 Less than 12 months ago
H02059 -Blood pressure: when last reading
Unweighted WeightedValue Count Percent Count Percent Formatted Value
. 115 0.87 60697.24 0.90 Did not answerA 6 0.05 1822.73 0.03 Invalid multiple responses1 380 2.87 211765.50 3.14 More than 2 years ago2 902 6.81 421227.70 6.24 1 to 2 years ago3 11836 89.40 6050564.00 89.69 Less than 12 months ago
H02060 -Blood pressure: know if blood pressure is too high or not
Unweighted WeightedValue Count Percent Count Percent Formatted Value
05/13/23 150
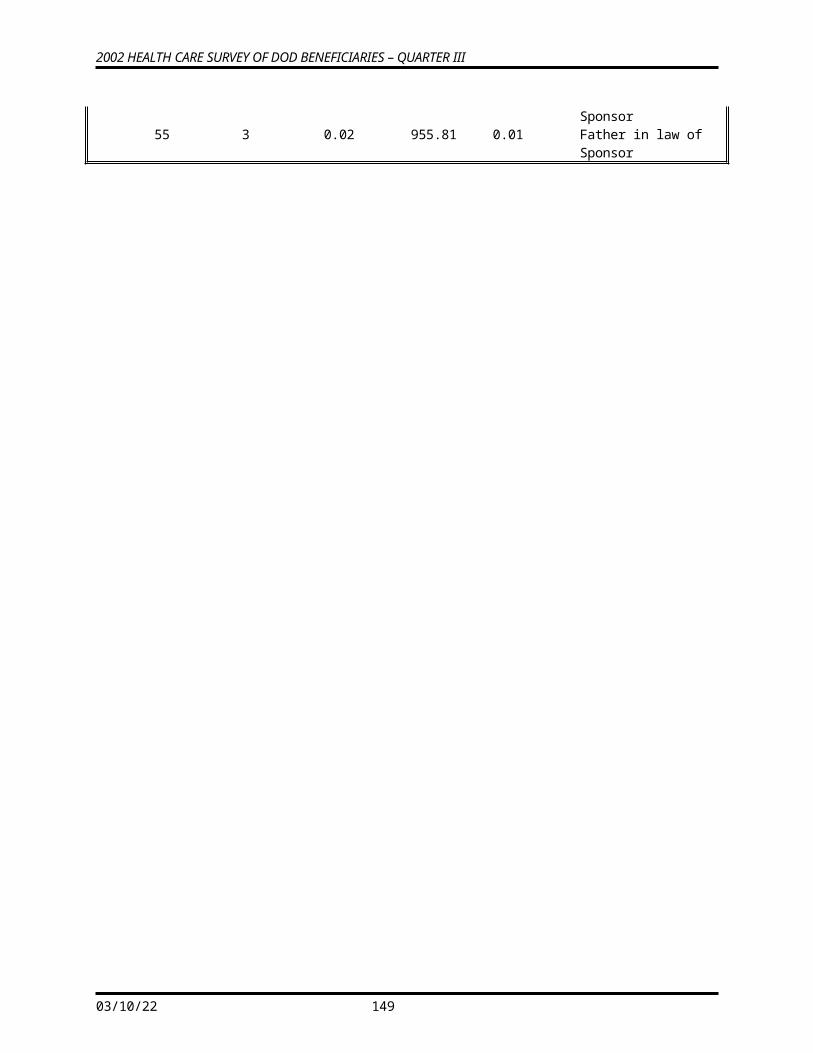
2002 HEALTH CARE SURVEY OF DOD BENEFICIARIES – QUARTER III
. 129 0.97 73095.34 1.08 Did not answerA 13 0.10 11674.85 0.17 Invalid multiple responses1 2126 16.06 1253509.00 18.58 Yes2 10011 75.62 4931639.00 73.10 No3 960 7.25 476159.30 7.06 Don't Know
H02061 -When did you last have a cholesterol screening
Unweighted WeightedValue Count Percent Count Percent Formatted Value
. 140 1.06 75447.03 1.12 Did not answerA 7 0.05 2426.56 0.04 Invalid multiple responses1 1966 14.85 900360.80 13.35 Never had a cholesterol
screening2 722 5.45 360542.60 5.34 5 or more years ago3 1349 10.19 611705.70 9.07 More than 2 but less than
5 years ago4 2310 17.45 1108534.00 16.43 1 to 2 years ago5 6745 50.95 3687060.00 54.65 Less than 12 months ago
H02062 -When did you last have a flu shot
Unweighted WeightedValue Count Percent Count Percent Formatted Value
. 103 0.78 54948.72 0.81 Did not answerA 13 0.10 6448.53 0.10 Invalid multiple responses1 2551 19.27 1144569.00 16.97 Never had a flu shot2 2283 17.24 1164844.00 17.27 More than 2 years ago3 1728 13.05 874762.00 12.97 1 to 2 years ago4 6561 49.56 3500505.00 51.89 Less than 12 months ago
05/13/23 151
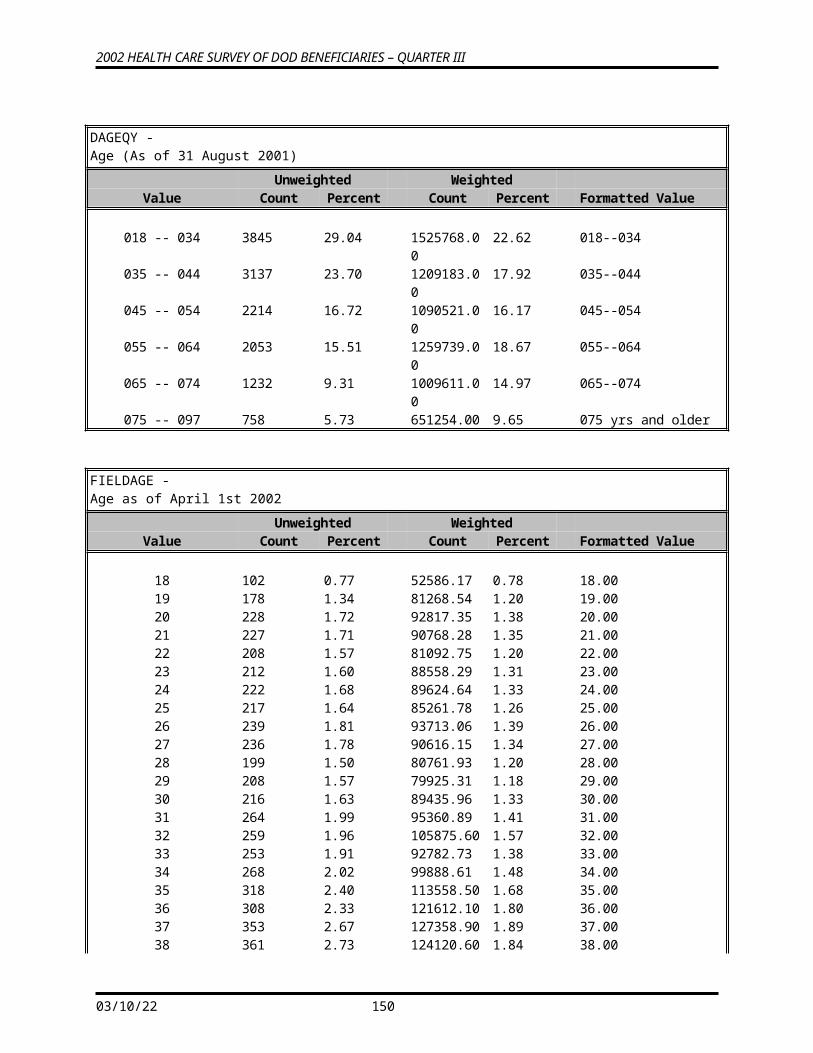
2002 HEALTH CARE SURVEY OF DOD BENEFICIARIES – QUARTER III
H02063 -Smoked at least 100 cigarettes in life
Unweighted WeightedValue Count Percent Count Percent Formatted Value
. 105 0.79 63082.89 0.94 Did not answerD 140 1.06 72306.68 1.07 Don't knowA 2 0.02 1493.53 0.02 Invalid multiple responses1 5925 44.75 3270566.00 48.48 Yes2 7067 53.38 3338628.00 49.49 No
H02064 -Smoke everyday somedays or not at all
Unweighted WeightedValue Count Percent Count Percent Formatted Value
. 209 1.58 128905.40 1.91 Did not answerD 9 0.07 4826.91 0.07 Don't knowA 2 0.02 1054.91 0.02 Invalid multiple responsesC 928 7.01 500727.60 7.42 Should be skippedN 6279 47.43 2910207.00 43.14 Valid skip2 3567 26.94 2041539.00 30.26 Not at all3 628 4.74 307284.60 4.56 Some days4 1617 12.21 851531.20 12.62 Every day
H02065 -How long since you quit smoking
Unweighted WeightedValue Count Percent Count Percent Formatted Value
. 293 2.21 185382.40 2.75 Did not answerD 92 0.69 49553.43 0.73 Don't knowA 1 0.01 1230.11 0.02 Invalid multiple responsesC 479 3.62 240220.90 3.56 Should be skippedN 8973 67.78 4329529.00 64.18 Valid skip2 3129 23.63 1821413.00 27.00 12 months or more3 272 2.05 118747.70 1.76 Less than 12 months
05/13/23 152
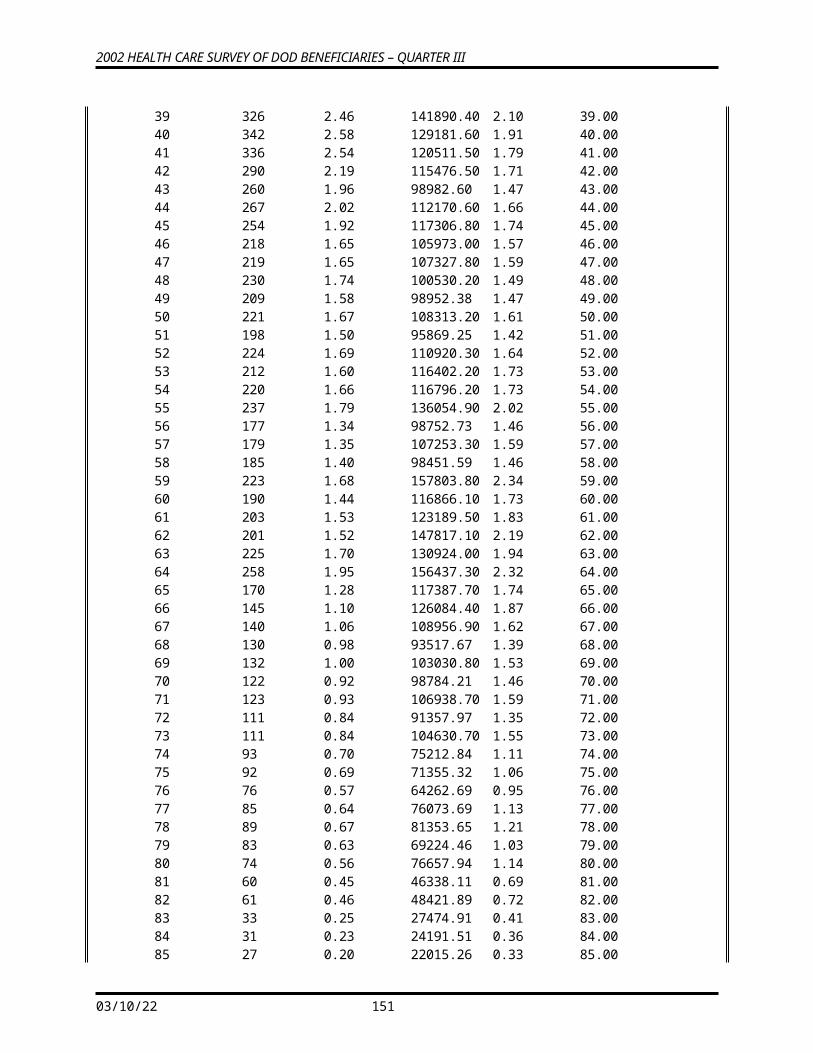
2002 HEALTH CARE SURVEY OF DOD BENEFICIARIES – QUARTER III
H02066 -Last year: number of visits advised to quit smoking
Unweighted WeightedValue Count Percent Count Percent Formatted Value
. 391 2.95 229007.70 3.39 Did not answerA 1 0.01 93.94 0.00 Invalid multiple responsesC 1169 8.83 676876.30 10.03 Should be skippedN 9255 69.91 4604092.00 68.25 Valid skip1 903 6.82 471781.00 6.99 None2 486 3.67 257157.10 3.81 1 visit3 697 5.26 342309.20 5.07 2 to 4 visits4 181 1.37 89007.70 1.32 5 to 9 visits5 156 1.18 75751.86 1.12 10 or more visits
H02067 -Are you male or female
Unweighted WeightedValue Count Percent Count Percent Formatted Value
. 183 1.38 99661.03 1.48 Did not answerA 4 0.03 2465.22 0.04 Invalid multiple responses1 6355 48.00 3407996.00 50.52 Male2 6697 50.59 3235955.00 47.97 Female
H02068 -Last prostate disease exam or blood test
Unweighted WeightedValue Count Percent Count Percent Formatted Value
. 53 0.40 38335.32 0.57 Did not answerA 8 0.06 4713.21 0.07 Invalid multiple responsesC 419 3.16 190771.40 2.83 Should be skippedN 6433 48.59 3126990.00 46.35 Valid skip1 1762 13.31 813779.40 12.06 Never had a prostate
gland examination2 430 3.25 194585.30 2.88 5 or more years ago3 707 5.34 349566.40 5.18 More than 2 but less than
5 years ago4 979 7.39 557589.50 8.27 1 to 2 years ago5 2448 18.49 1469746.00 21.79 Within the last 12 months
H02069 -Last have a Pap smear test
Unweighted WeightedValue Count Percent Count Percent Formatted Value
05/13/23 153
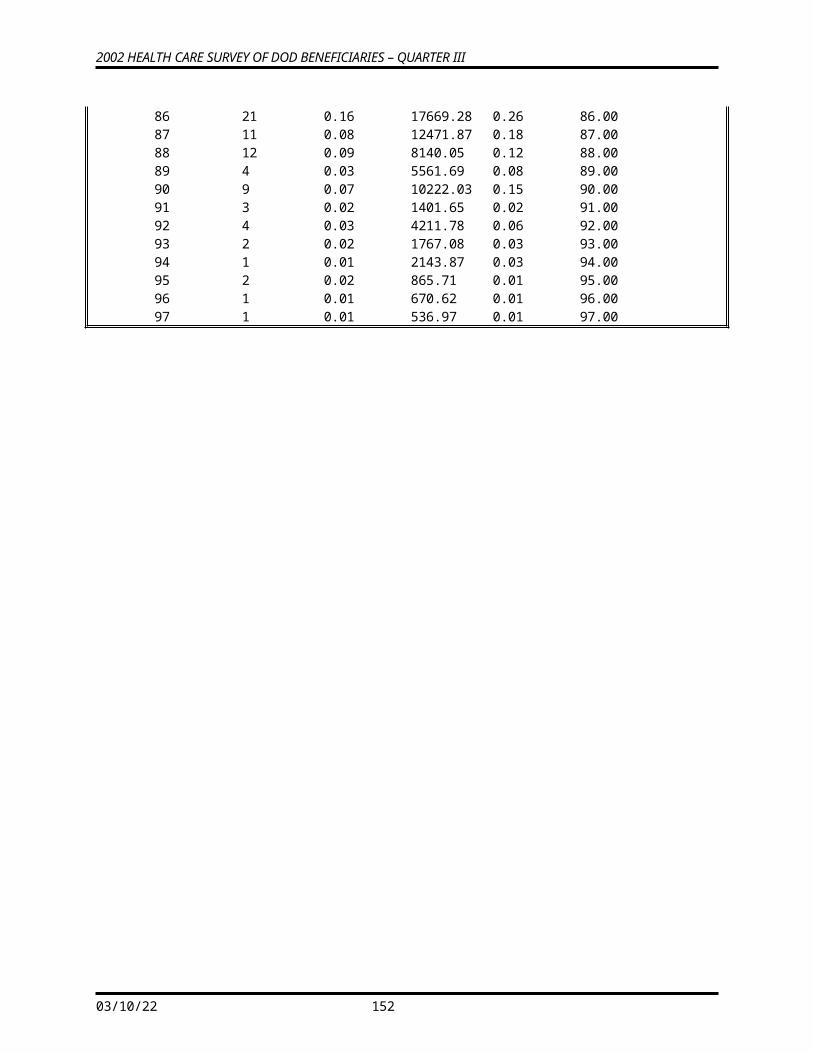
2002 HEALTH CARE SURVEY OF DOD BENEFICIARIES – QUARTER III
. 114 0.86 57232.78 0.85 Did not answerA 4 0.03 3073.01 0.05 Invalid multiple responsesC 230 1.74 153992.90 2.28 Should be skippedN 6157 46.51 3274322.00 48.54 Valid skip1 123 0.93 55120.16 0.82 Never had a Pap smear
test2 371 2.80 247983.70 3.68 5 or more years ago3 240 1.81 140747.10 2.09 More than 3 but less than
5 years ago4 1501 11.34 781617.30 11.59 1 to 3 years ago5 4499 33.98 2031988.00 30.12 Within the last 12 months
H02070 -Are you under age 40
Unweighted WeightedValue Count Percent Count Percent Formatted Value
C 678 5.12 415523.60 6.16 Should be skippedN 5709 43.12 3012791.00 44.66 Valid skip1 2891 21.84 1031600.00 15.29 Yes2 3961 29.92 2286162.00 33.89 No
H02071 -Last time: breasts checked mammography
Unweighted WeightedValue Count Percent Count Percent Formatted Value
. 181 1.37 111428.80 1.65 Did not answerA 9 0.07 4539.84 0.07 Invalid multiple responsesC 830 6.27 371162.80 5.50 Should be skippedN 8448 63.81 4088752.00 60.61 Valid skip1 245 1.85 134766.70 2.00 Never had a
mammogram2 163 1.23 104669.60 1.55 More than 5 years ago3 301 2.27 170639.20 2.53 More than 2 less than 5
years ago4 707 5.34 436844.70 6.48 1 to 2 years ago5 2355 17.79 1323273.00 19.62 Within the last 12 months
H02072 -Last time: breast exam by professional
Unweighted WeightedValue Count Percent Count Percent Formatted Value
. 112 0.85 64368.57 0.95 Did not answerA 8 0.06 4609.98 0.07 Invalid multiple responsesC 1081 8.17 457755.20 6.79 Should be skippedN 8197 61.92 4002159.00 59.33 Valid skip1 88 0.66 61404.26 0.91 Never had a breast exam
05/13/23 154
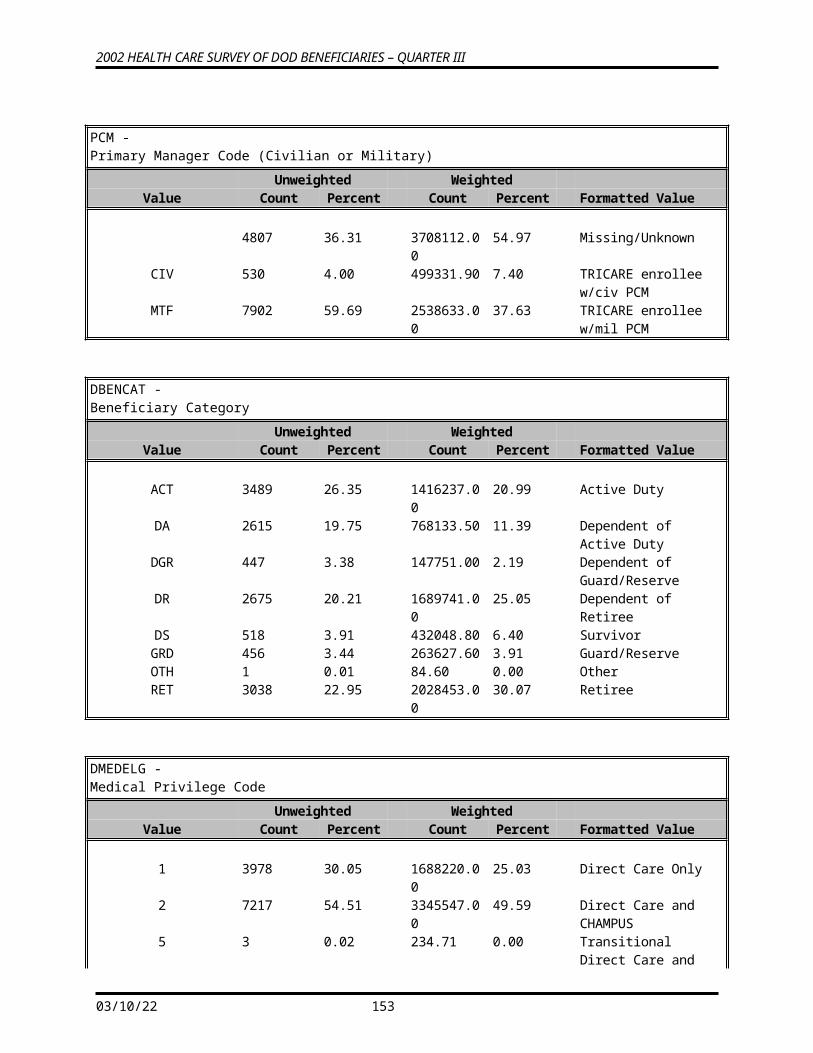
2002 HEALTH CARE SURVEY OF DOD BENEFICIARIES – QUARTER III
2 193 1.46 131298.90 1.95 5 or more years ago3 280 2.11 164120.40 2.43 More than 2 less than 5
years ago4 676 5.11 421548.80 6.25 1 to 2 years ago5 2604 19.67 1438811.00 21.33 Within the last 12 months
H02073 -Been pregnant in last year or pregnant now
Unweighted WeightedValue Count Percent Count Percent Formatted Value
. 185 1.40 119093.10 1.77 Did not answerC 152 1.15 84002.22 1.25 Should be skippedN 6235 47.10 3344313.00 49.57 Valid skip1 231 1.74 80945.37 1.20 Yes2 437 3.30 167350.80 2.48 No3 5999 45.31 2950373.00 43.73 No
H02074 -In what trimester is your pregnancy
Unweighted WeightedValue Count Percent Count Percent Formatted Value
. 190 1.44 121338.50 1.80 Did not answerA 1 0.01 467.95 0.01 Invalid multiple responsesC 11 0.08 7124.80 0.11 Should be skippedN 12812 96.77 6538914.00 96.93 Valid skip1 46 0.35 16198.99 0.24 First trimester2 84 0.63 28992.26 0.43 Second trimester3 95 0.72 33040.76 0.49 Third trimester
05/13/23 155
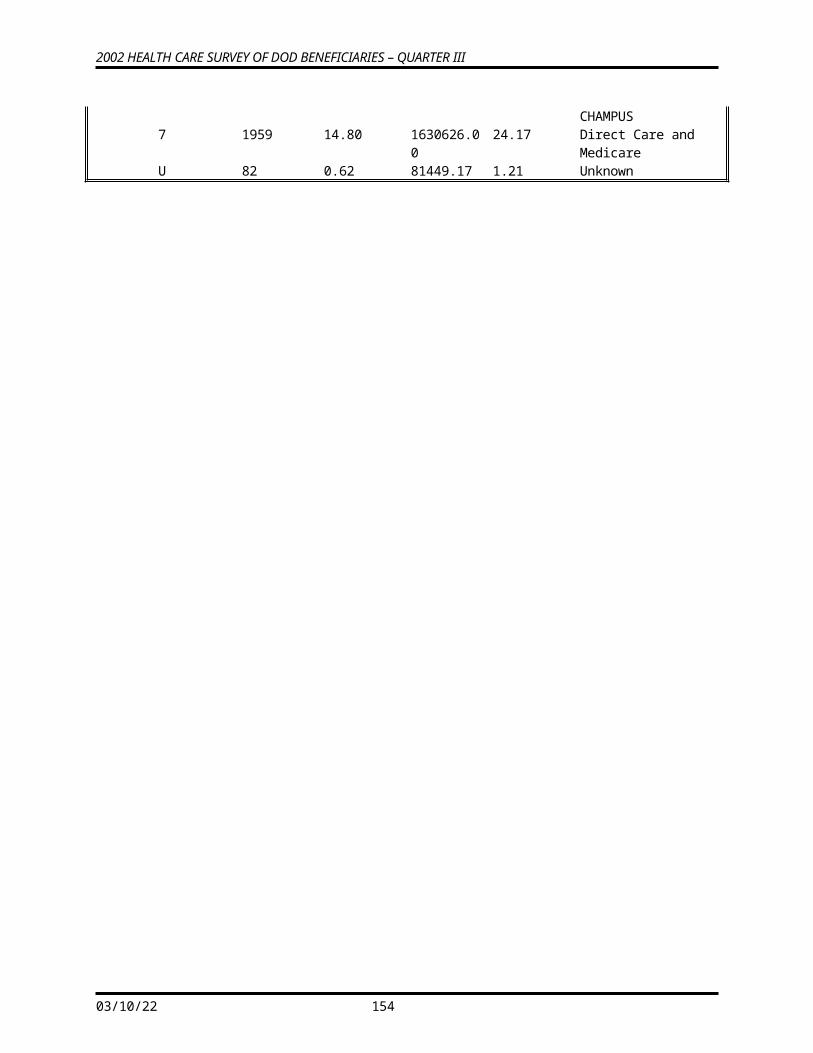
2002 HEALTH CARE SURVEY OF DOD BENEFICIARIES – QUARTER III
H02075 -Trimester first received prenatal care
Unweighted WeightedValue Count Percent Count Percent Formatted Value
. 215 1.62 140006.50 2.08 Did not answerC 45 0.34 21818.23 0.32 Should be skippedN 12341 93.22 6356869.00 94.23 Valid skip1 29 0.22 23681.74 0.35 Did not receive prenatal
care2 3 0.02 1975.71 0.03 Third trimester3 57 0.43 21846.48 0.32 Second trimester4 549 4.15 179878.90 2.67 First trimester
H02076 -In general how would you rate your overall health
Unweighted WeightedValue Count Percent Count Percent Formatted Value
. 90 0.68 55567.44 0.82 Did not answerA 26 0.20 13054.15 0.19 Invalid multiple responses1 250 1.89 151786.50 2.25 Poor2 1398 10.56 864735.70 12.82 Fair3 4600 34.75 2384961.00 35.35 Good4 4885 36.90 2374609.00 35.20 Very Good5 1990 15.03 901363.60 13.36 Excellent
H02077 -Are you Spanish/Hispanic/Latino
Unweighted WeightedValue Count Percent Count Percent Formatted Value
. 387 2.92 206978.40 3.07 Did not answerA 14 0.11 4523.87 0.07 Invalid multiple responses1 11863 89.61 6054755.00 89.75 No2 391 2.95 179743.30 2.66 Yes3 224 1.69 126665.30 1.88 Yes4 29 0.22 16289.21 0.24 Yes5 331 2.50 157122.20 2.33 Yes
05/13/23 156
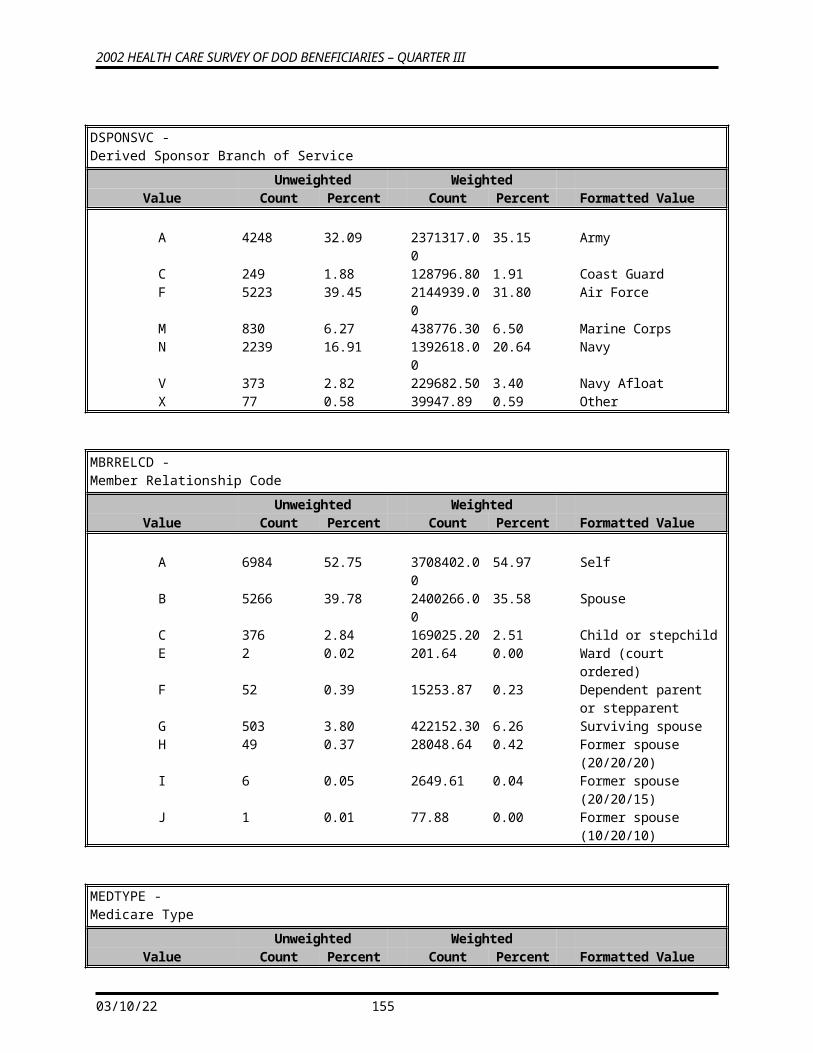
2002 HEALTH CARE SURVEY OF DOD BENEFICIARIES – QUARTER III
SREDA -Highest grade completed
Unweighted WeightedValue Count Percent Count Percent Formatted Value
. 110 0.83 51797.25 0.77 Did not answerA 126 0.95 80293.76 1.19 Invalid multiple responses1 152 1.15 115713.70 1.72 8th grade or less2 336 2.54 206943.20 3.07 Some high school3 2902 21.92 1668641.00 24.73 High school graduate or
GED4 5442 41.11 2632201.00 39.02 Some college or 2-year
degree5 1825 13.79 872470.10 12.93 4-year college graduate6 2346 17.72 1118018.00 16.57 More than 4-year college
degree
SRRACEA -Race: White
Unweighted WeightedValue Count Percent Count Percent Formatted Value
1 10509 79.38 5468017.00 81.05 Marked2 2730 20.62 1278060.00 18.95 Not Marked
SRRACEB -Race: Black or African American
Unweighted WeightedValue Count Percent Count Percent Formatted Value
1 1408 10.64 694813.60 10.30 Marked2 11831 89.36 6051263.00 89.70 Not Marked
SRRACEC -Race: American Indian or Alaska Native
Unweighted WeightedValue Count Percent Count Percent Formatted Value
1 273 2.06 135033.90 2.00 Marked2 12966 97.94 6611043.00 98.00 Not Marked
05/13/23 157
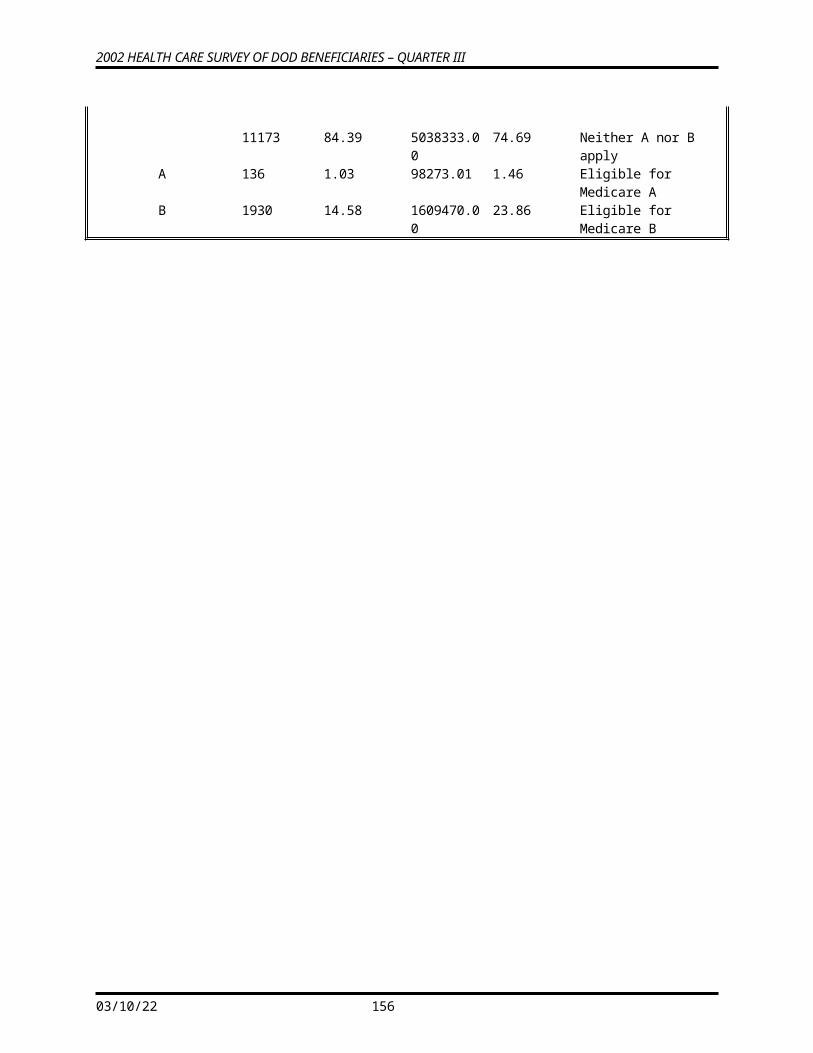
2002 HEALTH CARE SURVEY OF DOD BENEFICIARIES – QUARTER III
SRRACED -Race: Asian
Unweighted WeightedValue Count Percent Count Percent Formatted Value
1 759 5.73 342362.60 5.07 Marked2 12480 94.27 6403714.00 94.93 Not Marked
SRRACEE -Race: Native Hawaiian/other Pacific Islanders
Unweighted WeightedValue Count Percent Count Percent Formatted Value
1 89 0.67 36545.94 0.54 Marked2 13150 99.33 6709531.00 99.46 Not Marked
SRAGE -What is your age now?
Unweighted WeightedValue Count Percent Count Percent Formatted Value
. 83 0.63 42572.16 0.63 Did not answerA 9 0.07 4999.39 0.07 Invalid multiple responses1 1280 9.67 528424.00 7.83 18 to 242 2367 17.88 921013.90 13.65 25 to 343 3133 23.66 1189633.00 17.63 35 to 444 2225 16.81 1086128.00 16.10 45 to 545 2063 15.58 1261873.00 18.71 55 to 646 1299 9.81 1027115.00 15.23 65 to 747 780 5.89 684319.00 10.14 75 or older
S02D01 -Last 12 months: care from dentist's office or dental clinic
Unweighted WeightedValue Count Percent Count Percent Formatted Value
. 186 1.40 104811.90 1.55 Did not answerA 1 0.01 128.80 0.00 Invalid multiple responses1 8579 64.80 4265369.00 63.23 Yes2 4473 33.79 2375767.00 35.22 No
S02D02 -Last 12 months: number of times to dentist's office or clinic for self
Unweighted WeightedValue Count Percent Count Percent Formatted Value
05/13/23 158
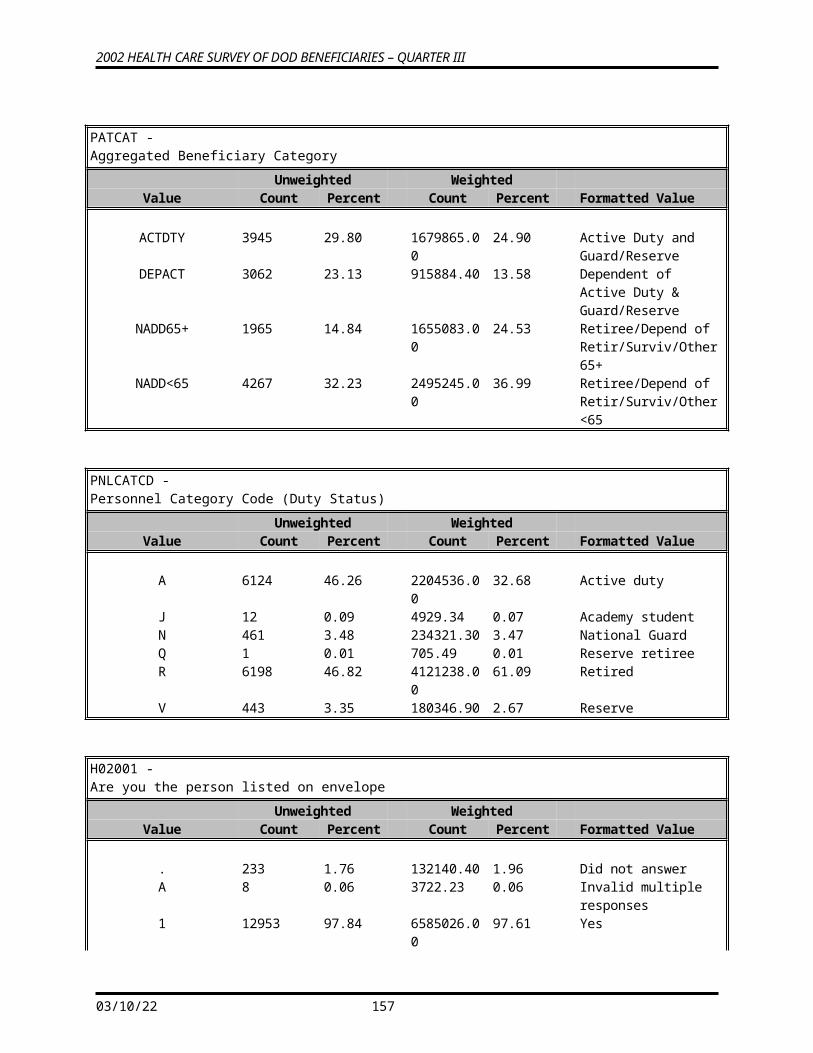
2002 HEALTH CARE SURVEY OF DOD BENEFICIARIES – QUARTER III
A 24 0.18 13954.34 0.21 Invalid Multiple Responses
. 231 1.74 130646.40 1.94 Missing/UnknownC 593 4.48 377471.40 5.60 Should be skippedN 3880 29.31 1998296.00 29.62 Valid Skip1 78 0.59 51259.85 0.76 None2 2182 16.48 939695.70 13.93 13 3372 25.47 1704659.00 25.27 24 1313 9.92 679813.10 10.08 35 842 6.36 473208.20 7.01 46 626 4.73 327405.00 4.85 5 to 97 98 0.74 49668.42 0.74 10 or more
S02D03 -Last 12 months: rating of dental care
Unweighted WeightedValue Count Percent Count Percent Formatted Value
. 244 1.84 141011.20 2.09 Did not answerN 4159 31.41 2174504.00 32.23 I didn't have any dental
care in the lasA 29 0.22 17953.15 0.27 Invalid multiple responsesC 334 2.52 215059.10 3.19 Should be skipped0 64 0.48 34272.10 0.51 01 54 0.41 27431.94 0.41 12 109 0.82 46707.48 0.69 23 126 0.95 62521.30 0.93 34 159 1.20 87873.78 1.30 45 458 3.46 233234.10 3.46 56 468 3.54 228413.80 3.39 67 972 7.34 459353.70 6.81 78 1815 13.71 858112.30 12.72 89 1930 14.58 910288.90 13.49 910 2318 17.51 1249340.00 18.52 10
S02M01 -Last 12 months: treatment or counseling for personal or family problem
Unweighted WeightedValue Count Percent Count Percent Formatted Value
. 104 0.79 50974.52 0.76 Did not answer1 2204 16.65 1149977.00 17.05 Yes2 10931 82.57 5545125.00 82.20 No
S02M02 -Last 12 months: problem to get treatment or counseling needed
Unweighted WeightedValue Count Percent Count Percent Formatted Value
05/13/23 159
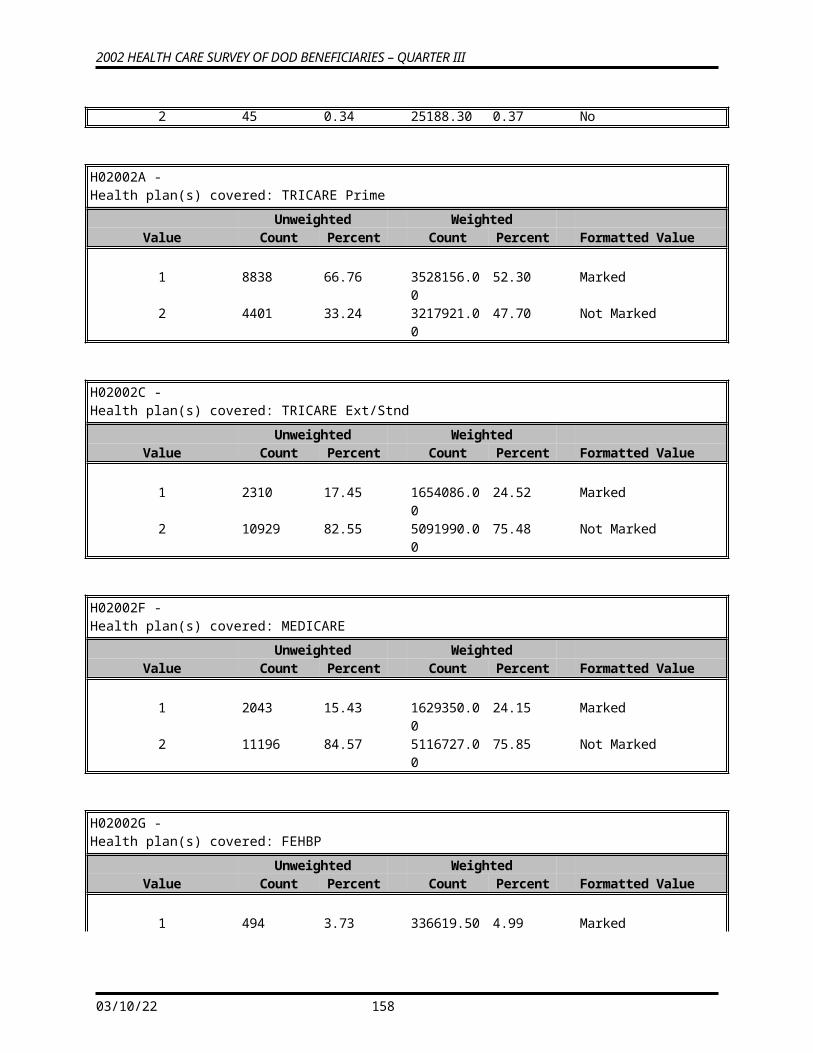
2002 HEALTH CARE SURVEY OF DOD BENEFICIARIES – QUARTER III
. 209 1.58 114081.40 1.69 Did not answerN 10598 80.05 5370679.00 79.61 I didn't need to get any
treatment or coA 11 0.08 7384.52 0.11 Invalid multiple responsesC 502 3.79 268239.90 3.98 Should be skipped1 202 1.53 102487.60 1.52 Big Problem2 287 2.17 128088.90 1.90 Small Problem3 1430 10.80 755116.00 11.19 Not a problem
S02M03 -Last 12 months: rating of treatment or counseling
Unweighted WeightedValue Count Percent Count Percent Formatted Value
. 302 2.28 173345.80 2.57 Did not answerA 7 0.05 6725.53 0.10 Invalid multiple responsesN 10931 82.57 5545125.00 82.20 Valid Skip0 76 0.57 44821.87 0.66 01 31 0.23 15831.16 0.23 12 44 0.33 17297.61 0.26 23 40 0.30 15167.39 0.22 34 68 0.51 36604.89 0.54 45 169 1.28 81465.71 1.21 56 128 0.97 59284.02 0.88 67 229 1.73 106456.80 1.58 78 371 2.80 192462.30 2.85 89 342 2.58 173744.30 2.58 910 501 3.78 277744.70 4.12 10
S02P01 -Last 12 months: new or refill prescription
Unweighted WeightedValue Count Percent Count Percent Formatted Value
. 30 0.23 13921.87 0.21 Did not answer1 11313 85.45 5822267.00 86.31 Yes2 1896 14.32 909887.90 13.49 No
S02P02 -Last 12 months: problem to get prescription medicine
Unweighted WeightedValue Count Percent Count Percent Formatted Value
. 570 4.31 330823.80 4.90 Did not answerN 2118 16.00 1022935.00 15.16 I didn't get any
prescriptions in the laA 16 0.12 9534.88 0.14 Invalid multiple responsesC 21 0.16 11206.62 0.17 Should be skipped
05/13/23 160
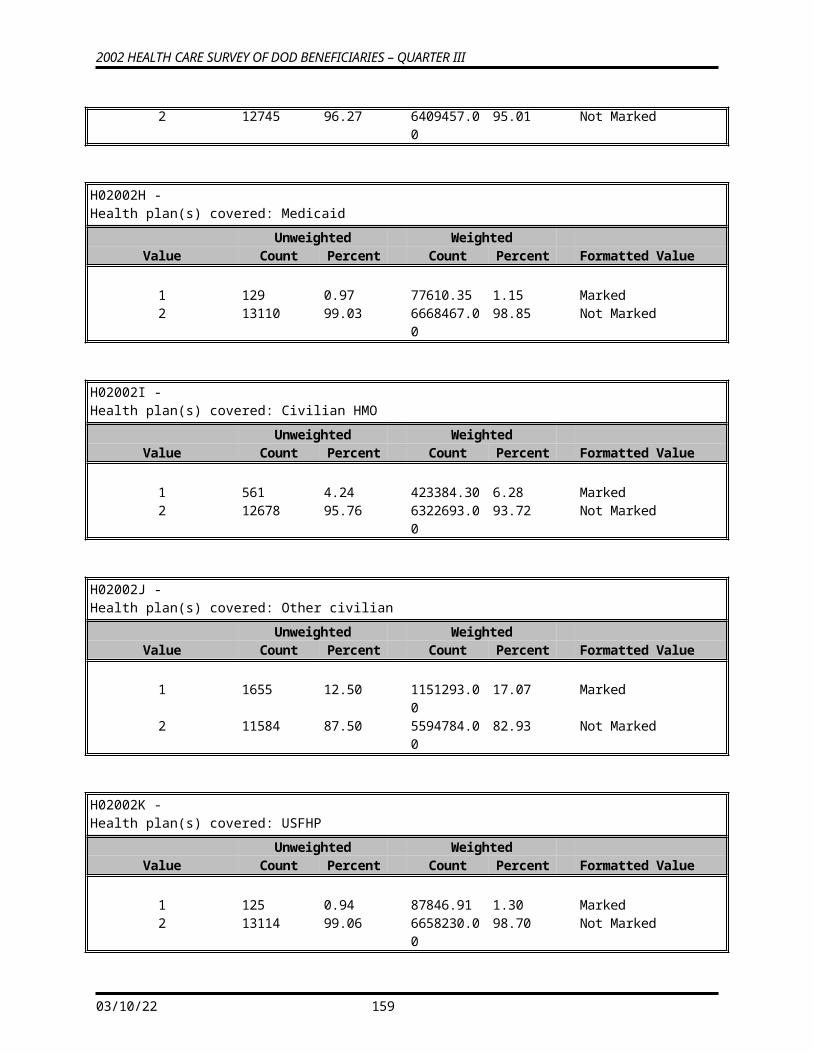
2002 HEALTH CARE SURVEY OF DOD BENEFICIARIES – QUARTER III
1 457 3.45 238694.90 3.54 Big Problem2 1471 11.11 703285.20 10.43 Small Problem3 8586 64.85 4429596.00 65.66 Not a problem
S02P03 -Last 12 months: how often get prescription medicine needed
Unweighted WeightedValue Count Percent Count Percent Formatted Value
. 418 3.16 252841.10 3.75 Did not answerN 2161 16.32 1035836.00 15.35 I didn't get any
prescriptions in the laA 21 0.16 16734.20 0.25 Invalid multiple responsesC 12 0.09 6163.51 0.09 Should be skipped1 399 3.01 264972.40 3.93 Never2 723 5.46 392371.40 5.82 Sometimes3 1817 13.72 948352.60 14.06 Usually4 7688 58.07 3828806.00 56.76 Always
S02X01 -Rating of overall mental or emotional health
Unweighted WeightedValue Count Percent Count Percent Formatted Value
. 83 0.63 48042.78 0.71 Did not answerA 15 0.11 6028.85 0.09 Invalid multiple responses1 153 1.16 97241.29 1.44 Poor2 926 6.99 529589.80 7.85 Fair3 3070 23.19 1680825.00 24.92 Good4 4918 37.15 2458292.00 36.44 Very Good5 4074 30.77 1926057.00 28.55 Excellent
05/13/23 161
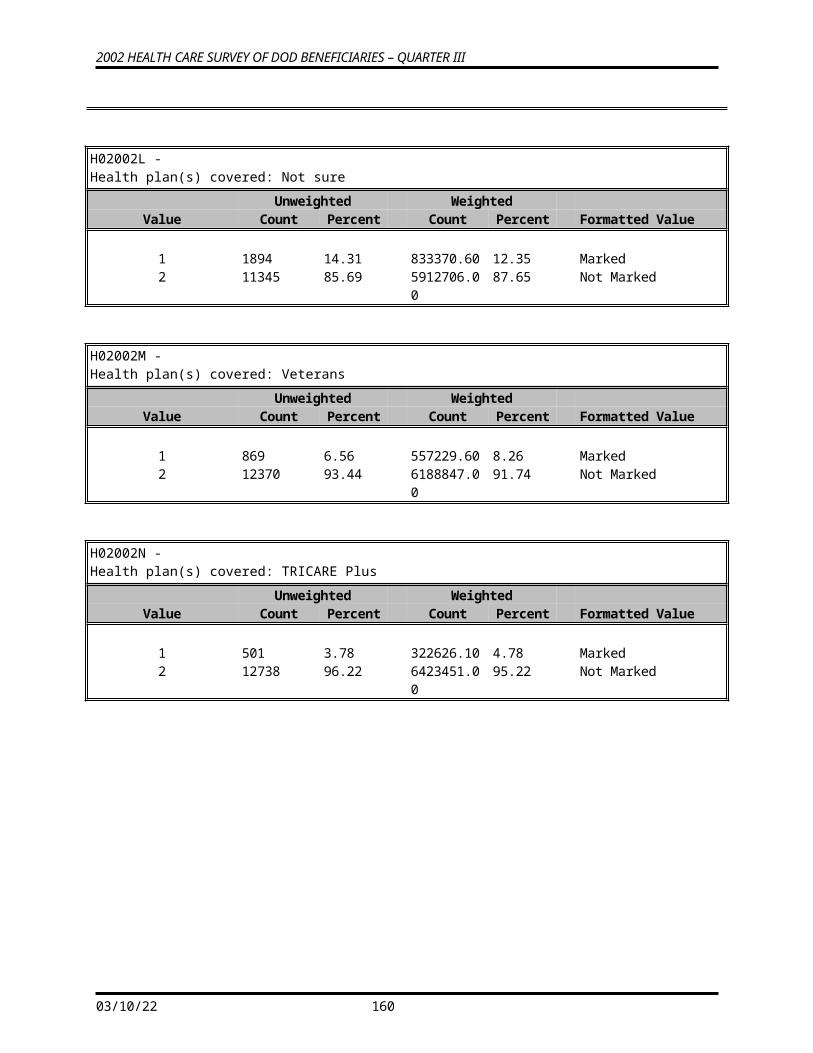
2002 HEALTH CARE SURVEY OF DOD BENEFICIARIES – QUARTER III
S02X02 -Rating of life overall
Unweighted WeightedValue Count Percent Count Percent Formatted Value
. 119 0.90 63776.26 0.95 Did not answerA 40 0.30 27946.58 0.41 Invalid multiple responses0 19 0.14 16304.94 0.24 01 26 0.20 19631.18 0.29 12 54 0.41 37663.65 0.56 23 113 0.85 78437.76 1.16 34 211 1.59 120739.70 1.79 45 709 5.36 382614.30 5.67 56 693 5.23 380242.90 5.64 67 1788 13.51 923076.90 13.68 78 3522 26.60 1737521.00 25.76 89 3343 25.25 1628675.00 24.14 910 2602 19.65 1329447.00 19.71 10
FLAG_FIN -Final Disposition
Unweighted WeightedValue Count Percent Count Percent Formatted Value
1 13239 100.00 6746077.00 100.00 Returned survey
DUPFLAG -Multiple Response Indicator
Unweighted WeightedValue Count Percent Count Percent Formatted Value
NO 13134 99.21 6700247.00 99.32 NOYES 105 0.79 45829.95 0.68 YES
FNSTATUS -Final Status
Unweighted WeightedValue Count Percent Count Percent Formatted Value
11 13239 100.00 6746077.00 100.00 Elig
05/13/23 162
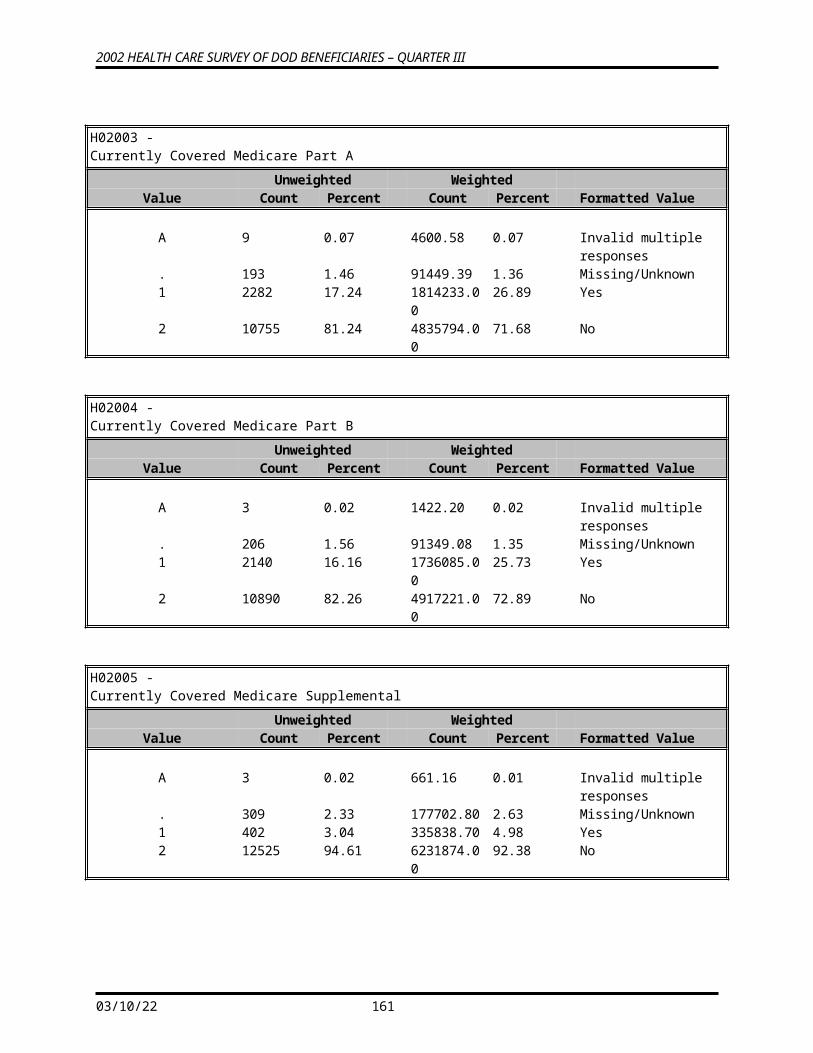
2002 HEALTH CARE SURVEY OF DOD BENEFICIARIES – QUARTER III
KEYCOUNT -Number of Key Questions Answered
Unweighted WeightedValue Count Percent Count Percent Formatted Value
15 8 0.06 4293.73 0.06 1516 14 0.11 6695.31 0.10 1617 6 0.05 4578.08 0.07 1718 23 0.17 13569.46 0.20 1819 37 0.28 31164.54 0.46 1920 85 0.64 47487.53 0.70 2021 74 0.56 45337.01 0.67 2122 35 0.26 23575.03 0.35 2223 63 0.48 35383.97 0.52 2324 118 0.89 74127.65 1.10 2425 233 1.76 153703.70 2.28 2526 391 2.95 214899.10 3.19 2627 904 6.83 474379.30 7.03 2728 2706 20.44 1365782.00 20.25 2829 8542 64.52 4251100.00 63.02 29
N1 -Coding Scheme Note 1
Unweighted WeightedValue Count Percent Count Percent Formatted Value
1 12134 91.65 6072715.00 90.02 12 153 1.16 88274.38 1.31 23 351 2.65 182889.10 2.71 34 113 0.85 63584.04 0.94 45 430 3.25 294018.50 4.36 56 58 0.44 44596.16 0.66 6
N2 -Coding Scheme Note 2
Unweighted WeightedValue Count Percent Count Percent Formatted Value
1 7574 57.21 3441743.00 51.02 12 125 0.94 55815.27 0.83 23 694 5.24 460942.50 6.83 34 4618 34.88 2656103.00 39.37 45 1 0.01 1495.22 0.02 56 221 1.67 128322.40 1.90 67 6 0.05 1655.57 0.02 7
N3 -Coding Scheme Note 3
05/13/23 163
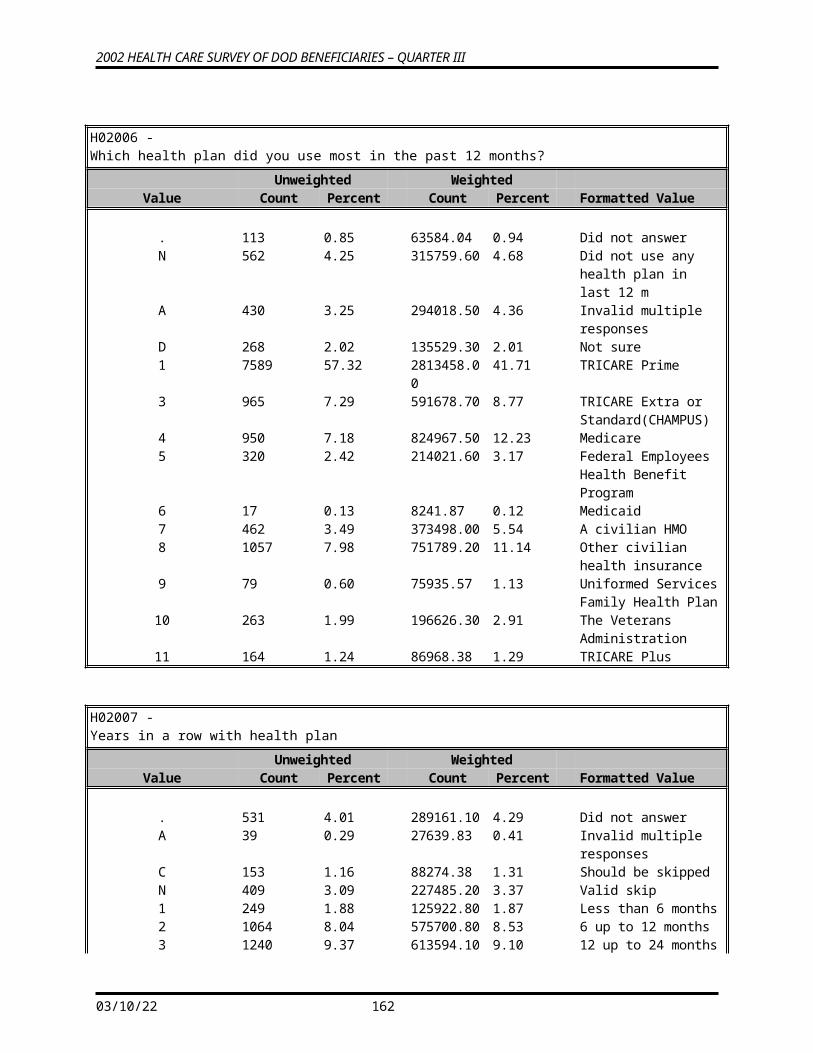
2002 HEALTH CARE SURVEY OF DOD BENEFICIARIES – QUARTER III
Unweighted WeightedValue Count Percent Count Percent Formatted Value
1 7627 57.61 4288159.00 63.57 12 51 0.39 25659.17 0.38 23 619 4.68 265581.90 3.94 34 4753 35.90 2060024.00 30.54 45 188 1.42 106036.50 1.57 56 1 0.01 615.59 0.01 6
N4 -Coding Scheme Note 4
Unweighted WeightedValue Count Percent Count Percent Formatted Value
1 8664 65.44 3424233.00 50.76 12 64 0.48 56043.33 0.83 23 602 4.55 421761.50 6.25 34 3622 27.36 2620130.00 38.84 45 283 2.14 220628.40 3.27 56 4 0.03 3281.44 0.05 6
N5 -Coding Scheme Note 5
Unweighted WeightedValue Count Percent Count Percent Formatted Value
1 3690 27.87 2679454.00 39.72 12 8090 61.11 3225406.00 47.81 23 1459 11.02 841216.10 12.47 3
N6 -Coding Scheme Note 6
Unweighted WeightedValue Count Percent Count Percent Formatted Value
1 6639 50.15 3528209.00 52.30 12 50 0.38 23610.46 0.35 23 408 3.08 208121.40 3.09 34 6001 45.33 2897774.00 42.95 45 1 0.01 2143.87 0.03 56 133 1.00 83399.65 1.24 67 3 0.02 1040.03 0.02 78 4 0.03 1779.00 0.03 8
N7 -Coding Scheme Note 7
05/13/23 164
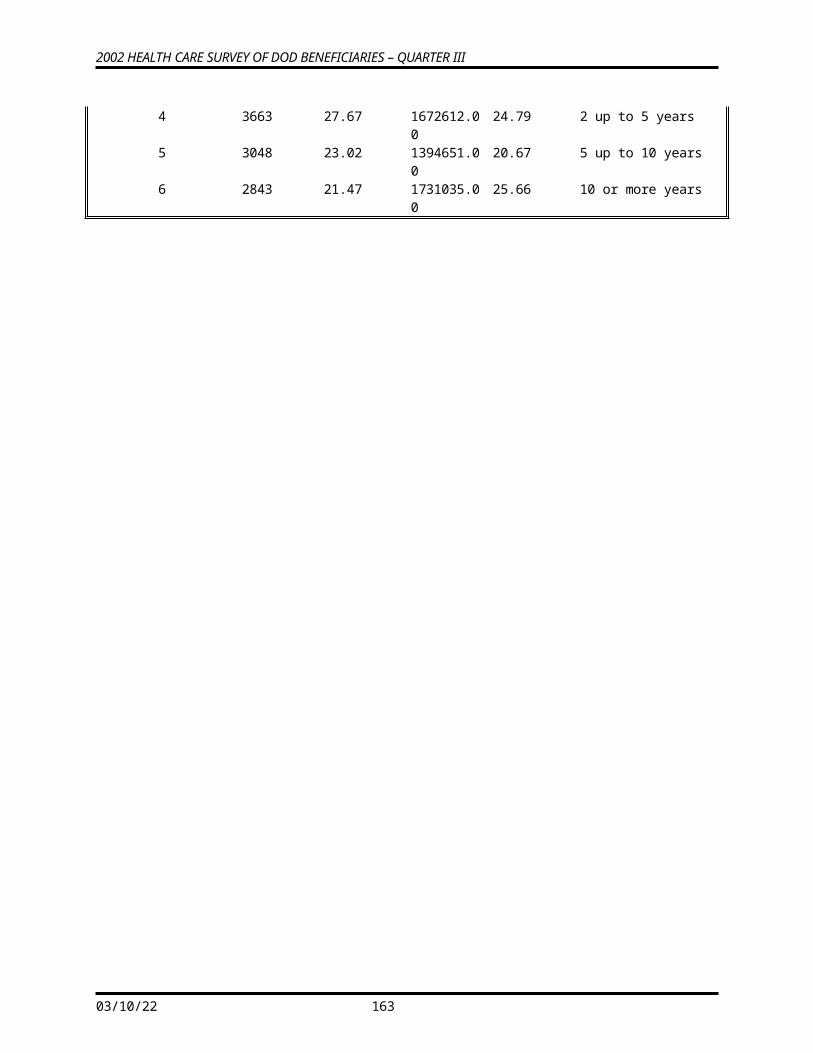
2002 HEALTH CARE SURVEY OF DOD BENEFICIARIES – QUARTER III
Unweighted WeightedValue Count Percent Count Percent Formatted Value
1 6641 50.16 3580217.00 53.07 12 34 0.26 23887.28 0.35 23 494 3.73 302018.90 4.48 34 6034 45.58 2822381.00 41.84 45 34 0.26 16753.95 0.25 56 2 0.02 818.39 0.01 6
N8 -Coding Scheme Note 8
Unweighted WeightedValue Count Percent Count Percent Formatted Value
1 7409 55.96 3783856.00 56.09 12 51 0.39 29621.94 0.44 23 330 2.49 175671.00 2.60 34 5283 39.90 2650978.00 39.30 46 162 1.22 102152.70 1.51 67 2 0.02 1575.76 0.02 78 2 0.02 2221.07 0.03 8
N9 -Coding Scheme Note 9
Unweighted WeightedValue Count Percent Count Percent Formatted Value
1 10343 78.13 5246525.00 77.77 12 35 0.26 18385.41 0.27 23 324 2.45 168521.60 2.50 34 2404 18.16 1228938.00 18.22 45 129 0.97 80814.54 1.20 56 4 0.03 2892.75 0.04 6
05/13/23 165
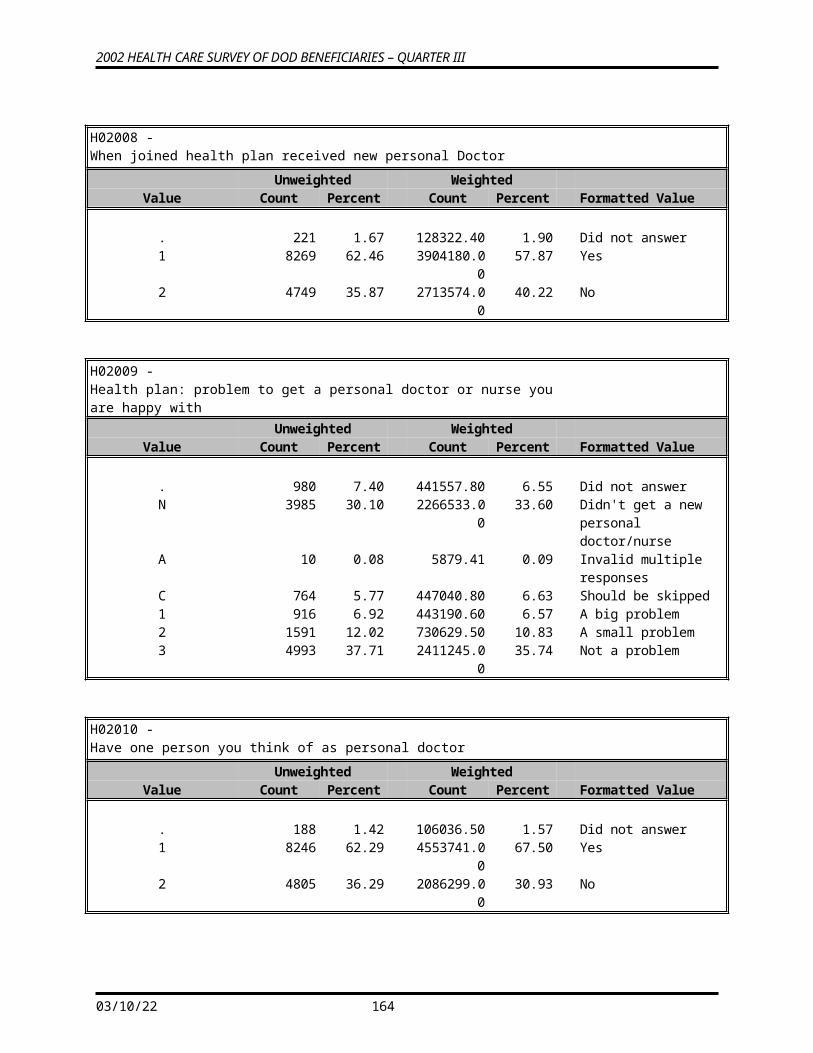
2002 HEALTH CARE SURVEY OF DOD BENEFICIARIES – QUARTER III
N10 -Coding Scheme Note 10
Unweighted WeightedValue Count Percent Count Percent Formatted Value
1 5414 40.89 2719959.00 40.32 12 13 0.10 7892.14 0.12 23 866 6.54 470458.70 6.97 34 6821 51.52 3471627.00 51.46 45 121 0.91 73107.36 1.08 56 4 0.03 3033.53 0.04 6
N11 -Coding Scheme Note 11
Unweighted WeightedValue Count Percent Count Percent Formatted Value
1 1440 10.88 717431.80 10.63 12 448 3.38 235050.90 3.48 23 3 0.02 3757.92 0.06 34 11137 84.12 5657778.00 83.87 45 21 0.16 15987.92 0.24 56 1 0.01 371.36 0.01 67 189 1.43 115698.60 1.72 7
N12 -Coding Scheme Note 12
Unweighted WeightedValue Count Percent Count Percent Formatted Value
1 8368 63.21 4120335.00 61.08 12 183 1.38 90327.37 1.34 23 63 0.48 41499.76 0.62 34 4290 32.40 2285440.00 33.88 45 134 1.01 95167.84 1.41 56 14 0.11 8366.67 0.12 67 186 1.40 104811.90 1.55 78 1 0.01 128.80 0.00 8
05/13/23 166
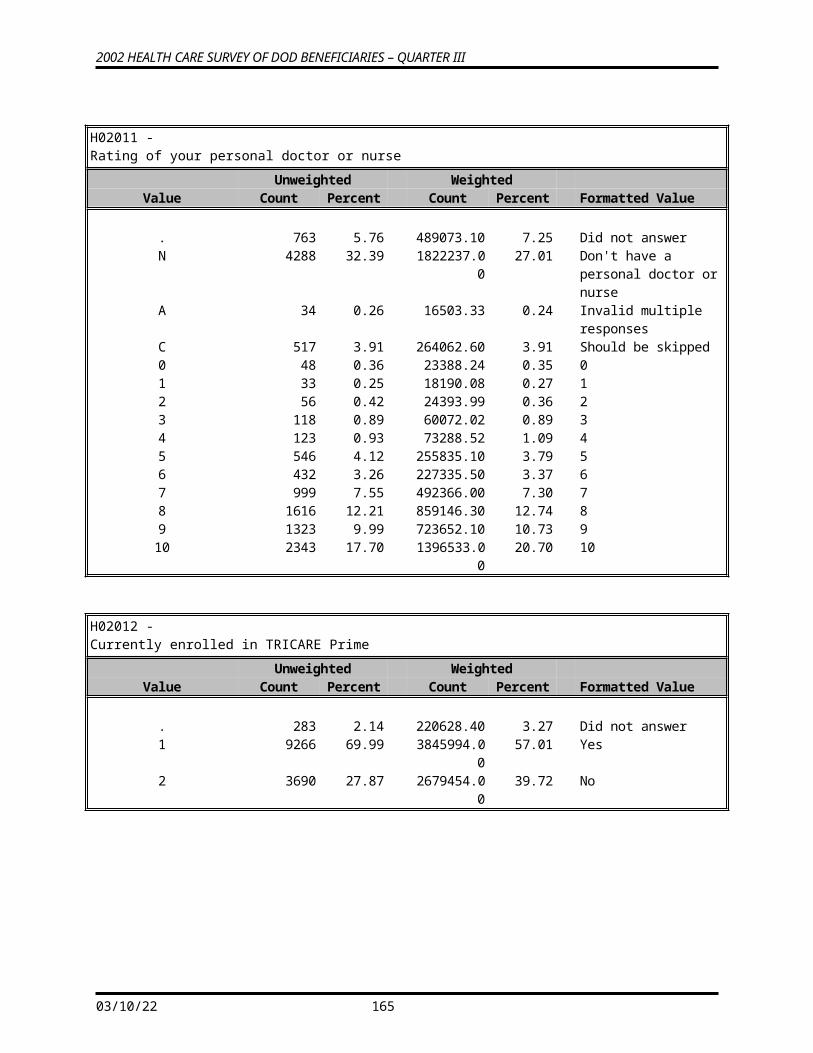
2002 HEALTH CARE SURVEY OF DOD BENEFICIARIES – QUARTER III
N13 -Coding Scheme Note 13
Unweighted WeightedValue Count Percent Count Percent Formatted Value
1 1287 9.72 606686.60 8.99 12 16 0.12 8190.20 0.12 23 917 6.93 543290.80 8.05 34 10913 82.43 5533755.00 82.03 45 104 0.79 50974.52 0.76 56 2 0.02 3179.33 0.05 6
N14 -Coding Scheme Note 14
Unweighted WeightedValue Count Percent Count Percent Formatted Value
1 10719 80.97 5506784.00 81.63 12 1 0.01 334.65 0.00 23 594 4.49 315483.60 4.68 34 1893 14.30 909086.20 13.48 45 30 0.23 13921.87 0.21 56 2 0.02 467.08 0.01 6
N15 -Coding Scheme Note 15
Unweighted WeightedValue Count Percent Count Percent Formatted Value
1 6425 48.53 3647896.00 54.07 12 51 0.39 22268.22 0.33 23 167 1.26 84378.57 1.25 34 1301 9.83 544672.10 8.07 45 4797 36.23 2221450.00 32.93 56 498 3.76 225411.70 3.34 6
05/13/23 167
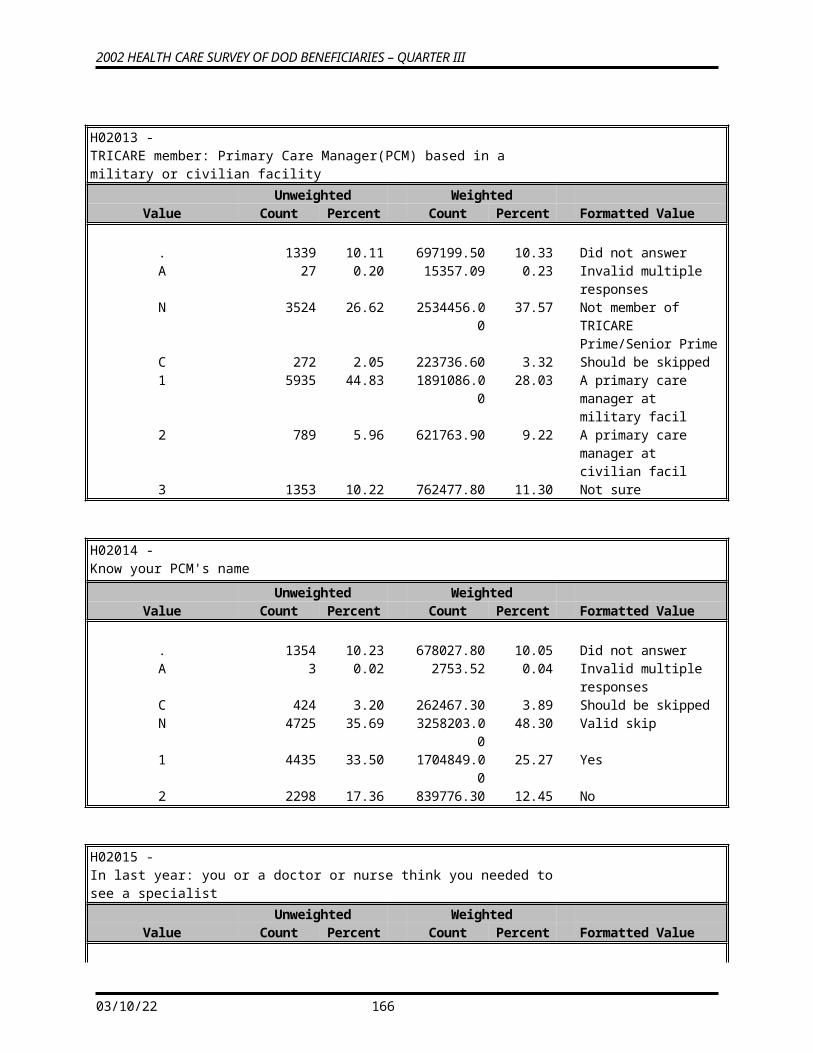
2002 HEALTH CARE SURVEY OF DOD BENEFICIARIES – QUARTER III
N16 -Coding Scheme Note 16
Unweighted WeightedValue Count Percent Count Percent Formatted Value
1 4322 32.65 2342593.00 34.73 12 33 0.25 20781.90 0.31 23 388 2.93 227207.00 3.37 34 8238 62.23 4019682.00 59.59 46 256 1.93 134105.50 1.99 68 2 0.02 1706.98 0.03 8
N17 -Coding Scheme Note 17
Unweighted WeightedValue Count Percent Count Percent Formatted Value
1 4865 36.75 2470647.00 36.62 12 40 0.30 29714.17 0.44 23 418 3.16 252807.90 3.75 34 7768 58.68 3903552.00 57.86 46 145 1.10 87009.16 1.29 67 2 0.02 861.44 0.01 78 1 0.01 1485.20 0.02 8
N18 -Coding Scheme Note 18
Unweighted WeightedValue Count Percent Count Percent Formatted Value
1 1908 14.41 1037950.00 15.39 12 13 0.10 8665.97 0.13 23 320 2.42 188499.60 2.79 34 10860 82.03 5435378.00 80.57 45 138 1.04 75583.41 1.12 5
05/13/23 168
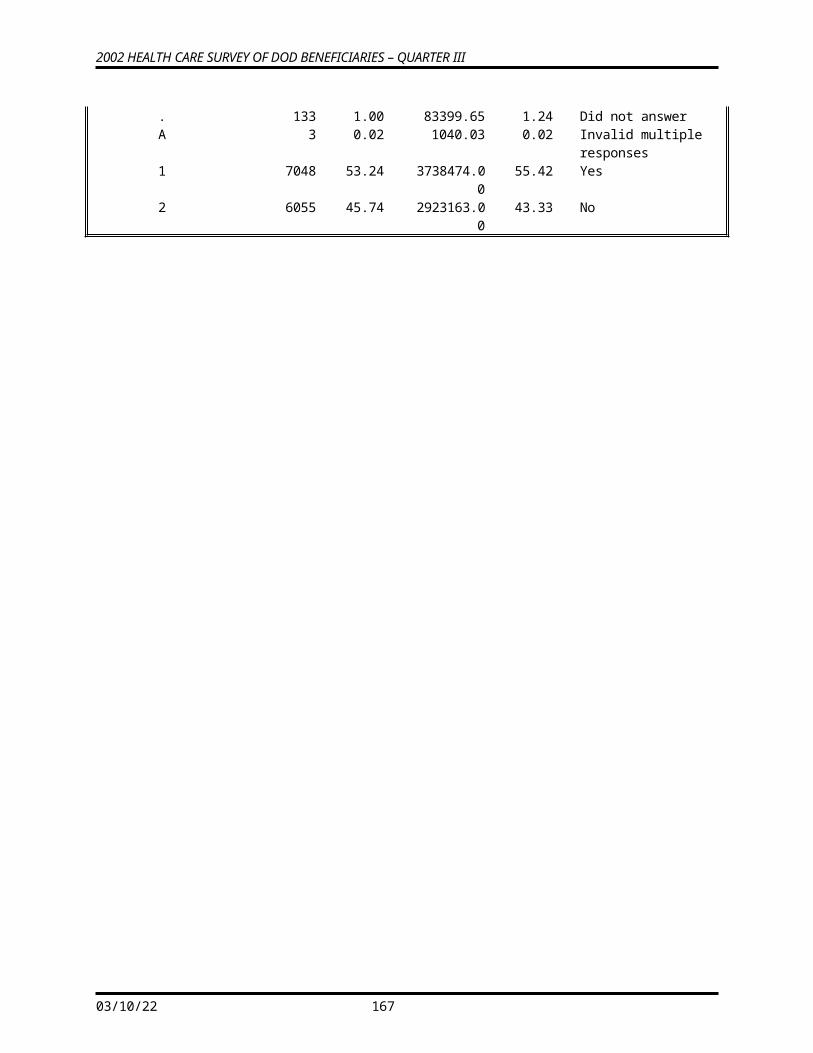
2002 HEALTH CARE SURVEY OF DOD BENEFICIARIES – QUARTER III
N19 -Coding Scheme Note 19
Unweighted WeightedValue Count Percent Count Percent Formatted Value
1 3461 26.14 1673781.00 24.81 12 19 0.14 14536.48 0.22 23 726 5.48 437192.90 6.48 34 8880 67.07 4542916.00 67.34 46 152 1.15 76135.46 1.13 67 1 0.01 1515.62 0.02 7
N24 -Coding Scheme Note 24
Unweighted WeightedValue Count Percent Count Percent Formatted Value
1 249 1.88 115846.80 1.72 12 1943 14.68 1007276.00 14.93 23 871 6.58 508602.80 7.54 34 2328 17.58 1350703.00 20.02 45 343 2.59 165795.50 2.46 56 10 0.08 6822.05 0.10 67 5 0.04 3094.09 0.05 79 120 0.91 75920.68 1.13 910 16 0.12 9908.74 0.15 1011 37 0.28 25784.69 0.38 1112 111 0.84 63733.57 0.94 1213 100 0.76 50395.88 0.75 1314 149 1.13 85717.90 1.27 1415 568 4.29 300880.20 4.46 1517 3 0.02 335.94 0.00 1718 27 0.20 11638.98 0.17 1819 6249 47.20 2898232.00 42.96 1921 1 0.01 361.00 0.01 2122 2 0.02 451.20 0.01 2226 107 0.81 64576.43 0.96 26
05/13/23 169
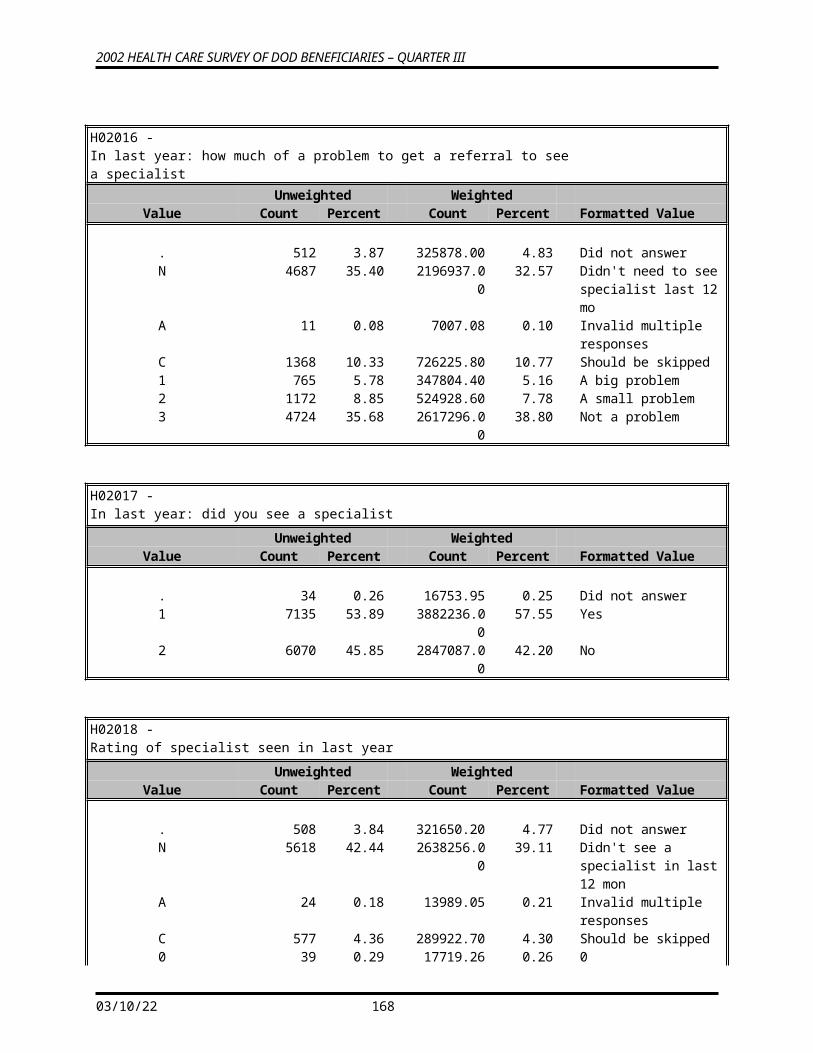
2002 HEALTH CARE SURVEY OF DOD BENEFICIARIES – QUARTER III
N25A -Coding Scheme Note 25A
Unweighted WeightedValue Count Percent Count Percent Formatted Value
1 4 0.03 1485.53 0.02 12 16 0.12 7318.94 0.11 23 7 0.05 6748.05 0.10 34 14 0.11 7339.76 0.11 45 8 0.06 3237.73 0.05 56 138 1.04 75996.24 1.13 69 5611 42.38 2948664.00 43.71 911 16 0.12 12086.98 0.18 1112 697 5.26 423622.90 6.28 1213 31 0.23 23621.80 0.35 1314 6274 47.39 3041568.00 45.09 1415 3 0.02 2993.74 0.04 1516 22 0.17 7724.24 0.11 1617 393 2.97 181561.70 2.69 1718 5 0.04 2107.65 0.03 18
N25B -Coding Scheme Note 25B
Unweighted WeightedValue Count Percent Count Percent Formatted Value
1 6387 48.24 3428315.00 50.82 12 419 3.16 190771.40 2.83 23 6433 48.59 3126990.00 46.35 3
N25C -Coding Scheme Note 25C
Unweighted WeightedValue Count Percent Count Percent Formatted Value
1 5665 42.79 2985140.00 44.25 12 722 5.45 443174.50 6.57 23 6852 51.76 3317762.00 49.18 3
05/13/23 170
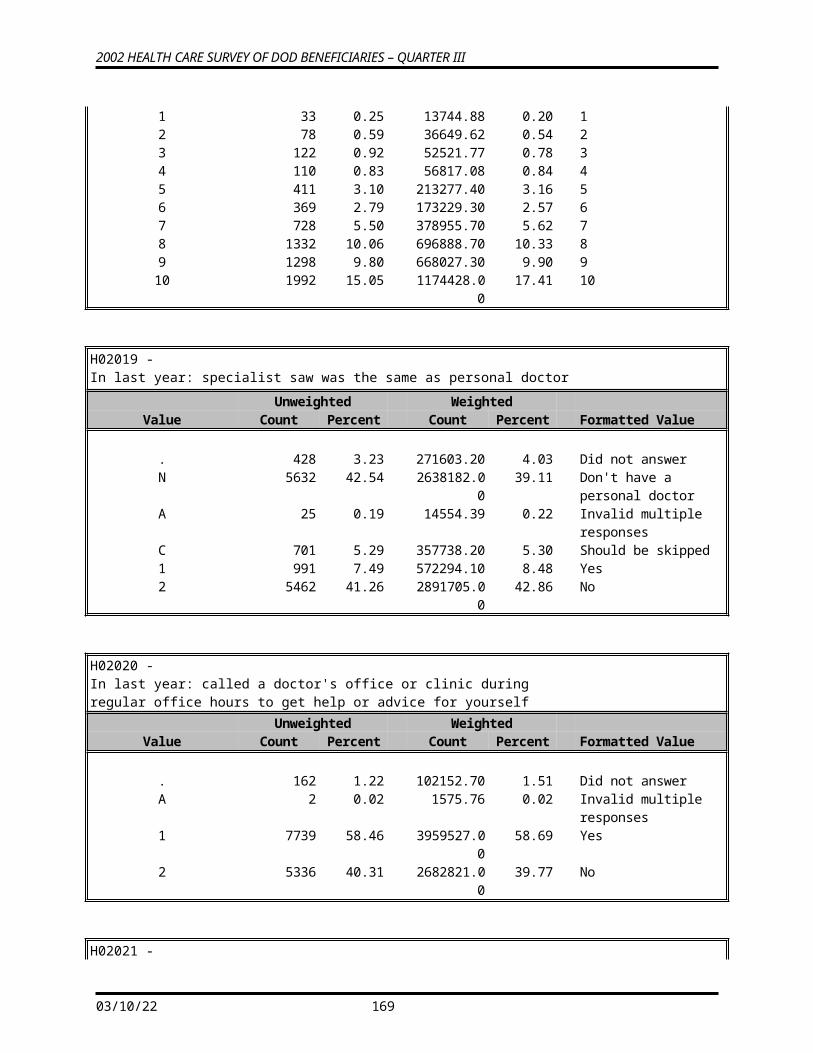
2002 HEALTH CARE SURVEY OF DOD BENEFICIARIES – QUARTER III
N26 -Coding Scheme Note 26
Unweighted WeightedValue Count Percent Count Percent Formatted Value
1 6387 48.24 3428315.00 50.82 12 3874 29.26 2241031.00 33.22 23 2842 21.47 1009526.00 14.96 34 4 0.03 1384.18 0.02 46 83 0.63 43746.80 0.65 67 12 0.09 2964.07 0.04 78 37 0.28 19109.88 0.28 8
N27 -Coding Scheme Note 27
Unweighted WeightedValue Count Percent Count Percent Formatted Value
1 6387 48.24 3428315.00 50.82 12 230 1.74 80616.16 1.20 23 437 3.30 167350.80 2.48 34 5988 45.23 2942597.00 43.62 45 1 0.01 329.21 0.00 56 185 1.40 119093.10 1.77 67 11 0.08 7775.38 0.12 7
MISS_1 -Count of: Violates Skip Pattern
Unweighted WeightedValue Count Percent Count Percent Formatted Value
0 13239 100.00 6746077.00 100.00 0 times
MISS_4 -Count of: Incomplete grid error
Unweighted WeightedValue Count Percent Count Percent Formatted Value
0 13239 100.00 6746077.00 100.00 0 times
05/13/23 171
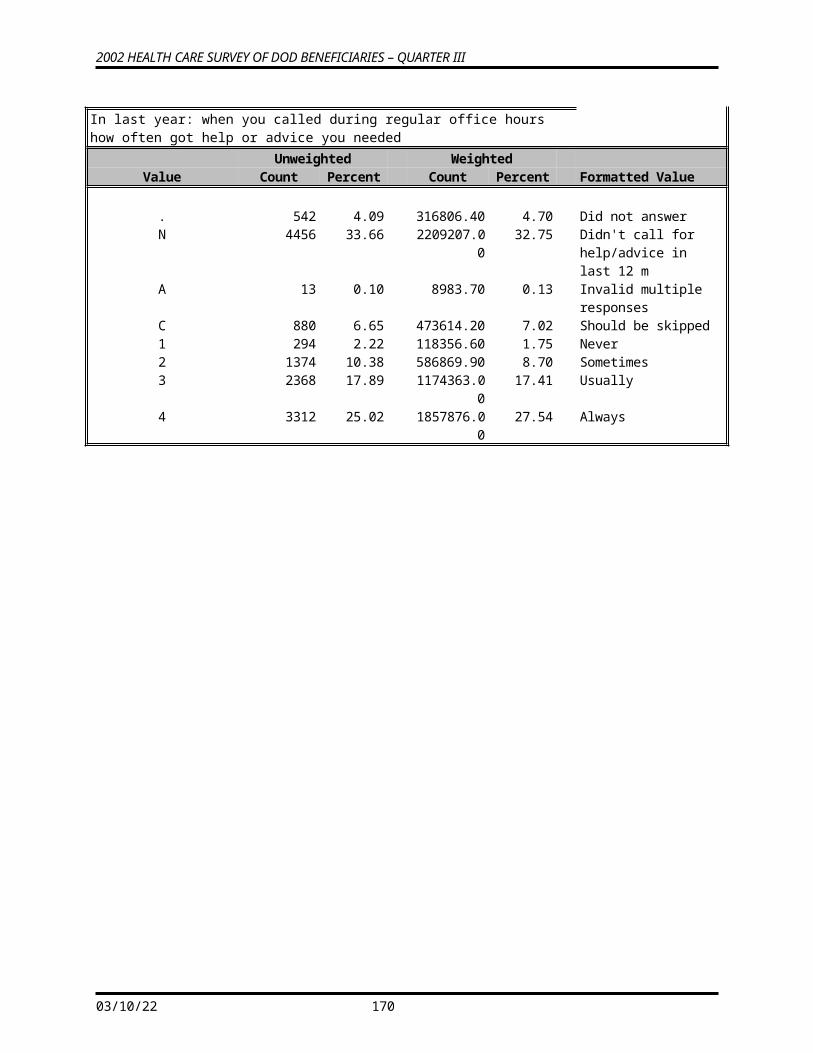
2002 HEALTH CARE SURVEY OF DOD BENEFICIARIES – QUARTER III
MISS_5 -Count of: Scalable response of Don't know
Unweighted WeightedValue Count Percent Count Percent Formatted Value
0 8074 60.99 4202009.00 62.29 0 times1 3303 24.95 1621241.00 24.03 1 time2 1161 8.77 582447.80 8.63 2 times3 436 3.29 223383.60 3.31 3 times4 174 1.31 75556.58 1.12 4 times5 63 0.48 29628.44 0.44 5 times6 19 0.14 5421.34 0.08 6 times7 8 0.06 5853.44 0.09 7 times8 1 0.01 536.00 0.01 8 times
MISS_6 -Count of: Not applicable - valid skip
Unweighted WeightedValue Count Percent Count Percent Formatted Value
0 5365 40.52 2271668.00 33.67 0 times1 3488 26.35 1967902.00 29.17 1 time2 1504 11.36 890196.20 13.20 2 times3 931 7.03 531984.70 7.89 3 times4 521 3.94 293089.20 4.34 4 times5 319 2.41 176900.80 2.62 5 times6 203 1.53 111237.70 1.65 6 times7 153 1.16 101707.70 1.51 7 times8 97 0.73 50372.64 0.75 8 times9 92 0.69 40718.58 0.60 9 times10 91 0.69 38853.89 0.58 10 times11 100 0.76 55808.61 0.83 11 times12 60 0.45 45159.63 0.67 12 times13 54 0.41 30217.30 0.45 13 times14 51 0.39 22084.49 0.33 14 times15 40 0.30 20510.15 0.30 15 times16 25 0.19 19805.31 0.29 16 times17 28 0.21 11326.97 0.17 17 times18 24 0.18 16795.76 0.25 18 times19 16 0.12 11449.57 0.17 19 times20 15 0.11 9419.61 0.14 20 times21 10 0.08 3903.78 0.06 21 times22 8 0.06 3235.02 0.05 22 times23 9 0.07 5948.07 0.09 23 times24 6 0.05 3463.02 0.05 24 times25 6 0.05 1549.43 0.02 25 times26 4 0.03 633.36 0.01 26 times27 4 0.03 1167.26 0.02 27 times28 5 0.04 6066.50 0.09 28 times29 2 0.02 1176.65 0.02 29 times30 2 0.02 295.96 0.00 30 times31 6 0.05 1429.11 0.02 31 times
05/13/23 172
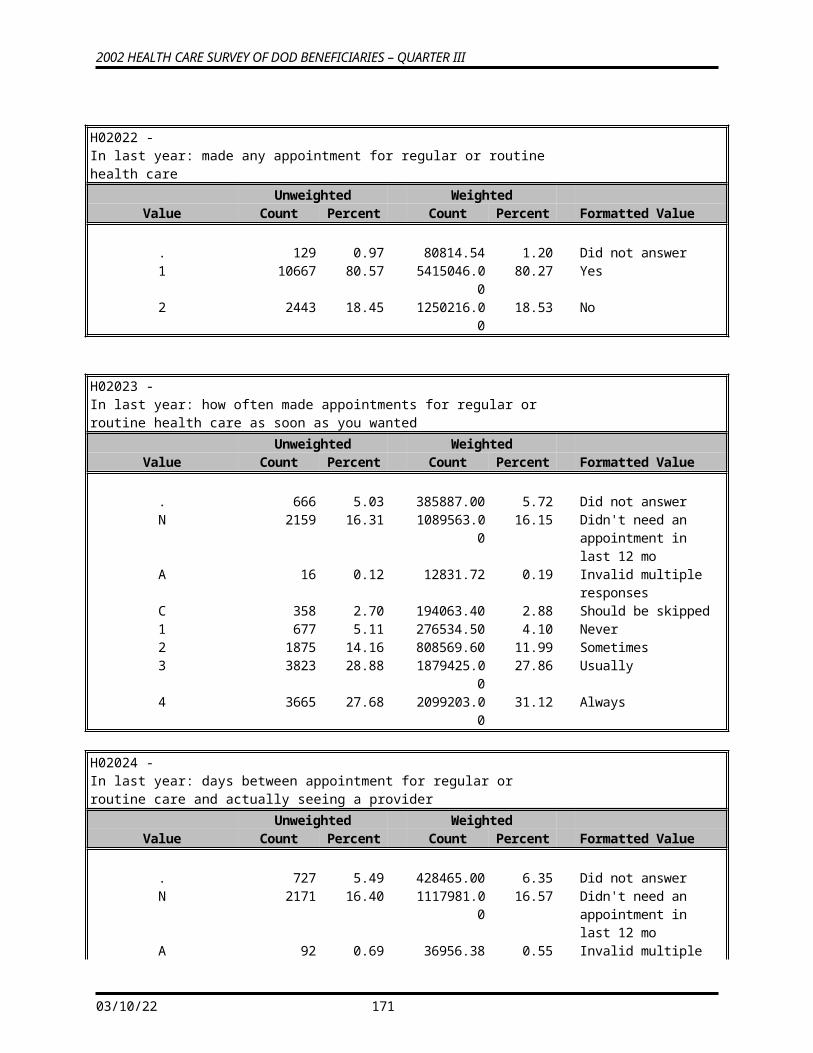
2002 HEALTH CARE SURVEY OF DOD BENEFICIARIES – QUARTER III
MISS_7 -Count of: Out-of-range error
Unweighted WeightedValue Count Percent Count Percent Formatted Value
0 13239 100.00 6746077.00 100.00 0 times
MISS_8 -Count of: Multiple response error
Unweighted WeightedValue Count Percent Count Percent Formatted Value
0 11596 87.59 5782380.00 85.71 0 times1 1301 9.83 762117.90 11.30 1 time2 241 1.82 138794.40 2.06 2 times3 57 0.43 33644.22 0.50 3 times4 22 0.17 14775.48 0.22 4 times5 8 0.06 6247.60 0.09 5 times6 3 0.02 2702.57 0.04 6 times7 5 0.04 2869.59 0.04 7 times8 2 0.02 1066.91 0.02 8 times10 1 0.01 199.11 0.00 10 times11 1 0.01 345.50 0.01 11 times12 1 0.01 777.47 0.01 12 times26 1 0.01 155.79 0.00 26 times
05/13/23 173
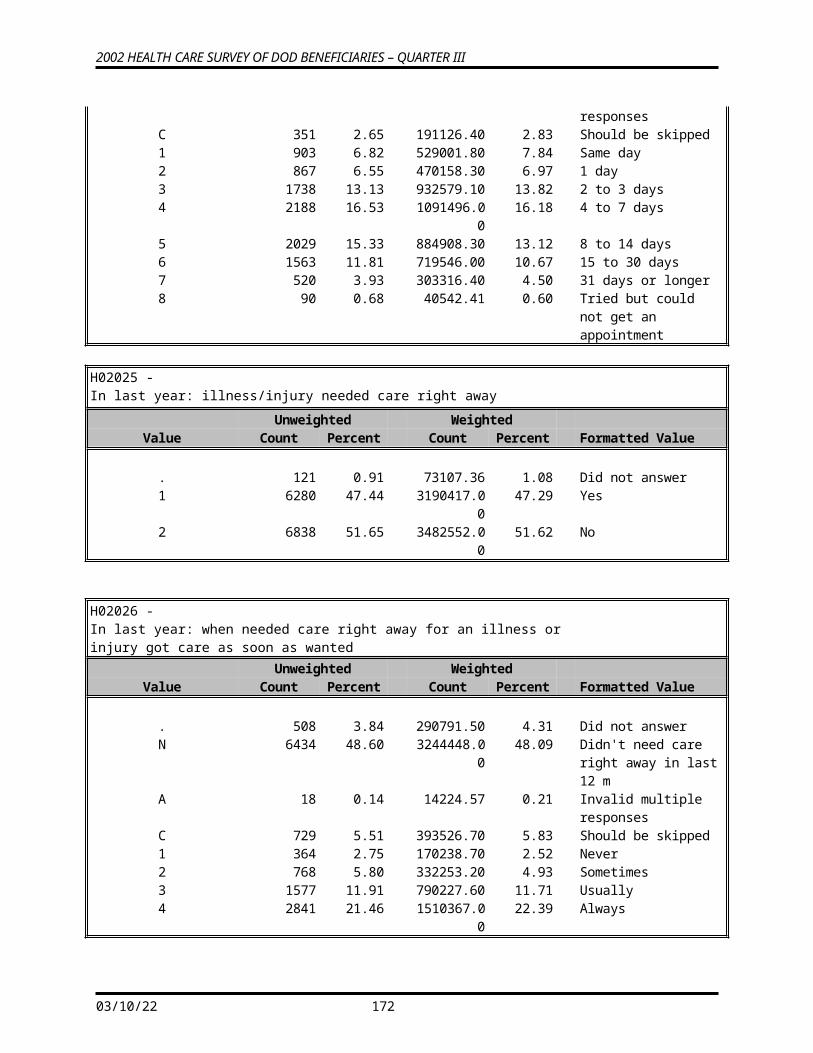
2002 HEALTH CARE SURVEY OF DOD BENEFICIARIES – QUARTER III
MISS_9 -Count of: No response - invalid skip
Unweighted WeightedValue Count Percent Count Percent Formatted Value
0 2 0.02 249.83 0.00 0 times1 4 0.03 1143.21 0.02 1 time2 12 0.09 6211.53 0.09 2 times3 22 0.17 13359.83 0.20 3 times4 35 0.26 18989.43 0.28 4 times5 52 0.39 25238.14 0.37 5 times6 83 0.63 34955.23 0.52 6 times7 84 0.63 39517.51 0.59 7 times8 155 1.17 64413.19 0.95 8 times9 211 1.59 105659.40 1.57 9 times10 282 2.13 131018.40 1.94 10 times11 332 2.51 161415.90 2.39 11 times12 417 3.15 215919.80 3.20 12 times13 492 3.72 279793.80 4.15 13 times14 621 4.69 312687.70 4.64 14 times15 642 4.85 312562.00 4.63 15 times16 774 5.85 431535.70 6.40 16 times17 731 5.52 383306.10 5.68 17 times18 747 5.64 385623.20 5.72 18 times19 803 6.07 434104.00 6.43 19 times20 754 5.70 370064.80 5.49 20 times21 731 5.52 347547.00 5.15 21 times22 633 4.78 348992.10 5.17 22 times23 634 4.79 309186.30 4.58 23 times24 551 4.16 273928.20 4.06 24 times25 460 3.47 219929.30 3.26 25 times26 383 2.89 194784.00 2.89 26 times27 296 2.24 149044.50 2.21 27 times28 283 2.14 146305.90 2.17 28 times29 239 1.81 111111.30 1.65 29 times30 206 1.56 109435.20 1.62 30 times31 170 1.28 87973.83 1.30 31 times32 143 1.08 66316.55 0.98 32 times33 107 0.81 66721.74 0.99 33 times34 112 0.85 58384.72 0.87 34 times35 89 0.67 41418.65 0.61 35 times36 96 0.73 46295.66 0.69 36 times37 97 0.73 48422.90 0.72 37 times38 105 0.79 57031.98 0.85 38 times39 96 0.73 42396.30 0.63 39 times
40 -- 70 553 4.18 293081.90 4.34 40 or more times
05/13/23 174
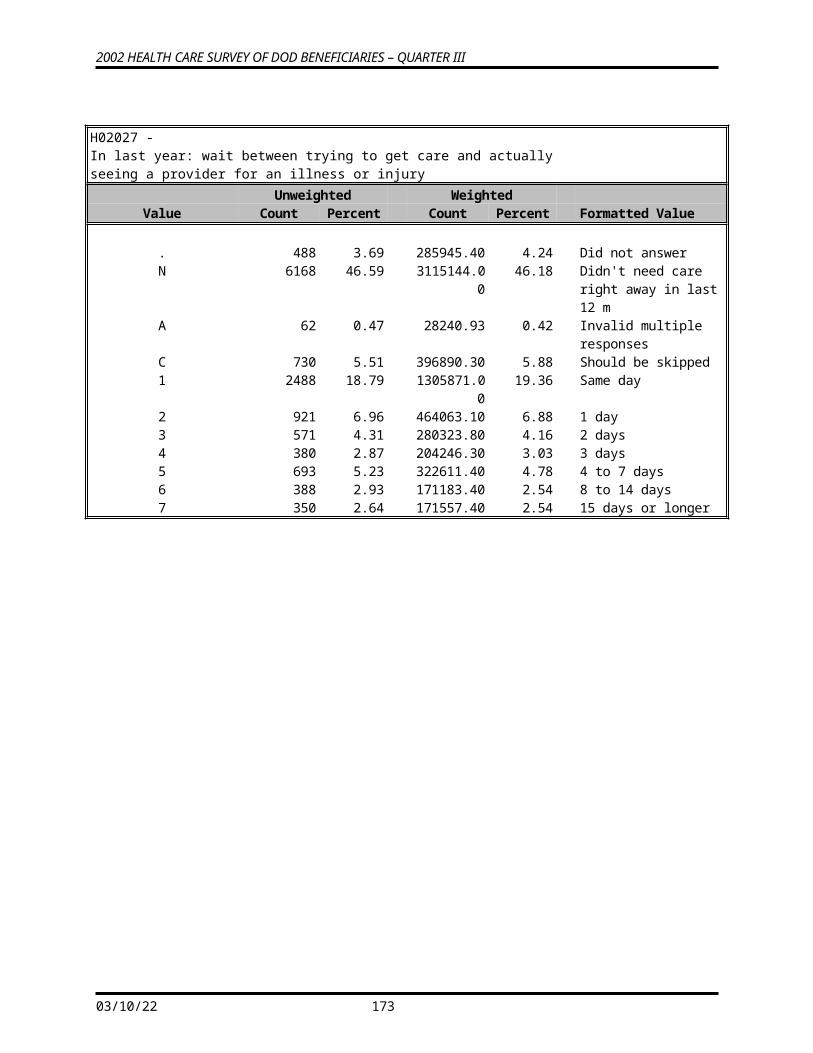
2002 HEALTH CARE SURVEY OF DOD BENEFICIARIES – QUARTER III
MISS_TOT -Total number of missing responses
Unweighted WeightedValue Count Percent Count Percent Formatted Value
1 1 0.01 161.93 0.00 1 time3 1 0.01 316.76 0.00 3 times4 3 0.02 654.35 0.01 4 times5 9 0.07 4208.25 0.06 5 times6 24 0.18 8228.20 0.12 6 times7 36 0.27 15170.28 0.22 7 times8 64 0.48 25226.24 0.37 8 times9 102 0.77 41639.44 0.62 9 times10 129 0.97 55583.84 0.82 10 times11 206 1.56 94047.61 1.39 11 times12 266 2.01 119287.90 1.77 12 times13 315 2.38 153255.40 2.27 13 times14 412 3.11 202282.10 3.00 14 times15 520 3.93 265862.20 3.94 15 times16 589 4.45 331336.70 4.91 16 times17 654 4.94 351854.20 5.22 17 times18 706 5.33 370699.00 5.50 18 times19 703 5.31 368496.60 5.46 19 times20 783 5.91 375538.40 5.57 20 times21 790 5.97 395979.30 5.87 21 times22 785 5.93 391126.70 5.80 22 times23 709 5.36 370461.90 5.49 23 times24 618 4.67 300010.00 4.45 24 times25 585 4.42 290615.80 4.31 25 times26 535 4.04 266637.30 3.95 26 times27 418 3.16 220014.10 3.26 27 times28 360 2.72 193905.20 2.87 28 times29 305 2.30 155471.10 2.30 29 times30 264 1.99 142976.80 2.12 30 times31 218 1.65 126835.20 1.88 31 times32 172 1.30 95159.15 1.41 32 times33 149 1.13 67762.83 1.00 33 times34 139 1.05 72896.01 1.08 34 times35 120 0.91 62524.14 0.93 35 times36 121 0.91 58940.08 0.87 36 times37 107 0.81 49874.31 0.74 37 times38 110 0.83 49474.32 0.73 38 times39 148 1.12 72560.22 1.08 39 times
40 -- 72 1063 8.03 579003.10 8.58 40 or more times
05/13/23 175
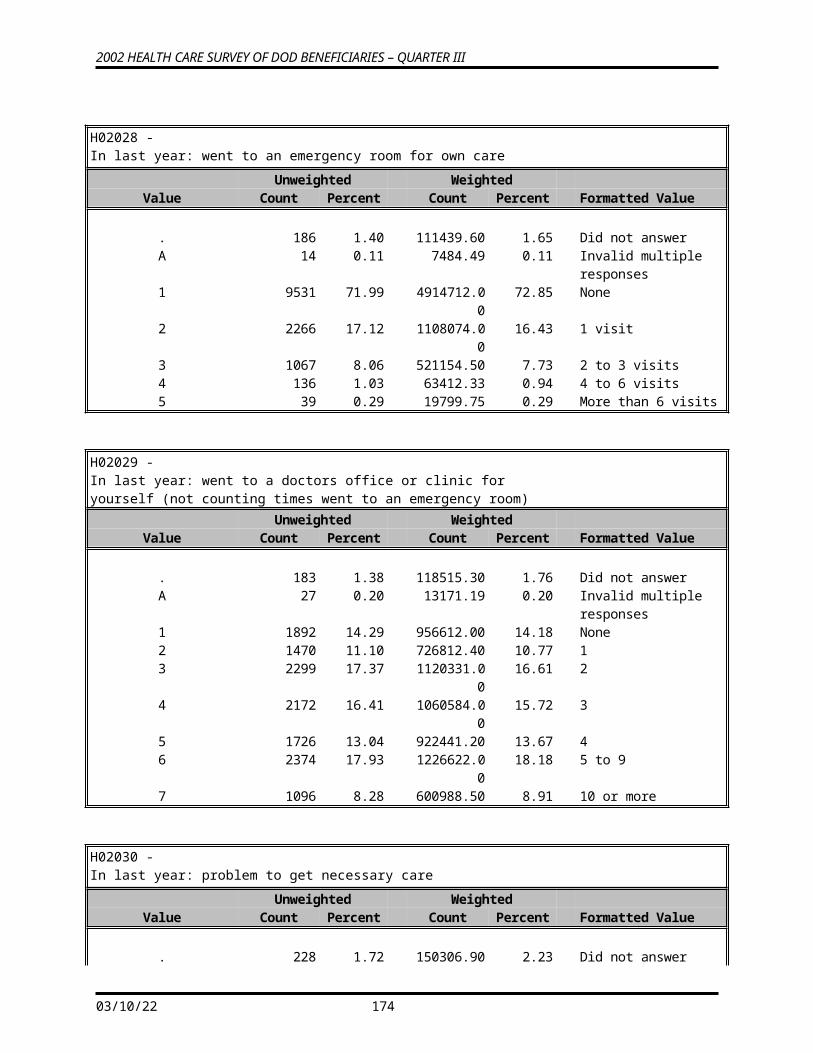
2002 HEALTH CARE SURVEY OF DOD BENEFICIARIES – QUARTER III
XENRLLMT -Enrollment in TRICARE Prime
Unweighted WeightedValue Count Percent Count Percent Formatted Value
. 94 0.71 43850.98 0.65 Missing/Unknown1 3945 29.80 1679865.00 24.90 Active Duty - under 652 4436 33.51 1512791.00 22.42 Enrolled - under 653 2799 21.14 1854487.00 27.49 Not enrolled - under 654 1965 14.84 1655083.00 24.53 Not enrolled - 65 or over
XENR_PCM -Enrollment by PCM type
Unweighted WeightedValue Count Percent Count Percent Formatted Value
. 94 0.71 43850.98 0.65 Missing/Unknown1 3945 29.80 1679865.00 24.90 Active Duty - under 652 4013 30.31 1148467.00 17.02 Enrolled - under 653 423 3.20 364324.60 5.40 Enrolled - under 654 2799 21.14 1854487.00 27.49 Not enrolled - under 655 1965 14.84 1655083.00 24.53 Not enrolled - 65 or over
XINS_COV -Insurance Coverage
Unweighted WeightedValue Count Percent Count Percent Formatted Value
. 615 4.65 340464.10 5.05 Missing/Unknown1 3945 29.80 1679865.00 24.90 Prime-under 65 Active
Duty2 4216 31.85 1433345.00 21.25 Prime-under 65 Non-
active Duty3 783 5.91 498333.30 7.39 Standard/Extra4 1458 11.01 1191322.00 17.66 Medicare5 1824 13.78 1339868.00 19.86 Other Insurance7 144 1.09 74682.81 1.11 TRICARE Plus8 254 1.92 188197.30 2.79 Veterans Administration
(VA)
05/13/23 176
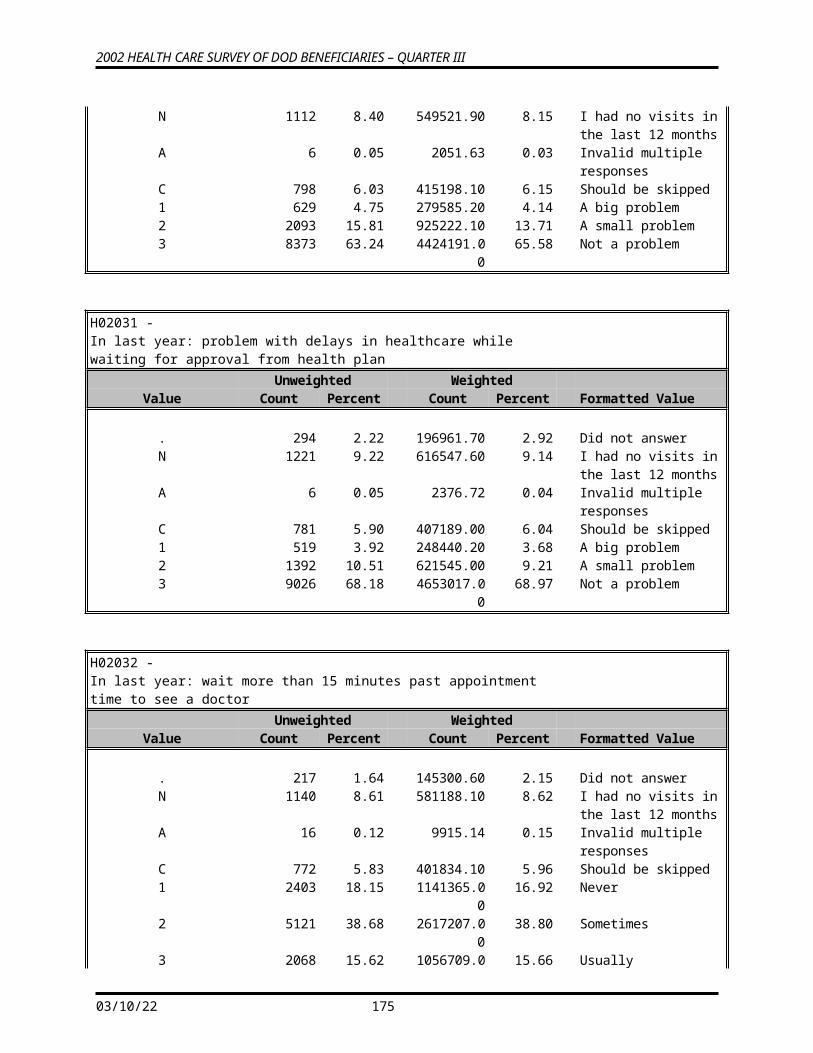
2002 HEALTH CARE SURVEY OF DOD BENEFICIARIES – QUARTER III
XQENROLL -Enrollment according to questionnaire response
Unweighted WeightedValue Count Percent Count Percent Formatted Value
. 1613 12.18 1026533.00 15.22 Missing/Unknown1 3945 29.80 1679865.00 24.90 Active Duty - under 652 3600 27.19 1025238.00 15.20 Enrolled - under 653 533 4.03 391326.60 5.80 Enrolled - under 654 2318 17.51 1599911.00 23.72 Not enrolled - under 655 1230 9.29 1023203.00 15.17 Not enrolled - 65 or over
XREGION -Region
Unweighted WeightedValue Count Percent Count Percent Formatted Value
. 10 0.08 37914.52 0.56 Missing data1 1812 13.69 874944.60 12.97 Northeast2 1042 7.87 680099.50 10.08 Mid-Atlantic3 1590 12.01 866891.20 12.85 Southeast4 1079 8.15 470226.40 6.97 Gulfsouth5 821 6.20 545956.50 8.09 Heartland6 1620 12.24 793793.50 11.77 Southwest7 794 6.00 329256.40 4.88 Central 78 1287 9.72 561702.30 8.33 Central 89 692 5.23 489115.70 7.25 Southern California10 343 2.59 220609.00 3.27 Golden Gate11 554 4.18 305146.00 4.52 Northwest12 366 2.76 111127.70 1.65 Hawaii13 518 3.91 207605.70 3.08 Europe14 433 3.27 136425.10 2.02 Western Pacific
Command15 86 0.65 68471.90 1.01 TRICARE Latin America16 192 1.45 46790.78 0.69 Alaska
CONUS -CONUS/OCONUS Indicator
Unweighted WeightedValue Count Percent Count Percent Formatted Value
. 10 0.08 37914.52 0.56 Invld/Missng Add0 1037 7.83 412502.70 6.11 Not in CONUS1 12192 92.09 6295660.00 93.32 In CONUS
05/13/23 177
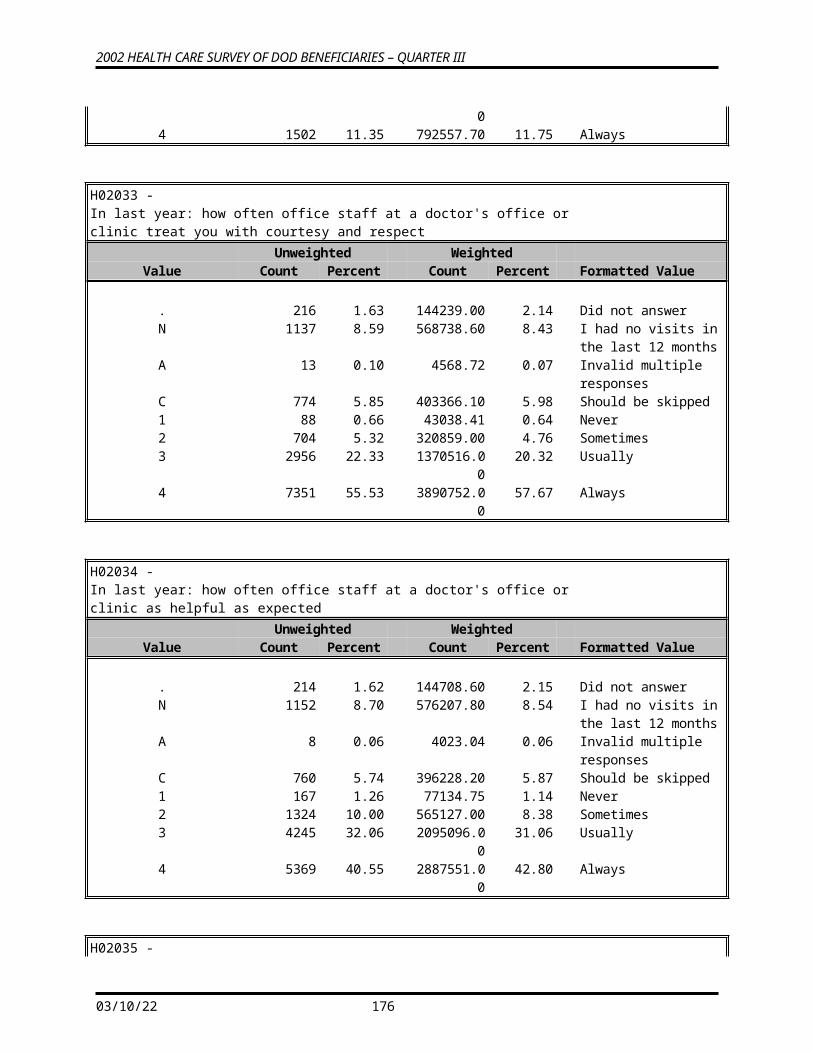
2002 HEALTH CARE SURVEY OF DOD BENEFICIARIES – QUARTER III
OUTCATCH -Out of Catchment Area Indicator
Unweighted WeightedValue Count Percent Count Percent Formatted Value
0 11636 87.89 4003175.00 59.34 Catchment areas1 1603 12.11 2742902.00 40.66 Out of catchment areas
XSEXA -Male or Female (Recode)
Unweighted WeightedValue Count Percent Count Percent Formatted Value
1 6387 48.24 3428315.00 50.82 Male2 6852 51.76 3317762.00 49.18 Female
XBNFGRP -Constructed Beneficiary Group
Unweighted WeightedValue Count Percent Count Percent Formatted Value
. 26 0.20 6141.33 0.09 Missing/Unknown1 3827 28.91 1619428.00 24.01 Active Duty2 3154 23.82 970179.40 14.38 Family of Active3 4267 32.23 2495245.00 36.99 Ret/Surv/Fam <654 1965 14.84 1655083.00 24.53 Ret/Surv/Fam 65+
KDISENRL -Intention to disenroll
Unweighted WeightedValue Count Percent Count Percent Formatted Value
. 4059 30.66 2921810.00 43.31 Missing/Unknown/NA1 514 3.88 212536.30 3.15 Yes2 8666 65.46 3611731.00 53.54 No
05/13/23 178
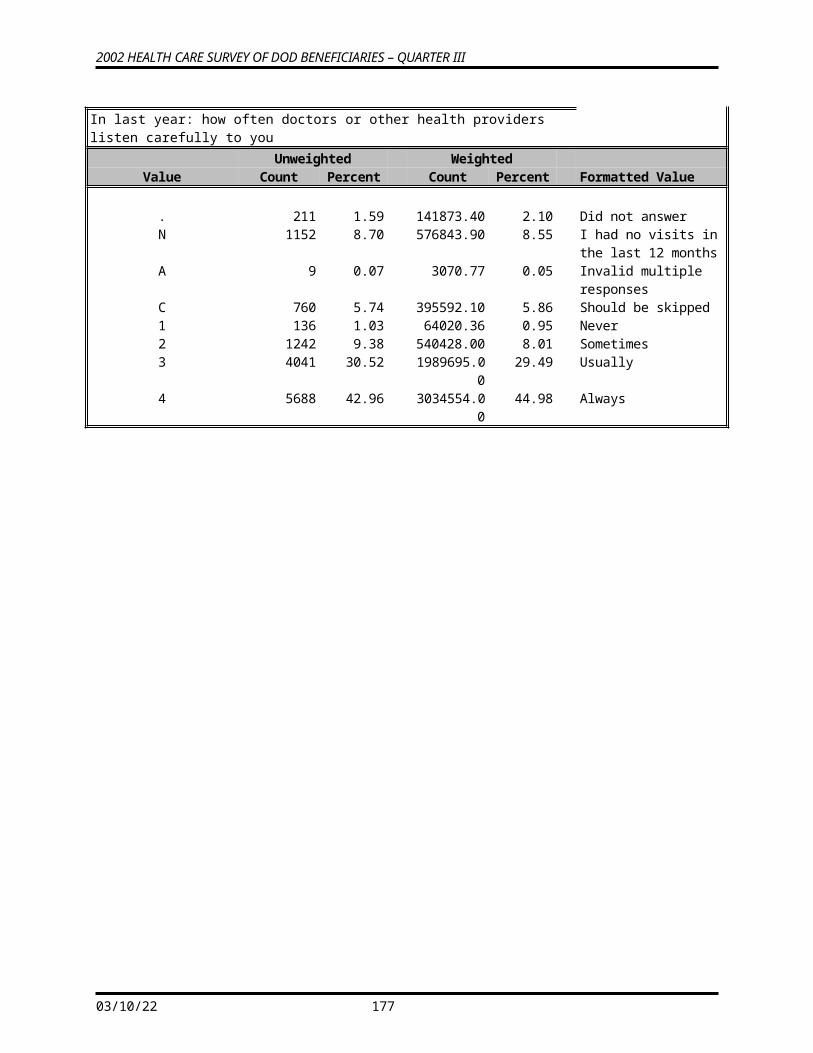
2002 HEALTH CARE SURVEY OF DOD BENEFICIARIES – QUARTER III
KMILOFFC -Office wait of 15 min or more at Military facility
Unweighted WeightedValue Count Percent Count Percent Formatted Value
. 6685 50.49 4482811.00 66.45 Missing/Unknown/NA1 1991 15.04 721835.30 10.70 Yes2 4563 34.47 1541430.00 22.85 No
KCIVOFFC -Office wait of 15 min or more at Civilian facility
Unweighted WeightedValue Count Percent Count Percent Formatted Value
. 8970 67.75 3585616.00 53.15 Missing/Unknown/NA1 1470 11.10 1044818.00 15.49 Yes2 2799 21.14 2115643.00 31.36 No
KBGPRB1 -Big problem getting referrals to specialist
Unweighted WeightedValue Count Percent Count Percent Formatted Value
. 6578 49.69 3256048.00 48.27 Missing/Unknown/NA1 765 5.78 347804.40 5.16 Yes2 5896 44.54 3142224.00 46.58 No
KBGPRB2 -Big problem getting necessary care
Unweighted WeightedValue Count Percent Count Percent Formatted Value
. 2144 16.19 1117078.00 16.56 Missing/Unknown/NA1 629 4.75 279585.20 4.14 Yes2 10466 79.05 5349413.00 79.30 No
05/13/23 179
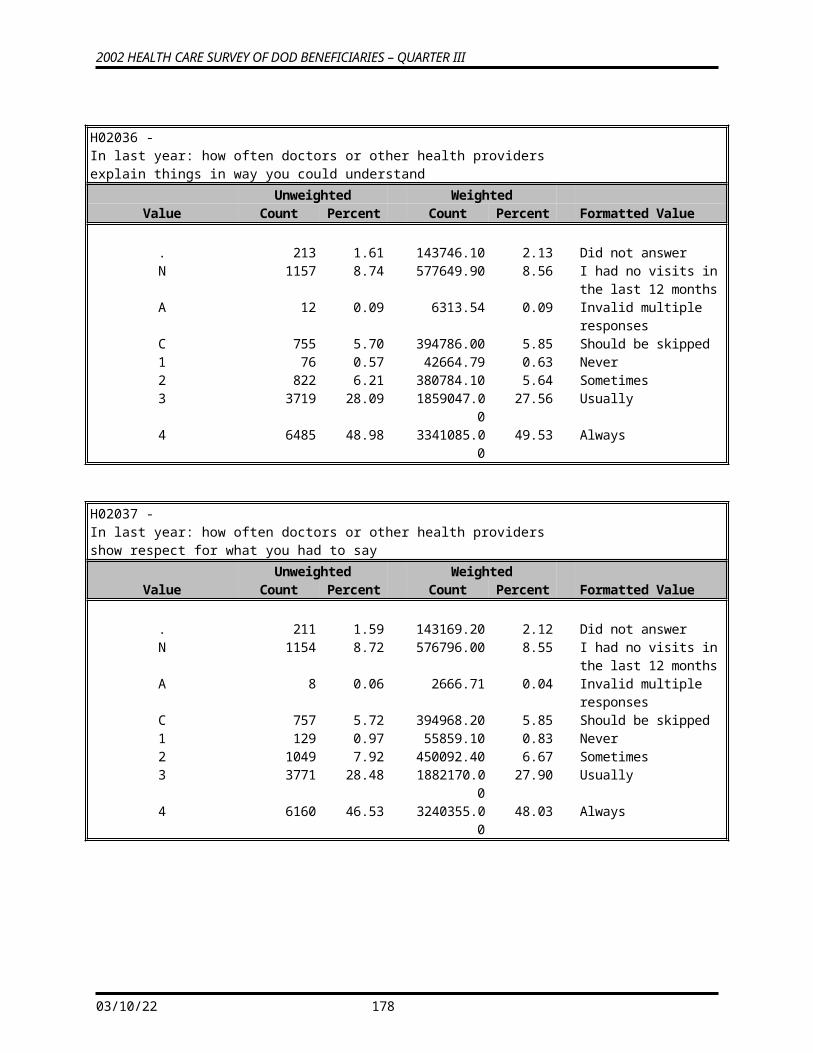
2002 HEALTH CARE SURVEY OF DOD BENEFICIARIES – QUARTER III
KMILOPQY -Outpatient visits to Military facility
Unweighted WeightedValue Count Percent Count Percent Formatted Value
A 19 0.14 7221.33 0.11 Mult response. 256 1.93 130864.50 1.94 No response1 6396 48.31 4340460.00 64.34 None2 911 6.88 299028.70 4.43 1 visit3 1441 10.88 493003.70 7.31 2 visits4 1381 10.43 469095.10 6.95 3 visits5 989 7.47 343062.40 5.09 4 visits6 1317 9.95 463920.10 6.88 5 to 9 visits7 529 4.00 199420.60 2.96 10 or more visits
KCIVOPQY -Outpatient visits to Civilian facility
Unweighted WeightedValue Count Percent Count Percent Formatted Value
A 7 0.05 5328.86 0.08 Mult response. 289 2.18 183967.60 2.73 No response1 8647 65.31 3350219.00 49.66 None2 513 3.87 394439.10 5.85 1 visit3 807 6.10 599419.40 8.89 2 visits4 747 5.64 562739.80 8.34 3 visits5 684 5.17 546498.50 8.10 4 visits6 1007 7.61 722468.10 10.71 5 to 9 visits7 538 4.06 380996.80 5.65 10 or more visits
KCIVINS -Beneficiary covered by civilian insurance
Unweighted WeightedValue Count Percent Count Percent Formatted Value
1 2651 20.02 1863813.00 27.63 Yes2 10588 79.98 4882264.00 72.37 No
KBRSTCR -Women age 40 and over ever had mammogram and breast exam
Unweighted WeightedValue Count Percent Count Percent Formatted Value
. 9561 72.22 4619288.00 68.47 Missing/Unknown/NA1 3439 25.98 1985596.00 29.43 Yes2 239 1.81 141193.70 2.09 No
HP_PRNTL -
05/13/23 180
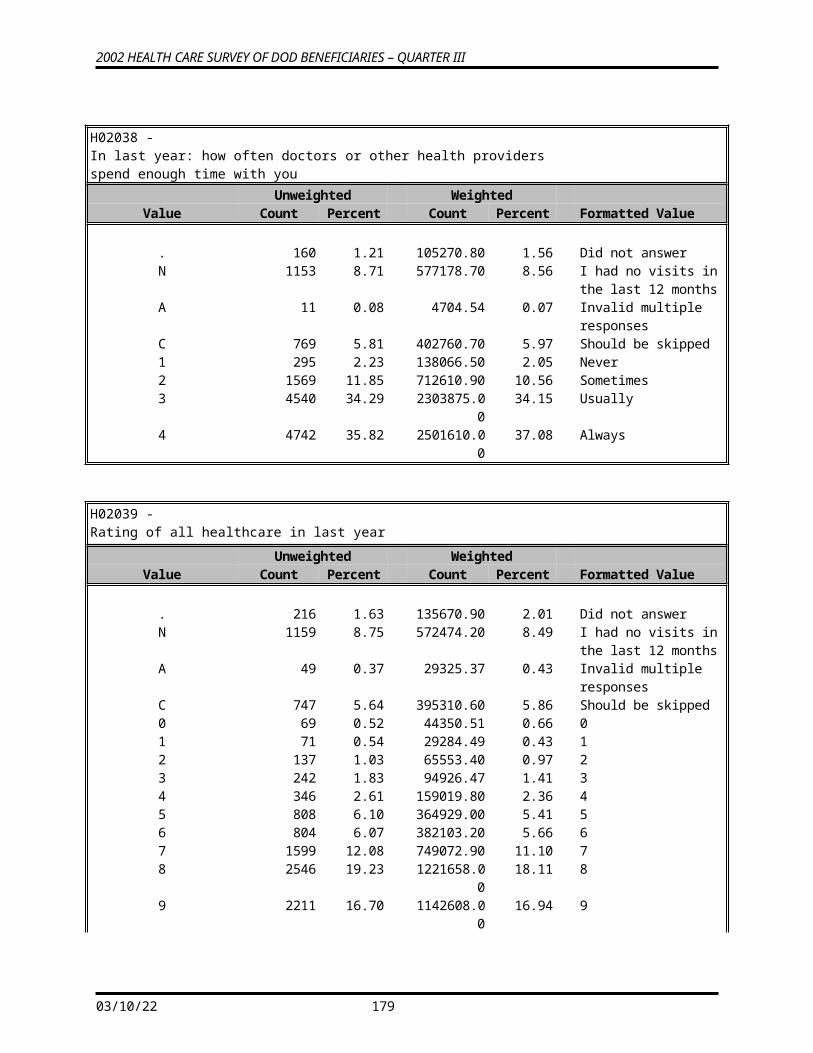
2002 HEALTH CARE SURVEY OF DOD BENEFICIARIES – QUARTER III
Pregnant in last year received care in 1st trimesterUnweighted Weighted
Value Count Percent Count Percent Formatted Value
. 12609 95.24 6521985.00 96.68 Missing/Unknown/3 mnths prg now
1 547 4.13 178582.50 2.65 Yes2 83 0.63 45509.68 0.67 No
HP_MAMOG -Women age 40 and over mammography in past 2 years
Unweighted WeightedValue Count Percent Count Percent Formatted Value
. 9542 72.07 4605447.00 68.27 Missing/Unknown/NA1 3028 22.87 1745613.00 25.88 Yes2 669 5.05 395017.30 5.86 No
HP_MAM50 -Women age 50 and over mammography in past 2 years
Unweighted WeightedValue Count Percent Count Percent Formatted Value
. 10770 81.35 5089690.00 75.45 Missing/Unknown/NA1 2101 15.87 1380609.00 20.47 Yes2 368 2.78 275777.70 4.09 No
HP_PAP -All women Pap smear in last 3 years
Unweighted WeightedValue Count Percent Count Percent Formatted Value
. 6505 49.14 3488621.00 51.71 Missing/Unknown/NA1 6000 45.32 2813605.00 41.71 Yes2 734 5.54 443851.00 6.58 No
05/13/23 181
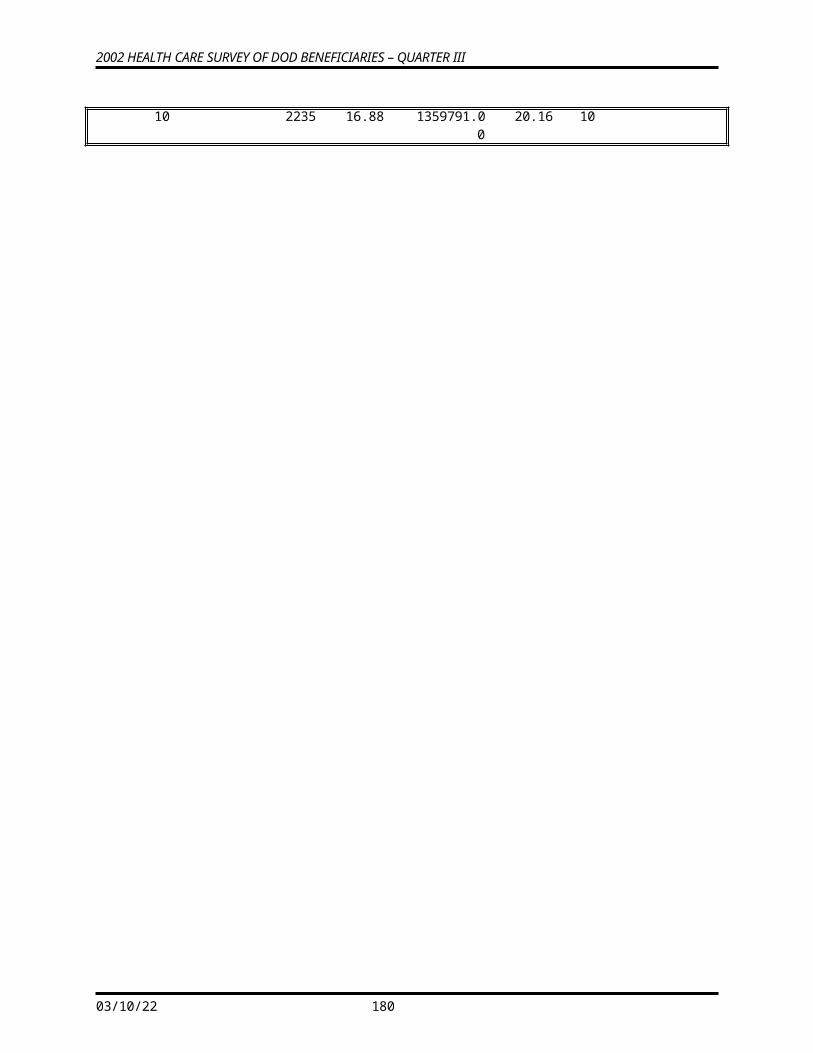
2002 HEALTH CARE SURVEY OF DOD BENEFICIARIES – QUARTER III
HP_BP -Blood pressure check in last 2 years know results
Unweighted WeightedValue Count Percent Count Percent Formatted Value
. 172 1.30 98429.03 1.46 Unknown1 11946 90.23 6082277.00 90.16 Yes2 1121 8.47 565370.30 8.38 No
HP_FLU -Age 65 and older flu shot in last 12 months
Unweighted WeightedValue Count Percent Count Percent Formatted Value
. 11218 84.73 5075700.00 75.24 Missing/Unknown/NA1 1442 10.89 1215725.00 18.02 Yes2 579 4.37 454652.00 6.74 No
HP_PROS -Men age 50 or over prostrate exam in last 12 months
Unweighted WeightedValue Count Percent Count Percent Formatted Value
. 10698 80.81 5032520.00 74.60 Missing/Unknown/NA1 1653 12.49 1129991.00 16.75 Yes2 888 6.71 583565.70 8.65 No
HP_GP -General physical exam in last 12 months
Unweighted WeightedValue Count Percent Count Percent Formatted Value
. 161 1.22 87969.50 1.30 Missing/Unknown/NA1 7176 54.20 3741586.00 55.46 Yes2 5902 44.58 2916521.00 43.23 No
05/13/23 182
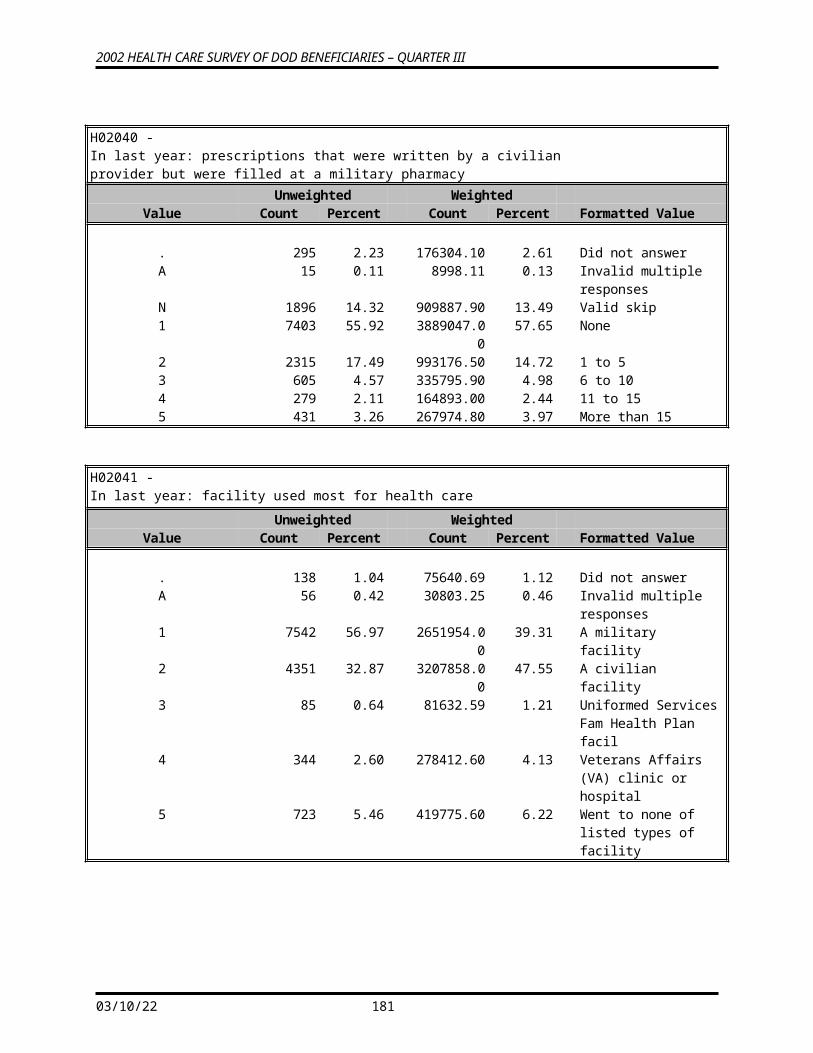
2002 HEALTH CARE SURVEY OF DOD BENEFICIARIES – QUARTER III
HP_BRST -Women age 40 and over breast exam in last 12 months
Unweighted WeightedValue Count Percent Count Percent Formatted Value
. 9485 71.64 4564088.00 67.66 Missing/Unknown/NA1 2543 19.21 1414512.00 20.97 Yes2 1211 9.15 767476.80 11.38 No
HP_CHOL -Cholesterol screening in last 5 years
Unweighted WeightedValue Count Percent Count Percent Formatted Value
. 147 1.11 77873.59 1.15 Missing/Unknown/NA1 10404 78.59 5407300.00 80.15 Yes2 2688 20.30 1260903.00 18.69 No
HP_SMOKE -Advised to quit smoking in last 12 months
Unweighted WeightedValue Count Percent Count Percent Formatted Value
. 10816 81.70 5510070.00 81.68 Missing/Unknown/NA1 1520 11.48 764225.90 11.33 Yes2 903 6.82 471781.00 6.99 No
BWT -Basic Sampling Weight
Unweighted WeightedValue Count Percent Count Percent Formatted Value
11.172 -- 27.681 1342 10.14 130648.40 1.94 Minimum to 10th Percentile
28.205 -- 49.095 1989 15.02 297408.10 4.41 >10th to 25th Percentile49.530 -- 99.037 3410 25.76 987282.70 14.63 >25th to 50th Percentile99.129 -- 241.021 3224 24.35 1602731.00 23.76 >50th to 75th Percentile242.657 -- 549.083 1965 14.84 1327029.00 19.67 >75th to 90th Percentile613.476 -- 1573.797 1309 9.89 2400978.00 35.59 >90th to 100th Percentile
05/13/23 183
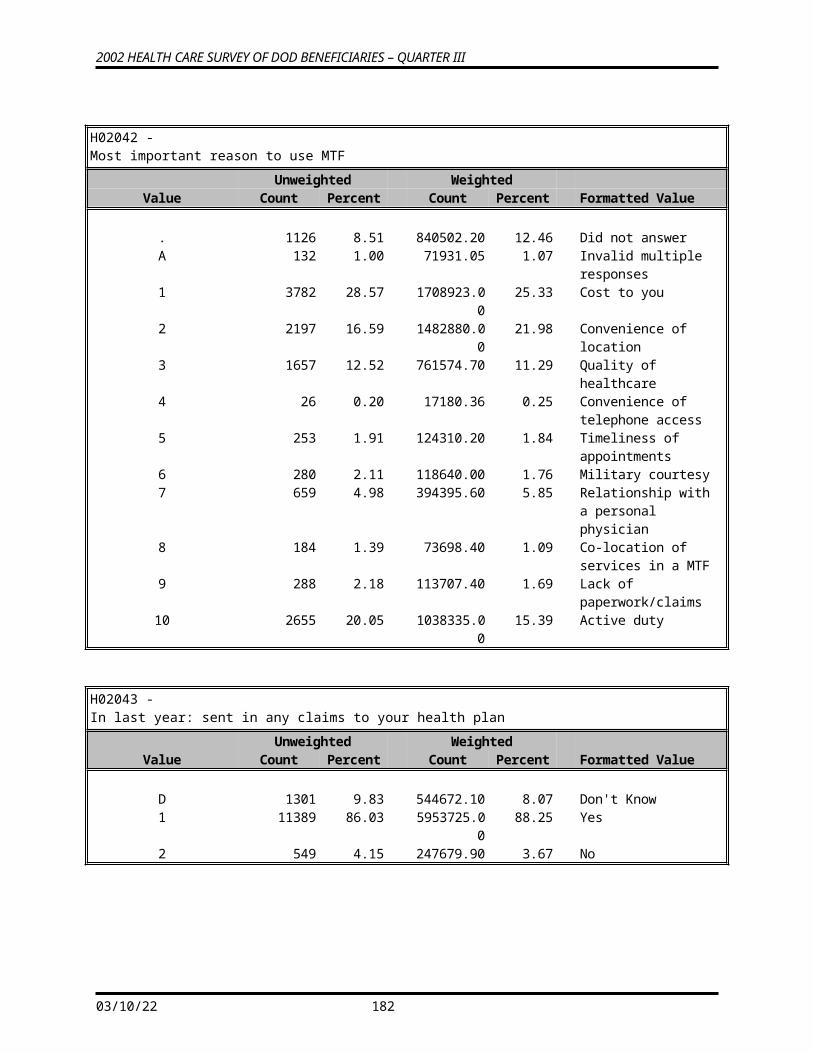
2002 HEALTH CARE SURVEY OF DOD BENEFICIARIES – QUARTER III
ADJ_CELL -Adjusted STRATUM cell
Unweighted WeightedValue Count Percent Count Percent Formatted Value
101 36 0.27 3799.00 0.06 101102 22 0.17 1955.00 0.03 102104 53 0.40 5766.00 0.09 104301 20 0.15 4557.00 0.07 301302 17 0.13 3384.89 0.05 302304 22 0.17 3202.00 0.05 304305 25 0.19 7098.00 0.11 305306 21 0.16 5744.00 0.09 306401 53 0.40 3899.00 0.06 401402 34 0.26 3194.00 0.05 402404 31 0.23 3861.00 0.06 404501 38 0.29 11832.00 0.18 501502 14 0.11 4671.00 0.07 502504 30 0.23 3485.00 0.05 504601 39 0.29 7671.00 0.11 601602 22 0.17 6622.00 0.10 602604 20 0.15 5492.00 0.08 604605 29 0.22 7017.78 0.10 605801 46 0.35 4099.00 0.06 801802 18 0.14 2489.00 0.04 802804 38 0.29 3740.00 0.06 804901 26 0.20 7566.00 0.11 901902 36 0.27 6055.11 0.09 902904 28 0.21 12791.00 0.19 904905 35 0.26 18107.00 0.27 905906 47 0.36 23416.16 0.35 9061001 38 0.29 6534.00 0.10 10011002 25 0.19 3777.00 0.06 10021004 47 0.36 6721.00 0.10 10041301 56 0.42 4997.00 0.07 13011302 28 0.21 2798.00 0.04 13021304 28 0.21 3211.00 0.05 13041401 33 0.25 16027.00 0.24 14011402 59 0.45 26769.25 0.40 14021405 35 0.26 15859.86 0.24 14051406 48 0.36 25774.62 0.38 14061901 49 0.37 9044.00 0.13 19011902 29 0.22 4933.00 0.07 19021904 24 0.18 4879.00 0.07 19042401 38 0.29 39534.00 0.59 24012402 51 0.39 20995.00 0.31 24022404 40 0.30 26316.00 0.39 24042406 36 0.27 20522.00 0.30 24062801 15 0.11 6891.00 0.10 28012802 13 0.10 4447.00 0.07 28022804 24 0.18 3424.00 0.05 28042805 20 0.15 3613.00 0.05 28052806 22 0.17 3344.64 0.05 28062901 42 0.32 74478.00 1.10 29012902 22 0.17 24976.00 0.37 2902
05/13/23 184
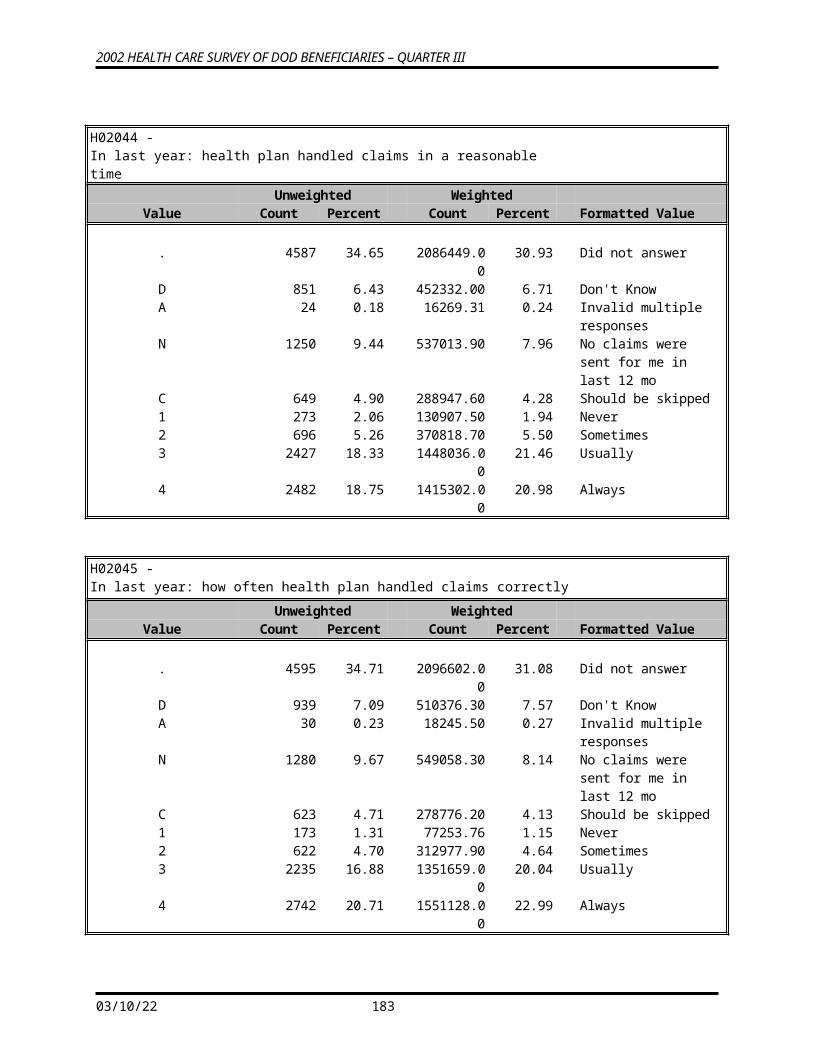
2002 HEALTH CARE SURVEY OF DOD BENEFICIARIES – QUARTER III
2903 19 0.14 6821.00 0.10 29032904 27 0.20 25766.00 0.38 29042905 55 0.42 69488.00 1.03 29053001 22 0.17 12844.00 0.19 30013002 20 0.15 3837.00 0.06 30023004 43 0.32 3302.00 0.05 30043006 17 0.13 2663.00 0.04 30063201 23 0.17 15532.00 0.23 32013202 41 0.31 8925.00 0.13 32023204 17 0.13 8604.00 0.13 32043205 36 0.27 13666.00 0.20 32053301 44 0.33 14417.00 0.21 33013302 26 0.20 7656.00 0.11 33023304 29 0.22 13367.00 0.20 33043305 51 0.39 19282.00 0.29 33053501 45 0.34 12310.00 0.18 35013502 24 0.18 4528.00 0.07 35023504 24 0.18 3581.00 0.05 35043601 46 0.35 3850.00 0.06 36013602 23 0.17 2176.00 0.03 36023604 42 0.32 3968.00 0.06 36043701 50 0.38 18406.00 0.27 37013702 45 0.34 4857.00 0.07 37023704 13 0.10 5907.00 0.09 37043705 58 0.44 28618.00 0.42 37053801 44 0.33 27004.27 0.40 38013802 40 0.30 8925.00 0.13 38023804 30 0.23 10907.00 0.16 38043805 30 0.23 13284.00 0.20 38053806 23 0.17 12504.96 0.19 38063901 38 0.29 35488.00 0.53 39013902 54 0.41 20689.00 0.31 39023904 32 0.24 21025.00 0.31 39043905 35 0.26 24692.31 0.37 39053906 22 0.17 17104.33 0.25 39064201 21 0.16 9815.00 0.15 42014202 45 0.34 7622.00 0.11 42024204 16 0.12 9651.00 0.14 42044205 34 0.26 13703.00 0.20 42054206 23 0.17 11521.92 0.17 42064301 42 0.32 3487.00 0.05 43014302 22 0.17 2290.00 0.03 43024304 44 0.33 4511.00 0.07 43044501 25 0.19 7919.00 0.12 45014502 39 0.29 6732.00 0.10 45024504 37 0.28 16027.82 0.24 45044505 49 0.37 21599.20 0.32 45054506 69 0.52 31810.00 0.47 45064601 25 0.19 2549.00 0.04 46014602 17 0.13 1907.00 0.03 46024604 69 0.52 7863.00 0.12 46044701 46 0.35 16487.00 0.24 47014702 19 0.14 8906.00 0.13 47024704 37 0.28 13672.21 0.20 47044705 15 0.11 8428.00 0.12 47054706 24 0.18 8664.00 0.13 47064801 20 0.15 22817.00 0.34 4801
05/13/23 185
2002 HEALTH CARE SURVEY OF DOD BENEFICIARIES – QUARTER III
4802 30 0.23 8345.00 0.12 48024804 22 0.17 8773.00 0.13 48044805 15 0.11 8233.13 0.12 48054806 23 0.17 9666.00 0.14 48064901 21 0.16 20289.00 0.30 49014902 34 0.26 11326.00 0.17 49024904 11 0.08 6654.00 0.10 49044905 33 0.25 10816.00 0.16 49055101 51 0.39 5224.00 0.08 51015102 32 0.24 3125.00 0.05 51025104 27 0.20 4497.00 0.07 51045201 35 0.26 29804.00 0.44 52015202 37 0.28 14687.00 0.22 52025204 29 0.22 13874.02 0.21 52045206 22 0.17 11547.00 0.17 52065301 33 0.25 4452.00 0.07 53015302 20 0.15 2409.00 0.04 53025304 21 0.16 2198.00 0.03 53045305 27 0.20 1733.00 0.03 53055501 28 0.21 8577.00 0.13 55015502 45 0.34 6251.12 0.09 55025504 18 0.14 8453.00 0.13 55045505 31 0.23 12318.00 0.18 55055506 21 0.16 8638.00 0.13 55065601 28 0.21 28729.00 0.43 56015602 35 0.26 6040.00 0.09 56025604 43 0.32 13407.00 0.20 56045606 16 0.12 7655.00 0.11 56065701 21 0.16 10031.00 0.15 57015702 15 0.11 5825.00 0.09 57025704 20 0.15 3213.33 0.05 57045705 35 0.26 4715.27 0.07 57055801 59 0.45 7335.00 0.11 58015802 30 0.23 4858.00 0.07 58025804 29 0.22 5428.00 0.08 58045901 41 0.31 4271.00 0.06 59015902 23 0.17 2456.00 0.04 59025904 28 0.21 2968.00 0.04 59046001 29 0.22 25203.00 0.37 60016002 42 0.32 14444.11 0.21 60026004 22 0.17 7176.00 0.11 60046005 36 0.27 13534.72 0.20 60056101 26 0.20 13949.00 0.21 61016102 27 0.20 6202.00 0.09 61026104 23 0.17 6074.88 0.09 61046105 24 0.18 11120.00 0.16 61056106 23 0.17 8087.00 0.12 61066201 43 0.32 5505.00 0.08 62016202 16 0.12 2737.00 0.04 62026204 30 0.23 3239.00 0.05 62046401 25 0.19 9148.00 0.14 64016402 11 0.08 4239.58 0.06 64026404 16 0.12 3309.00 0.05 64046405 25 0.19 3901.00 0.06 64056601 40 0.30 16909.00 0.25 66016602 43 0.32 11042.29 0.16 66026604 25 0.19 12427.00 0.18 6604
05/13/23 186
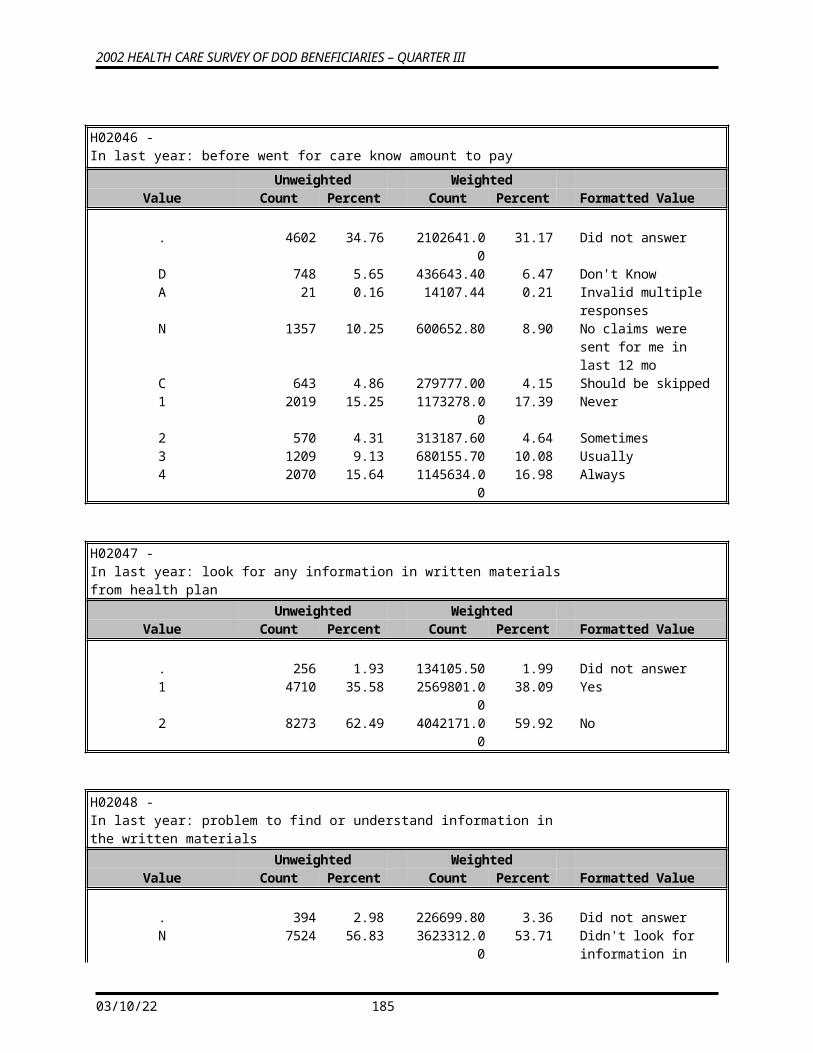
2002 HEALTH CARE SURVEY OF DOD BENEFICIARIES – QUARTER III
6605 50 0.38 24819.95 0.37 66056701 48 0.36 23104.00 0.34 67016702 52 0.39 9164.00 0.14 67026704 23 0.17 9235.00 0.14 67046705 33 0.25 18609.09 0.28 67056706 26 0.20 16369.38 0.24 67066901 53 0.40 17511.00 0.26 69016902 26 0.20 8360.00 0.12 69026904 38 0.29 10305.37 0.15 69047301 26 0.20 12881.56 0.19 73017302 14 0.11 5925.00 0.09 73027304 22 0.17 8170.00 0.12 73047305 41 0.31 14957.00 0.22 73057501 30 0.23 10958.00 0.16 75017502 21 0.16 3906.00 0.06 75027504 18 0.14 4682.00 0.07 75047505 40 0.30 4879.00 0.07 75057801 33 0.25 8173.00 0.12 78017802 20 0.15 5502.00 0.08 78027804 20 0.15 6991.00 0.10 78047805 31 0.23 8461.00 0.13 78057806 24 0.18 5624.00 0.08 78067901 16 0.12 7716.00 0.11 79017902 12 0.09 5713.00 0.08 79027904 28 0.21 10656.00 0.16 79047905 36 0.27 16828.00 0.25 79057906 38 0.29 14063.00 0.21 79068301 53 0.40 7400.00 0.11 83018302 22 0.17 4523.00 0.07 83028304 32 0.24 7229.00 0.11 83048601 16 0.12 8834.00 0.13 86018602 43 0.32 3898.00 0.06 86028604 37 0.28 8297.00 0.12 86048606 28 0.21 7727.00 0.11 86068901 55 0.42 47124.00 0.70 89018902 63 0.48 25762.00 0.38 89028904 18 0.14 13539.00 0.20 89048905 27 0.20 21339.00 0.32 89058906 16 0.12 12087.00 0.18 89069001 43 0.32 4386.00 0.07 90019002 24 0.18 2377.00 0.04 90029004 33 0.25 2973.00 0.04 90049101 23 0.17 33298.00 0.49 91019102 24 0.18 11699.52 0.17 91029103 17 0.13 2818.00 0.04 91039104 36 0.27 12596.00 0.19 91049106 18 0.14 3873.00 0.06 91069201 17 0.13 8348.00 0.12 92019202 12 0.09 4822.00 0.07 92029204 63 0.48 10181.00 0.15 92049501 26 0.20 7062.00 0.10 95019502 20 0.15 5382.00 0.08 95029504 26 0.20 11213.00 0.17 95049505 23 0.17 9335.13 0.14 95059506 27 0.20 9328.50 0.14 95069601 61 0.46 14593.00 0.22 96019602 34 0.26 7685.00 0.11 9602
05/13/23 187
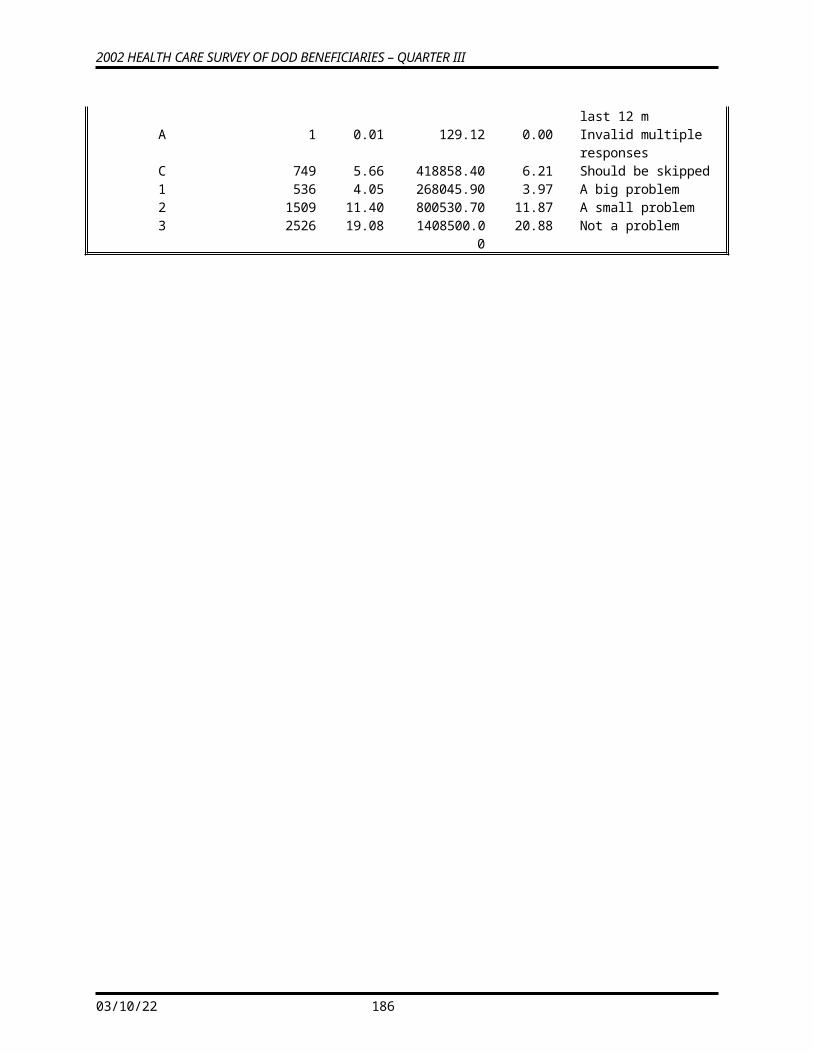
2002 HEALTH CARE SURVEY OF DOD BENEFICIARIES – QUARTER III
9604 28 0.21 7720.00 0.11 96049801 29 0.22 15357.00 0.23 98019802 22 0.17 7691.00 0.11 98029804 13 0.10 7008.00 0.10 98049805 33 0.25 10036.00 0.15 980510101 28 0.21 5998.00 0.09 1010110102 16 0.12 3133.00 0.05 1010210104 17 0.13 3369.00 0.05 1010410105 16 0.12 3735.00 0.06 1010510106 18 0.14 3406.00 0.05 1010610301 26 0.20 13583.56 0.20 1030110302 41 0.31 6095.00 0.09 1030210304 22 0.17 8493.00 0.13 1030410305 32 0.24 13043.00 0.19 1030510306 14 0.11 9406.00 0.14 1030610401 20 0.15 10661.00 0.16 1040110402 23 0.17 3703.00 0.05 1040210404 61 0.46 7975.00 0.12 1040410501 25 0.19 11715.41 0.17 1050110502 20 0.15 4285.71 0.06 1050210504 18 0.14 7775.00 0.12 1050410505 19 0.14 9043.00 0.13 1050510506 24 0.18 9659.00 0.14 1050610801 22 0.17 14583.00 0.22 1080110802 36 0.27 9347.00 0.14 1080210804 39 0.29 18178.00 0.27 1080410806 20 0.15 10282.00 0.15 1080610901 19 0.14 9592.00 0.14 1090110902 44 0.33 7057.00 0.10 1090210904 29 0.22 14871.00 0.22 1090410905 66 0.50 35126.21 0.52 1090511001 61 0.46 43998.00 0.65 1100111002 41 0.31 22548.72 0.33 1100211004 23 0.17 14105.00 0.21 1100411005 16 0.12 13566.00 0.20 1100511006 20 0.15 8616.00 0.13 1100611201 51 0.39 6728.00 0.10 1120111202 33 0.25 3737.00 0.06 1120211204 25 0.19 3718.00 0.06 1120411301 20 0.15 7341.90 0.11 1130111302 14 0.11 2881.20 0.04 1130211304 24 0.18 3078.00 0.05 1130411305 42 0.32 5408.00 0.08 1130511701 36 0.27 28325.00 0.42 1170111702 17 0.13 8557.61 0.13 1170211704 30 0.23 18630.00 0.28 1170411705 47 0.36 25928.83 0.38 1170511801 45 0.34 5314.00 0.08 1180111802 27 0.20 3396.00 0.05 1180211804 25 0.19 3630.00 0.05 1180411901 58 0.44 8774.00 0.13 1190111902 33 0.25 4911.00 0.07 1190211904 22 0.17 4747.00 0.07 1190412001 36 0.27 12782.00 0.19 1200112002 53 0.40 8415.76 0.12 1200212004 15 0.11 4384.69 0.06 1200412005 46 0.35 15482.95 0.23 12005
05/13/23 188
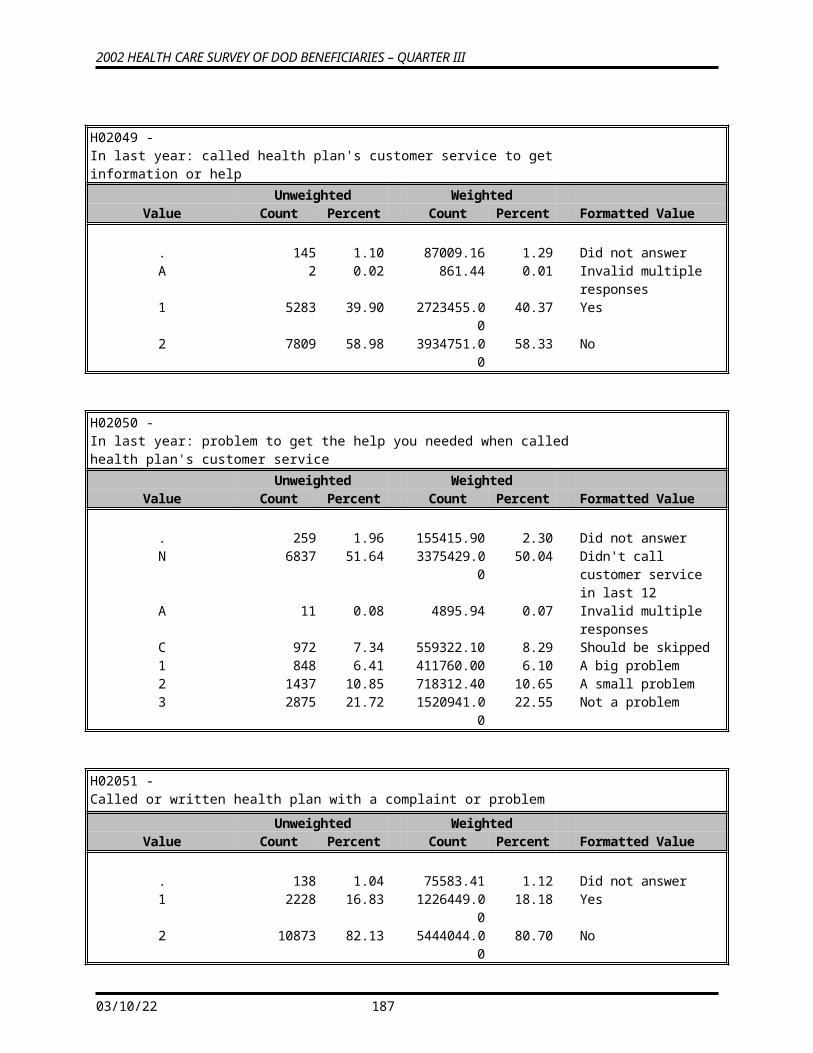
2002 HEALTH CARE SURVEY OF DOD BENEFICIARIES – QUARTER III
12101 20 0.15 12274.00 0.18 1210112102 41 0.31 9853.00 0.15 1210212104 18 0.14 9648.00 0.14 1210412105 49 0.37 17992.88 0.27 1210512301 43 0.32 15764.00 0.23 1230112302 32 0.24 13505.00 0.20 1230212303 25 0.19 4317.00 0.06 1230312304 45 0.34 21020.00 0.31 1230412305 53 0.40 32075.80 0.48 1230512306 36 0.27 18337.62 0.27 1230612401 54 0.41 80742.00 1.20 1240112402 30 0.23 28135.00 0.42 1240212403 30 0.23 13454.97 0.20 1240312404 15 0.11 17506.00 0.26 1240412405 36 0.27 46123.00 0.68 1240512406 18 0.14 22141.89 0.33 1240612501 37 0.28 29716.00 0.44 1250112502 39 0.29 16144.00 0.24 1250212504 44 0.33 21533.00 0.32 1250412505 65 0.49 45719.12 0.68 1250512601 27 0.20 13663.00 0.20 1260112602 19 0.14 9143.00 0.14 1260212604 24 0.18 7952.00 0.12 1260412605 38 0.29 11342.67 0.17 1260512701 20 0.15 7974.00 0.12 1270112702 20 0.15 4214.00 0.06 1270212704 19 0.14 3149.00 0.05 1270412705 30 0.23 5335.00 0.08 1270512801 29 0.22 3648.00 0.05 1280112802 20 0.15 1995.00 0.03 1280212804 45 0.34 4149.00 0.06 1280412901 55 0.42 9562.00 0.14 1290112902 22 0.17 3603.00 0.05 1290212904 22 0.17 3646.00 0.05 1290413101 40 0.30 4679.00 0.07 1310113102 15 0.11 2716.00 0.04 1310213104 19 0.14 2047.00 0.03 1310428001 41 0.31 7539.00 0.11 2800128002 46 0.35 8022.00 0.12 2800228004 16 0.12 2050.00 0.03 2800428701 77 0.58 4995.00 0.07 2870128702 35 0.26 2882.00 0.04 2870228704 18 0.14 1207.00 0.02 2870432101 73 0.55 9426.00 0.14 3210132102 26 0.20 2474.00 0.04 3210232104 20 0.15 1788.00 0.03 3210432601 59 0.45 6200.00 0.09 3260132602 18 0.14 2880.00 0.04 3260232604 21 0.16 1526.00 0.02 3260433001 36 0.27 9238.00 0.14 3300133002 30 0.23 5392.00 0.08 3300236601 37 0.28 3854.00 0.06 3660136602 30 0.23 3269.00 0.05 3660236604 57 0.43 7690.00 0.11 3660438501 32 0.24 7626.00 0.11 3850138502 33 0.25 4382.00 0.06 3850238504 23 0.17 3951.00 0.06 38504
05/13/23 189

2002 HEALTH CARE SURVEY OF DOD BENEFICIARIES – QUARTER III
60601 31 0.23 21452.00 0.32 6060160602 32 0.24 15078.00 0.22 6060260701 49 0.37 18053.00 0.27 6070160702 35 0.26 12129.00 0.18 6070260901 46 0.35 27316.00 0.40 6090160902 45 0.34 14660.00 0.22 6090261201 56 0.42 29123.00 0.43 6120161202 18 0.14 4237.00 0.06 6120261601 22 0.17 4039.00 0.06 6160161602 41 0.31 5008.00 0.07 6160261701 37 0.28 17885.00 0.27 6170161702 18 0.14 8897.00 0.13 6170262001 35 0.26 5782.00 0.09 6200162002 11 0.08 2985.00 0.04 6200262004 16 0.12 3835.39 0.06 6200462101 28 0.21 17207.00 0.26 6210162102 16 0.12 6030.00 0.09 6210262201 35 0.26 19835.00 0.29 6220162202 22 0.17 6992.82 0.10 6220263301 41 0.31 11744.00 0.17 6330163302 28 0.21 8571.00 0.13 6330263802 61 0.46 12031.00 0.18 6380264001 40 0.30 9383.00 0.14 6400164002 25 0.19 6262.00 0.09 6400280401 45 0.34 7270.00 0.11 8040180402 21 0.16 3854.00 0.06 8040280501 50 0.38 5916.00 0.09 8050180502 28 0.21 3950.00 0.06 8050280601 46 0.35 10015.00 0.15 8060180602 20 0.15 5141.00 0.08 80602713901 55 0.42 6975.00 0.10 713901713902 42 0.32 3659.00 0.05 713902999002 49 0.37 125736.00 1.86 999002999101 38 0.29 88152.00 1.31 999101999102 26 0.20 22076.89 0.33 999102999103 74 0.56 50512.00 0.75 999103999104 23 0.17 44833.00 0.66 999104999105 223 1.68 373863.20 5.54 999105999106 146 1.10 302510.00 4.48 999106999201 34 0.26 51531.00 0.76 999201999202 13 0.10 20855.00 0.31 999202999203 28 0.21 30481.00 0.45 999203999204 47 0.36 75573.00 1.12 999204999205 186 1.40 264114.10 3.92 999205999206 181 1.37 304822.60 4.52 999206999301 39 0.29 68222.00 1.01 999301999302 21 0.16 20620.00 0.31 999302999303 60 0.45 47042.00 0.70 999303999304 33 0.25 66803.00 0.99 999304999305 208 1.57 412122.10 6.11 999305999306 174 1.31 373033.00 5.53 999306
05/13/23 190
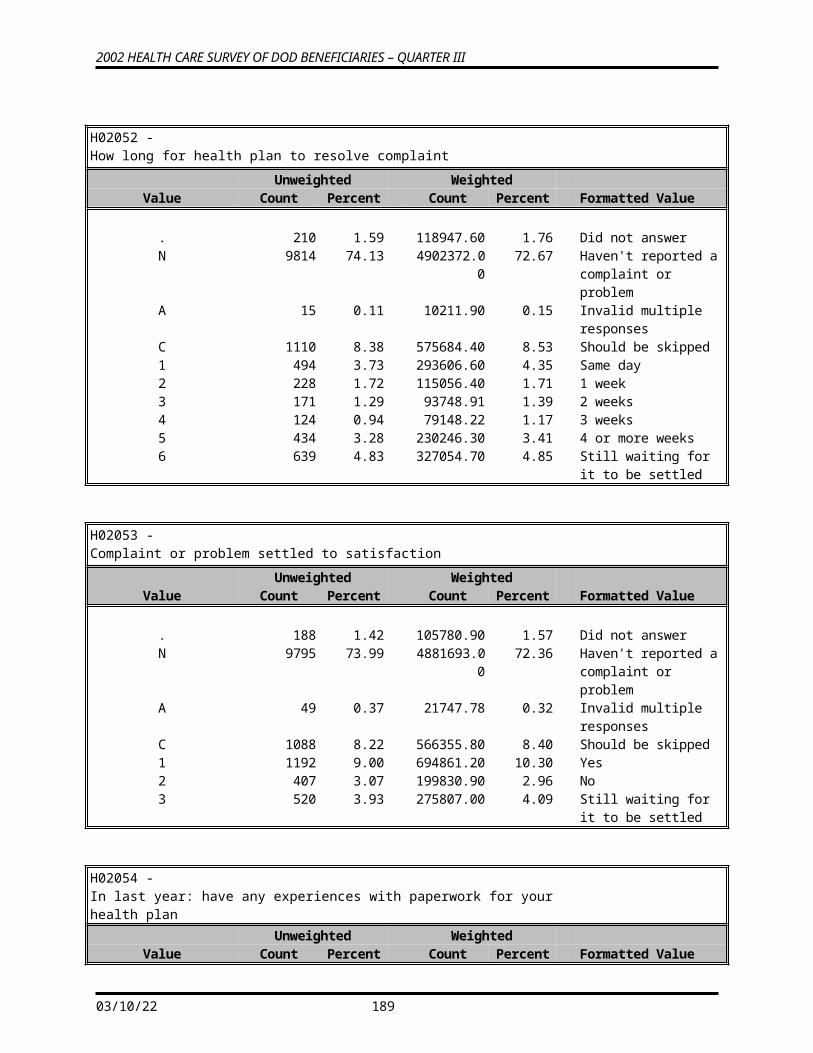
2002 HEALTH CARE SURVEY OF DOD BENEFICIARIES – QUARTER III
WRWT1 -Replicated/JackKnife Weight 1
Unweighted WeightedValue Count Percent Count Percent Formatted Value
0.000 -- 95.206 1338 10.11 212171.40 3.15 Minimum to 10th Percentile
96.166 -- 141.110 1979 14.95 228739.10 3.39 >10th to 25th Percentile141.959 -- 337.606 3338 25.21 742499.20 11.01 >25th to 50th Percentile342.264 -- 565.895 3269 24.69 1439956.00 21.35 >50th to 75th Percentile567.887 -- 1446.313 2015 15.22 1646494.00 24.41 >75th to 90th Percentile1513.460 -- 10254.27 1300 9.82 2476217.00 36.71 >90th to 100th Percentile
WRWT2 -Replicated/JackKnife Weight 2
Unweighted WeightedValue Count Percent Count Percent Formatted Value
0.000 -- 95.238 1353 10.22 194552.40 2.88 Minimum to 10th Percentile
96.338 -- 143.253 1968 14.87 229319.60 3.40 >10th to 25th Percentile143.572 -- 337.440 3371 25.46 758354.30 11.24 >25th to 50th Percentile337.577 -- 579.191 3245 24.51 1437285.00 21.31 >50th to 75th Percentile581.544 -- 1438.494 1994 15.06 1636108.00 24.25 >75th to 90th Percentile1447.657 -- 10221.69 1308 9.88 2490457.00 36.92 >90th to 100th Percentile
WRWT3 -Replicated/JackKnife Weight 3
Unweighted WeightedValue Count Percent Count Percent Formatted Value
0.000 -- 95.238 1331 10.05 194752.70 2.89 Minimum to 10th Percentile
96.166 -- 141.071 1978 14.94 228626.10 3.39 >10th to 25th Percentile144.926 -- 337.606 3323 25.10 739301.80 10.96 >25th to 50th Percentile338.200 -- 579.191 3288 24.84 1448036.00 21.46 >50th to 75th Percentile579.718 -- 1454.218 2034 15.36 1678301.00 24.88 >75th to 90th Percentile1481.897 -- 10254.27 1285 9.71 2457060.00 36.42 >90th to 100th Percentile
05/13/23 191
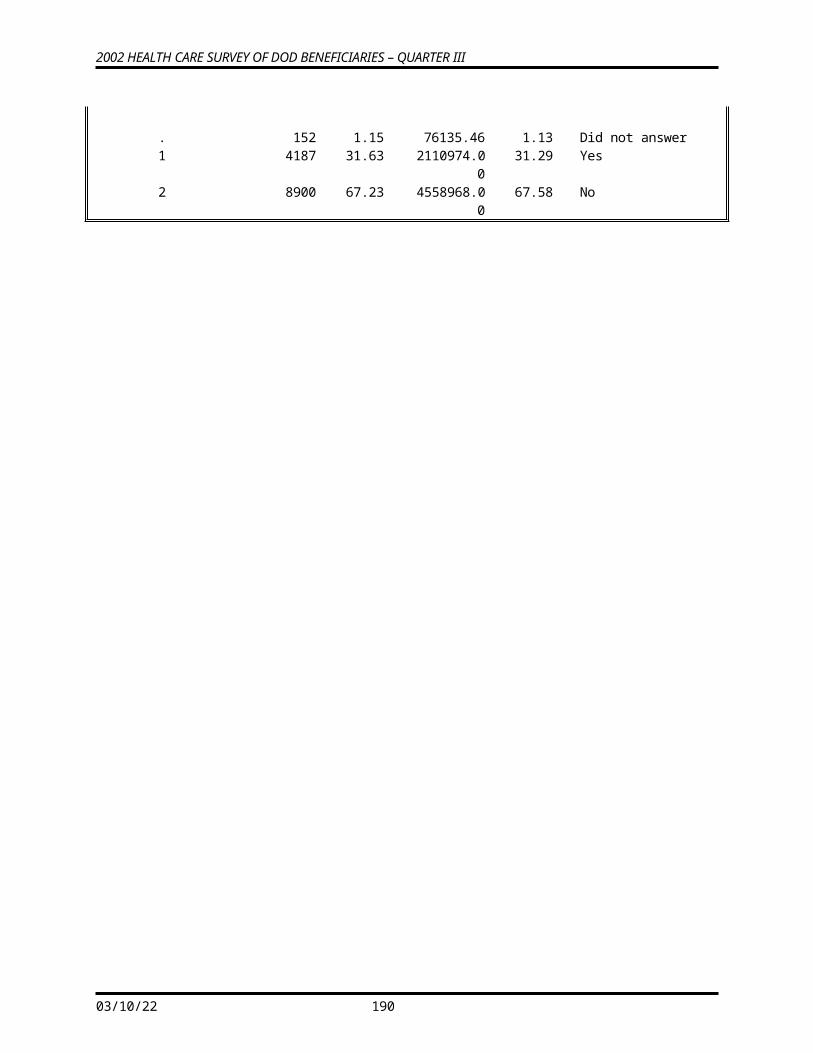
2002 HEALTH CARE SURVEY OF DOD BENEFICIARIES – QUARTER III
WRWT4 -Replicated/JackKnife Weight 4
Unweighted WeightedValue Count Percent Count Percent Formatted Value
0.000 -- 96.166 1350 10.20 200557.40 2.97 Minimum to 10th Percentile
98.963 -- 142.253 1937 14.63 224206.30 3.32 >10th to 25th Percentile144.708 -- 337.606 3357 25.36 745272.90 11.05 >25th to 50th Percentile339.433 -- 578.178 3280 24.78 1443879.00 21.40 >50th to 75th Percentile579.718 -- 1454.131 2032 15.35 1679109.00 24.89 >75th to 90th Percentile1497.870 -- 10168.40 1283 9.69 2453053.00 36.36 >90th to 100th Percentile
WRWT5 -Replicated/JackKnife Weight 5
Unweighted WeightedValue Count Percent Count Percent Formatted Value
0.000 -- 95.238 1334 10.08 198339.50 2.94 Minimum to 10th Percentile
99.014 -- 145.042 1991 15.04 230444.80 3.42 >10th to 25th Percentile146.296 -- 335.247 3296 24.90 731514.90 10.84 >25th to 50th Percentile336.949 -- 579.191 3308 24.99 1455102.00 21.57 >50th to 75th Percentile579.718 -- 1430.760 2006 15.15 1646248.00 24.40 >75th to 90th Percentile1497.870 -- 10140.35 1304 9.85 2484428.00 36.83 >90th to 100th Percentile
WRWT6 -Replicated/JackKnife Weight 6
Unweighted WeightedValue Count Percent Count Percent Formatted Value
0.000 -- 98.448 1361 10.28 208119.80 3.09 Minimum to 10th Percentile
98.963 -- 143.572 1946 14.70 226169.30 3.35 >10th to 25th Percentile144.708 -- 337.606 3397 25.66 762820.10 11.31 >25th to 50th Percentile342.264 -- 578.178 3191 24.10 1408000.00 20.87 >50th to 75th Percentile579.718 -- 1454.218 2065 15.60 1694964.00 25.13 >75th to 90th Percentile1481.897 -- 10140.35 1279 9.66 2446004.00 36.26 >90th to 100th Percentile
05/13/23 192
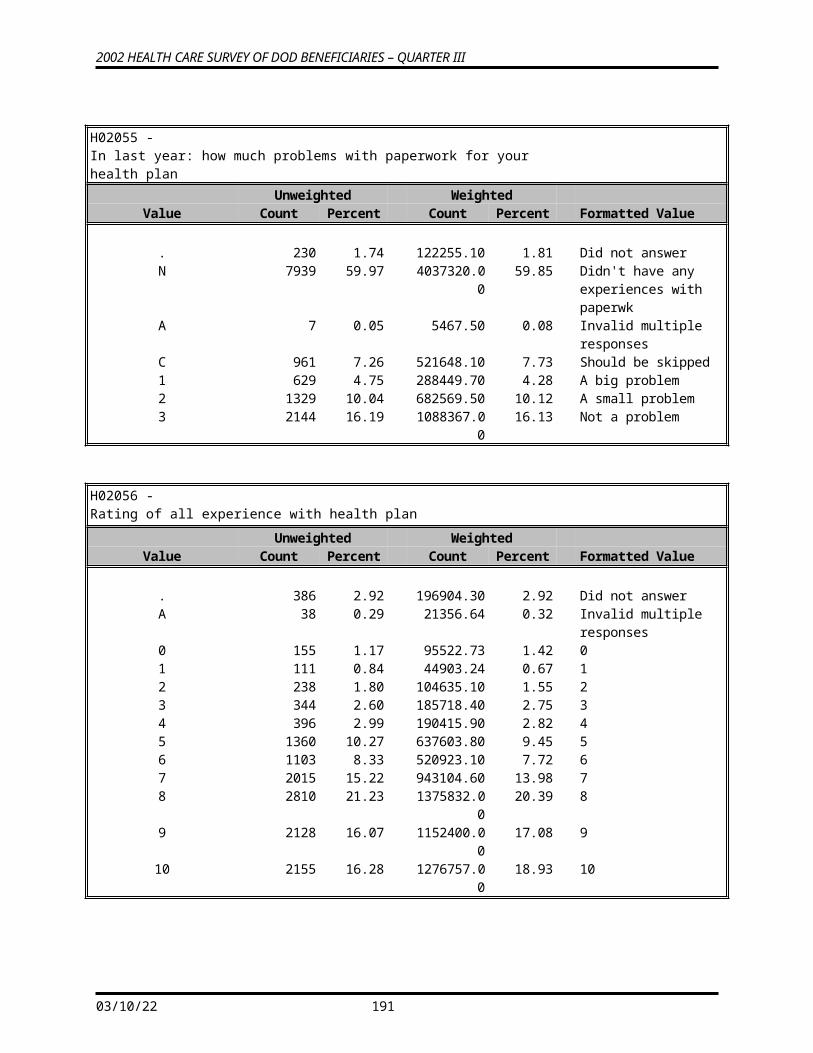
2002 HEALTH CARE SURVEY OF DOD BENEFICIARIES – QUARTER III
WRWT7 -Replicated/JackKnife Weight 7
Unweighted WeightedValue Count Percent Count Percent Formatted Value
0.000 -- 96.166 1342 10.14 203826.00 3.02 Minimum to 10th Percentile
98.963 -- 141.110 1985 14.99 230018.10 3.41 >10th to 25th Percentile143.253 -- 337.606 3369 25.45 755588.30 11.20 >25th to 50th Percentile338.200 -- 578.178 3199 24.16 1410106.00 20.90 >50th to 75th Percentile579.718 -- 1446.313 2040 15.41 1662179.00 24.64 >75th to 90th Percentile1447.657 -- 10140.35 1304 9.85 2484360.00 36.83 >90th to 100th Percentile
WRWT8 -Replicated/JackKnife Weight 8
Unweighted WeightedValue Count Percent Count Percent Formatted Value
0.000 -- 96.166 1345 10.16 202156.20 3.00 Minimum to 10th Percentile
99.014 -- 141.110 1966 14.85 228300.00 3.38 >10th to 25th Percentile146.367 -- 337.606 3368 25.44 755574.90 11.20 >25th to 50th Percentile338.617 -- 564.910 3243 24.50 1434541.00 21.26 >50th to 75th Percentile565.895 -- 1446.313 2012 15.20 1648685.00 24.44 >75th to 90th Percentile1447.657 -- 11032.82 1305 9.86 2476819.00 36.71 >90th to 100th Percentile
WRWT9 -Replicated/JackKnife Weight 9
Unweighted WeightedValue Count Percent Count Percent Formatted Value
0.000 -- 96.591 1383 10.45 203195.60 3.01 Minimum to 10th Percentile
99.014 -- 146.367 1985 14.99 232591.20 3.45 >10th to 25th Percentile146.825 -- 337.288 3305 24.96 744146.10 11.03 >25th to 50th Percentile342.264 -- 576.930 3235 24.44 1427067.00 21.15 >50th to 75th Percentile579.718 -- 1446.313 2023 15.28 1653446.00 24.51 >75th to 90th Percentile1447.657 -- 10714.78 1308 9.88 2485631.00 36.85 >90th to 100th Percentile
05/13/23 193
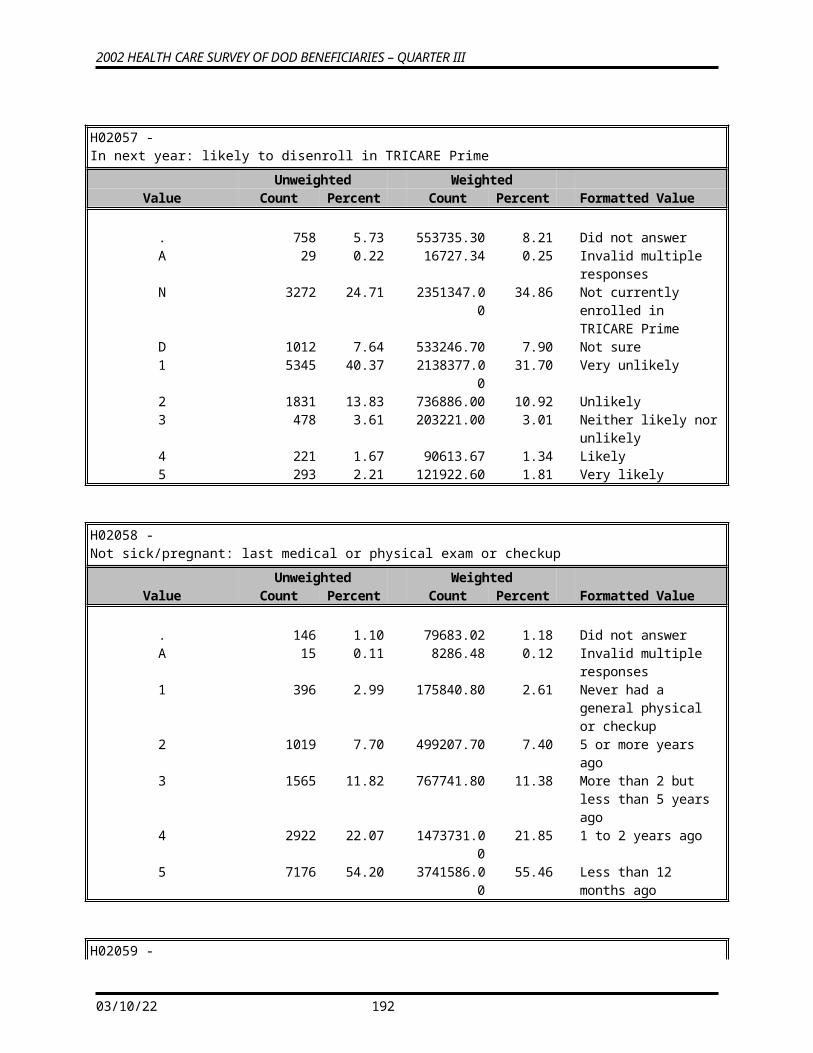
2002 HEALTH CARE SURVEY OF DOD BENEFICIARIES – QUARTER III
WRWT10 -Replicated/JackKnife Weight 10
Unweighted WeightedValue Count Percent Count Percent Formatted Value
0.000 -- 94.660 1354 10.23 197509.30 2.93 Minimum to 10th Percentile
95.206 -- 146.367 2014 15.21 235337.40 3.49 >10th to 25th Percentile146.825 -- 342.298 3272 24.71 734161.10 10.88 >25th to 50th Percentile343.385 -- 564.910 3260 24.62 1433184.00 21.24 >50th to 75th Percentile565.895 -- 1446.313 2032 15.35 1655603.00 24.54 >75th to 90th Percentile1447.657 -- 10140.35 1307 9.87 2490282.00 36.91 >90th to 100th Percentile
WRWT11 -Replicated/JackKnife Weight 11
Unweighted WeightedValue Count Percent Count Percent Formatted Value
0.000 -- 94.543 1332 10.06 190124.90 2.82 Minimum to 10th Percentile
95.206 -- 142.253 1982 14.97 229566.20 3.40 >10th to 25th Percentile144.708 -- 337.606 3334 25.18 743331.90 11.02 >25th to 50th Percentile341.832 -- 578.178 3246 24.52 1428279.00 21.17 >50th to 75th Percentile579.718 -- 1449.940 2037 15.39 1662414.00 24.64 >75th to 90th Percentile1513.460 -- 10172.67 1308 9.88 2492361.00 36.95 >90th to 100th Percentile
WRWT12 -Replicated/JackKnife Weight 12
Unweighted WeightedValue Count Percent Count Percent Formatted Value
0.000 -- 96.591 1356 10.24 194876.50 2.89 Minimum to 10th Percentile
98.448 -- 146.367 2014 15.21 235432.40 3.49 >10th to 25th Percentile146.825 -- 342.298 3285 24.81 738275.90 10.94 >25th to 50th Percentile343.229 -- 564.910 3269 24.69 1442773.00 21.39 >50th to 75th Percentile565.895 -- 1449.940 2006 15.15 1641960.00 24.34 >75th to 90th Percentile1497.870 -- 10140.35 1309 9.89 2492759.00 36.95 >90th to 100th Percentile
05/13/23 194
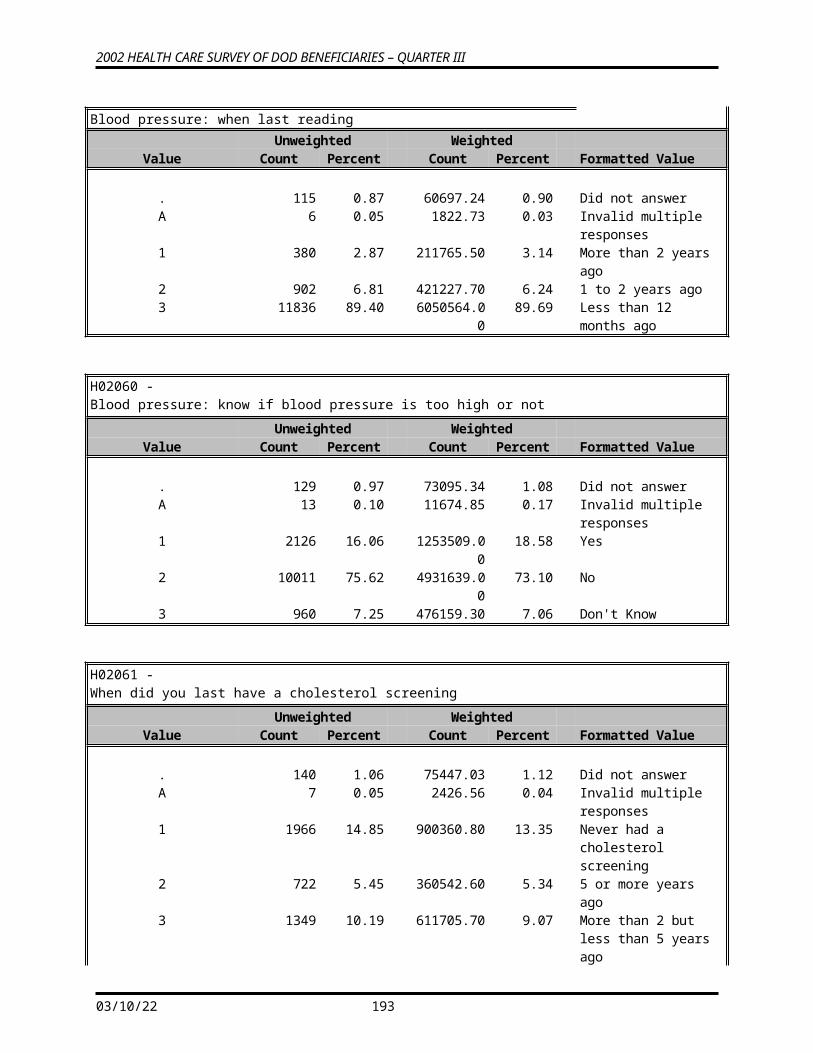
2002 HEALTH CARE SURVEY OF DOD BENEFICIARIES – QUARTER III
WRWT13 -Replicated/JackKnife Weight 13
Unweighted WeightedValue Count Percent Count Percent Formatted Value
0.000 -- 94.660 1324 10.00 201337.70 2.98 Minimum to 10th Percentile
95.206 -- 146.367 2042 15.42 237604.50 3.52 >10th to 25th Percentile147.067 -- 334.260 3255 24.59 727307.20 10.78 >25th to 50th Percentile337.440 -- 579.191 3284 24.81 1443835.00 21.40 >50th to 75th Percentile579.718 -- 1434.264 2024 15.29 1655230.00 24.54 >75th to 90th Percentile1447.657 -- 11759.38 1310 9.90 2480763.00 36.77 >90th to 100th Percentile
WRWT14 -Replicated/JackKnife Weight 14
Unweighted WeightedValue Count Percent Count Percent Formatted Value
0.000 -- 96.591 1346 10.17 199722.30 2.96 Minimum to 10th Percentile
98.963 -- 141.071 1972 14.90 228062.50 3.38 >10th to 25th Percentile144.926 -- 335.247 3343 25.25 744322.60 11.03 >25th to 50th Percentile341.832 -- 580.016 3274 24.73 1446232.00 21.44 >50th to 75th Percentile584.112 -- 1426.552 1999 15.10 1642422.00 24.35 >75th to 90th Percentile1447.657 -- 10140.35 1305 9.86 2485315.00 36.84 >90th to 100th Percentile
WRWT15 -Replicated/JackKnife Weight 15
Unweighted WeightedValue Count Percent Count Percent Formatted Value
0.000 -- 94.543 1331 10.05 196460.10 2.91 Minimum to 10th Percentile
98.963 -- 146.367 2018 15.24 234675.90 3.48 >10th to 25th Percentile146.818 -- 332.503 3278 24.76 730993.00 10.84 >25th to 50th Percentile333.912 -- 582.029 3291 24.86 1447937.00 21.46 >50th to 75th Percentile582.539 -- 1442.059 2015 15.22 1649153.00 24.45 >75th to 90th Percentile1481.897 -- 10140.35 1306 9.86 2486858.00 36.86 >90th to 100th Percentile
05/13/23 195
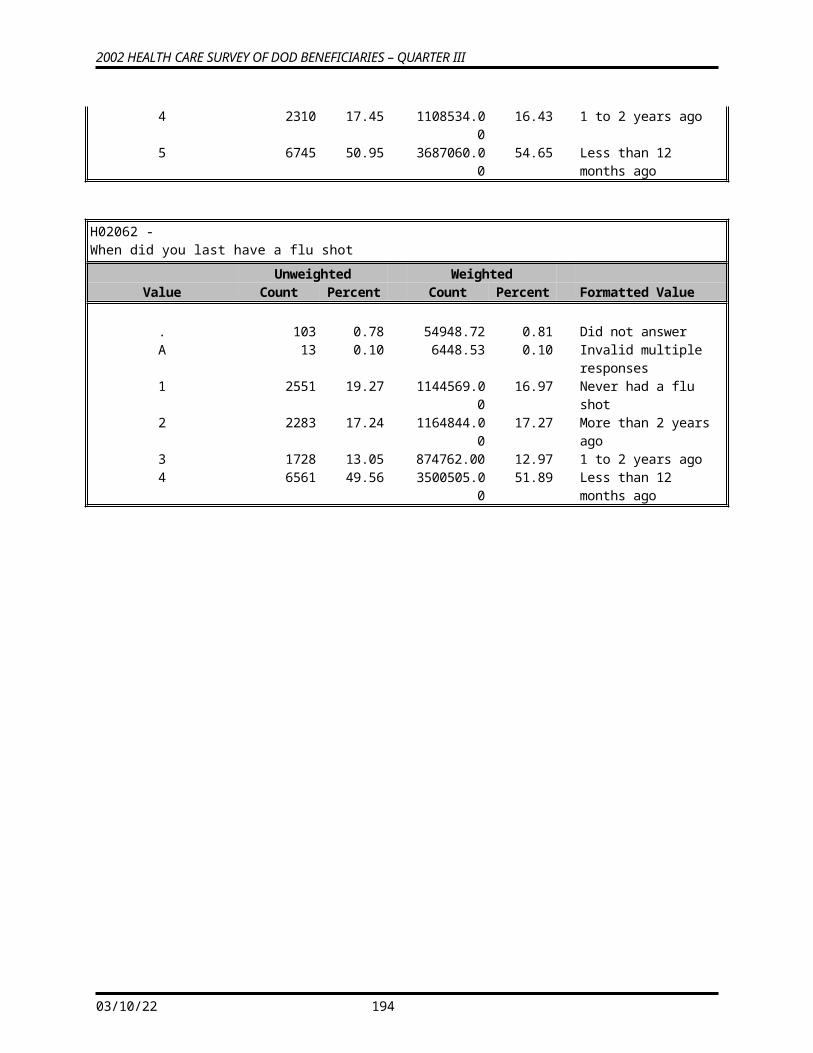
2002 HEALTH CARE SURVEY OF DOD BENEFICIARIES – QUARTER III
WRWT16 -Replicated/JackKnife Weight 16
Unweighted WeightedValue Count Percent Count Percent Formatted Value
0.000 -- 96.591 1335 10.08 176546.00 2.62 Minimum to 10th Percentile
99.014 -- 146.367 2013 15.21 234883.10 3.48 >10th to 25th Percentile146.818 -- 337.606 3286 24.82 738079.00 10.94 >25th to 50th Percentile341.832 -- 582.029 3317 25.05 1468357.00 21.77 >50th to 75th Percentile582.539 -- 1449.940 1997 15.08 1659053.00 24.59 >75th to 90th Percentile1521.158 -- 10204.76 1291 9.75 2469159.00 36.60 >90th to 100th Percentile
WRWT17 -Replicated/JackKnife Weight 17
Unweighted WeightedValue Count Percent Count Percent Formatted Value
0.000 -- 99.171 1367 10.33 198450.80 2.94 Minimum to 10th Percentile
99.706 -- 146.367 1987 15.01 232494.70 3.45 >10th to 25th Percentile147.067 -- 337.577 3300 24.93 741615.00 10.99 >25th to 50th Percentile341.832 -- 564.910 3244 24.50 1430073.00 21.20 >50th to 75th Percentile565.895 -- 1442.059 2035 15.37 1660401.00 24.61 >75th to 90th Percentile1447.657 -- 10786.72 1306 9.86 2483043.00 36.81 >90th to 100th Percentile
WRWT18 -Replicated/JackKnife Weight 18
Unweighted WeightedValue Count Percent Count Percent Formatted Value
0.000 -- 94.660 1360 10.27 212021.00 3.14 Minimum to 10th Percentile
95.206 -- 146.367 2017 15.24 235334.10 3.49 >10th to 25th Percentile147.067 -- 342.264 3277 24.75 733503.40 10.87 >25th to 50th Percentile342.584 -- 582.029 3290 24.85 1450236.00 21.50 >50th to 75th Percentile582.539 -- 1442.059 1994 15.06 1635939.00 24.25 >75th to 90th Percentile1447.657 -- 10172.67 1301 9.83 2479043.00 36.75 >90th to 100th Percentile
05/13/23 196
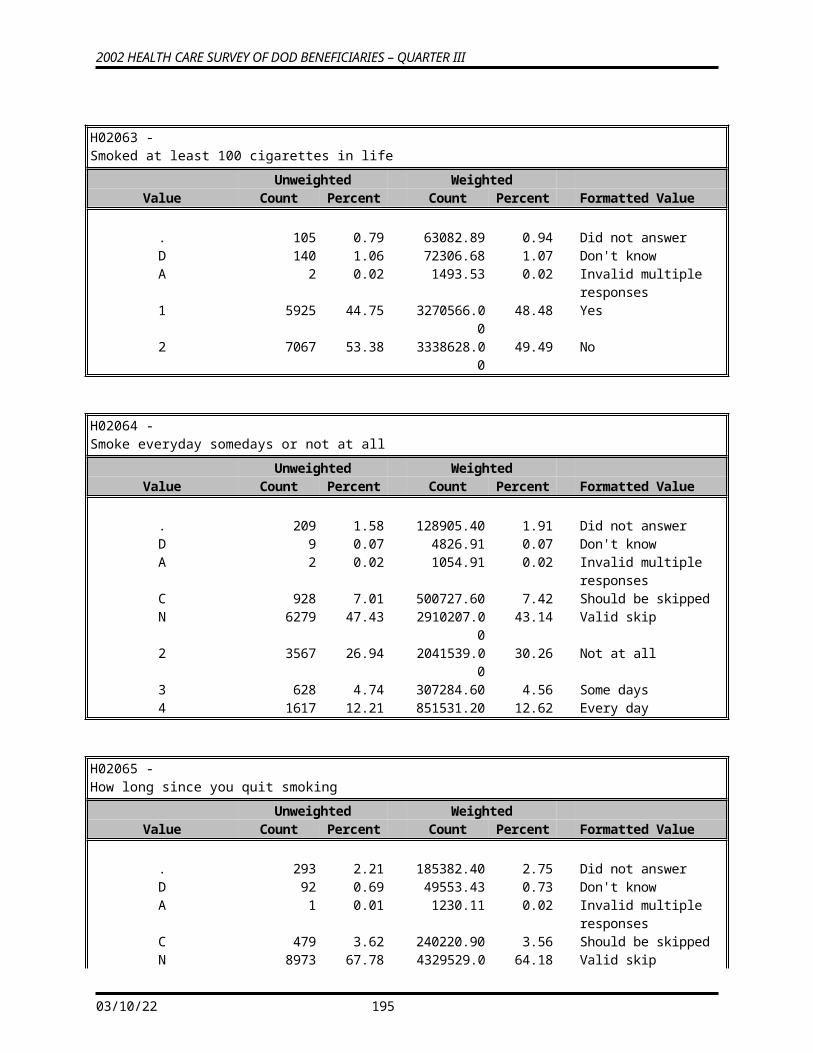
2002 HEALTH CARE SURVEY OF DOD BENEFICIARIES – QUARTER III
WRWT19 -Replicated/JackKnife Weight 19
Unweighted WeightedValue Count Percent Count Percent Formatted Value
0.000 -- 95.206 1343 10.14 190352.30 2.82 Minimum to 10th Percentile
96.166 -- 143.253 1977 14.93 229510.50 3.40 >10th to 25th Percentile144.708 -- 334.385 3313 25.02 739351.10 10.96 >25th to 50th Percentile335.247 -- 584.220 3331 25.16 1473642.00 21.84 >50th to 75th Percentile584.763 -- 1449.940 1967 14.86 1621547.00 24.04 >75th to 90th Percentile1513.460 -- 10140.35 1308 9.88 2491675.00 36.94 >90th to 100th Percentile
WRWT20 -Replicated/JackKnife Weight 20
Unweighted WeightedValue Count Percent Count Percent Formatted Value
0.000 -- 94.543 1330 10.05 191304.10 2.84 Minimum to 10th Percentile
95.206 -- 145.042 1980 14.96 229416.00 3.40 >10th to 25th Percentile146.296 -- 337.606 3352 25.32 749088.80 11.10 >25th to 50th Percentile339.821 -- 565.895 3245 24.51 1431656.00 21.22 >50th to 75th Percentile567.887 -- 1442.059 2024 15.29 1653409.00 24.51 >75th to 90th Percentile1447.657 -- 10204.76 1308 9.88 2491203.00 36.93 >90th to 100th Percentile
WRWT21 -Replicated/JackKnife Weight 21
Unweighted WeightedValue Count Percent Count Percent Formatted Value
0.000 -- 95.206 1334 10.08 206729.40 3.06 Minimum to 10th Percentile
96.166 -- 141.110 1979 14.95 229610.80 3.40 >10th to 25th Percentile146.367 -- 335.727 3335 25.19 744027.70 11.03 >25th to 50th Percentile335.996 -- 584.112 3310 25.00 1462991.00 21.69 >50th to 75th Percentile584.763 -- 1449.940 1976 14.93 1625778.00 24.10 >75th to 90th Percentile1481.897 -- 11044.60 1305 9.86 2476940.00 36.72 >90th to 100th Percentile
05/13/23 197
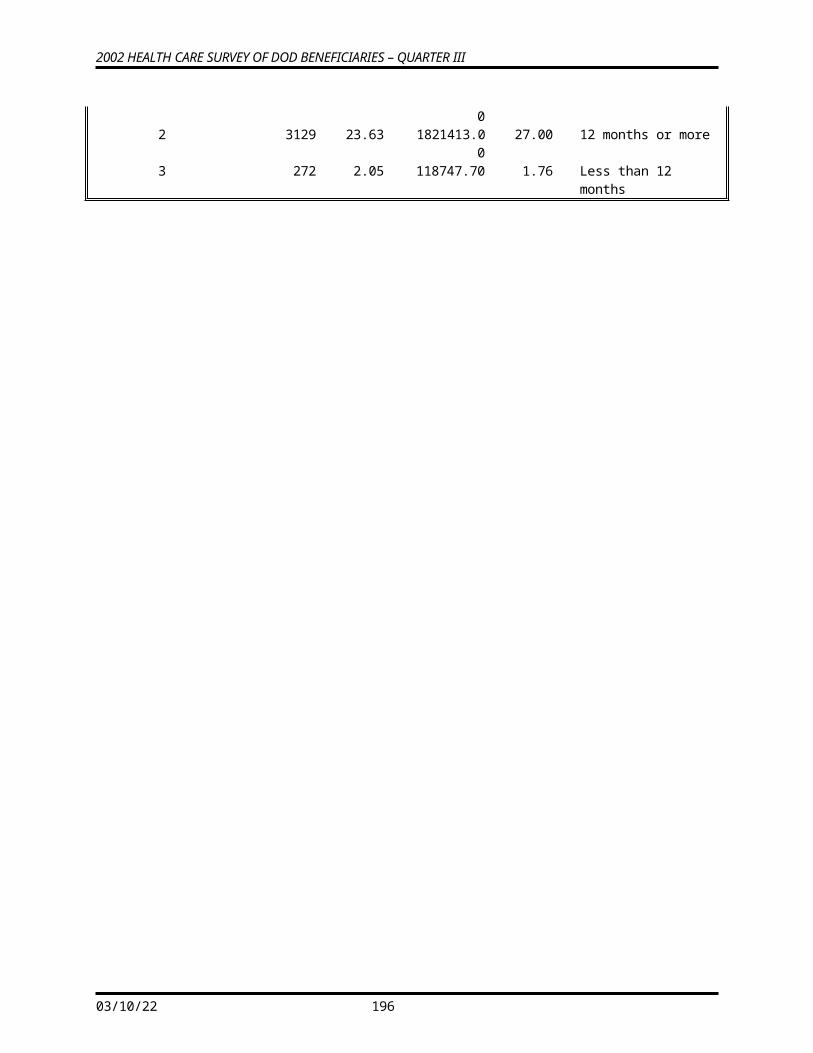
2002 HEALTH CARE SURVEY OF DOD BENEFICIARIES – QUARTER III
WRWT22 -Replicated/JackKnife Weight 22
Unweighted WeightedValue Count Percent Count Percent Formatted Value
0.000 -- 97.391 1341 10.13 181421.70 2.69 Minimum to 10th Percentile
98.948 -- 146.367 2032 15.35 237999.10 3.53 >10th to 25th Percentile147.067 -- 332.019 3250 24.55 728380.10 10.80 >25th to 50th Percentile333.912 -- 584.220 3357 25.36 1486339.00 22.03 >50th to 75th Percentile586.692 -- 1426.470 1947 14.71 1612067.00 23.90 >75th to 90th Percentile1447.657 -- 10148.34 1312 9.91 2499871.00 37.06 >90th to 100th Percentile
WRWT23 -Replicated/JackKnife Weight 23
Unweighted WeightedValue Count Percent Count Percent Formatted Value
0.000 -- 94.543 1325 10.01 214560.40 3.18 Minimum to 10th Percentile
97.391 -- 143.253 2028 15.32 235893.80 3.50 >10th to 25th Percentile144.708 -- 337.606 3285 24.81 733172.20 10.87 >25th to 50th Percentile339.821 -- 572.388 3294 24.88 1450437.00 21.50 >50th to 75th Percentile582.229 -- 1442.059 2007 15.16 1643782.00 24.37 >75th to 90th Percentile1481.897 -- 11006.43 1300 9.82 2468232.00 36.59 >90th to 100th Percentile
WRWT24 -Replicated/JackKnife Weight 24
Unweighted WeightedValue Count Percent Count Percent Formatted Value
0.000 -- 94.660 1337 10.10 193218.10 2.86 Minimum to 10th Percentile
95.206 -- 143.253 1958 14.79 227069.90 3.37 >10th to 25th Percentile144.708 -- 337.606 3352 25.32 747156.10 11.08 >25th to 50th Percentile342.264 -- 582.029 3303 24.95 1461439.00 21.66 >50th to 75th Percentile582.539 -- 1442.059 1983 14.98 1631335.00 24.18 >75th to 90th Percentile1511.084 -- 10394.36 1306 9.86 2485859.00 36.85 >90th to 100th Percentile
05/13/23 198
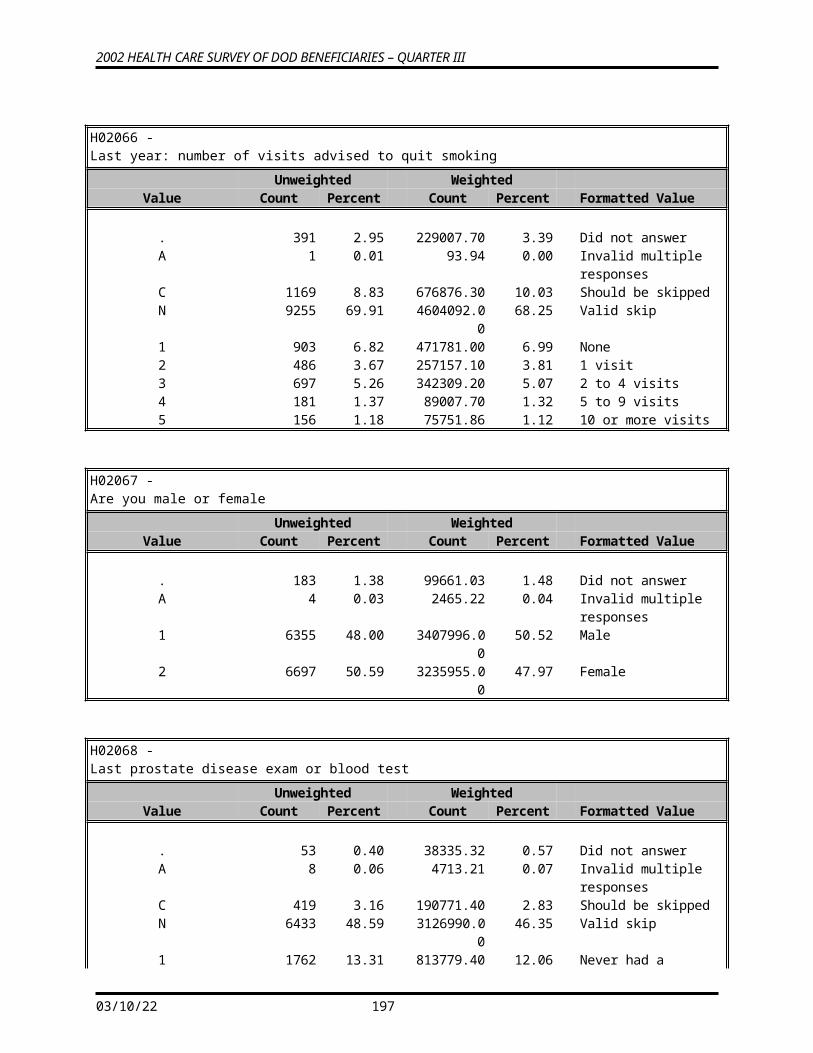
2002 HEALTH CARE SURVEY OF DOD BENEFICIARIES – QUARTER III
WRWT25 -Replicated/JackKnife Weight 25
Unweighted WeightedValue Count Percent Count Percent Formatted Value
0.000 -- 97.297 1351 10.20 199208.60 2.95 Minimum to 10th Percentile
97.951 -- 141.071 1983 14.98 230861.60 3.42 >10th to 25th Percentile144.708 -- 335.247 3316 25.05 742426.00 11.01 >25th to 50th Percentile335.996 -- 578.178 3253 24.57 1432633.00 21.24 >50th to 75th Percentile581.544 -- 1449.940 2030 15.33 1655368.00 24.54 >75th to 90th Percentile1499.228 -- 10427.94 1306 9.86 2485580.00 36.84 >90th to 100th Percentile
WRWT26 -Replicated/JackKnife Weight 26
Unweighted WeightedValue Count Percent Count Percent Formatted Value
0.000 -- 95.067 1341 10.13 185490.50 2.75 Minimum to 10th Percentile
95.206 -- 145.042 2013 15.21 234797.20 3.48 >10th to 25th Percentile147.661 -- 342.264 3283 24.80 735113.50 10.90 >25th to 50th Percentile343.229 -- 582.029 3310 25.00 1462291.00 21.68 >50th to 75th Percentile584.112 -- 1449.940 1977 14.93 1624293.00 24.08 >75th to 90th Percentile1493.331 -- 10116.10 1315 9.93 2504091.00 37.12 >90th to 100th Percentile
WRWT27 -Replicated/JackKnife Weight 27
Unweighted WeightedValue Count Percent Count Percent Formatted Value
0.000 -- 94.660 1337 10.10 182790.90 2.71 Minimum to 10th Percentile
97.951 -- 143.253 2000 15.11 233047.50 3.45 >10th to 25th Percentile145.085 -- 332.019 3300 24.93 739034.00 10.96 >25th to 50th Percentile337.606 -- 582.229 3296 24.90 1454925.00 21.57 >50th to 75th Percentile584.072 -- 1434.264 1994 15.06 1638188.00 24.28 >75th to 90th Percentile1447.657 -- 10116.10 1312 9.91 2498092.00 37.03 >90th to 100th Percentile
05/13/23 199
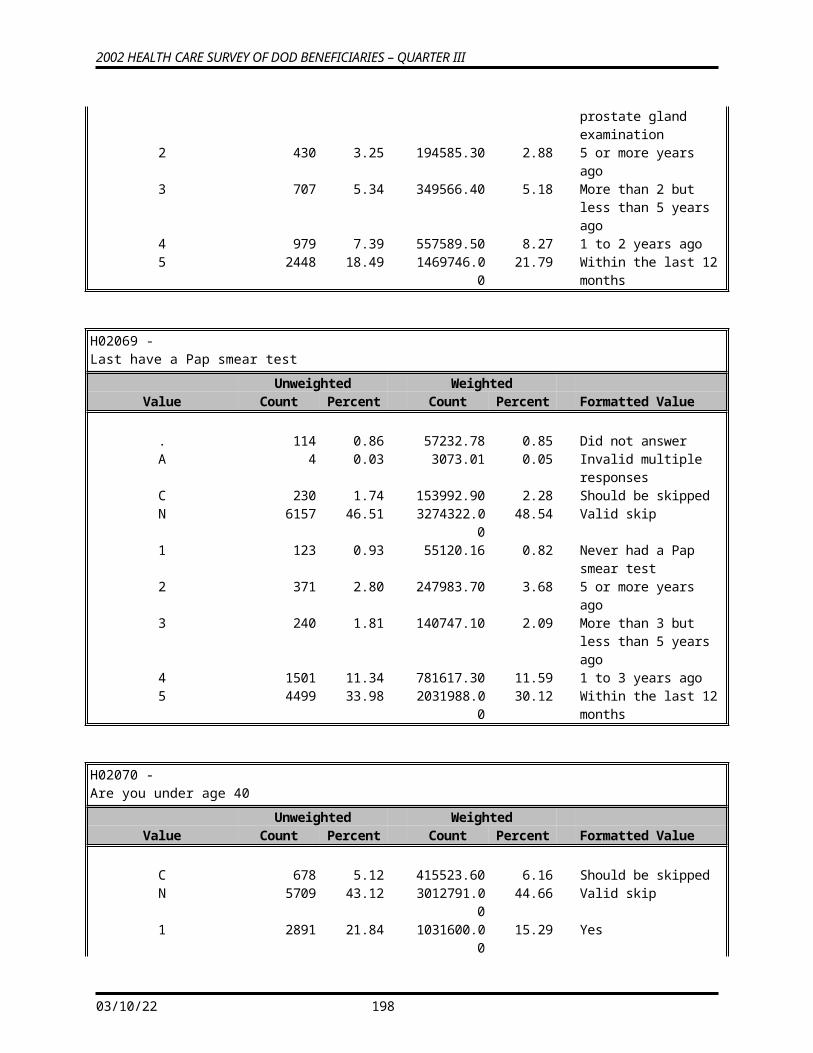
2002 HEALTH CARE SURVEY OF DOD BENEFICIARIES – QUARTER III
WRWT28 -Replicated/JackKnife Weight 28
Unweighted WeightedValue Count Percent Count Percent Formatted Value
0.000 -- 94.660 1327 10.02 196702.00 2.92 Minimum to 10th Percentile
95.206 -- 145.085 2004 15.14 233284.10 3.46 >10th to 25th Percentile146.008 -- 341.832 3320 25.08 744250.00 11.03 >25th to 50th Percentile342.264 -- 573.210 3278 24.76 1447040.00 21.45 >50th to 75th Percentile581.544 -- 1442.059 2005 15.14 1644384.00 24.38 >75th to 90th Percentile1447.657 -- 10689.15 1305 9.86 2480417.00 36.77 >90th to 100th Percentile
WRWT29 -Replicated/JackKnife Weight 29
Unweighted WeightedValue Count Percent Count Percent Formatted Value
0.000 -- 95.206 1348 10.18 201236.70 2.98 Minimum to 10th Percentile
98.448 -- 143.253 1954 14.76 226954.70 3.36 >10th to 25th Percentile143.783 -- 337.606 3318 25.06 736997.10 10.92 >25th to 50th Percentile338.554 -- 571.390 3318 25.06 1461813.00 21.67 >50th to 75th Percentile582.978 -- 1434.264 1997 15.08 1640232.00 24.31 >75th to 90th Percentile1447.657 -- 10760.91 1304 9.85 2478843.00 36.74 >90th to 100th Percentile
WRWT30 -Replicated/JackKnife Weight 30
Unweighted WeightedValue Count Percent Count Percent Formatted Value
0.000 -- 97.297 1354 10.23 188522.30 2.79 Minimum to 10th Percentile
100.655 -- 146.367 2004 15.14 234949.30 3.48 >10th to 25th Percentile146.691 -- 335.996 3288 24.84 740364.10 10.97 >25th to 50th Percentile337.606 -- 582.229 3285 24.81 1452303.00 21.53 >50th to 75th Percentile584.072 -- 1434.264 2000 15.11 1642849.00 24.35 >75th to 90th Percentile1447.657 -- 10694.06 1308 9.88 2487089.00 36.87 >90th to 100th Percentile
05/13/23 200
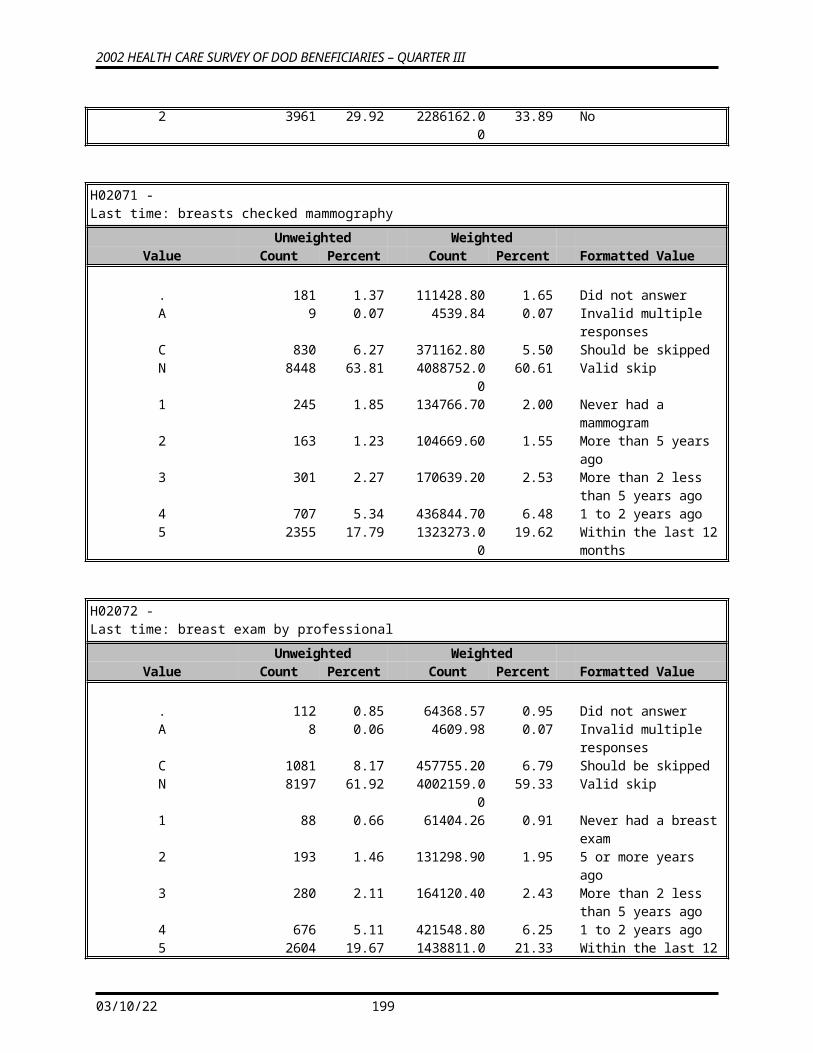
2002 HEALTH CARE SURVEY OF DOD BENEFICIARIES – QUARTER III
WRWT31 -Replicated/JackKnife Weight 31
Unweighted WeightedValue Count Percent Count Percent Formatted Value
0.000 -- 98.948 1389 10.49 193398.40 2.87 Minimum to 10th Percentile
99.014 -- 141.071 1905 14.39 222369.00 3.30 >10th to 25th Percentile143.783 -- 335.996 3336 25.20 744304.90 11.03 >25th to 50th Percentile339.821 -- 567.384 3276 24.75 1442796.00 21.39 >50th to 75th Percentile567.887 -- 1457.908 2050 15.48 1690725.00 25.06 >75th to 90th Percentile1499.228 -- 10153.00 1283 9.69 2452483.00 36.35 >90th to 100th Percentile
WRWT32 -Replicated/JackKnife Weight 32
Unweighted WeightedValue Count Percent Count Percent Formatted Value
0.000 -- 95.630 1360 10.27 187525.50 2.78 Minimum to 10th Percentile
97.951 -- 145.085 1957 14.78 228242.30 3.38 >10th to 25th Percentile146.296 -- 335.139 3324 25.11 744045.40 11.03 >25th to 50th Percentile335.996 -- 582.229 3290 24.85 1452679.00 21.53 >50th to 75th Percentile583.808 -- 1457.908 2019 15.25 1668033.00 24.73 >75th to 90th Percentile1493.331 -- 10120.75 1289 9.74 2465552.00 36.55 >90th to 100th Percentile
WRWT33 -Replicated/JackKnife Weight 33
Unweighted WeightedValue Count Percent Count Percent Formatted Value
0.000 -- 95.067 1340 10.12 181503.30 2.69 Minimum to 10th Percentile
97.951 -- 145.085 1994 15.06 232360.30 3.44 >10th to 25th Percentile146.367 -- 335.996 3329 25.15 747011.40 11.07 >25th to 50th Percentile341.832 -- 573.210 3266 24.67 1443508.00 21.40 >50th to 75th Percentile576.930 -- 1434.264 1995 15.07 1637066.00 24.27 >75th to 90th Percentile1447.657 -- 10236.18 1315 9.93 2504627.00 37.13 >90th to 100th Percentile
05/13/23 201
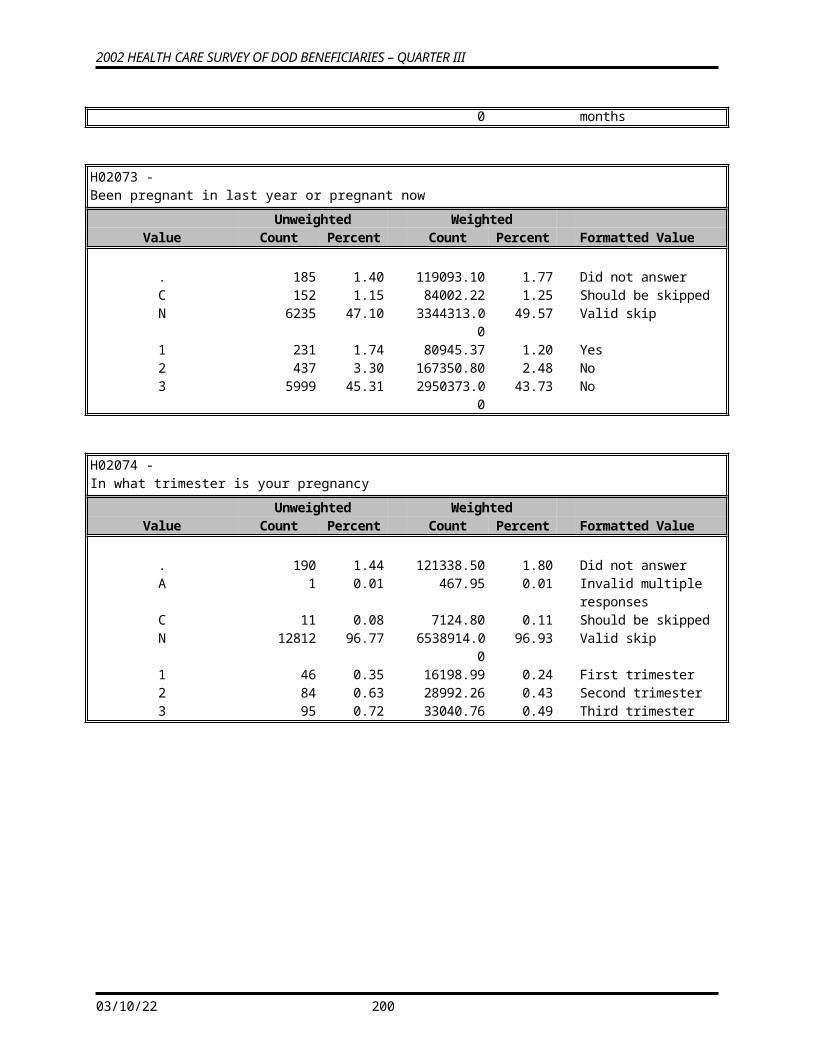
2002 HEALTH CARE SURVEY OF DOD BENEFICIARIES – QUARTER III
WRWT34 -Replicated/JackKnife Weight 34
Unweighted WeightedValue Count Percent Count Percent Formatted Value
0.000 -- 94.660 1362 10.29 191551.70 2.84 Minimum to 10th Percentile
97.951 -- 145.085 1956 14.77 227302.30 3.37 >10th to 25th Percentile146.008 -- 335.996 3346 25.27 747480.50 11.08 >25th to 50th Percentile339.195 -- 584.220 3340 25.23 1484677.00 22.01 >50th to 75th Percentile589.463 -- 1426.552 1925 14.54 1599004.00 23.70 >75th to 90th Percentile1513.460 -- 10222.20 1310 9.90 2496062.00 37.00 >90th to 100th Percentile
WRWT35 -Replicated/JackKnife Weight 35
Unweighted WeightedValue Count Percent Count Percent Formatted Value
0.000 -- 97.297 1350 10.20 188642.80 2.80 Minimum to 10th Percentile
97.951 -- 143.253 1964 14.83 229055.70 3.40 >10th to 25th Percentile144.757 -- 337.771 3322 25.09 741545.20 10.99 >25th to 50th Percentile339.821 -- 584.112 3345 25.27 1482073.00 21.97 >50th to 75th Percentile586.164 -- 1442.059 1949 14.72 1612233.00 23.90 >75th to 90th Percentile1447.657 -- 10450.48 1309 9.89 2492527.00 36.95 >90th to 100th Percentile
WRWT36 -Replicated/JackKnife Weight 36
Unweighted WeightedValue Count Percent Count Percent Formatted Value
0.000 -- 99.424 1419 10.72 203747.40 3.02 Minimum to 10th Percentile
99.805 -- 146.367 1934 14.61 227498.20 3.37 >10th to 25th Percentile146.825 -- 335.996 3323 25.10 749364.20 11.11 >25th to 50th Percentile339.433 -- 567.384 3229 24.39 1425544.00 21.13 >50th to 75th Percentile567.887 -- 1465.964 2028 15.32 1654032.00 24.52 >75th to 90th Percentile1493.331 -- 10518.47 1306 9.86 2485891.00 36.85 >90th to 100th Percentile
05/13/23 202
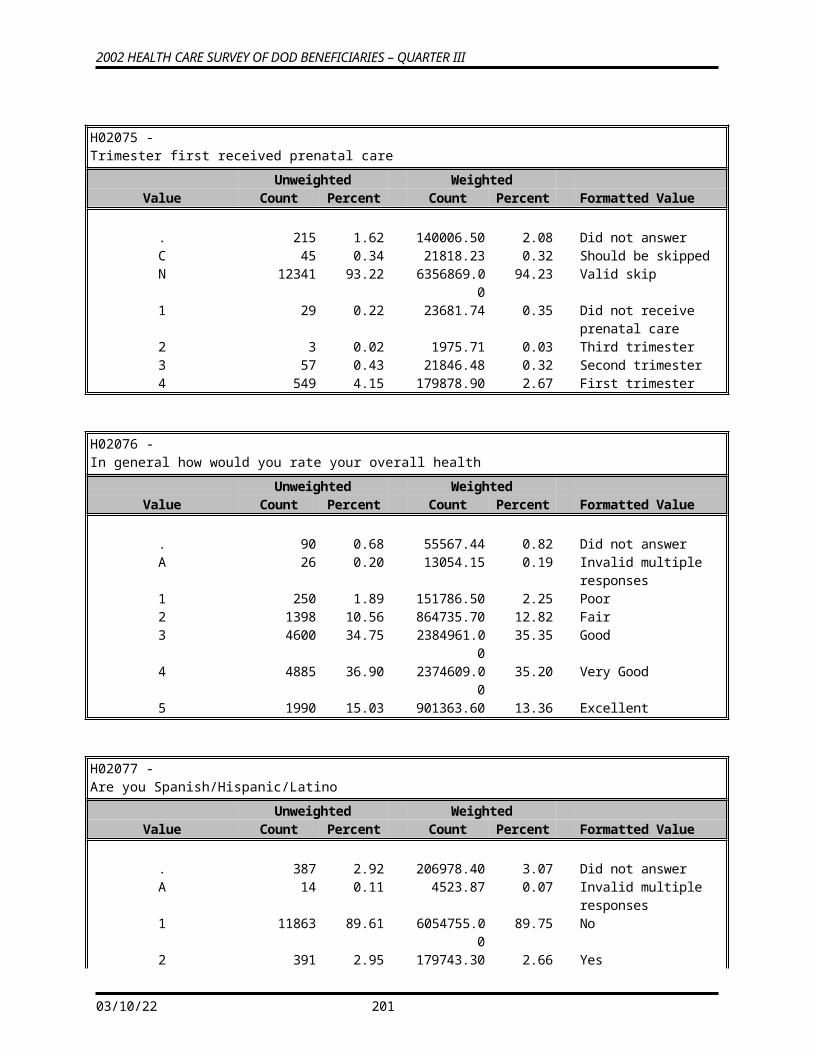
2002 HEALTH CARE SURVEY OF DOD BENEFICIARIES – QUARTER III
WRWT37 -Replicated/JackKnife Weight 37
Unweighted WeightedValue Count Percent Count Percent Formatted Value
0.000 -- 95.206 1333 10.07 180138.10 2.67 Minimum to 10th Percentile
97.951 -- 141.071 1953 14.75 226469.30 3.36 >10th to 25th Percentile144.708 -- 335.996 3339 25.22 743211.40 11.02 >25th to 50th Percentile337.771 -- 582.029 3296 24.90 1454472.00 21.56 >50th to 75th Percentile583.808 -- 1418.922 2011 15.19 1652161.00 24.49 >75th to 90th Percentile1488.085 -- 10203.92 1307 9.87 2489625.00 36.90 >90th to 100th Percentile
WRWT38 -Replicated/JackKnife Weight 38
Unweighted WeightedValue Count Percent Count Percent Formatted Value
0.000 -- 94.660 1360 10.27 195659.20 2.90 Minimum to 10th Percentile
95.206 -- 145.085 1977 14.93 230042.60 3.41 >10th to 25th Percentile146.008 -- 337.771 3286 24.82 732171.30 10.85 >25th to 50th Percentile339.195 -- 569.333 3316 25.05 1461941.00 21.67 >50th to 75th Percentile570.689 -- 1457.908 1992 15.05 1634767.00 24.23 >75th to 90th Percentile1511.084 -- 10203.92 1308 9.88 2491496.00 36.93 >90th to 100th Percentile
WRWT39 -Replicated/JackKnife Weight 39
Unweighted WeightedValue Count Percent Count Percent Formatted Value
0.000 -- 94.660 1355 10.23 198593.20 2.94 Minimum to 10th Percentile
97.951 -- 142.253 1951 14.74 226220.80 3.35 >10th to 25th Percentile143.783 -- 337.288 3368 25.44 753450.40 11.17 >25th to 50th Percentile339.913 -- 571.390 3243 24.50 1431367.00 21.22 >50th to 75th Percentile581.544 -- 1442.059 2017 15.24 1650145.00 24.46 >75th to 90th Percentile1447.657 -- 10222.20 1305 9.86 2486301.00 36.86 >90th to 100th Percentile
05/13/23 203
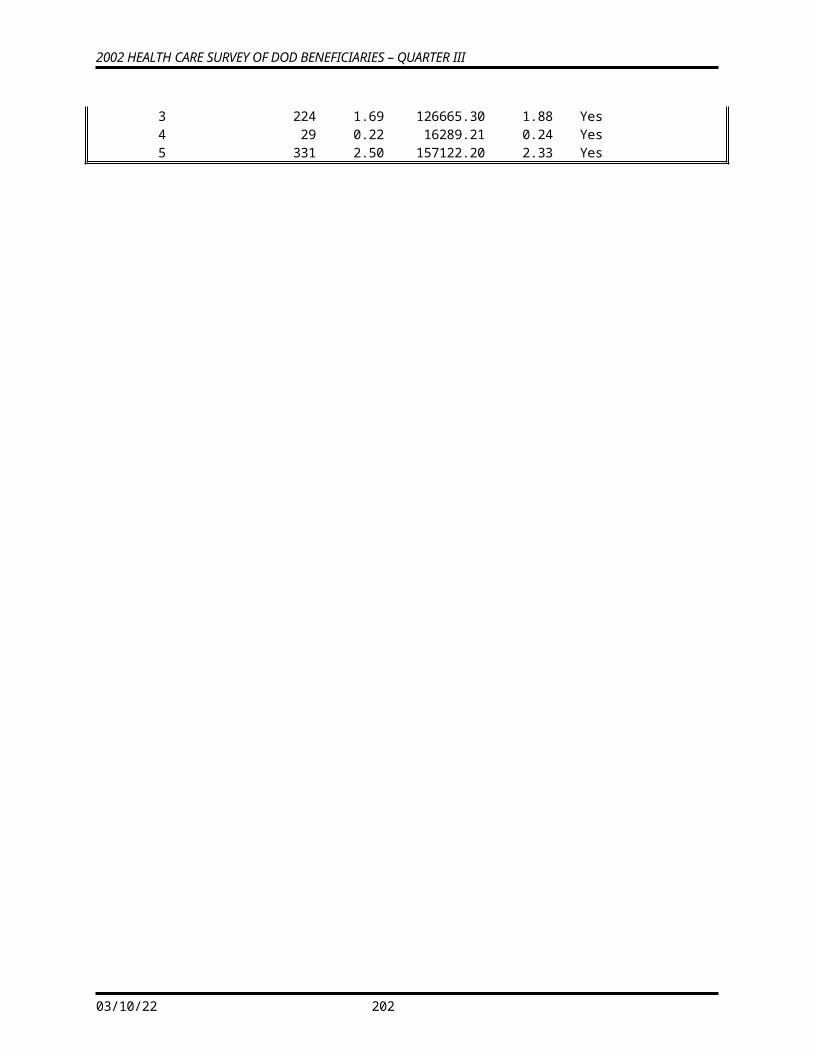
2002 HEALTH CARE SURVEY OF DOD BENEFICIARIES – QUARTER III
WRWT40 -Replicated/JackKnife Weight 40
Unweighted WeightedValue Count Percent Count Percent Formatted Value
0.000 -- 97.297 1351 10.20 203988.20 3.02 Minimum to 10th Percentile
98.448 -- 143.253 2001 15.11 233314.80 3.46 >10th to 25th Percentile143.783 -- 339.913 3298 24.91 739468.10 10.96 >25th to 50th Percentile341.832 -- 567.384 3298 24.91 1457891.00 21.61 >50th to 75th Percentile571.390 -- 1442.059 1989 15.02 1636087.00 24.25 >75th to 90th Percentile1493.331 -- 10818.26 1302 9.83 2475329.00 36.69 >90th to 100th Percentile
WRWT41 -Replicated/JackKnife Weight 41
Unweighted WeightedValue Count Percent Count Percent Formatted Value
0.000 -- 97.297 1352 10.21 186040.00 2.76 Minimum to 10th Percentile
97.951 -- 145.085 1972 14.90 230286.80 3.41 >10th to 25th Percentile146.008 -- 337.771 3344 25.26 752152.60 11.15 >25th to 50th Percentile339.913 -- 582.229 3298 24.91 1464895.00 21.71 >50th to 75th Percentile584.072 -- 1442.059 1964 14.83 1619904.00 24.01 >75th to 90th Percentile1447.657 -- 10203.92 1309 9.89 2492798.00 36.95 >90th to 100th Percentile
WRWT42 -Replicated/JackKnife Weight 42
Unweighted WeightedValue Count Percent Count Percent Formatted Value
0.000 -- 95.067 1341 10.13 197293.20 2.92 Minimum to 10th Percentile
95.206 -- 144.204 1973 14.90 229061.80 3.40 >10th to 25th Percentile144.708 -- 337.288 3352 25.32 748648.40 11.10 >25th to 50th Percentile338.746 -- 576.349 3277 24.75 1449169.00 21.48 >50th to 75th Percentile578.914 -- 1442.059 1991 15.04 1635478.00 24.24 >75th to 90th Percentile1447.657 -- 10222.20 1305 9.86 2486426.00 36.86 >90th to 100th Percentile
05/13/23 204
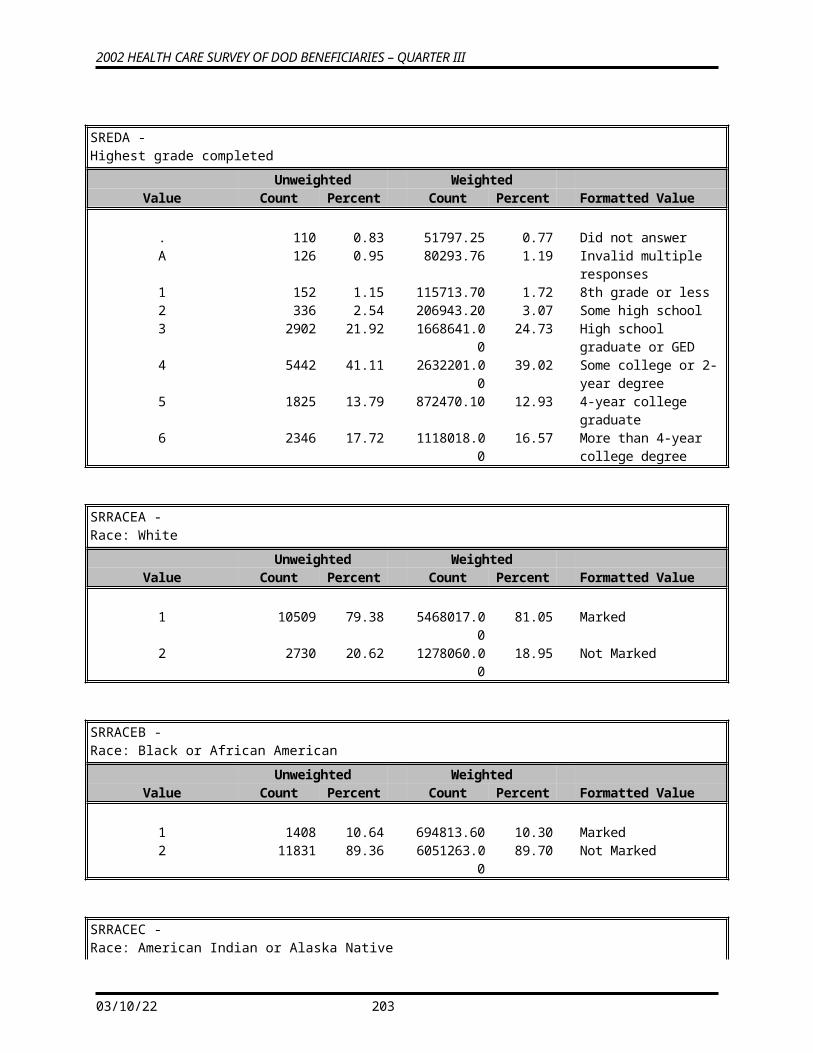
2002 HEALTH CARE SURVEY OF DOD BENEFICIARIES – QUARTER III
WRWT43 -Replicated/JackKnife Weight 43
Unweighted WeightedValue Count Percent Count Percent Formatted Value
0.000 -- 94.660 1324 10.00 179845.10 2.67 Minimum to 10th Percentile
99.014 -- 145.085 1987 15.01 231362.20 3.43 >10th to 25th Percentile146.296 -- 333.467 3317 25.05 742123.30 11.00 >25th to 50th Percentile334.662 -- 583.101 3307 24.98 1461472.00 21.66 >50th to 75th Percentile584.072 -- 1442.059 1994 15.06 1637885.00 24.28 >75th to 90th Percentile1447.657 -- 10450.48 1310 9.90 2493389.00 36.96 >90th to 100th Percentile
WRWT44 -Replicated/JackKnife Weight 44
Unweighted WeightedValue Count Percent Count Percent Formatted Value
0.000 -- 95.360 1332 10.06 190932.40 2.83 Minimum to 10th Percentile
97.951 -- 146.367 2017 15.24 235641.50 3.49 >10th to 25th Percentile146.825 -- 337.288 3328 25.14 749624.90 11.11 >25th to 50th Percentile339.913 -- 584.112 3287 24.83 1458394.00 21.62 >50th to 75th Percentile587.359 -- 1442.059 1968 14.87 1621248.00 24.03 >75th to 90th Percentile1514.261 -- 10203.92 1307 9.87 2490236.00 36.91 >90th to 100th Percentile
WRWT45 -Replicated/JackKnife Weight 45
Unweighted WeightedValue Count Percent Count Percent Formatted Value
0.000 -- 95.206 1345 10.16 196797.90 2.92 Minimum to 10th Percentile
97.297 -- 142.259 1976 14.93 229067.60 3.40 >10th to 25th Percentile145.085 -- 338.081 3331 25.16 744557.00 11.04 >25th to 50th Percentile339.195 -- 567.384 3255 24.59 1434558.00 21.27 >50th to 75th Percentile567.887 -- 1449.940 2050 15.48 1689494.00 25.04 >75th to 90th Percentile1493.331 -- 10203.92 1282 9.68 2451602.00 36.34 >90th to 100th Percentile
05/13/23 205
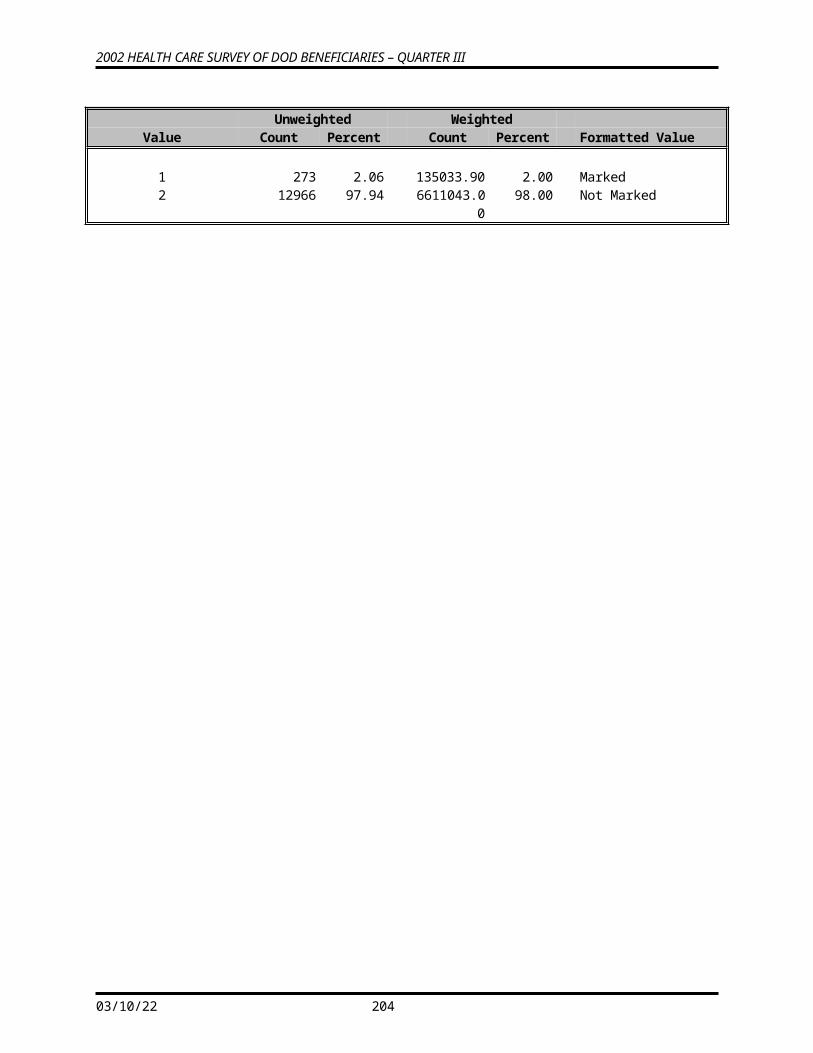
2002 HEALTH CARE SURVEY OF DOD BENEFICIARIES – QUARTER III
WRWT46 -Replicated/JackKnife Weight 46
Unweighted WeightedValue Count Percent Count Percent Formatted Value
0.000 -- 95.206 1361 10.28 193217.40 2.86 Minimum to 10th Percentile
97.961 -- 143.253 1985 14.99 232270.90 3.44 >10th to 25th Percentile143.783 -- 334.662 3283 24.80 734656.50 10.89 >25th to 50th Percentile335.247 -- 583.101 3317 25.05 1464715.00 21.71 >50th to 75th Percentile584.112 -- 1442.059 1987 15.01 1634404.00 24.23 >75th to 90th Percentile1447.657 -- 10222.20 1306 9.86 2486814.00 36.86 >90th to 100th Percentile
WRWT47 -Replicated/JackKnife Weight 47
Unweighted WeightedValue Count Percent Count Percent Formatted Value
0.000 -- 97.297 1326 10.02 186403.90 2.76 Minimum to 10th Percentile
97.951 -- 144.150 2000 15.11 232141.10 3.44 >10th to 25th Percentile145.085 -- 339.913 3296 24.90 735246.10 10.90 >25th to 50th Percentile342.264 -- 582.229 3341 25.24 1476912.00 21.89 >50th to 75th Percentile584.112 -- 1442.059 1968 14.87 1624411.00 24.08 >75th to 90th Percentile1447.657 -- 10450.48 1308 9.88 2490963.00 36.92 >90th to 100th Percentile
WRWT48 -Replicated/JackKnife Weight 48
Unweighted WeightedValue Count Percent Count Percent Formatted Value
0.000 -- 97.297 1355 10.23 198037.80 2.94 Minimum to 10th Percentile
97.951 -- 142.253 1960 14.80 227040.10 3.37 >10th to 25th Percentile145.085 -- 337.288 3357 25.36 749188.70 11.11 >25th to 50th Percentile340.712 -- 567.384 3279 24.77 1450683.00 21.50 >50th to 75th Percentile570.689 -- 1442.059 1979 14.95 1627837.00 24.13 >75th to 90th Percentile1447.657 -- 10203.92 1309 9.89 2493290.00 36.96 >90th to 100th Percentile
05/13/23 206
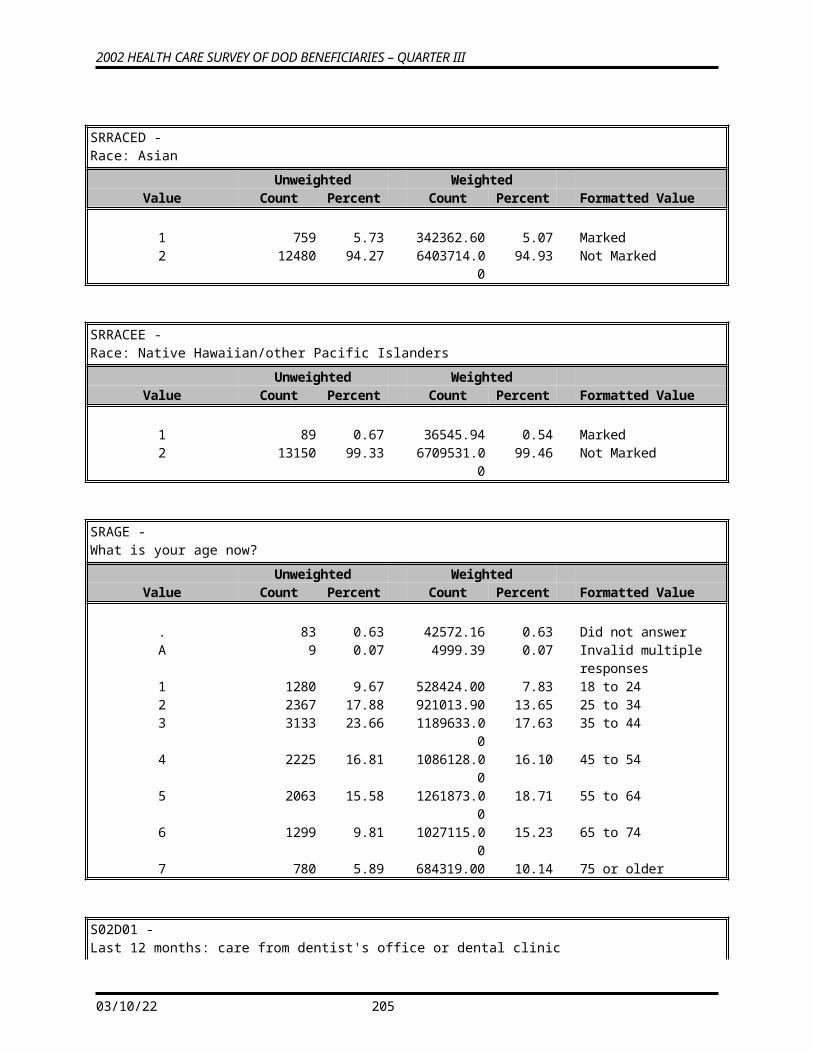
2002 HEALTH CARE SURVEY OF DOD BENEFICIARIES – QUARTER III
WRWT49 -Replicated/JackKnife Weight 49
Unweighted WeightedValue Count Percent Count Percent Formatted Value
0.000 -- 97.297 1341 10.13 196578.90 2.91 Minimum to 10th Percentile
98.963 -- 144.204 1980 14.96 229461.40 3.40 >10th to 25th Percentile145.042 -- 334.662 3310 25.00 737209.50 10.93 >25th to 50th Percentile335.247 -- 567.384 3310 25.00 1460222.00 21.65 >50th to 75th Percentile570.689 -- 1449.940 2013 15.21 1665953.00 24.70 >75th to 90th Percentile1481.897 -- 10236.44 1285 9.71 2456652.00 36.42 >90th to 100th Percentile
WRWT50 -Replicated/JackKnife Weight 50
Unweighted WeightedValue Count Percent Count Percent Formatted Value
0.000 -- 94.435 1324 10.00 193593.30 2.87 Minimum to 10th Percentile
97.341 -- 145.085 1991 15.04 230917.10 3.42 >10th to 25th Percentile146.825 -- 335.247 3311 25.01 737843.10 10.94 >25th to 50th Percentile336.949 -- 567.384 3324 25.11 1466350.00 21.74 >50th to 75th Percentile567.887 -- 1442.059 1984 14.99 1631342.00 24.18 >75th to 90th Percentile1447.657 -- 10203.92 1305 9.86 2486032.00 36.85 >90th to 100th Percentile
WRWT51 -Replicated/JackKnife Weight 51
Unweighted WeightedValue Count Percent Count Percent Formatted Value
0.000 -- 95.206 1330 10.05 195406.70 2.90 Minimum to 10th Percentile
97.297 -- 144.150 1983 14.98 229524.90 3.40 >10th to 25th Percentile144.708 -- 339.433 3329 25.15 742537.90 11.01 >25th to 50th Percentile340.712 -- 584.112 3332 25.17 1475590.00 21.87 >50th to 75th Percentile584.763 -- 1457.908 1959 14.80 1614778.00 23.94 >75th to 90th Percentile1493.331 -- 10203.92 1306 9.86 2488239.00 36.88 >90th to 100th Percentile
05/13/23 207
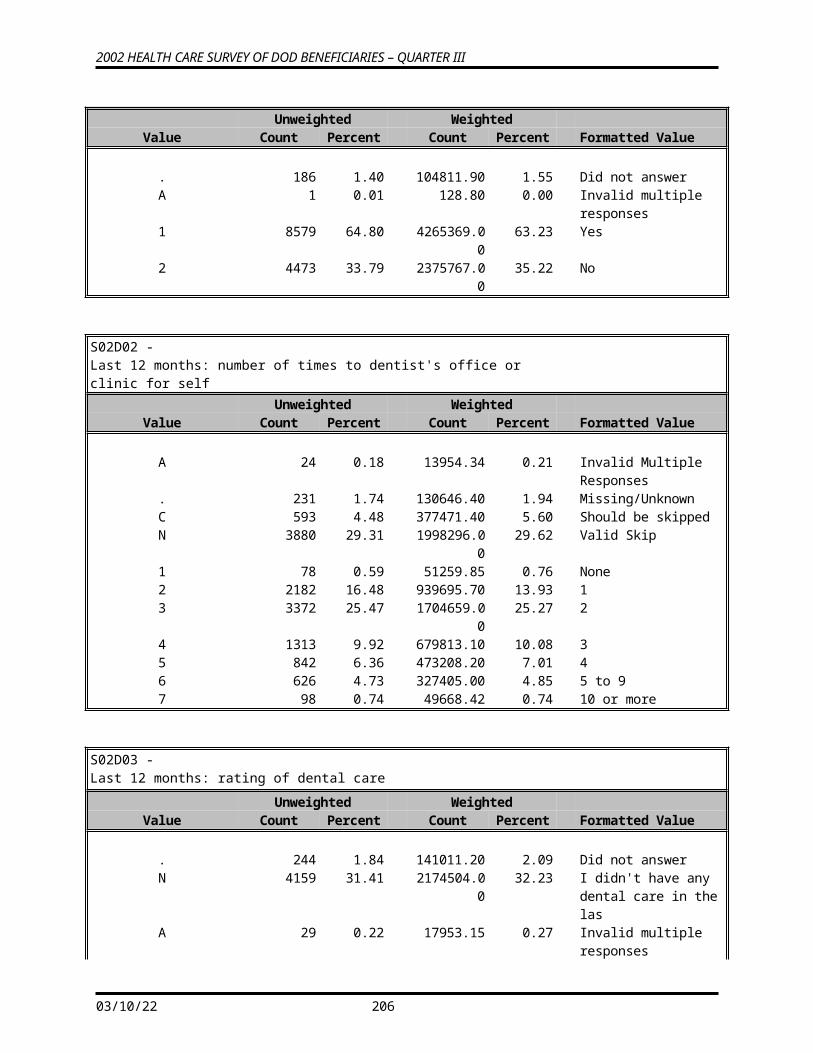
2002 HEALTH CARE SURVEY OF DOD BENEFICIARIES – QUARTER III
WRWT52 -Replicated/JackKnife Weight 52
Unweighted WeightedValue Count Percent Count Percent Formatted Value
0.000 -- 95.360 1377 10.40 194860.10 2.89 Minimum to 10th Percentile
98.448 -- 144.150 1967 14.86 229702.30 3.40 >10th to 25th Percentile146.825 -- 337.577 3304 24.96 740382.90 10.98 >25th to 50th Percentile339.433 -- 584.112 3333 25.18 1477530.00 21.90 >50th to 75th Percentile584.763 -- 1449.940 1974 14.91 1646946.00 24.41 >75th to 90th Percentile1481.897 -- 10203.92 1284 9.70 2456656.00 36.42 >90th to 100th Percentile
WRWT53 -Replicated/JackKnife Weight 53
Unweighted WeightedValue Count Percent Count Percent Formatted Value
0.000 -- 95.067 1350 10.20 192527.10 2.85 Minimum to 10th Percentile
95.206 -- 142.253 1963 14.83 227802.40 3.38 >10th to 25th Percentile147.067 -- 334.662 3320 25.08 739442.70 10.96 >25th to 50th Percentile336.949 -- 582.229 3302 24.94 1455654.00 21.58 >50th to 75th Percentile584.112 -- 1449.940 2016 15.23 1668654.00 24.74 >75th to 90th Percentile1481.897 -- 10257.50 1288 9.73 2461997.00 36.50 >90th to 100th Percentile
WRWT54 -Replicated/JackKnife Weight 54
Unweighted WeightedValue Count Percent Count Percent Formatted Value
0.000 -- 94.660 1363 10.30 209556.90 3.11 Minimum to 10th Percentile
95.206 -- 143.253 1982 14.97 230688.40 3.42 >10th to 25th Percentile143.783 -- 337.577 3300 24.93 737107.40 10.93 >25th to 50th Percentile339.913 -- 584.112 3336 25.20 1477419.00 21.90 >50th to 75th Percentile584.763 -- 1457.908 1960 14.80 1616842.00 23.97 >75th to 90th Percentile1513.460 -- 10243.23 1298 9.80 2474464.00 36.68 >90th to 100th Percentile
05/13/23 208
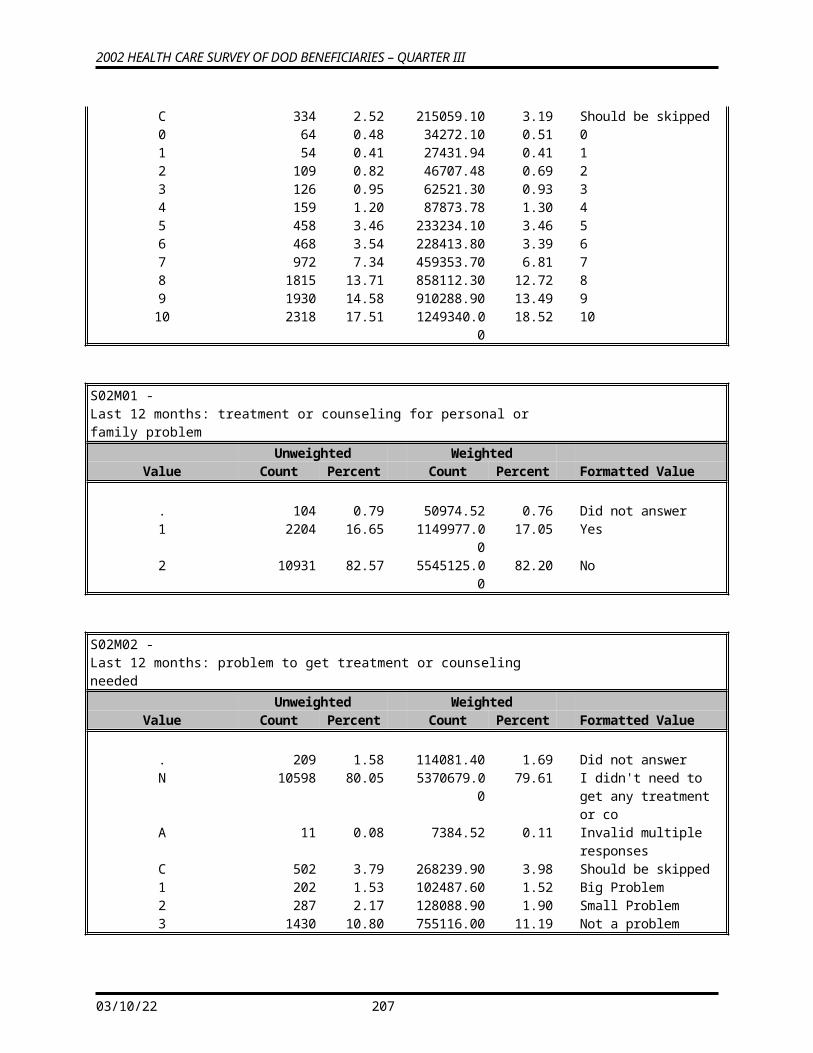
2002 HEALTH CARE SURVEY OF DOD BENEFICIARIES – QUARTER III
WRWT55 -Replicated/JackKnife Weight 55
Unweighted WeightedValue Count Percent Count Percent Formatted Value
0.000 -- 94.660 1354 10.23 196256.10 2.91 Minimum to 10th Percentile
95.206 -- 141.110 1941 14.66 224714.00 3.33 >10th to 25th Percentile143.783 -- 337.577 3371 25.46 750772.50 11.13 >25th to 50th Percentile338.746 -- 583.101 3280 24.78 1450117.00 21.50 >50th to 75th Percentile584.072 -- 1434.264 1984 14.99 1630690.00 24.17 >75th to 90th Percentile1493.331 -- 10221.69 1309 9.89 2493527.00 36.96 >90th to 100th Percentile
WRWT56 -Replicated/JackKnife Weight 56
Unweighted WeightedValue Count Percent Count Percent Formatted Value
0.000 -- 94.660 1346 10.17 193543.40 2.87 Minimum to 10th Percentile
95.206 -- 141.110 1970 14.88 228760.80 3.39 >10th to 25th Percentile144.708 -- 337.159 3326 25.12 743218.70 11.02 >25th to 50th Percentile337.577 -- 582.229 3320 25.08 1469093.00 21.78 >50th to 75th Percentile583.299 -- 1438.494 1971 14.89 1624468.00 24.08 >75th to 90th Percentile1447.657 -- 10305.16 1306 9.86 2486993.00 36.87 >90th to 100th Percentile
WRWT57 -Replicated/JackKnife Weight 57
Unweighted WeightedValue Count Percent Count Percent Formatted Value
0.000 -- 95.238 1328 10.03 186872.20 2.77 Minimum to 10th Percentile
97.297 -- 143.253 1980 14.96 229981.80 3.41 >10th to 25th Percentile143.783 -- 337.577 3328 25.14 743905.10 11.03 >25th to 50th Percentile340.712 -- 567.384 3260 24.62 1435462.00 21.28 >50th to 75th Percentile567.887 -- 1438.494 2037 15.39 1663402.00 24.66 >75th to 90th Percentile1447.657 -- 10487.89 1306 9.86 2486453.00 36.86 >90th to 100th Percentile
05/13/23 209
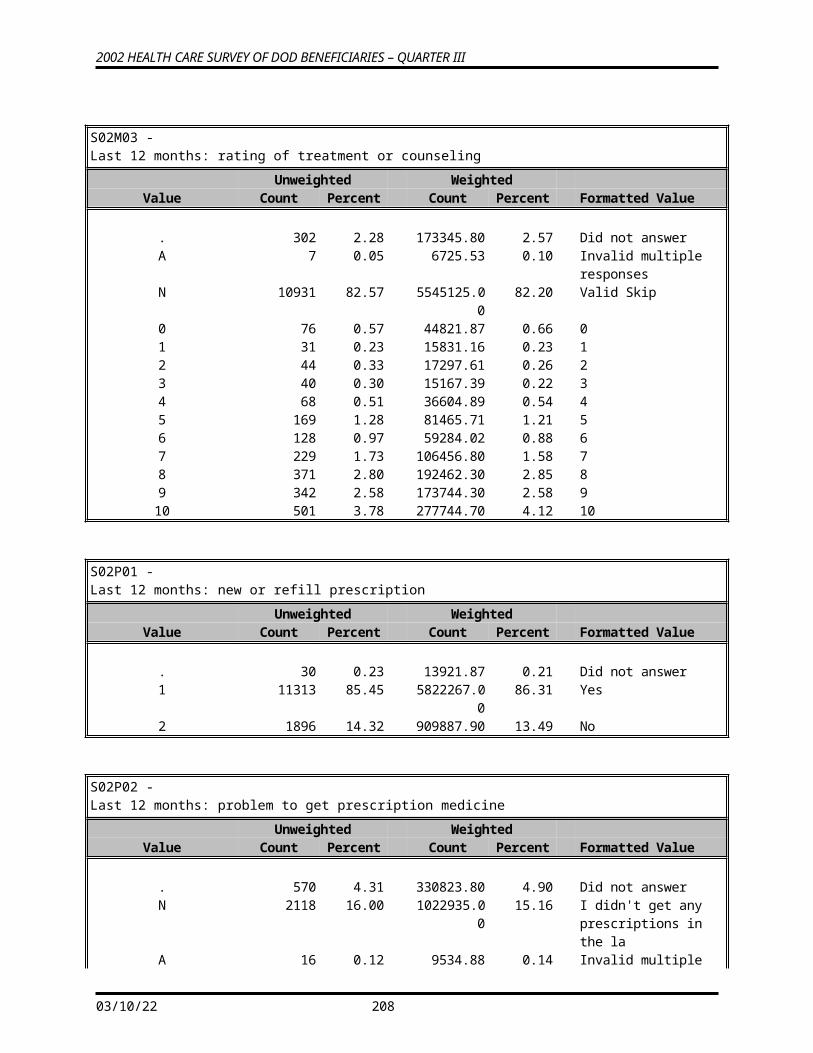
2002 HEALTH CARE SURVEY OF DOD BENEFICIARIES – QUARTER III
WRWT58 -Replicated/JackKnife Weight 58
Unweighted WeightedValue Count Percent Count Percent Formatted Value
0.000 -- 95.206 1338 10.11 198332.90 2.94 Minimum to 10th Percentile
96.166 -- 141.110 1981 14.96 229968.70 3.41 >10th to 25th Percentile144.708 -- 333.912 3303 24.95 735028.40 10.90 >25th to 50th Percentile334.662 -- 582.229 3340 25.23 1473233.00 21.84 >50th to 75th Percentile583.101 -- 1446.313 1971 14.89 1621968.00 24.04 >75th to 90th Percentile1447.657 -- 10221.69 1306 9.86 2487546.00 36.87 >90th to 100th Percentile
WRWT59 -Replicated/JackKnife Weight 59
Unweighted WeightedValue Count Percent Count Percent Formatted Value
0.000 -- 96.166 1330 10.05 194887.60 2.89 Minimum to 10th Percentile
98.963 -- 142.253 1985 14.99 229924.20 3.41 >10th to 25th Percentile143.783 -- 334.662 3318 25.06 738621.50 10.95 >25th to 50th Percentile336.949 -- 567.384 3297 24.90 1452418.00 21.53 >50th to 75th Percentile578.178 -- 1446.313 2004 15.14 1643836.00 24.37 >75th to 90th Percentile1514.261 -- 10286.61 1305 9.86 2486390.00 36.86 >90th to 100th Percentile
WRWT60 -Replicated/JackKnife Weight 60
Unweighted WeightedValue Count Percent Count Percent Formatted Value
0.000 -- 94.660 1324 10.00 203072.20 3.01 Minimum to 10th Percentile
96.166 -- 142.253 1973 14.90 227577.70 3.37 >10th to 25th Percentile143.783 -- 334.662 3337 25.21 739858.70 10.97 >25th to 50th Percentile336.949 -- 582.029 3326 25.12 1467309.00 21.75 >50th to 75th Percentile583.101 -- 1446.313 1974 14.91 1625090.00 24.09 >75th to 90th Percentile1481.897 -- 10468.68 1305 9.86 2483169.00 36.81 >90th to 100th Percentile
05/13/23 210
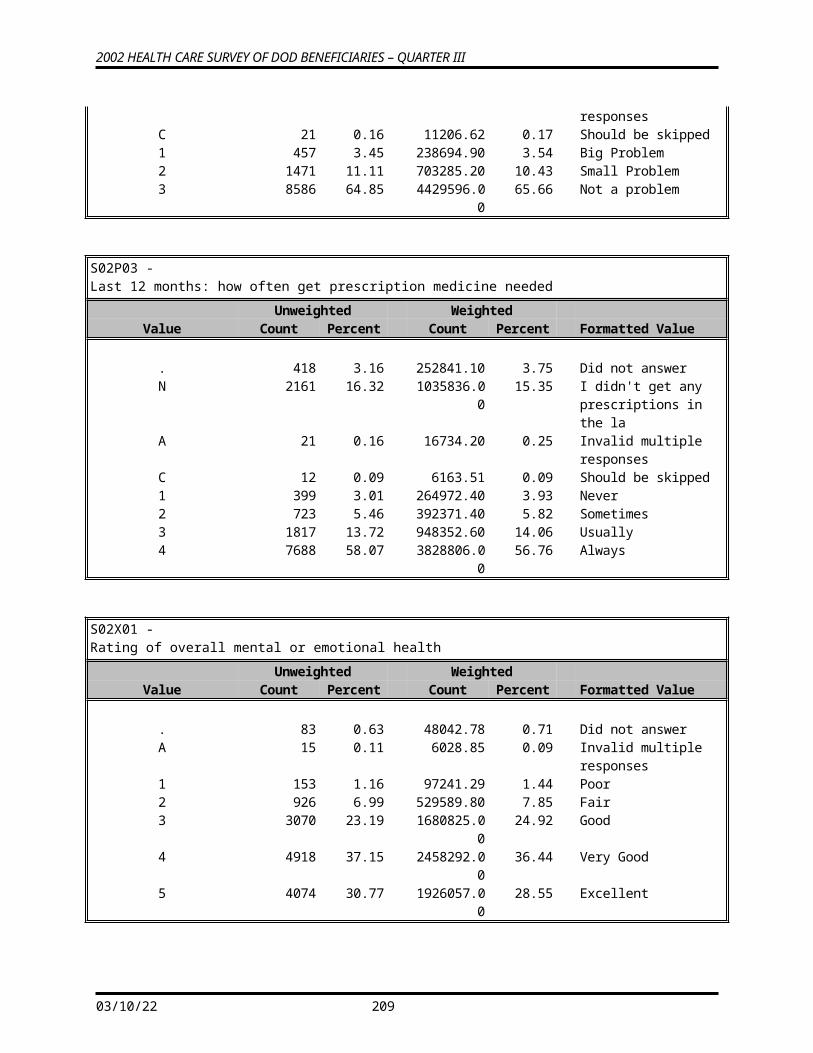
2002 HEALTH CARE SURVEY OF DOD BENEFICIARIES – QUARTER III
WRWT -Final Weight
Unweighted Weighted
Value Count Percent Count Percent Formatted Value
34.379 -- 99.929 1343 10.14 103897.50 1.54 Minimum to 10th Percentile
100.769 -- 146.712 1935 14.62 231856.70 3.44 >10th to 25th Percentile148.720 -- 337.938 3353 25.33 769422.80 11.41 >25th to 50th Percentile339.020 -- 570.056 3309 24.99 1478704.00 21.92 >50th to 75th Percentile581.569 -- 1447.739 1993 15.05 1665527.00 24.69 >75th to 90th Percentile1485.198 -- 10171.02 1306 9.86 2496668.00 37.01 >90th to 100th Percentile
05/13/23 211
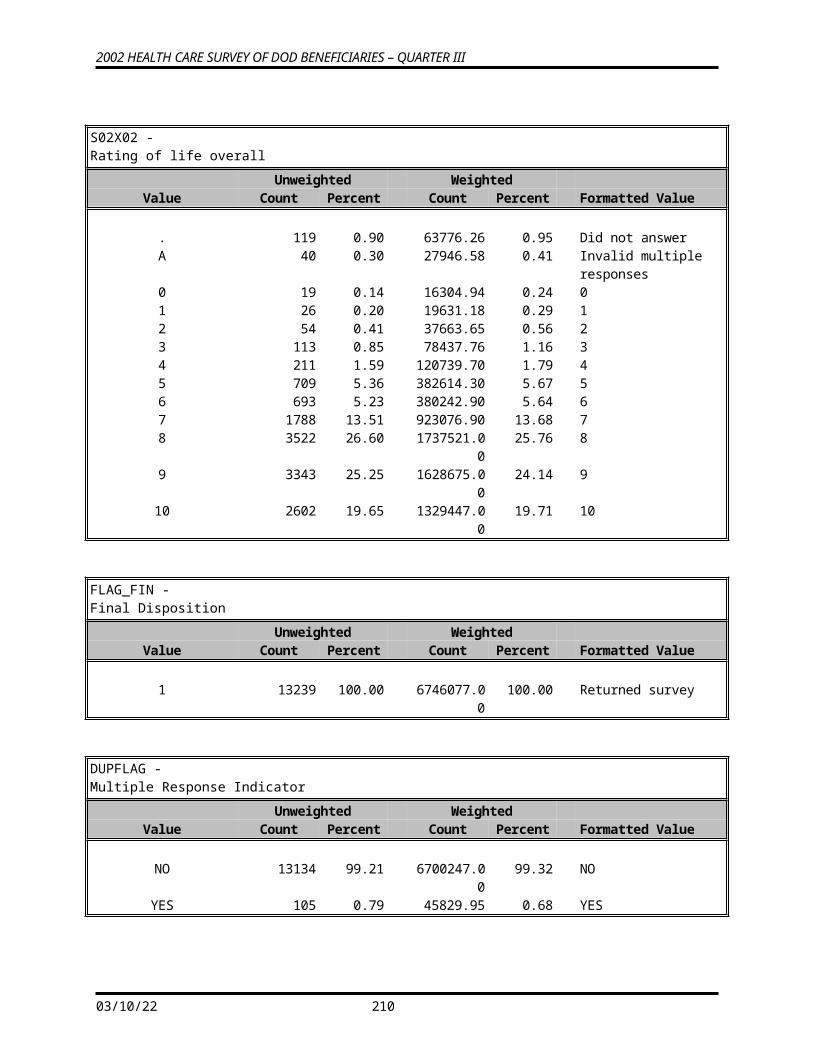
2002 HEALTH CARE SURVEY OF DOD BENEFICIARIES – QUARTER III
REFERENCES
Brick, J.M., P. Broene, P. James, and J. Severynse. A User’s Guide to WesVarPC. Version 2.0. Rockville, MD: Westat, Inc., 1996.
Brick, J.M. and G. Kalton. “Handling Missing Data in Survey Research.” Statistical Methods in Medical Research 1996; 5: 215-238.
Clusen, N.A., D.S. Jang. “The 2000 Health Care Survey of DoD Beneficiaries: Quarter One Adult Sample Design.” Mathematica Policy Research, Inc.: Washington, DC: 2000.
05/13/23 212
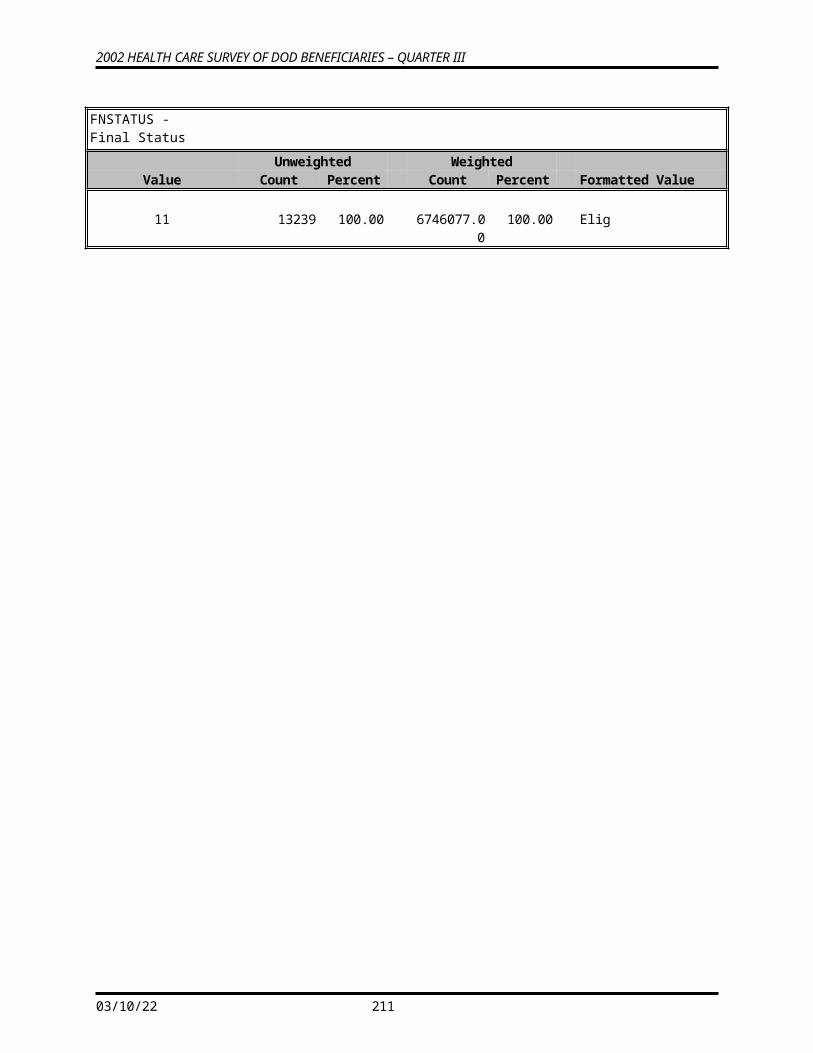
APPENDIX B
CROSSWALK BETWEEN 1996, 1997, 1998,1999, 2000 AND 2002 QUESTIONS FOR ADULT HCSDB
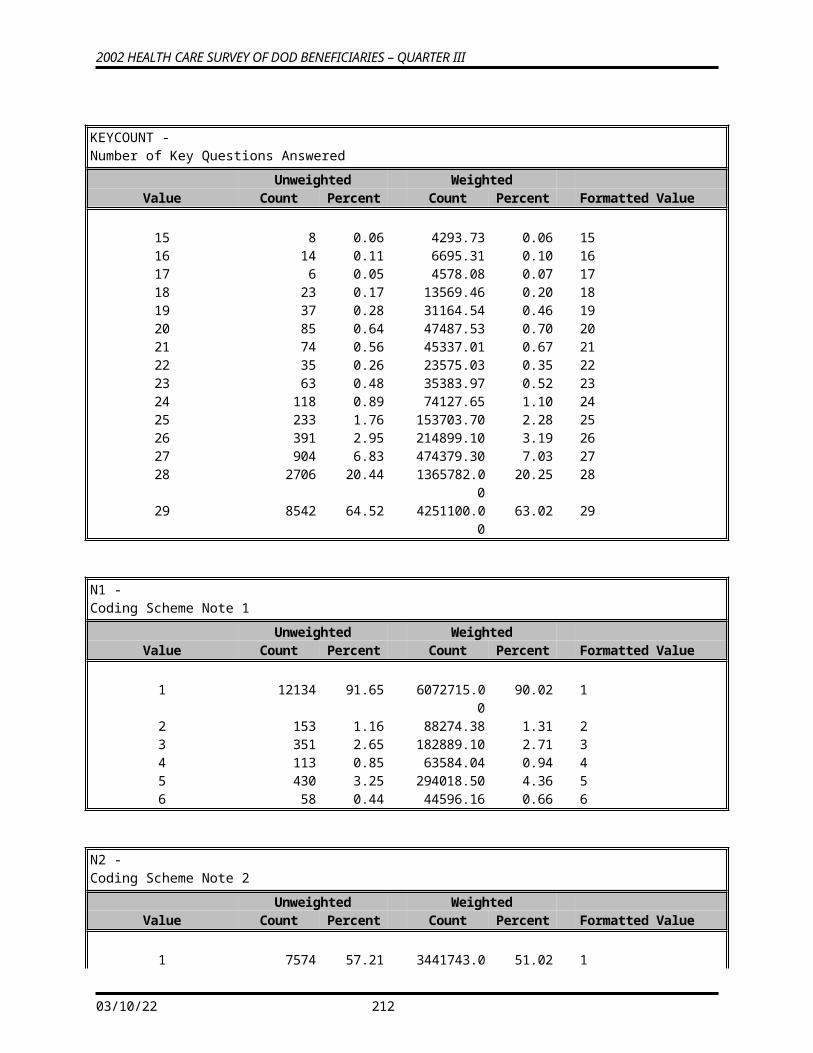
CROSSWALK BETWEEN 1996, 1997, 1998, 1999, 2000 AND 2002 ADULT SURVEY QUESTIONS
2002 Adult Survey 2000 Adult Survey Related Questions in Earlier Surveys2002 2000 1999
Variable Name
Q3 Question Number
Q2 Question Number
Q1 Question Number
Identical to 2002
Variable Name
Q4 Question Number
Q3 Question Number
Q2Question Number
Q1Question Number
Question Number
H02001 Q.01 Q.01 Q.01 H00000 Q.01 Q.01 Q.01
H02002A-H02002O *****
Q.02 Q.02 Q.02 H0003A-H0003M
Q.02 Q.04* Q.03* Q.03 Q.07
H02003 Q.03 Q.03 Q.03 S00I01 Q.03H02004 Q.04 Q.04 Q.04 S00I02 Q.04H02005 Q.05 Q.05 Q.05 S00I03 Q.05H02006 Q.06 Q.06 Q.06 H00001 Q.07 Q.02 Q.01 Q.01 Q.02
H02007 Q.07 Q.07 Q.07 H00002 Q.08 Q.03 Q.02 Q.02 Q.04H02008 Q.08 Q.09 Q.08 H00006 Q.09 Q.06 Q.05 Q.06 Q.22
H02009 Q.09 Q.10 Q.09 H00007 Q.10 Q.07 Q.06 Q.07 Q.23
H02010 Q.10 Q.11 Q.10 H00008 Q.11 Q.08 Q.07 Q.08 Q.24
H02011 Q.11 Q.16 Q.11 H00009 Q.12 Q.09 Q.08 Q.13 Q.25
H02012 Q.12 Q.17 Q.12 H00010 Q.13 Q.10 Q.09 Q.14 Q.03H02013 Q.13 Q.18 Q.13 H00011 Q.14 Q.11 Q.10 Q.15 Q.05
H02014 Q.14 Q.19 Q.14 H00012 Q.15 Q.12 Q.11 Q.16H02015 Q.15 Q.20 Q.15 H00013 Q.16 Q.13 Q.12 Q.17 Q.26H02016 Q.16 Q.21 Q.16 H00014 Q.17 Q.14 Q.13 Q.18 Q.27
H02017 Q.17 Q.22 Q.17 H00015 Q.18 Q.15 Q.14 Q.19 Q.28
H02018 Q.18 Q.24 Q.18 H00016 Q.19 Q.16 Q.15 Q.21 Q.30
H02019 Q.19 Q.25 Q.19 H00017 Q.20 Q.17 Q.16 Q.22 Q.31
H02020 Q.20 Q.26 Q.20 H00018 Q.21 Q.18 Q.17 Q.23 Q.32
H02021 Q.21 Q.27 Q.21 H00019 Q.22 Q.19 Q.18 Q.24 Q.33H02022 Q.22 Q.28 Q.22 H00020 Q.23 Q.20 Q.19 Q.25H02023 Q.23 Q.29 Q.23 H00021 Q.24 Q.21 Q.20 Q.26 Q.43H02024 Q.24 Q.30 Q.24 H00022 Q.25 Q.22 Q.21 Q.27
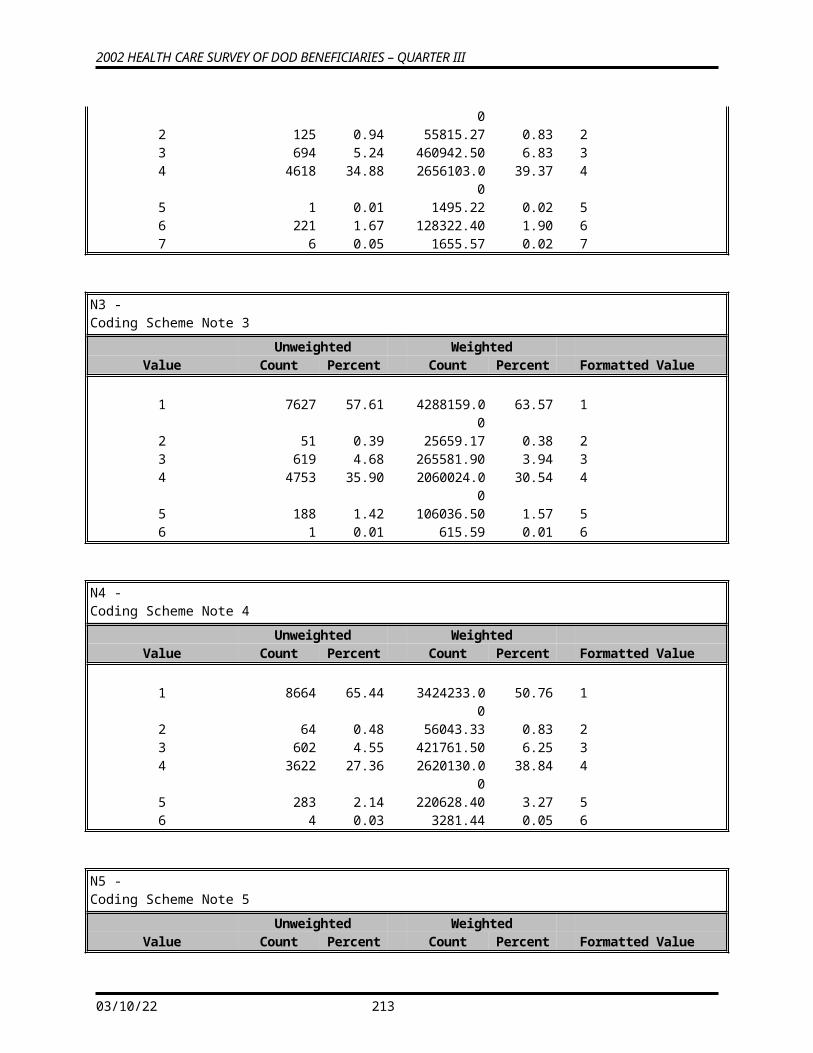
2002 Adult Survey 2000 Adult Survey Related Questions in Earlier Surveys2002 2000 1999
Variable Name
Q3 Question Number
Q2 Question Number
Q1 Question Number
Identical to 2002
Variable Name
Q4 Question Number
Q3 Question Number
Q2Question Number
Q1Question Number
Question Number
H02025 Q.25 Q.31 Q.25 H00023 Q.26 Q.23 Q.22 Q.28H02026 Q.26 Q.32 Q.26 H00024 Q.27 Q.24 Q.23 Q.29 Q.44H02027 Q.27 Q.33 Q.27 H00025 Q.28 Q.25 Q.24 Q.30H02028 Q.28 Q.34 Q.28 H00026 Q.29 Q.26 Q.25 Q.31 Q.38H02029 Q.29 Q.35 Q.29 H00027 Q.30 Q.27 Q.26 Q.32 Q.40, Q.41H02030 Q.30 Q.36 Q.30 H00028 Q.31 Q.28 Q.27 Q.33 Q.47H02031 Q.31 Q.37 Q.31 H00029 Q.32 Q.29 Q.28 Q.34 Q.48H02032 Q.32 Q.38 Q.32 H00030 Q.33 Q.30 Q.29 Q.35 Q.46
H02033 Q.33 Q.39 Q.33 H00031 Q.34 Q.31 Q.30 Q.36 Q.49
H02034 Q.34 Q.40 Q.34 H00032 Q.35 Q.32 Q.31 Q.37 Q.50
H02035 Q.35 Q.41 Q.35 H00033 Q.36 Q.33 Q.32 Q.38 Q.51
H02036 Q.36 Q.42 Q.36 H00034 Q.37 Q.34 Q.33 Q.39 Q.52
H02037 Q.37 Q.43 Q.37 H00035 Q.38 Q.35 Q.34 Q.40 Q.53
H02038 Q.38 Q.44 Q.38 H00036 Q.39 Q.36 Q.35 Q.41 Q.54
H02039 Q.39 Q.48 Q.39 H00037 Q.40 Q.37 Q.36 Q.45 Q.55
H02040 Q.49 Q.40 H00041 Q.44 Q.38 Q.43 Q.49 Q.56H02041 Q.50 Q.08 Q.41 H00042 Q.45 Q.39 Q.44 Q.50 Q.37H02042 Q.51 Q.42 H00084 Q.93 Q.99 Q.106
H02043 Q.52 Q.55 Q.43 H00043 Q.46 Q.40 Q.45 Q.57 Q.57
H02044 Q.53 Q.56 Q.44 H00044 Q.47 Q.41 Q.46 Q.58 Q.58
H02045 Q.54 Q.57 Q.45 H00045 Q.48 Q.42 Q.47 Q.59 Q.59
H02046 Q.55 Q.58 Q.46 H00046 Q.49 Q.43 Q.48 Q.60 Q.60
H02047 Q.56 Q.59 Q.47 H00047 Q.50 Q.44 Q.49 Q.61 Q.62
H02048 Q.57 Q.60 Q.48 H00048 Q.51 Q.45 Q.50 Q.62 Q.63
H02049 Q.58 Q.61 Q.49 H00049 Q.52 Q.46 Q.51 Q.63 Q.64
H02050 Q.59 Q.62 Q.50 H00050 Q.53 Q.47 Q.52 Q.64 Q.65
H02051 Q.60 Q.63 Q.51 H00051 Q.54 Q.48 Q.53 Q.65 Q.68
H02052 Q.61 Q.64 Q.52 H00052 Q.55 Q.49 Q.54 Q.66 Q.69
H02053 Q.62 Q.65 Q.53 H00053 Q.56 Q.50 Q.55 Q.67 Q.70
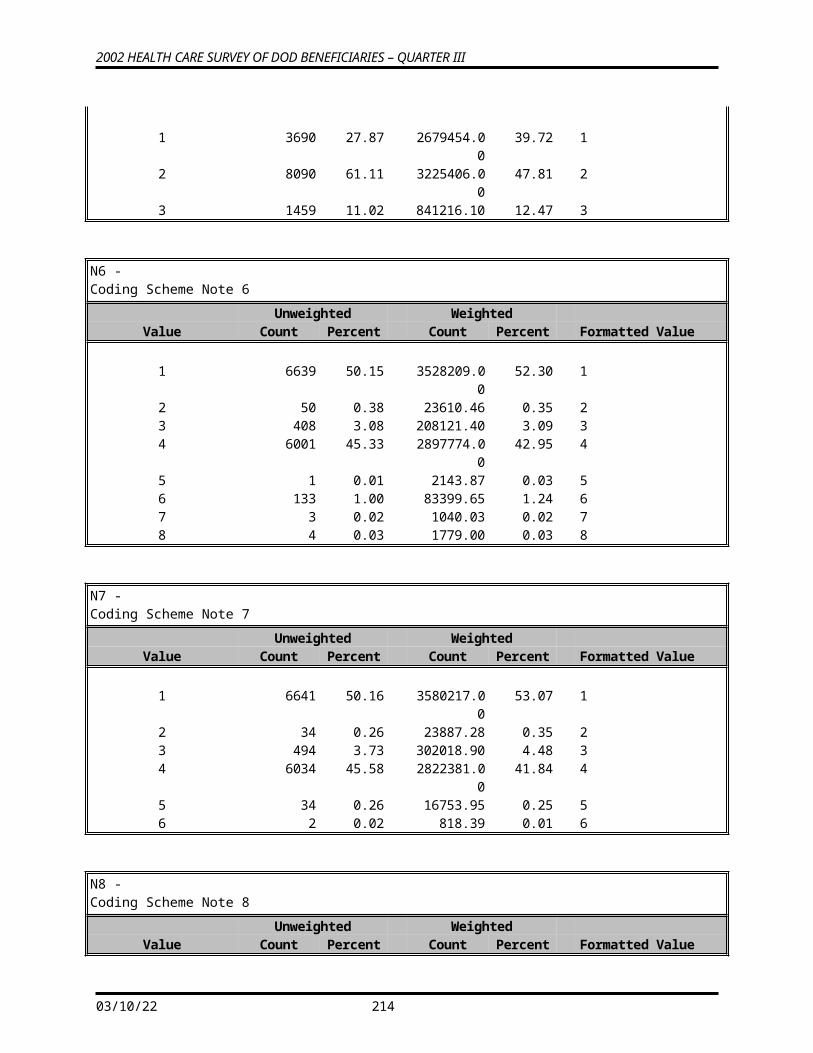
2002 Adult Survey 2000 Adult Survey Related Questions in Earlier Surveys2002 2000 1999
Variable Name
Q3 Question Number
Q2 Question Number
Q1 Question Number
Identical to 2002
Variable Name
Q4 Question Number
Q3 Question Number
Q2Question Number
Q1Question Number
Question Number
H02054 Q.63 Q.66 Q.54 H00054 Q.57 Q.51 Q.56 Q.68 Q.66H02055 Q.64 Q.67 Q.55 H00055 Q.58 Q.52 Q.57 Q.69 Q.67
H02056 Q.65 Q.68 Q.56 H00056 Q.59 Q.53 Q.58 Q.70 Q.71
H02057 Q.66 Q.69 Q.57 H00057 Q.60 Q.54 Q.59 Q.71 Q.72
H02058 Q.67 Q.70 Q.58 H00061 Q.61 Q.70 Q.62 Q.75 Q.08
H02059 Q.68 Q.71 Q.59 H00062 Q.62 Q.71 Q.63 Q.76 Q.09
H02060 Q.69 Q.72 Q.60 H00063 Q.63 Q.72**** Q.64 Q.77 Q.09BH02061 Q.70 Q.73 Q.61 H00064 Q.64 Q.73 Q.65 Q.78 Q.10
H02062 Q.71 Q.74 Q.62 H00065 Q.65 Q.74 Q.66 Q.79 Q.11
H02063 Q.72 Q.75 Q.63 H00066 Q.66 Q.75 Q.67 Q.80 Q.12
H02064 Q.73 Q.76 Q.64 H00067 Q.67 Q.76 Q.68 Q.81 Q.13
H02065 Q.74 Q.77 Q.65 H00068 Q.68 Q.77 Q.69 Q.82 Q.14
H02066 Q.75 Q.78 Q.66 H00069 Q.69 Q.78 Q.70 Q.83 Q.15
H02067 Q.76 Q.79 Q.67 H00070 Q.70 Q.79 Q.71 Q.84 Q.16
H02068 Q.77 Q.80 Q.68 H00071 Q.71 Q.80 Q.72 Q.85 Q.17
H02069 Q.78 Q.81 Q.69 H00072 Q.72 Q.81 Q.73 Q.86 Q.18
H02070 Q.79 Q.82 Q.70 H00073A Q.73 Q.82 Q.74 Q.87A Q.19A
H02071 Q.80 Q.83 Q.71 H00073B Q.74 Q.83*** Q.75*** Q.87B Q.19BH02072 Q.81 Q.84 Q.72 H00074 Q.75 Q.84 Q.76 Q.88 Q.19CH02073 Q.82 Q.85 Q.73 H00075 Q.76 Q.85 Q.77 Q.89 Q.20
H02074 Q.83 Q.86 Q.74 H00076A Q.77 Q.86 Q.78 Q.90A Q.21A
H02075 Q.84 Q.87 Q.75 H00076B Q.78 Q.87 Q.79 Q.90B Q.21B
SREDA Q.88 Q.97 Q.85 SREDA Q.88 Q.89 Q.81 Q.100 Q.86
H02076 Q.85 Q.88 H00077 Q.88 Q.80 Q.91 Q.77H02077 Q.89 Q.98 Q.86 H00079 Q.89 Q.90 Q.82 Q.101 Q.84
SRRACEA-SRRACEE
Q.90 Q99 Q.87 SRRACEA-SRRACEE
Q.90 Q.91 Q.83 Q.102 Q.85
SRAGE Q.91 Q100 Q.88 SRAGE Q.91 Q.92 Q.84 Q.103S02C01 Q.12 S00C01 Q.09S02C02 Q.13 S00C02 Q.10S02C03 Q.14 S00C03 Q.11S02C04 Q.15 S00C04 Q.12S02C05 Q.23 S00C05 Q.20
S02C06 Q.45 S00C06 Q.42S02C07 Q.46 S00C07 Q.43S02C08 Q.47 S00C08 Q.44S02C09 Q.49 S00C09 Q.51S02C10 Q.50 S00C10 Q52S02C11 Q.51 S00C11 Q53
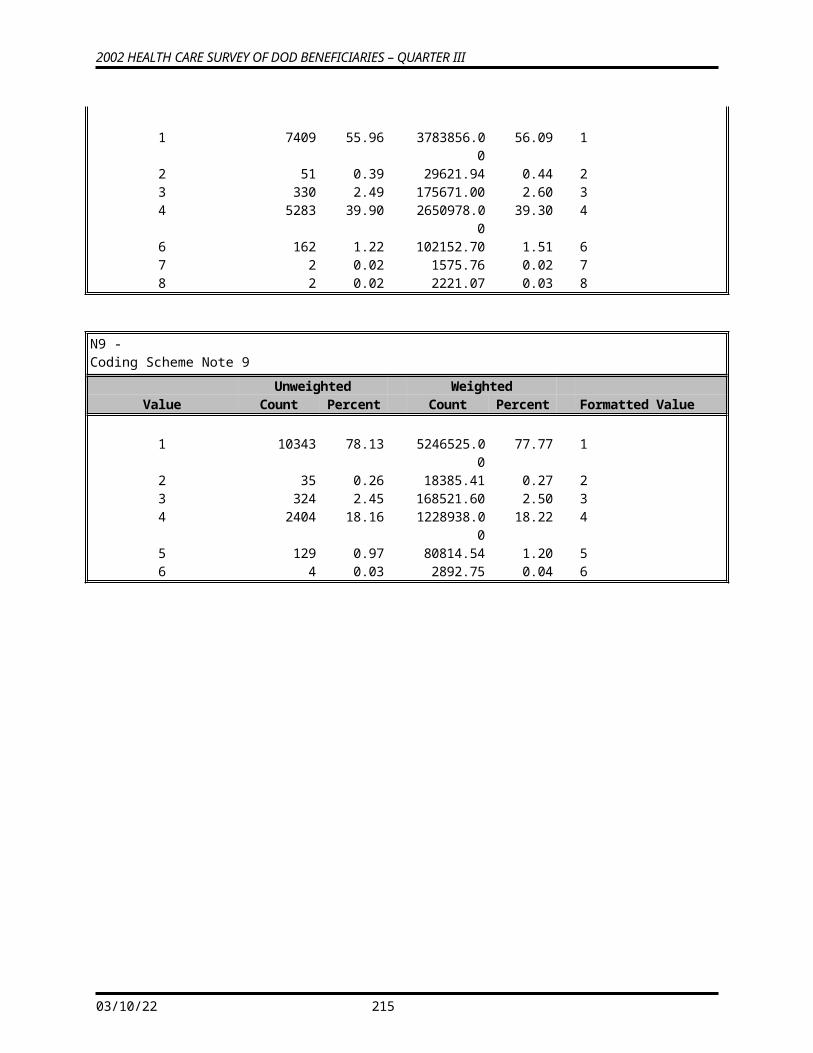
2002 Adult Survey 2000 Adult Survey Related Questions in Earlier Surveys2002 2000 1999
Variable Name
Q3 Question Number
Q2 Question Number
Q1 Question Number
Identical to 2002
Variable Name
Q4 Question Number
Q3 Question Number
Q2Question Number
Q1Question Number
Question Number
S02C12 Q.52 S00C12 Q.54S02C13 Q.53 S00C13 Q.55S02C14 Q.54 S00C14 Q.56S02C15 Q.89 S00C15 Q.92S02C16 Q.90 S00C16 Q.93S02C17 Q.91 S00C17 Q.94S02C18 Q.92 S00C18 Q.95S02C19 Q.93 S00C19 Q.96S02C20 Q.94 S00C20 Q.97S02C21 Q.95 S00C21 Q.98S02C22 Q.96 S00C22 Q.99S02E01 Q.101S02E02 Q.102S02E03 Q.103S02E04 Q.104S02E05 Q.105S02E06 Q.106S02E07 Q.107S02E08 Q.108S02E09 Q.109S02S01 Q.76 S00S01 Q.79S02S02 Q.77 S00S02 Q.80S02S03 Q.78 S00S03 Q.81S02S04 Q.79 S00S04 Q.82S02S05 Q.80 S00S05 Q.83S02S06 Q.81 S00S06 Q.84S02S07 Q.82 S00S07 Q.85S02S08 Q.83 S00S08 Q.86S02S09 Q.84 S00S09 Q.87S02L01 Q.89S02L02 Q.90S02L03A-S02L03I
Q.91
S02L04A-S02L04I
Q.92
S02L05 Q.93S02L06 Q.94S02L07 Q.95S02L08 Q.96S02L09 Q.97S02L10 Q.98S02L11 Q.99S02L12 Q.100S02L13A- Q.101
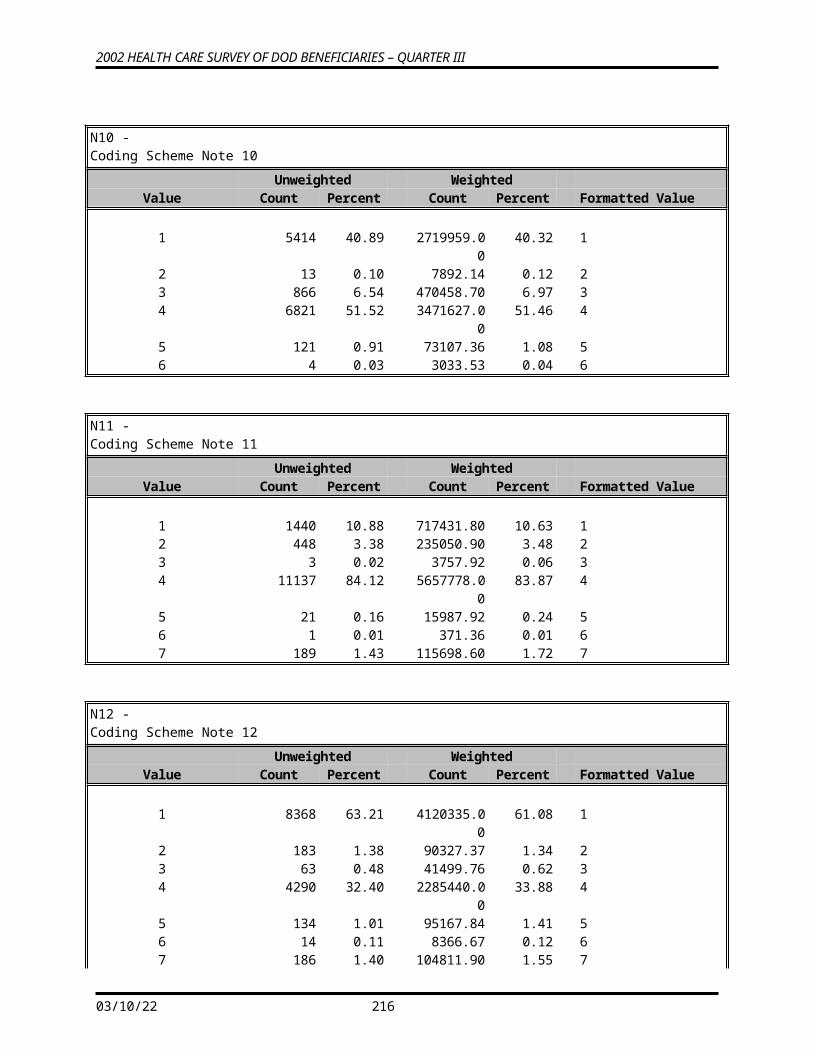
2002 Adult Survey 2000 Adult Survey Related Questions in Earlier Surveys2002 2000 1999
Variable Name
Q3 Question Number
Q2 Question Number
Q1 Question Number
Identical to 2002
Variable Name
Q4 Question Number
Q3 Question Number
Q2Question Number
Q1Question Number
Question Number
S02L13ES02L14 Q.102S02L15 Q.103S02L16 Q.104S02L17 Q.105S02D01 Q.40S02D02 Q.41S02D03 Q.42S02M01 Q.43 S02M01 Q.37S02M02 Q.44 S02M02 Q.38S02M03 Q.45 S02M03 Q.39S02P01 Q.46S02P02 Q.47S02P03 Q.48S02X01 Q.86S02X02 Q.87
APPENDIX C
CODING SCHEME AND CODING TABLES
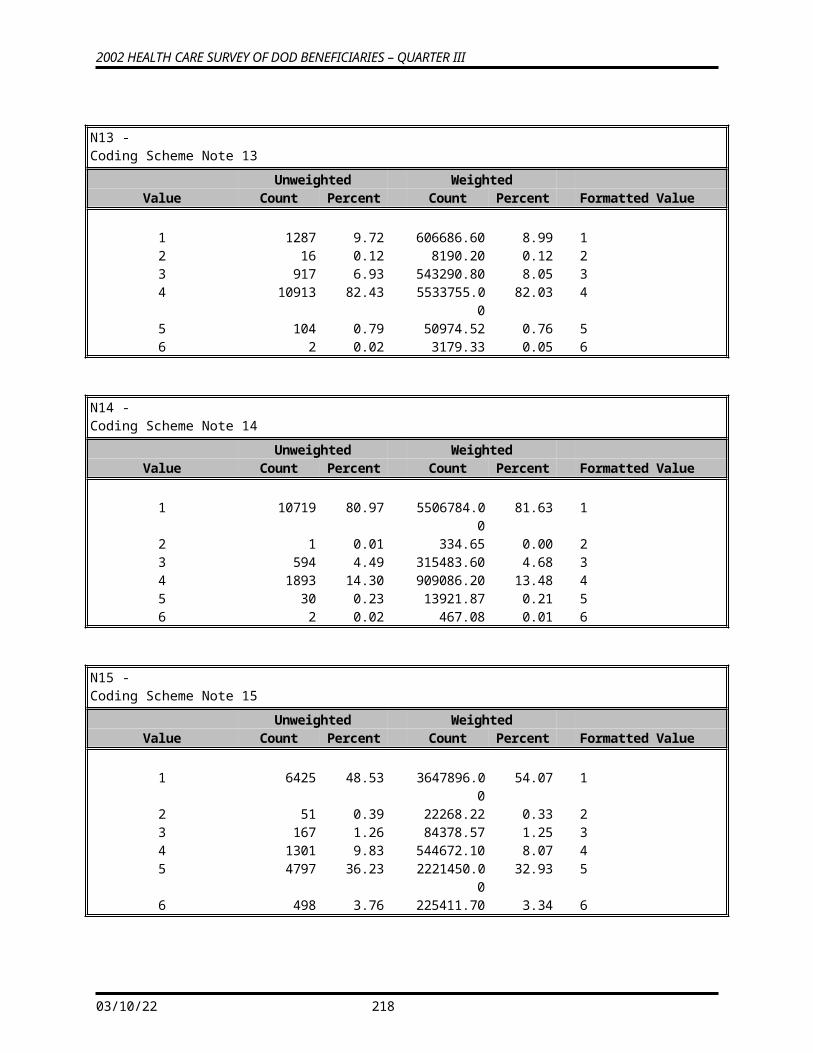
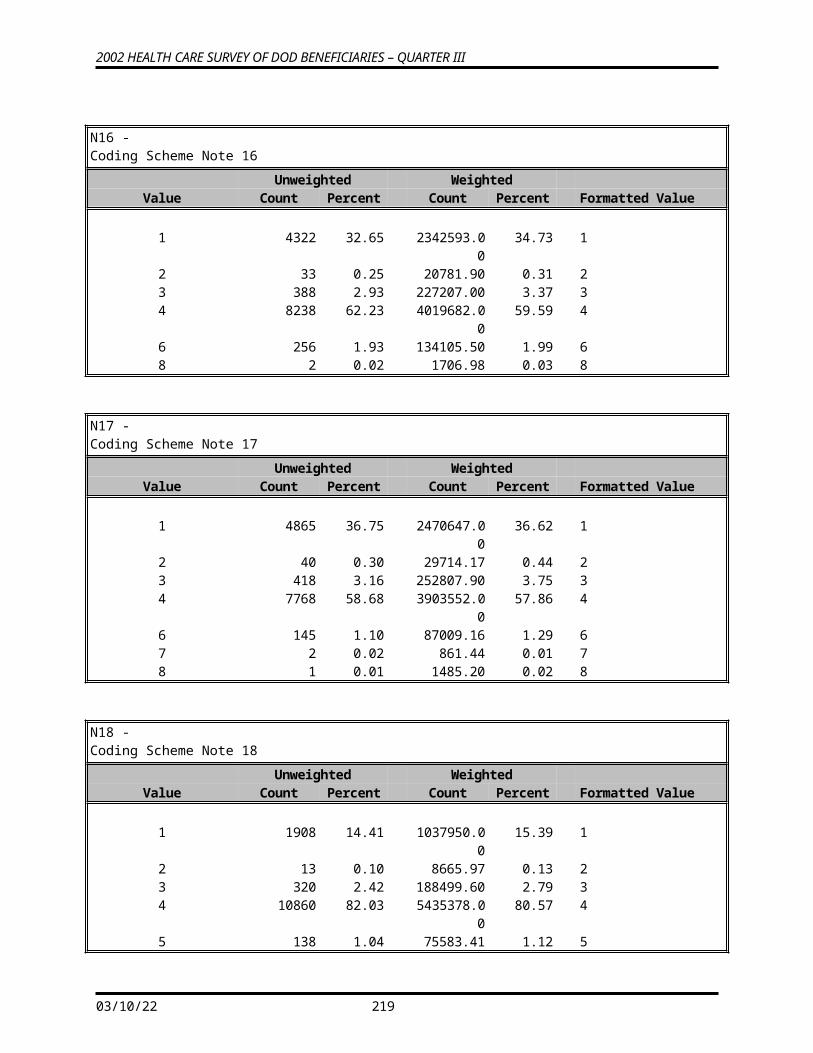
2000 HEALTH CARE SURVEY OF DOD BENEFICIARIES (HCSDB) CODING SCHEME AND CODING TABLES
BASIC SAS AND ASCII/EBCDIC MISSING DATA AND NOT APPLICABLE CODES
SAS ASCII/EBCDIC
Numeric Numeric Description
. -9 No response
.A -8 Multiple response error
.O -7 Out of range error
.N -6 Not Applicable or valid skip
.D -5 Scalable response of “Don’t know” or “not sure”
.I -4 Incomplete grid error
.C -1 Question should have been skipped.
Missing values ‘.’, multiple responses ‘.A’, and incomplete grids ‘.I’ are encoded prior to implementation of the Coding Scheme Notes (see below).
C-3

Coding Table for Note 1: H02006, H02007
N1 H02006is:
H02007 is:
H02006 is coded as:
H02007is coded as:
*
1 1-12, health plan, -5, not sure
Marked, missing, or multiple response
Stands as original value
Stands as original value
2 -6, no usage in past 12 months
Marked or multiple response
Stands as original value
.C, question should be skipped
F
3 -6, no usage in past 12 months
Missing response Stands as original value
.N, valid skip F
4 Missing response Marked, missing, or multiple response
Stands as original value
Stands as original value
5 Multiple response Marked or multiple response
Stands as original value
Stands as original value
6 Multiple response Missing response -6: Did not use any health plan in the last 12 months
.N, valid skip B
* Indication of backward coding (B) or forward coding (F).
Coding Table for Note 2:H02008, H02009
N2 H02008 is:
H02009 is:
H02008 is coded as:
H02009is coded as:
*
1 1: yes 1-3, missing, or multiple response
Stands as original value
Stands as original value
2 1: yes, missing, or multiple response
-6: didn’t get a new doctor
2: No .C question should be skipped
B
3 2: no, missing, or multiple response
1- 3 1: yes Stands as original value B
4 2: no Missing, multiple response, or –6: didn’t get a new doctor
Stands as original value
.N, valid skip if missing, .C, question should be skipped if marked
F
5 Missing response Multiple response 1: yes Stands as original value B6 Missing response Missing response Stands as original
valueStands as original value
7 Multiple response Missing response 2: no .N, valid skip B8 Multiple response Multiple response Stands as original
valueStands as original value
* Indication of backward coding (B) or forward coding (F).
C-4
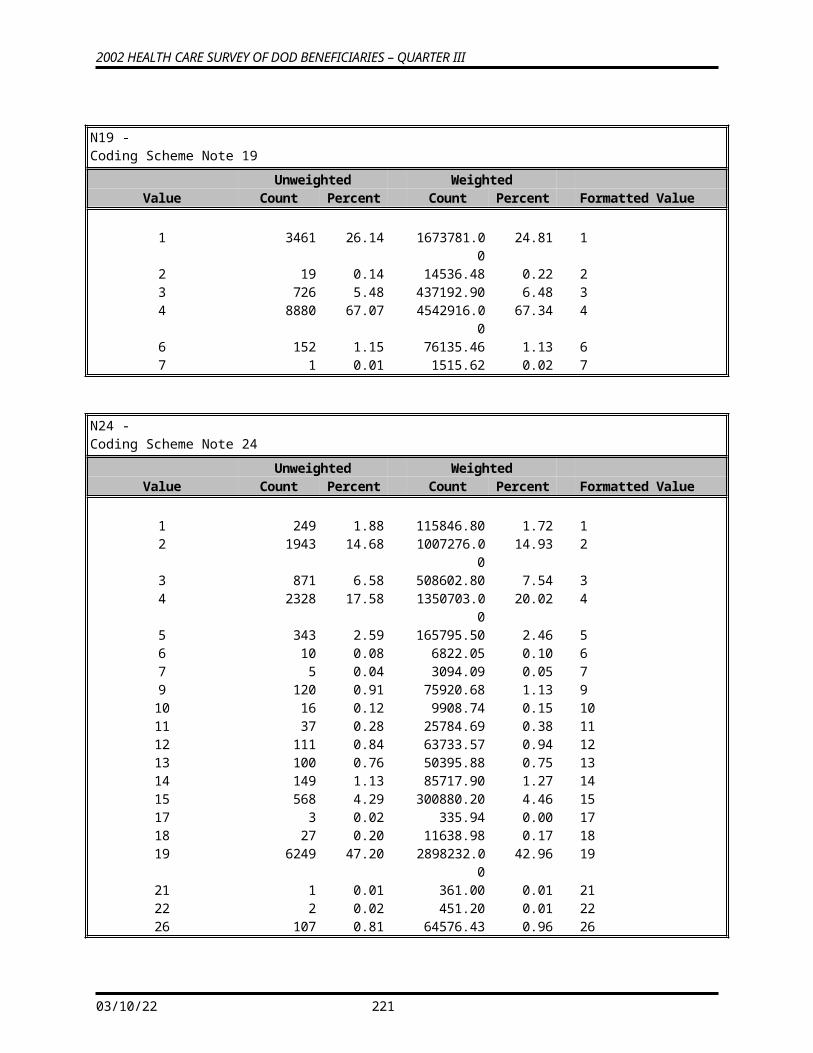
C-5

Coding Table for Note 3:H02010, H02011
N3 H02010 is:
H02011is:
H02010is coded as:
H02011is coded as:
*
1 1: yes 0-10, missing, or multiple response
Stands as original value
Stand as original value
2 1: yes, missing, or multiple response
-6, I don’t have a personal doctor or nurse
2: no .C, question should be skipped
BF
3 2: no, missing, or multiple response
0-10 or multiple response
1: yes Stands as original value B
4 2: no -6, I don’t have a personal doctor or nurse, or missing
Stands as original value
.N, valid skip if missing;
.C, question should be skipped if marked
F
5 Missing response Missing response Stands as original value
Stands as original value
6 Missing response Multiple response Stands as original value
Stands as original value
7 Multiple response Missing response 2: no .N, valid skip B8 Multiple response Multiple response Stands as original
valueStands as original value
* Indication of backward coding (B) or forward coding (F).
Coding Table for Note 4:H02012, H02013, H02014
N4 H02012 is: H02013 & H02014 are:
H02012is coded as:
H02013 & H02014 are coded as:
*
1 1: yes At least one is “marked” or “all are blank”
Stands as original value Stand as original value
2 1: yes, missing, or multiple response
“Blank or NA” 2: no .N, valid skip if missing;.C, question should be skipped if marked
B
3 2: no, missing, or multiple response
At least one is “marked”
1: yes Stand as original value B
4 2: no “Blank or NA” or “all are blank”
Stands as original value .N, valid skip if missing;.C, question should be skipped if marked
F
5 Missing response “All are blank” Stands as original value Stand as original value6 Multiple response “All are blank” 2: no .N, valid skip B* Indication of backward coding (B) or forward coding (F).
Definition of “all are blank” in Coding Table for Note 4:Responses to H02013 an H02014 are both missing.
Definition of “blank or NA” in Coding Table for Note 4:Response to H02013 is not applicable (-6), and H02014 is missing.
Definition of “marked” in Coding Table for Note 4:Any pattern of marks outside the definitions “all are blank” and “blank or NA”
C-6
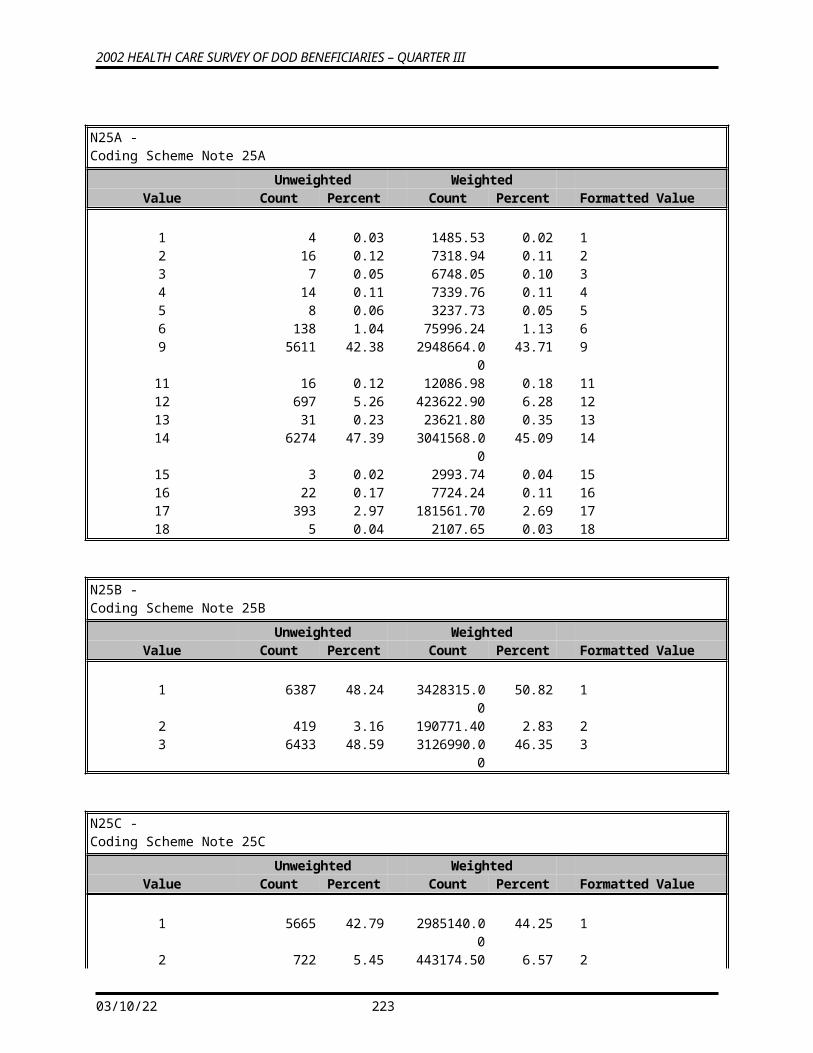
Coding Table for Note 5:H02013, H02014
N5 H02013 is: H02014 is: H02013 is coded as:
H02014is coded as:
*
1 .N valid skip or .C question should be skipped
.N valid skip or .C question should be skipped
Stands as original value Stands as original value
2 1-2, missing or multiple response
1,2, missing or multiple response
Stands as original value Stands as original value
3 3: not sure, -6: Not a member of TRICARE Prime, missing, or multiple response
1,2, missing or multiple response
Stands as original value .N, valid skip if missing, .C, question should be skipped if marked
* Indication of backward coding (B) or forward coding (F).
Coding Table for Note 6:H02015, H02016
N6 H02015 is:
H02016 is:
H02015 is coded as:
H02016is coded as:
*
1 1: yes 1, 2, 3, missing, or multiple response
Stands as original value
Stands as original value
2 1: yes, missing, or multiple response
-6: didn’t need to see a specialist
2: No .C question should be skipped
B
3 2: no, missing, or multiple response
1, 2, 3 1: yes Stands as original value B
4 2: no Missing, multiple response, or –6: didn’t need to see a specialist
Stands as original value
.N, valid skip if missing, .C, question should be skipped if marked
F
5 Missing response Multiple response 1: yes Stands as original value B6 Missing response Missing response Stands as original
valueStands as original value
7 Multiple response Multiple response Stands as original value
Stands as original value
8 Multiple response Missing response 2: no .N, valid skip B* Indication of backward coding (B) or forward coding (F).
C-7
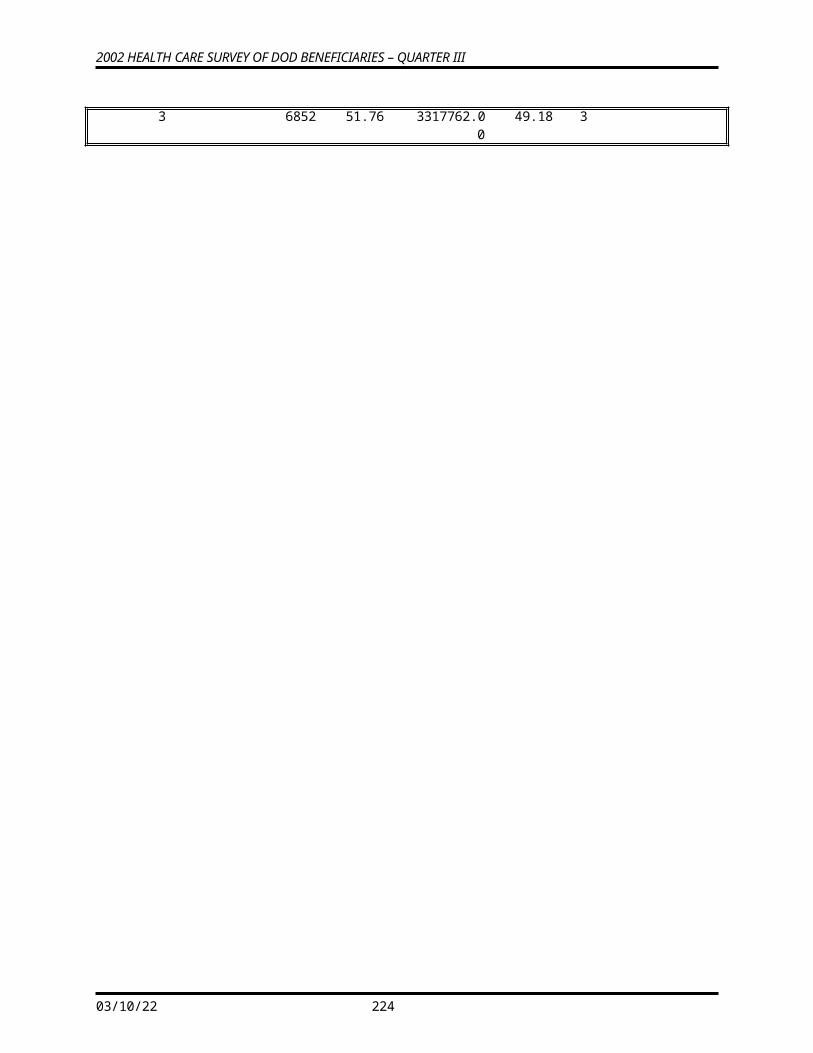
Coding Table for Note 7:H02017, H02018, H02019
N7 H02017 is:
H02018, H02019 Are:
H02017 is coded as:
H02018, H02019Are coded as:
*
1 1: yes “All are blank” or at least one is “marked”
Stands as original value
Stand as original value
2 1: yes, missing, or multiple response
“Blank or NA” 2:no .N, valid skip if missing;.C, question should be skipped if marked
BF
3 2: no, missing, or multiple response
At least one is “marked” 1: yes Stand as original value B
4 2: no “All are blank” or “blank or NA”
Stands as original value
.N, valid skip if missing, .C, question should be skipped if marked
F
5 Missing response “All are blank” Stands as original value
Stand as original value
6 Multiple response “All are blank” 2: no .N, valid skip B* Indication of backward coding (B) or forward coding (F).
Definition of “all are blank” in Coding Table for Note 7:H02018 and H0219 are all missing. Definition of “blank or NA” in Coding Table for Note 7:H02018 and H02019 are either not applicable (-6), or a combination of not applicable (-6) and missing.
Definition of “marked” in Coding Table for Note 7:Any pattern of marks outside the definitions “all are blank” and “blank or NA.”
C-8
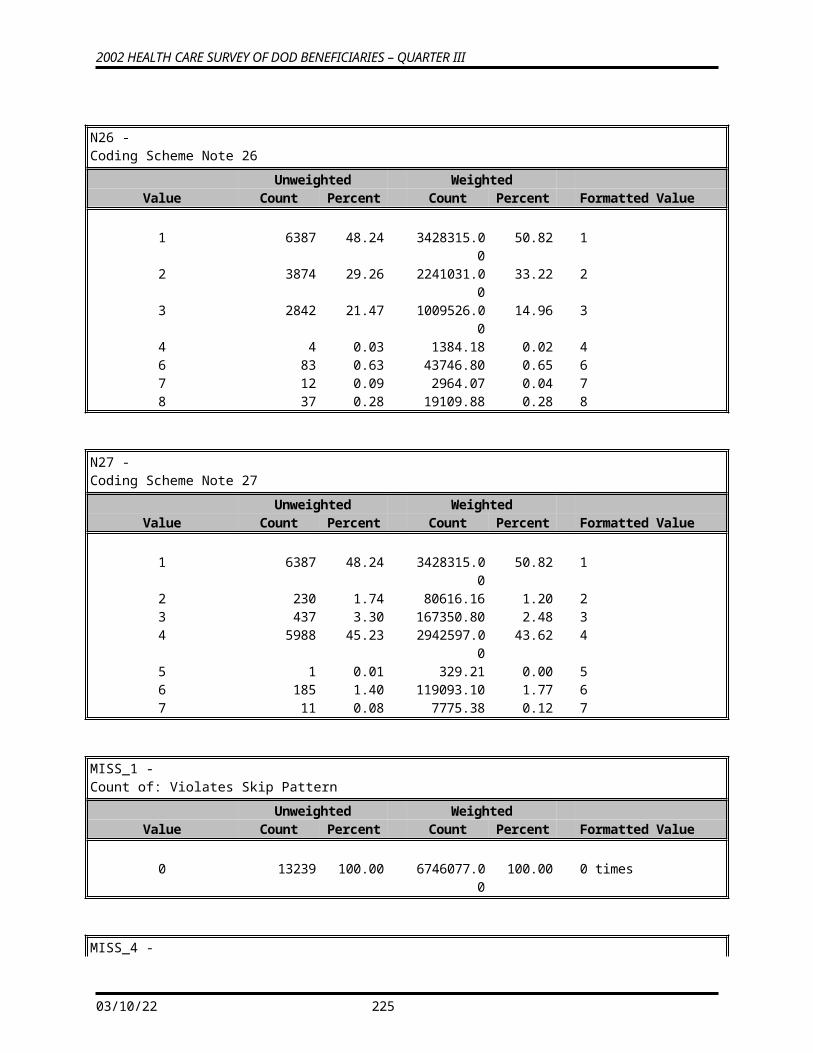
Coding Table for Note 8:H02020, H02021
N8 H02020 is: H02021 is: H02020 is coded as: H02021 is coded as: *1 1: yes 1-4: how often,
missing, or multiple response
Stands as original value
Stands as original value
2 1: yes, missing, or multiple response
-6: no calls 2: no .C, question should be skipped
BF
3 2: no, missing or multiple response
1-4: how often 1: yes Stands as original value B
4 2: no -6: no calls, missing, or multiple response
Stands as original value
.N, valid skip if missing;
.C, question should be skipped if marked
F
5 Missing response Multiple response 1: yes Stands as original value B6 Missing response Missing response Stands as original
valueStands as original value
7 Multiple response Multiple response Stands as original value
Stands as original value
8 Multiple response Missing response 2: no .N, valid skip B* Indication of backward coding (B) or forward coding (F).
Coding Table for Note 9:H02022, H02023, H02024
N9 H02022 is: H02023 & H02024 are:
H02022is coded as:
H02023 & H02024 are coded as:
*
1 1: yes At least one is “marked” or “all are blank”
Stands as original value Stand as original value
2 1: yes, missing, or multiple response
“Blank or NA” 2: no .N, valid skip if missing;.C, question should be skipped if marked
B
3 2: no, missing, or multiple response
At least one is “marked”
1: yes Stand as original value B
4 2: no “Blank or NA” or “all are blank”
Stands as original value .N, valid skip if missing;.C, question should be skipped if marked
F
5 Missing response “All are blank” Stands as original value Stand as original value6 Multiple response “All are blank” 2: no .N, valid skip B* Indication of backward coding (B) or forward coding (F).
Definition of “all are blank” in Coding Table for Note 9:Responses to H02023 an H02024 are both missing.
Definition of “blank or NA” in Coding Table for Note 9:Responses to H02023 and H02024 are either all not applicable (-6) or a combination of missing response and not applicable (-6).
Definition of “marked” in Coding Table for Note 9:Any pattern of marks outside the definitions “all are blank” and “blank or NA”
C-9
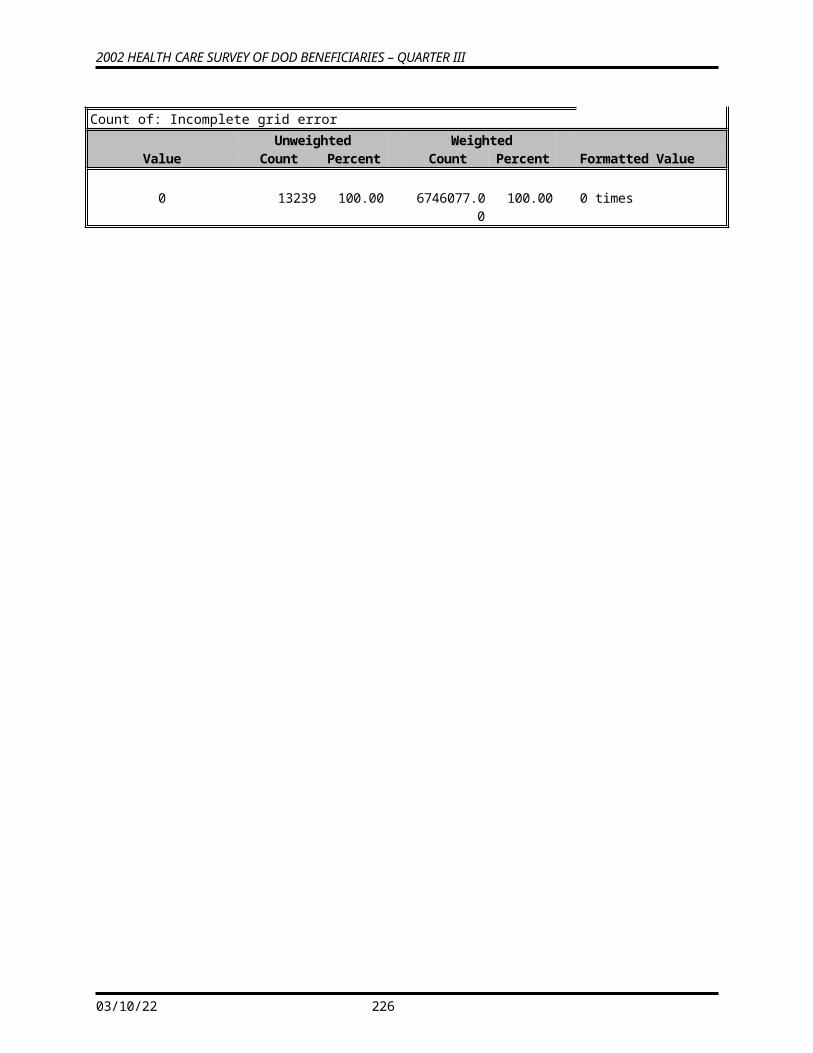
Coding Table for Note 10:H02025, H02026, H02027
N10 H02025 is: H02026 & H02027 are:
H02025is coded as:
H02026 & H02027 are coded as:
*
1 1: yes At least one is “marked” or “all are blank”
Stands as original value Stand as original value
2 1: yes, missing, or multiple response
“Blank or NA” 2: no .N, valid skip if missing;.C, question should be skipped if marked
B
3 2: no, missing, or multiple response
At least one is “marked”
1: yes Stand as original value B
4 2: no “Blank or NA” or “all are blank”
Stands as original value .N, valid skip if missing;.C, question should be skipped if marked
F
5 Missing response “All are blank” Stands as original value Stand as original value6 Multiple response “All are blank” 2: no .N, valid skip B* Indication of backward coding (B) or forward coding (F).
Definition of “all are blank” in Coding Table for Note 10:Responses to H02026 and H02027 are both missing.
Definition of “blank or NA” in Coding Table for Note 10:Responses to H02026 and H02027 are either both not applicable (-6) or a combination of missing response and not applicable (-6).
Definition of “marked” in Coding Table for Note 10:Any pattern of marks outside the definitions “all are blank” and “blank or NA”
C-10
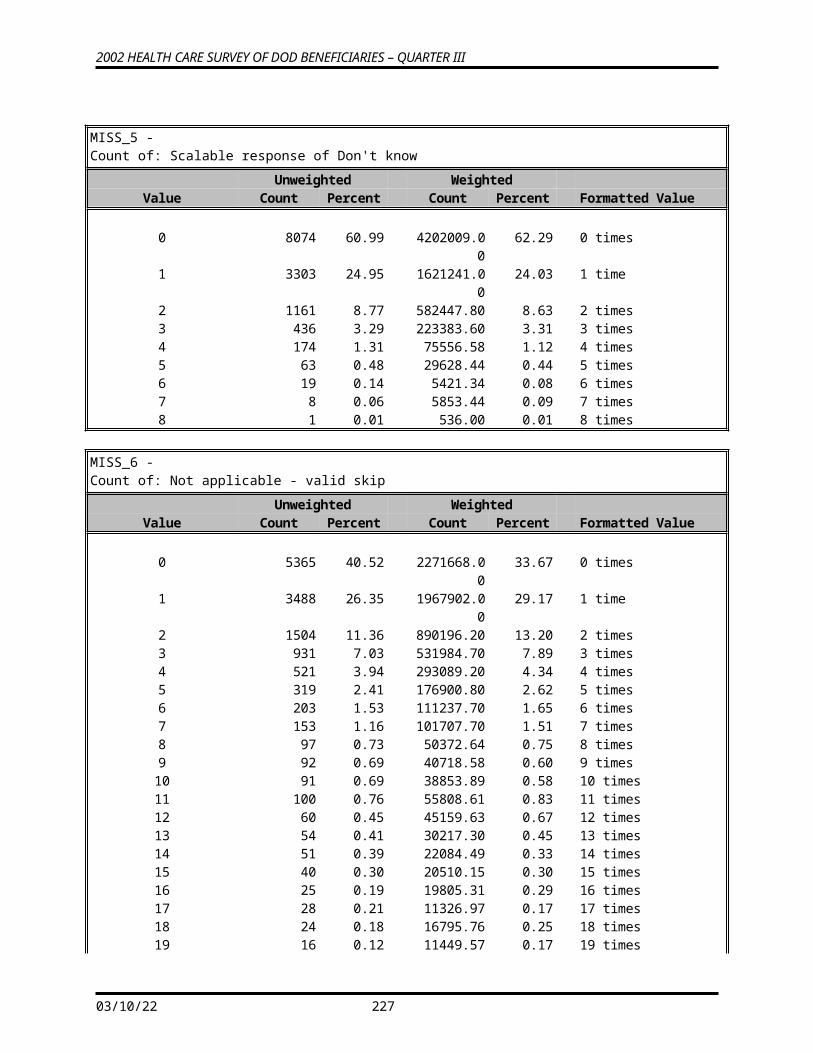
Coding Table for Note 11:H02029, H02030-H02039
N12 H02029 is:
H02030- H02039are:
H02029 is coded as:
H02030- H02039are coded as:
*
1 1: None “All are blank”or “blank or NA”
Stands as original value .N, valid skip if missing,.C, question should be skipped if marked
F
2 1: none, missing, or multiple response
At least one is “marked”
Stands as original value Stand as original value
3 2-7, missing, or multiple response
“Blank or NA” 1: None .N, valid skip if missing;.C, question should be skipped if marked
B
4 2-7 At least one is “marked” or“all are blank”
Stands as original value Stand as original value F
5 Missing response “All are blank” Stands as original value Stand as original value6 Multiple response “All are blank” 1: None .N, valid skip B* Indication of backward coding (B) or forward coding (F).Definition of “all are blank” in Coding Table for Note 11:Responses to H02030-H02039 are all missing.
Definition of “Blank or No or NA” in Coding Table for Note 11:Responses to H02030-H02039 are either all not applicable (-6) or a combination of missing response and not applicable (-6)
Definition of “marked” in Coding Table for Note 11:Any pattern of marks outside the definitions “all are blank” and “Blank or No or NA.”
C-11
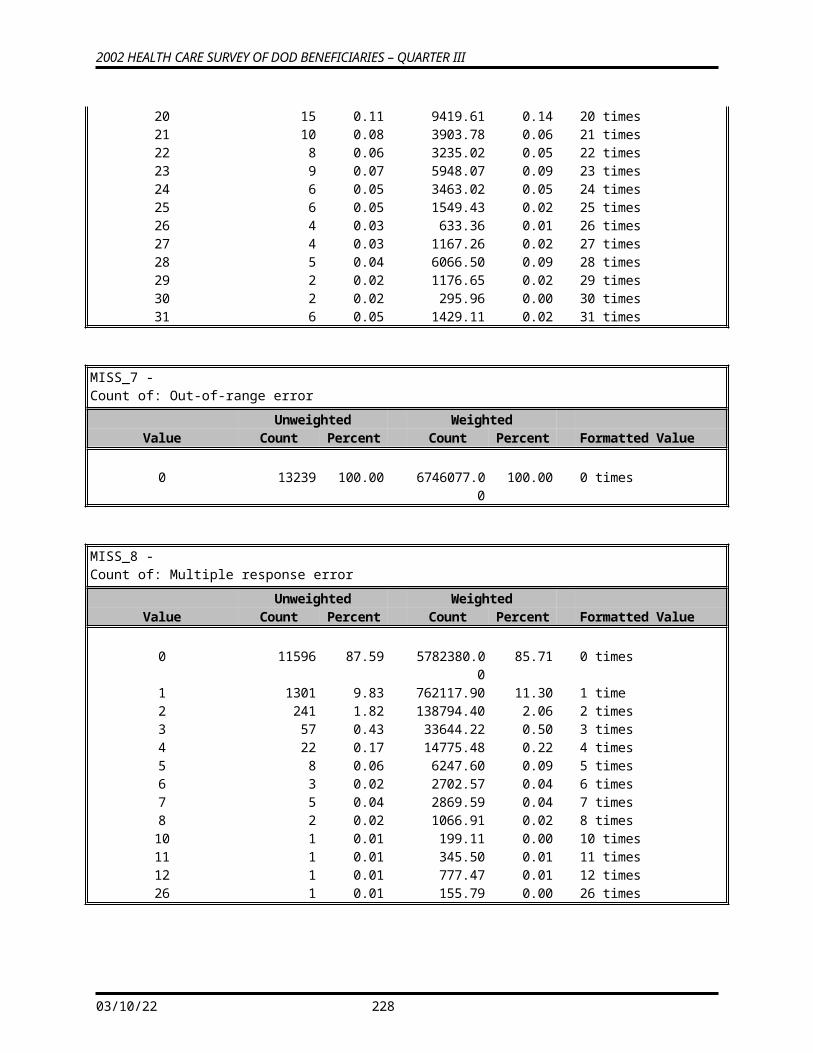
Coding Table for Note 12:S02D01, S02D02-S02D03
N12 S02D01 is: S02D02 is: S02D03 is: S02D01is coded as:
S02D02 & S02D03 are coded as:
*
1 1:yes Any value 0-10 or multiple response
Stands as original value
Stands as original value
2 1: Yes 1:none or missing Missing or –6: didn’t have any dental care
2:No .N, valid skip if missing;.C, question should be skipped if marked
BF
3 1: Yes 2-7 or multiple response
Any value Stands as original value
Stands as original value
4 2: No 1: none or missing –6: didn’t have any dental care, or missing
Stands as original value
.N, valid skip if missing;.C, question should be skipped if marked
F
5 2: No, missing, or multiple response
Any value 0-10 or multiple response
1:Yes Stands as original value
B
6 2: No, missing, or multiple response
2-7 or multiple response
Any value 1:Yes Stands as original value
B
7 Missing 1:none or missing –6: didn’t have any dental care, or missing
Stands as original value
Stands as original value
8 Multiple response 1:none or missing –6: didn’t have any dental care, or missing
Stands as original value
Stands as original value
* Indication of backward coding (B) or forward coding (F).
Coding Table for Note 13:S02M01, S02M02-S02M03
N13 S02M01 is: S02M02 & S02M03 are:
S02M01is coded as:
S02M02 & S02M03 are coded as:
*
1 1: yes At least one is “marked” or “all are blank”
Stands as original value Stand as original value
2 1: yes, missing, or multiple response
“Blank or NA” 2: no .N, valid skip if missing;.C, question should be skipped if marked
B
3 2: no, missing, or multiple response
At least one is “marked”
1: yes Stand as original value B
4 2: no “Blank or NA” or “all are blank”
Stands as original value .N, valid skip if missing;.C, question should be skipped if marked
F
5 Missing response “All are blank” Stands as original value Stand as original value6 Multiple response “All are blank” 2: no .N, valid skip B* Indication of backward coding (B) or forward coding (F).
Definition of “all are blank” in Coding Table for Note 13:Responses to S02M02 and S02M03 are both missing.
Definition of “blank or NA” in Coding Table for Note 13:
C-12
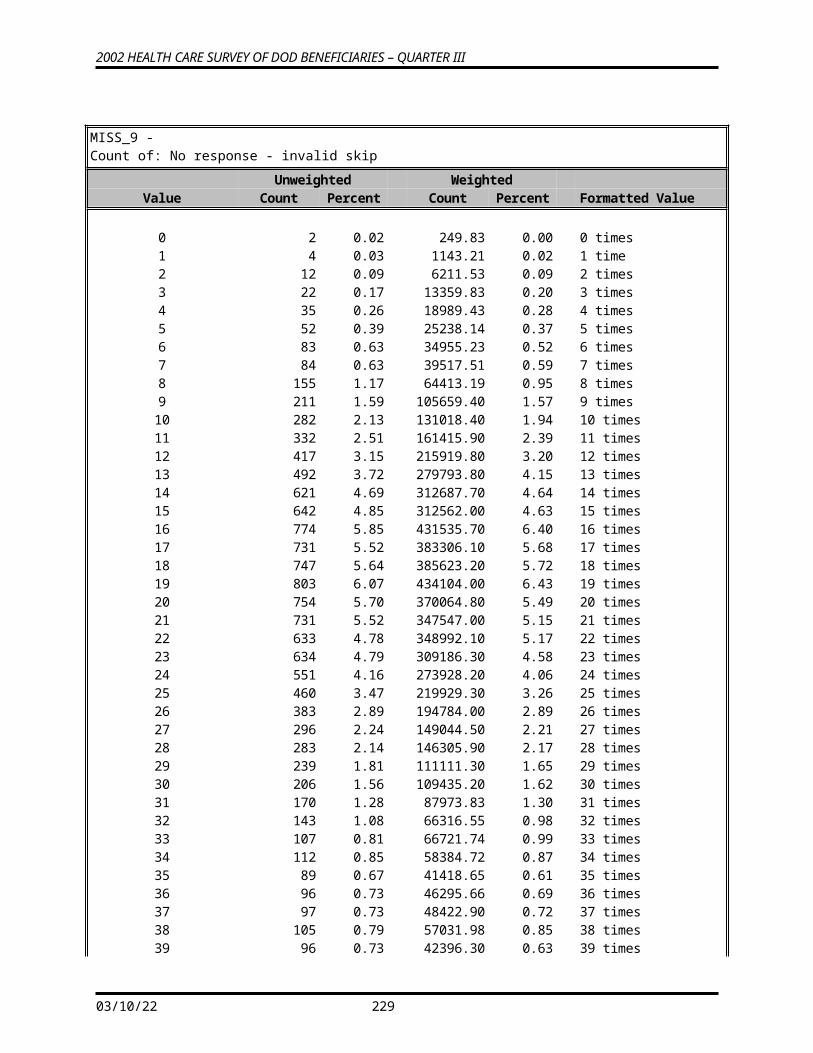
Responses to S02M02 and S02M03 are either both not applicable (-6) or a combination of missing response and not applicable (-6).
Definition of “marked” in Coding Table for Note 13:Any pattern of marks outside the definitions “all are blank” and “blank or NA”
C-13
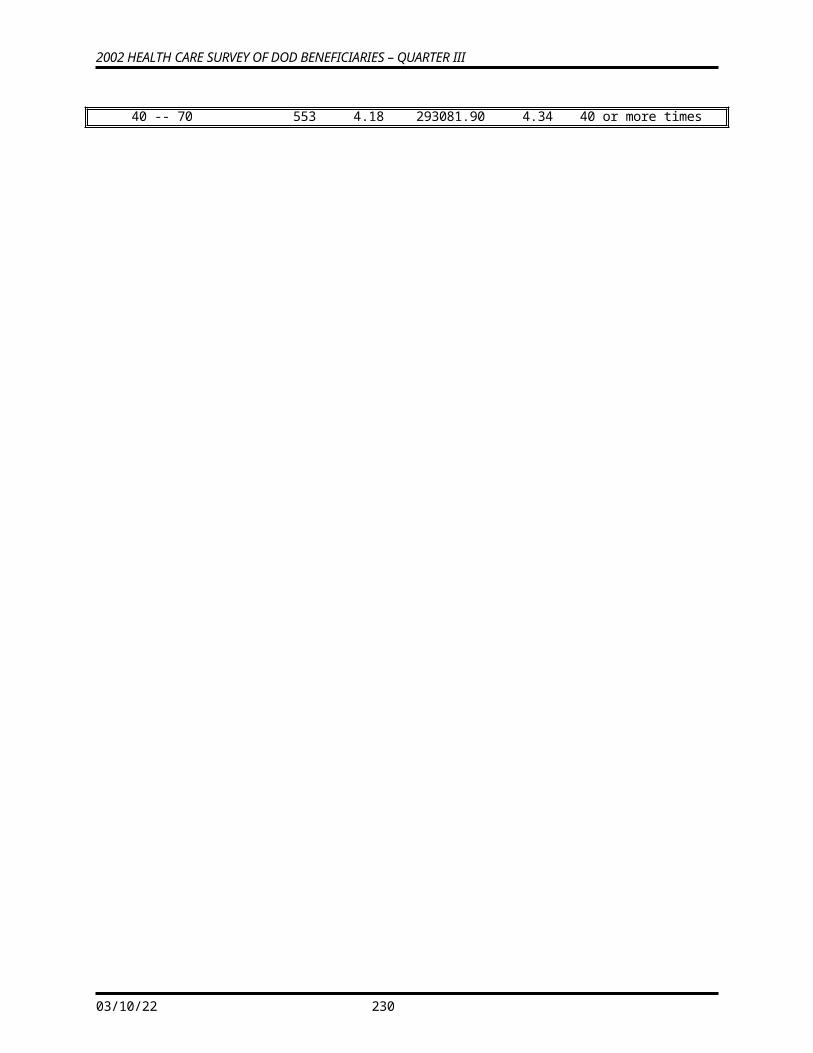
Coding Table for Note 14:S02P01, S02P02-S02P03
N14 S02P01 is: S02P02 & S02P03 are:
S02P01is coded as:
S02P02 & S02P03 are coded as:
*
1 1: yes At least one is “marked” or “all are blank”
Stands as original value Stand as original value
2 1: yes, missing, or multiple response
“Blank or NA” 2: no .N, valid skip if missing;.C, question should be skipped if marked
B
3 2: no, missing, or multiple response
At least one is “marked”
1: yes Stand as original value B
4 2: no “Blank or NA” or “all are blank”
Stands as original value .N, valid skip if missing;.C, question should be skipped if marked
F
5 Missing response “All are blank” Stands as original value Stand as original value6 Multiple response “All are blank” 2: no .N, valid skip B* Indication of backward coding (B) or forward coding (F).
Definition of “all are blank” in Coding Table for Note 14:Responses to S02P02 and S02P03 are both missing.
Definition of “blank or NA” in Coding Table for Note 14:Responses to S02P02 and S02P03 are either both not applicable (-6) or a combination of missing response and not applicable (-6).
Definition of “marked” in Coding Table for Note 14:Any pattern of marks outside the definitions “all are blank” and “blank or NA”
C-14
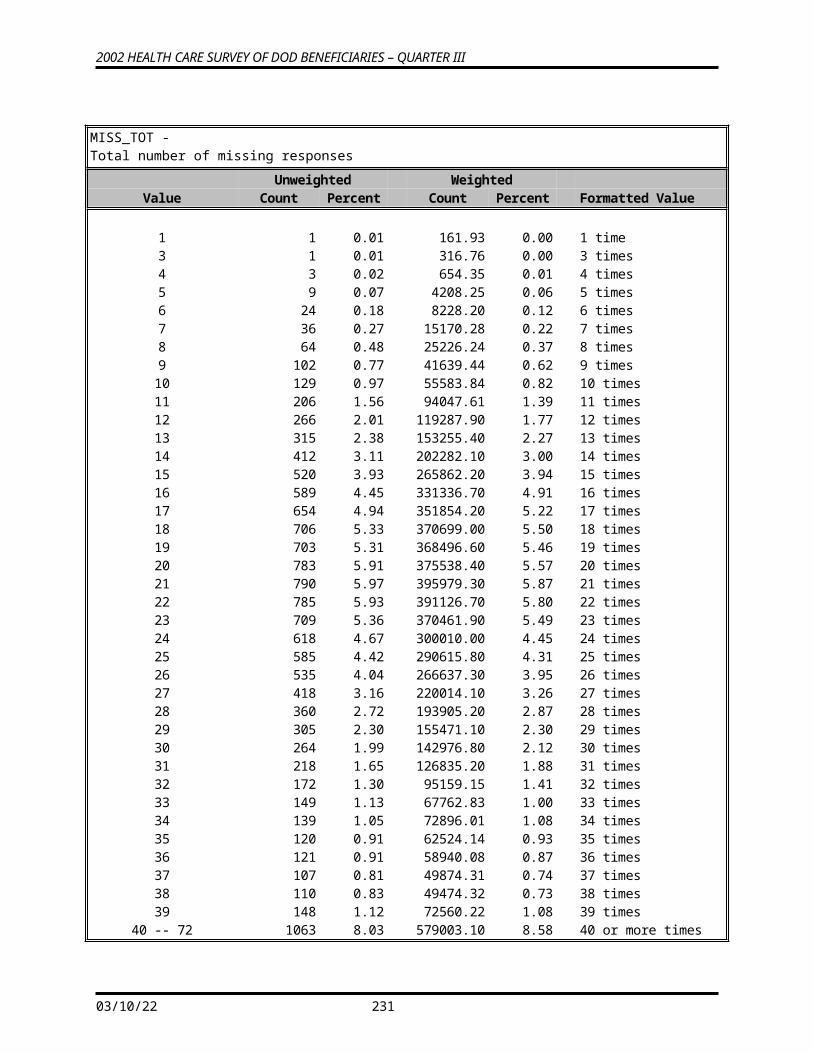
Coding Table for Note 15:H02043, H02044-H02046
N15 H02043 is: H02044-H02046 are:
H02043 is coded as:
H02044-H02046 are coded as:
*
1 1: yes At least one is “marked”, “all are blank” or “blank or don’t know”
Stands as original value Stand as original value
2 1: yes, -5: don’t know, missing, or multiple response
“Blank or NA” 2: no .N, valid skip if missing;.C, question should be skipped if marked
B
3 -5: don’t know At least one is “marked” 1:yes Stand as original value B4 -5: don’t know “Blank or don’t know” Stands as original value .N, valid skip if missing;
.C, question should be skipped if marked
BF
5 2: no, missing, or multiple response
At least one is “marked” or “blank or don’t know”
1: yes Stand as original value B
6 2: no, -5: don’t know “Blank or NA” or“all are blank”
Stands as original value .N, valid skip if missing;.C, question should be skipped if marked
7 Missing response “All are blank” Stands as original value Stand as original value8 Multiple response “All are blank” 2: no .N, valid skip B* Indication of backward coding (B) or forward coding (F).
Definition of “all are blank” in Coding Table for Note 15:Responses to H02044-H02046 are all missing.
Definition of “blank or NA” in Coding Table for Note 15:Responses to H02044-H02046 are either all not applicable (-6) or a combination of missing and not applicable (-6).
Definition of “blank or don’t know” in Coding Table for Note 15:Responses to H02044-H02046 are either all don’t know (-5) or a combination of missing and don’t know (-5).
Definition of “marked” in Coding Table for Note 15:Any pattern of marks outside the definitions “all are blank,” “blank or NA,” or “blank or don’t know.”
C-15

Table for Note 16:H02047, H02048
N16 H02047 is: H02048 is: H02047 is coded as: H02048 is coded as: *1 1: yes 1-3: categorize
problem, missing, or multiple response
Stands as original value
Stands as original value
2 1: yes, missing, or multiple response
-6: not applicable 2: no .C, question should be skipped
BF
3 2: no, missing, or multiple response
1-3: categorize problem or multiple response
1: yes Stands as original value B
4 2: no -6: not applicable, missing, or multiple response
Stands as original value
.N, valid skip if missing;
.C, question should be skipped if marked
F
5 Missing response Multiple response 1: yes Stands as original value B6 Missing response Missing response Stands as original
valueStands as original value
7 Multiple response Multiple response Stands as original value
Stands as original value
8 Multiple response Missing response 2: no .N, valid skip B* Indication of backward coding (B) or forward coding (F).
Coding Table for Note 17:H02049, H02050
N17 H02049 is: H02050 is: H02049 is coded as: H02050 is coded as: *1 1: yes 1-3: categorize
problem, missing, or multiple response
Stands as original value
Stands as original value
2 1: yes, missing, or multiple response
-6: not applicable 2: no .C, question should be skipped
BF
3 2: no, missing, or multiple response
1-3: categorize problem or multiple response
1: yes Stands as original value B
4 2: no -6: not applicable, missing, or multiple response
Stands as original value
.N, valid skip if missing;
.C, question should be skipped if marked
F
5 Missing response Multiple response 1: yes Stands as original value B6 Missing response Missing response Stands as original
valueStands as original value
7 Multiple response Multiple response Stands as original value
Stands as original value
8 Multiple response Missing response 2: no .N, valid skip B* Indication of backward coding (B) or forward coding (F).
C-16
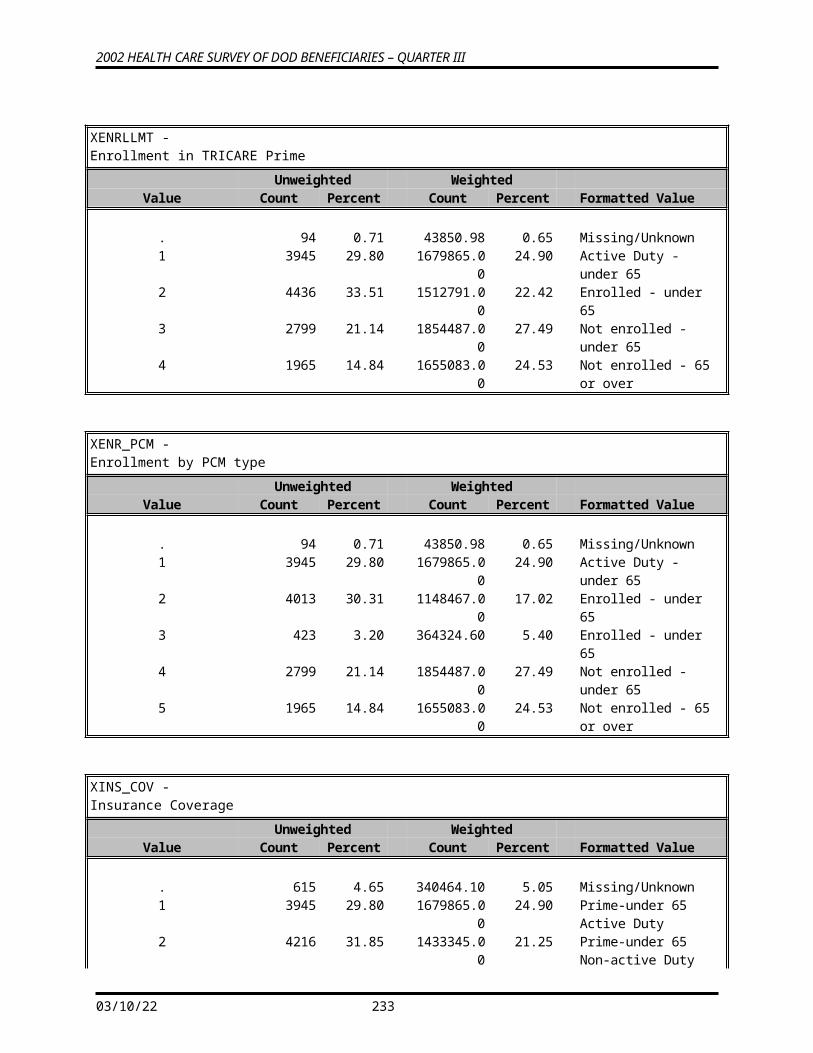
Coding Table for Note 18:H02051, H02052, H02053
N18 H02051 is:
H02052 & H02053 are:
H02051is coded as:
H02052 & H02053 are coded as:
*
1 1: yes At least one is “marked” or “all are blank”
Stands as original value Stand as original value
2 1: yes, missing, or multiple response
“Blank or NA” 2: no .N, valid skip if missing;.C, question should be skipped if marked
B
3 2: no, missing, or multiple response
At least one is “marked”
1: yes Stand as original value B
4 2: no “Blank or NA” or “all are blank”
Stands as original value .N, valid skip if missing;.C, question should be skipped if marked
F
5 Missing response “All are blank” Stands as original value Stand as original value6 Multiple response “All are blank” 2: no .N, valid skip B* Indication of backward coding (B) or forward coding (F).
Definition of “all are blank” in Coding Table for Note 18:Responses to H02052 an H02053 are both missing.
Definition of “blank or NA” in Coding Table for Note 18:Responses to H02052 and H02053 are either all not applicable (-6) or a combination of missing response and not applicable (-6).
Definition of “marked” in Coding Table for Note 18:Any pattern of marks outside the definitions “all are blank” and “blank or NA”
Coding Table for Note 19:H02054, H02055
N19 H02054 is: H02055 is: H02054 is coded as: H02055 is coded as: *1 1: yes 1-3: categorize
problem, missing, or multiple response
Stands as original value
Stands as original value
2 1: yes, missing, or multiple response
-6: not applicable 2: no .C, question should be skipped
BF
3 2: no, missing, or multiple response
1-3: categorize problem, or multiple response
1: yes Stands as original value B
4 2: no -6: not applicable or missing response
Stands as original value
.N, valid skip if missing;
.C, question should be skipped if marked
5 Missing response Multiple response 1: yes Stands as original value B6 Missing response Missing response Stands as original
valueStands as original value
7 Multiple response Missing response 2: no .N, valid skip B8 Multiple response Multiple response Stands as original
valueStands as original value
* Indication of backward coding (B) or forward coding (F).
C-17
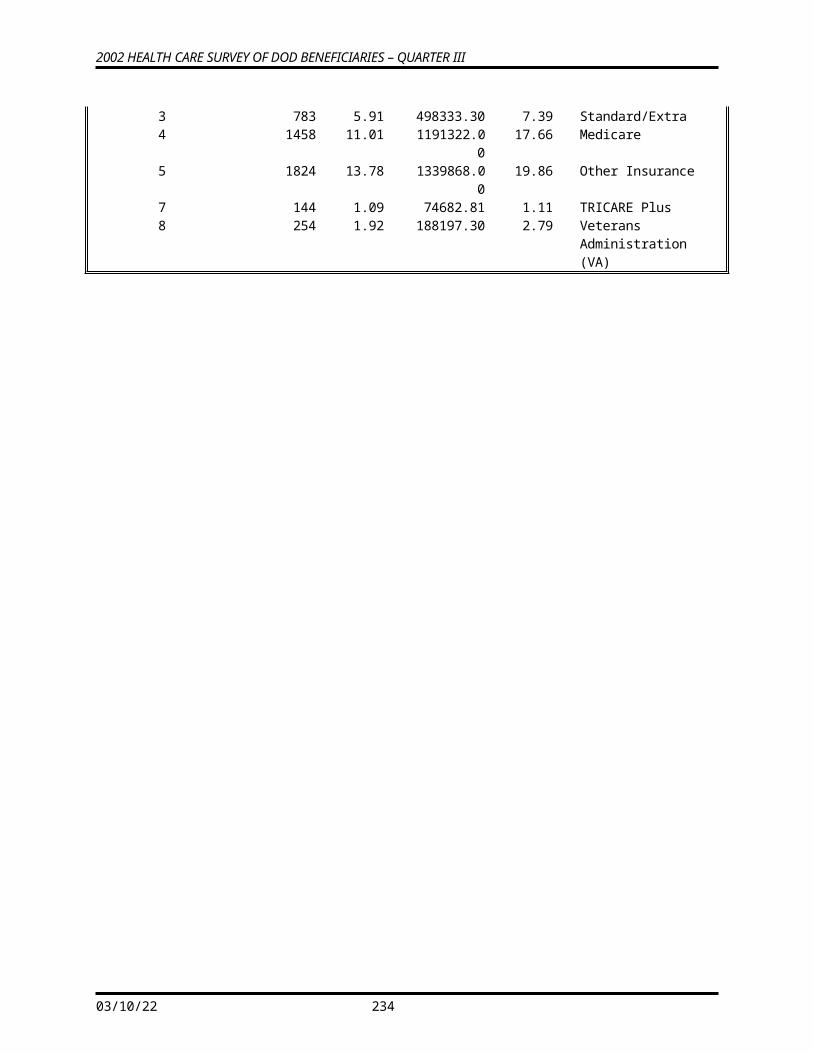
Coding Table for Note 24: H02063--H02066
N24 H02063
Is: H02064 is:
H02065 is:
H02066 is:
H02063 is coded as:
H02064is coded as:
H02065is coded as:
H02066is coded as:
*
1 1: ever smoked
3 or 4: still smoke
Marked or multiple response
Any value
Stands as original value
Stands as original value
.C, question should be skipped
Stands as original value
F
2 1: ever smoked
3 or 4: still smoke
Missing response
Any value
Stands as original value
Stands as original value
.N, valid skip
Stands as original value
3 1: ever smoked
2: quit 2: quit >1 year ago or –5: don’t know
Marked or multiple response
Stands as original value
Stands as original value
Stands as original value
.C, question should be skipped
F
4 1: ever smoked
2: quit 2: quit >1 year ago or -5: don’t know
Missing response
Stands as original value
Stands as original value
Stands as original value
.N, valid skip
5 1: ever smoked
2: quit 3: quit <1 year ago, missing, or multiple response
Any value
Stands as original value
Stands as original value
Stands as original value
Stands as original value
6 1: ever smoked
-5: don’t know, missing, or multiple response
2: quit >1 year ago
Marked or multiple response
Stands as original value
2: quit Stands as original value
.C, question should be skipped
FB
7 1: ever smoked
-5: don’t know, missing, or multiple response
2: quit >1 year ago
Missing response
Stands as original value
2: quit Stands as original value
.N, valid skip
FB
8 1: ever smoked
-5: don’t know, missing, or multiple response
3: quit <1 year ago
Any value
Stands as original value
2: quit Stands as original value
Stands as original value
B
9 1: ever smoked
-5:don’t know, missing, or multiple response
-5: don’t know, missing, or multiple response
Any value
Stands as original value
Stands as original value
Stands as original value
Stands as original value
10 2: never, -5: don’t know, missing, or multiple response
3 or 4: still smoke
Marked or multiple response
Any value
1: ever smoked
Stands as original value
.C, question should be skipped
Stands as original value
BF
* Indication of backward coding (B) or forward coding (F).
C-18
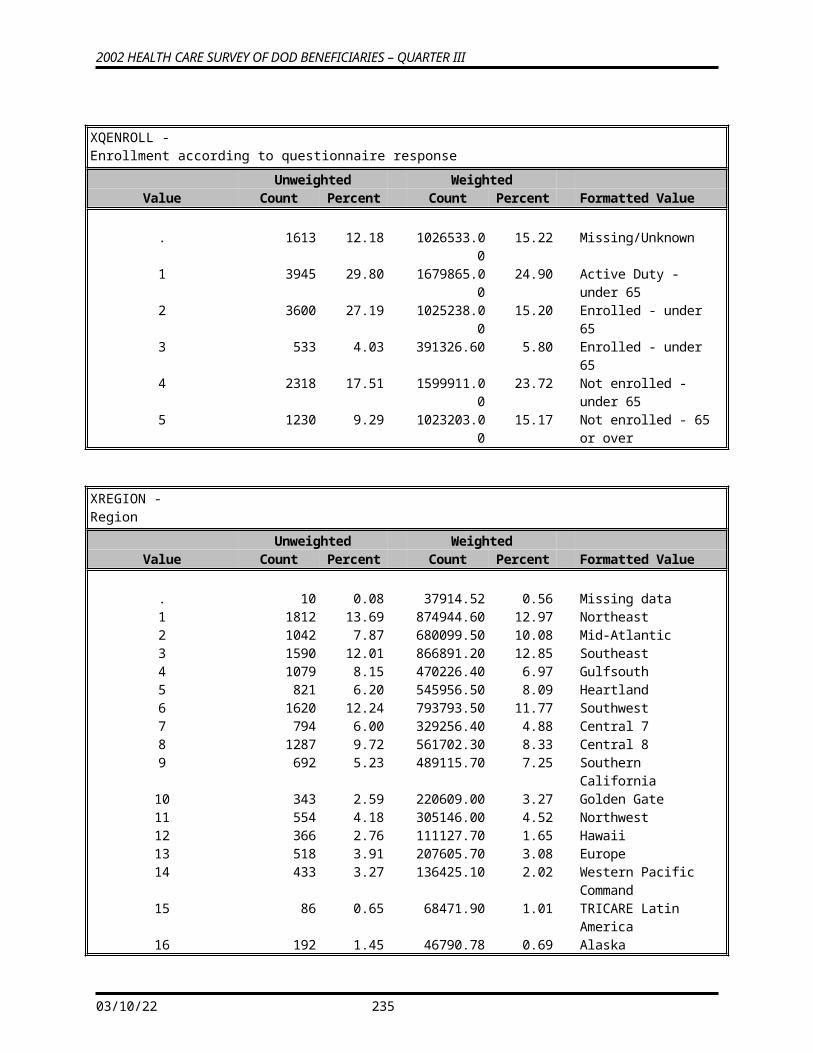
C-19
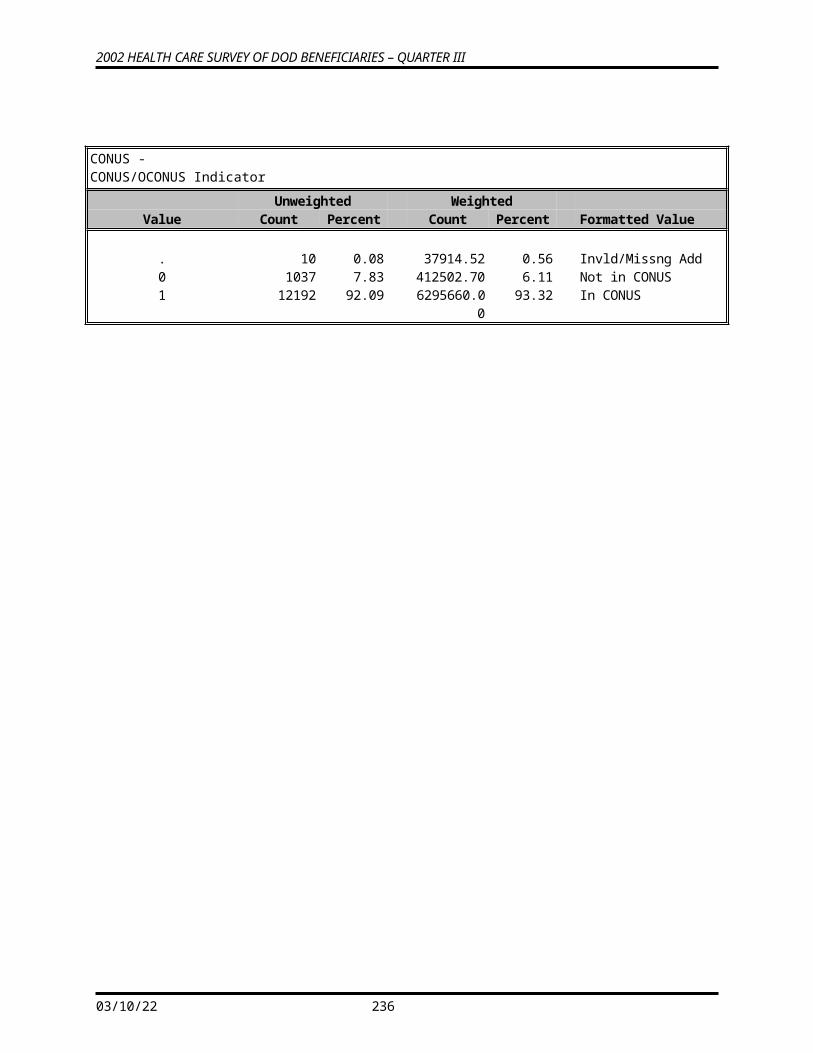
Coding Table for Note 24 continued:
N24 H02063 Is:
H02064 is:
H02065 is:
H02066 is:
H02063 is coded as:
H02064is coded as:
H02065is coded as:
H02066is coded as:
*
11 2: never,-5: don’t know, missing, or multiple response
3 or 4: still smoke
Missing response
Any value
1: ever smoked
Stands as original value
.N, valid skip
Stands as original value
B
12 2: never or -5: don’t know
2: quit,-5: don’t know, or multiple response
Marked or multiple response
Marked or multiple response
Stands as original value
.C, question should be skipped
.C, question should be skipped
.C, question should be skipped
F
13 2: never or -5: don’t know
2: quit,-5: don’t know, or multiple response
Marked or multiple response
Missing response
Stands as original value
.C, question should be skipped
.C, question should be skipped
.N, valid skip
F
14 2: never or -5: don’t know
2: quit,-5: don’t know, or multiple response
Missing response
Marked or multiple response
Stands as original value
.C, question should be skipped
.N, valid skip
.C, question should be skipped
F
15 2: never or -5: don’t know
2: quit,-5: don’t know, or multiple response
Missing response
Missing response
Stands as original value
.C, question should be skipped
.N, valid skip
.N, valid skip
F
16 2: never or-5: don’t know
Missing response
Marked or multiple response
Marked or multiple response
Stands as original value
.N, valid skip
.C, question should be skipped
.C, question should be skipped
F
17 2: never or-5: don’t know
Missing response
Marked or multiple response
Missing response
Stands as original value
.N, valid skip
.C, question should be skipped
.N, valid skip
F
18 2: never or-5: don’t know
Missing response
Missing response
Marked or multiple response
Stands as original value
.N, valid skip
.N, valid skip
.C, question should be skipped
F
19 2: never or-5: don’t know
Missing response
Missing response
Missing response
Stands as original value
.N, valid skip
.N, valid skip
.N, valid skip
20 Missing or multiple response
2: quit, missing, or multiple response
3: quit <1 year ago
Any value
1: ever smoked
Stands as original value
Stands as original value
Stands as original value
B
* Indication of backward coding (B) or forward coding (F).
C-20
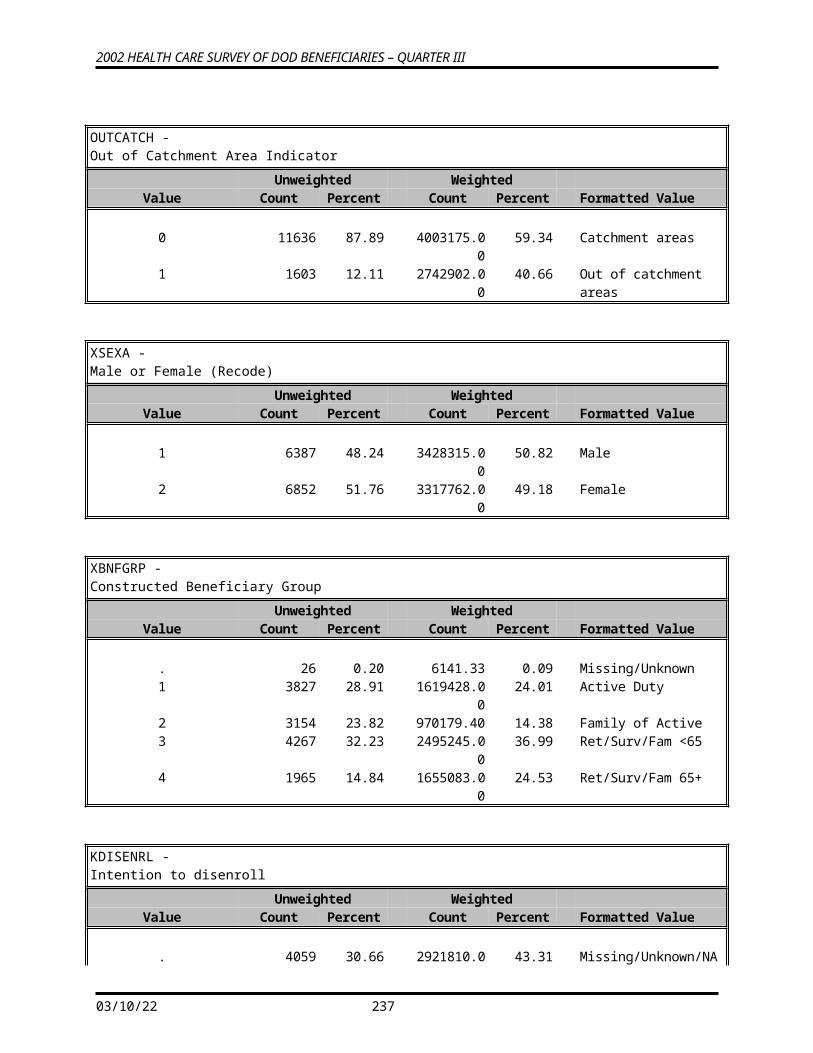
Coding Table for Note 24 continued:
N24 H02063 Is:
H02064 is:
H02065 is:
H02066 is:
H02063 is coded as:
H02064is coded as:
H02065is coded as:
H02066is coded as:
*
21 Missing or multiple response
2: quit, missing, or multiple response
2: quit >1 year ago
Marked or multiple response
1: ever smoked
Stands as original value
Stands as original value
.C, question should be skipped
BF
22 Missing or multiple response
2: quit, missing, or multiple response
2: quit >1 year ago
Missing response
1: ever smoked
Stands as original value
Stands as original value
.N, valid skip
B
23 Missing or multiple response
2: quit, missing, or multiple response
-5: don’t know
Missing response
Stands as original value
Stands as original value
Stands as original value
.N, valid skip
24 Missing or multiple response
2: quit, missing, or multiple response
-5: don’t know
Marked or multiple response
Stands as original value
Stands as original value
Stands as original value
.C, question should be skipped
F
25 Missing or multiple response
2: quit, missing, or multiple response
Missing or multiple response
2-5: some visits
1: ever smoked
Stands as original value
Stands as original value
Stands as original value
B
26 Missing or multiple response
2: quit, missing, or multiple response
Missing or multiple response
1: none, missing, or multiple response
Stands as original value
Stands as original value
Stands as original value
Stands as original value
27 Missing or multiple response
-5: don’t know
Marked or multiple response
Marked or multiple response
Stands as original value
Stands as original value
.C, question should be skipped
.C, question should be skipped
F
28 Missing or multiple response
-5: don’t know
Marked or multiple response
Missing response
Stands as original value
Stands as original value
.C, question should be skipped
.N, valid skip
F
29 Missing or multiple response
-5: don’t know
Missing response
Missing response
Stands as original value
Stands as original value
.N, valid skip
.N, valid skip
30 Missing or multiple response
-5: don’t know
Missing response
Marked or multiple response
Stands as original value
Stands as original value
.N, valid skip
.C, question should be skipped
F
* Indication of backward coding (B) or forward coding (F).
C-21

Coding Table for Note 25:
Note 25(Part A):H02067, SEX, XSEXA, H02068-H02075N25A
H02067: SEX is: H02068 is: H02069--H02075 are:
XSEXA is coded as:
1 Missing or multiple response
F Marked Any marked 2, female
2 Missing or multiple response
F Missing or multiple response
All missing or multiple response
2, female
3 Missing or multiple response
M Marked Any marked 1, male
4 Missing or multiple response
M Missing or multiple response
All missing or multiple response
1, male
5 Missing or multiple response
Any value Marked All missing or multiple response
1, male
6 Missing or multiple response
Any value Missing or multiple response
Any marked 2, female
7 Missing or multiple response
Z Marked Any marked ., missing value
8 Missing or multiple response
Z Missing or multiple response
All missing or multiple response
., missing value
9 1, male Any value Marked All missing or multiple response
1, male
10 1, male F Missing or multiple response
Any marked 2, female
11 1, male M or Z Missing or multiple response
Any marked 1, male
12 1, male Any value Marked Any marked 1, male13 1, male Any value Missing or
multiple responseAll missing or multiple response
1, male
14 2, female Any value Missing or multiple response
Any marked 2, female
15 2, female M Marked All missing or multiple response
1, male
16 2, female F or Z Marked All missing or multiple response
2, female
17 2, female Any value Marked Any marked 2, female18 2, female Any value Missing or
multiple responseAll missing or multiple response
2, female
SEX is the gender from the DEERS file. This variable is not used to override questionnaire responses, but to clear up any omissions or discrepancies in the responses.
XSEXA is the recoded gender variable after taking into account the self-reported response (H02067), any responses to gender-specific questions, and the gender of the sample beneficiary from DEERS.
C-22
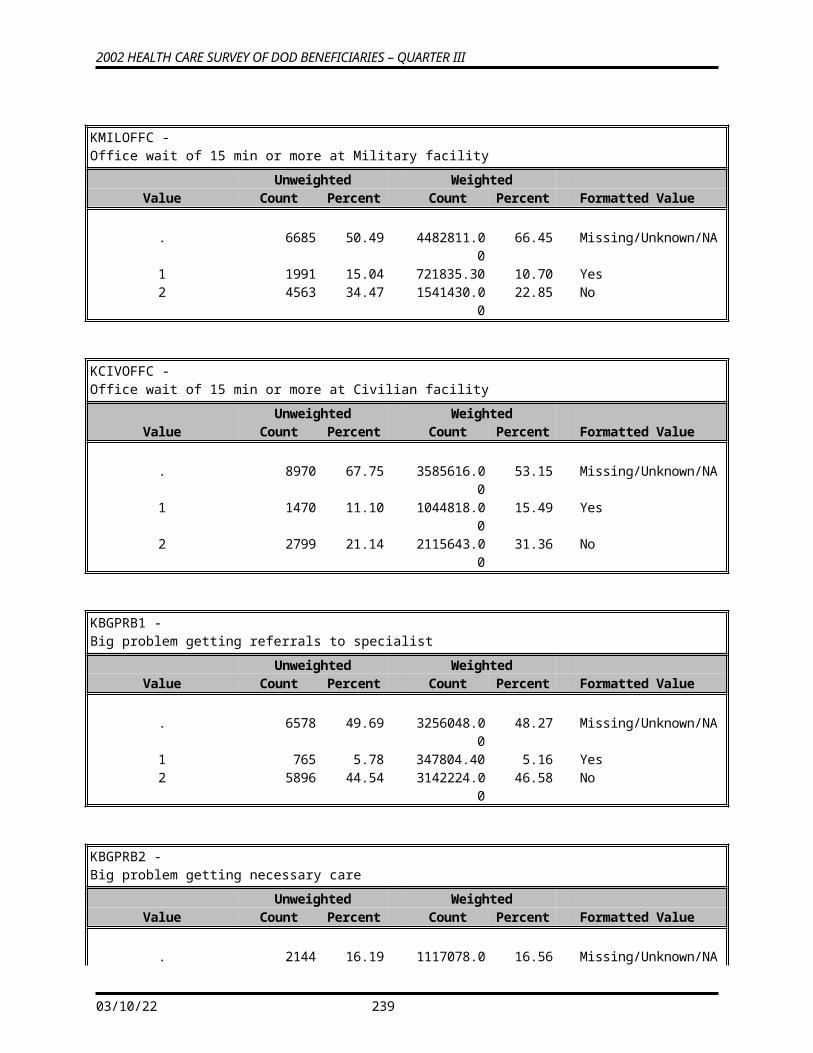
C-23
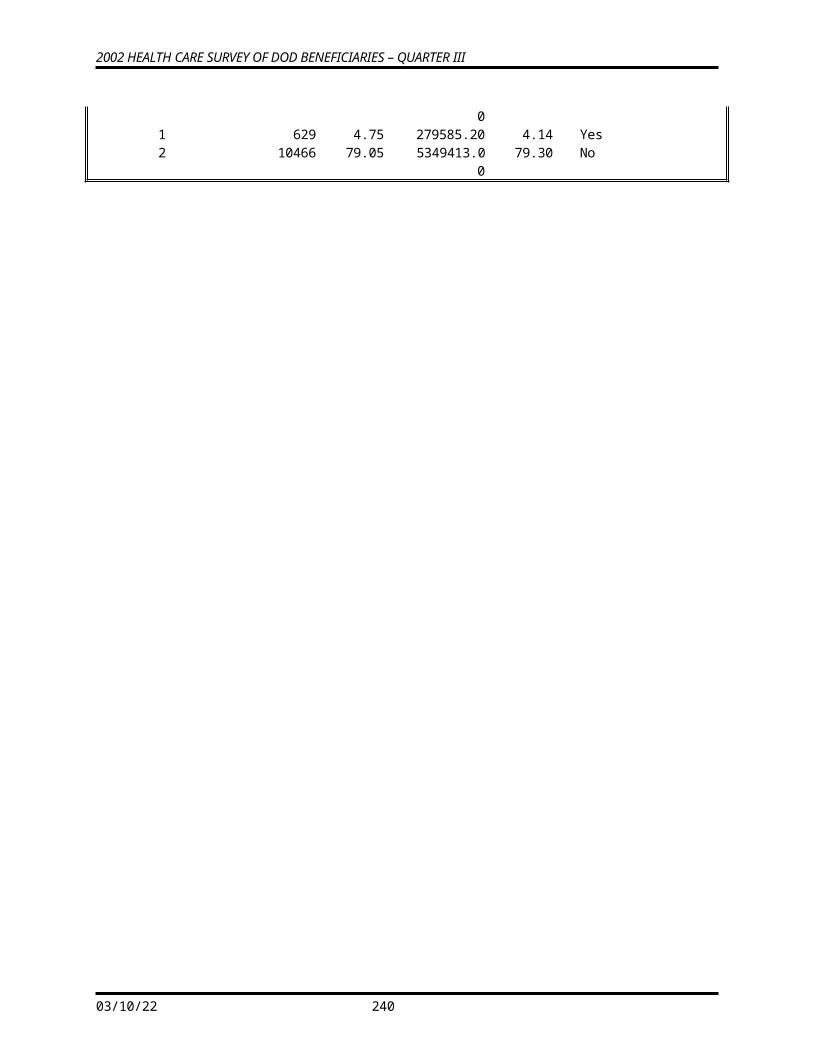
Note 25 (Part B):XSEXA, H02068
N25B XSEXA is: H02068 is: H02068 is coded as: *1 1: Male Marked, missing, or multiple response Stands as original value2 2: Female Marked or multiple response .C, question should be skipped F3 2: Female Missing response .N, valid skip F4 Missing Any response Missing value F* Indication of backward coding (B) or forward coding (F).
Note 25 (Part C):XSEXA, H02069 - H02075
N25C XSEXA is: H02069--H02075 are: H02069 --H02075 are coded as: *1 1: Male “All are blank” .N, valid skip F2 1: Male At least one is “marked” .N, valid skip if missing;
.C, question should be skipped if marked
F
3 2: Female “All are blank” or at least one is “marked” Stands as original value4 Missing “All are blank” or at least one is “marked” Missing value F* Indication of backward coding (B) or forward coding (F).
Definition of “all are blank” in Coding Table for Note 25c:All variables H02069--H02075 are missing.
Definition of “marked” in Coding Table for Note 25c:Any pattern of marks outside the definition “all are blank.”
C-24
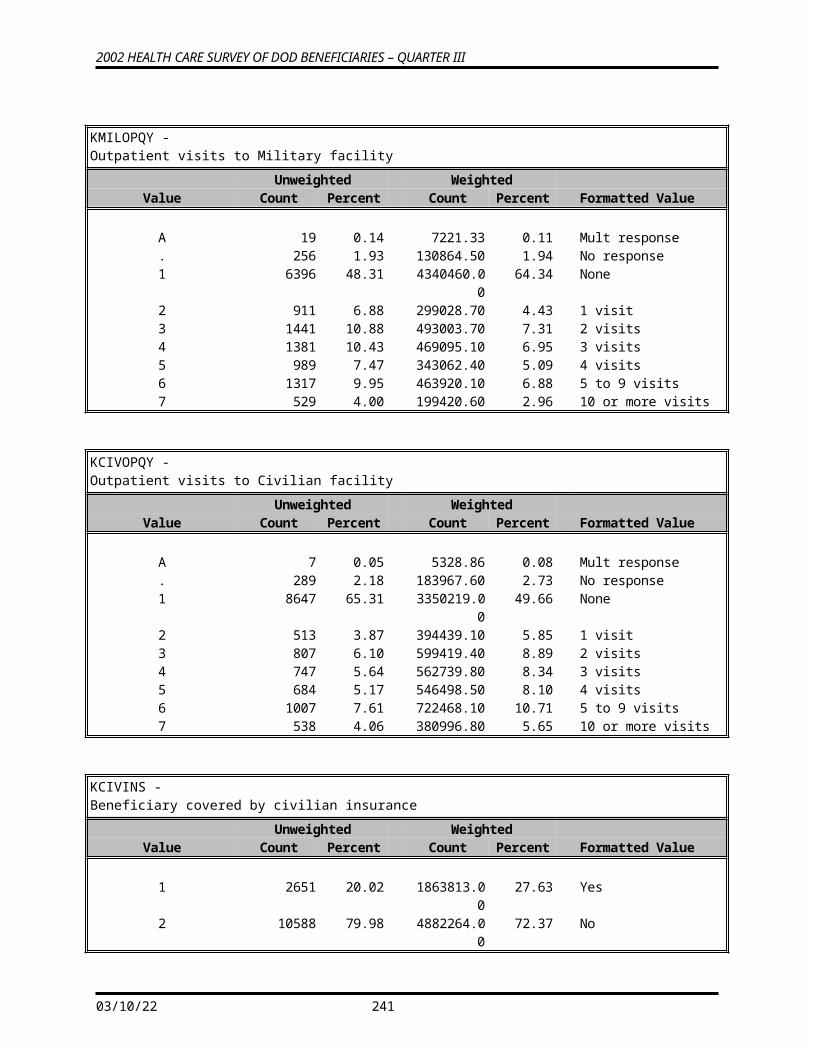
C-25
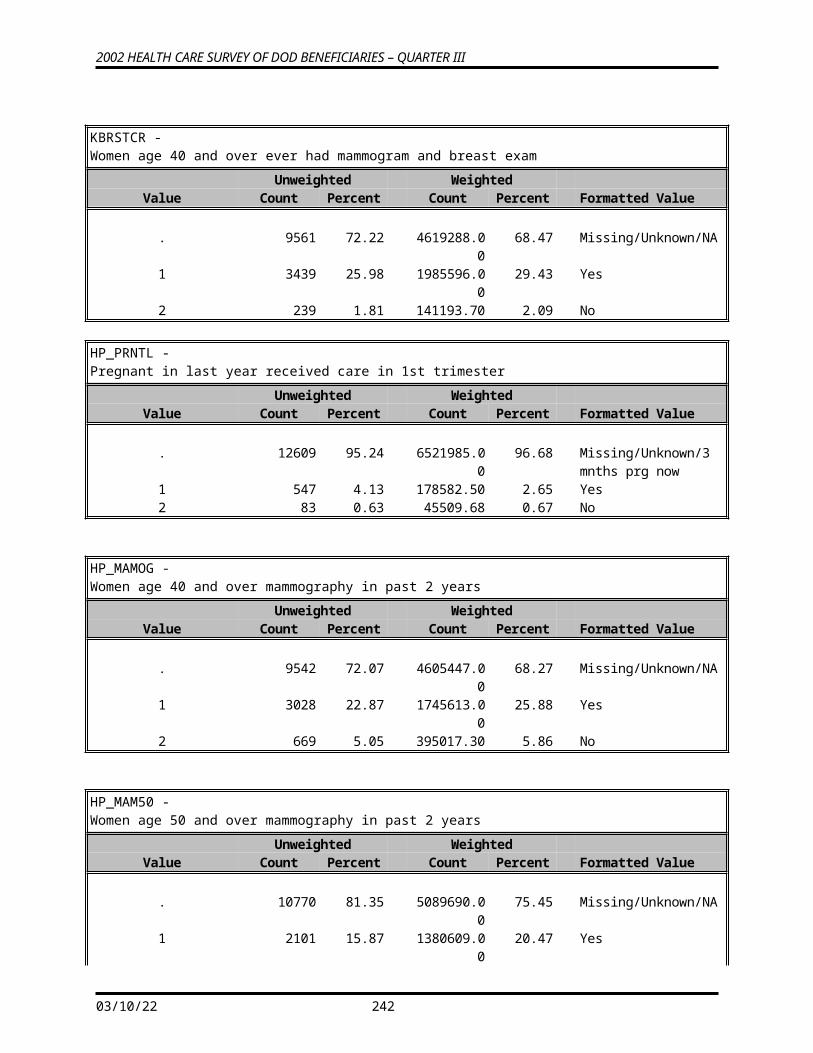
Coding Table for Note 26XSEXA, AGE, H02070, H02071, H02072
N26XSEXA is:
AGE is:
H02070 is:
H02071 & H02072 are:
H02070 is coded as:
H02071 & H02072 are coded as:
*
1 1: Male Any value
.C, question should be skipped, or .N, valid skip
C, question should be skipped, or .N, valid skip
Stands as original value
Stands as original value
2 2: Female
Any value
2: 40 or over Marked, missing, or multiple response
Stands as original value
Stand as original value
3 2: Female
Any value
1: under 40 Marked, missing or multiple response
Stands as original value
.N, valid skip if missing;.C, question should be skipped if marked
F
4 2: Female
Any value
Multiple response Marked or multiple response
2: > 40 Stand as original value
5 2: Female
Any value
Multiple response Missing 1: < 40 .N, valid skip BF
6 2: Female
Any value
Missing Marked or multiple response
2: > 40 Stand as original value
B
7 2: Female
< 40 Missing Missing 1: < 40 .N, valid skip F
8 2: Female
>=40 Missing Missing 1: < 40 .N, valid skip B
9 2: Female
Missing Missing Missing Stands as original value
Stand as original value
10 Missing Any value
Missing Missing Stands as original value
Stand as original value
* Indication of backward coding (B) or forward coding (F).
C-26
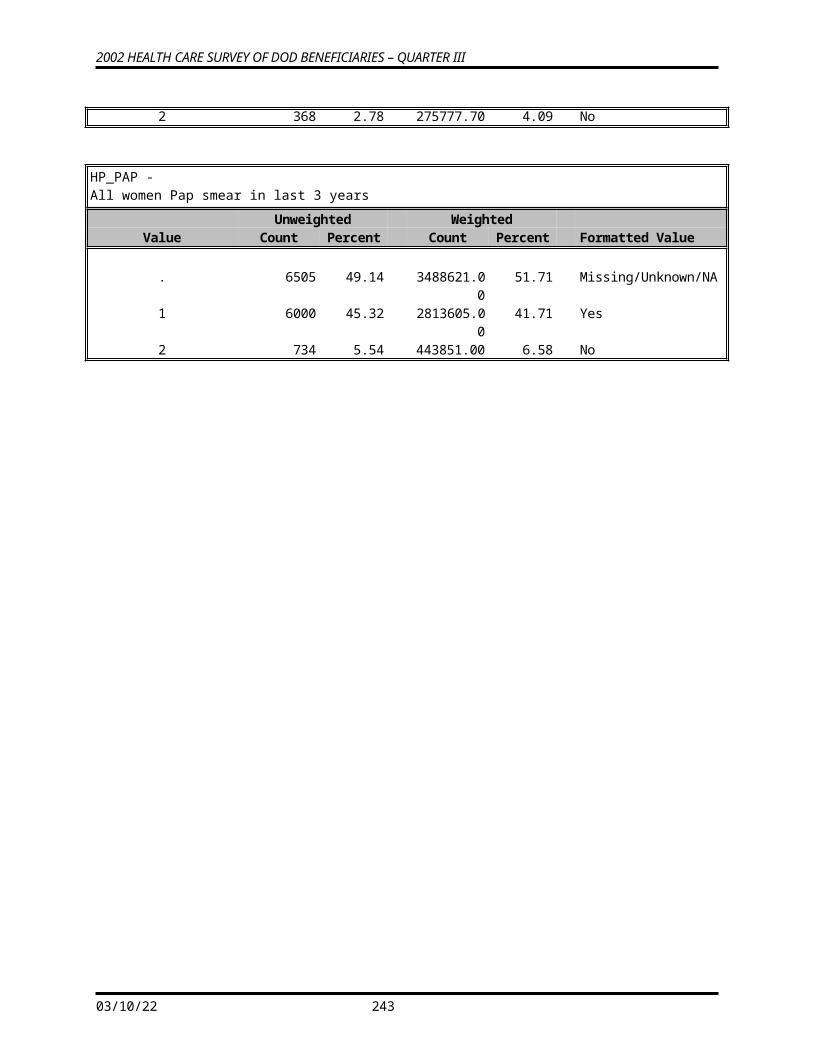
Coding Table for Note 27:XSEXA, H02073, H02074, H02075
N27 XSEXA is:
H02073 is: H02074is:
H02075 is: H02073 is coded as:
H02074 is coded as:
H02075 is coded as:
*
1 1: Male .C, question should be skipped, or .N, valid skip
.C, question should be skipped, or .N, valid skip
.C, question should be skipped, or .N, valid skip
Stands as original value
Stands as original value
Stands as original value
2 2: Female
1: pregnant now
Marked, missing, or multiple response
Marked, missing, or multiple response
Stands as original value
Stands as original value
Stands as original value
3 2: female
2: pregnant in last 12 months
Marked, missing or multiple response
Marked, missing or multiple response
Stands as original value
.N, valid skip if missing;.C, question should be skipped if marked
Stands as original value
F
4 2: Female
3: not pregnant in past 12 months
Marked, missing, or multiple response
Marked, missing, or multiple response
Stands as original value
.N, valid skip if missing;.C, question should be skipped if marked
.N, valid skip if missing;.C, question should be skipped if marked
F
5 2: Female
Missing or multiple response
Marked, or multiple response
Marked, missing or multiple response
1: pregnant now
Stands as original value
Stands as original value
B
6 2: Female
Missing response
Missing response
Marked, missing or multiple response
Stands as original value
Stands as original value
Stands as original value
7 2: Female
Multiple response
Missing response
Marked, missing or multiple response
3:not pregnant in past 12 months
.N, valid skip .N, valid skip if missing; .C, question should be skipped if marked
BF
8 Missing Missing or multiple response
Marked, missing or multiple response
Marked, missing or multiple response
Stands as original value
Stands as original value
Stands as original value
* Indication of backward coding (B) or forward coding (F).
C-27
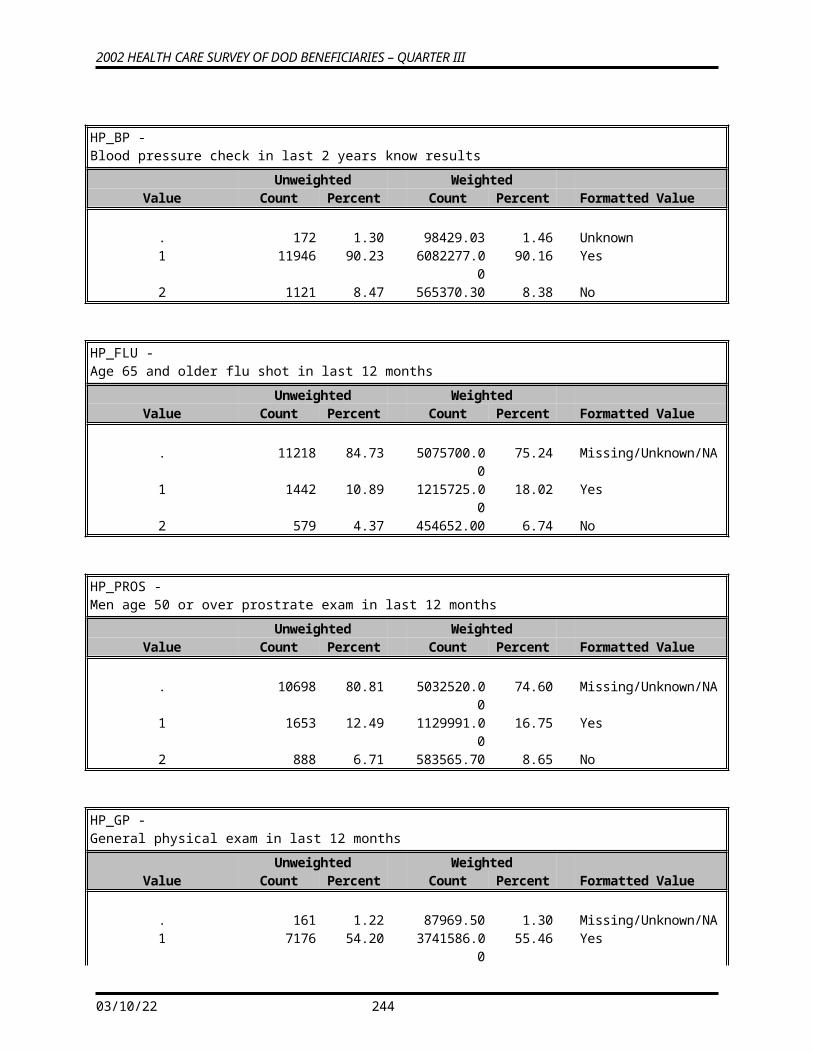
APPENDIX D
SAS PROC CONTENTS – ALPHABETICAL 2002 ADULT HCSDB – QUARTER III
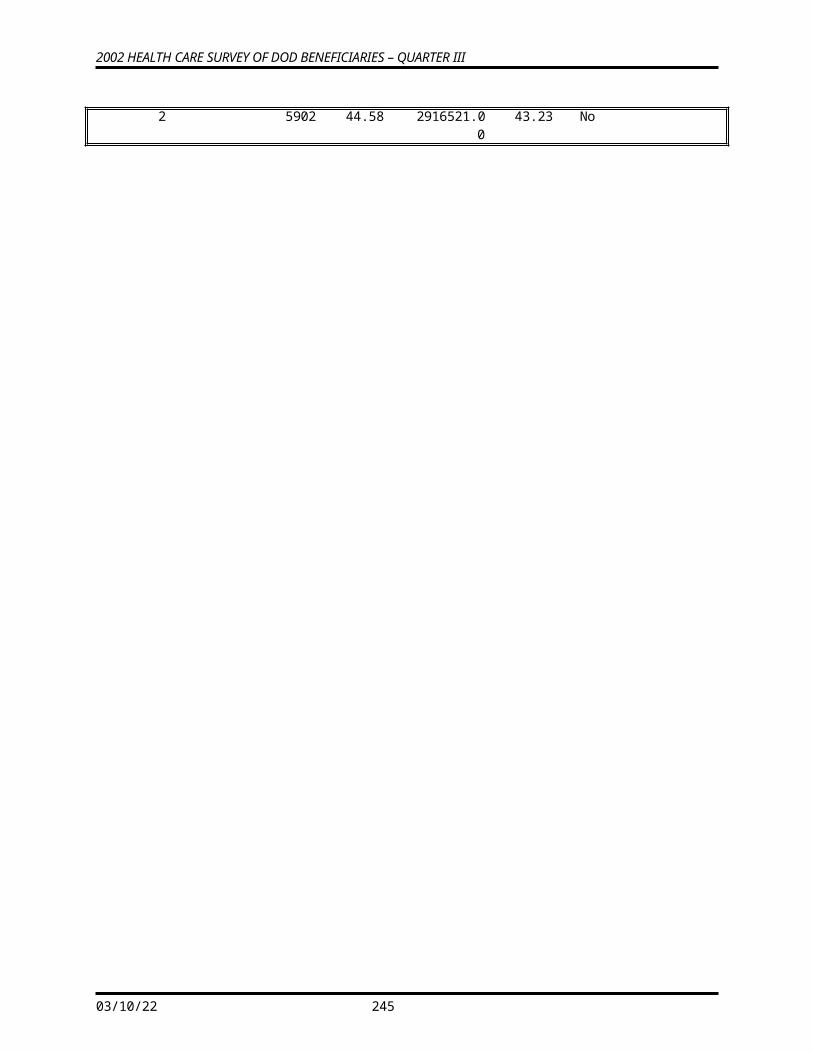
The SAS System 1
The CONTENTS Procedure
Data Set Name: IN.HCS023_1 Observations: 13239Member Type: DATA Variables: 268 Engine: V6 Indexes: 0 Created: 17:01 Wednesday, November 6, 2002 Observation Length: 1545 Last Modified: 17:01 Wednesday, November 6, 2002 Deleted Observations: 0 Protection: Compressed: YES Data Set Type: Reuse Space: NO Label: Point to Observations: NO Sorted: NO
-----Engine/Host Dependent Information-----
Data Set Page Size: 16384 Number of Data Set Pages: 1021 Number of Data Set Repairs: 0 File Name: C:\Files\DOD\Q3_2002\DATA\AFINAL\hcs023_1.sd2Release Created: 6.08.00 Host Created: WIN
-----Alphabetic List of Variables and Attributes----- # Variable Type Len Pos Format Informat Labelƒƒƒƒƒƒƒƒƒƒƒƒƒƒƒƒƒƒƒƒƒƒƒƒƒƒƒƒƒƒƒƒƒƒƒƒƒƒƒƒƒƒƒƒƒƒƒƒƒƒƒƒƒƒƒƒƒƒƒƒƒƒƒƒƒƒƒƒƒƒƒƒƒƒƒƒƒƒƒƒƒƒƒƒƒƒ207 ADJ_CELL Char 7 1050 ADJ_CELL - Adjusted STRATUM cell 206 BWT Num 8 1042 BWT - Basic Sampling Weight 5 CACSMPL Char 4 31 $CAC. CACSMPL - Catchment Area 182 CONUS Num 3 855 CONUSMHS. CONUS - CONUS/OCONUS Indicator 25 DAGEQY Char 3 88 Age (As of 28 February 2002) 28 DBENCAT Char 3 97 $BENCAT. Beneficiary Category 11 DCATCH Char 4 62 Catchment Area 29 DMEDELG Char 1 100 $MEDELG. Medical Privlege Code 12 DMIS_ID Char 9 66 DMIS ID
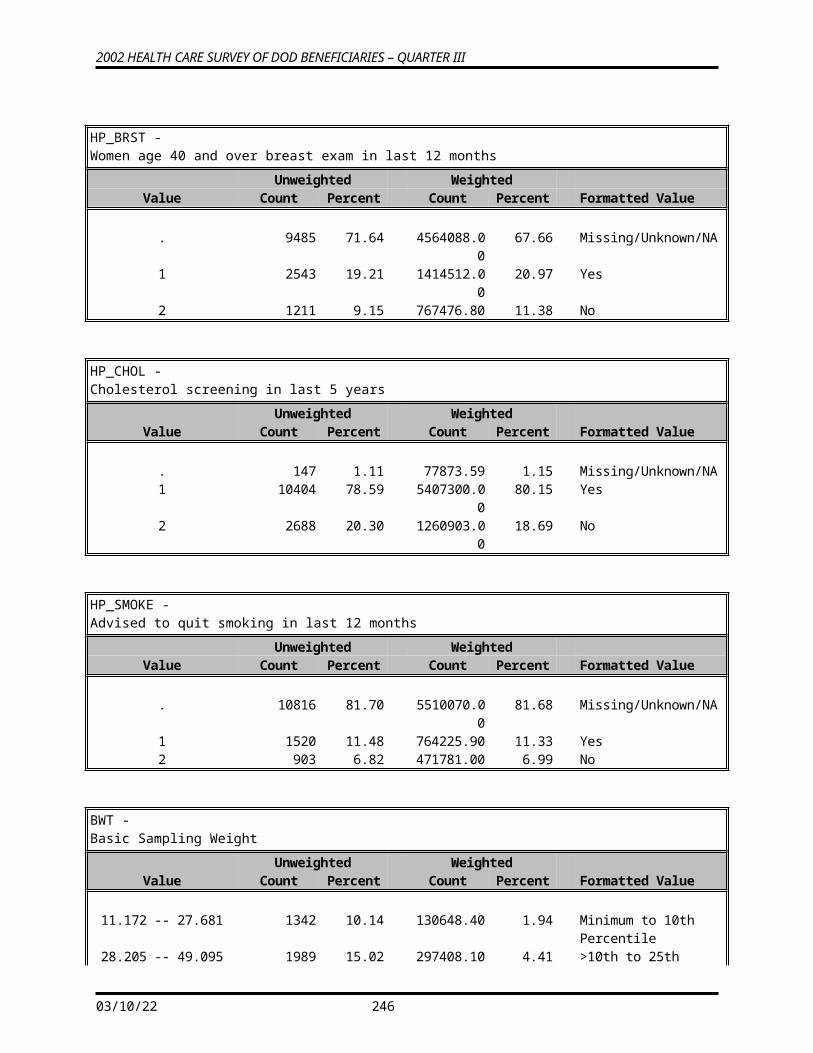
30 DSPONSVC Char 1 101 $SPONSVC. Derived Sponsor Branch of Service 141 DUPFLAG Char 3 537 Multiple Response Indicator 13 E1 Char 1 75 Eligibility indicator for period = 1 14 E2 Char 1 76 Eligibility indicator for period = 2 15 E3 Char 1 77 Eligibility indicator for period = 3 16 E4 Char 1 78 Eligibility indicator for period = 4 17 E5 Char 1 79 Eligibility indicator for period = 5 18 E6 Char 1 80 Eligibility indicator for period = 6 19 E7 Char 1 81 Eligibility indicator for period = 7 6 ENBGSMPL Char 2 35 $ENBGS. Enrollment by beneficiary category 26 FIELDAGE Char 3 91 Age as of July 1st 2002 140 FLAG_FIN Char 5 532 $FINAL. $5. Final Disposition 142 FNSTATUS Num 8 540 FNSTATS. Final Status 35 H02001 Num 4 112 YN. 11. Are you the person listed on envelope 47 H02003 Num 4 160 MEDA. 11. Currently Covered Medicare Part A 48 H02004 Num 4 164 MEDB. 11. Currently Covered Medicare Part B 49 H02005 Num 4 168 MEDSUPP. 11. Currently Covered Medicare Supplemental 50 H02006 Num 4 172 HPLAN1C_. 11. Which health plan did you use most 51 H02007 Num 4 176 HPTIME. 11. yrs in a row with health plan 52 H02008 Num 4 180 YN. 11. When joined hlth plan, rcv new prsnl Dr 53 H02009 Num 4 184 PROB1_. 11. Health plan: prblm to get Dr happy with 54 H02010 Num 4 188 YN. 11. Have one person think of as personal Dr 55 H02011 Num 4 192 RATE1_. 11. Rating of your personal Dr or nurse 56 H02012 Num 4 196 YN. 11. Currently enrolled in TRICARE Prime 57 H02013 Num 4 200 PCMBASE. 11. TRICARE member:prmry care mgr mil or cvl 58 H02014 Num 4 204 YN. 11. Know your PCM's name 59 H02015 Num 4 208 YN. 11. In lst yr:you/Dr think you need spclst 60 H02016 Num 4 212 PROB2_. 11. In lst yr:how much prblm rfrl to spclst 61 H02017 Num 4 216 YN. 11. In lst yr:did you see a specialist 62 H02018 Num 4 220 RATE2_. 11. Rating of specialist seen in lst yr 63 H02019 Num 4 224 YNOFT. 11. In lst yr:spclst saw same as persnl Dr 64 H02020 Num 4 228 YN. 11. In lst yr:call Dr for help/advice 65 H02021 Num 4 232 OFTEN2_. 11. In lst yr:when call how often get hlp nd 66 H02022 Num 4 236 YN. 11. In lst yr:make appts for reg hlth care
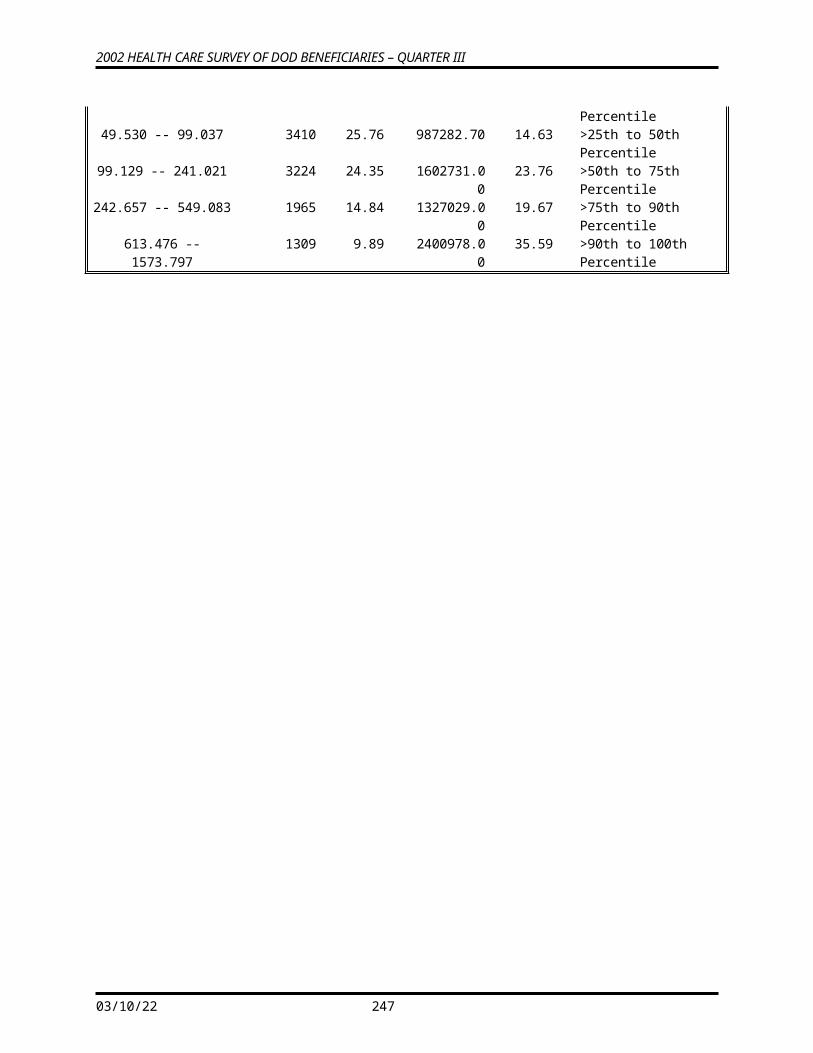
67 H02023 Num 4 240 OFTEN3_. 11. In lst yr:appt reg hlth care when wnted 68 H02024 Num 4 244 TIME1B_. 11. In lst yr:days btwn appt & see prvder 69 H02025 Num 4 248 YN. 11. In lst yr:illness/injry care right away 70 H02026 Num 4 252 OFTEN4_. 11. In lst yr:get care as soon as wanted 71 H02027 Num 4 256 TIME2_. 11. In lst yr:wait btwn try get care,see prv 72 H02028 Num 4 260 OFTEN5_. 11. In lst yr:goto emrgncy rm for own care 73 H02029 Num 4 264 OFTEN6_. 11. In lst yr:goto Dr office/clinic for care 74 H02030 Num 4 268 PROB3_. 11. In lst yr:prblm to get care thght ncssry 75 H02031 Num 4 272 PROB3_. 11. In lst yr:prblm w/delays wait for apprv 76 H02032 Num 4 276 OFTEN7_. 11. In lst yr:wait > 15 min past appt see Dr 77 H02033 Num 4 280 OFTEN7_. 11. In lst yr:how oftn treat w/ crtsy/rspct 78 H02034 Num 4 284 OFTEN7_. 11. In lst yr:how oftn staff helpful 79 H02035 Num 4 288 OFTEN7_. 11. In lst yr:how oftn Drs listen to you
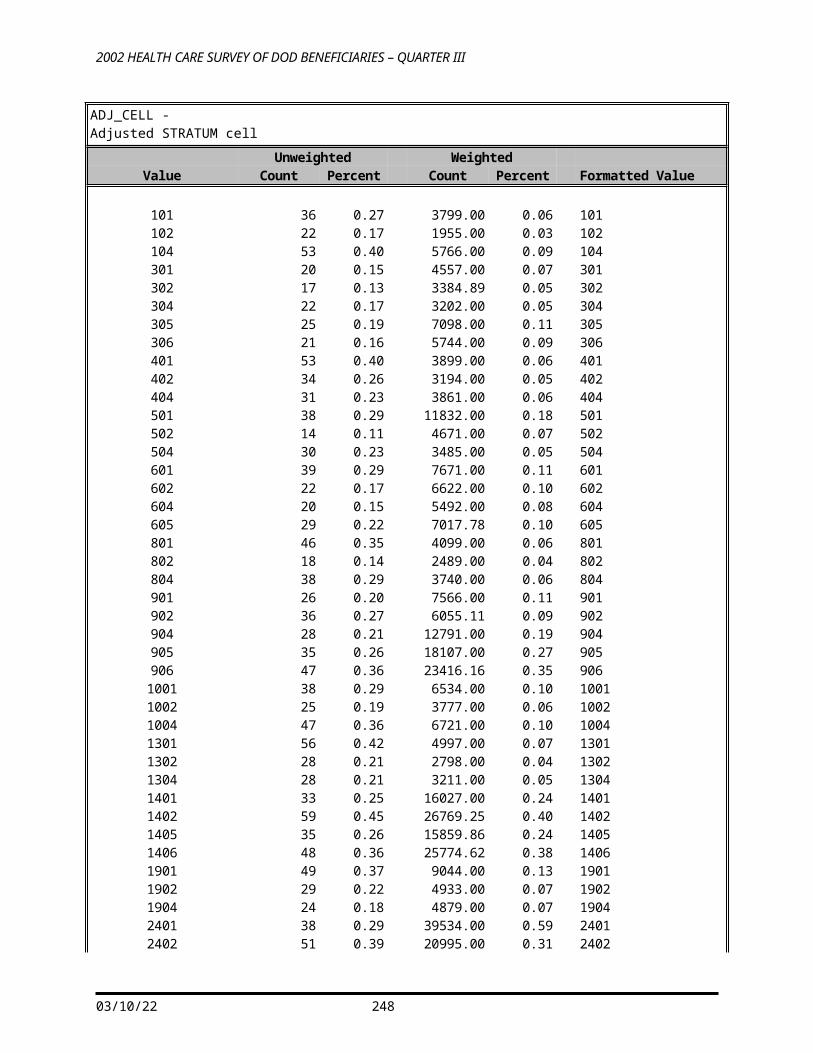
The SAS System 2
The CONTENTS Procedure
-----Alphabetic List of Variables and Attributes----- # Variable Type Len Pos Format Informat Labelƒƒƒƒƒƒƒƒƒƒƒƒƒƒƒƒƒƒƒƒƒƒƒƒƒƒƒƒƒƒƒƒƒƒƒƒƒƒƒƒƒƒƒƒƒƒƒƒƒƒƒƒƒƒƒƒƒƒƒƒƒƒƒƒƒƒƒƒƒƒƒƒƒƒƒƒƒƒƒƒƒƒƒƒƒƒ
80 H02036 Num 4 292 OFTEN7_. 11. In lst yr:how oftn Drs explain things 81 H02037 Num 4 296 OFTEN7_. 11. In lst yr:how oftn Drs show respect 82 H02038 Num 4 300 OFTEN7_. 11. In lst yr:how oftn Drs spend enough time 83 H02039 Num 4 304 RATE3_. 11. Rating of all health care in lst yr 84 H02040 Num 4 308 OFTENPX. 11. H02040 85 H02041 Num 4 312 PLACE. 11. In lst yr:fclty use most for Health care 86 H02042 Num 4 316 REASON1_. 11. H02042 87 H02043 Num 4 320 YNDNK. 11. In lst yr:send in any claims 88 H02044 Num 4 324 OFTEN9_. 11. In lst yr:Hlth pln handle in rsnble time 89 H02045 Num 4 328 OFTEN9_. 11. In lst yr:how oftn handle correctly 90 H02046 Num 4 332 OFTEN9_. 11. In lst yr:before care, know amt to pay 91 H02047 Num 4 336 YNINFOB. 11. In lst yr:info in written materials 92 H02048 Num 4 340 PROB8_. 11. In lst yr:prblm to find/undrstnd mtrls 93 H02049 Num 4 344 YN. 11. In lst yr:health plan's cstmr srvc help 94 H02050 Num 4 348 PROB9_. 11. In lst yr:prblm get help from cstmr srvc 95 H02051 Num 4 352 YN. 11. Call or write plan with complaint/prblm 96 H02052 Num 4 356 TIME4_. 11. How long for Hlth pln to resolve cmplnt 97 H02053 Num 4 360 SETTLED. 11. Complaint/prblm settled to satisfaction 98 H02054 Num 4 364 YN. 11. In lst yr:experiences with paperwork 99 H02055 Num 4 368 PROB10_. 11. In lst yr:prblms with paperwork 100 H02056 Num 4 372 RATE4_. 11. Rating of all experience with hlth plan
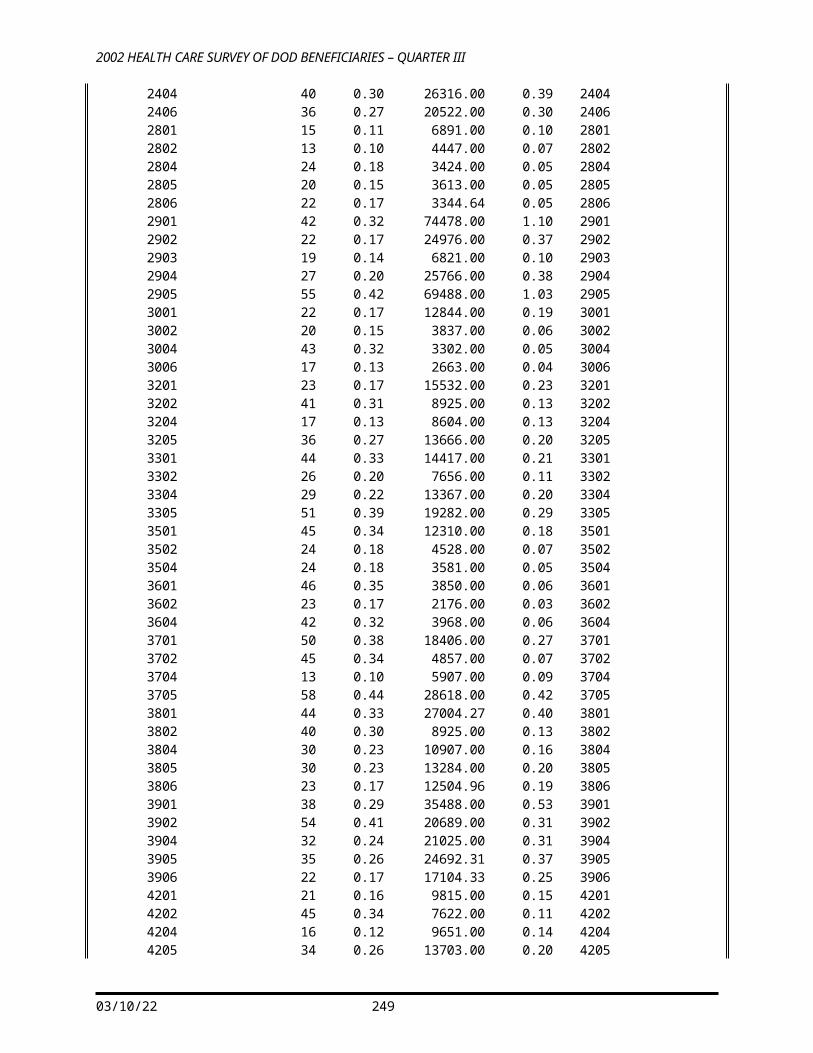
101 H02057 Num 4 376 LIKELY. 11. In nxt yr:lkly to dsnrl in TRICARE Prime102 H02058 Num 4 380 TIME5_. 11. Not sick/prgnt: lst mdcl/physcl exam 103 H02059 Num 4 384 TIME6_. 11. Blood pressure: when lst reading 104 H02060 Num 4 388 YNBP_. 11. Blood pressure: know if too high or not 105 H02061 Num 4 392 TIME7_. 11. When lst have cholesterol screening 106 H02062 Num 4 396 TIME8_. 11. When did you lst have a flu shot 107 H02063 Num 4 400 SMOKE. 11. Smoked at least 100 cigarettes in life 108 H02064 Num 4 404 TIME9_. 11. Smoke everyday, some days or not at all 109 H02065 Num 4 408 TIME10_. 11. How long since you quit smoking 110 H02066 Num 4 412 OFTEN11_. 11. lst yr: # visits advised to quit smoking111 H02067 Num 4 416 SEX. 11. Are you male or female 112 H02068 Num 4 420 TIME11_. 11. lst prostate disease exam or blood test 113 H02069 Num 4 424 TIME12_. 11. lst have a Pap smear test 114 H02070 Num 4 428 YN. 11. Are you under age 40 115 H02071 Num 4 432 TIME13_. 11. lst time: breasts checked mammography 116 H02072 Num 4 436 TIME14_. 11. lst time: breast exam by professional 117 H02073 Num 4 440 YNPREG. 11. Been pregnant in lst yr or pregnant now 118 H02074 Num 4 444 PREG1_. 11. In what trimester is your pregnancy 119 H02075 Num 4 448 PREG2_. 11. Trimester first received prenatal care 120 H02076 Num 4 452 HEALTH. 11. In gnrl, how would you rate ovrall hlth 121 H02077 Num 4 456 HISP. 11. Are you Spanish/Hispanic/Latino 36 H02002A Num 4 116 MARKED. 11. Health plan(s) covered: TRICARE Prime 37 H02002C Num 4 120 MARKED. 11. Health plan(s) covered: TRICARE Ext/Stnd 38 H02002F Num 4 124 MARKED. 11. Health plan(s) covered: MEDICARE 39 H02002G Num 4 128 MARKED. 11. Health plan(s) covered: FEHBP 40 H02002H Num 4 132 MARKED. 11. Health plan(s) covered: Medicaid 41 H02002I Num 4 136 MARKED. 11. Health plan(s) covered: Civilian HMO 42 H02002J Num 4 140 MARKED. 11. Health plan(s) covered: Other civilian 43 H02002K Num 4 144 MARKED. 11. Health plan(s) covered: USFHP 44 H02002L Num 4 148 MARKED. 11. Health plan(s) covered: Not sure 45 H02002M Num 4 152 MARKED. 11. Health plan(s) covered: Veterans 46 H02002N Num 4 156 MARKED. 11. Health plan(s) covered: TRICARE Plus
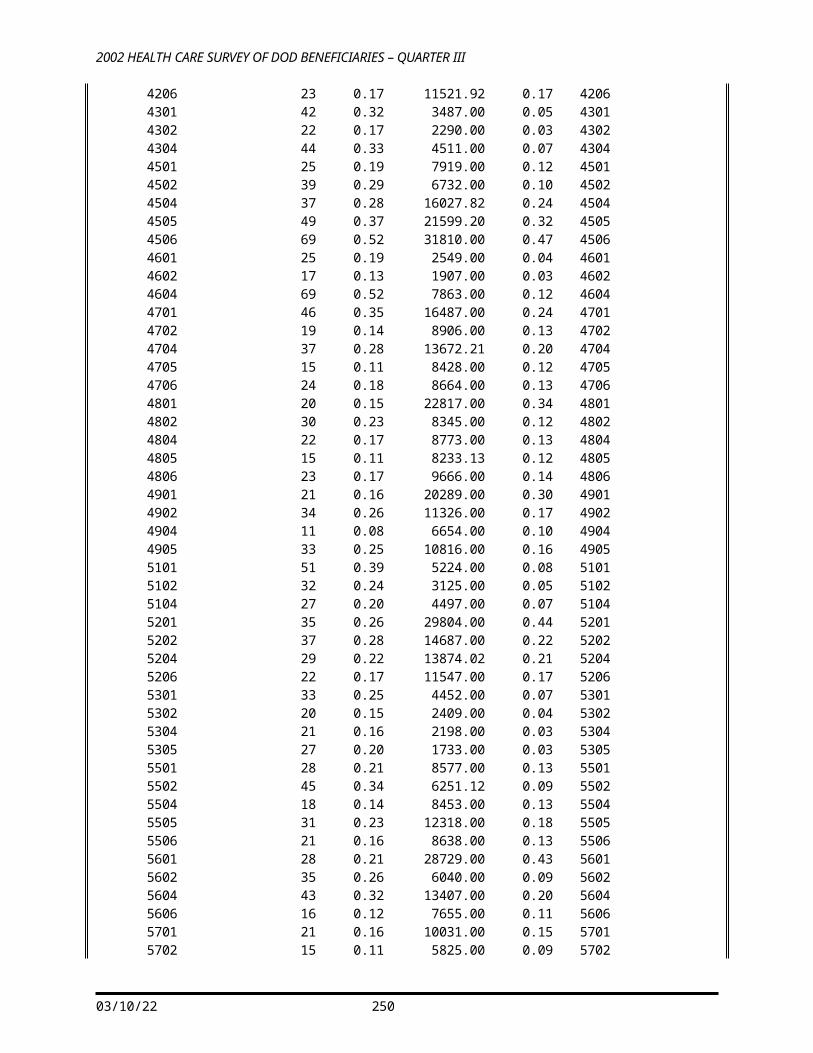
199 HP_BP Num 8 986 HAYNN2_. Bld prsre chck in last 2 yrs,know rslts 203 HP_BRST Num 8 1018 HAYNN. Women >=40, breast exam in last 12 mnths204 HP_CHOL Num 8 1026 HAYNN. Cholesterol screening in last 5 yrs 200 HP_FLU Num 8 994 HAYNN. 65 and older, flu shot in last 12 mnths 202 HP_GP Num 8 1010 HAYNN. General physical exam in last 12 mnths 197 HP_MAM50 Num 8 970 HAYNN. Women 50>=, mammography in pst 2 yrs 196 HP_MAMOG Num 8 962 HAYNN. Women 40>=, mammography in pst 2 yrs 198 HP_PAP Num 8 978 HAYNN. All women, Pap smear in last 3 yrs 195 HP_PRNTL Num 8 954 PRNTL. Prgnt in last yr, receivd cre 1st trimst201 HP_PROS Num 8 1002 HAYNN. Men 50>=, prostrate exam in last 12 mnth205 HP_SMOKE Num 8 1034 HAYNN. Advised to quit smoking in last 12 mnths189 KBGPRB1 Num 8 906 HAYNN. Big problem getting referrals to spclst 190 KBGPRB2 Num 8 914 HAYNN. Big problem getting necessary care 194 KBRSTCR Num 8 946 HAYNN. Women 40>= ever had mammogram & brst exm193 KCIVINS Num 8 938 HAYNN2_. Beneficiary coverd by civilian insurance188 KCIVOFFC Num 8 898 HAYNN. Office wait of 15 min or more-Civ 192 KCIVOPQY Num 8 930 HAGRID. Outpatient visits to Civilian facility 186 KDISENRL Num 8 882 HAYNN. Intention to disenroll 143 KEYCOUNT Num 8 548 # of Key Questions Answered 187 KMILOFFC Num 8 890 HAYNN. Office wait of 15 min or more-Mil 191 KMILOPQY Num 8 922 HAGRID. Outpatient visits to Military facility 24 LEGDDSCD Char 2 86 $DDSFMT. DDS Code 31 MBRRELCD Char 1 102 $MBRREL. Member Relationship Code 32 MEDTYPE Char 1 103 $MEDTYP. Medicare Type
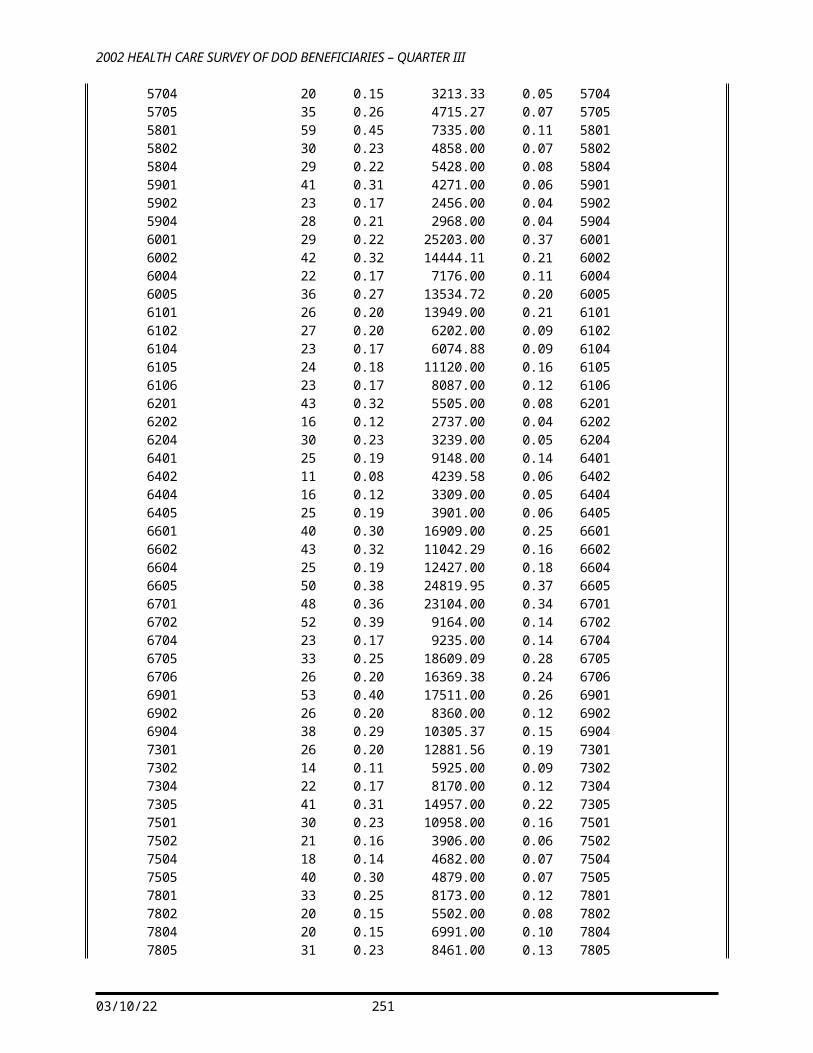
The SAS System 3
The CONTENTS Procedure
-----Alphabetic List of Variables and Attributes----- # Variable Type Len Pos Format Informat Labelƒƒƒƒƒƒƒƒƒƒƒƒƒƒƒƒƒƒƒƒƒƒƒƒƒƒƒƒƒƒƒƒƒƒƒƒƒƒƒƒƒƒƒƒƒƒƒƒƒƒƒƒƒƒƒƒƒƒƒƒƒƒƒƒƒƒƒƒƒƒƒƒƒƒƒƒƒƒƒƒƒƒƒƒƒƒ169 MISS_1 Num 8 756 HAMISS. Count of: Violates Skip Pattern 170 MISS_4 Num 8 764 HAMISS. Count of: Incomplete grid error 171 MISS_5 Num 8 772 HAMISS. Count of: Scalable reponse of Don't know172 MISS_6 Num 8 780 HAMISS. Count of: Not applicable - valid skip 173 MISS_7 Num 8 788 HAMISS. Count of: Out-of-range error 174 MISS_8 Num 8 796 HAMISS. Count of: Multiple response error 175 MISS_9 Num 8 804 HAMISS. Count of: No response - invalid skip 176 MISS_TOT Num 8 812 HAMISS. Total number of missing responses 7 MPCSMPL Num 8 37 MPCSMPL. MPCSMPL - Military Personnel Category 1 MPRID Char 8 0 $8. $42. Unique MPR Identifier 21 MRTLSTAT Char 1 83 $MSTATUS. Marital Status 144 N1 Num 8 556 Coding Scheme Note 1 145 N2 Num 8 564 Coding Scheme Note 2 146 N3 Num 8 572 Coding Scheme Note 3 147 N4 Num 8 580 Coding Scheme Note 4 148 N5 Num 8 588 Coding Scheme Note 5 149 N6 Num 8 596 Coding Scheme Note 6 150 N7 Num 8 604 Coding Scheme Note 7 151 N8 Num 8 612 Coding Scheme Note 8 152 N9 Num 8 620 Coding Scheme Note 9 153 N10 Num 8 628 Coding Scheme Note 10 154 N11 Num 8 636 Coding Scheme Note 11 155 N12 Num 8 644 Coding Scheme Note 12 156 N13 Num 8 652 Coding Scheme Note 13 157 N14 Num 8 660 Coding Scheme Note 14 158 N15 Num 8 668 Coding Scheme Note 15 159 N16 Num 8 676 Coding Scheme Note 16 160 N17 Num 8 684 Coding Scheme Note 17 161 N18 Num 8 692 Coding Scheme Note 18 162 N19 Num 8 700 Coding Scheme Note 19 163 N24 Num 8 708 Coding Scheme Note 24 167 N26 Num 8 740 Coding Scheme Note 26 168 N27 Num 8 748 Coding Scheme Note 27
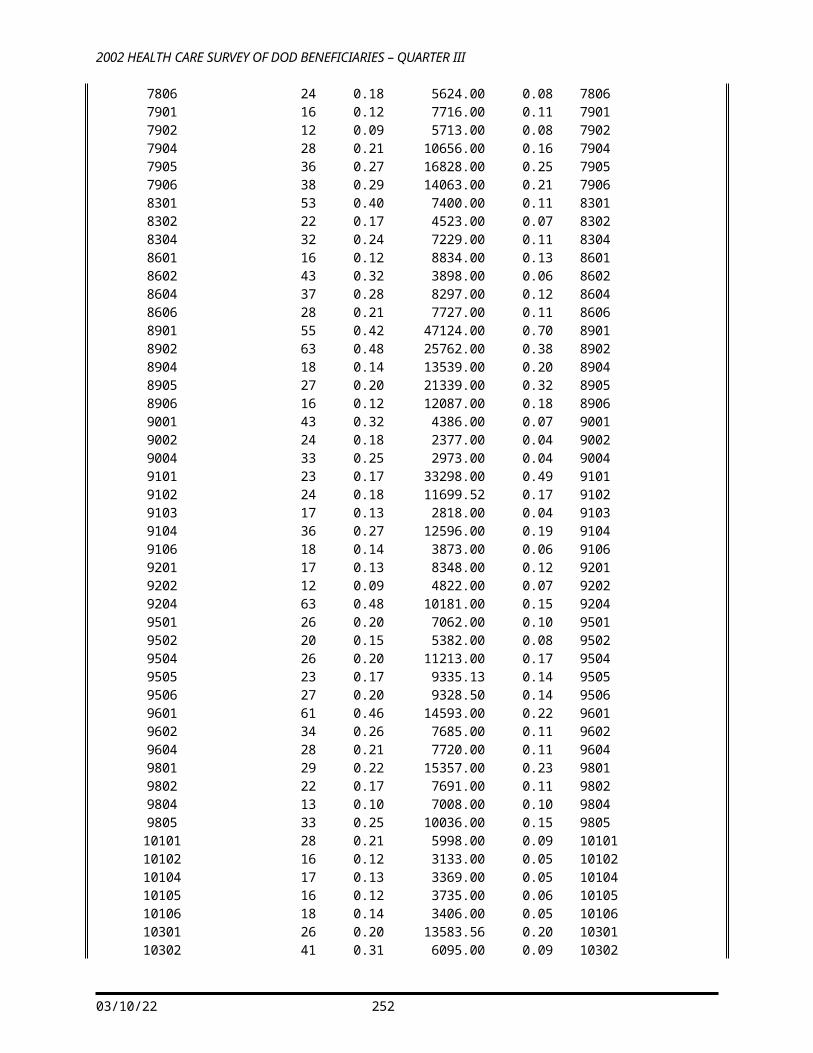
164 N25A Num 8 716 Coding Scheme Note 25A 165 N25B Num 8 724 Coding Scheme Note 25B 166 N25C Num 8 732 Coding Scheme Note 25C 8 NHFF Num 8 45 NHFF - Stratum Sample Size 183 OUTCATCH Num 8 858 OCATCH. Out of catchment area indicator 33 PATCAT Char 7 104 $AGGBCAT. Aggregated Beneficiary Category 27 PCM Char 3 94 $PCM. Primary Manager Code (CIV or MIL) 34 PNLCATCD Char 1 111 $PNLCAT. Personnel Category Code (Duty Status) 23 PNSEXCD Char 1 85 $SEXCD. Person Gender 10 QUARTER Char 7 55 Survey Quarter 22 RACEETHN Char 1 84 $RACECD. Race/Ethnic Code 129 S02D01 Num 4 488 YN. 11. In lst yr: care from dentist office/clin130 S02D02 Num 4 492 TIMED_. 11. In lst yr: go to dentist for self 131 S02D03 Num 4 496 RATED_. 11. Rating of dental care 132 S02M01 Num 4 500 YN. 11. In lst yr: treatment for personal/family133 S02M02 Num 4 504 PROBTC_. 11. Problm get treatment/counsel through hea134 S02M03 Num 4 508 RATE4_. 11. Rating of treatment/counseling 135 S02P01 Num 4 512 YN. 11. In lst yr: new prescription/refill 136 S02P02 Num 4 516 PROBP_. 11. In lst yr: problem get medicine from hea137 S02P03 Num 4 520 OFTENP_. 11. In lst yr: how often get medicine throug138 S02X01 Num 4 524 HEALTH. 11. S02X01 139 S02X02 Num 4 528 RATE4_. 11. S02X02 20 SERVAFF Char 1 82 $SERVAFF. Service Affiliation 9 SERVAREA Char 2 53 $SRVAREA. Service Area 3 SEXSMPL Num 8 16 SEX. SEXSMPL - Sex 128 SRAGE Num 4 484 AGEGRP. 11. What is your age now 122 SREDA Num 4 460 EDUC. 11. Highest grade completed 123 SRRACEA Num 4 464 MARKED. 11. Race: White 124 SRRACEB Num 4 468 MARKED. 11. Race: Black or African American 125 SRRACEC Num 4 472 MARKED. 11. Race: American Indian or Alaska Native 126 SRRACED Num 4 476 MARKED. 11. Race: Asian 127 SRRACEE Num 4 480 MARKED. 11. Race: Native Hawaiian/other Pacific Isl. 4 STRATUM Char 7 24 Sampling STRATUM 2 SVCSMPL Num 8 8 SVCSMPL. SVCSMPL - Branch of Service 268 WRWT Num 8 1537 Final Weight 208 WRWT1 Num 8 1057 Replicated/JackKnife Weight 1 209 WRWT2 Num 8 1065 Replicated/JackKnife Weight 2
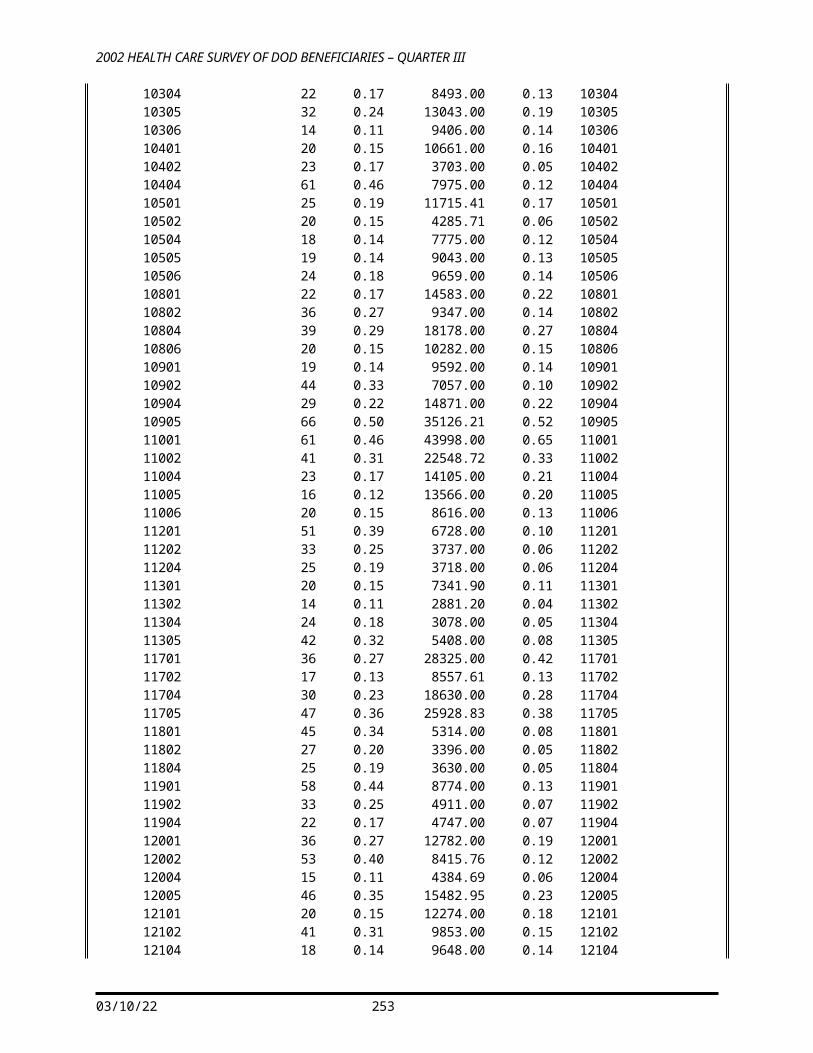
210 WRWT3 Num 8 1073 Replicated/JackKnife Weight 3 211 WRWT4 Num 8 1081 Replicated/JackKnife Weight 4 212 WRWT5 Num 8 1089 Replicated/JackKnife Weight 5 213 WRWT6 Num 8 1097 Replicated/JackKnife Weight 6 214 WRWT7 Num 8 1105 Replicated/JackKnife Weight 7 215 WRWT8 Num 8 1113 Replicated/JackKnife Weight 8 216 WRWT9 Num 8 1121 Replicated/JackKnife Weight 9
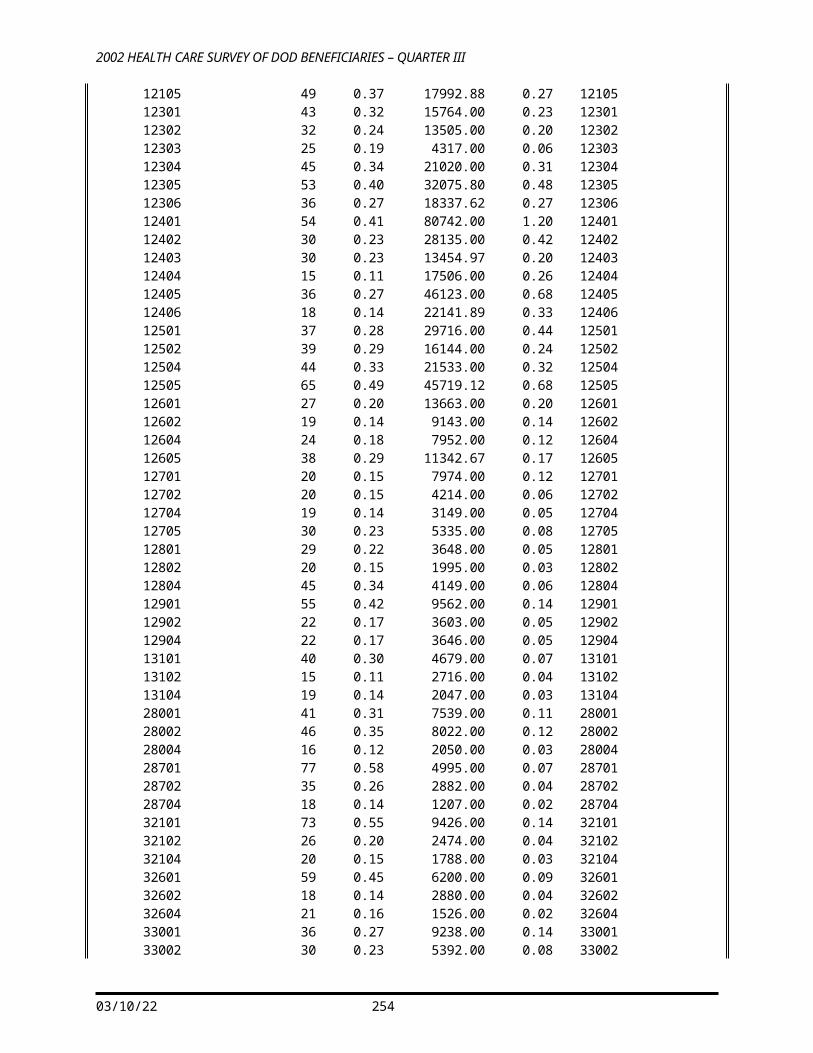
The SAS System 4
The CONTENTS Procedure
-----Alphabetic List of Variables and Attributes----- # Variable Type Len Pos Format Informat Labelƒƒƒƒƒƒƒƒƒƒƒƒƒƒƒƒƒƒƒƒƒƒƒƒƒƒƒƒƒƒƒƒƒƒƒƒƒƒƒƒƒƒƒƒƒƒƒƒƒƒƒƒƒƒƒƒƒƒƒƒƒƒƒƒƒƒƒƒƒƒƒƒƒƒƒƒƒƒƒƒƒƒƒƒƒƒ217 WRWT10 Num 8 1129 Replicated/JackKnife Weight 10 218 WRWT11 Num 8 1137 Replicated/JackKnife Weight 11 219 WRWT12 Num 8 1145 Replicated/JackKnife Weight 12 220 WRWT13 Num 8 1153 Replicated/JackKnife Weight 13 221 WRWT14 Num 8 1161 Replicated/JackKnife Weight 14 222 WRWT15 Num 8 1169 Replicated/JackKnife Weight 15 223 WRWT16 Num 8 1177 Replicated/JackKnife Weight 16 224 WRWT17 Num 8 1185 Replicated/JackKnife Weight 17 225 WRWT18 Num 8 1193 Replicated/JackKnife Weight 18 226 WRWT19 Num 8 1201 Replicated/JackKnife Weight 19 227 WRWT20 Num 8 1209 Replicated/JackKnife Weight 20 228 WRWT21 Num 8 1217 Replicated/JackKnife Weight 21 229 WRWT22 Num 8 1225 Replicated/JackKnife Weight 22 230 WRWT23 Num 8 1233 Replicated/JackKnife Weight 23 231 WRWT24 Num 8 1241 Replicated/JackKnife Weight 24 232 WRWT25 Num 8 1249 Replicated/JackKnife Weight 25 233 WRWT26 Num 8 1257 Replicated/JackKnife Weight 26 234 WRWT27 Num 8 1265 Replicated/JackKnife Weight 27 235 WRWT28 Num 8 1273 Replicated/JackKnife Weight 28 236 WRWT29 Num 8 1281 Replicated/JackKnife Weight 29 237 WRWT30 Num 8 1289 Replicated/JackKnife Weight 30 238 WRWT31 Num 8 1297 Replicated/JackKnife Weight 31 239 WRWT32 Num 8 1305 Replicated/JackKnife Weight 32 240 WRWT33 Num 8 1313 Replicated/JackKnife Weight 33 241 WRWT34 Num 8 1321 Replicated/JackKnife Weight 34 242 WRWT35 Num 8 1329 Replicated/JackKnife Weight 35 243 WRWT36 Num 8 1337 Replicated/JackKnife Weight 36 244 WRWT37 Num 8 1345 Replicated/JackKnife Weight 37 245 WRWT38 Num 8 1353 Replicated/JackKnife Weight 38 246 WRWT39 Num 8 1361 Replicated/JackKnife Weight 39 247 WRWT40 Num 8 1369 Replicated/JackKnife Weight 40 248 WRWT41 Num 8 1377 Replicated/JackKnife Weight 41 249 WRWT42 Num 8 1385 Replicated/JackKnife Weight 42 250 WRWT43 Num 8 1393 Replicated/JackKnife Weight 43
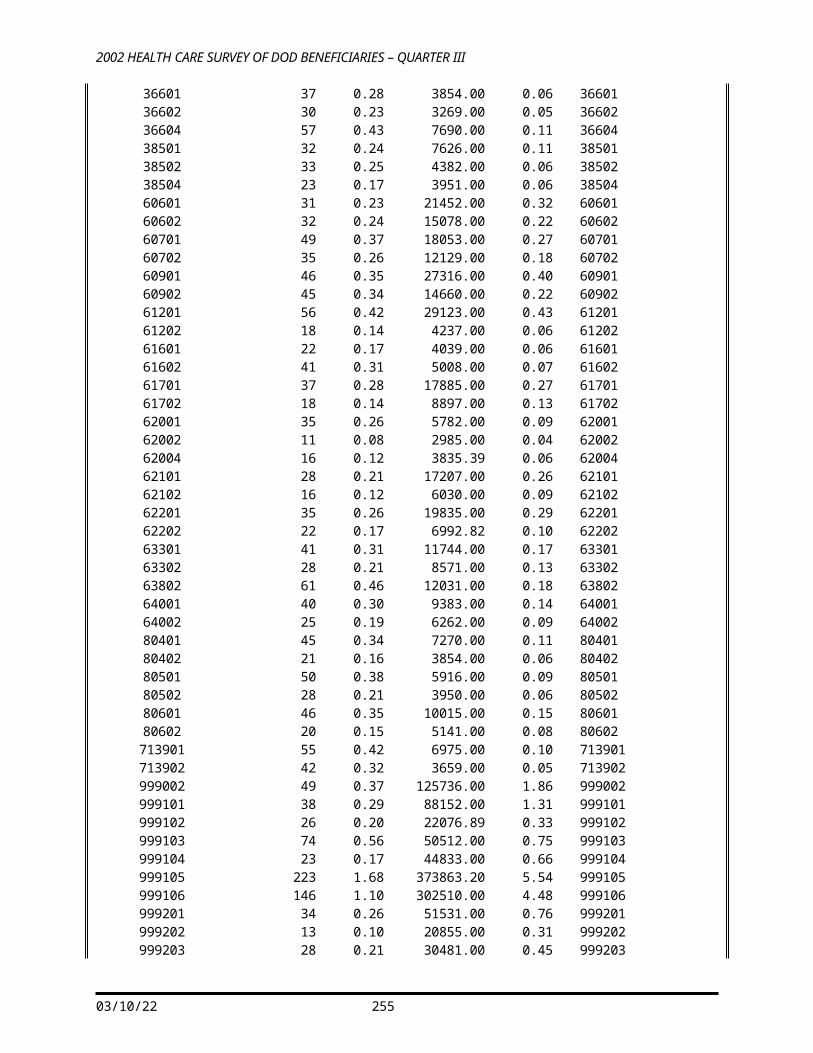
251 WRWT44 Num 8 1401 Replicated/JackKnife Weight 44 252 WRWT45 Num 8 1409 Replicated/JackKnife Weight 45 253 WRWT46 Num 8 1417 Replicated/JackKnife Weight 46 254 WRWT47 Num 8 1425 Replicated/JackKnife Weight 47 255 WRWT48 Num 8 1433 Replicated/JackKnife Weight 48 256 WRWT49 Num 8 1441 Replicated/JackKnife Weight 49 257 WRWT50 Num 8 1449 Replicated/JackKnife Weight 50 258 WRWT51 Num 8 1457 Replicated/JackKnife Weight 51 259 WRWT52 Num 8 1465 Replicated/JackKnife Weight 52 260 WRWT53 Num 8 1473 Replicated/JackKnife Weight 53 261 WRWT54 Num 8 1481 Replicated/JackKnife Weight 54 262 WRWT55 Num 8 1489 Replicated/JackKnife Weight 55 263 WRWT56 Num 8 1497 Replicated/JackKnife Weight 56 264 WRWT57 Num 8 1505 Replicated/JackKnife Weight 57 265 WRWT58 Num 8 1513 Replicated/JackKnife Weight 58 266 WRWT59 Num 8 1521 Replicated/JackKnife Weight 59 267 WRWT60 Num 8 1529 Replicated/JackKnife Weight 60 185 XBNFGRP Num 8 874 XBGC_S. Constructed Beneficiary Group 177 XENRLLMT Num 8 820 ENROLL. Enrollment in TRICARE Prime 178 XENR_PCM Num 8 828 PCM. Enrollment by PCM type 179 XINS_COV Num 8 836 INSURE. Insurance Coverage 180 XQENROLL Num 8 844 PCM. Enrllmnt accordng to questionre rspnse 181 XREGION Num 3 852 CREG. XREGION - Region 184 XSEXA Num 8 866 HASEX. Male or Female - R
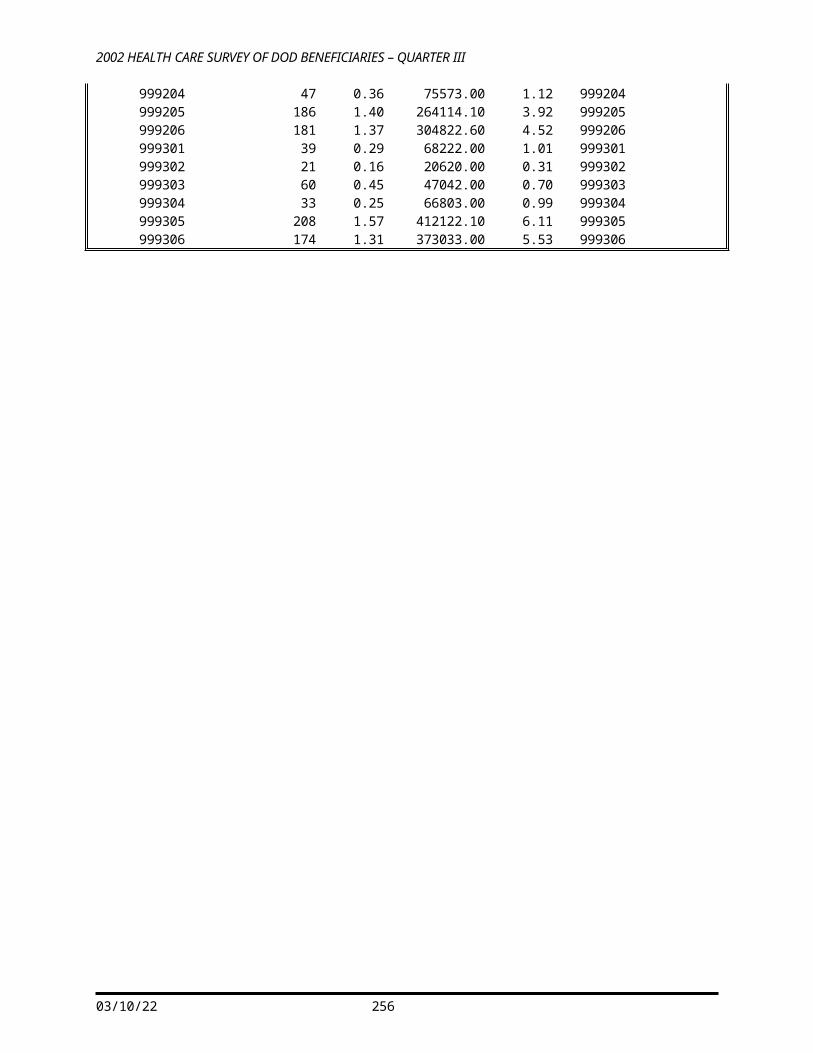
APPENDIX E
SAS PROC CONTENTS – POSITIONAL 2002 ADULT HCSDB – QUARTER III
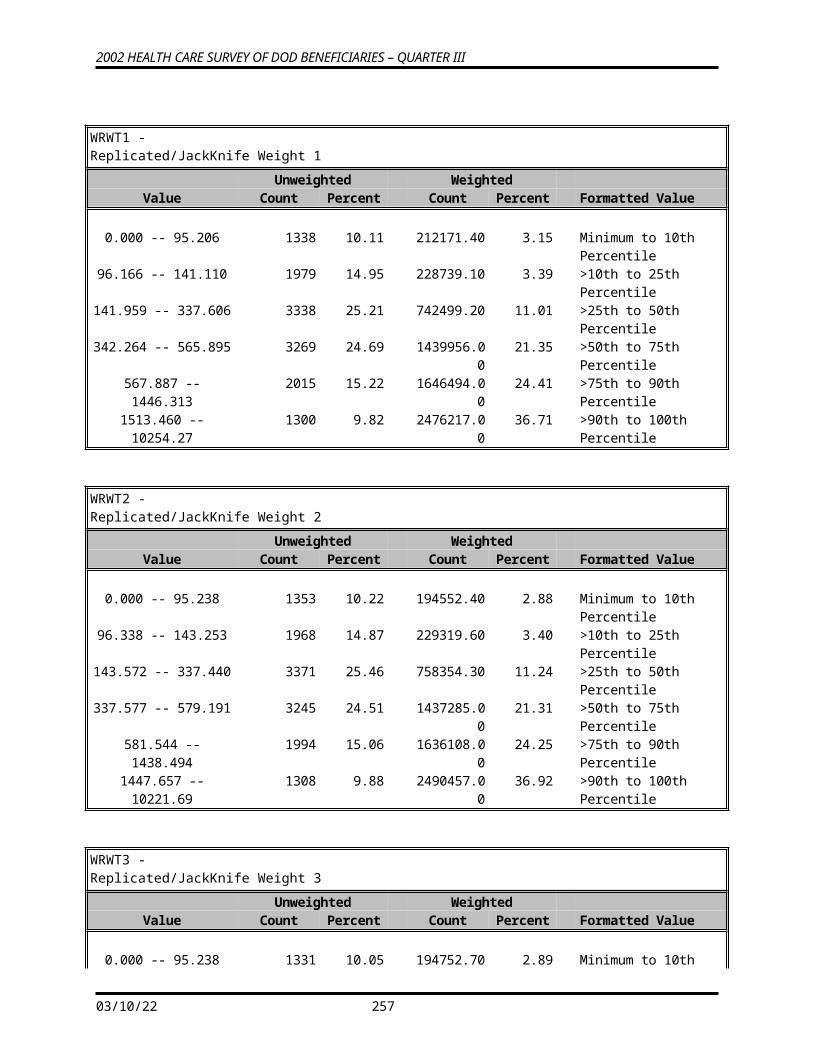
The CONTENTS Procedure
-----Variables Ordered by Position----- # Variable Type Len Pos Format Informat Labelƒƒƒƒƒƒƒƒƒƒƒƒƒƒƒƒƒƒƒƒƒƒƒƒƒƒƒƒƒƒƒƒƒƒƒƒƒƒƒƒƒƒƒƒƒƒƒƒƒƒƒƒƒƒƒƒƒƒƒƒƒƒƒƒƒƒƒƒƒƒƒƒƒƒƒƒƒƒƒƒƒƒƒƒƒƒ 1 MPRID Char 8 0 $8. $42. Unique MPR Identifier 2 SVCSMPL Num 8 8 SVCSMPL. SVCSMPL - Branch of Service 3 SEXSMPL Num 8 16 SEX. SEXSMPL - Sex 4 STRATUM Char 7 24 Sampling STRATUM 5 CACSMPL Char 4 31 $CAC. CACSMPL - Catchment Area 6 ENBGSMPL Char 2 35 $ENBGS. Enrollment by beneficiary category 7 MPCSMPL Num 8 37 MPCSMPL. MPCSMPL - Military Personnel Category 8 NHFF Num 8 45 NHFF - Stratum Sample Size 9 SERVAREA Char 2 53 $SRVAREA. Service Area 10 QUARTER Char 7 55 Survey Quarter 11 DCATCH Char 4 62 Catchment Area 12 DMIS_ID Char 9 66 DMIS ID 13 E1 Char 1 75 Eligibility indicator for period = 1 14 E2 Char 1 76 Eligibility indicator for period = 2 15 E3 Char 1 77 Eligibility indicator for period = 3 16 E4 Char 1 78 Eligibility indicator for period = 4 17 E5 Char 1 79 Eligibility indicator for period = 5 18 E6 Char 1 80 Eligibility indicator for period = 6 19 E7 Char 1 81 Eligibility indicator for period = 7 20 SERVAFF Char 1 82 $SERVAFF. Service Affiliation 21 MRTLSTAT Char 1 83 $MSTATUS. Marital Status 22 RACEETHN Char 1 84 $RACECD. Race/Ethnic Code 23 PNSEXCD Char 1 85 $SEXCD. Person Gender 24 LEGDDSCD Char 2 86 $DDSFMT. DDS Code 25 DAGEQY Char 3 88 Age (As of 28 February 2002) 26 FIELDAGE Char 3 91 Age as of July 1st 2002 27 PCM Char 3 94 $PCM. Primary Manager Code (CIV or MIL) 28 DBENCAT Char 3 97 $BENCAT. Beneficiary Category 29 DMEDELG Char 1 100 $MEDELG. Medical Privlege Code 30 DSPONSVC Char 1 101 $SPONSVC. Derived Sponsor Branch of Service 31 MBRRELCD Char 1 102 $MBRREL. Member Relationship Code 32 MEDTYPE Char 1 103 $MEDTYP. Medicare Type 33 PATCAT Char 7 104 $AGGBCAT. Aggregated Beneficiary Category 34 PNLCATCD Char 1 111 $PNLCAT. Personnel Category Code (Duty Status) 35 H02001 Num 4 112 YN. 11. Are you the person listed on envelope 36 H02002A Num 4 116 MARKED. 11. Health plan(s) covered: TRICARE Prime 37 H02002C Num 4 120 MARKED. 11. Health plan(s) covered: TRICARE Ext/Stnd 38 H02002F Num 4 124 MARKED. 11. Health plan(s) covered: MEDICARE 39 H02002G Num 4 128 MARKED. 11. Health plan(s) covered: FEHBP 40 H02002H Num 4 132 MARKED. 11. Health plan(s) covered: Medicaid
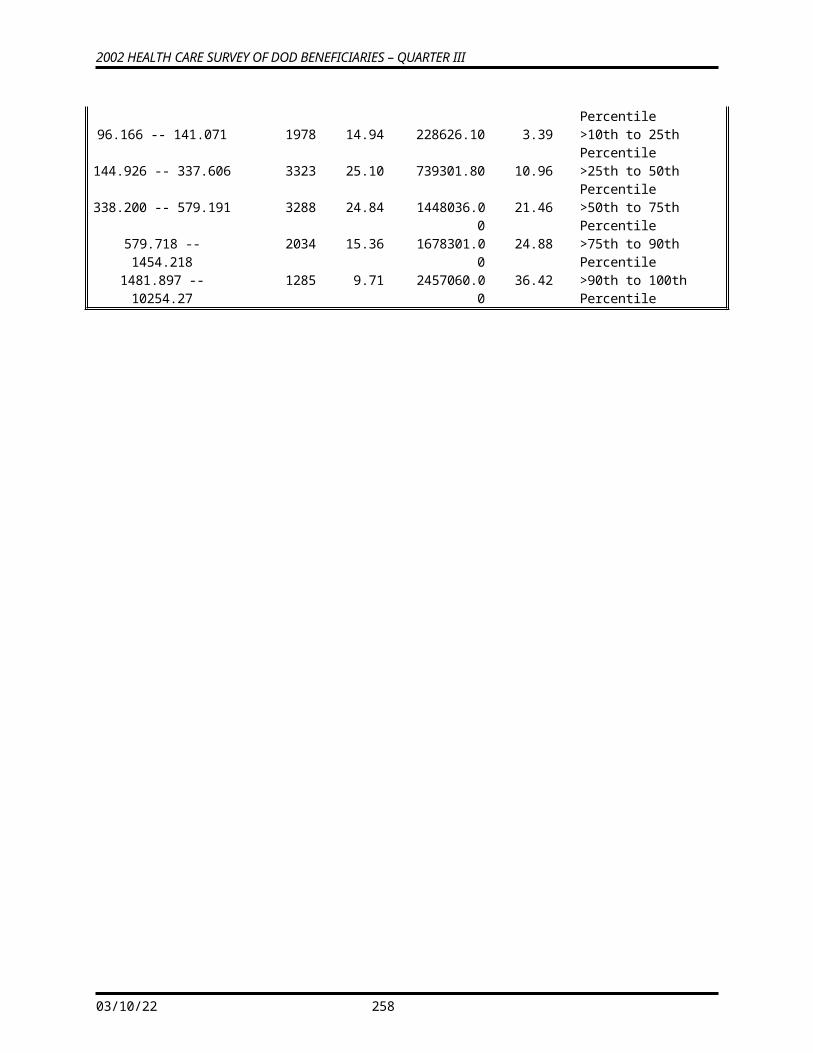
41 H02002I Num 4 136 MARKED. 11. Health plan(s) covered: Civilian HMO 42 H02002J Num 4 140 MARKED. 11. Health plan(s) covered: Other civilian 43 H02002K Num 4 144 MARKED. 11. Health plan(s) covered: USFHP 44 H02002L Num 4 148 MARKED. 11. Health plan(s) covered: Not sure 45 H02002M Num 4 152 MARKED. 11. Health plan(s) covered: Veterans 46 H02002N Num 4 156 MARKED. 11. Health plan(s) covered: TRICARE Plus 47 H02003 Num 4 160 MEDA. 11. Currently Covered Medicare Part A 48 H02004 Num 4 164 MEDB. 11. Currently Covered Medicare Part B 49 H02005 Num 4 168 MEDSUPP. 11. Currently Covered Medicare Supplemental 50 H02006 Num 4 172 HPLAN1C_. 11. Which health plan did you use most 51 H02007 Num 4 176 HPTIME. 11. yrs in a row with health plan 52 H02008 Num 4 180 YN. 11. When joined hlth plan, rcv new prsnl Dr 53 H02009 Num 4 184 PROB1_. 11. Health plan: prblm to get Dr happy with 54 H02010 Num 4 188 YN. 11. Have one person think of as personal Dr 55 H02011 Num 4 192 RATE1_. 11. Rating of your personal Dr or nurse 56 H02012 Num 4 196 YN. 11. Currently enrolled in TRICARE Prime 57 H02013 Num 4 200 PCMBASE. 11. TRICARE member:prmry care mgr mil or cvl 58 H02014 Num 4 204 YN. 11. Know your PCM's name 59 H02015 Num 4 208 YN. 11. In lst yr:you/Dr think you need spclst 60 H02016 Num 4 212 PROB2_. 11. In lst yr:how much prblm rfrl to spclst 61 H02017 Num 4 216 YN. 11. In lst yr:did you see a specialist 62 H02018 Num 4 220 RATE2_. 11. Rating of specialist seen in lst yr 63 H02019 Num 4 224 YNOFT. 11. In lst yr:spclst saw same as persnl Dr 64 H02020 Num 4 228 YN. 11. In lst yr:call Dr for help/advice 65 H02021 Num 4 232 OFTEN2_. 11. In lst yr:when call how often get hlp nd 66 H02022 Num 4 236 YN. 11. In lst yr:make appts for reg hlth care 67 H02023 Num 4 240 OFTEN3_. 11. In lst yr:appt reg hlth care when wnted 68 H02024 Num 4 244 TIME1B_. 11. In lst yr:days btwn appt & see prvder 69 H02025 Num 4 248 YN. 11. In lst yr:illness/injry care right away 70 H02026 Num 4 252 OFTEN4_. 11. In lst yr:get care as soon as wanted 71 H02027 Num 4 256 TIME2_. 11. In lst yr:wait btwn try get care,see prv 72 H02028 Num 4 260 OFTEN5_. 11. In lst yr:goto emrgncy rm for own care 73 H02029 Num 4 264 OFTEN6_. 11. In lst yr:goto Dr office/clinic for care 74 H02030 Num 4 268 PROB3_. 11. In lst yr:prblm to get care thght ncssry 75 H02031 Num 4 272 PROB3_. 11. In lst yr:prblm w/delays wait for apprv 76 H02032 Num 4 276 OFTEN7_. 11. In lst yr:wait > 15 min past appt see Dr 77 H02033 Num 4 280 OFTEN7_. 11. In lst yr:how oftn treat w/ crtsy/rspct
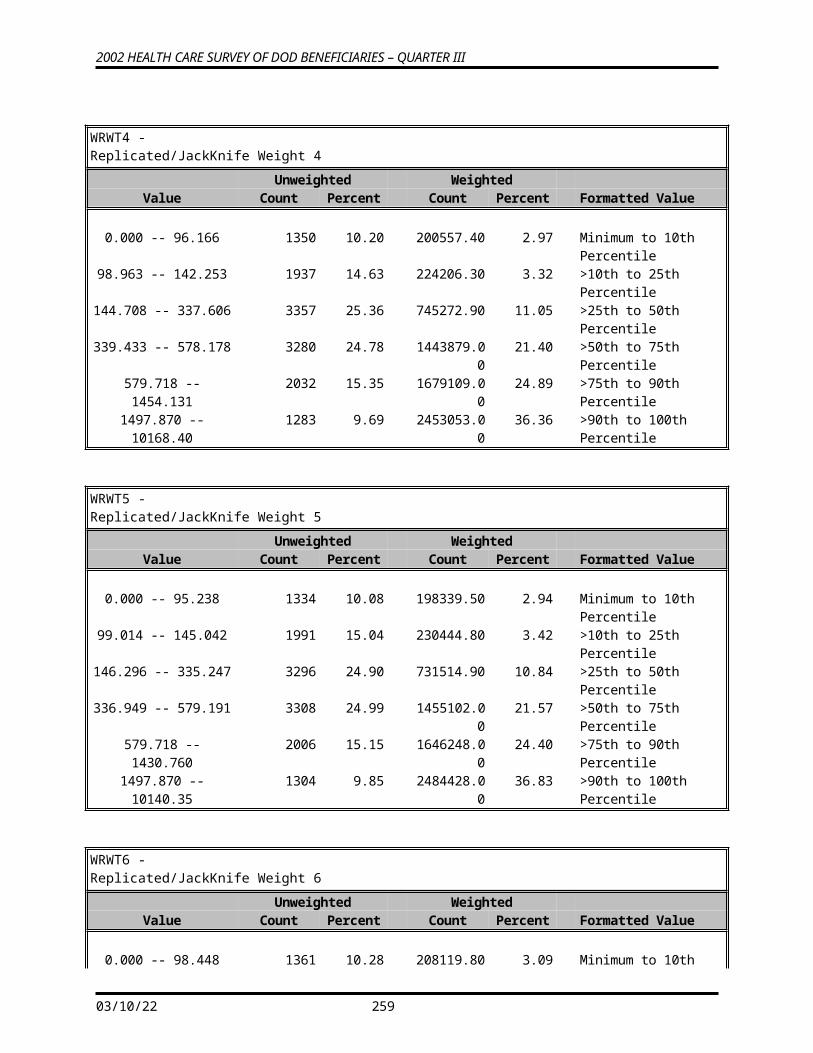
The SAS System 6
The CONTENTS Procedure
-----Variables Ordered by Position----- # Variable Type Len Pos Format Informat Labelƒƒƒƒƒƒƒƒƒƒƒƒƒƒƒƒƒƒƒƒƒƒƒƒƒƒƒƒƒƒƒƒƒƒƒƒƒƒƒƒƒƒƒƒƒƒƒƒƒƒƒƒƒƒƒƒƒƒƒƒƒƒƒƒƒƒƒƒƒƒƒƒƒƒƒƒƒƒƒƒƒƒƒƒƒƒ 78 H02034 Num 4 284 OFTEN7_. 11. In lst yr:how oftn staff helpful 79 H02035 Num 4 288 OFTEN7_. 11. In lst yr:how oftn Drs listen to you 80 H02036 Num 4 292 OFTEN7_. 11. In lst yr:how oftn Drs explain things 81 H02037 Num 4 296 OFTEN7_. 11. In lst yr:how oftn Drs show respect 82 H02038 Num 4 300 OFTEN7_. 11. In lst yr:how oftn Drs spend enough time 83 H02039 Num 4 304 RATE3_. 11. Rating of all health care in lst yr 84 H02040 Num 4 308 OFTENPX. 11. H02040 85 H02041 Num 4 312 PLACE. 11. In lst yr:fclty use most for Health care 86 H02042 Num 4 316 REASON1_. 11. H02042 87 H02043 Num 4 320 YNDNK. 11. In lst yr:send in any claims 88 H02044 Num 4 324 OFTEN9_. 11. In lst yr:Hlth pln handle in rsnble time 89 H02045 Num 4 328 OFTEN9_. 11. In lst yr:how oftn handle correctly 90 H02046 Num 4 332 OFTEN9_. 11. In lst yr:before care, know amt to pay 91 H02047 Num 4 336 YNINFOB. 11. In lst yr:info in written materials 92 H02048 Num 4 340 PROB8_. 11. In lst yr:prblm to find/undrstnd mtrls 93 H02049 Num 4 344 YN. 11. In lst yr:health plan's cstmr srvc help 94 H02050 Num 4 348 PROB9_. 11. In lst yr:prblm get help from cstmr srvc 95 H02051 Num 4 352 YN. 11. Call or write plan with complaint/prblm 96 H02052 Num 4 356 TIME4_. 11. How long for Hlth pln to resolve cmplnt 97 H02053 Num 4 360 SETTLED. 11. Complaint/prblm settled to satisfaction 98 H02054 Num 4 364 YN. 11. In lst yr:experiences with paperwork 99 H02055 Num 4 368 PROB10_. 11. In lst yr:prblms with paperwork 100 H02056 Num 4 372 RATE4_. 11. Rating of all experience with hlth plan 101 H02057 Num 4 376 LIKELY. 11. In nxt yr:lkly to dsnrl in TRICARE Prime102 H02058 Num 4 380 TIME5_. 11. Not sick/prgnt: lst mdcl/physcl exam 103 H02059 Num 4 384 TIME6_. 11. Blood pressure: when lst reading 104 H02060 Num 4 388 YNBP_. 11. Blood pressure: know if too high or not 105 H02061 Num 4 392 TIME7_. 11. When lst have cholesterol screening 106 H02062 Num 4 396 TIME8_. 11. When did you lst have a flu shot 107 H02063 Num 4 400 SMOKE. 11. Smoked at least 100 cigarettes in life 108 H02064 Num 4 404 TIME9_. 11. Smoke everyday, some days or not at all 109 H02065 Num 4 408 TIME10_. 11. How long since you quit smoking 110 H02066 Num 4 412 OFTEN11_. 11. lst yr: # visits advised to quit smoking111 H02067 Num 4 416 SEX. 11. Are you male or female 112 H02068 Num 4 420 TIME11_. 11. lst prostate disease exam or blood test 113 H02069 Num 4 424 TIME12_. 11. lst have a Pap smear test 114 H02070 Num 4 428 YN. 11. Are you under age 40 115 H02071 Num 4 432 TIME13_. 11. lst time: breasts checked mammography

116 H02072 Num 4 436 TIME14_. 11. lst time: breast exam by professional 117 H02073 Num 4 440 YNPREG. 11. Been pregnant in lst yr or pregnant now 118 H02074 Num 4 444 PREG1_. 11. In what trimester is your pregnancy 119 H02075 Num 4 448 PREG2_. 11. Trimester first received prenatal care 120 H02076 Num 4 452 HEALTH. 11. In gnrl, how would you rate ovrall hlth 121 H02077 Num 4 456 HISP. 11. Are you Spanish/Hispanic/Latino 122 SREDA Num 4 460 EDUC. 11. Highest grade completed 123 SRRACEA Num 4 464 MARKED. 11. Race: White 124 SRRACEB Num 4 468 MARKED. 11. Race: Black or African American 125 SRRACEC Num 4 472 MARKED. 11. Race: American Indian or Alaska Native 126 SRRACED Num 4 476 MARKED. 11. Race: Asian 127 SRRACEE Num 4 480 MARKED. 11. Race: Native Hawaiian/other Pacific Isl.128 SRAGE Num 4 484 AGEGRP. 11. What is your age now 129 S02D01 Num 4 488 YN. 11. In lst yr: care from dentist office/clin130 S02D02 Num 4 492 TIMED_. 11. In lst yr: go to dentist for self 131 S02D03 Num 4 496 RATED_. 11. Rating of dental care 132 S02M01 Num 4 500 YN. 11. In lst yr: treatment for personal/family133 S02M02 Num 4 504 PROBTC_. 11. Problm get treatment/counsel through hea134 S02M03 Num 4 508 RATE4_. 11. Rating of treatment/counseling 135 S02P01 Num 4 512 YN. 11. In lst yr: new prescription/refill 136 S02P02 Num 4 516 PROBP_. 11. In lst yr: problem get medicine from hea137 S02P03 Num 4 520 OFTENP_. 11. In lst yr: how often get medicine throug138 S02X01 Num 4 524 HEALTH. 11. S02X01 139 S02X02 Num 4 528 RATE4_. 11. S02X02 140 FLAG_FIN Char 5 532 $FINAL. $5. Final Disposition 141 DUPFLAG Char 3 537 Multiple Response Indicator 142 FNSTATUS Num 8 540 FNSTATS. Final Status 143 KEYCOUNT Num 8 548 # of Key Questions Answered 144 N1 Num 8 556 Coding Scheme Note 1 145 N2 Num 8 564 Coding Scheme Note 2 146 N3 Num 8 572 Coding Scheme Note 3 147 N4 Num 8 580 Coding Scheme Note 4 148 N5 Num 8 588 Coding Scheme Note 5 149 N6 Num 8 596 Coding Scheme Note 6 150 N7 Num 8 604 Coding Scheme Note 7 151 N8 Num 8 612 Coding Scheme Note 8 152 N9 Num 8 620 Coding Scheme Note 9 153 N10 Num 8 628 Coding Scheme Note 10 154 N11 Num 8 636 Coding Scheme Note 11

The SAS System 7
The CONTENTS Procedure
-----Variables Ordered by Position----- # Variable Type Len Pos Format Informat Labelƒƒƒƒƒƒƒƒƒƒƒƒƒƒƒƒƒƒƒƒƒƒƒƒƒƒƒƒƒƒƒƒƒƒƒƒƒƒƒƒƒƒƒƒƒƒƒƒƒƒƒƒƒƒƒƒƒƒƒƒƒƒƒƒƒƒƒƒƒƒƒƒƒƒƒƒƒƒƒƒƒƒƒƒƒƒ155 N12 Num 8 644 Coding Scheme Note 12 156 N13 Num 8 652 Coding Scheme Note 13 157 N14 Num 8 660 Coding Scheme Note 14 158 N15 Num 8 668 Coding Scheme Note 15 159 N16 Num 8 676 Coding Scheme Note 16 160 N17 Num 8 684 Coding Scheme Note 17 161 N18 Num 8 692 Coding Scheme Note 18 162 N19 Num 8 700 Coding Scheme Note 19 163 N24 Num 8 708 Coding Scheme Note 24 164 N25A Num 8 716 Coding Scheme Note 25A 165 N25B Num 8 724 Coding Scheme Note 25B 166 N25C Num 8 732 Coding Scheme Note 25C 167 N26 Num 8 740 Coding Scheme Note 26 168 N27 Num 8 748 Coding Scheme Note 27 169 MISS_1 Num 8 756 HAMISS. Count of: Violates Skip Pattern 170 MISS_4 Num 8 764 HAMISS. Count of: Incomplete grid error 171 MISS_5 Num 8 772 HAMISS. Count of: Scalable reponse of Don't know172 MISS_6 Num 8 780 HAMISS. Count of: Not applicable - valid skip 173 MISS_7 Num 8 788 HAMISS. Count of: Out-of-range error 174 MISS_8 Num 8 796 HAMISS. Count of: Multiple response error 175 MISS_9 Num 8 804 HAMISS. Count of: No response - invalid skip 176 MISS_TOT Num 8 812 HAMISS. Total number of missing responses 177 XENRLLMT Num 8 820 ENROLL. Enrollment in TRICARE Prime 178 XENR_PCM Num 8 828 PCM. Enrollment by PCM type 179 XINS_COV Num 8 836 INSURE. Insurance Coverage 180 XQENROLL Num 8 844 PCM. Enrllmnt accordng to questionre rspnse 181 XREGION Num 3 852 CREG. XREGION - Region 182 CONUS Num 3 855 CONUSMHS. CONUS - CONUS/OCONUS Indicator 183 OUTCATCH Num 8 858 OCATCH. Out of catchment area indicator 184 XSEXA Num 8 866 HASEX. Male or Female - R 185 XBNFGRP Num 8 874 XBGC_S. Constructed Beneficiary Group 186 KDISENRL Num 8 882 HAYNN. Intention to disenroll 187 KMILOFFC Num 8 890 HAYNN. Office wait of 15 min or more-Mil 188 KCIVOFFC Num 8 898 HAYNN. Office wait of 15 min or more-Civ 189 KBGPRB1 Num 8 906 HAYNN. Big problem getting referrals to spclst 190 KBGPRB2 Num 8 914 HAYNN. Big problem getting necessary care 191 KMILOPQY Num 8 922 HAGRID. Outpatient visits to Military facility 192 KCIVOPQY Num 8 930 HAGRID. Outpatient visits to Civilian facility

193 KCIVINS Num 8 938 HAYNN2_. Beneficiary coverd by civilian insurance194 KBRSTCR Num 8 946 HAYNN. Women 40>= ever had mammogram & brst exm195 HP_PRNTL Num 8 954 PRNTL. Prgnt in last yr, receivd cre 1st trimst196 HP_MAMOG Num 8 962 HAYNN. Women 40>=, mammography in pst 2 yrs 197 HP_MAM50 Num 8 970 HAYNN. Women 50>=, mammography in pst 2 yrs 198 HP_PAP Num 8 978 HAYNN. All women, Pap smear in last 3 yrs 199 HP_BP Num 8 986 HAYNN2_. Bld prsre chck in last 2 yrs,know rslts 200 HP_FLU Num 8 994 HAYNN. 65 and older, flu shot in last 12 mnths 201 HP_PROS Num 8 1002 HAYNN. Men 50>=, prostrate exam in last 12 mnth202 HP_GP Num 8 1010 HAYNN. General physical exam in last 12 mnths 203 HP_BRST Num 8 1018 HAYNN. Women >=40, breast exam in last 12 mnths204 HP_CHOL Num 8 1026 HAYNN. Cholesterol screening in last 5 yrs 205 HP_SMOKE Num 8 1034 HAYNN. Advised to quit smoking in last 12 mnths206 BWT Num 8 1042 BWT - Basic Sampling Weight 207 ADJ_CELL Char 7 1050 ADJ_CELL - Adjusted STRATUM cell 208 WRWT1 Num 8 1057 Replicated/JackKnife Weight 1 209 WRWT2 Num 8 1065 Replicated/JackKnife Weight 2 210 WRWT3 Num 8 1073 Replicated/JackKnife Weight 3 211 WRWT4 Num 8 1081 Replicated/JackKnife Weight 4 212 WRWT5 Num 8 1089 Replicated/JackKnife Weight 5 213 WRWT6 Num 8 1097 Replicated/JackKnife Weight 6 214 WRWT7 Num 8 1105 Replicated/JackKnife Weight 7 215 WRWT8 Num 8 1113 Replicated/JackKnife Weight 8 216 WRWT9 Num 8 1121 Replicated/JackKnife Weight 9 217 WRWT10 Num 8 1129 Replicated/JackKnife Weight 10 218 WRWT11 Num 8 1137 Replicated/JackKnife Weight 11 219 WRWT12 Num 8 1145 Replicated/JackKnife Weight 12 220 WRWT13 Num 8 1153 Replicated/JackKnife Weight 13 221 WRWT14 Num 8 1161 Replicated/JackKnife Weight 14 222 WRWT15 Num 8 1169 Replicated/JackKnife Weight 15 223 WRWT16 Num 8 1177 Replicated/JackKnife Weight 16 224 WRWT17 Num 8 1185 Replicated/JackKnife Weight 17 225 WRWT18 Num 8 1193 Replicated/JackKnife Weight 18 226 WRWT19 Num 8 1201 Replicated/JackKnife Weight 19 227 WRWT20 Num 8 1209 Replicated/JackKnife Weight 20 228 WRWT21 Num 8 1217 Replicated/JackKnife Weight 21 229 WRWT22 Num 8 1225 Replicated/JackKnife Weight 22 230 WRWT23 Num 8 1233 Replicated/JackKnife Weight 23 231 WRWT24 Num 8 1241 Replicated/JackKnife Weight 24

The SAS System 8
The CONTENTS Procedure
-----Variables Ordered by Position----- # Variable Type Len Pos Format Informat Labelƒƒƒƒƒƒƒƒƒƒƒƒƒƒƒƒƒƒƒƒƒƒƒƒƒƒƒƒƒƒƒƒƒƒƒƒƒƒƒƒƒƒƒƒƒƒƒƒƒƒƒƒƒƒƒƒƒƒƒƒƒƒƒƒƒƒƒƒƒƒƒƒƒƒƒƒƒƒƒƒƒƒƒƒƒƒ232 WRWT25 Num 8 1249 Replicated/JackKnife Weight 25 233 WRWT26 Num 8 1257 Replicated/JackKnife Weight 26 234 WRWT27 Num 8 1265 Replicated/JackKnife Weight 27 235 WRWT28 Num 8 1273 Replicated/JackKnife Weight 28 236 WRWT29 Num 8 1281 Replicated/JackKnife Weight 29 237 WRWT30 Num 8 1289 Replicated/JackKnife Weight 30 238 WRWT31 Num 8 1297 Replicated/JackKnife Weight 31 239 WRWT32 Num 8 1305 Replicated/JackKnife Weight 32 240 WRWT33 Num 8 1313 Replicated/JackKnife Weight 33 241 WRWT34 Num 8 1321 Replicated/JackKnife Weight 34 242 WRWT35 Num 8 1329 Replicated/JackKnife Weight 35 243 WRWT36 Num 8 1337 Replicated/JackKnife Weight 36 244 WRWT37 Num 8 1345 Replicated/JackKnife Weight 37 245 WRWT38 Num 8 1353 Replicated/JackKnife Weight 38 246 WRWT39 Num 8 1361 Replicated/JackKnife Weight 39 247 WRWT40 Num 8 1369 Replicated/JackKnife Weight 40 248 WRWT41 Num 8 1377 Replicated/JackKnife Weight 41 249 WRWT42 Num 8 1385 Replicated/JackKnife Weight 42 250 WRWT43 Num 8 1393 Replicated/JackKnife Weight 43 251 WRWT44 Num 8 1401 Replicated/JackKnife Weight 44 252 WRWT45 Num 8 1409 Replicated/JackKnife Weight 45 253 WRWT46 Num 8 1417 Replicated/JackKnife Weight 46 254 WRWT47 Num 8 1425 Replicated/JackKnife Weight 47 255 WRWT48 Num 8 1433 Replicated/JackKnife Weight 48 256 WRWT49 Num 8 1441 Replicated/JackKnife Weight 49 257 WRWT50 Num 8 1449 Replicated/JackKnife Weight 50 258 WRWT51 Num 8 1457 Replicated/JackKnife Weight 51 259 WRWT52 Num 8 1465 Replicated/JackKnife Weight 52 260 WRWT53 Num 8 1473 Replicated/JackKnife Weight 53 261 WRWT54 Num 8 1481 Replicated/JackKnife Weight 54 262 WRWT55 Num 8 1489 Replicated/JackKnife Weight 55 263 WRWT56 Num 8 1497 Replicated/JackKnife Weight 56 264 WRWT57 Num 8 1505 Replicated/JackKnife Weight 57 265 WRWT58 Num 8 1513 Replicated/JackKnife Weight 58 266 WRWT59 Num 8 1521 Replicated/JackKnife Weight 59 267 WRWT60 Num 8 1529 Replicated/JackKnife Weight 60 268 WRWT Num 8 1537 Final Weight