Embed Size (px)
Citation preview


Contract No W 7405 eng 26
THE HRE SIMULATOR
An Analog Computer for Solving the Kinetic
Equations of a Homogeneous Reactor
D M Collier L A Meeks J P Palmer
DATE ISSUED
SEP 131954
OAK RIDGE NATIONAL LABORATORY
Operated by
CARBIDE AND CARBON CHEMICALS COMPANY
A Division of Union Carbide and Carbon Corporation
Post Office Box P
Oak Ridge Tennessee
ORNL-1572
Copy No^_
4l*5b 034-J504

\

1
2
Si3f5
11
12
13
14
15
16
17
18
19
20
21
22
23
24
25
26
ORNL 1572
Instrumentation
INTERNAL DISTRIBUTION
C E Center
Biology LibraryHealth Physics LibraryCentral Research LibraryReactor ExperimentalEngineering LibraryLaboratory Records DepartmentLaboratory Records ORNL R CC E Larson
L B Emlet (K 25)
J P Murray (Y 12)A M WeinbergE H TaylorE D ShipleyC S Harnll
F C VonderLageC P Keim
J H Frye JrR S Livingston
W H Jordan
J A Swartout
S C Lind
27 F L Culler
28 A H Snell
29 A Ho 1laende r
30 M T Kelley31 G H Clewett
32 K Z Morgan33 T A Lincoln
34 A S Householder
35 C E Winters
36 D W Cardwe11
37 J A Lane
38 E M King
39 W J Ladniak
40 D D Cowen
41 M J Skinner
42 S J Cromer
43 c J Borkowski
44 p M Reyling
45 G C Williams
46 E P Epler47 58 D M Collier
59 70 L A Meeks
EXTERNAL DISTRIBUTION
71 J P Palmer Brookhaven National Laboratory72 73 Curtis Wright Corporation Wright Aeronautical Division
74 Division of Research and Medicine AEC ORO75 314 Given distribution as shown in TID 4500 under Instrumentation category
DISTRIBUTION PAGE TO BE REMOVED IF REPORT IS GIVEN PUBLIC DISTRIBUTION
l ll


THE REACTOR EQUATIONS
SOLVING THE EQUATIONS
HRE PROBLEMS INVESTIGATED
MODIFYING THE REACTOR EQUATIONS
BASIC NETWORKS
Steam Temperature AnalogyReactor Temperature AnalogyReactor Power Analogy
Summary of Coefficient Values
THE D C AMPLIFIER
THE MULTIPLIER
CONTENTS
Chapter 1INTRODUCTION
Chapter 2THE SIMULATOR
Chapter 3
COMPUTER RESULTS
CALIBRATION
SOLUTIONS FOR SEVERAL HRE PROBLEMS
Dynamic Response to a Positive Step Change inExcess Reactivity Coefficient
Ratio of Peak Power to Initial Power as a Function
of Excess ReactivityDynamic Response to Sudden Decrease in Power DemandRatio of Peak Power to Initial Power as a Function
of Steam Temperature Drop
SUMMARY OF EXPERIMENTAL RESULTS
APPENDIX
5
5
8
9
11
13
15
21
23
23
27
27
30
31
34


ABSTRACT
The kinetic equations which express reactor power and temperature as functionsof time have been derived and coefficients appropriate to the HomogeneousReactor Experiment have been evaluated These equations are a system of eightsimultaneous differential equations one of which is nonlinear Since theequations are not readily solvable by any of the usual analytical methods anelectronic analog computer has been developed to solve them for various conditions of operation Because the computer is to be used for the training ofoperating personnel as well as for experimental purposes it has been necessary to design the device without expansion of the time scale The computerthus follows in the same time periods excursions which are analogous to thoseencountered in the operation of the reactor
The essential components of the computer include a stable high gain d camplifier and an electronic multiplier For reliable drift free operationa differential system is used The amplifier has a maximum output of ±10 maat ±100 volts a differential drift of less than 1 mv referred to the inputand a gain of over 20 000 In the electronic multiplier one variable cancover the range from 1 to 100 volts while the other variable has a usablerange of 5 to 75 volts Both variables can change at any rate up to 100 cpswithout causing more than a 2% error in the product The multiplier outputis linear to within S7 over the range from 0 06 to 20 volts
Several conditions of operation for the HRE were investigated The primaryconcern is whether the nuclear systemis stable for various normal perturbationsand for some unusual ones In every case investigated the reactor proved tobe quite stable
VII

THE HRE SIMULATOR
An Analog Computer for Solving the Kinetic Equations of a Homogeneous Reactor
Chapter 1
INTRODUCTION
A reactor should in addition toperforming the function for which it (1)is designed provide adequate protection against the radiation hazardsof operation The principal dangerassociated with an operating reactoris that an excessively high neutronpower may develop High power maycause high pressures and overheatingof reactor parts with consequentdamage to the reactor and possiblywith danger to personnel in thevicinity
THE REACTOR EQUATIONS
The kinetic equations which describethe gross variations in reactor power (4)and temperature as functions of timehave been derived for the general wherepower reactor (cf for examplerefs 1 2 and 3) In the generalcase the effect of temperature uponthe reactor must be considered
Temperature changes in a reactoraffect its reactivity in two principalways namely as density effects andas nuclear effects In any event the =ieffect of temperature upon reactivityis so complex that no one generalization for all reactors is worthwhile
In the case of the HomogeneousReactor Experiment (HRE) the temperature coefficient of reactivity resultsprimarily from the effects of temperature upon density of the fuel so thekinetic equations are expected to be
(2)
(3)
dP
dtL f*
-a(er -e ) p I-+ I rU
dK J3_\ K + — P
. « Tdt
i = l 2 345
dd
b = P - a{8 - 6 )dt
dd
dta{6 - 6 ) - Pn
r s 0
I P.
reactor power level (megawatts) as a function of timetime (sec)
excess reactivity coefficient
total delayed neutron fraction = 0 00762
temperature coefficient ofreactivity = 0 00081/°Cmean reactor temperature
( C) as a function of timeinitial mean reactor temperature nominally 232 5°Cmean temperature of the steam( C) as a function of time
mean neutron lifetime = 10 4sec
power contribution (megawatts) from delayed neutronsof the ith kind as a func
tion of time
decay constant (sec ) fordelayed neutrons of the ithkind
H S d k d E C C mpb 11 El t yP I Th ory W ley New Y rk 1950 ( 1 AECD2201)
<2>H Hn n w t
the P 1 K et(J ly 1949)
(3)'S Gl
f N cl R19^2
D r
Eq td I t g t f
Nucl cs 5 61 67
nd M C Edl d Th ElTh y V n N t nd New Y
K =

y = reduction factor for power The steam turbine is not likely to befrom delayed neutrons of the a source of disturbance since itith kind accounting for the follows the characteristic Willan sfact that some delayed neu law rather closely Finally the steamtrons arise while the fuel is lines have a 4 sec holdup tank whichcirculated outside the will act as a cushion between thereactor and are lost to the nuclear and the external systemsreaction This cushion will allow only relatively
6 = reactor heat capacity= 0 175 slow changes in PQ to be reflectedmegawatt sec/°C back into the nuclear system Further
a = heat exchanger conversion equations should not therefore befactor = 0 025 megawatt/°C required for these investigations
g = heat capacity of the heat Should greater generality and moreexchanger (megawatt sec/°C) precise analysis be desirable the
PQ = power demanded from the boiler variations of PQ with time would have(megawatts) to be derived and additional equations
These equations treat only average would have to be incorporated in thequantities with no positional de system of simultaneous differentialpendence They have in some respects equations given in Eqs 1 through 4been linearized and simplified tof.,,1,..., „„!„,., „ SOLVING THE EQUATIONSiacilitate solution
No justification is given here for In the design of new reactor con -the equations themselves although it figurations or of the control systemis believed that they do describe for a new reactor solutions of therather adequately the response of the kinetic equations for different valuesHRE system to some perturbations of the parameters and for variousNevertheless the effects of bubble initial conditions can be of inestiformation circulation delays and mable value The solutions showturbulent fluid flow have been totally whether the design is satisfactoryneglected Thus it is important and wnetner the controls are adequateto emphasize that the HRE can be under various conditions of operationexpected to perform in the manner Unfortunately Eqs 1 through 4 do notindicated in this report only if the submit readily to mathematical solu-equations and the coefficient values lution They can be solved to almostpresented above are truly those which anY desired degree of accuracy bydescribe the physical situation utilizing methods of numerical analy
t.. i i i sis } It is however a very tediousIt is also pertinent that the system , , 7 "r t i task to investigate the solutions forof equations terminates at the steam „ 6 . ,
i,*,„«. iu .-.. - u l i a given set ol initial conditions andlines No attempt has been made to - ,,.„i„j0 ,.i „£.£•„„,-„ r .i ,. ±or the complete range of even oneinclude the eliects oi the generator
t .r _ , , , . parameteror oi the generator load other thanin the simple term P„ the power Since numerous questionable condidemanded from the heat exchanger To tl0nS °f opera tion ha ve arisen inbe completely general additional ^onnectlon wlth the HRE it has beenequations must be included for the deemed advlsable t0 deslSn and to concomplete steam system as well as for StrUCt an electronlc analog computerthe generator and for the generator °r reactor simulator to effect theload It is conceivable that P0 might desired solutions The resultsfollow time dependent gyrations that achleved Wlth an anal°g computerwould cause the reactor to be unstable though somewhat less accurate can beor unsafe but such is not expected to acqulred m°re quickly and effortlesslybe the case The generator will tie than the corresponding numericalinto the TVA distribution system so (171 ~ ~,,, , . WCSng K t c i i t o fload changes need not be extreme H u g r t ORNL 1205 Up l 1 1952)

solutions Furthermore the simulator
has been designed to operate in realtime that is any solution by thesimulator shows the same excursion of
power in the sane period of tine whicha similar excursion by the reactorrequires Thus the simulator willhave additional usefulness as an aid
in training reactor operators andtechnicians
As an example of the usefulnessof the solutions suppose there comesto mind some contingency which leadssay to an unusual set of initialconditions Appropriate solutions tothe equations can be obtained quicklywith the aid of the simulator If
the simulator shows that these initial
values cause only small and relativelyslow excursions of power and of temperature for all values of the parametersthen this contingency is no longer acause for worry On the other handif the simulator shows that for saya certain limited range of excessreactivity (8) and at a certain levelof power extraction (PQ) these initialconditions cause alarming excursionsof power then either supplementarycontrols or additional operating precautions must be instituted Further
more the ranges of S and of PQ forwhich this particular set of initialconditions significantly affects thesolutions are revealed by the simulator If greater accuracy is required numerical methods may beapplied in the neighborhood of theseranges instead of to the whole scopeof all parameters
HRE PROBLEMS INVESTIGATED
Several types of problems are beinginvestigated for the HRE The primaryconcern is whether the nuclear systemis stable " that is whether it will
stay within reasonable limits ofneutron power for any perturbationwhich might arise during operationThe system parameters are1 the power demand (PQ in Eq 4)
corresponding to the power extracted from the heat exchangerby the load
2 the excess reactivity coefficient(S in Eq 1) corresponding to achange in the position of the control rods
3 the heat capacity of the heatexchanger (g in Eq 4) corresponding to a very large or a verysmall boiler
4 the initial conditions
The power demand and the excessreactivity coefficient will be discussed first Because of inertia the
control rods cannot be moved instan
taneously Similarly because of theholdup tank in the steam lines thepower demand cannot change instantaneously Nonetheless the mostviolent response of the nuclear systemoccurs when step changes either ofexcess reactivity or of power demandare introduced For this reason stepchanges of both parameters are usedto show the limiting cases of extremeresponse to be expected Other morerealistic time dependent changes in5 or in PQ may be inserted to answerquestions of a more academic interestbut in studying the stability of thenuclear system in the sense in which
stable" has been defined the stepfunction holds primary interest
One specific problem consideredhere is the power and temperatureresponse of the reactor to variousstep changes in 8 for various valuesof PQ and of g The physical analogyof this problem is that of equilibriumoperation at a certain level of powerdemand and with a particular boilerconfiguration when an instantaneouschange in control rod position takesplace The changes in 8 cover theentire range of values which the control rods are expected to have Thesechanges are repeated for severalboilers and for all reasonable values
of power demand
The second specific problem considered here is the reactor power andtemperature response to various step
changes in PQ for several values ofg and for 8=0 This problem corresponds to equilibrium operation at acertain level of power demand with a

particular boiler configuration andfor a fixed rod position when aninstantaneous change in power demandtakes place These conditions mightbe brought about by a sudden break inthe steam linesorby the quick openingor closing of a steam valve duringoperation The changes in P arerepeated for several boilers and forall reasonable levels of power demand
The heat capacity and the initialconditions are discussed next The
exact value of the heat capacity ofthe heat exchanger is not accuratelyknown so three cases are studied These
three cases (cf Eqs 3 and 4) are
g = 0 g = 6 and g = 106
The consideration of the heat capacityparameter for these three cases impliesthe possibility that the reactorresponse to each condition can berepresented by a family of threecurves instead of a single curve Anabrupt change in the boiler configuration during operation wouldoccur only in the event that theboiler exploded This possibilityis accommodated by including thevalue g = 0 Should such an explosion occur the reactor responsewould be simply a quick drop fromthe curve for g = 6 or g = 106 tothe curve for g = 0 and P0 ~ 0 2megawatt No further specific questionshave been raised with regard to changesin this parameter It is expected thatthe actual boiler characteristicswill give a value in the vicinity ofg = 56 Preliminary studies have
shown that such a value will give areactor response no more violent than
that given by the value g = 6 andthat indeed the response will bebetween the curves for the valuesg = 6 and g = 106 Thus these twovalues should adequately include theactual case and also provide theextremes of response for the stabilitystudy
Finally changes in the initialconditions (for various values of PQand of g 8=0) demonstrate severalinteresting perturbations Normallythe initial conditions chosen are thoseof steady state operation at a givenlevel of power extraction Because oftemperature coefficient the equilibrium condition for the reactor powerlevel is independent of the value of8 if sufficient time has elapsedsince the insertion of a change of 8(cf Fig 15 chap 3) The lastspecific problem investigated is thereactor response in the event that thefuel circulating pumps falter in theiroperation That is at a certainlevel of power demand with a givenboiler configuration and with fixedcontrol rod position what happens tothe reactor power and temperature ifthe circulating pumps stop momentarilyand then resume operation' The problemis studied for two of the threeboiler configurations and for allreasonable levels of power demand
These then are the three problemsconsidered here The results obtained
from the computer are presented inchapter 3

Chapter 2
THE SIMULATOR
MODIFYING THE REACTOR EQUATIONS
The equations in chapter 1 are notpresented in the form most suited forobtaining an electrical analogy Bysubstituting Eq 2 into Eq 1 howeverthe more suitable form is obtained
dP
dt§ " L /3td - yx)
i=i
" a(6r - 6r ) T' 2-i 7l dtor
(5) _ = —pdt r
i = l
a0r - L yS (1 - y )P
Ti= 1
dK at
2j 7i~dT ~ r1 = 1
Thus the equations to be simulated arenow Eqs 2 through 5
BASIC NETWORKS
The problem now becomes one ofsynthesizing an electrical systemwhich follows the same equations as
those for the reactor so that voltagesat two points in the circuit representthe solutions for the unknown quantities
P and 6 Several reactor simulators
have been built (cf for examplerefs 1 and 2) but previous modelshave neglected the nonlinearity thatresults from temperature Photographsof the HRE simulator are shown in
Fig la and 16 but the Hathaway S8 Boscillograph used to record fasttransients is not shown A block
diagram of the computer simplifiedgreatly for clarity is shown in Figs7 and 8 (cf this chapter)
Steam Temperature Analogy Since
P0 is a driving function which may becontrolled at will a start will be
(1)P R B 11 d H A St R Sc I tr21 760 763 (1952) ( 1 AECD 2764)
(2)W P g 1 AP t bl El ctr c P I K t cS a I t r AECD 2941 (Ap 3 1950)
made by snythesizing an analogy for
dd.(4) g-
dt «<*r " *.> ~P0
The network of Fig 2 provides thedesired analogy
First assume a scale factor
relating voltage to power namelythat
(6) -£„ -eP,
Since PQ is an arbitrary parameter ofthe kinetic equations a voltage canbe taken from a battery or othersource in such a fashion as to
satisfy Eq 6 The scale factor £ mayhave any desired value in the case ofthis computer 10 volts represents 1megawatt of reactor power
Next assume that
(7) Er = ea6rwhere E is in volts and a and 8 are
as defined in chapter 1 The sourceof this voltage will be described inthe following
Finally it is pointed out that thed c amplifier (Fig 2) is a high gaindevice whose input will not changefrom ground potential by any appreciableamount Since the amplifier has again of somewhat over 20 000 thevoltage at the point marked 0 is lessthan 0 005 volt when Es is 100 voltsThus Ilx and I12 are in error by lessthan 1 part in 20 000 if it is assumedthat point 0 remains at ground potential Similarly I13 and I14 willbe in error by less than 1 part in20 000 Any input current requiredby the d c amplifier is less than 10 5times as large as I,, I12 I13 orI,. so this grid current of the
14 °
amplifier input tube is neglectedNote that the output voltage is 180 degout of phase with the input voltage
In the light of these assumptionsand of the directions and polaritiesshown the equation for Fig 2 is
I.11 Il2 + 'l3 + J14


+ Er-
•£„•-
" 0
-AAAAAAAr
-JWVWV\r-
D C
AMP
-*-MAAAAAAr
UNCLASS F EODWG 20470
-fc
Fig 2 Steam Temperature Analogy
butd£
'll = C7dt
1 2
1 10
ePr
1 3 R10
f?10
from Eq 6 and
14
from Eq 7 so
d£„
dt
*10C7 dEsdt
10
fi,10 "10 "10
Multiplying through by R1Q/eequation for Fig 2 becomes
E
= at
10
ft
Let
(8) fi10C7 =—-a
and the equation becomes
g dEs EK— = ad -•ea dt r
ea8t
R
~ P,
th<
This takes the form of Eq 4 if
(9) E = ea8s s
Reactor Temperature Analogy
Similarly the electrical network ofFig 3 is the required analogy for
dd.(3)
dtP - a(t )
Just as in the steam temperature
E *-
-£J>-
Rio
-AAMAr-
R,0
-^/vVW-
U SS FIE
DW 20 7
+ £
Fig 3 Reactor-Temperature Analogy
analogy
h = I, + Is + 110
or with the polarities shown in Fig 3
dE.-C.
dt R10
R10
R10
Upon substituting Eqs 7 and 9 in theabove equation it is seen that
d8 ead_ Ead-eaCc
dt R10 'i o fi10
Multiplying through by -R /e andletting
(10)
then gives
d8r6
fi10C6
dt
- a{tdt £
which immediately takes the form ofEq 3 if
(11) E = eP
Equation 11 is of course one of the
equalities desired and it will result
when Eq 5 is consideredDelayed Neutron Analogy The
network of Fig 4 gives the electricalanalogy for
dK
(2) -M, +— p/\
b
a
)
i = 12345
In terms of the direction and polaritiesof Fig 4
dE E - E
(12)1 l dt R

or
dE E - Ec c
dt RiCl
Now let
(13) RC - X
and also let
E = n KC 11
where ni is a proportionality constant Then
dKx
dt•n\K + A. E
111 i
Upon dividing through by n and substituting Eq 11 in the above equationit is seen that
dK. k €
dt-*-.*. +"
which assumes the form of Eq 2 if
(14) n,
-£•-
i
1 /3.
Reactor Power Analogy The final
equation to be simulated is
dP 8(5) — =— P
dt t
a0rn ~ t /Mi - yl)p_T
i = i
9
-2 yl
dK, a,8r
dt
UNCLASSIFIED
DWG 2047 2
AA/W—-)[+
Fig 4 Delayed Neutron Analogy
Fig 5 Reactor Power Analogy
and the network of Fig 5 is thedesired analogy
As in the steam temperature andreactor temperature analogies the d camplifier is a high gain high inputimpedance device so with negligibleerror its input may be considered tostay at ground potential and to require no current Therefore the
conductor marked ADD (Fig 5) may beconsidered to be ground for the network The equation for Fig 5 is
(15)
but
(16)
and
(17)
= h + 'o +
s
£i=i
dE
E
Ji + K
while from Eqs 12 and 14
dE
(18) Zi= l
ji =-E c*i=i
dt
« e\tr dK
• 'I, c- T dti = l
Furthermore the multiplier has beendesigned to take the input voltages Eand Er and to give an output voltage

-nEE
(19)
Hence
mEEi
R.
Now by putting Eqs 16 17 18into Eq 15 it is seen that
dE(20) ~
and 19
dt
3
T--2i = l
ekr dK,
ySi dt
nEE,
R
In order to obtain the correct term
for Ig consider Fig 6 The magnitudeof Ig is dependent upon the setting ofthe potentiometer tap on Q as well asupon the magnitude of the voltage E andof the resistances R and Q If D isdefined as the linear position of thetap on Q (that is D = 0 at center ofQ D = +1 at the +E end and D = -1 atthe -£ end) then
I, =-£
i? +— (1 - Z)) /? + —(1 + D)2
or
(21)
1 +
Q
ED
TT7 d - D2)4fi
When the tap is at either extreme ofthe potentiometer Is is maximum for agiven £
current
(22)
Thus for maximum positiveD = 1 and
fi 1 +
Q
UNCLASSIFIED
DWG 20474
•AAAAr
JW\A
'iJVWL-n
+ £"
Fig 6 Excess Reactivity Network
10
Now let
(23)
<*«>.Utilizing Eq 22 then gives
8 £(24) I, =-
Rfl 1 +•
Before returning to Eq 20 it isdesirable to note that substitutingEqs 21 and 22 into Eq 23 gives
ED *(1+Q8
RR Q
1 +— +— (1 - D2)Q 4fl
Dll+|R Q
1 +— + — (1 - D2)Q 4R
(25) 8 =D
£)'„.,,,1 +
411 +|Because of loading effects upon thepotentiometer Eq 25 expresses 8 as anonlinear function of D Increasingthe ratio R/Q causes the denominatorof Eq 25 to approach 1 When R/Q i 5(26) 8 = DS
m
is always within 17 of being correctwhile the equality is exact for anyR/Q when D = 0 ±1 Equation 26permits the desirable feature thatthe potentiometer have a linear callbration
Now by substituting Eq 24 intoEq 20 it is seen that
8 £ £dE
Itflll+i
fl.
e\tr dK,
fi. dt
nEE,
R
Then substituting Eqs 11 and 7 in the thenabove equation and dividing through by rq\e gives
dP 8 P P
9 dt 8 / R\ Rnmax Rll + — I °
2c.i= i
k t dKx ameP8
B dt R rI ? m
or by putting in the proper coefflcients
(9) £ = eads
if
(8) *1.C7g
a
Also
(7) £ =r
ea8r
if
(10) *!0C66
<**,- l>-£C k r
i i
7, dt
amerat
Rll + —) 8 1 = 1/Mi
a6?r " I ^(1 "A)
5
X1 = 1
*0r - I /Mi -r,>
i= 1
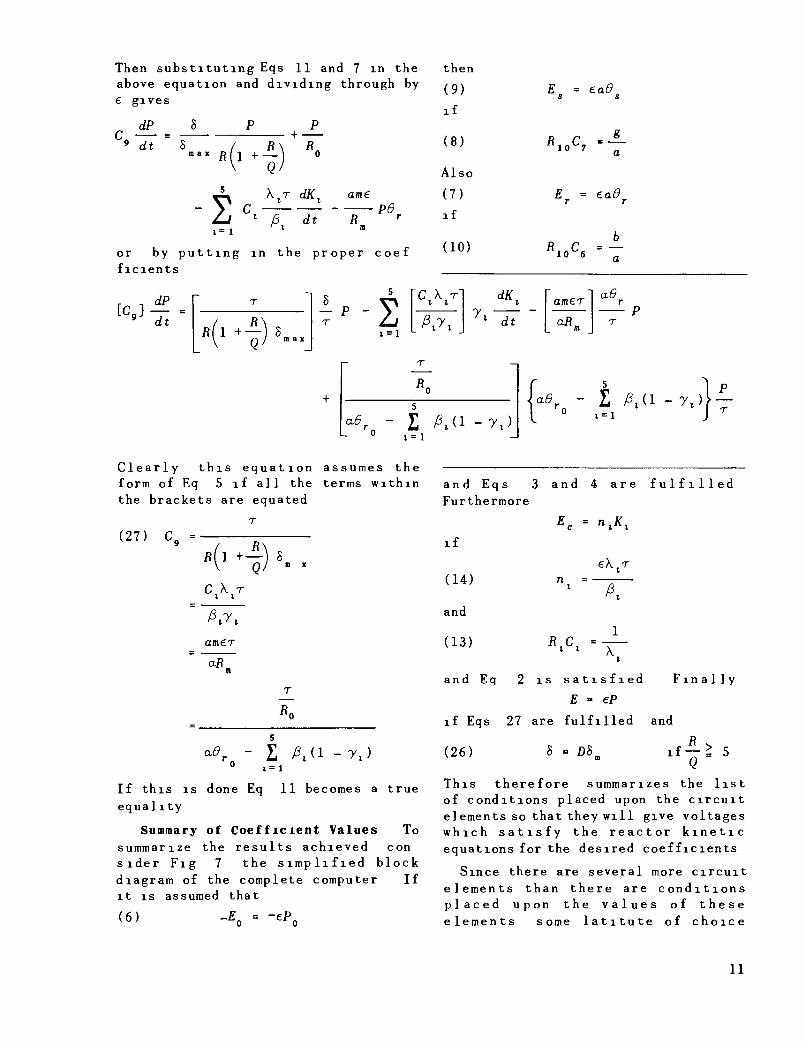
Clearly this equation assumes theform of Eq 5 if all the terms withinthe brackets are equated
(27) CnT
•(' +{) 8m x
ciV
/Mianer
aRm
T
R0
ad. - I 0ta -yl)
If this is done Eq 11 becomes a trueequality
Summary of Coefficient Values To
summarize the results achieved con
sider Fig 7 the simplified blockdiagram of the complete computer Ifit is assumed that
(6) -eP„
and Eqs 3Furthermore
if
(14)
and
(13)
and Eq
and 4 are fulfilled
£. ".*»
e\ r
P>
*iCi1
k
I is satisfied
£ = eP
if Eqs 27 are fulfilled and
(26) 8 = DS„
Finally
R •>
This therefore summarizes the list
of conditions placed upon the circuitelements so that they will give voltageswhich satisfy the reactor kineticequations for the desired coefficients
Since there are several more circuit
elements than there are conditions
placed upon the values of theseelements some latitute of choice
11

11 Io--_ ADD
:Rr-R5.
remains for the designer It may benoted that in some instances thechoice of one circuit value determinesa series of other values For instance
after choosing Cg the values of thedelayed neutron group circuit elementsare automatically fixed since
(13) - *
and
(27) Ct
12
XR C
i i
CiV
9 /Mi *i/MiAfter the choice of a value for C„all the values in the two equationsexcept the R( and the Ct are knownquantities Hence only one solutionfor each of the Rt and the C willsatisfy both conditions Incidentallythe sixth delayed neutron group wasomitted (with negligible error) because it contributes such a smallamplitude of current
The values used in the computer forthe circuit elements and for thecoefficients of the kinetic equations
12 R10
Fig 7 Electrical Analog of Reactor Kinetic Equations
UNCLASSIFIED
DWG 204 7 5
mEEr
are those given in chapter 1 and in thefollowing1 Power to voltage scale factor
e = 10 volts/megawatt
2 Integrating condenserC9 = 0 02 //.ft
3 Excess reactivitySm x = 0 01667
R = 50 000 ohms
Q = 10 000 ohms
4 Biasing resistors
a8r ' L /Ml -yJ-O 1883-0 0091 = 1
so RQ = 26 750 ohms [in thechoice of the biasing resistor itis of no consequence to the solutionof the computer problems whetherthe point of zero temperature is0°K 0°F 0°C or 170°C as longas &r = (6r - zero point) does notbecome negative and thus cause achange of polarity in £r whichnow is equal to eadr The multipliercannot accommodate such a change ofpolarity In order to reduce the

current load upon the amplifierthe zero of temperature is takenat 170°C and the true value of
RQ is 100 000 ohms correspondingto 8r of 62 5°C Preliminarymathematical considerations (cf
app ) show that for the chosenvalue of Sm 62 5 - 18 8 = 8fi 62 5 + 18 8 Thus 8 = 6r -170°C is always positive JDelayed neutron groups ^3>
THE D C AMPLIFIER
Without drift compensation ananalog computer using d c amplifiersis virtually useless Since similarstages operating under similar conditions tend to drift in similar
fashions the difference between the
output voltages of two such similarstages tends to have very littledrift For this reason difference
l y* A kv (sec ) RtCt (sec) Ct (^fd) Rt (megohms)
1 1 00 0 00030 14 00 0 0714 0 00432 16 5
2 1 00 0 00087 1 61 0 622 0 1086 5 73
3 0 904 0 00250 0 456 2 190 0 988 2 22
4 0 819 0 00218 0 154 6 49 2 32 2 80
5 0 810 0 00177 0 0315 31 80 9 08 3 50
Steam temperature network
7 70 sec± - 0a
C,
R10
0 2 33 23 33 /zfd
3 0 megohms
Reactor temperature network6
— =7 seca
R.
2 33 /xfd
... 3 0 megohms
Multiplier networkm = 0 016/volt
Rm = 25 000 ohms
For the desired solutions a
voltmeter or recording oscillographis used to measure
£P = —
e
Er8r = + 170 = 4£ + 170 (°C)
= 0 1£ (megawatts)
ea
ea+ 170 = 4£. + 170 (°C)
(3)J M SteF b 15 1950
mnu cat d t d
amplifiers are used in the reactorsimulator The drift encountered in
this design is less than ±1 mv over a12-hr period of operation
An added advantage of using difference amplifiers is that both positiveand negative signals are available atevery point in the circuit Thusaddition or subtraction is greatlyfacilitated with no change in thebasic design Since a differencesystem is used the true block diagramis that shown in Fig 8 Note thatthis is the same as the block diagramgiven in Fig 7 except that now thecomputer solves for both +P and —PThe amplifier outputs both positiveand negative are loaded in a balancedmanner so that no dissimilarity dueto loading is inserted
The unit tested most extensivelyfor drift did not contain a verycarefully matched input tube (6SN7)Since the input tube in this amplifieris the only important component indetermining the differential drift itwas aged and then carefully matchedfor use in the completed computerEither the 6SN7 or the 12AU7 both
low mu tubes which have proved to havelowdifferential drift characteristics
13

H 00
o o 3 o Ml
50
00
3 e o
I *1
. 33
-vw
w-
3)
-vw
w-
3]
-vw
w-
33
-VW
W1-
3)
-WW
A-
3
-vw
w^
33
-vw
w^-
^AA
AA
A-
33
-AV
W^
i
mE
E
»
"/I
T+
><-
O O
l-i:
JO
O
IO
4-
99
9
TO
PM
ET
ER
—7 /
4-
*1
_."O
SI
6C
c9
Im
q4-
Ol*
-,0
-I
++
99
09
4-
\Q.
4-m
EE
r
TO
PR
OD
UC
TM
ET
ER
9 |--o
o+
99
\j-
-AAA
AAr-
33
33
-AW
Ar-
33
O
-NW
r-3
3
33
-JV
WW
-3
3
-vm
-3
3
33
-JW
WV
-
ii ;_33
"3
I33
Jo
rn
0z
01m
VI

is a good input tube In order to keep oscillator which sets the basicthe drift low by reducing the grid sampling rate of 10 kc Since thecurrent and the noise voltages the product term in Eq 5 has a maximuminput tube (6SN7) is operated at reduced rate of change of only about 20 cpsheater voltage (5 8 volts) at reduced this high sampling rate introducesplate voltage (23 volts % /-t) and at negligible error The pulse shaper islow space current (60 ixa) The dif a one shot multivibrator whichferential gain of the amplifier is when triggered by the pulse repetitionover 20 000 The common mode gain is generator produces a rectangularless than 1 in order to provide longi pulse of about 82 /xsec durationtudinal stability The usable output Since one tube of this multivibratorrange is ±0 1 volt to ±100 volts with is fully on for 82 out of 100 /xsec and10 ma maximum load current Since the since this duty cycle cannot be inamplifier has unity feedback in its creased appreciable while stillpresent application the deviation maintaining reliable performance thefrom linearity is less than 1 part in pulse shaper begins to place an upper20 000 The schematic diagram for limit upon £ Next is the linearthis amplifier is shown in Fig 9 integrator which is switched on and
off by the 82 fJ-sec pulses from thepulse shaper The linear integrator
In order to solve the equations in is a sweep circuit and its outputreal time a fast and accurate multi voltage rises at the constant rate ofplier had to be developed The method 1 volt//xsec and establishes theof multiplication is based essentially proportionality between the voltage Erupon pulse techniques Fundamentally and time The integration rate doesthe method consists of not reach this constant value until1 producing a rectangular pulse after the sweep circuit has been on
whose time duration is proportional for x or 2 ^sec In order that theto one variable in this case £r sweep be quite linear this stage is
2 using this pulse to switch an biased in such a way that the outputintegrator which integrates with voltage starts at about -3 volts andrespect to time at a rate pro sweeps positive When the voltageportional to the other variable £ comparator is considered it will be
3 reading the peak voltage attained seen that this biasing arrangementSince the integrator integrates at a permits discarding the first fewrate proportional to £ and for a time mlcroseconds of integration theproportional to£r the final peak period wherein the nonlinearity occursvoltage is proportional to the productof £ and £ Thus far a saw tooth wave has been
r generated which goes from -3 volts toThe method is straightforward 4-78 volts m about 82 fisec This saw
enough but the reduction of it to tooth wave is generated at a stablepractice in the form of an accurate rate of 10 000 cps and lt has a verymultiplier is somewhat less straight constant slope in the range from 0 toforward Figure 10 is a block diagram 78 volts The saw tooth wave 1S fedshowing the essential parts of the into the voitage comparator When theelectronic system sweep voltage reachesground potential
In Fig 10 the blocks along the a steep pulse called the start pipheavy arrows from the pulse repetition is generated by a blocking oscillatorgenerator through the proportional The sweep voltage which is integratinggate generator constitute a pulse at a very linear rate continues towidth modulation system which produces rise When this voltage is equal topulses of duration proportional to £ £r another steep pulse of 3 /xsecThe pulse repetition generator is duration called the stop pip issimply a frequency stabilized blocking generated These two pulses are
THE [MULTIPLIER
15

16
su03E<Ua05Ml
H

UNCLASSIFIED
DWG 20478
PULSE
REPETITION
GENERATOR(lOOOOpps)
PULSE
SHAPER
(82 /xsec PULSEDURATION)
LINEAR
INTEGRATOR
(1 volt//Asec)
PRODUCT
OUTPUT
CATHODE
FOLLOWER
STORAGE
CIRCUIT
(97 ytisec)
DELAY
NETWORK
(1 /xsec)
RECOVERY
CIRCUIT
PULSE
STRETCHER
(4 ^.sec)
+ Er
+ E •
VOLTAGE
COMPARATOR
r~3STOP
PIP
START
PIP
PROPORTIONAL
GATE
GENERATOR
IPRODUCT
INTEGRATOR
1_
Fig 10 Block Diagram of Multiplier
clamped through diodes to the proportional gate generator which isfundamentally just a condenser whichsets the grid voltage of a cathodefollower The start pip causes thevoltage across the condenser to risequickly to a large positive valueThe front edge of the stop pip causesthe condenser to discharge quickly toa slightly negative voltage Thus theoutput cathode follower of the proportional gate generator produces apositive pulse whose time duration isproportional to £r in the ratio of 1yu.sec/volt The duration of the startpip and the rise time of the stop pipset a lower limit of about 5 volts
upon £r while the pulse shaper theintegration rate of the linear integrator and the resolution of thevoltage comparator combine to establishan upper limit on Er of about 75 voltsfor accurate operation
The second step of the multiplication process is much simpler Thepulse from the proportional gategenerator is clamped through diodes to
the grid of the product integrator andallows it to integrate only for theperiod of time between the start pipand the beginning of the stop pipThe second variable £ is applied asthe voltage which sets the rate ofintegration Thus the product integrator integrates at a rate proportionalto £ for a time proportional to £rThe precision of the product integratoris determined by its loop gain Inthis computer the product integratoris accurate to within 1% but thisaccuracy can be made as great asnecessary by simply increasing thegain
The final step of the multiplication process is accomplished throughthe use of a gated-clamp circuitcalled a pulse stretcher and acondenser and electronic switch combi
nation called the storage circuitThe output voltage of the productintegrator is connected throughclamping diodes to a condenser Thediode polarity is such that the condenser voltage follows the output
17

voltage of the product integrator asthis latter voltage goes up to itsfinal peak value but when the productintegrator output voltage drops backdown to its rest value the diodeclamp circuit isolates the condenserand causes the condenser voltage tostay at the final peak value reachedby the product integrator In thisway the peak output voltage attainedby the product integrator is heldmomentarily by the pulse stretcherNext the 3 (J-sec pulse initiated bythe stop pip blocking oscillator playsa twofold part First this pulse isapplied to an electronic switch Theswitch then allows a small condenser
(which together with the electronicswitch makes up the storage circuit)to be charged up to the value ofvoltage held by the pulse stretchercondenser at the end of 3 /xsec thestorage circuit condenser is againisolated from the pulse stretcher bythe electronic switch The second
part played by this 3 /isec pulseconsists of causing the pulse stretcherto recover The pulse goes through a1 /Ltsec delay line and the back edgeof the pulse causes a flip flop in therecovery circuit to change its stateof operation to produce a negativesignal This signal in turn isclamped to the pulse-stretcher condenser and causes it to become uncharged Meanwhile the storagecircuit isolated by the electronicswitch from the changes in voltagetaking place behind it causes theoutput cathode follower to maintain asteady voltage proportional to thepeak voltage attained by the productintegrator during its last precedingintegration Finally the next pulsefrom the pulse repetition generatorrestores the flip flop in the recoverycircuit to its normal state so that
the pulse stretcher is again ready tofollow the product integrator and atthe same time the chain of events
leading to a new product is initiatedFigure 11 shows the electronic circuitrywith the functional blocks corres
ponding to those in Fig 10 superimposed on the schematic diagram Inthe above explanation and in Fig 10
18
the multiplier has been described asif it produced pulses of only onepolarity throughout From Fig 11 itis apparent that a differential systemis again used and that both positiveand negative signals are produced ineach circuit following the pulseshaper
Much attention has been given todetails in order to improve the performance of the multiplier As in thecase of the amplifiers a differentialsystem is used throughout to avoiddrift The voltage comparator providespulses whose separation is nicely driftfree since similar comparison circuitsare used to initiate both the start
pip and the stop pip In every casewhere thermionic diodes can be usedan effort has been made to utilizethem because of their high backresistance In some instances the
thermionic current with zero appliedplate voltage can be neither toleratednor conveniently balanced out with acompensating diode In such casescrystal diodes carefully selected andconservatively operated are used
The performance of the circuit isgratifyingly reliable fast andsufficiently accurate for this application The variable £ can cover a
range from 1 to 100 volts while £has a usable range of 5 to 75 voltsBoth variables can change at any rateup to 100 cps without adding more than2% to the inaccuracy of the productTests show that the product value hasan inaccuracy of no more than 57 overan output range of 0 06 to 20 voltsThe largest contributors to thisinaccuracy are the nonlinearity of theproduct integrator and the nonlinearityof the output cathode follower Bothelements can readily be improved bysubstituting feedback amplifiers withsuitably high gain With £ or £ orboth £ and £r reduced to zero theoutput voltage does not exceed ±2 mvTins noise figure might be improved ifit were necessary but since the
desired range of product voltage ismany times this value the computeraccuracy suffers to only a negligibleextent from the presence of this noise

PULSE REPETITION GENERATOR PULSE SHAPER LINEAR INTEGRATOR
Fig 11 Multiplier Circuit
VOLTAGE COMPARATOR START PIP
UNCL SS FIED
DWG 20479
19

Chapter 3
COMPUTER RESULTS
CALIBRATION
Before the information from the
computer could be accurately correlated the instrument had to be
calibrated Two calibrations were
made to check the correspondence ofthe physical circuitry with thetheoretical values
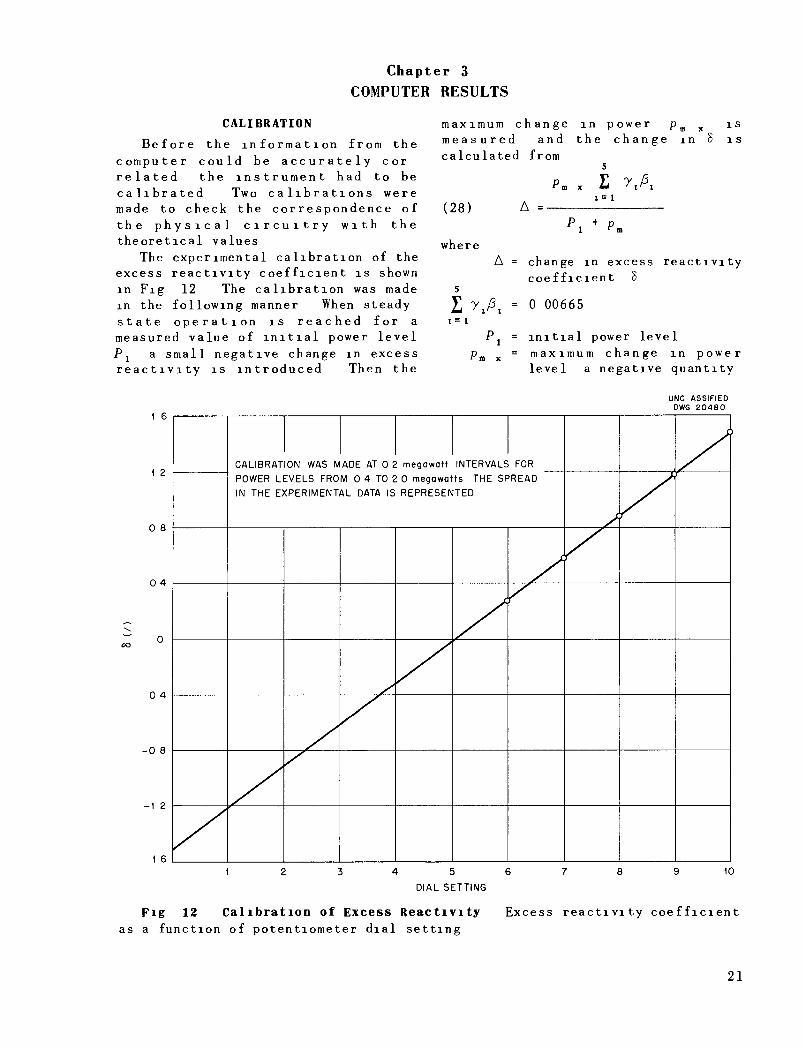
The experimental calibration of theexcess reactivity coefficient is shownin Fig 12 The calibration was madein the following manner When steadystate operation is reached for ameasured value of initial power levelPj a small negative change in excessreactivity is introduced Then the
maximum change in power pm xmeasured and the change in Scalculated from
is
1 s
(28)
where
A
i=i
p.
Pm
Ai=i
Pi + P,
= change in excess reactivitycoefficient S
= 0 00665
= initial power level= maximum change in power
level a negative quantity
UNC ASSIFIED
DWG 20480
1 6
1 2
0 8
0 4
0 4
-0 8
-1 2
1 6
CALIBRAT ON WAS M ADE AT 0 2 megawatt INTERVALS FOR
POWER LEVELS FROM 0 4 TO 2 0 megawatts THE SPREAD
IN THE EXPERIMENTAL DATA IS REPRESENTED
4 5 6
DIAL SETTING
10
Fig 12 Calibration of Excess Reactivity Excess reactivity coefficientas a function of potentiometer dial setting
21

(Eq 28 is derived in the appendix )Figure 13 shows a typical curve givenby the instrument for one such pointin this calibration
UNCLASSIFIEDOWG 20481
/0 INSTANT OF NEGATIVE A INSERTION TIME
Fig 13 P = / ( t)Negative Step in S
for a Smal1
The method of calibration outlinedabove is readily applied to the wholerange of the 8 potentiometers Q (cfFig 7 or 8) since only the change inS is calculated The potentiometerdial may be set for some chosen dialreading of greater than 5 (the nominalpoint of S = 0) and the power levelis then allowed to reach a steadystate value with the potentiometertaps connected to the ADD circuitsAs will be seen in one of the problemsinvestigated later the power leveldoes reach an equilibrium value Punder these conditions and indeed Pjis equal to PQ the power demand atthe boiler plus any power losses inthe nuclear system At any rateafter an equilibrium power level isreached a negative step in A may beintroduced by opening the switch andthus disconnecting the potentiometertaps from the ADD circuits and interrupting a positive value of the
current Js In this fashion a callbration is obtained for the region ofpositive 8 (that is for dial settingsfrom 5 to 10) For calibration in theregion of negative S (namely dialsettings of 0 to 5) the power levelis allowed to reach equilibrium whilethe switch is open and the potentiometer taps are not connected to the
ADD circuits The potentiometer dialis set at some selected reading of less
22
than 5 Then the switch is closed toconnect the potentiometer taps to theADD circuits and to allow a negativevalue of Jg to flow Since the condition of operation with the switchopen corresponds to § = 0 (cf Eq 23)both the above described methods of
introducing negative values of A arereferred in a straightforward mannerto the zero of S Therefore for anyparticular measurement |8| = -A andthe sign of 8 is determined by whetherthe potentiometers were disconnectedfrom or connected to the ADD circuits
to affect the negative change in A
Further consideration of Eq 28 andof Fig 12 is now necessary Thederivation of Eq 28 is based upon theassumption that the delayed neutronconcentrations and the reactor temperature do not change appreciably in thetime required for the power level togo from Pj to (pm x + Px) Thisassumption is very accurate for
negative values of A Since theentire computer is involved in thecalibration shown in Fig 12 thedeviation of the calibration curve
from the theoretical value of 8 = 1 667at a dial setting of 10 and S = -1 667at 0 is due to the accumulated errors
of the entire instrument The re
sistancevalues of the excess reactivitypotentiometers Q (cf Eqs 26 and 27or Fig 8) are not exactly the nominalvalues the measured ohmic resistance
is approximately 37 below the 10 000ohm value chosen a fact which changesthe theoretical value of S to
±1 627 but which does not violate the
inequality upon which the validity ofEq 26 rests Slight imperfections inthe potentiometers account for thefacts that 8=0 does not lie exactlyat a dial reading of D and that thepositive 8 is somewhat smaller inr max
magnitude than the negative valueThe remaining discrepancy between theobserved value |Smax| = 1 50 ± 0 017and the corrected theoretical value of
1 627 is largely due to the fact thatthe multiplier output is not quitelinear with changes in P There is aslight decrease in the effecti/e value

of a as P increases This decrease in
a. then manifests itself as an apparentdecrease in the value of 8 as |S| isincreased The effects of this non-
linearity are also discussed brieflyin the appendix In any event thiscalibration takes into account many ofthe inaccuracies of the instrument
and in laige part corrects for theseimperfections Note that the calibration shown in Fig 12 is quitelinear a fact which is partly due tothe use of potentiometers having only0 1% deviation from linearity andwhich confirms the conclusions in
corporated in Eq 26The second calibration is that of
the temperature coefficient of reactivity The experimental curve isshown in Fig 14 The reactor temperature is measured when it has reached
an equilibrium value with 8=0 thena known change in S is inserted andthe temperature is again measured afterits steady state value is attainedThen
change in excess reactivity 8a
change in reactor temperature A#
as is also derived in the appendixThus the temperature coefficient ofreactivity is the tangent of the angledesignated as 4> in Fig 14 Theslight nonlinearity of the multiplieris hardly apparent here since it islargely accommodated in the calibrationof the excess reactivity coefficient
According to the calculations ofinstrument accuracy any resultsshould be easily within 107 of thetrue solutions to the stated equationsThe computer itself gives solutionswhich are within 37 of being accuratemost of the error being attributableto multiplier inaccuracy The accumulated errors of the recordingoscillograph and its associatedamplifier are estimated to be about 37of the reading Finally the errorsinvolved in reading the recordercharts in calibrating the recorderetc average about 2% of the readingThus the following results should bewithin 10% of the true solution to the
kinetic equations Eqs 2 through 5for the coefficient values stated
previously
SOLUTIONS FOR SEVERAL HRE PROBLEMS
Dynamic Response to a Positive Step
Change in Excess Reactivity Coef
ficient The first problem investigatedis the dynamic response of the reactorpower of the reactor temperature andof the boiler temperature to a stepchange in excess reactivity coefficientfor several values of boiler heat
capacity and for all feasible valuesof power demand at the boiler A setof typical curves is shown in Fig 15This specific set of curves shows fora constant load of P. =04 megawattthe reactor and steam temperaturechanges and the reactor power asfunctions of time following a +0 887step change in 8 inserted at timet = 0 A logarithmic time scale isemployed so that both fast and slowchanges can be observed
The power curve of Fig 15 will beconsidered first Here several
interesting features become evident -note that the height of the power peakis not influenced by the boiler heatcapacity Indeed the power transientis almost identical for all three
cases However the tail of the powercurve is slightly different for thedifferent heat capacity values thatis the power falls off somewhat moreslowly for larger values of boilerheat capacity It should also bepointed out that the final power levelis identical to the initial powerlevel This indicates that the reactor
power is indeed stable against perturbations which arise from control rod
movement and illustrates nicely thatthe delayed neutrons and the temperature coefficient of reactivity control
the stability of the reactor powerThe effects of the boiler become
apparent only after a time which islong compared with the time requiredto reach a power peak (~30 to 100 msec)Thus it would be of little value to
include a more complicated system ofequations to describe the reactor load
23

O )4
<
cr.
H<orUJ
DCot-o<LlI
tr
<
o
UNCLASSIFIED
DWG 20482
Fig 14 Calibration of Temperature Coefficient Change in reactor temperature coefficient as a function of excess reactivity coefficient
24

UNCLASSIFIEDDWG 20483
8
7
TEMPERATURE CHANGE AND
POWER AS FUNCTIONS OF TIME l \
|| 1 1 1 1 1 11II 1 | 1 1 11II 1 IIRESPONSE TO A 0 88 / INCREASE IN EXCESS REACTIVITY (S)
© BOILER HEAT CAPACITY "0 (g 0)@ BOILER HEAT CAPACITY - REACTOR HEAT CAPACITY {g~b)
hU
OF
LLUV
s
VIIM b A bl tK INCKtASt
j \© BOILER V1EAT(:apaCITY= REACTOR HEAT CAPACITY
1 1A9=A8 ©
X10 ($ 10A)
j \P A0 ©
~"~ 6 A9 @o
DDi<D
j§ 5ccUJ
Soa. 4
1..
s
A8S (g
ccoi-o<
^ 3
Ya: Q
2
y/Aes ©
P® P ®
0P © -
12
<io
UJ
CC
<cc
0 001 0 01 01 10
TIME (sec)
100
Fig 15 Typical Dynamic Response to a Step Increase in 8 Temperaturechange and power as functions of time following a step increase in 8
The temperatures of the steam andof the reactor will be considered nextFrom Eq 4
(29) a(8r - 8s)d8
+ gdt
Upon combining Eqs 29 and 3seen that
(30)
d8
dt ~ " ° ° dt
Therefore if the boiler heat capacityg is zero Eq 29 shows that the difference between the reactor temperature and the boiler temperature isproportional to P„ which is heldconstant throughout this set ofsolutions Thus for a step change inexcess reactivity and for g = 0 thetwo temperatures differing by aconstant amount will rise in identical
dd
P -P0 - g
it is
fashions For this condition the
deviations of the two temperaturesfrom their initial values are shown
as Case 1 of Fig 15 Since no changeis made in the load PQ the differencebetween the two temperatures must havethe same value at all times The
reactor temperature must change by anamount
8Ac9 = —
ra
so the initial and final values of
reactor temperature are not the samebut the difference between steamtemperature and reactor temperatureremains constant Note that for this
value of g the reactor temperatureovershoots its final value slightlyThe effect of &r in Eq 5 then causesthe reactor power to undershoot itsfinal value of 0 4 megawatt by a very
25

small amount The small overshoot of
the temperature indicates that thenuclear system has a slight tendencyto be oscillatory but this is rapidlydamped out When the boiler heatcapacity is equal to the reactor heatcapacity the steam temperature changelags behind the reactor temperaturechange in accordance with Eq 29 However when the steam temperature startsto increase since (P - P ) at this
instant is very nearly the same as forCase 1 Eq 30 shows that the reactortemperature begins to have a slowerrate of change than in the previouscase and in turn causes the P curve
to fall off more slowly than in theprevious case This sequence of eventsis shown in Case 2 of Fig 15 Notethat there is still a slight overshootin &8 but that this overshoot is not
so large in amplitude as it was previously which indicates that the systemis more nearly critically dampedSimilarly for a boiler heat capacityten times as great as the reactor heatcapacity the change in boiler temperature is simply delayed by an evengreater length of time than in Case 2and the change in reactor temperaturetakes longer to get up to its finalvalues (cf Case 3 of Fig 15) Inthis case there is neither an under
swing of power nor an overshoot oftemperature and thus there is indication that the system is overdamped
A slight deviation from the mamline of investigation was made inorder to observe a few qualitativefacts about the damping of the nuclearsystem With the delayed neutronnetworks disconnected a modified setof equations was solved that wasequivalent to Eqs 1 through 4 but thathad /8t = Kt = 0 in Eqs 1 and 2 Thenwhen a positive or negative step of 8was inserted with g = 0 the solutionsto this modified set of equationsshowed an undamped oscillation ofpower about the value PQ The heightof the power excursion above P wasseveral times as great as that observedfor the same step value of 8 when thedelayed neutrons were included in the
26
equations For very small values of 8the oscillation was nearly sinusoidalbut as 8 was increased the half cyclewhich was less than PQ began toflatten out and the period of oscillation became long compared with theduration of a high power excursionThis effect has been discussed at
length in previous reports (cf forexample refs 12 3 and 4) for themodified set of equations This testqualitatively confirmed the conclusionsreached in the previous reports
When values for g other than g = 0are employed the oscillation is rathersharply damped The power excursionsdisappear entirely after two to fivepositive peaks depending on the valuesof Pfl 8 and g The largest valuefor g gives the most damping althoughthe system is still underdamped Whenthe delayed neutrons are added anextremely strong damping effect isobserved and in combination with the
damping effect of the external system(that is the value of g) the nuclearsystem can become overdamped as isdemonstrated by Case 3 of Fig 15 Inthe case of the HRE only a smallportion of the delayed neutrons islost from the nuclear reaction when
the fuel is circulated through theexternal piping and this lost portionis accommodated in Eq 1 by includingthe attenuation factor y Since thedelayed neutron concentrations willnot be attenuated to any greater extentthan this under the conditions of
actual operation no further simulatorobservations were made with the delayedneutrons removed In the event that
higher velocities of fuel circulationand larger ratios of fuel time in
external system to time in reactor arecontemplated a greater percentage ofthe delayed neutrons will be lost the
HRE Q P g Rep Feb 28 1950 ORNL 630p 22 26
( 2)H g n R ctor Exp rm t F ibil ty
R po t ORNL 730 p 73 76 (J ly 6 1950)
<3)£fflf Q P g Rep N 30 19 50 ORNL 925p 78 98
(4)T A Wei ton et I HRE Qu Prog RepA g 15 1951 ORNL 1121 p 99 107

power peaks will be higher and thepower excursions may continue forseveral peaks In short the dampingaction of the delayed neutrons willbe greatly reduced and under theseconditions the power excursions shouldbe thoroughly investigated in aquantitative manner The simulatorcan be readily adapted to perform suchan investigation
Numerous curves such as the one
shown in Fig 15 were obtained forvarious values of 8 and at various
levels of P0 They do not differqualitatively Quantitatively theheight of the power pulses is independent of the value of g butdepends upon the values of P0 and of 8The time required to reach this peakis approximately inversely proportionalto the square root of P and is independent of 8 and of g Of the mformation which can be obtained from
these curves that of greatest immediateinterest is the amplitude of the powersurge as a function of the step valueof 8 for various values of P. These
data are discussed next
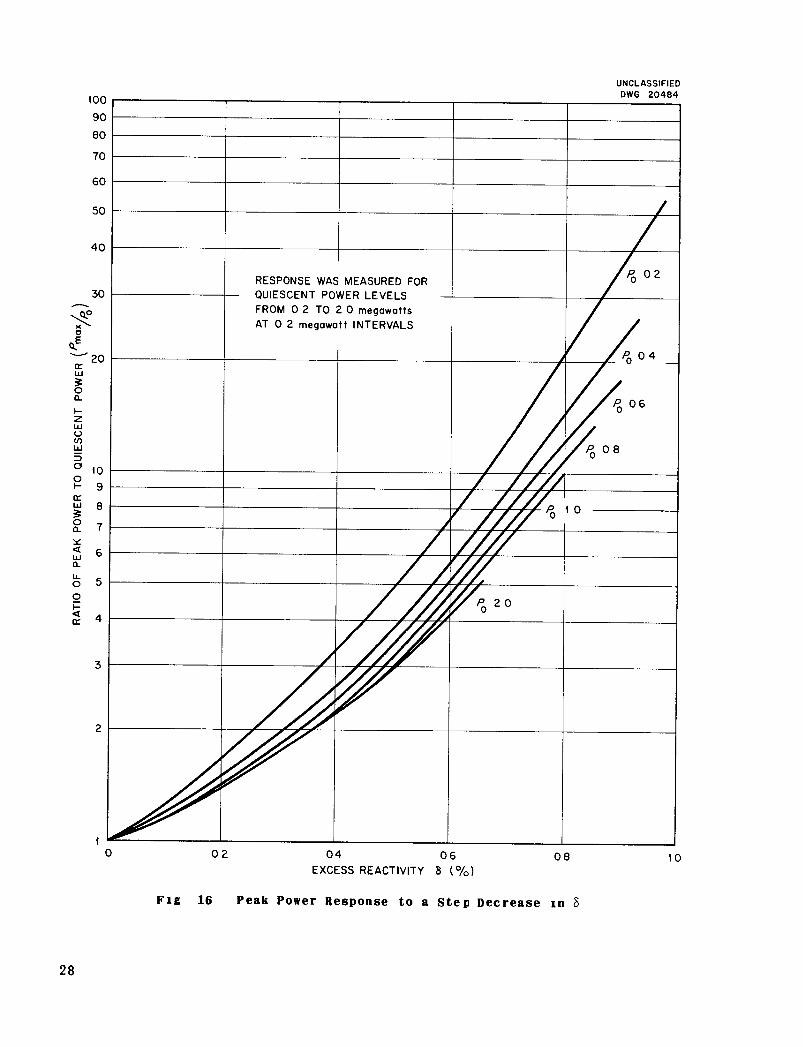
Ratio of Peak Power to Initial
Power as a Function of Excess Reactivi ty
The dynamic response of reactor powerto step increases in 8 has been correlated in Fig 16 to show the ratioof peak power Pm x to initial power asa function of 8 for various values of
initial power level PQ Note that asthe initial power level is increasedthe maximum step values of 8 must bereduced so that the amplifier outputsdo not become saturated For instance
at PQ = 2 0 megawatts the Pmax/P0 ratioat 8 = 0 66% is 5 2 This means thatthe amplifiers are giving a 104 voltsignal at maximum power This valueof voltage is just about the maximumreliable output obtainable with thisparticular amplifier design It istherefore impractical to introduce anylarger values of 8 at this level ofinitial power
It is interesting to compare theresults of Fig 16 with those computedby methods of numerical analysis Thetwo methods of solution give results
which are within 37 of each other
This is easily within the margin oferror which can be expected in readingthe graphical output curves of thecomputer Several of the simplifyingassumptions made by the MathematicsPanel to more readily achieve theirsolutions were checked with the
simulator For example the mvestigation of power peaks with the delayedneutron concentrations held constant
and with the boiler heat capacity equalto zero makes the equations investigated with the simulator equivalent tothose solved by methods of numericalanalysis The results given by thecomputer under these conditions arewithin 2% of the results obtained from
the computer without these simplifyingassumptions the results thus confirmthat the assumptions are quite wellchosen Furthermore the results
achieved with the computer under theseassumptions are within llA7 of thoseachieved by the Mathematics Panel afact which tends to confirm the accurate
operation of the instrumentDynamic Response to Sudden Decrease
in Power Demand The next probleminvestigated is the dynamic responseof the reactor to a sudden decrease in
power demand P Figure 17 showstypical curves for the reactor powerreactor temperature change and steamtemperature change as functions oftime following a sudden reduction ofpower demand from 1 12 to 0 44 megawattsat time t = 0 From Eq 29 with g = 0,it is readily seen that the steamtemperature jumps by the amount-AP0/a (here = +27 2°C) when the powerdemand is changed by an amount APQSince the reactor heat capacity 6 isnot zero the reactor temperaturecannot change instantaneously but doeshave a finite rate of change as soonas the step APQ is inserted as maybe seen from Eq 30 with g = 0 Thenas the reactor temperature graduallychanges in accordance with Eq 30the steam temperature changes similarly and the power is forced to alower value (in accordance with Eq 5)This sequence of events is shown asCase 1 of Fig 17 Note that duringthe power transient the reactor
27
UNCLASSIFIED
DWG 20484100
90
80
70
60
RESPONSE WAS MEASURED FOR
QUIESCENT P0WFR ' curi «
/o 02FROM 0 2 TO
AT 0 2 megawa2 0 megawattstt INTERVALS
/£ 0 4
//Po0&/P0 08
V /av'/o 'u
ypo20
50
40
30
Jl°
20
Oo.
o
UJ
O
oo.
<UJo_
u.
o
<cc
28
02 04 06
EXCESS REACTIVITY S (%)08
Fig 16 Peak Power Response to a Step Decrease in 8
10

UNCLASSIFIED
DWG 20485
1 2
1 0
% 0 I
a:oh-
u<
0 6
04
0 2
ASs®
~n„>
\ p ©
y © ^RESPONSE TO A DECREASE OF 0 68 megawatt \ 'AB ©IN POWLK EXTRACTED FROM THE BOILER (/£)
© BOILER HEAT CAPACITY =0 Kg 0)(2) BOILER HEAT CAPACITY = REACTOR HEAT
CAPACITY [g b)
s
sA6 ©
AB ©
32
28
24u
ya (0
T'<.1
16 O
UJirj>
12 £cc
0 001 0 01 10 10 100
TIME (sec)
Fig 17 Typical Dynamic Response to a Step Decrease of P.
temperature is raised slightly aboveits initial value This causes the
reactor power to be reduced to its newvalue but then the power must undershoot its final value and maintain the
undershoot just long enough to restorethe reactor temperature to its initialvalue This case is of little practicalinterest since in practice the heatexchanger will have some positivenonzero value of heat capacity Theexample does serve to illustrate thelimiting case which would exist if avery small boiler were coupled to thereactor and it does provide conditionsunder which the interaction of events
may easily be correlated to thephysical sequence
Case 2 of Fig 17 is a more realisticsituation which illustrates the
sequence of events when the boilerheat capacity and the reactor heatcapacity are identical The maindifference between the curves for the
two cases is simply that the excursions
in power and in temperature are delayedin time as a result of the increased
boiler heat capacity The overswingof temperature and the undershoot ofpower are not so extreme in Case 2The larger the boiler heat capacitythe greater the delay before theexcursions of power and temperaturetake place and the smaller the overshoot of temperature and the underswing in power Only a single overshoot is observed experimentally andthus there is an indication that the
system is highly stable as was pointedout previously
The case for boiler heat capacityten times as large as reactor heatcapacity shows the same generalcharacteristics as Case 2 Under
these conditions the excursions of
steam temperature and of reactor powerare delayed so much however that theplot will not fit the time scale ofFig 17 so the case is not shownThe excursion of reactor temperature
29

is almost undetectable in this instanceas is the undershoot of power
Numerous curves were taken fordifferent values of PQ and of APQualitatively they are identical tothe typical curves shown in Fig 17Quantitatively the magnitudes of thetotal changes are predictable and are
AP = AP„AP„
t£. A£ = 0
For the case of g = 0 the reactortemperature change reaches a peakheight of approximately
-AP,\A8 1 6
is about 2 8 sec the steam temperature change jumps to its final valueand then follows an excursion identicalto that for A8r The time scale ofevents remains unchanged for differentvalues of P0 and AP0 Similar relationships exist for Case 2 Hence a simplechange of the vertical scales of Fig17 gives dynamic curves for othervalues of PQ and APQ that are within27 of those obtained experimentally
Ratio of Peak Power to Initial
Power as a Function of Steam Temperature Drop The last problem investigated is the response of the reactorpower when the fuel circulating pumpsfalter in their operation When thecirculating pumps are stopped thereactor power drops rather quickly toa level which corresponds to theradiation losses of the core Althoughthe reactor radiation loss is notsimply a constant but vanes with thereactor temperature this detail has
been neglected and the radiation lossof the nuclear system has been approximated for this analysis as being aconstant 0 18 megawatt (In previousinvestigations the radiation lossesof the reactor core have been neglectedthey can be regarded as being a constituent part of PQ under most circumstances )
To simulate the stopping of thepumps the temperature equations aremodified to become
30
d8r
dt(3a) 6
and
d8.
(P _ 0 18) - a8r
Ua) g__ = _(po + a0s)
Thus when the pumps stop the reactorpower and temperature undergo dynamicexcursions which are somewhat similar
to the curves for P and Ac?r shown asCase 1 of Fig 17 The presence ofthe term ~a6r makes Eq 3a somewhatdifferent from Eq 30 so Fig 17 doesnot portray the dynamic curves exactlyNonetheless the reactor power dropsquickly from (PQ + 0 18) to 0 18megawatt and the reactor temperaturereturns to its original value (asdetermined by the reactivity of thereactor) Meantime the heat exchanger is cut off from the reactorcore Since a constant load demand
PQ is still connected to the heatexchanger the steam temperature fallsexponentially in accordance with Eq4a Obviously the rapidity of thisdrop in boiler temperature dependsupon the values of PQ and of g Thelarger the boiler heat capacity gthe more slowly will the steam temperature drop for a given load PConversely the larger the steam loadthe more rapidly will the steam temperature drop for a given heat capacityg These then are the dynamics ofstopping the circulating pumps
When the boiler temperature hasdropped by a predetermined amountAc9s the circulating pumps are restoredto normal operation by again changingEqs 3a and 4a to Eqs 3 and 4 Injecting the cold and hence quite densefuel into the reactor has an effectsimilar to that due to a change inexcess reactivity Power peaks thatare dynamically somewhat similar tothose of Fig 15 result The peaksare not exactly like those of Fig 15however because the fuel does notcontinue to be cold after the cyclingof fuel resumes so this condition isnot like inserting a step change of 8To resume pumping after the fuel in
the external loop has cooled a predetermined amount is thus like in
serting a small 8 step which decreasesto zero with time If the case of
g = 0 were considered here startingthe pumps would be like inserting animpusle of 8 since the fuel wouldwarm up instantaneously This casepresents difficulties in accuratelycontrolling the steam temperature dropwhile the pumps are stopped so sincethe case is not one which will be
encountered in practice it is notconsidered further When the external
system has a nonzero value of heatcapacity the injection of cold fuelis like a small 8 step which decaysexponentially the rate of decaydepending on the values of P0 and of gPhysically this simply indicates thatthe temperature of the fuel continuesto be pulled down below its normalvalue until it heats up the boilerpiping and all the materials whichcontribute to the boiler heat capacityThus in this instance the height ofthe power peaks depends slightly uponthe value of boiler heat capacity
The ratio of peak power to initialpower is plotted in Fig 18 as afunction of steam temperature changeNote that the curves follow the same
trend with changes in P0 as do thecurves of Fig 16 Note also that thepower peak is not influenced so greatlyby the boiler heat capacity g as bythe steam temperature drop At9s andby the level of power extraction PQThis effect is particularly apparentat larger values of P where theexcursions are identical in height forthe two values of boiler heat capacityAt smaller values of PQ the value ofboiler heat capacity has a greatereffect However as P. is reduced
beyond 0 4 megawatt the presence ofthe radiation losses begins to maskthe effects of the cold fuel and the
ratio again becomes smaller
SUMMARY OF EXPERIMENTAL RESULTS
The steady state solutions for Eqs2 through 5 show that the static
reactor power level is fixed by thelosses of the nuclear system plus thepower extracted from the system Thesesolutions show that the temperature ofthe reactor is fixed by the reactivitylevel The dynamic solutions showthat the power and the temperature ofthe reactor undergo only rather slowand not very violent excursions in theevent that the power demand is suddenlyreduced or the fuel circulating pumpsfalter in their operation When thecontrol rods are suddenly removed thereactor power undergoes a singleviolent surge and then settles downrather quickly to its static value (asshown in Figs 15 and 16)
Actual operation of the reactorsince the above data were taken con
firms that the computer is qualitativelycorrect Several of the coefficient
values which at the time the computerwas built represented the best estimates of the prospective values havesince proved to be slightly in errorThe computer has been modified toaccommodate these new coefficient
values and further data are beingtaken by the people associated withthe HRE project
The fact that the HRE is now in
operation is not sufficient reason todeem the usefulness of the reactorsimulator at an end The computercan be modified to give answerswithin the accuracy required forengineering design to any problemwhich requires solutions to equationsof the following general type
dx »— = alX + a2xy + 2, «tSdk
dy_dk
and
dzi
dk
t=o
a4x + a5y f(k)
= blZl + cxx + dvy
12 3
31

00
O
100
90
80
\ 70o
or
w 60
o0.
OCOUJ
O
oI-
o
<
o
o
<cc
50
40
30
20
1 0
UNCLASSIFIED
DWG 20486
^m,n = 018 megawatt THE AVERAGE
HEAT LOSSES FROM RADIATION OF THEREACTOR CORF
© BOILER HEAT CAPACITY =REACTOR HEAT CAPACITY (g=b)
(D BOILER HEAT CAPACITY =RFATTDR HFAT CADAriTV v (O l„-ir\t.\
</ ivu I
P 040 ®//
/p 04 ©o w
S 010 0 AN >©
20 40 60 80 100 120 140 160
STEAM TEMPERATURE DROP -A6L. ( C)
Fig 18 Peak Power Response as a Function of Steam Temperature Drop whenCirculating Pumps Stop and Then Resume Operation
32

where k = a constant times time andthe as 6s cs ds and e s can be
positive or negative constants or
certain functions of k Together witha whole class of engineering problems
in this category any reactors of thehomogeneous type which may be proposedfor future construction should certainlypresent just such a problem as thecomputer is designed to solve
33

Appendix
SOME MATHEMATICAL CONSIDERATIONS
DERIVATION OF THE EXCESS REACTIVITY
CALIBRATION EQUATION
Initially the reactor power is ata constant value so P = 0 = K where
the dot superscript indicates differentiation with respect to timeFurthermore
P = P, 8 = 8r Ki = Kt and 8 = S0at that time Upon putting thesevalues into Eqs 1 and 2 which statethat
(Al) P s - L 0>
- «K -e 0)p s
- + Z ykK«=i
K = -k K + — P' r
When a small negative step-changeA is introduced in the excess reactivity 8 then p can be definedas the subsequent change in reactorpower Thus when
8 = 80 + A
P * Pt + Pwhere both p and A are negativequantities If the reactor temperatureand the delayed neutron concentrationsmay be assumed to remain constantthroughout the period of time requiredfor the excursion p to take place thefollowing equation results
34
P = p = S0 + A- I 0i = i
-aid - 8 )Pr + P
—• 'iii,= i
Now by using Eq A3 it is seen that
/ s \ P.
p = K + A - I /s
(s° +a-?/')t- ».- I ^
i=i
or
(A5) P=^p, +(s0 +a- £ AlNow multiplying Eq A4 by yx summingover i and equating the result withEq A3 gives
t = i
so
<A6> §o - I /?, " - I 7Ai = i L=l
Substituting Eq A6 into Eq A5 gives
Ap--Px + A- I y0\JL

vhich has the solution
AP,_A +
s
z yB
(A7) — exp \—
Z y b - a= i
Finally the maximum value of p occurswhen the exponential term approacheszero so that
or
(A8) A =
AP
-a + Z rA= i
Z 7A1= 1
Pi
which is the form used in Eqlong as
Z rA » ai=i
the above equation will hold even forA > 0 However if A is kept lessthan zero the assumptions that thereactor temperature and the delayedneutron concentrations do not changein the time required for P to go fromPj to (Pj + pm ) are assured of beingcorrect
The time required to reach p iscontrolled by the time constant
-A + z v0 4i=i
28
Consider the case when A = —17 = -0 01then
10 4(0 01 + 0 00665)
= 166 5 sec
Thus in 0 024 sec (= 4/166 5) p willbe within 27 of having reached p
Because of the large heat capacity ofthe reactor and the comparatively longtime constants associated with the
delayed neutron concentrations noappreciable change in either can havetaken place in this length of timeThus Eq A8 is a good approximationwhen negative values of A are usedespecially if |A| ^ 17
The initial conditions for Eqs 3and 4 should also be pointed out atthis time These equations are
(A9)
and
(A10)
b8 = P - a{6 - )
gt :{8. ) - Pn
In the initial steady state condition
0 so P, a 8 .)from Eq A10 and
6 = 0 so P = a{8 - 8 ) = P.r \ o 0/
from Eq A9 Thus Pj = PQ as mentioned previously (cf chap 2)
POWER AND TEMPERATURE EXCURSIONS
FOR A RAMP INPUT OF 8
Since the excursion of power as afunction of step insertions in excessreactivity has been presented inchapter 3 it is also interesting tosee the effect on reactor power ofintroducing 8 as a ramp function oftime The following is a mathematicalanalysis of this case
Equations 5 4 and 3 state
(All) P.lT
s - Z 0,(1 -y.)
" «(6r ~ - Z r*.
35

(A9)
and
be P - a(t
(aio) g8 -aid - e ) - P„° s r s 0
If 8 = S0 + Ct where C is a constantrate of change of excess reactivityand if enough time has elapsed sincethe start of this ramp function (thatis at t = 0) for the reactor power toreach a steady state condition thenin the steady state P = K =0 sofrom Eq All
s0 + ct - z 0,(i - ?,>
"aK -'Jbut from Eq A6
so - Z /M1 - y > • °i=i
C« - a(*r - *pJThere fore
(A12)
gd = a
c+ — t
r r,o a
Substitution of Eq A12 in Eq A10gives
+ — t - ea
- P„
which has the solution
P. Cg C— +— taa a
(Ai3) e0
0
a
Pn Cg ( /g)t
Then provided that enough time haselapsed
Pi.(A14) 8
r o
Cg x C— + — taa a
in the steady stateBefore continuing this analysis
the question of just how much elapsedtime is enough should be resolvedIn Eq A13 the time constant g/a has
36
the values 0 7 and 70 sec corres
ponding respectively to g = 0 b and106 Since e"4 = 0 0183 the termwillbe less than 27 removed from its final
value after the passage of four timeconstants Thus 0 28 or 280 sec
must elapse depending on the valuechosen for g before 6 has recoveredfrom the transient resulting fromstarting the ramp function of 8However it was assumed originallythat enough time had passed for EqAll to reach a steady state condition and this implied that Eq A2was at equilibrium The slowestdelayed neutron group considered herehas a time constant (l/\5) of 31 8sec so about 127 2 sec must intervene
between the time when the ramp startsand the time when Eq All approachesequilibrium Both equilibriums mustexist for this analysis to applytherefore the amount of time which
must elapse is the larger of the twovalues or 127 sec for g = 0 6 and280 sec for g = 106 Since C must bea constant this required lapse oftime together with the available rangeof variation in 8 sets a practicallimit on the maximum value of C
Since it is known that initiallyP ~ PQ it can be assumed that thesteady-state value of P with the rampinput of 8 is
(A15) P = P0 -i- p
Also differentiating Eq A12 gives
C(A16) 8 = —
r a
Now substituting Eqs A12 A14 A15and A16 into Eq A9 gives
6 - = P. + p - aC
e +— tr o a
Po Cg• e + — + —
ro a aa
CgP ~
Thus
(A17)
a
P =~ (6 + g)a
C— ta

Hence it can be stated in generalthat for a ramp input of 8 p thesteady stage offset in reactor powerfrom the initial value P0 is
rate of change of 8 timesthe sum of boiler and
reactor heat capacities
temperature coefficientof reactivity
Some simple tests with the computerconfirm this analysis although thesetests show that the values givenabove for elapsed time tend to be conserva tive
SOME MATHEMATICAL DIFFERENCES BETWEEN
THE FOREGOING ANALYSES AND THE
ACTUAL COMPUTER OPERATION
It is advisable to point out atthis time that as actually performedwith the computer the initial reactortemperature (call it 6 ) is not equalto (9 Furthermore
s /- Z 0,(1 -r.)
initially as may have been gatheredfrom Fq A6 but instead 8 = 0initially Nevertheless it can bereadily seen from Eq 5
p = s - Z 0,d -y )
-*(*r-sP0)J-- Ey.*that the stable initial conditiondemands that
tt(er, - «r0) =" E 0 <1 ^ >which may then be defined as 8. Thus8=0 initially and a slight loweringof the reactor temperature produces80 the reactivity required to maintaincriticality It is easily seen thatthis modification in no sense changesthe foregoing analyses
Since the discussion of reactortemperature as a modifying factor to
the excess reactivity coefficient hasarisen several other facets of this
phenomenon will be considered
DERIVATION OF THE CALIBRATION EQUATION
FOR THE TEMPERATURE COEFFICIENT
OF REACTIVITY
In the calibration of a the temperature coefficient of reactivity usewas made of the bracketed term in
Eq 5 or Eq All In the steadystate condition P = 0 = K and thisbracketed term must be identicallyequal to zero Thus if dr is theinitial temperature at steady statewith 8=0 then
5
(Ai8) - Z 0,d - y )i=i
-C,-8-,) 0
Now if a change in the excessreactivity coefficient (= 8) is mtroduced the final temperature at steadystate become 8 and
2
(A19) Z 0 d - y.)
-a(
If A6> = 8 -8r 2 , ,
subtracted from Eq A19
- 8 \= 02 ro)and Eq A18 is
8 = ad .)= a A6
Since 8 is readily calibrated by othermeans the relation
(A20)Ad
canbeused to experimentally determinethe precise value of a.
EVALUATION OF THE MAXIMUM
TEMPERATURE EXCURSION
With the calibrated values of 8m x
and a known it is possible to predictthe maximum excursion of temperaturewhich the computer must be prepared toundergo (cf chap 2) From Eq A20and Figs 12 and 14 the calibration
37

curves
\Adr
it is seen that
a
1 527
0 00081= 18 8°C
Since the zero point of temperatureso far as the computer is concernedis set at 170°C then d normallyoperates in the neighborhood of 62 5and never becomes smaller than 43 7nor larger than 81 3 These temperature limits correspond respectivelyto Er = 10 9 volts and 20 3 volts andthus assure that this voltage input tothe multiplier always remains positiveand well within the most accurate rangeof the multiplier (cf chap 2)
DISCUSSION OF INACCURACIES
IN THE COMPUTER
In practice the computer containscertain inaccuracies those connected
with the multiplier are of the greatestconsequence There are however otherinaccuracies present For instanceto assume that the input potentialof one of the d c amplifiers does notdiffer from ground potential isslightly erroneous Inaccuracies ofthis type may be reduced to as littleas 0 017 by simply increasing the gamof the amplifier and by carefullymeasuring and matching the resistanceand capacitance values in the analogcircuits (cf for example refs 1and 2) In this computer the accumulated inaccuracies of this nature
are calculated to be no greater than17 of the reading On the other handas was learned from tests and exhaustlvemeasurements the inaccuracy of themultiplier is slightly less than 27
The major inaccuracy of the multiplier appears as a slight decreasein a when the multiplier s outputvoltage is caused to increase Thusthe approximation that a is a constantis reasonably accurate for this computer but it is only a first orderapproximation To a second order of
D McD n Id R Sci I t 21 154 57(1)
(1950)
(2)G AKr d T M Krn £1 ctro ic An logC «p te McG w H 11 New Y rk 1952
38
approximation Eq 5 or Eq Allshould read
(A2i) p = s - Z 0 (i - y )
- aid P) d + a"0~r,
P
T
- Z y ki = i
where
(A22) aid P) = a0[l + eidr P)]
Ad IS
3a
W
ao +
- e
Ba
ddAd
0
3a
3PAP
an increment
of 6f in the vicinity of d and APis(P - Pi) an increment of P in thevicinity of Pj Note that the outputof the multiplier is now -aid P) d P/rwhile the constant portion of thetemperature term produced in the computer by a precision resistor networkand not subject to the nonlinearityin a due to the multiplier isai P/r
0 roAs is pointed out in the preceding
section the range of operation for8 is selected such that
Furthermore Ad is restricted to arelatively small range so that
(A23) aidr P) £ aiP)
In o
that in tqssame value
po we r say
3o_3P
AP
rder for the aQ in Fq A21 andEas A22 and A23 to have the
a reference level of
f i = 06 megawatt is

selected then aid 0 6) = a. andr o
the a0 of Eq A21 is given this valueThen Eq A23 may be modified to read
3a r(A24) aid P) % a0 +— [P - 0 6]
where 3a/3P is now averaged over therange from P to 0 6 megawatt Thusit is apparent that the expressionused in calibrating 8 (that is Eqs28 or A8) depends to a slight degreeon the level of power demand PQ atwhich the calibration is made Further
more the equilibrium condition forEq 5 or All depends slightly uponthe power level which indicates that80 is a function of P in the samefashion that a is Anyway by analysiswhich is a little more detailed and
involved than can be included in this
report it can be shown that Fig 14is simply a good determination of thevalue aQ Also a calibration curveof 8 for each power level studied wasused to give the true value of 8 inserted Figure 14 is the calibrationat 0 6 megawatt while the values from0 2 to 2 0 megawatts are included
within the spread of data shown thereSince the reactor power returns toits initial value the equilibriumdeterminations are correct as shown
in the dynamic curves for a positivestep in 8 since a decreases slightlyat higher power levels the powerpeaks tend to be a little higher thanthey would be without this nonlinearityComparison of the results of Fig 16with the results obtained by theMathematics Panel using the Bureauof Standards digital computer (SEAC)shows that Fig 16 is less than 1 57higher than the Mathematics Panel sresults Therefore it may be statedthat this nonlinearity is so slightas to be of little consequence Thenonlinearity can readily be correctedby insertion of a properly designedfeedback amplifier instead of thecatnode follower But the temperaturecoefficient of reactivity of thereactor itself was expected to behavein much this same fashion (as indeed
it has) so the corrective measureswere advisedly not taken in the designof this multiplier
39