Embed Size (px)
Citation preview
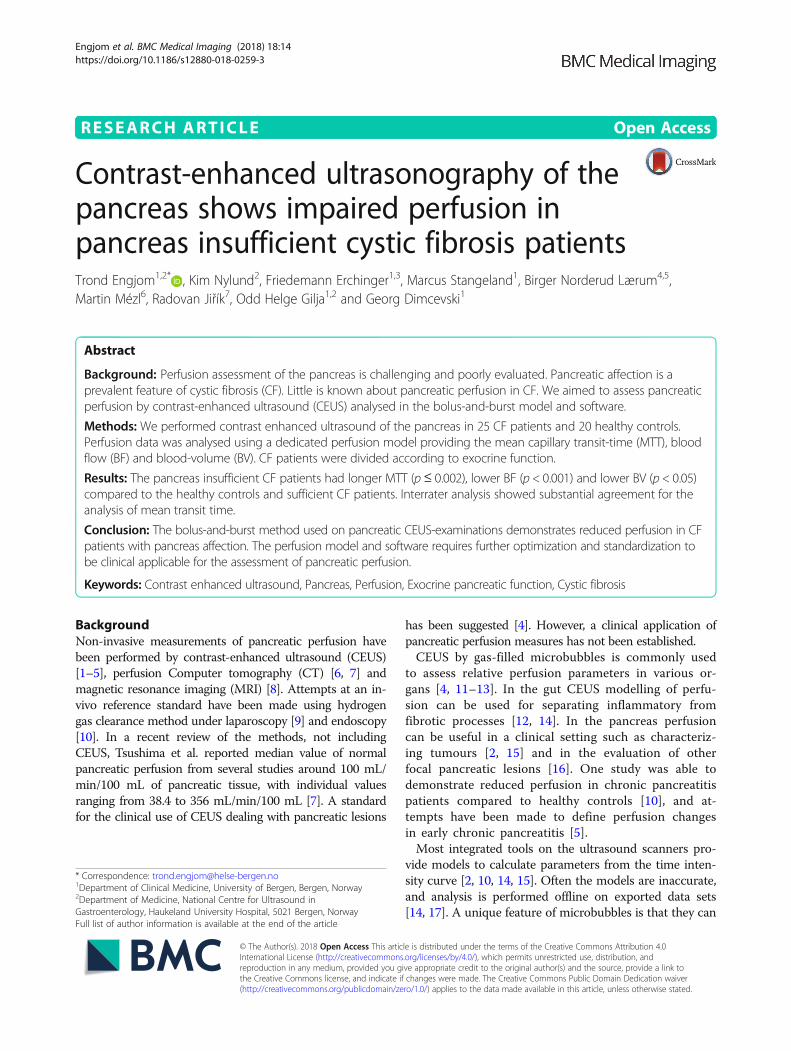
RESEARCH ARTICLE Open Access
Contrast-enhanced ultrasonography of thepancreas shows impaired perfusion inpancreas insufficient cystic fibrosis patientsTrond Engjom1,2* , Kim Nylund2, Friedemann Erchinger1,3, Marcus Stangeland1, Birger Norderud Lærum4,5,Martin Mézl6, Radovan Jiřík7, Odd Helge Gilja1,2 and Georg Dimcevski1
Abstract
Background: Perfusion assessment of the pancreas is challenging and poorly evaluated. Pancreatic affection is aprevalent feature of cystic fibrosis (CF). Little is known about pancreatic perfusion in CF. We aimed to assess pancreaticperfusion by contrast-enhanced ultrasound (CEUS) analysed in the bolus-and-burst model and software.
Methods: We performed contrast enhanced ultrasound of the pancreas in 25 CF patients and 20 healthy controls.Perfusion data was analysed using a dedicated perfusion model providing the mean capillary transit-time (MTT), bloodflow (BF) and blood-volume (BV). CF patients were divided according to exocrine function.
Results: The pancreas insufficient CF patients had longer MTT (p≤ 0.002), lower BF (p < 0.001) and lower BV (p < 0.05)compared to the healthy controls and sufficient CF patients. Interrater analysis showed substantial agreement for theanalysis of mean transit time.
Conclusion: The bolus-and-burst method used on pancreatic CEUS-examinations demonstrates reduced perfusion in CFpatients with pancreas affection. The perfusion model and software requires further optimization and standardization tobe clinical applicable for the assessment of pancreatic perfusion.
Keywords: Contrast enhanced ultrasound, Pancreas, Perfusion, Exocrine pancreatic function, Cystic fibrosis
BackgroundNon-invasive measurements of pancreatic perfusion havebeen performed by contrast-enhanced ultrasound (CEUS)[1–5], perfusion Computer tomography (CT) [6, 7] andmagnetic resonance imaging (MRI) [8]. Attempts at an in-vivo reference standard have been made using hydrogengas clearance method under laparoscopy [9] and endoscopy[10]. In a recent review of the methods, not includingCEUS, Tsushima et al. reported median value of normalpancreatic perfusion from several studies around 100 mL/min/100 mL of pancreatic tissue, with individual valuesranging from 38.4 to 356 mL/min/100 mL [7]. A standardfor the clinical use of CEUS dealing with pancreatic lesions
has been suggested [4]. However, a clinical application ofpancreatic perfusion measures has not been established.CEUS by gas-filled microbubbles is commonly used
to assess relative perfusion parameters in various or-gans [4, 11–13]. In the gut CEUS modelling of perfu-sion can be used for separating inflammatory fromfibrotic processes [12, 14]. In the pancreas perfusioncan be useful in a clinical setting such as characteriz-ing tumours [2, 15] and in the evaluation of otherfocal pancreatic lesions [16]. One study was able todemonstrate reduced perfusion in chronic pancreatitispatients compared to healthy controls [10], and at-tempts have been made to define perfusion changesin early chronic pancreatitis [5].Most integrated tools on the ultrasound scanners pro-
vide models to calculate parameters from the time inten-sity curve [2, 10, 14, 15]. Often the models are inaccurate,and analysis is performed offline on exported data sets[14, 17]. A unique feature of microbubbles is that they can
* Correspondence: [email protected] of Clinical Medicine, University of Bergen, Bergen, Norway2Department of Medicine, National Centre for Ultrasound inGastroenterology, Haukeland University Hospital, 5021 Bergen, NorwayFull list of author information is available at the end of the article
© The Author(s). 2018 Open Access This article is distributed under the terms of the Creative Commons Attribution 4.0International License (http://creativecommons.org/licenses/by/4.0/), which permits unrestricted use, distribution, andreproduction in any medium, provided you give appropriate credit to the original author(s) and the source, provide a link tothe Creative Commons license, and indicate if changes were made. The Creative Commons Public Domain Dedication waiver(http://creativecommons.org/publicdomain/zero/1.0/) applies to the data made available in this article, unless otherwise stated.
Engjom et al. BMC Medical Imaging (2018) 18:14 https://doi.org/10.1186/s12880-018-0259-3
be cleared from the bloodstream using a burst of ultra-sound with a high mechanical index. Recently, Jirik et al.developed a method for estimating absolute perfusion pa-rameters; the bolus-and-burst technique [18]. The phar-macokinetic model used allows the estimation of themean capillary transit time (MTT), the blood volume(BV), and also blood flow (BF) using the central volumetheorem, BF = BV/MTT [18, 19]. The integral of the time-intensity curve in a vessel (artery or vein) is used for scal-ing the data and calculate absolute values for blood flowand blood volume. The model has earlier been related topathological findings and clinical outcome data in the in-testines of patients with Crohn’s disease [12]. We recentlyevaluated the inter observer and inter system quality ofthe model in the pancreas [20].Patients with cystic fibrosis (CF) develop pancreatic
damage as a result of defective ductal and acinar pancre-atic secretion [21, 22]. The main pathological findings inthe affected CF pancreas are homogenous atrophy, fibro-sis and fatty infiltration, whereas the more focal featuresof chronic pancreatitis are not frequently seen [21, 23].The microvascular changes and perfusion characteristicsin CF are not well described in literature. Autopsy stud-ies of chronic pancreatitis patients have shown markedreduction in pancreatic vasculature with reduced num-ber, volume and calibre changes of the vessels [24]. It isassumed that the same reduction of microvascular dens-ity is present in the affected CF pancreas. The possibilityof precise pancreas phenotype characterization, and amarked, homogenous pathological difference betweennormal and affected tissue, makes CF patients a goodmodel population for examining pancreas perfusion.The aim of this study was to assess absolute perfusion
parameters in the pancreas using bolus-and-burst tech-nique [12, 18, 19] in patients with CF and healthycontrols. Furthermore, the interrater agreement of themodel-analysis was evaluated.
MethodsSubjectsDuring a 4-year period (December 2010–May 2014),CF patients aged > 15 years attending regular followup in the CF clinic were offered a detailed evaluationof the pancreas in this prospective observationalstudy. The CF diagnosis was defined according to thepresent diagnostic criteria for CF in the cystic fibrosisfoundation consensus report [25, 26]. A group ofhealthy controls was also included. Inclusion criteriafor the control group were absence of abdominalsymptoms and disease. Subjects with insufficientsonographic visualisation of the pancreas, extensiverespiratory movements or technical flaws in the re-corded perfusion/reperfusion phases were excludedretrospectively.
Patient characteristicsPatient records were reviewed and all subjects wereinterviewed. Age and sex of the patient, body massindex, CFTR mutation status and sweat-test values (Cl−)were documented.
Transabdominal ultrasoundThe subjects were fasting > 4 h. A GE Logic E9 scannerwith a 1-5 MHz curvilinear-probe was used (GeneralElectric medical systems and primary care diagnostics,Milwaukee, WI, USA). Scanning of the pancreas wasperformed with the subjects in supine position, using atransverse or oblique epigastric probe position. An intra-venous bolus of 1.5 mL SonoVue® contrast agent(Bracco, Milan, Italy) was given over 2 s followed by abolus of 10 ml saline over 4 s. The dual view containingboth the B-mode and the contrast image was used forthe acquisition. Recordings were acquired for 90 s withthe following settings: Dynamic range 66, 9 frames persecond, probe frequency 4 MHz and mechanical index:0.10. The focus position was placed at the deepest pointof the pancreas. When the contrast intensity reached asteady state (after 45 s) a high-power pulse sequencewas applied to burst the bubbles, and the replenishmentphase was recorded for 45 s. Recordings were stored asDigital Imaging and Communications in Medicine(DICOM)-files for later analysis.
Image processing and analysisExclusion of datasetsTo ensure relevant and good quality data, a strict exclu-sion procedure was applied. Datasets with generally in-sufficient imaging quality or particularly withdisturbances in the reperfusion phase were excludedprior to the final analysis. Exclusions were made blindedto patient characteristics. Post analysis exclusions of out-liers represented by MTT > 15sek were performed toexclude non-physiological values from the analysis.
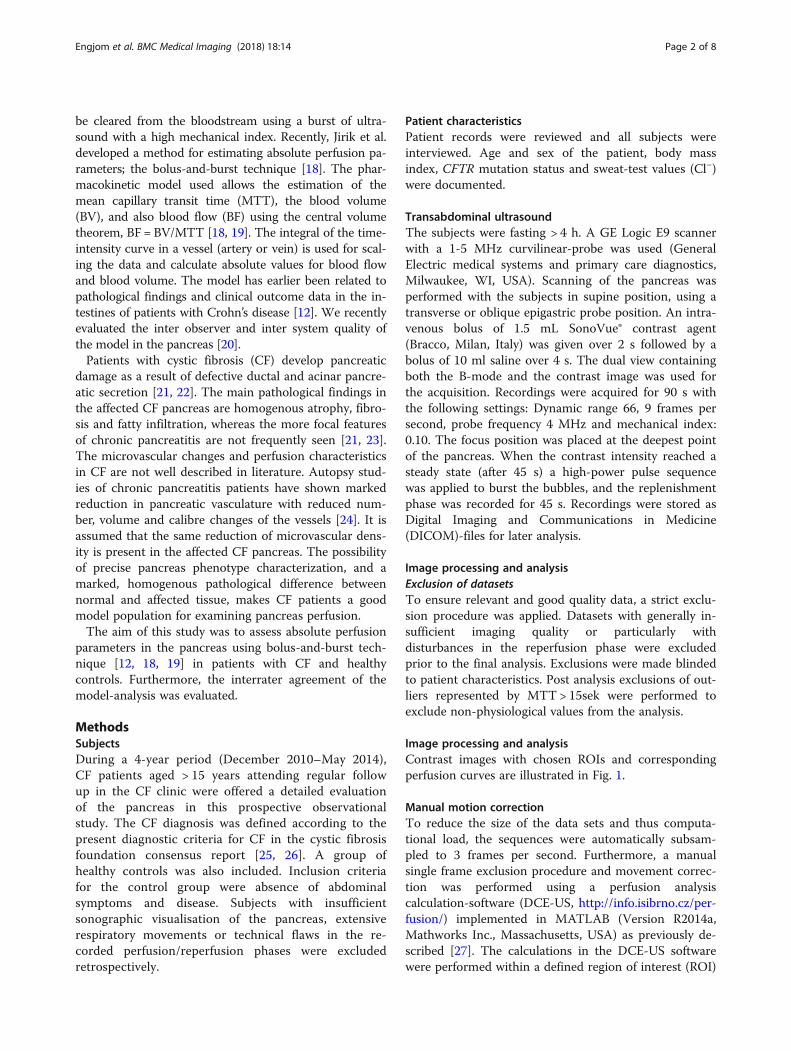
Image processing and analysisContrast images with chosen ROIs and correspondingperfusion curves are illustrated in Fig. 1.
Manual motion correctionTo reduce the size of the data sets and thus computa-tional load, the sequences were automatically subsam-pled to 3 frames per second. Furthermore, a manualsingle frame exclusion procedure and movement correc-tion was performed using a perfusion analysiscalculation-software (DCE-US, http://info.isibrno.cz/per-fusion/) implemented in MATLAB (Version R2014a,Mathworks Inc., Massachusetts, USA) as previously de-scribed [27]. The calculations in the DCE-US softwarewere performed within a defined region of interest (ROI)
Engjom et al. BMC Medical Imaging (2018) 18:14 Page 2 of 8
in the pancreas after the motion correction and frameexclusion. The ROI was chosen in a region of the pan-creas with minimal residual motion and other artefacts.The size and form of the ROI had to be adjusted accord-ing to this, excluding the possibility of a standardizedROI for all patients. An anatomical location in the heador body of the pancreas was preferred, but sample qual-ity had priority over exact standardization of anatomicallocation. For the scaling procedure an artery close to thechosen ROI (mainly superior mesenteric or gastroduode-nal artery) was identified. If necessary a second motioncorrection process was performed before a ROI wasdrawn and the integral of the arterial tissue concentra-tion curve calculated.The manual motion correction and perfusion analysis
was performed by clinicians experienced (> 5 years) with
pancreatic ultrasound and blinded to knowledge of pan-creatic function and clinical data.
Perfusion analysisIn Fig. 1 we present the perfusion curves for selectedparts of the pancreas in two patients. The complexmathematical calculations in the bolus-and-burstperfusion-analysis model are described in detail by Jiriket al. [18, 19]. It provides estimates of the physiologicalparameters blood volume (BV [mL/100 mL]), mean ca-pillary transit time (MTT [s]) and blood flow (BF [mL/min/100 mL tissue]) calculated as BF = BV/MTT*60.The perfusion model includes a scaling factor requiredfor absolute quantification of blood volume and flow[18, 19] derived from the area under the curve of the ar-terial tissue concentration curve.
Fig. 1 Analysis and perfusion curves. The figure displays contrast images from with a chosen region of interest (Red encirclement) in the body/tail of thepancreas in a sufficient (upper) and insufficient (lower) CF patient. The ROIs were placed by guidance from the B-mode image. Mark that the ROI in theinsufficient patient is placed over an atrophic and poorly perfused pancreas. The highly perfused structure anterior to the pancreas is the ventricular wall.The perfusion curves with different phases are presented to the right the measured (blue) and modelled (green) curves. A: Arrival of contrast. B: First passof contrast bolus. C/F: Linear decay phases. D: Burst. E: replenishment phase. Curves are presented before scaling to the arterial input, thus values are inarbitrary units and not directly comparable. (C(t): Concentration over time. [a.u]: Arbitrary units
Engjom et al. BMC Medical Imaging (2018) 18:14 Page 3 of 8
Interrater analysisBefore analysis the DICOM files were randomized, usinga web based free-ware, Research Randomizer [28]. Theperfusion analysis was performed by two observers (KNand TE). The results from observer 2 were used forinterrater analysis only.
Exocrine pancreas functionWe assessed exocrine pancreatic function by a secretin stim-ulated, short endoscopic function test described elsewhere[29, 30]. Faecal elastase-1 was measured by a commercialanalysis kit (ScheBo, Biotech, Giessen, Germany). The CFpatients were defined as pancreas sufficient by faecal elastase> 100 μg/g or duodenal bicarbonate > 80 mmol/L.
Statistical analysisStatistics were calculated in SPSS statistics 22 (IBM SPSSStatistics, New York, USA) and SigmaPlot 11, (Systat Soft-ware Inc., San Jose, CA, USA). Normal distribution of thesamples was tested by Kolmogorov-Smirnov test. The re-sults are presented as median values with IQ range. Sim-ple comparisons between groups were made Mann-Witney U-test. Accuracy data are calculated from receiveroperator curves (ROC). Variance is expressed through95% confidence intervals. 5% level of statistical signifi-cance was used. Correlation was calculated using Pear-son’s correlation coefficient. Interrater reliability wascalculated as intra-class correlation coefficients (ICC) in arandom, two-way analysis. The ICC has values between 0and 1 and is considered poor if 0–0.2, fair if 0.2–0.4, goodif 0.4–0.75 and excellent if > 0.75. The scaled data wereanalysed according to consistency. Agreement was definedaccording to Landis and Koch [31]: 0 = no agreement, 0 -0.20 = slight agreement, 0.21–0.40 = fair agreement, 0.41-0.60 = moderate agreement, 0.61–0.80 = substantialagreement and 0.81–1 = almost perfect agreement.Bland-Altman plots were drawn. Power and number ofpatients at baseline are calculated based on the followingassumptions: The smallest difference between the groupsrejecting the null hypothesis is estimated to 35%. Theworst case standard deviation is chosen 25%. Sample sizesof 14 patients in each group are expected to give the de-sired power of at least 0.80.
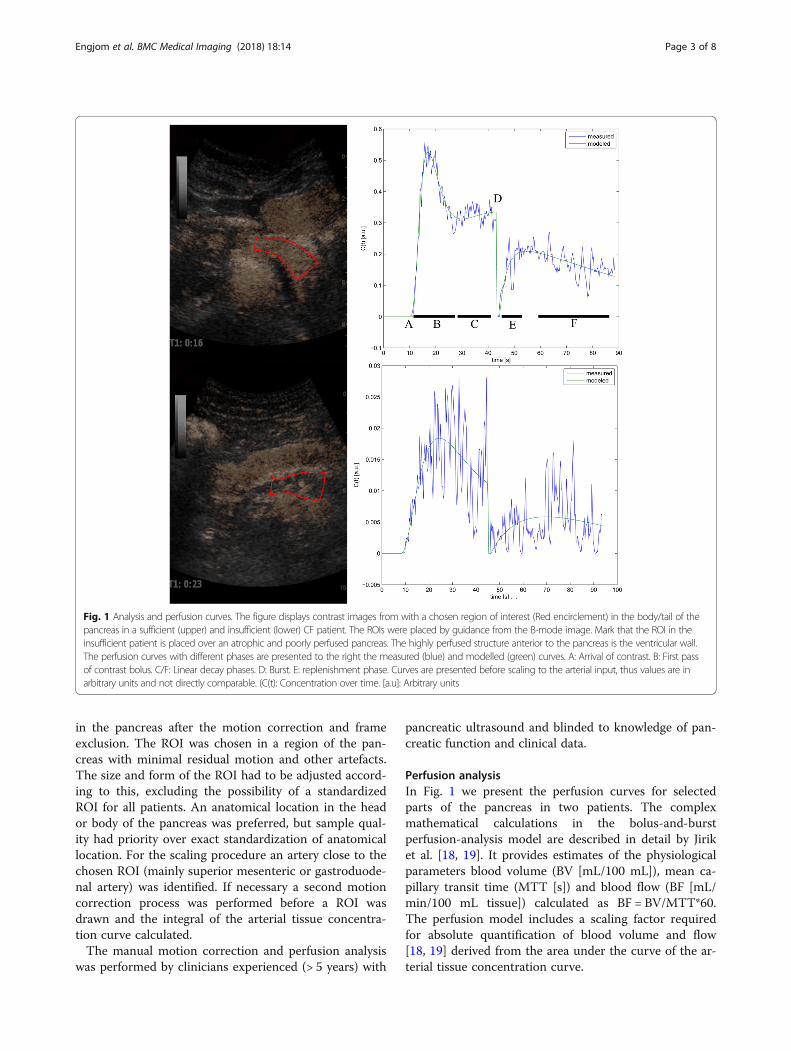
ResultsInclusionThe inclusion flow chart is displayed in Fig. 2. We exam-ined 33 CF patients and 25 healthy controls according tothe protocol. We excluded 8 CF patients and 5 controlsdue to poor pancreatic ultrasound visualisation, or fail-ure to track the same region of interest throughout theexamination. Accordingly, we present results from 25CF patients and 20 healthy controls (HC). When sortedby exocrine pancreatic function, patient groups were
divided as follows: Cystic fibrosis; pancreatic insufficient(CFI, n = 13) and cystic fibrosis; pancreatic sufficient(CFS, n = 12). Observer 2 failed to achieve analysis forfour of 45 subjects analysed by observer 1. Further threeanalyses were excluded from the analysis performed byobserver 2 due to non-physiological values (MTT > 15 s), leaving 38 analyses for the interrater agreement ana-lysis. Demographic data and data for exocrine functionare displayed in Table 1. The control group was slightlyolder and contained more females than the CF groups(p < 0.05).
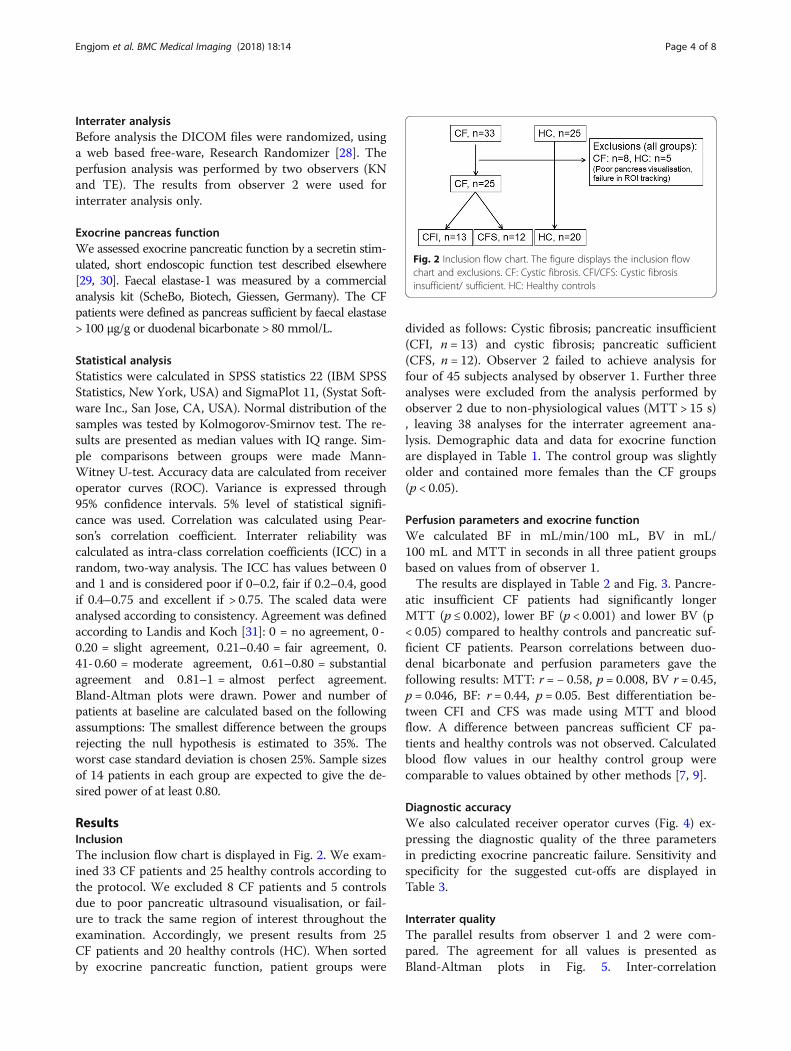
Perfusion parameters and exocrine functionWe calculated BF in mL/min/100 mL, BV in mL/100 mL and MTT in seconds in all three patient groupsbased on values from of observer 1.The results are displayed in Table 2 and Fig. 3. Pancre-
atic insufficient CF patients had significantly longerMTT (p ≤ 0.002), lower BF (p < 0.001) and lower BV (p< 0.05) compared to healthy controls and pancreatic suf-ficient CF patients. Pearson correlations between duo-denal bicarbonate and perfusion parameters gave thefollowing results: MTT: r = − 0.58, p = 0.008, BV r = 0.45,p = 0.046, BF: r = 0.44, p = 0.05. Best differentiation be-tween CFI and CFS was made using MTT and bloodflow. A difference between pancreas sufficient CF pa-tients and healthy controls was not observed. Calculatedblood flow values in our healthy control group werecomparable to values obtained by other methods [7, 9].
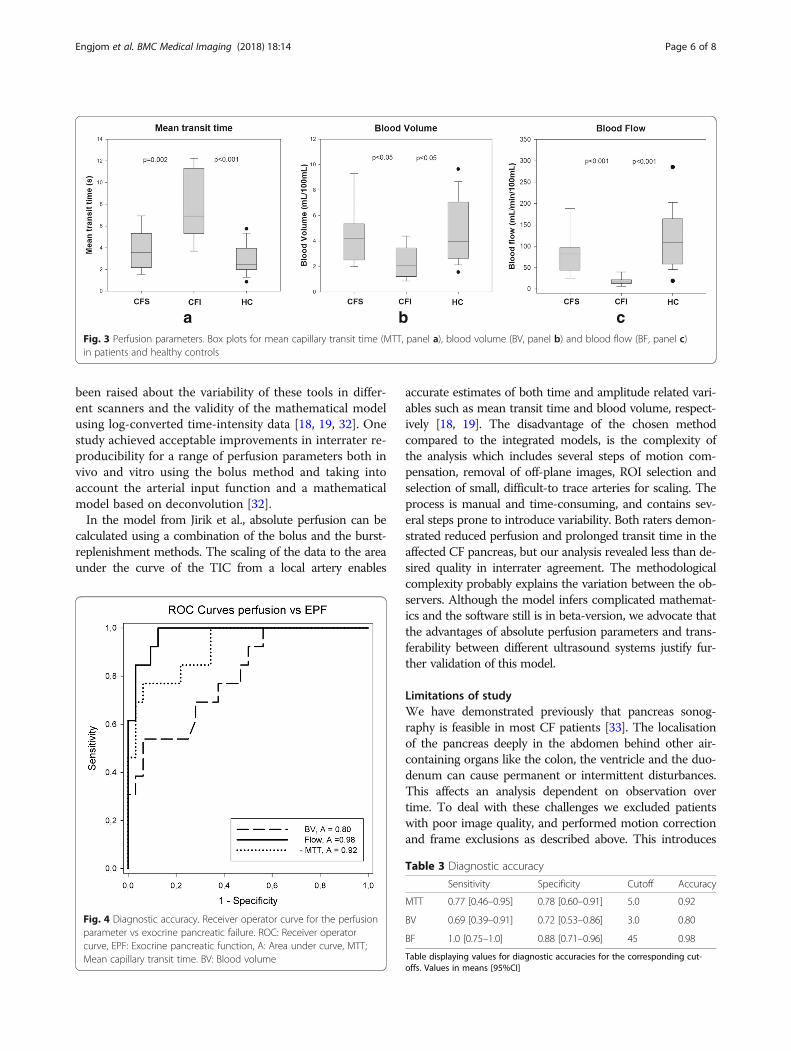
Diagnostic accuracyWe also calculated receiver operator curves (Fig. 4) ex-pressing the diagnostic quality of the three parametersin predicting exocrine pancreatic failure. Sensitivity andspecificity for the suggested cut-offs are displayed inTable 3.
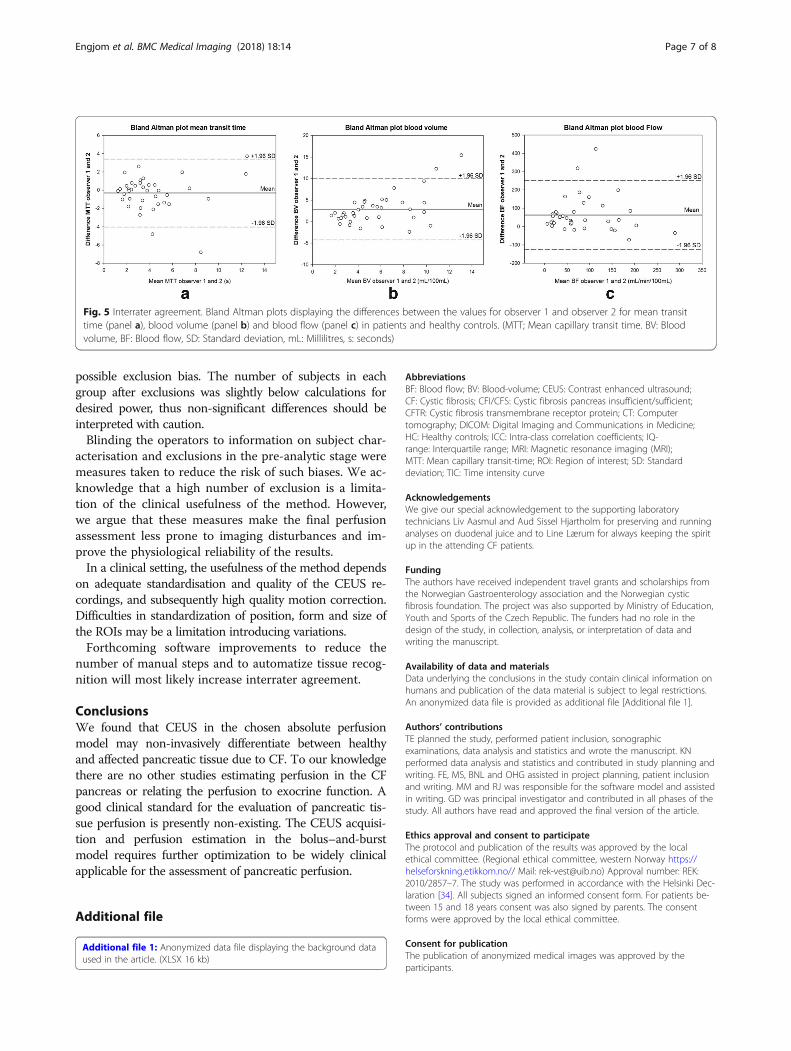
Interrater qualityThe parallel results from observer 1 and 2 were com-pared. The agreement for all values is presented asBland-Altman plots in Fig. 5. Inter-correlation
Fig. 2 Inclusion flow chart. The figure displays the inclusion flowchart and exclusions. CF: Cystic fibrosis. CFI/CFS: Cystic fibrosisinsufficient/ sufficient. HC: Healthy controls
Engjom et al. BMC Medical Imaging (2018) 18:14 Page 4 of 8

coefficient (ICC [95%CI]) was calculated for all three pa-rameters and demonstrated excellent agreement forMTT (ICC 0.78 [0.62, 0.88]) where the differences be-tween the observations were non-different from zeroand linear regression detected no bias through the rangeof MTT. For the two other parameters the agreementwas moderate (BV: ICC 0.44 [0.14, 0.67], BF: ICC 0.48[0.19, 0.69]. A single variable t-test demonstrated thatthe difference between the observed values for these pa-rameters differs from zero (p < 0.05), and linear regres-sion detected a fixed bias with a higher values in thecalculations from observer 2.
DiscussionWe calculated absolute pancreatic perfusion parametersusing the bolus-and-burst method applied on data fromcontrast-enhanced ultrasound of the pancreas in CF pa-tients and healthy controls. The results were related toexocrine pancreatic function. We demonstrate two mainfindings: First, we show that pancreatic perfusion in pan-creatic insufficient CF patients is reduced compared topancreatic sufficient patients and healthy controls. Sec-ondly we found that the reduced perfusion calculated inour absolute perfusion model in CF patients predicts exo-crine pancreatic insufficiency in CF with an acceptablediagnostic accuracy. Accordingly, CEUS with absolute per-fusion analysis in the bolus-and burst model may non-invasively differentiate between healthy pancreatic tissueand exocrine insufficient pancreatic tissue due to CF. Forthe inter-rater quality of the analysis process we find ex-cellent agreement for MTT, whereas the two other param-eters demonstrate a fixed bias between the raters.
Presently, this is the only study describing perfusionaspects in the CF pancreas. The CF pancreas was chosento evaluate the CEUS bolus-and-burst method due tothe clear and homogenous discrimination betweenhealthy and abnormal tissue. The exocrine function inour population was either normal or very low. This find-ing was distinctly reflected in the distribution of the bi-carbonate levels between individuals with a healthy oraffected pancreas. By the combination of faecal elastaseand endoscopic short test to define exocrine pancreaticfunction we provide a strict and accurate definition ofpancreas sufficiency [29]. Few results in the intermediaterange reduce the value of correlation studies betweenperfusion and exocrine function parameters. However,the perfusion parameters still demonstrate acceptablecorrelation to exocrine pancreatic function.The literature describing the vascularity of the affected
CF pancreas is lacking, but due to the described severefatty infiltration and progression towards atrophy, fibrosisand degeneration of normal anatomy [23], we assume thatthe vascular density in the pancreas is reduced. This hy-pothesis fits our findings where measured blood volumeand the calculated blood flow are reduced and the transittime is increased in the affected pancreas. The clinical ap-plication of this finding in CF diagnostics is possibly lim-ited, but the ability to differ between tissues with normaland reduced perfusion may be more relevant in other dis-eases. The clinical application of CEUS in the differentialdiagnostics of pancreatic tumours is already established[4]. Furthermore, particularly in chronic pancreatitis thegland may be focally destroyed due to obstructive causes.In this setting, the discrimination between vital tissue con-nected to recent changes and more irreversibly destroyedtissue due to longstanding changes could be relevant forthe therapeutic decision process.Contrast-enhanced ultrasound of the pancreas infers
several challenges both in image quality, reproducibilityand standardisation. In this study we exported the imagedata and used a non-integrated perfusion analysis toolinstead of the widespread integrated tools. The advan-tages of tools integrated in the scanners are better avail-ability and clinical feasibility. However, questions have
Table 1 Demographic data and exocrine function
CFI (n = 13) CFS (n = 12) HC (n = 20) p
Age 21 (16–52) * 21 (16–70)* 26 (18–66) *
Gender (♀/♂) 6 / 7 6 / 6 13 / 7
Body mass index 21 (19–23) 22 (21–25) 22 (20–25)
Sweat [Cl−] 113 (100–130) 72 (66–78) – ***
F-Elastase (μg/g) 0 (0–2) 571 (512–612) – ***
D-bicarbonate (meq/L) 11 (11–19) 118 (96–130) – ***
Values are expressed as medians (IQ range) unless otherwise stated (*Median (Range) (CFI/ CFS: Cystic fibrosis insufficient/ sufficient, HC: Healthy controls). *: <0.05, **: < 0.01, *** < 0.001)
Table 2 Perfusion parameters
CFI (n = 13) CFS (n = 12) HC (n = 21) p
MTT (s) 6.9 (5.3–11.3) 3.6 (2.2–5.3) 2.5 (2.0–4.0) **
BV (ml/100 mL) 2.1 (1.2–3.5) 4.2 (2.5–5.3) 3.9 (2.7–7.1) *
BF (ml/min/100 ml) 17 (13–22) 82 (44–97) 110 (59–165) ***
Values are expressed as median (IQ range). There is no difference betweenCFS and HC group. Concerning difference in BF for these two groups, thepower is below desired level
Engjom et al. BMC Medical Imaging (2018) 18:14 Page 5 of 8
been raised about the variability of these tools in differ-ent scanners and the validity of the mathematical modelusing log-converted time-intensity data [18, 19, 32]. Onestudy achieved acceptable improvements in interrater re-producibility for a range of perfusion parameters both invivo and vitro using the bolus method and taking intoaccount the arterial input function and a mathematicalmodel based on deconvolution [32].In the model from Jirik et al., absolute perfusion can be
calculated using a combination of the bolus and the burst-replenishment methods. The scaling of the data to the areaunder the curve of the TIC from a local artery enables
accurate estimates of both time and amplitude related vari-ables such as mean transit time and blood volume, respect-ively [18, 19]. The disadvantage of the chosen methodcompared to the integrated models, is the complexity ofthe analysis which includes several steps of motion com-pensation, removal of off-plane images, ROI selection andselection of small, difficult-to trace arteries for scaling. Theprocess is manual and time-consuming, and contains sev-eral steps prone to introduce variability. Both raters demon-strated reduced perfusion and prolonged transit time in theaffected CF pancreas, but our analysis revealed less than de-sired quality in interrater agreement. The methodologicalcomplexity probably explains the variation between the ob-servers. Although the model infers complicated mathemat-ics and the software still is in beta-version, we advocate thatthe advantages of absolute perfusion parameters and trans-ferability between different ultrasound systems justify fur-ther validation of this model.
Limitations of studyWe have demonstrated previously that pancreas sonog-raphy is feasible in most CF patients [33]. The localisationof the pancreas deeply in the abdomen behind other air-containing organs like the colon, the ventricle and the duo-denum can cause permanent or intermittent disturbances.This affects an analysis dependent on observation overtime. To deal with these challenges we excluded patientswith poor image quality, and performed motion correctionand frame exclusions as described above. This introduces
a b cFig. 3 Perfusion parameters. Box plots for mean capillary transit time (MTT, panel a), blood volume (BV, panel b) and blood flow (BF, panel c)in patients and healthy controls
Fig. 4 Diagnostic accuracy. Receiver operator curve for the perfusionparameter vs exocrine pancreatic failure. ROC: Receiver operatorcurve, EPF: Exocrine pancreatic function, A: Area under curve, MTT;Mean capillary transit time. BV: Blood volume
Table 3 Diagnostic accuracy
Sensitivity Specificity Cutoff Accuracy
MTT 0.77 [0.46–0.95] 0.78 [0.60–0.91] 5.0 0.92
BV 0.69 [0.39–0.91] 0.72 [0.53–0.86] 3.0 0.80
BF 1.0 [0.75–1.0] 0.88 [0.71–0.96] 45 0.98
Table displaying values for diagnostic accuracies for the corresponding cut-offs. Values in means [95%CI]
Engjom et al. BMC Medical Imaging (2018) 18:14 Page 6 of 8
possible exclusion bias. The number of subjects in eachgroup after exclusions was slightly below calculations fordesired power, thus non-significant differences should beinterpreted with caution.Blinding the operators to information on subject char-
acterisation and exclusions in the pre-analytic stage weremeasures taken to reduce the risk of such biases. We ac-knowledge that a high number of exclusion is a limita-tion of the clinical usefulness of the method. However,we argue that these measures make the final perfusionassessment less prone to imaging disturbances and im-prove the physiological reliability of the results.In a clinical setting, the usefulness of the method depends
on adequate standardisation and quality of the CEUS re-cordings, and subsequently high quality motion correction.Difficulties in standardization of position, form and size ofthe ROIs may be a limitation introducing variations.Forthcoming software improvements to reduce the
number of manual steps and to automatize tissue recog-nition will most likely increase interrater agreement.
ConclusionsWe found that CEUS in the chosen absolute perfusionmodel may non-invasively differentiate between healthyand affected pancreatic tissue due to CF. To our knowledgethere are no other studies estimating perfusion in the CFpancreas or relating the perfusion to exocrine function. Agood clinical standard for the evaluation of pancreatic tis-sue perfusion is presently non-existing. The CEUS acquisi-tion and perfusion estimation in the bolus–and-burstmodel requires further optimization to be widely clinicalapplicable for the assessment of pancreatic perfusion.
Additional file
Additional file 1: Anonymized data file displaying the background dataused in the article. (XLSX 16 kb)
AbbreviationsBF: Blood flow; BV: Blood-volume; CEUS: Contrast enhanced ultrasound;CF: Cystic fibrosis; CFI/CFS: Cystic fibrosis pancreas insufficient/sufficient;CFTR: Cystic fibrosis transmembrane receptor protein; CT: Computertomography; DICOM: Digital Imaging and Communications in Medicine;HC: Healthy controls; ICC: Intra-class correlation coefficients; IQ-range: Interquartile range; MRI: Magnetic resonance imaging (MRI);MTT: Mean capillary transit-time; ROI: Region of interest; SD: Standarddeviation; TIC: Time intensity curve
AcknowledgementsWe give our special acknowledgement to the supporting laboratorytechnicians Liv Aasmul and Aud Sissel Hjartholm for preserving and runninganalyses on duodenal juice and to Line Lærum for always keeping the spiritup in the attending CF patients.
FundingThe authors have received independent travel grants and scholarships fromthe Norwegian Gastroenterology association and the Norwegian cysticfibrosis foundation. The project was also supported by Ministry of Education,Youth and Sports of the Czech Republic. The funders had no role in thedesign of the study, in collection, analysis, or interpretation of data andwriting the manuscript.
Availability of data and materialsData underlying the conclusions in the study contain clinical information onhumans and publication of the data material is subject to legal restrictions.An anonymized data file is provided as additional file [Additional file 1].
Authors’ contributionsTE planned the study, performed patient inclusion, sonographicexaminations, data analysis and statistics and wrote the manuscript. KNperformed data analysis and statistics and contributed in study planning andwriting. FE, MS, BNL and OHG assisted in project planning, patient inclusionand writing. MM and RJ was responsible for the software model and assistedin writing. GD was principal investigator and contributed in all phases of thestudy. All authors have read and approved the final version of the article.
Ethics approval and consent to participateThe protocol and publication of the results was approved by the localethical committee. (Regional ethical committee, western Norway https://helseforskning.etikkom.no// Mail: [email protected]) Approval number: REK:2010/2857–7. The study was performed in accordance with the Helsinki Dec-laration [34]. All subjects signed an informed consent form. For patients be-tween 15 and 18 years consent was also signed by parents. The consentforms were approved by the local ethical committee.
Consent for publicationThe publication of anonymized medical images was approved by theparticipants.
Fig. 5 Interrater agreement. Bland Altman plots displaying the differences between the values for observer 1 and observer 2 for mean transittime (panel a), blood volume (panel b) and blood flow (panel c) in patients and healthy controls. (MTT; Mean capillary transit time. BV: Bloodvolume, BF: Blood flow, SD: Standard deviation, mL: Millilitres, s: seconds)
Engjom et al. BMC Medical Imaging (2018) 18:14 Page 7 of 8

Competing interestsThe authors declare that they have no competing interests.
Publisher’s NoteSpringer Nature remains neutral with regard to jurisdictional claims inpublished maps and institutional affiliations.
Author details1Department of Clinical Medicine, University of Bergen, Bergen, Norway.2Department of Medicine, National Centre for Ultrasound inGastroenterology, Haukeland University Hospital, 5021 Bergen, Norway.3Department of Medicine, Voss Hospital, Voss, Norway. 4Department ofClinical Science, University of Bergen, Bergen, Norway. 5LHL-clinics Bergen,Bergen, Norway. 6Department of Biomedical Engineering, Faculty of ElectricalEngineering and Communication, Brno University of Technology, Brno, CzechRepublic. 7Institute of Scientific Instruments of the Czech Academy ofSciences, Brno, Czech Republic.
Received: 2 July 2017 Accepted: 3 May 2018
References1. D'Onofrio M, Zamboni G, Faccioli N, Capelli P, Pozzi MR.
Ultrasonography of the pancreas. 4. Contrast-enhanced imaging.Abdom Imaging. 2007;32(2):171–81.
2. Kersting S, Konopke R, Kersting F, Volk A, Distler M, Bergert H, Saeger HD,Grutzmann R, Bunk A. Quantitative perfusion analysis of transabdominalcontrast-enhanced ultrasonography of pancreatic masses and carcinomas.Gastroenterology. 2009;137(6):1903–11.
3. Matsubara H, Itoh A, Kawashima H, Kasugai T, Ohno E, Ishikawa T, Itoh Y,Nakamura Y, Hiramatsu T, Nakamura M, et al. Dynamic quantitativeevaluation of contrast-enhanced endoscopic ultrasonography in thediagnosis of pancreatic diseases. Pancreas. 2011;40(7):1073–9.
4. Piscaglia F, Nolsoe C, Dietrich CF, Cosgrove DO, Gilja OH, Bachmann NM, AlbrechtT, Barozzi L, Bertolotto M, Catalano O, et al. The EFSUMB guidelines andrecommendations on the clinical practice of contrast enhanced ultrasound (CEUS):update 2011 on non-hepatic applications. Ultraschall Med. 2012;33(1):33–59.
5. Azemoto N, Kumagi T, Yokota T, Hirooka M, Kuroda T, Koizumi M, Ohno Y,Yamanishi H, Abe M, Onji M, et al. Utility of contrast-enhancedtransabdominal ultrasonography to diagnose early chronic pancreatitis.Biomed Res Int. 2015;2015:393124.
6. Delrue L, Blanckaert P, Mertens D, Van MS, Ceelen W, Duyck P. Tissueperfusion in pathologies of the pancreas: assessment using 128-slicecomputed tomography. Abdom Imaging. 2012;37(4):595–601.
7. Tsushima Y, Miyazaki M, Taketomi-Takahashi A, Endo K. Feasibility ofmeasuring human pancreatic perfusion in vivo using imaging techniques.Pancreas. 2011;40(5):747–52.
8. Bali MA, Metens T, Denolin V, De Maertelaer V, Deviere J, Matos C.Pancreatic perfusion: noninvasive quantitative assessment with dynamiccontrast-enhanced MR imaging without and with secretin stimulation inhealthy volunteers–initial results. Radiology. 2008;247(1):115–21.
9. Ishida H, Makino T, Kobayashi M, Tsuneoka K. Laparoscopic measurement ofpancreatic blood flow. Endoscopy. 1983;15(3):107–10.
10. Lewis MP, Lo SK, Reber PU, Patel A, Gloor B, Todd KE, Toyama MT, ShermanS, Ashley SW, Reber HA. Endoscopic measurement of pancreatic tissueperfusion in patients with chronic pancreatitis and control patients.Gastrointest Endosc. 2000;51(2):195–9.
11. Claudon M, Dietrich CF, Choi BI, Cosgrove DO, Kudo M, Nolsoe CP, Piscaglia F,Wilson SR, Barr RG, Chammas MC, et al. Guidelines and good clinical practicerecommendations for contrast enhanced ultrasound (CEUS) in the liver–update 2012: a WFUMB-EFSUMB initiative in cooperation with representativesof AFSUMB, AIUM, ASUM, FLAUS and ICUS. Ultraschall Med. 2013;34(1):11–29.
12. Nylund K, Jirik R, Mezl M, Leh S, Hausken T, Pfeffer F, Odegaard S, Taxt T,Gilja OH. Quantitative contrast-enhanced ultrasound comparison betweeninflammatory and fibrotic lesions in patients with Crohn's disease.Ultrasound Med Biol. 2013;39(7):1197–206.
13. Lassau N, Bonastre J, Kind M, Vilgrain V, Lacroix J, Cuinet M, Taieb S, Aziza R,Sarran A, Labbe-Devilliers C, et al. Validation of dynamic contrast-enhancedultrasound in predicting outcomes of antiangiogenic therapy for solidtumors: the French multicenter support for innovative and expensivetechniques study. Invest Radiol. 2014;49(12):794–800.
14. Saevik F, Nylund K, Hausken T, Odegaard S, Gilja OH. Bowel perfusion measuredwith dynamic contrast-enhanced ultrasound predicts treatment outcome inpatients with Crohn's disease. Inflamm Bowel Dis. 2014;20(11):2029-37.
15. D'Onofrio M, Canestrini S, Crosara S, De RR, Pozzi MR. Contrast enhancedultrasound with quantitative perfusion analysis for objective characterizationof pancreatic ductal adenocarcinoma: a feasibility study. World J Radiol.2014;6(3):31–5.
16. Fan Z, Li Y, Yan K, Wu W, Yin S, Yang W, Xing B, Li X, Zhang X. Applicationof contrast-enhanced ultrasound in the diagnosis of solid pancreaticlesions–a comparison of conventional ultrasound and contrast-enhancedCT. Eur J Radiol. 2013;82(9):1385–90.
17. Tranquart F, Mercier L, Frinking P, Gaud E, Arditi M. Perfusion quantificationin contrast-enhanced ultrasound (CEUS)–ready for research projects androutine clinical use. Ultraschall in der Medizin (Stuttgart, Germany : 1980).2012;33(Suppl 1):S31–8.
18. Jirik R, Nylund K, Taxt T, Mézl M, Hausken T, Harabi V, Kol R et al: Parametricultrasound perfusion analysis combining bolus tracking and replenishment.In: 2012 IEEE International Ultrasonics Symposium: 7–10 Oct. 2012 2012;2012: 1323–1326.
19. Jirik R, Nylund K, Gilja OH, Mezl M, Harabis V, Kolar R, Standara M, Taxt T.Ultrasound perfusion analysis combining bolus-tracking and burst-replenishment. IEEE Trans Ultrason Ferroelectr Freq Control. 2013;60(2):310–9.
20. Stangeland M, Engjom T, Mezl M, Jirik R, Gilja OH, Dimcevski G, Nylund K:Interobserver variation of the bolus-and-burst method for pancreaticperfusion with dynamic contrast-enhanced ultrasound. Ultrasound IntOpen 2017: 3 (3):E99-E106. doi: https://doi.org/10.1055/s-0043-110475.Epub 2017 Sep 12.
21. Durie PR, Forstner GG. Pathophysiology of the exocrine pancreas in cysticfibrosis. J R Soc Med. 1989;82(Suppl 16):2–10.
22. Kopelman H, Corey M, Gaskin K, Durie P, Weizman Z, Forstner G. Impairedchloride secretion, as well as bicarbonate secretion, underlies the fluid secretorydefect in the cystic fibrosis pancreas. Gastroenterology. 1988;95(2):349–55.
23. Kopito LE, Shwachman H. The pancreas in cystic fibrosis: chemicalcomposition and comparative morphology. Pediatr Res. 1976;10(8):742–9.
24. Pitkaranta P, Kivisaari L, Nordling S, Nuutinen P, Schroder T. Vascularchanges of pancreatic ducts and vessels in acute necrotizing, and in chronicpancreatitis in humans. Int J Pancreatol. 1991;8(1):13–22.
25. Farrell PM, Rosenstein BJ, White TB, Accurso FJ, Castellani C, Cutting GR,Durie PR, Legrys VA, Massie J, Parad RB, et al. Guidelines for diagnosis ofcystic fibrosis in newborns through older adults: Cystic Fibrosis Foundationconsensus report. J Pediatr. 2008;153(2):S4–S14.
26. Smyth AR, Bell SC, Bojcin S, Bryon M, Duff A, Flume P, Kashirskaya N, Munck A,Ratjen F, Schwarzenberg SJ, et al. European cystic fibrosis society standards ofcare: best practice guidelines. J Cystic Fibros. 2014;13(Suppl 1):S23–42.
27. Schafer S, Nylund K, Saevik F, Engjom T, Mezl M, Jirik R, Dimcevski G, Gilja OH,Tonnies K. Semi-automatic motion compensation of contrast-enhancedultrasound images from abdominal organs for perfusion analysis. Comput BiolMed. 2015;63:229–37. https://doi.org/10.1016/j.compbiomed.2014.09.014.Epub 2014 Oct 17
28. Urbaniak G PS: Research Randomizer (Version 4.0). computer softwareAvailable at: https://www.randomizer.org. Accessed 10 May 2018.
29. Engjom T, Erchinger F, Laerum BN, Tjora E, Aksnes L, Gilja OH, Dimcevski G.Diagnostic accuracy of a short endoscopic secretin test in patients withcystic fibrosis. Pancreas. 2015;44(8):1266–72.
30. Erchinger F, Engjom T, Tjora E, Hoem D, Hausken T, Gilja OH, Dimcevski G.Quantification of pancreatic function using a clinically feasible shortendoscopic secretin test. Pancreas. 2013;42(7):1101–6.
31. Landis J, Koch G. The measurement of observer agreement for categoricaldata. Biometrics. 1977;33:159–74.
32. Gauthier M, Tabarout F, Leguerney I, Polrot M, Pitre S, Peronneau P, LassauN. Assessment of quantitative perfusion parameters by dynamic contrast-enhanced sonography using a deconvolution method: an in vitro and invivo study. J Ultrasound Med. 2012;31(4):595–608.
33. Engjom T, Erchinger F, Laerum BN, Tjora E, Gilja OH, Dimcevski G.Ultrasound echo-intensity predicts severe pancreatic affection in cysticfibrosis patients. PLoS One. 2015;10(3):e0121121.
34. WMA general assembly 2015. World medical association declaration ofHelsinki. Ethical Principles for Medical Research Involving HumanSubjects. Available at: https://www.wma.net/policies-post/wma-declaration-of-helsinki-ethical-principles-for-medical-research-involving-human-subjects/. Accessed 16 June 2017.
Engjom et al. BMC Medical Imaging (2018) 18:14 Page 8 of 8