Embed Size (px)
Citation preview
1 EXS / P2-15
Contribution of ASDEX Upgrade to disruption studies for ITER
G. Pautasso, Y. Zhang(a), B. Reiter, L. Giannone, A. Herrmann, O. Kardaun, V.E. Lukash(b),M. Maraschek, Y. Nakamura(c), G.Sias(d), M. Sugihara(e) and the ASDEX Upgrade Team
Max-Planck-Institut f¨ur Plasmaphysik, EURATOM Association, D-85748 Garching, Germany(a) ASIPP, Hefei, China;(b) Kurchatov Institute, Moscow, Russia;(c) Japan Atomic EnergyAgency, Naka-shi, Ibaraki-ken, Japan;(d) University of Cagliari, Italy;(e) ITER InternationalTeam, ITER, CEA-Cadarache, Francee-mail contact of main author:[email protected]
1. IntroductionPlasma disruptions represent a hazard for the structural integrity of ITER, since they willgenerate runaway electrons, large mechanical forces and thermal loads. The contribution of theexisting tokamaks to ITER consists, firstly, in refining the characterization of these loads andtheir extrapolation, on the basis of physical models, and secondly, in learning to predict, avoidand mitigate disruptions. The ASDEX Upgrade (AUG) research program covers these specifictopics and this paper reports on significant progress made recently in these areas. For work ondisruption avoidance, not discussed in this contribution, the reader is referred to reference [1].
2. Halo currentThe halo current causes large electromagnetic forces and, from an engineering point of view, itsmagnitude and spatial distribution must be known for dimensioning the intercepted structures.
TP
F_m
3
2
1
max (I_h) / I_p
0.0 0.2 0.4
✱ mitigated
-- TPF*max(I_h/I_p) =0.75
▼ VDE
■ centered disr.
FIG. 1: TPFm versus max(Ih)=Ip;0 fordifferent types of disruptions
The analysis of the halo current evolution inAUG is of particular interest for the follow-ing reasons: The device is equipped with alarge number of detectors which allow the re-construction of the current profile on the di-vertors and on the heat shield in differenttoroidal sectors. AUG has always reportedhalo current magnitudes larger than those inother tokamaks ([2], [3]); the reasons for thisare still unknown. Moreover, the halo currentexhibits large toroidal asymmetries correlatedwith strong MHD activity. Kink modes are be-lieved to cause large asymmetries of the halocurrent [4] and to drive the large horizontalforces observed up to now only in JET [5] -[6]. At present, no physics-based model isavailable for the prediction of the amplitude
of these modes in ITER and any further understanding of their driving mechanism is valuable.The ITER specifications for the expected magnitude of the halo current and its degree oftoroidal asymmetry have been based up to now on data collected from several tokamaks andsummarized in the plot of the toroidal peaking factor,TPF , versus the maximum halo cur-rent fraction,max(Ih)=Ip;0 (see figure 64 of [2] and figure 42 of [3]). ThisTPF is, moreprecisely, taken at the time of the maximum halo current fraction; in this work we defineTPFm � TPF (tmax(Ih)=Ip;0). Currently, there is no physics based specification for the timehistory ofIh andTPF ; nevertheless, the information on the duration ofmax(Ih) andTPFm,that is on the impulse exerted, is required for the design of the mechanical structures, since theirdynamic response depends also on the load waveform. The data points in the aforementionedplot reach themax(Ih)=Ip;0 � TPFm = 0:75 boundary [2], which represents a challengingload for the mechanical design of the structures, if applied during the whole current quench.
2 EXS / P2-15
A self-consistent simulation of the whole vertical displacement (VD), following or preceding adisruption, is required to predict the halo current time history and detailed code benchmark isin progress (see section 3).
0
1
2
3
4
5
6
# 23349
2.275 2.280 2.285 2.290time (s)
-0.6
-0.4
-0.2
m
-20
-10
0
10
T/s
-0.06
-0.04
-0.02
0
z_curr (m)
dB_θ /dt [φ = 0]dB_θ /dt [φ = π]
I_p,0 = 0.8 MA
2.275 2.280 2.285 2.290time (s)
0.0
0.5
1.0
1.5
2.0 sector 4 sector 4 sector 10 sector 12 sector 14DUIoo
T
curr
ent /
tile
(kA
)
TPF(t)
I_h / 10 (A)5
max_i (I_i) / 10 (A)5
(a)
(b)
(c)
2.275 2.280 2.285 2.290time (s)
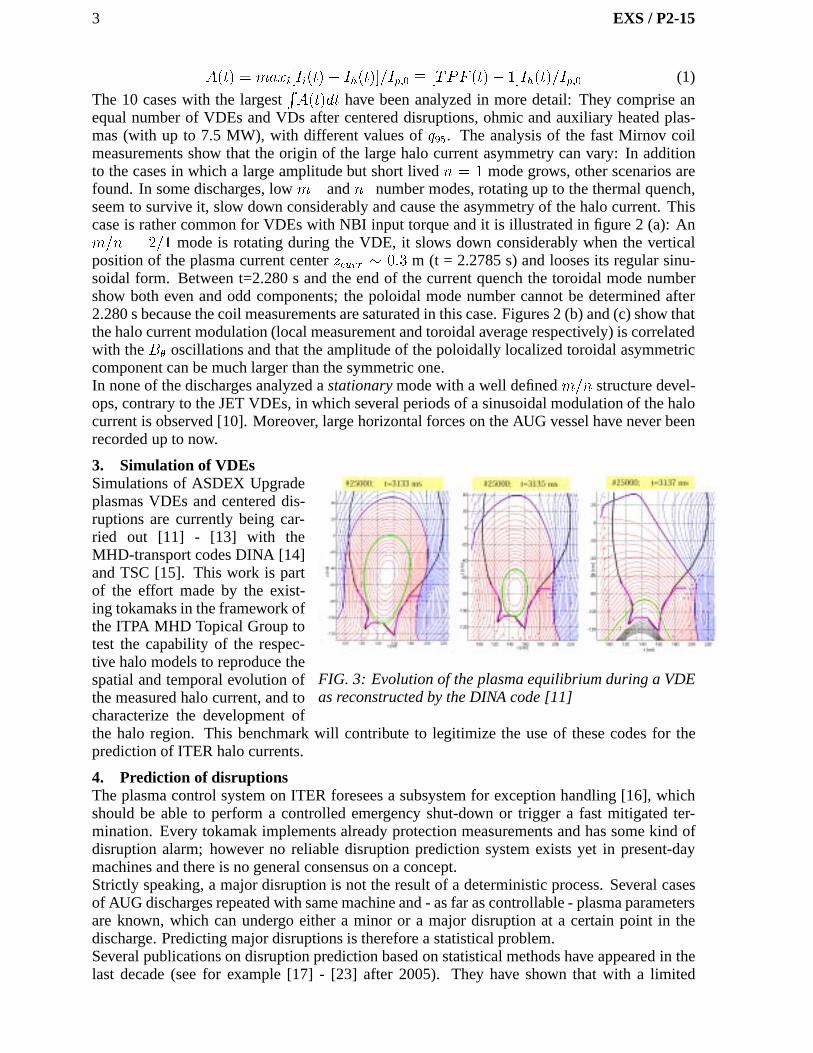
FIG. 2: Time traces of (a) plasma current (Ip),vertical position of the current center (zcurr),measurements from two Mirnov coils (dB�=dt)located at the same poloidal position (� = 0)in two sectors�� = � apart, (b) the toroidalpeaking factor (TPF ), the toroidally averagedhalo current (Ih), the maximum halo currentmeasured in a sector extrapolated to the 16 sec-tors (maxi(Ii)) and (c) the current per tile mea-sured by the DUIoo shunt array (upper part ofinner divertor plate) for a discharge with largeRA(t)dt
The value ofmax(Ih)=Ip;0 can reach 50% inAUG, as it is shown in figures 1, although themean of its statistical distribution amounts to27 % for unmitigated disruptions; mitigateddisruptions have a much lower halo current.VDEs and VDs following centered disrup-tions have a similar distribution density onthis figure. This happens because often thethermal quench of centered disruptions leavesresidual thermal energy in the plasma andthe fast decay of the current starts only laterwhen the plasma has displaced vertically andis limited by the divertor. This type of VDneeds to be considered as one of the ITERdisruption scenarios, since so far only the VDwith fast current quench after thermal quenchhas been examined [7]; in this case the VDoccurs at reduced plasma current and gener-ates a small fractionIh=Ip;0.Several discharges are close to themax(Ih)=Ip;0� TPFm = 0:75 boundary. In-dependently of where the discharge is locatedalong the boundary, the largemax(Ih)=Ip;0or/andTPFm last 0.2-0.4 ms, and they typ-ically coincide with the appearance of a largeperturbation of the magnetic configurationwith a toroidal mode numbern = 1. Then = 1 halo current structure survives fora few ms, it is generally locked or rotatesslowly with a frequency� 1 kHz, at most1.5 times around the torus. The rotation ismostly in the counter-Ip direction but caseswith co-Ip are also known.The difference between the highmax(Ih)=Ip;0 and the high TPFm datapoints along the boundary seems to be dueto the different amplitudes and rotation fre-quency of then = 1 halo current perturbationand its occurrence in time, with respect totmax(Ih)=Ip;0 . How this depends on the plasmaparameters is not known. If the current decayis faster than the shrinking of the plasmacross section (large safety factor) and stronginteraction with the plasma wall is missing,
such as after massive gas injection, then the strong MHD event is not visible and the halocurrent is toroidally symmetric.In order to find cases with long lasting asymmetries, the following asymmetry (A) factor hasbeen defined (following [8] and [9]) and calculated for the shots of the database:
3 EXS / P2-15
A(t) = maxi[Ii(t)� Ih(t)]=Ip;0 � [TPF (t)� 1]Ih(t)=Ip;0 (1)
The 10 cases with the largestRA(t)dt have been analyzed in more detail: They comprise an
equal number of VDEs and VDs after centered disruptions, ohmic and auxiliary heated plas-mas (with up to 7.5 MW), with different values ofq95. The analysis of the fast Mirnov coilmeasurements show that the origin of the large halo current asymmetry can vary: In additionto the cases in which a large amplitude but short livedn = 1 mode grows, other scenarios arefound. In some discharges, lowm� andn�number modes, rotating up to the thermal quench,seem to survive it, slow down considerably and cause the asymmetry of the halo current. Thiscase is rather common for VDEs with NBI input torque and it is illustrated in figure 2 (a): Anm=n = 2=1 mode is rotating during the VDE, it slows down considerably when the verticalposition of the plasma current centerzcurr � 0:3 m (t = 2.2785 s) and looses its regular sinu-soidal form. Between t=2.280 s and the end of the current quench the toroidal mode numbershow both even and odd components; the poloidal mode number cannot be determined after2.280 s because the coil measurements are saturated in this case. Figures 2 (b) and (c) show thatthe halo current modulation (local measurement and toroidal average respectively) is correlatedwith theB� oscillations and that the amplitude of the poloidally localized toroidal asymmetriccomponent can be much larger than the symmetric one.In none of the discharges analyzed astationarymode with a well definedm=n structure devel-ops, contrary to the JET VDEs, in which several periods of a sinusoidal modulation of the halocurrent is observed [10]. Moreover, large horizontal forces on the AUG vessel have never beenrecorded up to now.
3. Simulation of VDEs
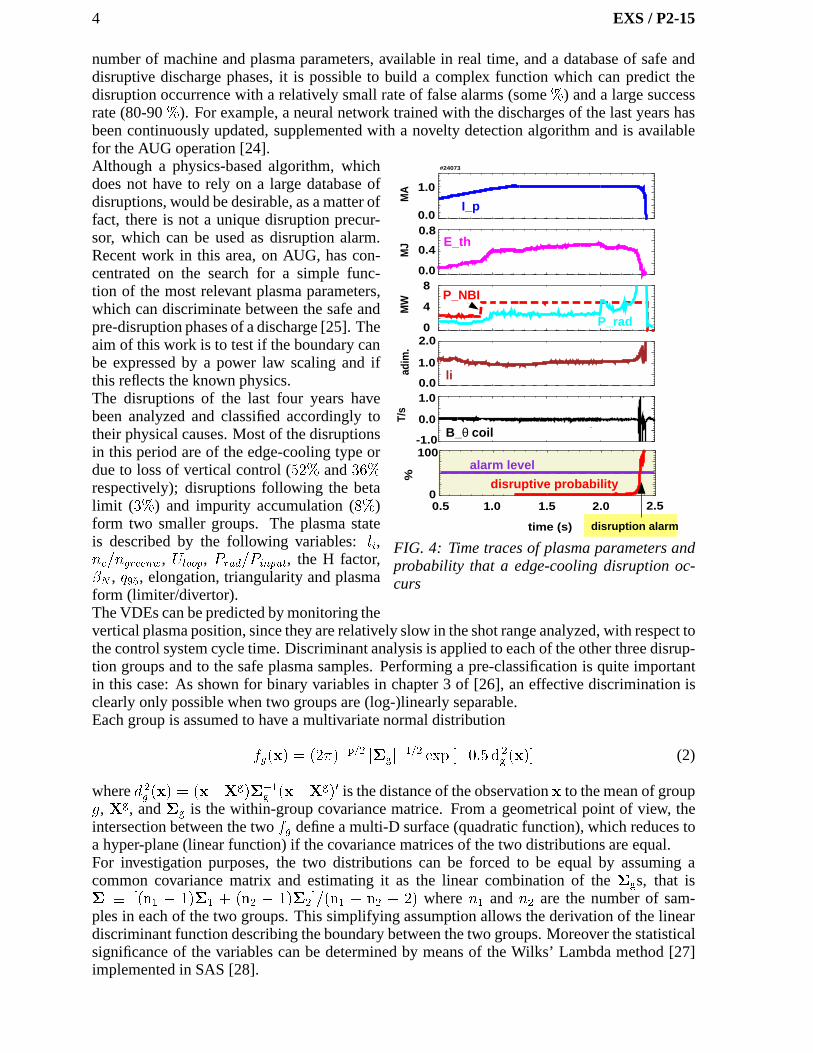
FIG. 3: Evolution of the plasma equilibrium during a VDEas reconstructed by the DINA code [11]
Simulations of ASDEX Upgradeplasmas VDEs and centered dis-ruptions are currently being car-ried out [11] - [13] with theMHD-transport codes DINA [14]and TSC [15]. This work is partof the effort made by the exist-ing tokamaks in the framework ofthe ITPA MHD Topical Group totest the capability of the respec-tive halo models to reproduce thespatial and temporal evolution ofthe measured halo current, and tocharacterize the development ofthe halo region. This benchmark will contribute to legitimize the use of these codes for theprediction of ITER halo currents.
4. Prediction of disruptionsThe plasma control system on ITER foresees a subsystem for exception handling [16], whichshould be able to perform a controlled emergency shut-down or trigger a fast mitigated ter-mination. Every tokamak implements already protection measurements and has some kind ofdisruption alarm; however no reliable disruption prediction system exists yet in present-daymachines and there is no general consensus on a concept.Strictly speaking, a major disruption is not the result of a deterministic process. Several casesof AUG discharges repeated with same machine and - as far as controllable - plasma parametersare known, which can undergo either a minor or a major disruption at a certain point in thedischarge. Predicting major disruptions is therefore a statistical problem.Several publications on disruption prediction based on statistical methods have appeared in thelast decade (see for example [17] - [23] after 2005). They have shown that with a limited
4 EXS / P2-15
number of machine and plasma parameters, available in real time, and a database of safe anddisruptive discharge phases, it is possible to build a complex function which can predict thedisruption occurrence with a relatively small rate of false alarms (some%) and a large successrate (80-90%). For example, a neural network trained with the discharges of the last years hasbeen continuously updated, supplemented with a novelty detection algorithm and is availablefor the AUG operation [24].
0.0
1.0
0.0
0.4
0.8
0
4
8
0.0
1.0
2.0
MA
MJ
MW
adim
.
-1.0
0.0
1.0 T/
s
#24073
0.5 1.0 1.5 2.0 2.5
time (s)
0
%
100
alarm level
disruptive probability
disruption alarm
I_p
E_th
P_NBI
P_rad
li
B_θ coil
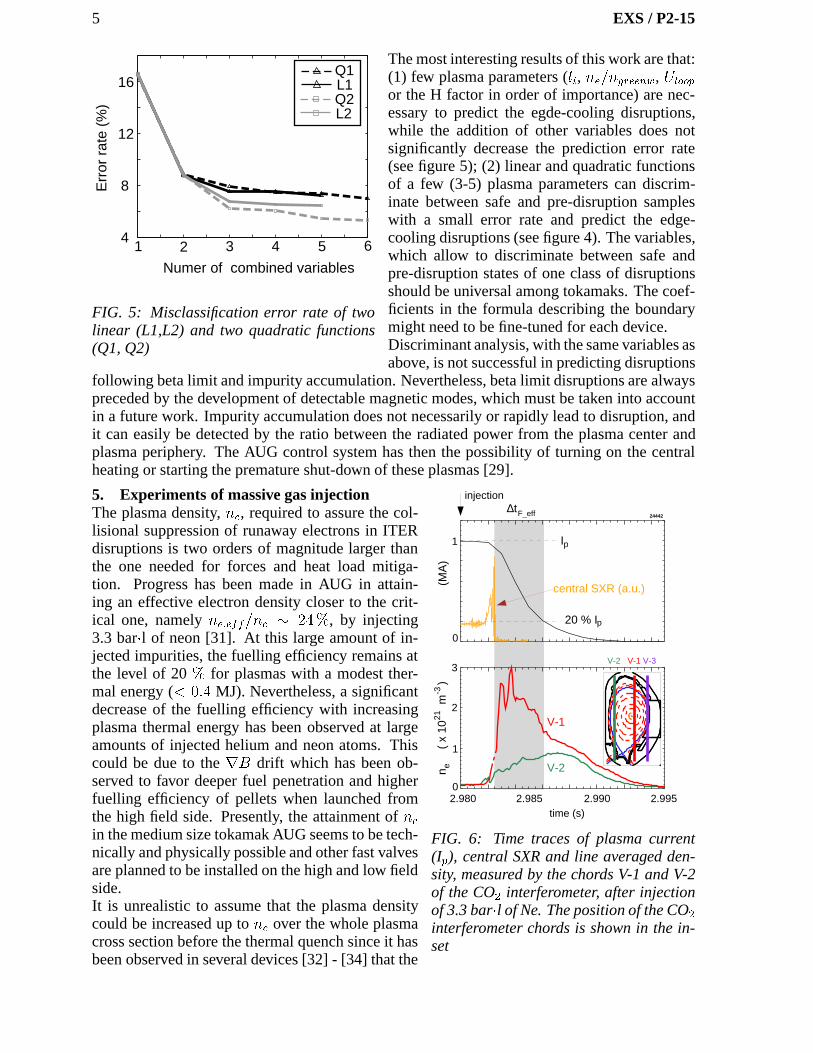
FIG. 4: Time traces of plasma parameters andprobability that a edge-cooling disruption oc-curs
Although a physics-based algorithm, whichdoes not have to rely on a large database ofdisruptions, would be desirable, as a matter offact, there is not a unique disruption precur-sor, which can be used as disruption alarm.Recent work in this area, on AUG, has con-centrated on the search for a simple func-tion of the most relevant plasma parameters,which can discriminate between the safe andpre-disruption phases of a discharge [25]. Theaim of this work is to test if the boundary canbe expressed by a power law scaling and ifthis reflects the known physics.The disruptions of the last four years havebeen analyzed and classified accordingly totheir physical causes. Most of the disruptionsin this period are of the edge-cooling type ordue to loss of vertical control (52% and36%respectively); disruptions following the betalimit (3%) and impurity accumulation (8%)form two smaller groups. The plasma stateis described by the following variables:li,ne=ngreenw, Uloop, Prad=Pinput, the H factor,�N , q95, elongation, triangularity and plasmaform (limiter/divertor).The VDEs can be predicted by monitoring thevertical plasma position, since they are relatively slow in the shot range analyzed, with respect tothe control system cycle time. Discriminant analysis is applied to each of the other three disrup-tion groups and to the safe plasma samples. Performing a pre-classification is quite importantin this case: As shown for binary variables in chapter 3 of [26], an effective discrimination isclearly only possible when two groups are (log-)linearly separable.Each group is assumed to have a multivariate normal distribution
fg(x) = (2�)�p=2 j�gj�1=2 exp [�0:5 d 2
g (x)] (2)
whered 2g (x) = (x�Xg)��1
g (x�Xg)0 is the distance of the observationx to the mean of groupg, Xg, and�g is the within-group covariance matrice. From a geometrical point of view, theintersection between the twofg define a multi-D surface (quadratic function), which reduces toa hyper-plane (linear function) if the covariance matrices of the two distributions are equal.For investigation purposes, the two distributions can be forced to be equal by assuming acommon covariance matrix and estimating it as the linear combination of the�gs, that is� � [(n1 � 1)�1 + (n2 � 1)�2]=(n1 + n2 � 2) wheren1 andn2 are the number of sam-ples in each of the two groups. This simplifying assumption allows the derivation of the lineardiscriminant function describing the boundary between the two groups. Moreover the statisticalsignificance of the variables can be determined by means of the Wilks’ Lambda method [27]implemented in SAS [28].
5 EXS / P2-15
1 2 3 4 5 64
8
12
16
Q1L1Q2L2
Numer of combined variables
Err
or r
ate
(%)
FIG. 5: Misclassification error rate of twolinear (L1,L2) and two quadratic functions(Q1, Q2)
The most interesting results of this work are that:(1) few plasma parameters (li, ne=ngreenw, Uloop
or the H factor in order of importance) are nec-essary to predict the egde-cooling disruptions,while the addition of other variables does notsignificantly decrease the prediction error rate(see figure 5); (2) linear and quadratic functionsof a few (3-5) plasma parameters can discrim-inate between safe and pre-disruption sampleswith a small error rate and predict the edge-cooling disruptions (see figure 4). The variables,which allow to discriminate between safe andpre-disruption states of one class of disruptionsshould be universal among tokamaks. The coef-ficients in the formula describing the boundarymight need to be fine-tuned for each device.Discriminant analysis, with the same variables asabove, is not successful in predicting disruptions
following beta limit and impurity accumulation. Nevertheless, beta limit disruptions are alwayspreceded by the development of detectable magnetic modes, which must be taken into accountin a future work. Impurity accumulation does not necessarily or rapidly lead to disruption, andit can easily be detected by the ratio between the radiated power from the plasma center andplasma periphery. The AUG control system has then the possibility of turning on the centralheating or starting the premature shut-down of these plasmas [29].
5. Experiments of massive gas injection
0
1
24442
2.980 2.985 2.990 2.995time (s)
0
2
3
V-1
V-2
I
20 % I
central SXR (a.u.)(MA
)
p
p
∆tF_eff
1
n
( x
10
m
)
-
3
21
e
V-2 V-1 V-3
injection
FIG. 6: Time traces of plasma current(Ip), central SXR and line averaged den-sity, measured by the chords V-1 and V-2of the CO2 interferometer, after injectionof 3.3 bar�l of Ne. The position of the CO2interferometer chords is shown in the in-set
The plasma density,nc, required to assure the col-lisional suppression of runaway electrons in ITERdisruptions is two orders of magnitude larger thanthe one needed for forces and heat load mitiga-tion. Progress has been made in AUG in attain-ing an effective electron density closer to the crit-ical one, namelyne;eff=nc � 24%, by injecting3.3 bar�l of neon [31]. At this large amount of in-jected impurities, the fuelling efficiency remains atthe level of 20% for plasmas with a modest ther-mal energy (< 0:4 MJ). Nevertheless, a significantdecrease of the fuelling efficiency with increasingplasma thermal energy has been observed at largeamounts of injected helium and neon atoms. Thiscould be due to therB drift which has been ob-served to favor deeper fuel penetration and higherfuelling efficiency of pellets when launched fromthe high field side. Presently, the attainment ofncin the medium size tokamak AUG seems to be tech-nically and physically possible and other fast valvesare planned to be installed on the high and low fieldside.It is unrealistic to assume that the plasma densitycould be increased up tonc over the whole plasmacross section before the thermal quench since it hasbeen observed in several devices [32] - [34] that the
6 EXS / P2-15
thermal quench is triggered when the impurity bulk has reached a flux surface withq � 2.Nevertheless, this does not exclude a-priori that MGI can be used for runaway suppression pro-viding that the core density increases after the thermal quench fast enough to stop the runawayelectrons and their generation in the plasma center. Measurements indicate that during the ther-mal quench the mobility of the impurities increases radially and toroidally, and that during thecurrent quench strong radiation is localized at or close to the plasma core. Nevertheless, nocode can presently simulate the complex MHD and transport phenomena triggered by MGI andpredict the redistribution of the impurity ions in a plasma.
1
0
23254
I (MA)
E (MJ)
0
5
V-3
4.80 4.81 4.82 4.83 4.84time (s)
V-2
V-1
-15
0
15
dB/d
t (T
/s) =pol. coils ∆ϕ π
I II
p
th
0
10
20∫ n
dl
( x
10
m )
e-2
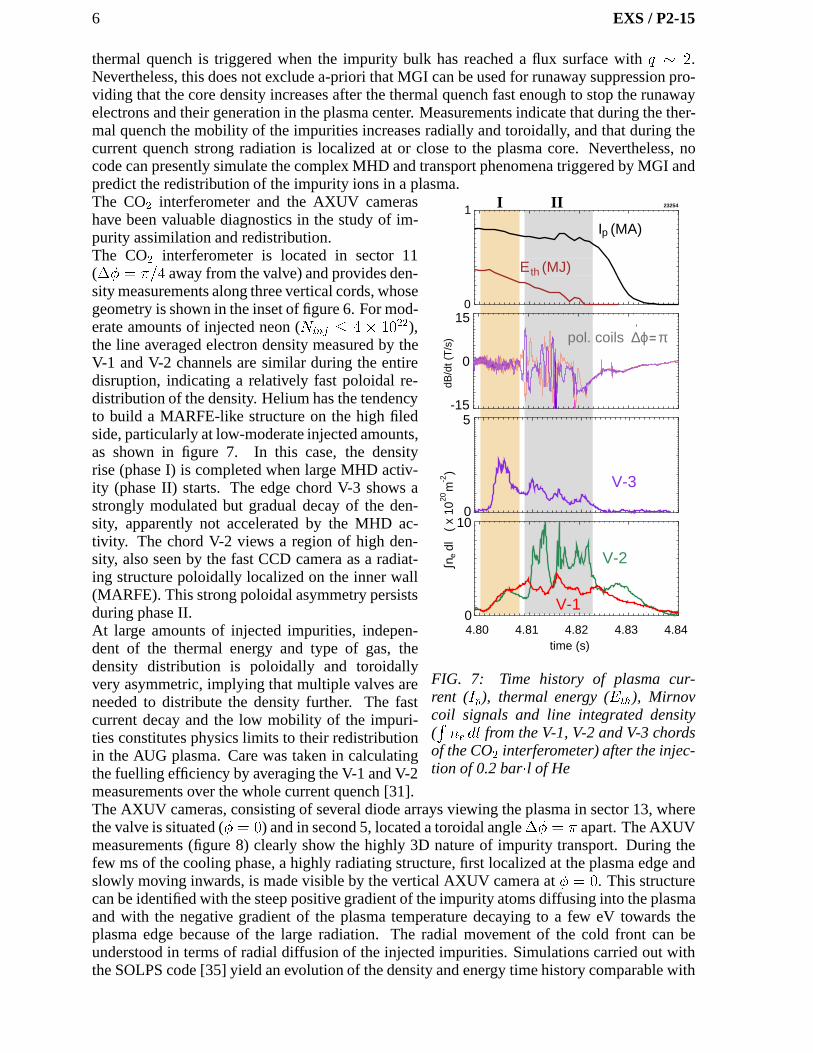
FIG. 7: Time history of plasma cur-rent (Ip), thermal energy (Eth), Mirnovcoil signals and line integrated density(Rne dl from the V-1, V-2 and V-3 chords
of the CO2 interferometer) after the injec-tion of 0.2 bar�l of He
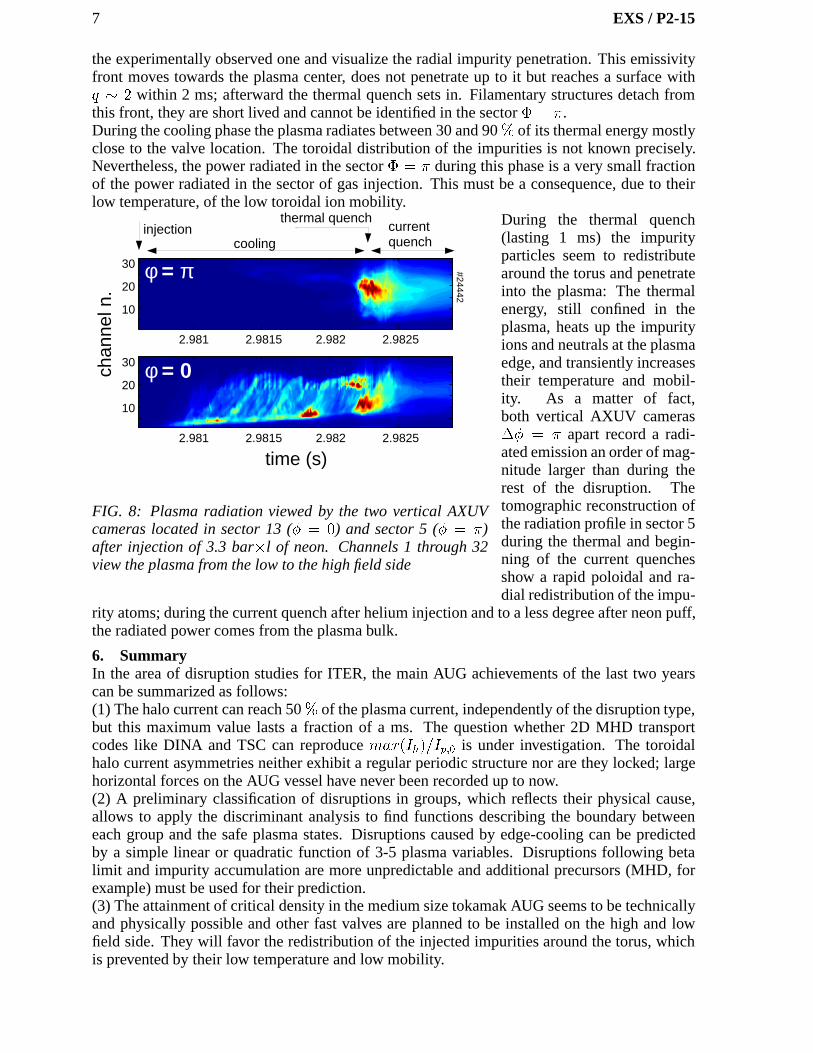
The CO2 interferometer and the AXUV camerashave been valuable diagnostics in the study of im-purity assimilation and redistribution.The CO2 interferometer is located in sector 11(�� = �=4 away from the valve) and provides den-sity measurements along three vertical cords, whosegeometry is shown in the inset of figure 6. For mod-erate amounts of injected neon (Ninj � 4 � 1022),the line averaged electron density measured by theV-1 and V-2 channels are similar during the entiredisruption, indicating a relatively fast poloidal re-distribution of the density. Helium has the tendencyto build a MARFE-like structure on the high filedside, particularly at low-moderate injected amounts,as shown in figure 7. In this case, the densityrise (phase I) is completed when large MHD activ-ity (phase II) starts. The edge chord V-3 shows astrongly modulated but gradual decay of the den-sity, apparently not accelerated by the MHD ac-tivity. The chord V-2 views a region of high den-sity, also seen by the fast CCD camera as a radiat-ing structure poloidally localized on the inner wall(MARFE). This strong poloidal asymmetry persistsduring phase II.At large amounts of injected impurities, indepen-dent of the thermal energy and type of gas, thedensity distribution is poloidally and toroidallyvery asymmetric, implying that multiple valves areneeded to distribute the density further. The fastcurrent decay and the low mobility of the impuri-ties constitutes physics limits to their redistributionin the AUG plasma. Care was taken in calculatingthe fuelling efficiency by averaging the V-1 and V-2measurements over the whole current quench [31].The AXUV cameras, consisting of several diode arrays viewing the plasma in sector 13, wherethe valve is situated (� = 0) and in second 5, located a toroidal angle�� = � apart. The AXUVmeasurements (figure 8) clearly show the highly 3D nature of impurity transport. During thefew ms of the cooling phase, a highly radiating structure, first localized at the plasma edge andslowly moving inwards, is made visible by the vertical AXUV camera at� = 0. This structurecan be identified with the steep positive gradient of the impurity atoms diffusing into the plasmaand with the negative gradient of the plasma temperature decaying to a few eV towards theplasma edge because of the large radiation. The radial movement of the cold front can beunderstood in terms of radial diffusion of the injected impurities. Simulations carried out withthe SOLPS code [35] yield an evolution of the density and energy time history comparable with
7 EXS / P2-15
the experimentally observed one and visualize the radial impurity penetration. This emissivityfront moves towards the plasma center, does not penetrate up to it but reaches a surface withq � 2 within 2 ms; afterward the thermal quench sets in. Filamentary structures detach fromthis front, they are short lived and cannot be identified in the sector� = �.During the cooling phase the plasma radiates between 30 and 90% of its thermal energy mostlyclose to the valve location. The toroidal distribution of the impurities is not known precisely.Nevertheless, the power radiated in the sector� = � during this phase is a very small fractionof the power radiated in the sector of gas injection. This must be a consequence, due to theirlow temperature, of the low toroidal ion mobility.
2.981 2.9815 2.982 2.9825
10
20
30
2.981 2.9815 2.982 2.9825
10
20
30
time (s)
chan
nel n
.
φ = π
φ = 0
injectioncooling
currentquench
thermal quench
#24442
FIG. 8: Plasma radiation viewed by the two vertical AXUVcameras located in sector 13 (� = 0) and sector 5 (� = �)after injection of 3.3 bar�l of neon. Channels 1 through 32view the plasma from the low to the high field side
During the thermal quench(lasting 1 ms) the impurityparticles seem to redistributearound the torus and penetrateinto the plasma: The thermalenergy, still confined in theplasma, heats up the impurityions and neutrals at the plasmaedge, and transiently increasestheir temperature and mobil-ity. As a matter of fact,both vertical AXUV cameras�� = � apart record a radi-ated emission an order of mag-nitude larger than during therest of the disruption. Thetomographic reconstruction ofthe radiation profile in sector 5during the thermal and begin-ning of the current quenchesshow a rapid poloidal and ra-dial redistribution of the impu-
rity atoms; during the current quench after helium injection and to a less degree after neon puff,the radiated power comes from the plasma bulk.
6. SummaryIn the area of disruption studies for ITER, the main AUG achievements of the last two yearscan be summarized as follows:(1) The halo current can reach 50% of the plasma current, independently of the disruption type,but this maximum value lasts a fraction of a ms. The question whether 2D MHD transportcodes like DINA and TSC can reproducemax(Ih)=Ip;0 is under investigation. The toroidalhalo current asymmetries neither exhibit a regular periodic structure nor are they locked; largehorizontal forces on the AUG vessel have never been recorded up to now.(2) A preliminary classification of disruptions in groups, which reflects their physical cause,allows to apply the discriminant analysis to find functions describing the boundary betweeneach group and the safe plasma states. Disruptions caused by edge-cooling can be predictedby a simple linear or quadratic function of 3-5 plasma variables. Disruptions following betalimit and impurity accumulation are more unpredictable and additional precursors (MHD, forexample) must be used for their prediction.(3) The attainment of critical density in the medium size tokamak AUG seems to be technicallyand physically possible and other fast valves are planned to be installed on the high and lowfield side. They will favor the redistribution of the injected impurities around the torus, whichis prevented by their low temperature and low mobility.
8 EXS / P2-15
References
[1] B. Esposito et al., contribution EXW/10-2Ra, this conference[2] ITER Physics Expert Group on Disruptions, Plasma Control, MHD and ITER Physics
Basis Editors, Nucl. Fusion39 (1999) 225[3] T.C. Hender et al., Nuclear Fusion47 (2007) 128-202[4] N. Pomphrey et al., Nuclear Fusion38 (1998) 449-466[5] L.E. Zakharov, Physics of Plasma15 (2008) 062507[6] P. Noll et al., in Proceedings of the 19th Symposium on Fusion Technology, Lisbon, edited
by C. Varandas and F. Serra (Elsevier, Amsterdam, 1996), Vol. 1, p. 751[7] G. Sannazzaro et al.,Structural load specification for ITER tokamak components,Sympo-
sium on Fusion Engineering, 23rd IEEE/NPSS (1-5 June 2009) San Diego, USA[8] S.N. Gerasimov et al., contribution P4.121, 37th EPS Conference on Plasma Physics and
Controlled Fusion (21-25 Jun 2010), Dublin, Ireland[9] T. Hender’s private communication
[10] V. Riccardo et al., contribution I5.118, 37th EPS Conference on Plasma Physics and Con-trolled Fusion (21-25 Jun 2010), Dublin, Ireland, to be published in PPCF
[11] V.E. Lukash et al., contribution P4.140, 37th EPS Conference on Plasma Physics andControlled Fusion (21-25 Jun 2010), Dublin, Ireland
[12] Y. Nakamura et al., contribution P2.184, 37th EPS Conference on Plasma Physics andControlled Fusion (21-25 Jun 2010), Dublin, Ireland
[13] L. Bandyopadhyay et al., contribution ITR/P1-16, this conference[14] R.R. Khayrutdinov and V.E. Lukash, J. Comput. Physics109(1993) 193-201[15] S.C. Jardin et al., J. Comp. Physics66 (1986) 481[16] J.A. Snipes et al., Fusion Engineering and Design85 (July 2010) 461-465[17] B. Cannas et al., Nuclear Fusion46 (2006) 699[18] B. Cannas et al., Nuclear Fusion47 (2007) 1559[19] Wang Hao et al., Chinese Physics,16 (12)(2007) 3738-04[20] A. Murari et al., Nuclear Fusion49 (2009) 055028[21] G.A. Ratta‘ et al., Nuclear Fusion50 (2010) 025005[22] B. Cannas et al., Nuclear Fusion50 (2010) 075004[23] A. Murari et al., Nuclear Fusion50 (2010) 05500[24] B. Cannas et al., 27th SOFT (27 Sep - 1 Oct 2010), Porto, Portugal[25] Y. Zhang et al., contribution P2.194, 37th EPS Conference on Plasma Physics and Con-
trolled Fusion (21-25 Jun 2010), Dublin, Ireland[26] C.M. Bishop,Neural Networks for Pattern Recognition,(1995) Clarendon Press, Oxford[27] A.M. Kshirsagar,Multivariate analysis,(1972) Marcel Dekker Inc., New York and Basel[28] SAS Institute Inc., Cary, NC, USA. SAS/STAT 9.2 User’s Guide, Second Edition, 2009,
procedures REG and DISCRIM[29] A. Kallenbach et al., Nuclear Fusion49 (2009) 045007[30] T.C. Hender et al., Nuclear Fusion47 (2007) 128-202[31] G. Pautasso et al, Plasma Physics and Control Fusion51 (2009) 124056[32] E. Hollman et al., Phys. Plasmas14 (2007) 012502[33] C. Reux et al., Nuclear Fusion50 (2010) 095006[34] B. Reiter, PhD Thesis presented at the Faculty of Physics, Ludwig-Maximilians-
Universitat, Munich, 21.5.2010[35] G. Pautasso et al., contribution EX/P9-1, Proc. of the 22nt IAEA Conference Fusion En-
ergy, Geneva, Switzerland, (October 2008 (IAEA, Vienna), Vol. IAEA-CN-165 (2008)