Embed Size (px)
Citation preview
Contribution of L-band SAR to systematic globalmangrove monitoring
Richard LucasA,M, Lisa-Maria RebeloB, Lola FatoyinboC,Ake RosenqvistD, Takuya ItohE, Masanobu ShimadaF, Marc SimardG,Pedro Walfir Souza-FilhoH, Nathan ThomasA, Carl Trettin I,Arnon Accad J, Joao CarreirasK and Lammert HilaridesL
ACentre for Ecosystem Science, The University of New South Wales,
High Street, Kensington, NSW 2052, Australia.BInternational Water Management Institute, Regional Office for Southeast Asia
and the Mekong, PO Box 4199, Vientiane, Lao People’s Democratic Republic.CBiospheric Sciences Laboratory, Code 618, NASA Goddard Space Flight Center,
8800 Greenbelt Road, Greenbelt, MD 20771, USA.DSolo Earth Observation (soloEO), TTT Mid-Tower 5006, Kachidoki 6-3-2,
Chuo-ku,Tokyo 104-0054, Japan.ERemote Sensing Technology Center of Japan (RESTEC), Roppongi First Building 12F,
1-9-9 Roppongi, Minato-ku, Tokyo 106-0032, Japan.FJapan Aerospace Exploration Agency, Earth Observation Research Center,
Sengen 2-1-1 Tsukuba Ibaraki, 305-8505, Japan.GJet Propulsion Laboratory, MS 300-319D, 4800 Oak Grove Drive,
Pasadena, California (CA 90039), USA.HUniversidade Federal do Para Instituto de Geociencias, Av. Augusto Correa 1,
Caixa Postal 8608, CEP. 66075-110, Belem, Para, Brasil; and Vale Institute of Tecnology,
Rua Boaventura da Silva 955, 66055-090, Belem, Brazil.ICenter for Forested Wetlands Research, US Forest Service, Southern Research Station,
3734 Hwy 402, Cordesville, SC 29434, USA.JQueensland Herbarium, Department of Science, Information Technology, Innovation and the
Arts, Brisbane Botanic Gardens, Mt Coot-tha, Mt Coot-tha Road, Toowong, Qld 4066, Australia.KTropical Research Institute, Travessa do Conde da Ribeira, 9, 1400-142, Lisbon, Portugal.LWetlands International, PO Box 471, 6700 AL, Wageningen, The Netherlands.MCorresponding author. Email: [email protected]
Abstract. Information on the status of and changes in mangroves is required for national and international policydevelopment, implementation and evaluation. To support these requirements, a component of the Japan AerospaceExploration Agency’s (JAXA) Kyoto and Carbon (K&C) initiative has been to design and develop capability for a Global
Mangrove Watch (GMW) that routinely monitors and reports on local to global changes in the extent of mangroves,primarily on the basis of observations by Japanese L-band synthetic aperture radar (SAR). The GMW aims are as follows:(1) tomap progression of changewithin or from existing (e.g. Landsat-derived) global baselines of the extent ofmangrovesby comparing advanced land-observing satellite 2 (ALOS-2) phased array L-band SAR 2 (PALSAR-2) data from 2014
with that acquired by the Japanese earth resources satellite (JERS-1) SAR (1992–1998) andALOSPALSAR (2006–2011);(2) to quantify changes in the structure and associated losses and gains of carbon on the basis of canopy height and above-ground biomass (AGB) estimated from the shuttle radar topographic mission (SRTM; acquired 2000), the ice, cloud and
land-elevation satellite (ICESAT) geoscience laser altimeter system (GLAS; 2003–2010) and L-band backscatter data;(3) to determine likely losses and gains of tree species diversity through reference to International Union for theConservation of Nature (IUCN) global thematic layers on the distribution of mangrove species; and (4) to validate maps of
changes in the extent ofmangroves, primarily through comparisonwith dense time-series of Landsat sensor data and to usethese same data to describe the causes and consequences of change. The paper outlines and justifies the techniques beingimplemented and the role that theGMWmight play in supporting national and international policies that relate specifically
to the long-term conservation of mangrove ecosystems and the services they provide to society.
CSIRO PUBLISHING
Marine and Freshwater Research, 2014, 65, 589–603
http://dx.doi.org/10.1071/MF13177
Journal compilation � CSIRO 2014 www.publish.csiro.au/journals/mfr
RESEARCH FRONT
Additional keywords: climate change, forest dynamics, international conventions, remote sensing.
Received 5 July 2013, accepted 23 January 2014, published online 20 June 2014
Introduction
Mangroves are located primarily in the intertidal zones of the
tropics and subtropics where they provide valuable resourcesfor local populations, harbour a diverse fauna and flora, offercoastal protection and store substantive amounts of carbon(Glaser 2003; Mumby 2006; Alongi 2008; Donato et al. 2011).
Despite their importance in ecosystem service provision,extensive areas have been cleared to support commercial ven-tures such as aquaculture, annual crops (e.g. swamp rice) and
tree crops, with annual rates of loss averaging 0.8% since 1970(Butchart et al. 2010). Mangroves are also responding to coastalchange that is human-induced, natural and/or influenced by
climatic fluctuation. However, the extent of these differentevents and processes and their causes and consequences remainlargely unknown at a global level because no systematicmapping depicting changes in mangroves has historically, or is
currently, taking place.For several decades, remote-sensing data from both airborne
and spaceborne sensors have been available to provide some
capacity for observing and quantifying changes in mangrovesacross the required range of scales, although their use formonitoring has been limited. At the local and site level, aerial
photography and very high-resolution (VHR) optical space-borne (e.g. Quickbird, Worldview) data provide a large amountof detail for establishing baseline maps of the extent of man-
groves, but spatial coverage is limited and acquisitions are oftennot repeated (Proisy et al. 2007; Neukermans et al. 2008; Wanget al. 2004, 2008). For regional-scale assessments, the moderatespatial resolution optical (e.g. Landsat, SPOT, ASTER) data are
better placed (Spalding et al. 1997, 2010; Giri et al. 2011).However, routine detection of change has proved difficult inmany tropical and subtropical regions where mangroves occur,
largely because the persistence of cloud cover prevents regularobservations. Increasingly, this restriction is being overcome byexploiting the dense Landsat sensor time series, which has led to
a plethora of techniques (e.g. pixel mining; Zhu and Woodcock2012) for increasing the number of cloud-free observationsand, hence, mapping capability. Others (e.g. Souza-Filho andParadella 2003; Nascimento et al. 2013) have instead exploited
synthetic aperture radar (SAR) acquired at various frequenciesand polarisations, either singularly or in combination withoptical data, because these allow observations regardless of
weather and illumination conditions.Spaceborne SAR with capability for monitoring at global
levels and with historical archives are the European Space
Agency’s (ESA) European remote-sensing (ERS) satellite-1(1991–2000) and -2 (1995–2011) advanced microwave instru-ment (AMI) and ENVISAT advanced SAR (2002–2012) and
the Canadian Space Agency’s (CSA) RADARSAT-1 (1995–2013) and -2 (2007–present), all of which operated at C-band.ESA’s Sentinel-1 SAR will continue observations at C-bandfrom 2014. The German Space Agency (DLR) successfully
instigated the Tandem-X mission (in 2010; encompassing the
TerraSAR-X; launched 2007) and the Italian COSMO-SkyMed(a constellation of four satellites, with the last launched in 2010)
is also providing X-band SAR data. The limitation of usingthe X- and C-band data from sensors operating in the past,however, has been that the global acquisitions have not beensystematic over the period of operation; access has, until recen-
tly, been limited by availability and cost, and retrieval of thethree-dimensional structure of forests (through polarimetry andinterferometry) is generally restricted to the upper canopy. The
most useful of these sensors formangrovemonitoring is arguablythe TanDEM-Xmission, because the global DEMs derived fromthese data (without the canopy removed) are anticipated to
provide information on mangrove canopy height across theirrange. By comparing canopy heights from the TanDEM-Xmission (following release in 2014) with those generated usingthe 2000 shuttle radar topographic mission (SRTM), changes in
height should reflect changes in mangrove structure.The primary L-band sensors operating at a global level
have been the Japan Aerospace Exploration Agency’s (JAXA)
Japanese earth resources satellite (JERS-1) SAR and theadvanced land-observing satellite (ALOS) phased array L-bandSAR (PALSAR), which were in operations from 1992 to 1998
and from 2006 to 2011, respectively (Shimada and Ohtaki 2010;Shimada et al. 2010). Both JERS-1 SAR and ALOS PALSARfeatured systematic acquisition strategies that provided consis-
tent pantropical (JERS-1) and global (ALOS) L-band SARcoverages on an annual basis (Rosenqvist et al. 2000, 2007a).The ALOS-2 PALSAR-2 is their successor and was launchedin 2014, from which observations of the coastal tropics and
subtropics will continue on from those obtained during theprevious two decades. The benefits of these sensors formangrove monitoring are (1) that consistent, systematic and
cloud-free observations across their geographical range will becontinued over three decades and (2) their greater sensitivity tothe three-dimensional woody components of mangroves, which
allows the above-ground biomass (AGB) and structure to beretrieved (Lucas et al. 2007).
Given the known capabilities of Japanese SAR for mangrovemonitoring (Lucas et al. 2007), a component of JAXA’s Kyoto
and Carbon (K&C) initiative (Rosenqvist et al. 2010) has beento develop capability for a Global Mangrove Watch (GMW;JAXA 2013), primarily using Japanese L-band SAR data.
During early activities within the GMW, historical JERS-1SAR and ALOS PALSAR data have been used to updateLandsat-based baseline maps (by e.g. Giri et al. 2011 of the
extent of mangroves for several years (mid-1990s, 2007, 2008,2009 and 2010) against which future change observed by theALOS-2 PALSAR-2 can be quantified. Furthermore, within the
mapped areas, baseline measures of structure and AGB gener-ated using historical interferometric radar and lidar data, such asthose provided by the SRTM (11 February 2000, for 10 days)and/or the ice, cloud and land-elevation satellite (ICESAT; 12
January 2003 for 7 years) geoscience laser altimeter system
590 Marine and Freshwater Research R. Lucas et al.

(GLAS), respectively (Simard et al. 2006, 2008; Fatoyinbo andSimard 2013), are being referenced. The global datasets of
mangrove tree species composition compiled by the Interna-tional Union for the Conservation of Nature (IUCN; www.iucnredlist.org) are being used to indicate species losses and
gains. The L-band SAR data themselves can also be used todistinguish taller (.,10m) mangroves with prop root systems(e.g. Rhizophora and Ceriops species) from those without
because of their comparatively lower L-band HH backscatter(Lucas et al. 2007). The combination of these remote-sensingdatasets, therefore, allows changes in the extent and structureand losses and gains in both carbon and tree species diversity to
be quantified.A necessary component of the GMW is to provide validation
of these biophysical attributes (including extent) as well as
observed change. One approach is to use local- to regional-scalereference sites distributed across the tropics and subtropics forwhich field data and observations (including crowd-sourced)
and also airborne/spaceborne VHR remote-sensing data areavailable. However, this is difficult to coordinate, particularlygiven the infrequency of access tomangrove areas, the historicalnature of the SAR datasets, and also the timeliness of field and
remote-sensing data collection. Therefore, an alternative, com-plementary and global source of validation data is the densetime series of Landsat sensor data, which have been released
recently by the United States Geological Survey (USGS), andthe interpretation of these.
The present paper provides an overview of the GMW and its
components but also focuses on policy needs that can beaddressed through the provision of GMW outputs relating toextent and biophysical attributes and changes in these. Justifi-
cation is provided for the use of L-band SAR within the GMW.The integration of these data with complementary opticalremote-sensing data within the framework of the GMW isdemonstrated for the purposes of providing information needed
for policy development, implementation and evaluation. Thevalidation of output products is also considered.
The importance of mangroves
Across their geographical range, mangroves are a main con-
tributor to near-shore productivity, offer coastal protection,provide shelter for commercially important fish species andcrustaceans and filter pollutants (Mumby 2006). Mangroves arealso important to local communities because the timber is used
for construction of dwellings, furniture and boats, the manu-facture of charcoal, and firewood. Beyond the mangrove trunk,the branches are used to make fishing poles and traps, the bark
provides tannins and fodder for animals, and the sap has com-mercial value in that it can be used for producing medicines,sugars, alcohol, insecticides and pesticides (Bandaranayake
1998; Rasolofoharinoro et al. 1998; Hogarth 1999).Despite their importance, human activities beyond local
exploitation are leading to the alteration and loss of man-
grove forests across their geographical range. Large and oftencontiguous areas of mangroves are cleared for aquacultureand agriculture, saltpan creation, commercial forestry andtimber harvesting, urban expansion and maritime development
(Barbier and Cox 2004). In many regions, such changes have
gone unnoticed by the wider community or have been inade-quately quantified, largely because of the lack of spatial obser-
vations of sufficient extent, detail and temporal frequency.However, there is an increasing need for timely informationon their changing distribution and condition at scales ranging
from the local to global, for several reasons.
(1) Mangroves provide a substantial reservoir (Fatoyinbo and
Simard 2013) and a potentially large sink for carbon(Dittmar et al. 2006; Donato et al. 2011; Hutchison et al.
2013), particularly given their high growth rates and ability
to rapidly colonise. As such, they can contribute to reduc-tions in net greenhouse gas (GHG) emissions and poten-tially provide ‘carbon’ income to local populations andgovernments. Continued destruction and degradation of
mangroves is, however, contributing carbon emissions fromthe land use, land-use change and forestry (LULUCF) sector(Siikamaki et al. 2012).
(2) Mangroves are increasingly seen as barometers of regionalto global climate change, responding to fluctuations in sealevel and also to anomalous rainfall and temperature
regimes (Beaumont et al. 2011). In many regions, man-groves have been shown to offer protection against stormsurges and tsunamis (Alongi 2008), attenuating the destruc-
tive nature of the extreme events and offering options fortheir future mitigation.
(3) Mangroves support high levels of floral and faunal diversityand associated provisioning services (Vo et al. 2012), many
of which are critical to local livelihoods and of importanceto both local and regional economies.
Examples of the importance of mangrove, human impacts andtheir role in providing ecosystem services are provided inTable 1.
The needs of policy
The Ramsar Convention
Contracting Parties to the Ramsar Convention, which was
adopted in 1971, have committed to ‘the conservation and wiseuse of all wetlands by local and national actions and inter-national cooperation, as a contribution towards achieving sus-
tainable development throughout the world’. Mangroves aredesignated as Marine/Coastal Wetlands: I (intertidal forestedwetlands) under the Ramsar Convention and, globally, 262 sitesare designated, covering an area of 27 million hectares (Ramsar
2012. Under this Convention, the Parties have committedthemselves to ‘undertake national wetland inventories to sup-port national policy initiatives and site management that ensure
the wise use of wetlands in their territories’. However, majorweaknesses in the techniques used and management of infor-mation (Finlayson 1999; MEA 2005; Rosenqvist et al. 2007b)
led to a further Ramsar resolution in 2005 that aimed to improvewetland inventory, assessment and monitoring through the useof multi-scale approaches that integrated remote-sensing data
(Ramsar 2005). To evaluate the ecological outcomes resultingfrom implementation of the Ramsar Convention, eight indica-tors of effectiveness are used, of which the indicator of effec-tiveness ‘A’, on the status and trends in wetland ecosystem
extent, is the most relevant in this context.
Radar monitoring of mangroves Marine and Freshwater Research 591

The key data requirements to support the Ramsar Conventioninclude maps showing the extent and condition of wetlands
(including mangroves), with these addressing the commitmentsof contracting parties to achieve a ‘coherent and comprehensivenational and international network’ of wetland types. Informa-
tion on levels of inundation and disturbance within the definedwetland areas is needed,with this also specified as a contributionto a global wetlands inventory by JAXA’s K&C initiative. Inaddition, data on how wetlands are changing as a result of
previous policy or management responses are required to assesstheir effectiveness in relation to the ‘conservation and wise useof wetlands’. Such information can then support the ongoing
development and adaptation of policy responses (MacKay et al.2009) and also ensure the representation of wetland types withinthe Ramsar listings.
The Convention on Biological Diversity
The Convention on Biological Diversity (CBD), which cameinto force in 1993, obliged signatory nations to ensure ‘con-servation of biological diversity, the sustainable use of its
components and the fair and equitable sharing of the benefitsarising out of the utilisation of generic resources.’ In 2010 inNagoya, Japan, governments agreed to the Strategic Plan forBiodiversity (2011–2020) and the Aichi Biodiversity Targets as
a basis for halting and eventually reversing the loss of biodi-versity, with this supported by a joint Ramsar workplan with theCBD (Rosenqvist et al. 2007b; Ramsar 2012). The CBD also
endorsed (through Decision XI/3) the development of a set ofessential biodiversity variables (EBVs) (Convention onBiological Diversity 2010) relevant to the derivation of biodi-
versity indicators, with these designed to harmonise monitoring(Pereira et al. 2013). The Biodiversity Indicators Partnership(BIP) is chargedwith assessing and reporting on theAichi Targetachievement through its suite of indicators for each target.
The Aichi Targets most relevant to mangroves are 5, 7, 10,11, 12, 14 and 15 (Table 2), with these requiring information on
the rate of habitat loss, degradation and fragmentation, actualand future impacts including those associated with climaticchange, the extent and condition of mangroves of particular
importance for biodiversity and ecosystem services (e.g. forinclusion within protected areas), extinction risk and provisionof ecosystem services. The EBVs that require measurementinclude species populations (abundance and distributions),
community composition (taxonomic diversity) and ecosystemstructure (Pereira et al. 2013). In the latter case, remotely sensedestimates of cover by height and biomass were explicitly stated
as a requirement for measurement and scalability. A particularbenefit of the use of the JERS-1 SAR, ALOS PALSAR andALOS-2 PALSAR-2 is that the observations taken in the
mid-1990s, late 2000s and mid-2010s respectively and derivedlayers relating to the EBVs, as generated by the GMW, canassist in reporting on and meeting the Aichi Targets.
The United Nations Framework Conventionon Climate Change (UNFCCC)
The UNFCCC is an international treaty signed in 1992 thatsought to limit the average global temperature increases andthe resulting climate change and to cope with these impacts.
The Kyoto Protocol was signed in 1997, which legally boundsignatory countries to emission-reduction targets over twocommitment periods, namely 2008–2012 and 2013–2020.
Within this Treaty, the Clean Development Mechanism (CDM)is one of three operational, flexible and financial mechanismsthat were created under the UNFCCC Kyoto Protocol and was
developed as a carbon standard in 1997. Under the CDM, creditsare generated through emission-reduction projects in thedeveloping world to assist countries with caps on emissionsmeet their targets. The verified carbon standard (VCS) is a
Table 1. Indicative facts, highlighting the role of mangroves, the impacts of losses
Global area Varied estimates spatially and temporally. 6In 1990, 161 000 km2, 1In 2000, 137 760 km2 in 118
countries with 75% in 15 countries. 5In 2005, 152 000 km2. In 2010, 156 000 km2;
47% of mangroves in Indonesia, Brazil, Nigeria, Australia and Mexico.
Total economic value 3Up to US$10 million ha per year, depending on site and concomitant management regimes.7US$1.6 billion per year worldwide.
Level of protection 16.9% within the existing protected areas network.
Biodiversity 890% of marine organisms spend part of their life in mangroves.770 species of mangrove across the tropics and subtropics, with highest diversity in Indo-Malesia
and Australasia.
Food provisioning 7,8Almost 80% of global fish catches are dependent to some extent on mangroves.
Carbon storage 2In the tropics, an average of 1023MgCha�1 and up to 20 Pg C.
Approximately five times more C per unit area compared with other forest ecosystems
because of long-term C burial in sediments.
Deforestation rates 3,4Between 1% and 2% per year. Global loss of 30–50% over the past half century, with 520%
(3.6 million ha) lost since 1980, primarily through aquaculture development, deforestation,
and freshwater diversion.
Contribution to global anthropogenic
CO2 emissions
3Estimated at 0.02–0.12 Pg C year�1; second only to fossil-fuel combustion equivalent to 10%
of annual emissions from deforestation.
Species loss 7Almost 40% of mangrove-dependent animal species considered to be at a higher risk of extinction.
Majority of declines in Indo-Malesia and Australasia, with these being centres of diversity.
Sources: 1Giri et al. (2011), 2Donato et al. (2011), 3Siikamaki et al. (2012), 3World Mangrove Network (2013), 4MEA (2005), 5FAO (2007), 6FAO (2010),7Daru et al. (2013), 8Sandilyan and Kathiresan (2012)
592 Marine and Freshwater Research R. Lucas et al.

voluntary GHG-reduction program that ensures that carboncredits are real, measurable, additional, permanent, indepen-
dently verified and traceable, with all projects being listedin an online registry. The UN Reducing Emissions fromDeforestation and forest Degradation (REDDþ) was also
launched in 2008, to assist developing countries build theircapacity for reducing emissions through conservation, sustain-able use and enhancement of forest carbon stocks. As part of thisprocess, a monitoring, reporting and verification (MRV) system
was introduced, which requires countries to respond to a set ofrequisites to ensure access to international financialmechanisms(Lawrence 2012).
Discussions within the UNFCCC and other internationalorganisations have led to the introduction of IntergovernmentalPanel on Climate Change (IPCC) guidelines for quantifying
carbon, including within wetland forests and other wetlands.This has arisen out of recognition that ecosystems such asmangroves, and also sea grasses and saltmarshes, represent
large reservoirs for carbon, with a significant proportion storedin the organic soil beneath. Indeed, regional studies in the Indo-Pacific region have confirmed that mangrove forests are amongthe most carbon (C)-rich ecosystems on the planet (Donato
et al., 2011) with total (above, below and soil) C densityreaching 1000 Mg ha�1.
The rationale behind initiatives such as REDDþ is that,
given adequate C prices in the market, the C contained instanding mangroves would provide higher financial returns thanthe profits foregone by destroying or degrading mangroves for
alternatives uses (Murray et al. 2012). This idea is particularlyapplicable in developing countries where opportunity costs arelow and the mangrove C-mitigation potential is high. This is the
case in several tropical countries where alternative uses to
mangroves are mostly related to agriculture or wood collection.Through win–win financial mechanisms such as REDDþ,
tropical countries have the opportunity to contribute to theconservation of ecologically valuable mangrove ecosystems,thus keeping the benefit of their present and future ecological
services, while promoting clean development and contributingto the international effort of curbing human-driven climaticchanges. REDDþ also acknowledges the importance of creat-ing social and economic safeguards against factors that might
jeopardise food security in developing countries, whose popula-tions mainly rely on natural resources for their subsistence.Presently, REDDþ projects are generating only C credits on the
voluntary market, although some important decisions and keymilestones have been made at the 19th Conference of Parties(COP), including that ‘the framework for results-based pay-
ments for REDDþ is now in place’ and that ‘countries thathave the required elements for REDDþ (i.e. a national REDDþstrategy, a national forest monitoring system, a forest reference
emission level and/or forest reference level) can begin to accessfinancing from various sources on the basis of an agreed metric:tonnes of CO2-equivalent’.
The Intergovernmental science-policy Platformon Biodiversity and Ecosystem Services (IPBES)
IPBES is an intergovernmental body, with 115 member states,
which was established in 2012. The IPBES aims to bridge thegap between science and policy in the fields of biodiversityand related ecosystem services. The initial work program was
adopted at the December 2013 plenary session, and Objec-tive 4, for the period 2014–2018 seeks to ‘strengthen theknowledge–policy interface on the global dimensions of chan-
ges in biodiversity and ecosystem services’. As a contribution
Table 2. Convention on Biological Diversity (CBD) Aichi Targets of relevance to mangrove ecosystems
No. Target
Strategic goal B: reduce the direct pressures on biodiversity and promote sustainable use
5 By 2020, the rate of loss of all natural habitats, including forests, is at least halved and, where feasible, brought close to zero,
and degradation and fragmentation are significantly reduced.
7 By 2020, areas under agriculture, aquaculture and forestry are managed sustainably, ensuring conservation of biodiversity.
10 By 2015, the multiple anthropogenic pressure on coral reefs and other vulnerable ecosystems affected by climate change or ocean
acidification are minimised, so as to maintain their integrity and functioning.
Strategic goal C: improve the status of biodiversity by safeguarding ecosystems, species and genetic diversity
11 By 2020, at least 17% of terrestrial and inland water and 10% of coastal and marine areas, especially areas of particular importance
for biodiversity and ecosystem services, are conserved through effectively and equitably managed, ecologically representative
and well connected systems of protected areas and other effective area-based conservation measures, and integrated into the wider
landscapes and seascapes.
12 By 2020, the extinction of known threatened species has been prevented and their conservation status, particularly of those most
in decline, has been improved and sustained.
Strategic goal D: enhance the benefits to all from biodiversity and ecosystem services
14 By 2020, ecosystems that provide essential services, including services related to water, and contribute to health, livelihoods and
well being, are restored and safeguarded, taking into account the needs of women, indigenous and location communities, and the
poor and vulnerable.
15 By 2020, ecosystem resilience and the contribution of biodiversity to carbon stocks has been enhanced, through conservation
and restoration, including restoration of at least 15% of degraded ecosystems, thereby contributing to climate change mitigation
and adaption and to combating desertification.
Radar monitoring of mangroves Marine and Freshwater Research 593

to this objective, maps of the status and trends of mangrovesand the identification of drivers and pressures are needed,
thereby enabling the effectiveness of policy response to bemonitored.
Convention on the Conservation of MigratorySpecies of Wild Animals (CMS)
The CMS is an intergovernmental treaty dedicated to the con-servation of migratory species, their habitats and migration
routes. It was signed in 1979 and currently has 199 memberstates. To tailor to specific needs of species or habitat conser-vation, the CMS uses several instruments for implementation,such as legally binding agreements (e.g. the Africa–Eurasian
Waterbird Agreement; AEWA), and less formal Memoranda ofUnderstanding (MoU) (e.g. the Dugong MoU and WesternAfrican Aquatic Mammals MoU). Within the context of the
CMS, information on changes in the extent and biophysicalproperties of mangroves is essential, given the dependence ofthe species covered under these on mangroves during all or part
of their lifecycle (Heinsohn et al. 1979;Martin and Finch 1995).
Regional, national and corporate examples
On regional and national levels, there is a wide range of needsrelating to mangroves that involve a wide range of authorities.These include up-to-date and standardised outputs on the extent,status and change of mangroves, which would benefit the
following:
(1) The MRV element of a country’s ‘Readiness Preparation
Plan’ to engage in the UN-REDDþ process, among othermultilateral programs (e.g. the Forest Carbon PartnershipFacility (FCPF) and the Forest Investment Program (FIP)).
(2) The Regional Partnership For Marine And Coastal Conser-vation In West Africa (PRCM) strategic line of Action 3‘analysis, prevention and management of risks and chal-
lenges in the coastal and marine area’ of the 2012–2016strategy (PRCM 2012).
(3) Indonesia’s ‘One Map’ initiative, streamlining the use of
geospatial data across all government agencies and sup-porting the National Forest Monitoring System.
(4) Global Monitoring for Environment and Security (GMES)& Africa, an ongoing initiative that aims to extend the
GMES (nowCopernicus) services and products in Africa. Inparticular, the Marine and Coastal Areas thematic com-ponent clearly identifies the need for comprehensive moni-
toring of mangrove areas in the African continent.(5) National mangrove-based coastal defence strategies.(6) Wetland inventories that need to be established and main-
tained in countries where mangroves occur.
The Global Aquaculture Alliance (GAA) is a corporative
example where information on mangroves and their replace-ment land covers is also needed. The GAA was established in1997 as a non-profit NGO and it develops the ‘best aquaculture
practices’ (BAP) performance standards addressing corporatesocial and environmental responsibility in a voluntary certifi-cation program for aquaculture facilities. The Finfish andCrustacean Farms BAP standards address mangroves in ‘BAP
Standard 4: Mangrove andWetlands Conservation’. To monitor
and report on this implementation for BAP-certified shrimpfarms, the GAA requires regular and up-to-date information on
the status and extent of mangroves.To address the requirements of the diversity of initiatives
and projects underway, information on the extent of intact,
regenerating and degraded mangrove forests is required, toge-ther with estimates of their biomass (C) and changes in thesemeasures over time, with associated measures of uncertainty.
Knowledge of the causes and consequence of change and thecapacity to protect, restore and sustainably manage mangroveforests is also needed. For these purposes, a reliable andconsistent monitoring system becomes essential.
Addressing the needs
In recognising the urgency for more information on mangroves
globally, several initiatives have been forthcoming over the pasttwo decades. Improving knowledge of the extent of mangrovesfor reference years has been the focus of several international
efforts. Spalding et al. (1997) produced the first global productby using a combination of existing maps, ground surveys andremotely sensed data; UNEP–WCMC released an updated‘World Atlas of Mangroves’ in 2010, developed from a wide
range of sources ranging from point-based measurements tomaps (Spalding et al. 2010); and Giri et al. (2011) generated anupdated global mangrove baseline of the extent, with this based
primarily on the Landsat sensor-data archive.The generation of these baseline maps of the extent provides
a critical tool for conservation efforts and management of
mangroves and could be used to quantitatively assess someof the ecosystem services they provide (Table 3). However,several initiatives have recently sought to obtain and use more
specific information about mangrove services. In particular,BirdLife International initiated the ‘Mangrove ConservationAlliance’ in 2011, which is aimed at conserving and sustain-ably managing mangrove ecosystems; Wetlands International
conceived the ‘Mangrove Capital’ program,which aims to bringthe values of mangroves to the fore and provide the knowledgeand tools necessary for the improved management of mangrove
forests; the International Tropical Timber Organization (ITTO)funded the establishment of an international network for theconservation and sustainable use of mangrove genetic resources
and established a Global Mangrove Database and InformationSystem (GLOMIS), a searchable database of scientific literaturerelating to mangroves and institutions and scientists working onall aspects of mangroves.
The United Nations Environment Program (UNEP) BlueCarbon Initiative, a coordinated global partnership program,was created in response to the need of coordinated efforts to
address issues relating to climate-change impacts on coastalecosystems and also their values, including in relation to Csequestration. The Initiative seeks to further research and
develop financial and policy platforms for restoring and con-serving coastal ecosystems (e.g. mangroves, seagrasses andsaltmarshes). These platforms include internationally appli-
cable and acceptable measurement standards to support finan-cial platforms (e.g. MRV). For this purpose, a reliable andconsistent monitoring system becomes essential.
Despite these efforts, there is still no system that routinely
and consistently provides timely and accurate information on
594 Marine and Freshwater Research R. Lucas et al.

the status and trends of mangroves at regional to global scales.
Realistic quantitative measures of the economic values ofmangroves are also needed as is a commitment to ensure thatthese are not undervalued in both private and public decision
making in relation to their use. Agreement on definitions andmore consistent use of methods in space and over time isessential to ensure objective and reliable estimates of theextent, tree species diversity and C losses and gains within
and among regions.
The contribution of L-band SAR
Mangrove extent
Although global maps of the extent of mangroves have been
generated from optical remote-sensing data, a limitation is thatseveral (e.g. Spalding et al. 1997, 2010) used data gatheredby a range of organisations and from a variety of sources, of
which many had limited or no repeatability. Furthermore,mapping was often necessarily undertaken using datafrom different years because cloud cover often preventedobservationswithin a single period. Themap ofGiri et al. (2011)
incorporated an element of repeatability by using freely avail-able satellite sensor data but the reliance on optical data pre-vented routine monitoring because of gaps in coverage. For
these reasons, such products cannot be easily updated for the
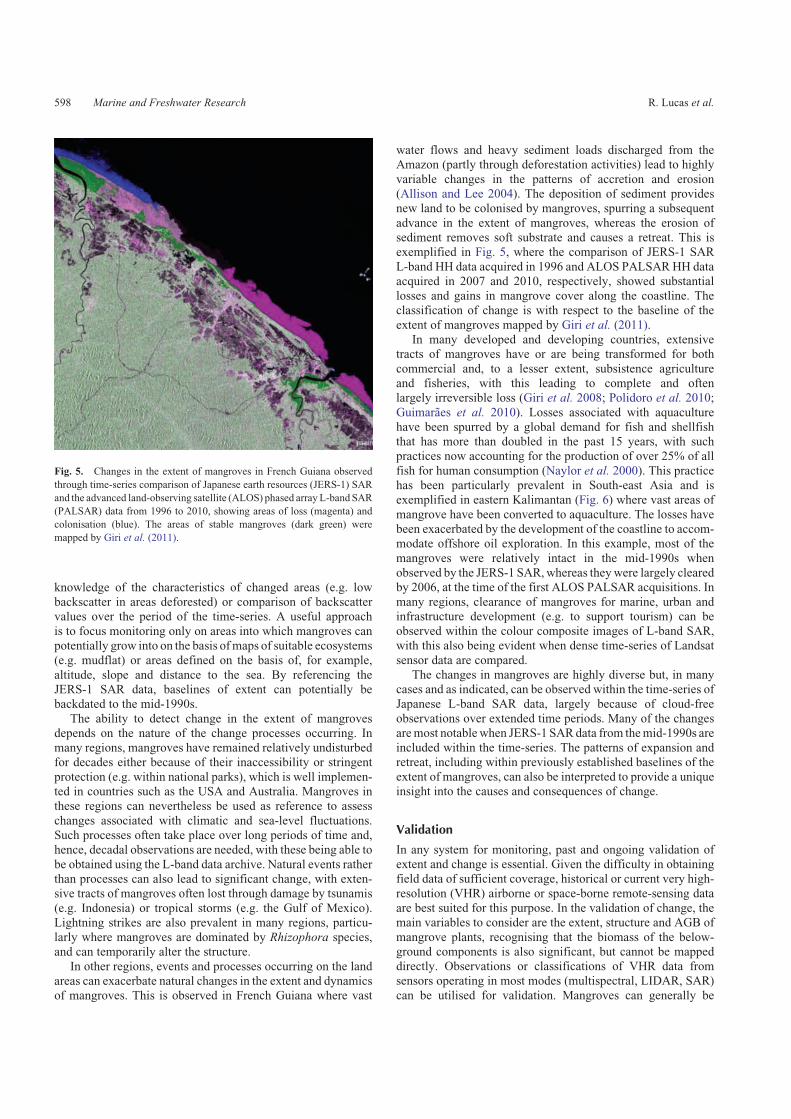
purpose of consistent and regular monitoring.Despite these limitations, baseline maps of the extent of
mangroves generated from optical remote-sensing data need to
be integrated because of the difficulty in generating these fromthe L-band SAR data themselves, even though the issuessurrounding cloud cover are overcome. In particular, the gener-ation of baseline maps of the extent of mangroves from L-band
SAR data alone is limited where mangroves adjoin forests(including plantations) and shrublands because of similaritiesin backscatter (Fig. 1). Where mangroves are backed by non- or
sparsely vegetated surfaces (e.g. sand or mud flats, samphires)on their landward margins, these can generally be discriminatedand mapped because of their higher backscatter at both L-band
HH and HV polarisation, although confusion with high-biomassmangroves with extensive prop root systems may also occurbecause of the low backscatter from these forests (Held et al.
2003; Lucas et al. 2007). One solution is to confine the mappingof mangroves to areas where they have a higher probability ofoccurrence. For example, mangroves are unlikely to occur onsloping ground, close to saline water or at elevations above sea
level exceeding 10m. The existing baseline maps of the extentof mangroves can be used to determine, at a subregion level,statistics on their distribution relative to environmental
Table 3. Common information requirement onmangroves that can be addressed using remote-sensing technologies and spatial-analysis techniques
Information requirements Primary users Primary reasons
Extent Policy
Land holders
Define areas for conservation and exploitation
Quantitative summaries of economic,
social, cultural and environmental values
Policy Ensure maintenance or enhancement for general well being
Food quantity (actual and predicted;
fish, game, fruits, grain)
Local populations
Commercial
Local/national government
Ensure continued provision of food for populations
Fibre and fuel amounts Local populations
Commercial
Determine potential resource and/or ensure sustainable use
of mangrove habitats
Biochemical and genetic material Commercial
Policy
Ensure maintenance of habitat condition and floral and faunal
species diversity
Habitat structure and floristic
composition
Conservation
Science community
Evaluate condition of breeding sites for faunal species
(invertebrates, fish, birds) and pollinators
Extent and rates of mangrove removal Conservation
Policy
Science community
Quantify area, trends in area loss, causes and consequences
Regeneration and restoration rates Conservation
Commercial
Science community
Highlight expansion, areas of potential exploitation, causes and
areas used sustainably
Areas capable of supporting mangroves Conservation
Policy
Identify potential areas for restoration
Extent and arrangement of mangrove zones Conservation Evaluate role and potential for coastal protection (e.g. in areas
vulnerable to storm surges or tsunamis)
Response to sea level fluctuations Policy
Science community
Understand implications of global climate change
Erosion and accretion Land managers Indicate sites of mangrove loss and actual or potential colonisation
Changes in water and soil quality (e.g. salinity,
sediment loads, pollutants, acid sulfate)
Land managers
Local government
Indicate degradation state and allow ameliorative action to be
taken before long-term damage is inflicted
Volume, biomass, carbon stocks and cycling Policy
Science community
Commercial
Quantify existing resource and identify current and potential carbon
accumulation capacity of mangroves
Radar monitoring of mangroves Marine and Freshwater Research 595

variables and, hence, the probability of occurrence. Therefore,the approach adopted in the GMW is to use these existing
baselines to initially establish where mangroves occur within areference year and then refine these baselines based on changeswithin the areas they are most likely to occur and as observed
and quantified using temporal L-band SAR.
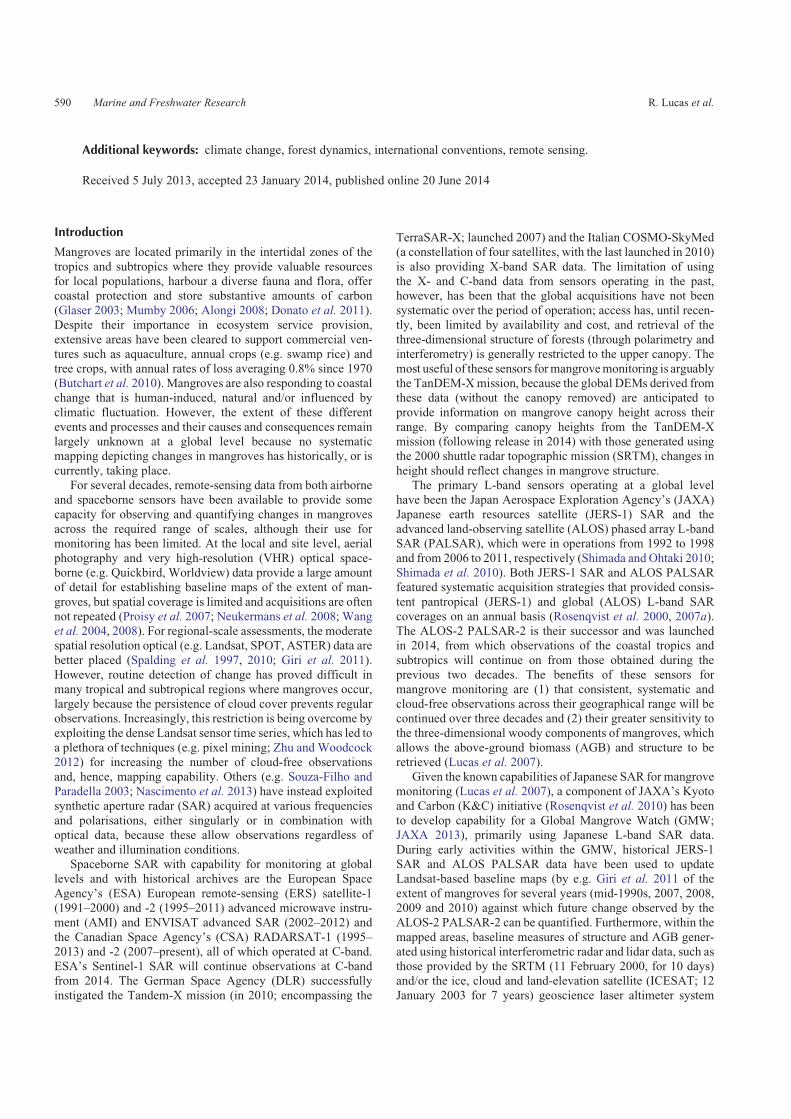
AGB and structure
Once a baseline of the extent of mangroves is established,estimates of mangrove canopy height, AGB and BGB(e.g. derived from allometric equations that use tree size or ratiosdescribing the relationship between AGB and BGB compon-
ents and, subsequently, C storage) can be generated withinthe mapped area (e.g. Comley and McGuinness 2005). These
estimates of AGB are already available for several regions(see Fig. 2), including Africa (Fatoyinbo and Simard 2013;
Fatoyinbo et al. 2008), Florida in theUnited States (Simard et al.2006) and Colombia (Simard et al. 2008). Most have beengenerated using SRTM data acquired in 2000 and, hence, the
estimates are compatible with the baseline estimate of the extentof mangroves generated by Giri et al. (2011), primarily on thebasis of Landsat sensor data from 2000.
The estimates of AGB can be improved further by integrat-ing ALOS PALSAR data. For example, Omar et al. (2014)observed an asymptotic increase in L-band HV backscatterwith AGB in commercial mangrove forests in Malaysia,
although saturation in the relationship was evident. Focusingon Australian mangroves, Lucas et al. (2007) and Held et al.
Nigeria
Cameroon
Man
grov
e he
ight
(m
)
0 250Km
45403530
4�30
�N7�
30�N
10�30�E7�30�E4�30�E6�
N3�
N
4�30
�N7�
30�N
6�N
3�N
9�E6�E3�E
10�30�E7�30�E4�30�E 9�E6�E3�E
252015
510
0
Fig. 2. Map of mangrove canopy height, derived from shuttle radar topographic mission (SRTM) data.
(b)(a)
Fig. 1. Mangroves in Cape York, Australia, observed by (a) the ALOS PALSAR, with HH, HV and the ratio of
HH to HV displayed in RGB. (b) The same mangroves can be discriminated from adjoining forests by the higher
Landsat-derived foliage projective cover (FPC; often .90%).
596 Marine and Freshwater Research R. Lucas et al.

(2003) noted, however, that where extensive prop root systemsoccurred, the ‘typical’ asymptotic increase in L-band backsca-
tter with AGB was disrupted at,120Mg ha�1 (approximatingto,8–12m in height), with the backscatter then decreasing in
proportion to increasing AGB to over 400Mg ha�1 (Lucaset al. 2007). By exploiting these backscatter characteristics
of mangroves, new mapping techniques have been developedthat exploit mangrove canopy-height models (CHMs) andL-band SAR backscatter to differentiate between mangroves
with and those without prop root systems (Fig. 3; Lucas et al.2007). Because information on mangrove structure is alsoobtained, these data can be used to measure relative stages of
regeneration and colonisation. The broad species compositioncan be inferred because only a few species (e.g. Rhizophora)support such structures. However, an approach adopted here isto also use the range-map data from the IUCN Red List
database, with this indicating where the different mangrovespecies are distributed globally on a quarter-degree squarebasis (Fig. 4).
Detection of change
On the basis that the globalmap ofGiri et al. (2011) from 2000 is
used because of its time compatibility with the SRTM, changeswithin and from the mapped area can be quantified using theavailable L-band SAR data. Through this process, revised
baselines of the extent of mangroves can be generated for eachyear of observation on the basis of observed expansion into seaareas and, where detectable, inland colonisation, although the
latter is more difficult because of similarities in backscatter withforest vegetation. Because coverage of the L-band SAR data issystematic and global, wall-to-wall mapping within selected
years (e.g. 1995, 2007, 2010) and change detection is alsoachieved, overcoming the difficulties experienced by the FAO(2007) in compiling spatial and statistical datasets from dispa-rate sources and from different years. Within the baseline area,
changes associated with deforestation or degradation, whethernatural or anthropogenic, can be detected on the basis of
MangroveSpecies
(# of species)
0
1 – 5
6 – 10
11 – 20
21 – 30
31 – 40
41 – 51
Fig. 4. Mangrove species richness by country (IUCN 2010).
Fig. 3. Classification of mangroves, Hinchinbrook Island, Queensland,
Australia showing areas of low (pale green) and high (olive green) biomass
forests without prop roots, and high biomass forests with prop roots (red).
Radar monitoring of mangroves Marine and Freshwater Research 597
knowledge of the characteristics of changed areas (e.g. lowbackscatter in areas deforested) or comparison of backscattervalues over the period of the time-series. A useful approach
is to focus monitoring only on areas into which mangroves canpotentially grow into on the basis ofmaps of suitable ecosystems(e.g. mudflat) or areas defined on the basis of, for example,
altitude, slope and distance to the sea. By referencing theJERS-1 SAR data, baselines of extent can potentially bebackdated to the mid-1990s.
The ability to detect change in the extent of mangrovesdepends on the nature of the change processes occurring. Inmany regions, mangroves have remained relatively undisturbedfor decades either because of their inaccessibility or stringent
protection (e.g. within national parks), which is well implemen-ted in countries such as the USA and Australia. Mangroves inthese regions can nevertheless be used as reference to assess
changes associated with climatic and sea-level fluctuations.Such processes often take place over long periods of time and,hence, decadal observations are needed, with these being able to
be obtained using the L-band data archive. Natural events ratherthan processes can also lead to significant change, with exten-sive tracts of mangroves often lost through damage by tsunamis
(e.g. Indonesia) or tropical storms (e.g. the Gulf of Mexico).Lightning strikes are also prevalent in many regions, particu-larly where mangroves are dominated by Rhizophora species,and can temporarily alter the structure.
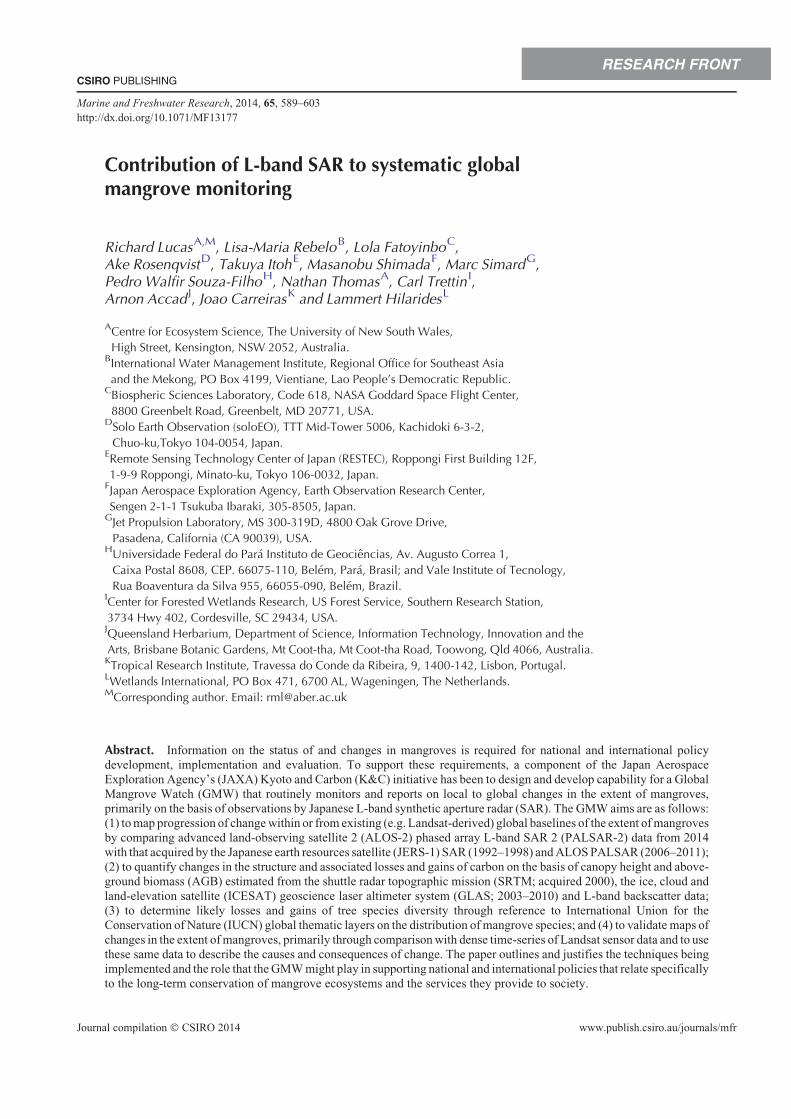
In other regions, events and processes occurring on the landareas can exacerbate natural changes in the extent and dynamicsof mangroves. This is observed in French Guiana where vast
water flows and heavy sediment loads discharged from theAmazon (partly through deforestation activities) lead to highly
variable changes in the patterns of accretion and erosion(Allison and Lee 2004). The deposition of sediment providesnew land to be colonised by mangroves, spurring a subsequent
advance in the extent of mangroves, whereas the erosion ofsediment removes soft substrate and causes a retreat. This isexemplified in Fig. 5, where the comparison of JERS-1 SAR
L-band HH data acquired in 1996 and ALOS PALSARHH dataacquired in 2007 and 2010, respectively, showed substantiallosses and gains in mangrove cover along the coastline. Theclassification of change is with respect to the baseline of the
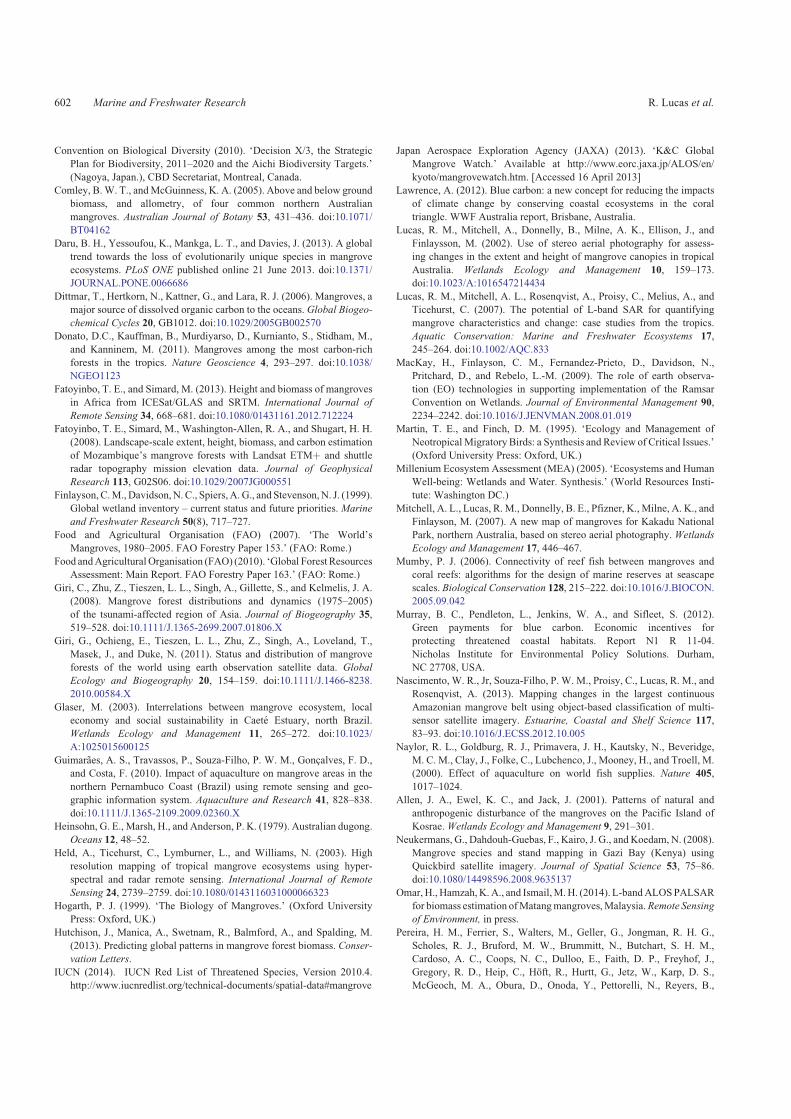
extent of mangroves mapped by Giri et al. (2011).In many developed and developing countries, extensive
tracts of mangroves have or are being transformed for both
commercial and, to a lesser extent, subsistence agricultureand fisheries, with this leading to complete and oftenlargely irreversible loss (Giri et al. 2008; Polidoro et al. 2010;
Guimaraes et al. 2010). Losses associated with aquaculturehave been spurred by a global demand for fish and shellfishthat has more than doubled in the past 15 years, with suchpractices now accounting for the production of over 25% of all
fish for human consumption (Naylor et al. 2000). This practicehas been particularly prevalent in South-east Asia and isexemplified in eastern Kalimantan (Fig. 6) where vast areas of
mangrove have been converted to aquaculture. The losses havebeen exacerbated by the development of the coastline to accom-modate offshore oil exploration. In this example, most of the
mangroves were relatively intact in the mid-1990s whenobserved by the JERS-1 SAR,whereas theywere largely clearedby 2006, at the time of the first ALOS PALSAR acquisitions. In
many regions, clearance of mangroves for marine, urban andinfrastructure development (e.g. to support tourism) can beobserved within the colour composite images of L-band SAR,with this also being evident when dense time-series of Landsat
sensor data are compared.The changes in mangroves are highly diverse but, in many
cases and as indicated, can be observed within the time-series of
Japanese L-band SAR data, largely because of cloud-freeobservations over extended time periods. Many of the changesaremost notablewhen JERS-1 SARdata from themid-1990s are
included within the time-series. The patterns of expansion andretreat, including within previously established baselines of theextent of mangroves, can also be interpreted to provide a uniqueinsight into the causes and consequences of change.
Validation
In any system for monitoring, past and ongoing validation ofextent and change is essential. Given the difficulty in obtainingfield data of sufficient coverage, historical or current very high-
resolution (VHR) airborne or space-borne remote-sensing dataare best suited for this purpose. In the validation of change, themain variables to consider are the extent, structure and AGB of
mangrove plants, recognising that the biomass of the below-ground components is also significant, but cannot be mappeddirectly. Observations or classifications of VHR data fromsensors operating in most modes (multispectral, LIDAR, SAR)
can be utilised for validation. Mangroves can generally be
Fig. 5. Changes in the extent of mangroves in French Guiana observed
through time-series comparison of Japanese earth resources (JERS-1) SAR
and the advanced land-observing satellite (ALOS) phased array L-band SAR
(PALSAR) data from 1996 to 2010, showing areas of loss (magenta) and
colonisation (blue). The areas of stable mangroves (dark green) were
mapped by Giri et al. (2011).
598 Marine and Freshwater Research R. Lucas et al.

better discriminated from adjoining vegetation covers and non-vegetated surfaces within VHR data on the basis of spectral
(spectral reflectance, SAR backscatter) or height differences.Texture measures can also be exploited, given the homogeneityof mangrove canopies relative to many other forest types. Evenwhen the extent of mangrove forest remains constant, its
structure and biomass may change. For this reason, estimates ofcanopy cover, height andAGB ofmangroves obtained primarilyfrom stereo imagery (Lucas et al. 2002; Mitchell et al. 2007),
lidar and/or InSARare required. Validation of change also needsto be achievable, particularly if undertaken at a global level.Hence, approaches such as systematic stratified samplingwithin
and among regions and according to distributions of mangroves(e.g. by type) are needed. In the future, validation activities need
to take place at the same time or close to observations by theALOS-2 PALSAR-2 to assess performance within a mangrove
monitoring system. In this regard, considerable potential existsfor using the additional resource of crowd-sourced informationfor validation, particularly given that the local populations oftencause ongoing changes in mangroves through their activities, or
are affected by these.A complementary approach to validating change is to use
the dense time-series of Landsat sensor data, which have
recently been released by the United States Geological Survey(USGS). This is exemplified by Fig. 7, which highlights howthe changes in French Guiana observed by comparing the
JERS-1 SAR and ALOS PALSAR data are also evident withinthe Landsat time-series. A particular benefit of using both
0 5 10 20 KilometersBorneo, N00 E117 N
117�20�0�E117�10�0�E 117�30�0�E
117�20�0�E117�10�0�E
0�20�0�S
0�30�0�S
0�40�0�S
0�50�0�S
0�20�0�S
0�30�0�S
0�40�0�S
0�50�0�S
117�30�0�E
Fig. 6. Japanese earth resources (JERS-1) SAR (1996) and the advanced land-observing satellite
(ALOS) phased array L-band SAR (PALSAR) (2007, 2010) L-band HH colour composite (1996, 2007
and 2010 in RGB), showing extensive loss of mangroves as a consequence of aquaculture and oil
exploitation in East Kalimantan. Reductions in the extent of mangroves are indicated in red, whereas
gains (relatively minor) are indicated in green and blue.
Radar monitoring of mangroves Marine and Freshwater Research 599

time-series is that the potential causes (e.g. deforestation withincatchments upstream or clearing for aquaculture or saltpans) canbe suggested and consequences (e.g. losses, increased accretion
of sediments or forest dieback) observed. Using dense time-series datasets of Landsat sensor data, the overall accuracy ofclassification of change exceeded 90% (losses and gains in
the seaward direction) for nine sites, including French Guiana(N. Thomas, R. Lucas and T. Itoh, unpubl. data), although lossesand colonisation at the landward margins were more difficult toquantify.
Discussion and conclusions
The GMW conducted as part of JAXA’s K&C initiative aims to
support global monitoring of mangroves by using time-series ofJERS-1 SAR, ALOS PALSAR and ALOS-2 PALSAR-2. Forthis, the use of existing baselines of the extent of mangroves
generated from other data sources (e.g. Landsat) is essentialbecause of the difficulty in discriminating mangroves fromadjoining land covers (particularly forests) by using the L-band
SAR data themselves. The global maps of Giri et al. (2011) arepreferred because of time-compatibility with the SRTM global-elevation dataset. The baseline mapping can also be continually
refined and updated using the available SAR data. The primary
benefits of using Japanese L-band SAR with the GMW are asfollows:
(1) systematic, temporally consistent and cloud-free observa-tions of mangroves across their global range over several
decades are available and will continue to be provided on atleast an annual basis; as such, these data provide capacity fora wall-to-wall rather than sample-based approach for map-
ping and monitoring;(2) these data are sensitive to the three-dimensional structure
and AGB of vegetation and changes in these; and(3) the historical data have been combined by JAXA into
global and regional L-band HH mosaics for the mid-1990s(1994–1998) and HH and HVmosaics for 2007, 2008, 2009and 2010, which can be augmented using data to be acquired
by the ALOS-2 PALSAR-2 from 2014; as a consequence,wall-to-wall rather than sample-based monitoring can takeplace and global baselines of extent can be refined for
specific years.
Although other sensors (e.g. X- and C-band or optical) have
provided and continue to provide data that can contributeobservations of mangroves, the L-band SAR fulfils more ofthe requirements for ongoing and routine monitoring at a global
level (Table 4).
(a) (d )
(b) (e)
(c) (f )
Fig. 7. The changing extent of mangroves observed in French Guiana in (a) 1984, (b) 1990, (c) 1998), (d ) 2007,
(e) 2008 and ( f ) 2010. The patterns observed correspond to those mapped in Fig. 5.
600 Marine and Freshwater Research R. Lucas et al.

Within the baselines of the extent of mangroves established,spatial estimates of structural attributes and AGB have already
been established for some regions (Simard et al. 2006, 2008;Fatoyinbo and Simard 2013) and can be extended globally andalso refined using the ALOS PALSAR data themselves (e.g. by
distinguishing between high-biomass mangroves with and thosewithout prop root systems). Using these data, estimates of C andstructural change can be quantified for areas where change is
detected by using the Japanese SAR data. The tree speciescomposition of affected mangroves can also be discernedthrough reference to the IUCN mapping.
A key requirement of the GMW is the provision of data,both historical and current, for validating maps of the extent,retrieved biophysical properties and the change of mangroves.For this purpose, airborne SAR and LIDAR data should be
exploited where possible because of the ability of the former topenetrate cloud and the capacity to retrieve structure and AGBfrom both. Consideration should also be given to the use of
crowd-sourced information during the period of the ALOS-2PALSAR acquisitions. However, the use of the dense time-series of Landsat sensor data is advocated for validation at a
regional to global scale, given the complementarity and consis-tency of information provided.
The GMW is intended to support the range of activities that
are ongoing to ensure conservation and sustainable use ofmangroves, including through policy development, implemen-tation and assessment. For most policies, maps of the extent,structure, species composition and biomass are required and the
GMW can contribute to such provision, particularly followinglaunch of theALOS-2 PALSAR-2where the intention is provideup-to-date change mapping as and when data are acquired.
Information to assess the impacts of past and current policiesand inform the likely consequences of future actions can also beprovided. A previous limitation of using Japanese SAR data has
been the availability and cost. In the GMW, the intention is tomake the baseline and change maps available to the widercommunity such that these can be used to determine past extentsbut also increase awareness of current changes associated with
specific events (e.g. deforestation) or processes (e.g. erosion orcolonisation following accretion).
In many of the regions where mangroves occur, wetlands are
also prevalent and, although a larger area would need to beimaged in some cases, the GMW can act as demonstrator andalso precursor to the Ramsar GlobalWetland Observing System
(GWOS). Such a system would also benefit from the use of thetime-series of Japanese SAR data and particularly the wide
swath coarser-resolution (100m) ScanSAR data, which will beobserving at both HH and HV polarisation when the ALOS-2PALSAR-2 is launched. These same data would also benefit
the monitoring of forest and non-forest areas, particularly intropical regions.
Mangroves form an integral but often poorly recognised
component of coastal ecosystems; however, in the long-term,the environmental, social and economic benefits of retainingmangroves far outweigh those associated with replacement land
covers. Hence, the implementation of the GMW will inform onthe changing extent and dynamics of mangroves and theircontribution to, for example, ecosystem services. However,such as system requires a high level of coordination and
investment through a range of mechanisms agreed by nationaland international governments, businesses and organisations.
References
Allison,M. A., and Lee,M. T. (2004). Sediment exchange between Amazon
mudbanks and shore-fringing mangroves in French Guiana. Marine
Geology 208, 169–190. doi:10.1016/J.MARGEO.2004.04.026
Alongi, D. (2008). Mangrove forests: resilience, protection from tsunamis,
and responses to global climate change. Estuarine, Coastal and Shelf
Science 76, 1–13. doi:10.1016/J.ECSS.2007.08.024
Bandaranayake, W. M. (1998). Traditional and medicinal uses of man-
groves. Mangroves and Salt Marshes 2, 133–148. doi:10.1023/
A:1009988607044
Barbier, E. B., and Cox, M. (2004). An economic analysis of shrimp farm
expansion and mangrove conversion in Thailand. Land Economics 80,
389–407. doi:10.2307/3654728
Beaumont, L. J., Pitman, A., Perkins, S., Zimmermann,N. E., Yoccoz, N. G.,
and Thuiller, W. (2011). Impacts of climate change on the world’s most
exceptional ecoregions. Proceedings of the National Academy of
Sciences, USA 108, 2306–2311. doi:10.1073/PNAS.1007217108
Butchart, S., Walpole, M., Collen, B., van Strien, A., Scharlemann, J. P. W.,
Almond, R. E. A., Baillie, J. E. M., Bomhard, B., Brown, C., Bruno, J.,
Carpenter, K. E., Carr, G. M., Chanson, J., Chenery, A. M., Csirke, J.,
Davidson, N. C., Dentener, F., Foster, M., Galli, A., Galloway, J. N.,
Genovesi, P., Gregory, R. D., Hockings,M., Kapos, V., Lamarque, J.-F.,
Leverington, F., Loh, J., McGeoch, M. A., McRae, L., Minasyan, A.,
Morcillo, M. H., Oldfield, T. E. E., Pauly, D., Quader, S., Revenga, C.,
Sauer, J. R., Skolnik, B., Spear, D., Stanwell-Smith, D., Stuart, S. N.,
Symes, A., Tierney,M., Tyrrell, T. D., Vie, J.-C., andWatson, R. (2010).
Global biodiversity: indicators of recent declines. Science 328,
1164–1168. doi:10.1126/SCIENCE.1187512
Table 4. Strengths and weaknesses of global observing satellite for mangrove characterisation, mapping and monitoring
See text for explanation of the abbreviations
L-band SAR C-band SAR X-band SAR Optical sensor
JERS-1
SAR
ALOS
PALSAR
ALOS-2
PALSAR-2
Landsat SPOT/ASTER
Cloud-free observations � � � � �Sensitivity to foliage components � � � �Sensitivity to larger woody components � � �Sensitivity to woody biomass � � �Global acquisitions � � � � � � �Systematic acquisitions � � � �Archival data � � � � �
Radar monitoring of mangroves Marine and Freshwater Research 601
Convention on Biological Diversity (2010). ‘Decision X/3, the Strategic
Plan for Biodiversity, 2011–2020 and the Aichi Biodiversity Targets.’
(Nagoya, Japan.), CBD Secretariat, Montreal, Canada.
Comley, B. W. T., andMcGuinness, K. A. (2005). Above and below ground
biomass, and allometry, of four common northern Australian
mangroves. Australian Journal of Botany 53, 431–436. doi:10.1071/
BT04162
Daru, B. H., Yessoufou, K., Mankga, L. T., and Davies, J. (2013). A global
trend towards the loss of evolutionarily unique species in mangrove
ecosystems. PLoS ONE published online 21 June 2013. doi:10.1371/
JOURNAL.PONE.0066686
Dittmar, T., Hertkorn, N., Kattner, G., and Lara, R. J. (2006). Mangroves, a
major source of dissolved organic carbon to the oceans. Global Biogeo-
chemical Cycles 20, GB1012. doi:10.1029/2005GB002570
Donato, D.C., Kauffman, B., Murdiyarso, D., Kurnianto, S., Stidham, M.,
and Kanninem, M. (2011). Mangroves among the most carbon-rich
forests in the tropics. Nature Geoscience 4, 293–297. doi:10.1038/
NGEO1123
Fatoyinbo, T. E., and Simard, M. (2013). Height and biomass of mangroves
in Africa from ICESat/GLAS and SRTM. International Journal of
Remote Sensing 34, 668–681. doi:10.1080/01431161.2012.712224
Fatoyinbo, T. E., Simard, M., Washington-Allen, R. A., and Shugart, H. H.
(2008). Landscape-scale extent, height, biomass, and carbon estimation
of Mozambique’s mangrove forests with Landsat ETMþ and shuttle
radar topography mission elevation data. Journal of Geophysical
Research 113, G02S06. doi:10.1029/2007JG000551
Finlayson, C.M.,Davidson,N.C., Spiers,A.G., and Stevenson,N. J. (1999).
Global wetland inventory – current status and future priorities. Marine
and Freshwater Research 50(8), 717–727.
Food and Agricultural Organisation (FAO) (2007). ‘The World’s
Mangroves, 1980–2005. FAO Forestry Paper 153.’ (FAO: Rome.)
Food andAgriculturalOrganisation (FAO) (2010). ‘Global ForestResources
Assessment: Main Report. FAO Forestry Paper 163.’ (FAO: Rome.)
Giri, C., Zhu, Z., Tieszen, L. L., Singh, A., Gillette, S., and Kelmelis, J. A.
(2008). Mangrove forest distributions and dynamics (1975–2005)
of the tsunami-affected region of Asia. Journal of Biogeography 35,
519–528. doi:10.1111/J.1365-2699.2007.01806.X
Giri, G., Ochieng, E., Tieszen, L. L., Zhu, Z., Singh, A., Loveland, T.,
Masek, J., and Duke, N. (2011). Status and distribution of mangrove
forests of the world using earth observation satellite data. Global
Ecology and Biogeography 20, 154–159. doi:10.1111/J.1466-8238.
2010.00584.X
Glaser, M. (2003). Interrelations between mangrove ecosystem, local
economy and social sustainability in Caete Estuary, north Brazil.
Wetlands Ecology and Management 11, 265–272. doi:10.1023/
A:1025015600125
Guimaraes, A. S., Travassos, P., Souza-Filho, P. W. M., Goncalves, F. D.,
and Costa, F. (2010). Impact of aquaculture on mangrove areas in the
northern Pernambuco Coast (Brazil) using remote sensing and geo-
graphic information system. Aquaculture and Research 41, 828–838.
doi:10.1111/J.1365-2109.2009.02360.X
Heinsohn, G. E., Marsh, H., and Anderson, P. K. (1979). Australian dugong.
Oceans 12, 48–52.
Held, A., Ticehurst, C., Lymburner, L., and Williams, N. (2003). High
resolution mapping of tropical mangrove ecosystems using hyper-
spectral and radar remote sensing. International Journal of Remote
Sensing 24, 2739–2759. doi:10.1080/0143116031000066323
Hogarth, P. J. (1999). ‘The Biology of Mangroves.’ (Oxford University
Press: Oxford, UK.)
Hutchison, J., Manica, A., Swetnam, R., Balmford, A., and Spalding, M.
(2013). Predicting global patterns in mangrove forest biomass. Conser-
vation Letters.
IUCN (2014). IUCN Red List of Threatened Species, Version 2010.4.
http://www.iucnredlist.org/technical-documents/spatial-data#mangrove
Japan Aerospace Exploration Agency (JAXA) (2013). ‘K&C Global
Mangrove Watch.’ Available at http://www.eorc.jaxa.jp/ALOS/en/
kyoto/mangrovewatch.htm. [Accessed 16 April 2013]
Lawrence, A. (2012). Blue carbon: a new concept for reducing the impacts
of climate change by conserving coastal ecosystems in the coral
triangle. WWF Australia report, Brisbane, Australia.
Lucas, R. M., Mitchell, A., Donnelly, B., Milne, A. K., Ellison, J., and
Finlaysson, M. (2002). Use of stereo aerial photography for assess-
ing changes in the extent and height of mangrove canopies in tropical
Australia. Wetlands Ecology and Management 10, 159–173.
doi:10.1023/A:1016547214434
Lucas, R. M., Mitchell, A. L., Rosenqvist, A., Proisy, C., Melius, A., and
Ticehurst, C. (2007). The potential of L-band SAR for quantifying
mangrove characteristics and change: case studies from the tropics.
Aquatic Conservation: Marine and Freshwater Ecosystems 17,
245–264. doi:10.1002/AQC.833
MacKay, H., Finlayson, C. M., Fernandez-Prieto, D., Davidson, N.,
Pritchard, D., and Rebelo, L.-M. (2009). The role of earth observa-
tion (EO) technologies in supporting implementation of the Ramsar
Convention on Wetlands. Journal of Environmental Management 90,
2234–2242. doi:10.1016/J.JENVMAN.2008.01.019
Martin, T. E., and Finch, D. M. (1995). ‘Ecology and Management of
NeotropicalMigratory Birds: a Synthesis and Review of Critical Issues.’
(Oxford University Press: Oxford, UK.)
Millenium Ecosystem Assessment (MEA) (2005). ‘Ecosystems and Human
Well-being: Wetlands and Water. Synthesis.’ (World Resources Insti-
tute: Washington DC.)
Mitchell, A. L., Lucas, R. M., Donnelly, B. E., Pfizner, K., Milne, A. K., and
Finlayson, M. (2007). A new map of mangroves for Kakadu National
Park, northern Australia, based on stereo aerial photography. Wetlands
Ecology and Management 17, 446–467.
Mumby, P. J. (2006). Connectivity of reef fish between mangroves and
coral reefs: algorithms for the design of marine reserves at seascape
scales. Biological Conservation 128, 215–222. doi:10.1016/J.BIOCON.
2005.09.042
Murray, B. C., Pendleton, L., Jenkins, W. A., and Sifleet, S. (2012).
Green payments for blue carbon. Economic incentives for
protecting threatened coastal habitats. Report N1 R 11-04.
Nicholas Institute for Environmental Policy Solutions. Durham,
NC 27708, USA.
Nascimento, W. R., Jr, Souza-Filho, P. W. M., Proisy, C., Lucas, R. M., and
Rosenqvist, A. (2013). Mapping changes in the largest continuous
Amazonian mangrove belt using object-based classification of multi-
sensor satellite imagery. Estuarine, Coastal and Shelf Science 117,
83–93. doi:10.1016/J.ECSS.2012.10.005
Naylor, R. L., Goldburg, R. J., Primavera, J. H., Kautsky, N., Beveridge,
M. C. M., Clay, J., Folke, C., Lubchenco, J., Mooney, H., and Troell, M.
(2000). Effect of aquaculture on world fish supplies. Nature 405,
1017–1024.
Allen, J. A., Ewel, K. C., and Jack, J. (2001). Patterns of natural and
anthropogenic disturbance of the mangroves on the Pacific Island of
Kosrae. Wetlands Ecology and Management 9, 291–301.
Neukermans, G., Dahdouh-Guebas, F., Kairo, J. G., and Koedam, N. (2008).
Mangrove species and stand mapping in Gazi Bay (Kenya) using
Quickbird satellite imagery. Journal of Spatial Science 53, 75–86.
doi:10.1080/14498596.2008.9635137
Omar, H., Hamzah,K.A., and Ismail,M.H. (2014). L-bandALOSPALSAR
for biomass estimation ofMatangmangroves,Malaysia.Remote Sensing
of Environment, in press.
Pereira, H. M., Ferrier, S., Walters, M., Geller, G., Jongman, R. H. G.,
Scholes, R. J., Bruford, M. W., Brummitt, N., Butchart, S. H. M.,
Cardoso, A. C., Coops, N. C., Dulloo, E., Faith, D. P., Freyhof, J.,
Gregory, R. D., Heip, C., Hoft, R., Hurtt, G., Jetz, W., Karp, D. S.,
McGeoch, M. A., Obura, D., Onoda, Y., Pettorelli, N., Reyers, B.,
602 Marine and Freshwater Research R. Lucas et al.

Sayre, R., Scharlemann, J. P. W., Stuart, S. N., Turak, E., Walpole, M.,
andWegmann,M. (2013). Essential biodiversity variables. Science 339,
277–278. doi:10.1126/SCIENCE.1229931
Polidoro, B. A., Carpenter, K. E., Collins, L., Duke, N. C., Ellison, A. M.,
Ellison, J. C., Farnsworth, E. J., Fernando, E. S., Kathiresan, K.,
Koedam, N. E., Livingstone, S. R., Miyagi, T., Moore, G. E.,
NgocNam,V.,Ong, J. E., Primavera, J. H., Salmo, S.G., III, Sanciangco,
J. C., Sukardjo, S., Wang, Y., and Yong, J. W. H. (2010). The loss of
species: mangrove extinction risk and geographic areas of global
concern. PLoS ONE 5, e10095. doi:10.1371/JOURNAL.PONE.
0010095
PRCM (2012). ‘Strategy 2012–2016.’ Available at http://prcmarine.org/
new/sites/all/images/PRCM-Strategie-2012-2016-final-eng-synthese.pdf.
[Accessed 24 December 2013]
Proisy, C., Couteron, P., and Fromard, F. (2007). Predicting and mapping
mangrove biomass from canopy grain analysis using Fourier-based
textural ordination of IKONOS images. Remote Sensing of Environment
109, 379–392. doi:10.1016/J.RSE.2007.01.009
Ramsar (2005). ‘Resolution IX.1 Annex D, Resolution IX.1 Annex D:
Ecological ‘Outcome-oriented’ Indicators for Assessing the Implemen-
tation Effectiveness of the Ramsar Convention. Available
at http://www.ramsar.org/cda/en/ramsar-documents-resol-resolution-
ix-1-annex-d/main/ramsar/1-31-107%5E23547_4000_0__. [Accessed
13 May 2013]
Ramsar (2012). ‘Resolution XI.6, Partnerships and Synergies with Multi-
lateral Environmental Agreements and Other Institutions.’ (Ramsar:
Bucharest, Romania.) Available at http://www.ramsar.org/cda/en/
ramsar-documents-cops-cop11-cop11-resolutions/main/ramsar/1-31-58-
500%5E25837_4000_0__. [Accessed 13 May 2013]
Rasolofoharinoro,M., Blasco, F., Bellan, M. F., Aizpuru,M., Gauquelin, T.,
and Denis, J. A. (1998). Remote sensing based methodology of man-
grove studies in Madagascar. International Journal of Remote Sensing
19, 1873–1886. doi:10.1080/014311698215036
Rosenqvist, A., Shimada, M., Chapman, B., Freeman, A., De Grandi, G.,
Saatchi, S., and Rauste, Y. (2000). The global rain forest mapping :
a review. International Journal of Remote Sensing 21, 1375–1387.
doi:10.1080/014311600210227
Rosenqvist, A., Shimada, M., and Watanabe, M. (2007a). ALOS PALSAR:
a pathfinder mission for global-scale monitoring of the environment.
IEEE Transactions on Geoscience and Remote Sensing 45, 3307–3316.
doi:10.1109/TGRS.2007.901027
Rosenqvist, A., Finlayson, M., Lowry, J., and Taylor, D. (2007b). The
potential of long wavelength satellite borne radar to support implemen-
tation of the Ramsar Wetlands Convention. Journal of Aquatic Conser-
vation: Marine and Freshwater Ecosystems 17, 229–244. doi:10.1002/
AQC.835
Rosenqvist, A., Shimada,M., Chapman, B., Paillou, P., Hess, L., and Lowry,
J. (2010). The Kyoto & Carbon initiative: a brief summary. IEEE
Journal of Selected Topics in Applied Earth Observation and Remote
Sensing 3, 551–553. doi:10.1109/JSTARS.2010.2086270
Shimada, M., and Ohtaki, T. (2010). Generating large-scale high-quality
SAR mosaic datasets: application to PALSAR data for global
monitoring. IEEE Journal of Selected Topics in Applied Earth Observa-
tions and Remote Sensing 3, 637–656. doi:10.1109/JSTARS.2010.
2077619
Shimada, M., Tadono, T., and Rosenqvist, A. (2010). Advanced land
observing satellite (ALOS) and monitoring global environmental
change. Proceedings of the IEEE 98, 780–799.
Sandilyan, S., and Kathiresan, K. (2012). Mangrove conservation: a
global perspective. Biodiversity and Conservation 21, 3523–3542.
doi:10.1109/JPROC.2009.2033724
Siikamaki, J., Sanchirico, J. N., and Jardine, S. L. (2012). Global
economic potential for reducing carbon dioxide emissions from
mangrove loss. Proceedings of the National Academy of Sciences,
USA (PNAS) Early Edition 109, 14 369–14 374. doi:10.1073/
PNAS.1200519109
Simard, M., Zhang, K. Q., Rivera-Monroy, V. H., Ross, M. S., Ruiz, P. L.,
Castaneda-Moya, E., Twilley, R. R., and Rodriguez, E. (2006).Mapping
height and biomass of mangrove forests in Everglades National Park
with SRTM elevation data. Photogrammetric Engineering and Remote
Sensing 72, 299–311. doi:10.14358/PERS.72.3.299
Simard, M., Rivera-Monroy, V. H., Mancera-Pineda, J. E., Castaneda-
Moya, E., and Twilley, R. R. (2008). A systematic method for 3d
mapping of mangrove forests based on shuttle radar topography mission
elevation data, ICESat/GLAS waveforms and field data: application to
Cienaga Grande De Santa Marta, Colombia. Remote Sensing of Envi-
ronment 112, 2131–2144. doi:10.1016/J.RSE.2007.10.012
Souza-Filho, P. W. M., and Paradella, W. R. (2003). Use of synthetic
aperture radar for recognition of coastal geomorphological features,
land-use assessment and shoreline changes in Braganca coast, Para,
northern Brazil. Annals of the Brazilian Academy of Sciences 75,
341–356. doi:10.1590/S0001-37652003000300007
Spalding, M., Blasco, F., and Field, C. (1997). ‘World Mangrove Atlas.’
(International Society for Mangrove Ecosystems: Okinawa, Japan.)
Spalding, M., Kainuma, M., and Collins, L. (2010). ‘World Atlas of
Mangroves.’ 2nd edn. (Earthscan: London.)
Vo, Q. T., Kuenzer, C., Vo, Q.M.,Moder, F., andOppelt, N. (2012). Review
of valuation methods for mangrove ecosystem services. Ecological
Indicators 23, 431–446. doi:10.1016/J.ECOLIND.2012.04.022
Wang, L., Sousa-Filho, W. P., and Gong, P. (2004). Integration of
object-based and pixel-based classification for mapping mangroves
with IKONOS imagery. International Journal of Remote Sensing 25,
5655–5668. doi:10.1080/014311602331291215
Wang, L., Silvan-Cardenas, J. L., and Sousa, W. P. (2008). Neural network
classification of mangrove species from multi-seasonal IKONOS imag-
ery. Photogrammetric Engineering and Remote Sensing 74, 921–927.
doi:10.14358/PERS.74.7.921
World Mangrove Network (2012). Western Indian Ocean Mangrove
Network/United States Forest Service Workshop report, Maputo,
Mozambique, 29–31 October 2012.
Zhu, Z., and Woodcock, C. E. (2012). Continuous monitoring of forest
disturbance using all available Landsat imagery. Remote Sensing of
Environment 122, 75–91. doi:10.1016/J.RSE.2011.10.030
www.publish.csiro.au/journals/mfr
Radar monitoring of mangroves Marine and Freshwater Research 603