Embed Size (px)
Citation preview
CONTROL ENGINEERING LABORATORY
Advanced and sustainable beneficiation of platinum group minerals (PGM) in sulphide poor
platinum (PGE) deposits, BEPGE-project Final report
Jarmo Kiuttu, Jari Ruuska and Leena Yliniemi
Report A No 42, May 2010
2
University of Oulu Control Engineering Laboratory Report A No 42, May 2010
Advanced and sustainable beneficiation of platinum group minerals (PGM) in sulphide poor platinum (PGE) deposits, BEPGE-project
Jarmo Kiuttu, Jari Ruuska and Leena Yliniemi
University of Oulu, Control Engineering Laboratory
Abstract: Flotation is a separation process, where valuable minerals and metals are separated from gangue minerals. The separation is based on the difference of the surface chemistry of minerals. Flotation has been used for beneficiation of minerals nearly 100 years, but still the mechanism of the process isn’t well known. The aim of this project is to develop the beneficiation process for sulphide poor PGE ores and to increase the knowledge of the flotation process. The developed process will be modelled by using HSC-Sim software. In this report some examples of control applications are presented, simulators for mineral processing industry are mentioned and a developed HSC-model for flotation is introduced. Keywords: Flotation, beneficiation, modeling, control, simulation, mineral processing ISBN 978-951-42-6234-0 University of Oulu ISSN 1238-9390 Control Engineering Laboratory P.O. Box 4300 FIN-90014 University of Oulu
3
1. INTRODUCTION .......................................................................................................... 4 2. Flotation .......................................................................................................................... 5 3. Control applications in mineral processing industry; literature review .......................... 6 4. Simulators used in mineral processing industry; literature review ............................... 10 5 Simulation programs and applications in mineral processing industry; literature review ........................................................................................................................................... 11
5.1 JKSimMet ............................................................................................................... 12 5.2 JKSimFloat ............................................................................................................. 12 5.3 UsimPac ................................................................................................................. 13 5.4 SUPASIM .............................................................................................................. 14 5.5 HSC ......................................................................................................................... 15
5.5.1 HSC Chemistry ................................................................................................ 15 5.5.2 HSC Sim .......................................................................................................... 16
6. HSC-Model for flotation ............................................................................................... 17 6.1. Simulation results ................................................................................................... 21
7. Future work ................................................................................................................... 24 References ......................................................................................................................... 25
4
1. INTRODUCTION This report is written based on the work done in the research project “Advanced and
sustainable beneficiation of platinum group minerals (PGM) in sulphide poor platinum
(PGE) deposits, BEPGE” financed by TEKES and companies. The aim of this research is
to develop a new, pro-environmental process for the beneficiation of sulphide poor PGE
minerals. The main interest is on using carbon dioxide during grinding and flotation.
BEPGE-project is carried out in co-operation with GTK (Geological Survey of Finland)
and companies. The examined ores come from two Finnish deposits, where the mine pits
are under construction. The aim of the Control Engineering Laboratory in this project is
to model and to simulate the developed beneficiation process.
The aim to develop a new beneficiation process is very challenging. Results should be
better than the existing beneficiation alternatives. The new beneficiation process
developed during this project could be usable for new opening mines in the future.
5
2. Flotation
Flotation is a separation process, where valuable minerals and metals are separated form
gangue minerals. Differences between minerals surface chemistry is beyond the
separation process. This means that surfaces of valuable minerals are made hydrophobic
with collector chemicals and the gangue minerals stay hydrophilic or are made
hydrophilic with depressant chemicals. The collector chemicals attach into the surfaces of
valuable minerals so that their hydrophobic end stays outwards, which makes it possible
the attachment of the minerals into the air bubbles. The depressant chemicals create a
sheer layer on to the surface of gangue minerals which prevents the flotation of gangue.
Frothers are used to create a stable froth on the flotation cell and to lower the surface
tension in slurry /Napier-Munn, 2007/.
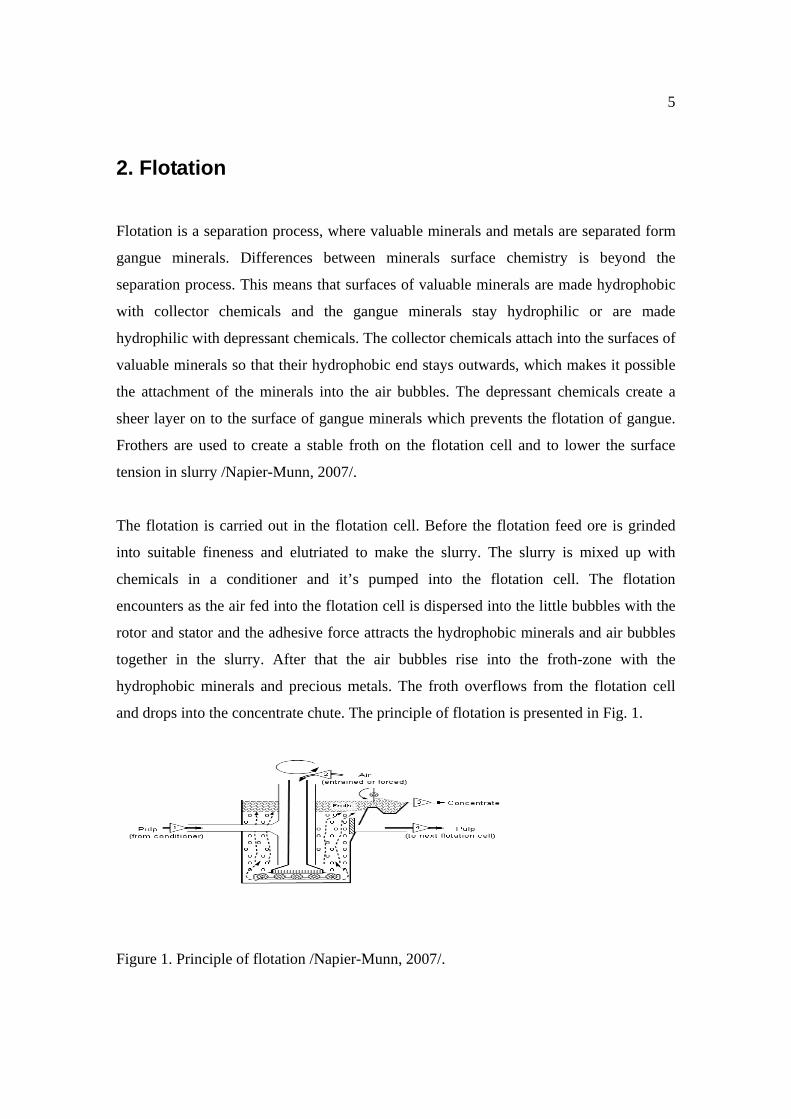
The flotation is carried out in the flotation cell. Before the flotation feed ore is grinded
into suitable fineness and elutriated to make the slurry. The slurry is mixed up with
chemicals in a conditioner and it’s pumped into the flotation cell. The flotation
encounters as the air fed into the flotation cell is dispersed into the little bubbles with the
rotor and stator and the adhesive force attracts the hydrophobic minerals and air bubbles
together in the slurry. After that the air bubbles rise into the froth-zone with the
hydrophobic minerals and precious metals. The froth overflows from the flotation cell
and drops into the concentrate chute. The principle of flotation is presented in Fig. 1.
Figure 1. Principle of flotation /Napier-Munn, 2007/.
6
3. Control applications in mineral processing industry; literature review Spencer et. al. (1999) have been studying SAG mill monitoring with acoustic emissions.
It has been shown that measurement of acoustic emissions can be used as a part of a
system for both process control and condition monitoring of SAG mills. To liberate
valuable minerals from gangue minerals, semi-autogenous grinding plays a very
important role and that’s why it is important to be able to control it. Monitoring of surface
vibration (acoustic emission) is commonly used as a non-invasive, low-cost means of
monitoring. Results of this study support the view that higher feed rate dynamic steady
states correspond to an increased charge mass, an increase in mill rotation speed results in
grinding media being lifted higher and more often directly impacting the shell liner, thus
increasing acoustic emissions.
A control strategy for a column flotation process has been developed by Persechini et. al.
(2004). The three variables affecting to the grade and the recovery-% during flotation are
the froth layer height, the air holdup in the collection zone and the bias. Three variables,
the wash water, air flowrate and tailings flowrate are selected for manipulation to keep
the three controlled variables in stable operating conditions. The dynamics of the process
is presented in the transfer function matrix. To determine the interaction between the
variables and the choice of proper pairing between controlled and manipulated variables
an analysis technique based on the relative gain array is done. The controllers are tested
in a pilot scale-plant to validate the designed PI-controllers.
Liu & MacGregor (2008) carried out a research considering flotation control with
machine vision. Proposed method is based on the causal process model predicting future
froth appearances from the given values of manipulated variables and observed values of
the process variables.
Chen et. al. (2007) present a fuzzy logic based on-line optimization control integrated in
an expert system of ball mill grinding circuit. Product particle size was controlled to
7
enhance ball mills efficiency. Control strategies practicality, reliability and effectiveness
were demonstrated by testing it in an industrial operation.
Kämpjärvi & Jämsä-Jounela (2003) compared different control strategies to control level
in flotation cells. Four control strategies including one SISO (Single Input single Output)
and three MIMO (Multiple Input Multiple Output) controllers were tested. Model for six
flotation cells in series were used and simulations were performed with Matlab. Results
show that level control performances are significantly better with MIMO controllers than
with SISO controllers. This is due to high interaction between the control loops, which
cannot be taken into account by using SISO systems.
Orchard et. al. (2001) present the fuzzy predictive control technique based application to
optimize the operation of a grinding plant. Application is specially desingned in order to
maximize the ore feed rate and to follow a pre-determined particle size set-point.
Simulations done with Matlab under typical disturbances show this control scheme more
efficient than a classical one.
A multivariable decoupling internal model control for a grinding circuit is presented by
Zhou et. al. (2008). Simulations are performed for servo, regulatory, disturbance rejection
and robustness problems. Simulations show the better performance of decoupling, set-
point response, load disturbance rejection, fault tolerance and robustness.
Maldonado et. al. (2007) present an optimal control of a rougher flotation process. The
optimization problem is solved considering phenomenological models for each flotation
tank of the circuit, validated by using process data obtained from several sampling
surveys carried out in a rougher flotation circuit of a Chilean mineral processing plant.
The control objective is the minimization of the Cu tailing grade in each tank given a
final Cu concentrate grade. Simulation results show a good correspondence between the
proposed optimization strategy and the actual operating practices at the rougher flotation
plant under survey.
8
Orchard et. al. (2001) presented a fuzzy predictive control application for mineral
grinding plant. Controlled variables are solids percentage, particle size and power
demand. Manipulated variables are water and ore feed flows. The controller uses linear
multivariable models and fuzzy characterization of the controlled variables and calculates
the manipulated variables. Simulations performed under typical disturbances show a
better performance compared to conventional predictive control.
Hamilton & Guy (2001) introduced a level control system developed by CSIRO. This
new device is based on the use of a Linear Variable Differential Transformer which
measures the change of pulp level as indicated by a floating device at the liquid-air
interface. They also present a level control based on pressure measurement. A change in a
pulp level produces a corresponding change in the flotation tanks side tube pressure. This
change is used as a signal for control.
Bouchard et. al (2005) review the recently done work at Universite Laval in the field of
column flotation instrumentation and control. The control results presented, rely on froth
depth and bias sensors. Results show that control of a flotation column could be improved
by using different control methods, such as nonlinear, multivariable and feed-forward
control. The emphasis is placed on the available information, which may be used to reach
the control objectives. Laboratory and pilot-scale results indicate that integrating
knowledge of the process and new measurements available are necessary to reach the
control objectives.
Chuk & Nuñes (2003) introduce a robust GPC (generalized predictive control) of a
flotation column. A robust GPC design is applied to control froth depth and gas hold-up
in a laboratory-scale flotation column. Tests are made to demonstrate that the goals are
achieved. Froth depth and gas hold-up have a fast and offset-free behavior and controller
can manage a wide range of mineralogical changes in feed, such as density, rate, size and
grade.
9
Bergh & Yianatos (2003) present a monitoring and control application designed for
flotation column. PLS (partial least square)-model are used to illustrate the process.
Simulations show that these models can be used to provide alarms to operators and start-
up procedures to remedy the abnormal situation.
Ding et. al (2006) present a hybrid intelligent systems for supervisory control of mineral
grinding process. System consists of in addition to basic instrumentation, actuator, a
process control system, a supervisory control system and a technical performance index
decision system, which is done by using CBR (Case Based Reasoning –method).
Supervisory control system is to adjust the set-points of control loops of the process
control system according to the particle size determined by its decision system and
production condition. The system is compared to the NN (Neural Networks) –method and
the results show the validity and efficiency of the system.
Jämsä-Jounela et al (2001) developed a monitoring tool for calculating performance
indices of the control loops. The structure of the tool is demonstrated via level control of
the flotation cells. The simulations and the tests show that the indices were sufficient to
provide the necessary information about the control performance.

10
4. Simulators in mineral processing industry; literature review
Smith et. al (2008) developed base-case model, of a bank of flotation cells at a South
African platinum mine on a physics-based froth zone simulator, FrothSim. FrothSim
models the three phases (solid, liquid and gas) in flotation froths and model entrainment
and drainage of water and unattached solids, allowing the upgrading effect of a froth to
be simulated. The overflow rates for minerals were simulated and the entrained minerals
and water rates were predicted. After determining the optimum air-profile, it was tested in
a froth experimental sampling campaign and confirmed the predicted improvement in
flotation performance along the bank.
A multistage flotation plant simulator done in Matlab was introduced by Loveday &
Hemphill (2006). Simulator is to maximize platinum recovery, while maintaining the
mass of final concentrate. Pulp kinetics based conventional models were regressed to
steady-state data from a nine stage platinum flotation plant. To characterize the froth in
each stage, ‘froth factors’ were obtained by regression. Also a ‘depressant factor’ was
required for gangue minerals to account for effect of additional depressant in the cleaners.
To limit the amount of model parameters, only two pulp kinetic parameters and two
recycle parameters were used for three mineral classes. Simulations present an
improvement in recovery with the existing circuit and the extra cleaning stage addition
caused a further increase in recovery. Plant tests are in the progress to verify the
simulations.
11
5 Simulation programs and applications in mineral processing
industry; literature review
Schwarz & Alexander (2006) describe enhancement done in flotation circuit performance
by simulation by using JKSimFloat. They describe the simulation principles in details and
they show two case studies, where the simulation resulted in substantial improvements to
the sites.
Vorster et. al (2001) introduce an investigation into the effect of microwave radiation on
the processing of a massive sulphide ore. Significant reductions in the Bond work index
can be achieved without any discernible adverse effect on the subsequent flotation
process. A maximum reduction in work index was achieved after microwave exposure.
Process simulation on the package USIMPAC showed significant flowsheet changes are
possible as result of exposure to microwave radiation and the subsequent reduction in
work index.
Three articles by Hay & Rule (2003)/24/, Hay (2005)/25/ and Hay & Schroeder
(2005)/26/ are written about the use of SUPASIM –program to design, analyse, diagnose,
understand and optimise flotation.
Klumowsky & Rijkers (1996) describe the experimental work done with small SAG mill.
They also describe how to use data to scale-up SAG mill. They also compare different
simulation techniques using programs MICROSIM, JKSimMet and USimPac. A
conclusion drawn from the work is that small-scale SAG mills can be used to accurately
design SAG mill circuits, provided that the ball size and feed size of the samples used is
large enough.
12
5.1 JKSimMet /26/
JKSimMet is a software package, which is tailored specifically for plant and development
metallurgists who wish to plant behaviour and for design engineers who need process
simulation models to assess design alternatives. Software is made for the analysis and
simulation of comminution and classification circuits in mineral processing operations.
JKSimMet is developed in Julius Kruttschnitt Mineral Research Center (JKMRC),
Australia. Sofware incorporates models, which are based on a large database of operating
plant data and tested in actual plant conditions (www.jktech.com).
JKSimMet allows the user to:
• build a graphic-based flowsheet of the prosessing plant
• assign machine criteria and model parameters to each plant case study
• simulate the effect caused by changes in operating conditions to predict
product flows and size distributions
• determine optimum conditions, including plant throughput
Following models are available: rod and ball mill, autogenous and semi-autogenous mill,
crusher, HPGR (high-pressure grinding roll), simple degradation, vibrating screen –
single and double deck, DSM (Dutch State Mine) screen aka sieve bend, hydrocyclone,
effiency curve and splitter.
5.2 JKSimFloat /27/
JKSimFloat is a windows-based software package for the simulation of flotation plant
operations. The software is developed for plant metallurgists, operators, researchers and
consultants. The models behind the JKSimFloat have been applied to over 50 flotation
operations including base-metals (Pb, Zn, Cu, Ni). Simulations of very complex circuits
13
with JKSimFloat may only require a few seconds to converge, compared to previous
spreadsheet methods which could last several hours (www.jktech.com).
JKSimFloat allows the user to:
• build a graphic-based flowsheet of the prosessing plant
• assign machine criteria and model parameters to each plant case study
• simulate the effect of changes in the flowsheet to predict the flows, size
distributions and element distributions
• determine optimum grade and recovery via simulation
• adjust floatability components to estimate the effect of regrinding and
reagent addition
There are model available for: AMIRA P9 flotation model, conventional, column,
Jameson cells, hydrocyclone, size redistribution (regrinding), floatability transfer
(reagent), splitter and combiner.
5.3 UsimPac /28/
USimPac is a process simulation software package developed by BRGM and
commercialized since 1986. BRGM is France's leading public institution in the
geoscience field. It is a user-friendly steady-state simulator that allows mineral
processing engineers and scientists to model plant operations with available experimental
data and determine optimal plant configuration that meets production targets. The
simulator can also assist plant designers with sizing unit operations required to achieve
given circuit objectives (www.caspeo.net).
The software package contains functions that can:
• manipulate experimental data,
14
• calculate coherent material balances, sizes and settings of unit operations,
physical properties of the processed materials,
• simulate plant operation and display results in tables and graphs.
A simulator combines the following elements:
• A flowsheet that describes the process in terms of successive unit
operations and material streams.
• A phase model that describes the materials handled by the plant (raw
material, products, reagents, water, wastes).
• A mathematical model for each unit operation. This model formalizes the
current scientific knowledge about the unit operation.
• A set of algorithms for data reconciliation, model calibration, unit
operation sizing, full material balance calculation, power consumption and
capital cost calculation.
USimPac has over 40 comminution modules used in mineral processing. The complete
list can be found from http://www.caspeo.net/en/Software/SoftMainFrame.htm.
5.4 SUPASIM /31/
SUPASIM is a proprietary flotation simulation program and an empirical mill sizing
methodology developed in mid 80’s. It also maintains a large database of milling and
flotation operations as well as associated laboratory and pilot test data to characterise ores
and predict plant performance. The approach of SUPASIM is the ore characterisation,
information organising in an understandable way and add structure to the complex
flotation situation and by doing so to support the user to interpret the relationship
between variables and optimise the flotation process (Hay, 2005). In addition to
simulating over 35 operating flotation plants from laboratory data, SUPASIM has been
15
used to design and simulate the performance of four flotation plants from laboratory data
only (www.venmyn.com).
5.5 HSC
HSC-software is a product developed by Outokumpu Technology. It was originally done
for their own calculating purposes, which is still one important area of focus for
development work.
5.5.1 HSC Chemistry /32/
HSC Chemistry software enables the user to simulate chemical reactions and processes
on a thermochemical basis. This method does not take into account all the necessary
factors, such as rates of reactions, heat and mass transfer issues, etc. However, in many
cases a pure thermochemical approach may easily give useful and versatile information
for developing new chemical processes and improving existing ones.
With HSC Chemistry it is possible to calculate chemical equilibria between pure
substances and the ideal and also, to some extent, non-ideal solutions. For these
calculations only enthalpy (H), entropy (S) and heat capacity (Cp) data for all prevailing
compounds or pure substances is needed. In many cases these calculation results may
simulate the real chemical reactions and processes at sufficient accuracy for practical
applications.
Of course, experimental work is needed to verify the results, because HSC does not take
kinetic phenomena into account. However, HSC helps to avoid expensive trial-and-error
chemistry, because it quickly and easily gives some kind indication of the effects of
process parameters on the reaction products and process conditions. Usually,
thermochemical calculations at least show what is physically possible and what is
16
impossible, which is highly valuable information when making plans for experimental
investigations.
The HSC 6.0 contains 21 calculation modules and 11 databases. The name of the
program is based on the fact that calculation modules automatically utilize the same
extensive thermochemical database which contains enthalpy (H), entropy (S) and heat
capacity (Cp) data for more than 20 000 chemical compounds.
5.5.2 HSC Sim /33/
Reason for doing HSC Sim was to expand the area of use from the modelling of single
chemical reactions to the modelling of whole process. Using HSC Sim –module it is
possible to connect single reactors using graphic flowsheet. With HSC Sim –module it is
possible to model and simulate an existing or completely new process. HSC Sim –module
contains common mineralogical, hydrometallurgical and pyrometallurgical process
models. Via simulation it is possible for example to minimize the out coming waste from
process by using closed loops of process. Shortly said, waste can be changed often as
valuable raw materials, if an appropriate feeding point is from them in process.
Experimental testing of these kinds of matters is not often done, as tests can stir up the
process and cause danger situations.
17
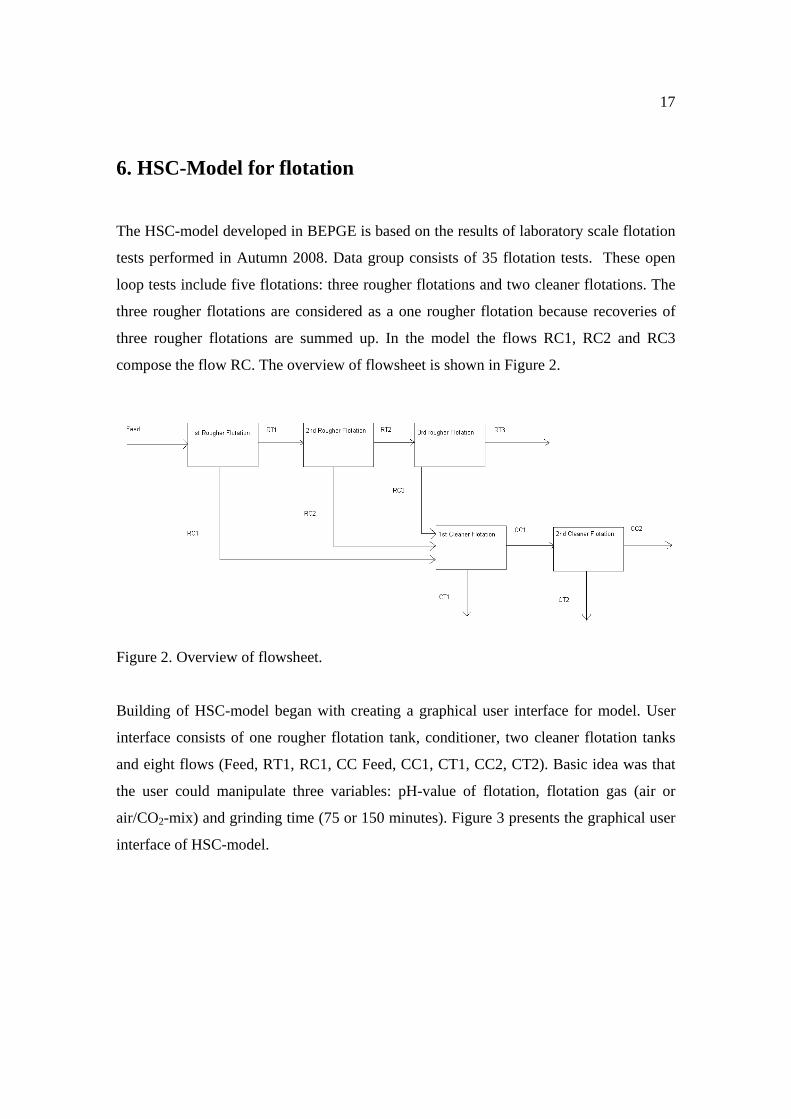
6. HSC-Model for flotation
The HSC-model developed in BEPGE is based on the results of laboratory scale flotation
tests performed in Autumn 2008. Data group consists of 35 flotation tests. These open
loop tests include five flotations: three rougher flotations and two cleaner flotations. The
three rougher flotations are considered as a one rougher flotation because recoveries of
three rougher flotations are summed up. In the model the flows RC1, RC2 and RC3
compose the flow RC. The overview of flowsheet is shown in Figure 2.
Figure 2. Overview of flowsheet.
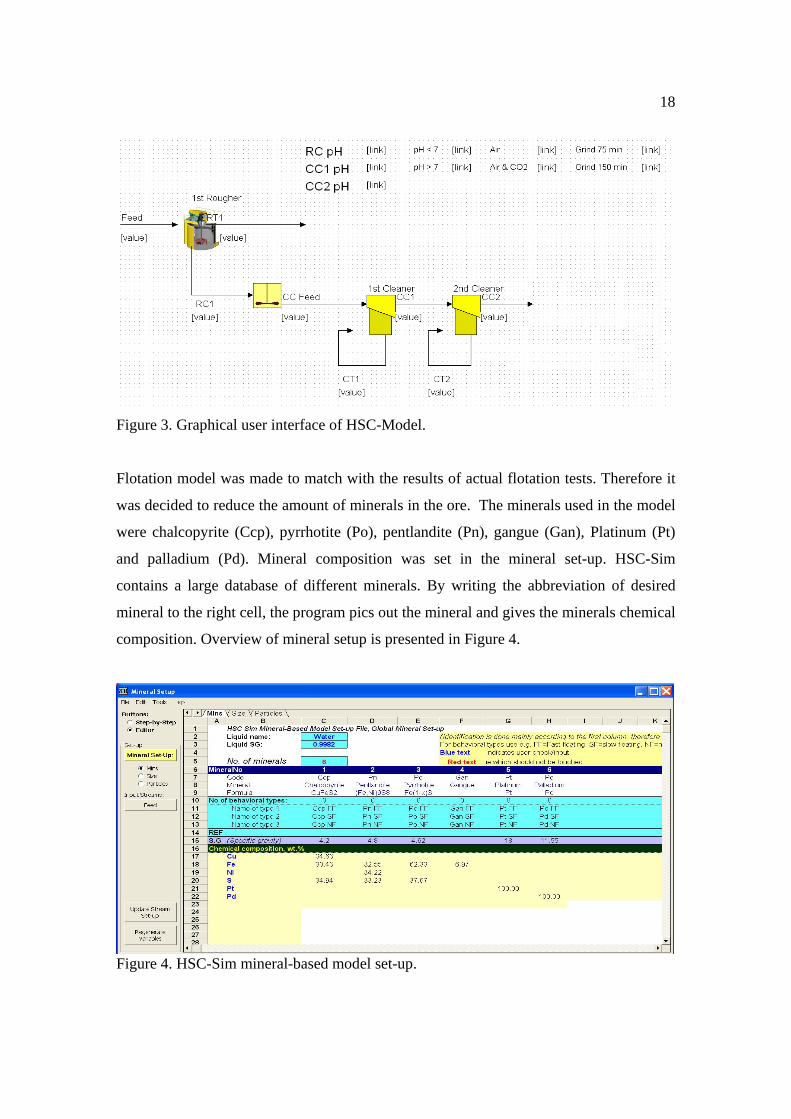
Building of HSC-model began with creating a graphical user interface for model. User
interface consists of one rougher flotation tank, conditioner, two cleaner flotation tanks
and eight flows (Feed, RT1, RC1, CC Feed, CC1, CT1, CC2, CT2). Basic idea was that
the user could manipulate three variables: pH-value of flotation, flotation gas (air or
air/CO2-mix) and grinding time (75 or 150 minutes). Figure 3 presents the graphical user
interface of HSC-model.
18
Figure 3. Graphical user interface of HSC-Model.
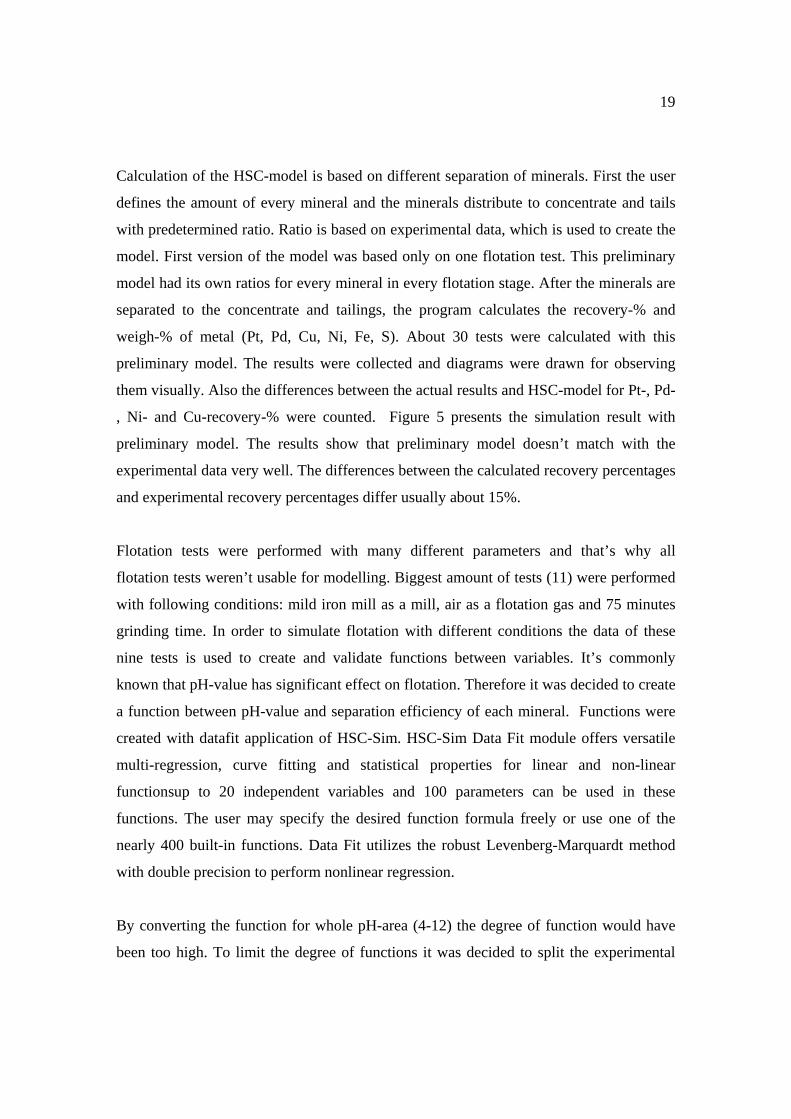
Flotation model was made to match with the results of actual flotation tests. Therefore it
was decided to reduce the amount of minerals in the ore. The minerals used in the model
were chalcopyrite (Ccp), pyrrhotite (Po), pentlandite (Pn), gangue (Gan), Platinum (Pt)
and palladium (Pd). Mineral composition was set in the mineral set-up. HSC-Sim
contains a large database of different minerals. By writing the abbreviation of desired
mineral to the right cell, the program pics out the mineral and gives the minerals chemical
composition. Overview of mineral setup is presented in Figure 4.
Figure 4. HSC-Sim mineral-based model set-up.
19
Calculation of the HSC-model is based on different separation of minerals. First the user
defines the amount of every mineral and the minerals distribute to concentrate and tails
with predetermined ratio. Ratio is based on experimental data, which is used to create the
model. First version of the model was based only on one flotation test. This preliminary
model had its own ratios for every mineral in every flotation stage. After the minerals are
separated to the concentrate and tailings, the program calculates the recovery-% and
weigh-% of metal (Pt, Pd, Cu, Ni, Fe, S). About 30 tests were calculated with this
preliminary model. The results were collected and diagrams were drawn for observing
them visually. Also the differences between the actual results and HSC-model for Pt-, Pd-
, Ni- and Cu-recovery-% were counted. Figure 5 presents the simulation result with
preliminary model. The results show that preliminary model doesn’t match with the
experimental data very well. The differences between the calculated recovery percentages
and experimental recovery percentages differ usually about 15%.
Flotation tests were performed with many different parameters and that’s why all
flotation tests weren’t usable for modelling. Biggest amount of tests (11) were performed
with following conditions: mild iron mill as a mill, air as a flotation gas and 75 minutes
grinding time. In order to simulate flotation with different conditions the data of these
nine tests is used to create and validate functions between variables. It’s commonly
known that pH-value has significant effect on flotation. Therefore it was decided to create
a function between pH-value and separation efficiency of each mineral. Functions were
created with datafit application of HSC-Sim. HSC-Sim Data Fit module offers versatile
multi-regression, curve fitting and statistical properties for linear and non-linear
functionsup to 20 independent variables and 100 parameters can be used in these
functions. The user may specify the desired function formula freely or use one of the
nearly 400 built-in functions. Data Fit utilizes the robust Levenberg-Marquardt method
with double precision to perform nonlinear regression.
By converting the function for whole pH-area (4-12) the degree of function would have
been too high. To limit the degree of functions it was decided to split the experimental
20
data into two sections according the pH-value: acid (2 tests) and alkaline (9 tests).
Functions for separation efficiency vs. pH-value were converted for each mineral in acid
and alkaline conditions. In alkaline pH data of 6 tests were used for modelling and 3 for
testing and in acid pH data of one test for modelling and one for testing were used. Due
the lack of data there weren’t enough experimental points to convert the functions based
only on experimental data. HSC-Sim offers an application to manipulate the results if
user knows, on the basis of other information sources, the approximate path of the
function curve. Therefore trim points were added to boost the data. Trim points were
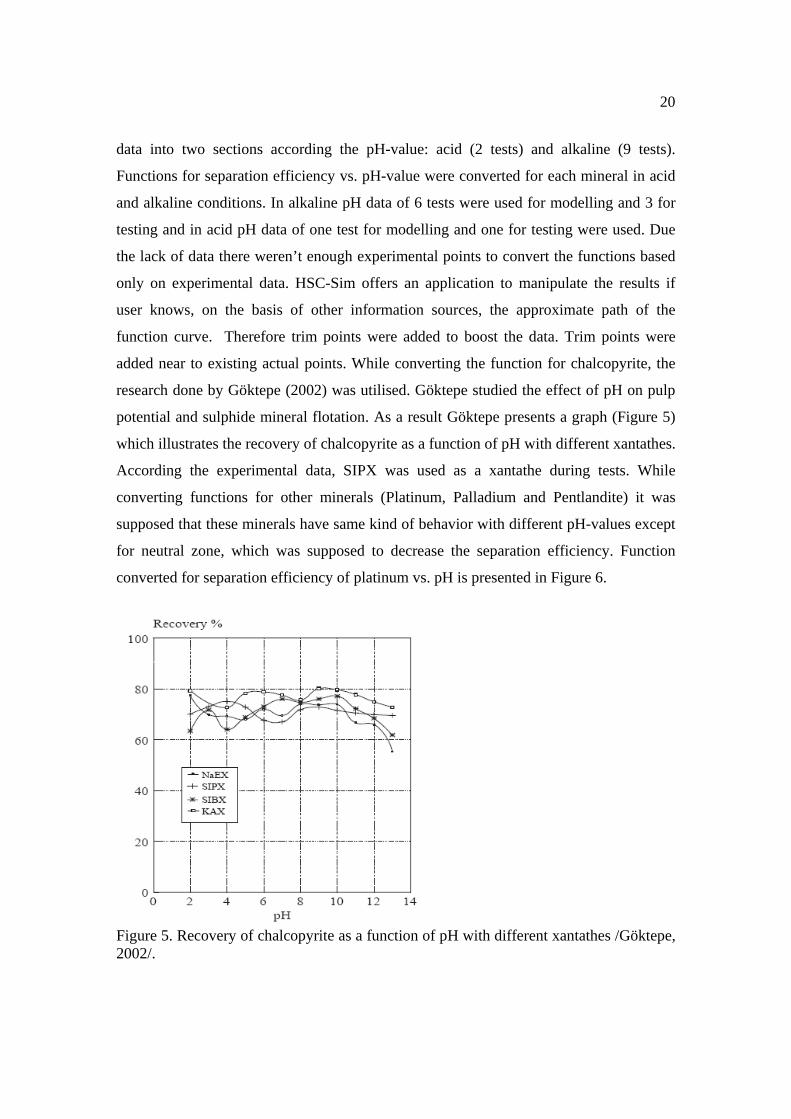
added near to existing actual points. While converting the function for chalcopyrite, the
research done by Göktepe (2002) was utilised. Göktepe studied the effect of pH on pulp
potential and sulphide mineral flotation. As a result Göktepe presents a graph (Figure 5)
which illustrates the recovery of chalcopyrite as a function of pH with different xantathes.
According the experimental data, SIPX was used as a xantathe during tests. While
converting functions for other minerals (Platinum, Palladium and Pentlandite) it was
supposed that these minerals have same kind of behavior with different pH-values except
for neutral zone, which was supposed to decrease the separation efficiency. Function
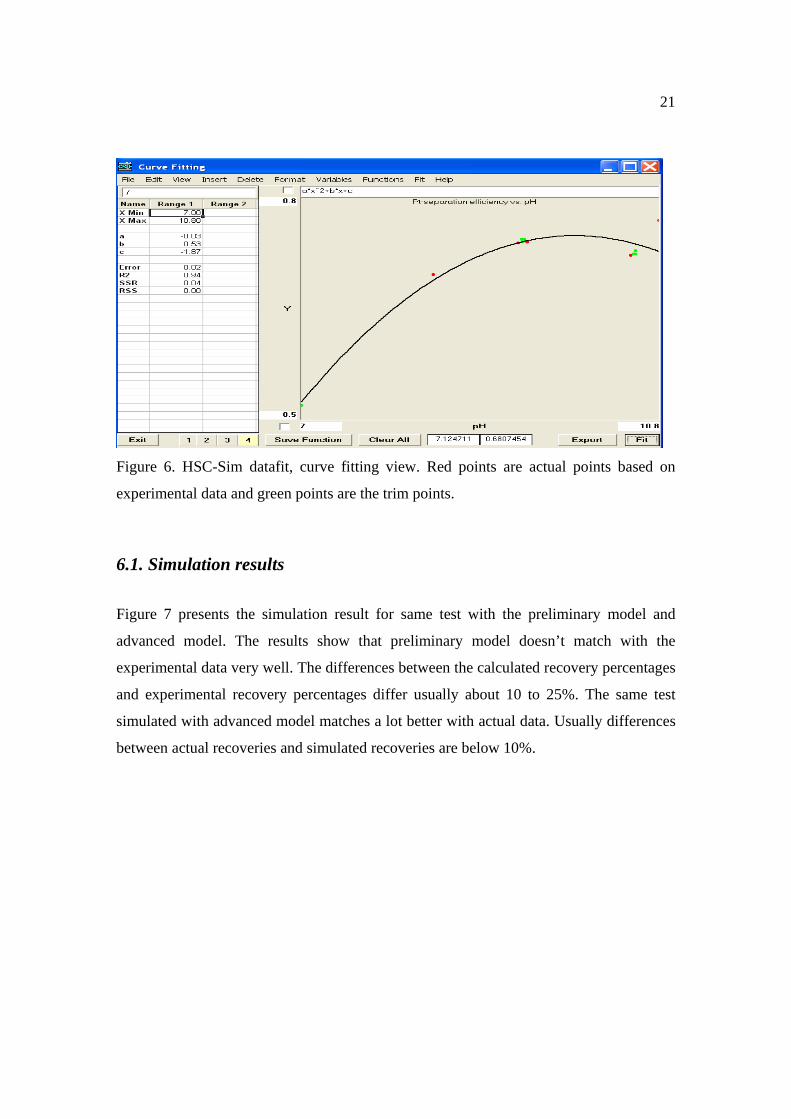
converted for separation efficiency of platinum vs. pH is presented in Figure 6.
Figure 5. Recovery of chalcopyrite as a function of pH with different xantathes /Göktepe, 2002/.
21
Figure 6. HSC-Sim datafit, curve fitting view. Red points are actual points based on
experimental data and green points are the trim points.
6.1. Simulation results
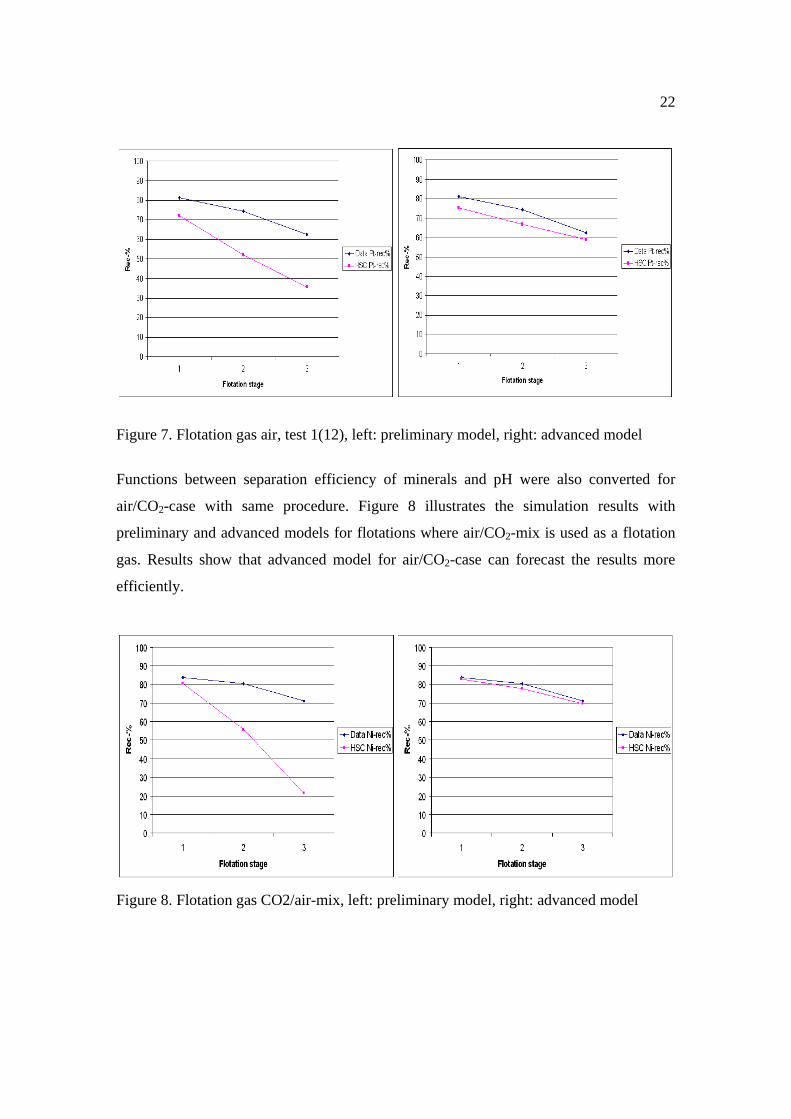
Figure 7 presents the simulation result for same test with the preliminary model and
advanced model. The results show that preliminary model doesn’t match with the
experimental data very well. The differences between the calculated recovery percentages
and experimental recovery percentages differ usually about 10 to 25%. The same test
simulated with advanced model matches a lot better with actual data. Usually differences
between actual recoveries and simulated recoveries are below 10%.
22
Figure 7. Flotation gas air, test 1(12), left: preliminary model, right: advanced model
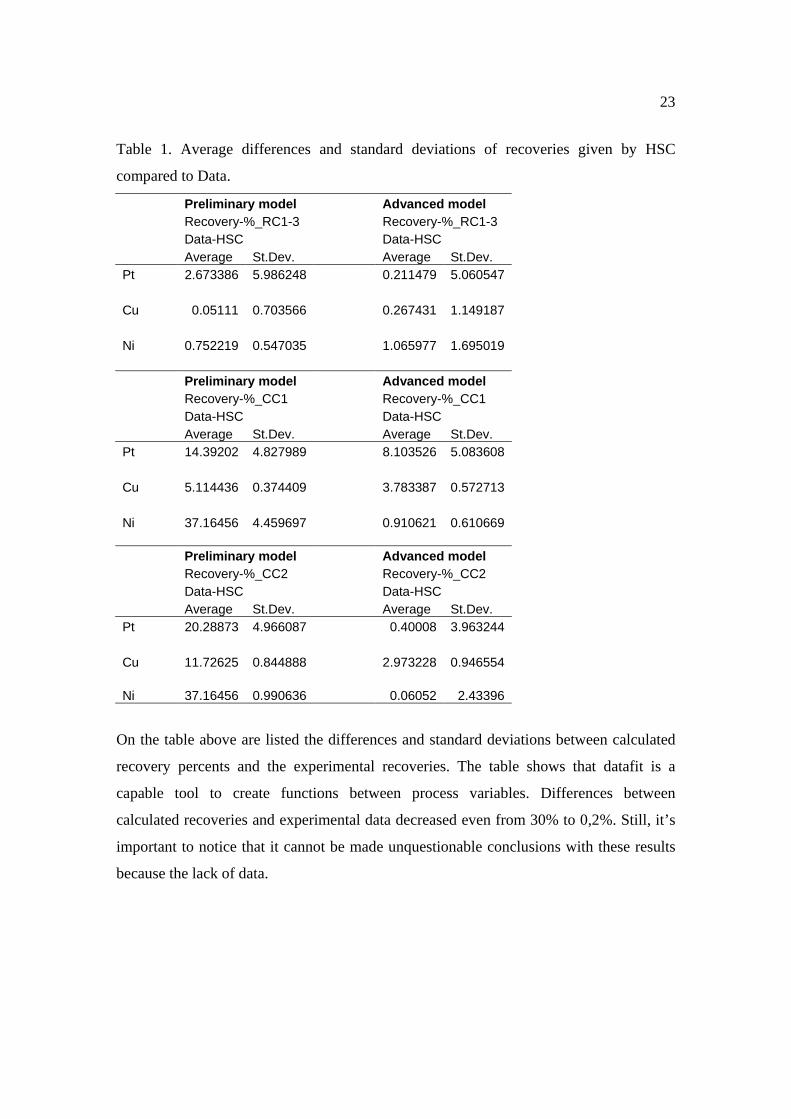
Functions between separation efficiency of minerals and pH were also converted for
air/CO2-case with same procedure. Figure 8 illustrates the simulation results with
preliminary and advanced models for flotations where air/CO2-mix is used as a flotation
gas. Results show that advanced model for air/CO2-case can forecast the results more
efficiently.
Figure 8. Flotation gas CO2/air-mix, left: preliminary model, right: advanced model
23
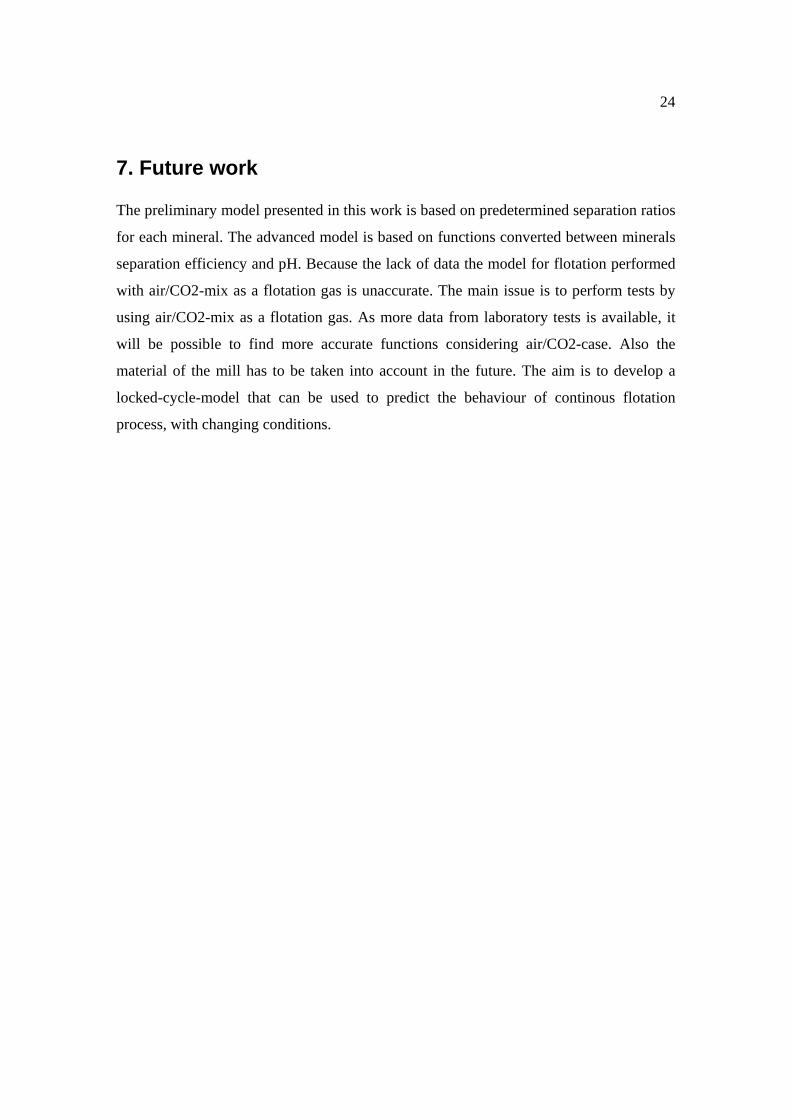
Table 1. Average differences and standard deviations of recoveries given by HSC
compared to Data.
Preliminary model Advanced model Recovery-%_RC1-3 Recovery-%_RC1-3 Data-HSC Data-HSC Average St.Dev. Average St.Dev. Pt 2.673386 5.986248 0.211479 5.060547 Cu 0.05111 0.703566 0.267431 1.149187 Ni 0.752219 0.547035 1.065977 1.695019 Preliminary model Advanced model Recovery-%_CC1 Recovery-%_CC1 Data-HSC Data-HSC Average St.Dev. Average St.Dev. Pt 14.39202 4.827989 8.103526 5.083608 Cu 5.114436 0.374409 3.783387 0.572713 Ni 37.16456 4.459697 0.910621 0.610669 Preliminary model Advanced model Recovery-%_CC2 Recovery-%_CC2 Data-HSC Data-HSC Average St.Dev. Average St.Dev. Pt 20.28873 4.966087 0.40008 3.963244 Cu 11.72625 0.844888 2.973228 0.946554 Ni 37.16456 0.990636 0.06052 2.43396
On the table above are listed the differences and standard deviations between calculated
recovery percents and the experimental recoveries. The table shows that datafit is a
capable tool to create functions between process variables. Differences between
calculated recoveries and experimental data decreased even from 30% to 0,2%. Still, it’s
important to notice that it cannot be made unquestionable conclusions with these results
because the lack of data.
24
7. Future work The preliminary model presented in this work is based on predetermined separation ratios
for each mineral. The advanced model is based on functions converted between minerals
separation efficiency and pH. Because the lack of data the model for flotation performed
with air/CO2-mix as a flotation gas is unaccurate. The main issue is to perform tests by
using air/CO2-mix as a flotation gas. As more data from laboratory tests is available, it
will be possible to find more accurate functions considering air/CO2-case. Also the
material of the mill has to be taken into account in the future. The aim is to develop a
locked-cycle-model that can be used to predict the behaviour of continous flotation
process, with changing conditions.
25
References 1. Bergh, L.G.; Yianatos, J.B. (2003). Flotation column monitoring and control based on
PLS models, IFAC Workshop on New Technologies for Automation of the Metallurgical Industry, Proceedings, Shanghai, China, 11-13 October 2003, pp. 352-358
2. Bouchard, J.; Desbiens, A.; Villar, R. del (2005). Recent advances in bias and froth depth control in flotation columns, Minerals Engineering 18/2005, pp. 709-720
3. Chen, X.; Zhai, J.; Li, Q.; Fei, S. (2007). Fuzzy Logic Based On-Line Efficiency Optimization Control of a Ball Mill Grinding Circuit, Fuzzy Systems and Knowledge Discovery, FSKD 2007, Fourth International Conference, Proceedings, Haikou, China, 24-27 August 2007, pp. 575-580
4. Chuk, O.D.; Nuñez, E. (2003). Robust GPC control of a flotation column using genetic algorithms, IFAC Workshop on New Technologies for Automation of the Metallurgical Industry, Proceedings, Shanghai, China, 11-13 October 2003, pp. 347-351
5. Ding, J.; Zhou, P.; Liu, C.; Chai, T. (2006). Hybrid Intelligent System for Supervisory Control of Mineral Grinding Process, Intelligent Systems Design and Applications, 2006, ISDA '06, Sixth International Conference, Proceedings, Jinan, China, 16-18 October 2006, pp. 979-984
6. Göktepe, F. (2002). Effect of pH on pulp potential and sulphide mineral flotation, Turkish J. Eng. Env. Sci. 26/2002, pp. 309-318.
7. Hamilton, J.A.; Guy, P.J. (2001). Pulp level control for flotation – options and a CSIRO laboratory perspective, Minerals Engineering 14/2001, pp. 77-86
8. Hay, M.P.; Rule, C.M. (2003). SUPASIM: a flotation plant design and analysis methodology, Minerals Engineering 16/2003, pp. 1103-1109
9. Hay, M.P. (2005). Using the SUPASIM flotation model to diagnose and understand flotation behaviour from laboratory through to plant, Minerals Engineering 18/2005, pp. 762-771
10. Hay, M.P.; Schroeder, G. (2005). Use of the SUPASIM flotation model in optimising Impala’s UG2 circuit, Minerals Engineering 18/2005, pp. 772-784
11. Jämsä-Jounela, S-L; Poikonen, R.; Vatanski, N.; Rantala, A. (2003). Evaluation of control performance: methods, monitoring tool and applications in a flotation plant, Minerals Engineering 16/2003, pp. 963-976
12. Klymowsky, I.B.; Rijkers, A.L.M. (1996). The use of data from small-scale mills and computer simulation techniques for scale-up and design of SAG mill circuits, Int. J. Miner. Process 44-45/1996, pp. 273-287
13. Kämpjärvi, P. & Jämsä-Jounela, S-L (2003). Level control strategies for flotation cells, Minerals Engineering 16/2003, pp. 1061-1068
14. Liu, J.J. & MacGregor, J.F. (2008). Froth-based modeling and control of flotation processes, Minerals Engineering 21/2008, pp. 642-651
15. Loveday, B.K.; Hemphill, A.L. (2006). Optimisation of a multistage flotation plant using plant survey data, Minerals Engineering 19/2006, pp. 627-632
26
16. Maldonado, M.; Sbarbaro, D.; Lizama, E. (2007). Optimal control of a rougher flotation process based on dynamic programming, Minerals Engineering 20/2007, pp. 221-232
17. Napier-Munn, T.J. ed., 2007. Wills’ Mineral Processing Technology. 7th ed. Oxford: Butterworth-Heinemann, 2007, 444 p.
18. Orchard, M.; Flores, A.; Munoz, C.; Cipriano, A. (2001). Model-based predictive control with fuzzy characterization of goals and constraints, applied to the dynamic optimization of grinding plants, Fuzzy Systems, 2001, 10th IEEE International Conference, Proceedings, Melbourne, Australia, 2-5 December 2001, pp. 916-919
19. Orchard, M.; Flores, A.; Munoz, C.; Cipriano, A. (2001). Predictive control with fuzzy characterization of percentage of solids, particle size and power demand for minerals grinding, Control Applications, 2001, IEEE International Conference, Proceedings, Mexico City, Mexico, 5-7 September 2001, pp. 600-605
20. Persechini, M.A.M.; Peres, A.E.C.; Jota, F.G (2004). Control strategy for a column flotation process, Control Engineering Practice 12/2004, pp. 963-976
21. Schwarz, S.; Alexander, D. (2006). JKSimFloat V6.1 PLUS: Improving flotation circuit performance by simulation, Mineral process modelling, simulation and control conference, 2006, International Conference, Proceedings, Ontario, Canada, 6-7 June 2006, pp. xxx-xxx
22. Smith, C.; Neethling, S.; Cilliers, J.J. (2008). Air-rate profile optimisation: From simulation to bank improvement, Minerals Engineering, Article in press, 2008. pp. xxx-xxx
23. Spencer, S.J.; Campbell, J.J.; Weller, K.R.; Liu, Y (1999). Acoustic emissions monitoring of SAG mill performance, Intelligent Processing and Manufacturing of Materials, IPMM '99, Second International Conference, Proceedings, Honolulu, HI, 10-15 July 1999, pp. 939-946
24. Vorster, W.; Rowson, N.A.; Kingman, S.W. (2001). The effect of microwave radiation upon the processing of Neves Corvo Copper ore, Int. J. Miner. Process 63/2001, pp. 29-44
25. Zhou, P.; Chai, T.; Wang, H.; Su, C-Y (2008). Multivariable decoupling internal model control for grinding circuit, American Control Conference, Proceedings, Seattle, USA, 11-13 June 2008, pp. 2475-2480
26.http://www.jktech.com.au/Products_Services/Brochure_Files/Softwawre_JKSimMet_006_b_EMAIL.pdf (10.3.2010)
27.http://www.jktech.com.au/Products_Services/Brochure_Files/Software_JKSimFloat_007_b_EMAIL.pdf (10.3.2010)
28.http://www.caspeo.net/en/Software/USIMPAC/USIMPAC_Generalities.htm (11.3.2010) 29. http://www.venmyn.com/associates.php (11.3.2010) 30. http://www.outotec.com/hsc (12.3.2010) 31.http://akseli.tekes.fi/opencms/opencms/OhjelmaPortaali/ohjelmat/MASI/fi/Dokumenttiarkisto/Viestinta_ja_aktivointi/Lehdistotiedotteet/Outotec_HSC-Sim_Lehdistotiedote.pdf (15.3.2010) 32. HSC-Sim manual available at http://www.outotec.com/39500.epibrw

27
ISBN 978-951-42-6234-0 ISSN 1238-9390 University of Oulu Control Engineering Laboratory – Series A Editor: Leena Yliniemi 26. Paavola M, Ruusunen M & Pirttimaa M, Some change detection and time-series forecasting algorithms for an electronics manufacturing process. 23 p. March 2005. ISBN 951-42-7662-0. ISBN 951-42-7663-9 (pdf). 27. Baroth R. Literature review of the latest development of wood debarking. August 2005. ISBN 951-42-7836. 28. Mattina V & Yliniemi L, Process control across network, 39 p. October 2005. ISBN 951-42-7875-5. 29. Ruusunen M, Monitoring of small-scale biomass combustion processes. 28 p. March 2006. ISBN 951-42-8027-X. ISBN 951-42-8028-8 (pdf). 30. Gebus S, Fournier G, Vittoz C & Ruusunen M, Knowledge extraction for optimizing monitorability and controllability on a production line. 36 p. March 2006. ISBN 951-42-9390-X 31. Sorsa A & Leiviskä K, State detection in the biological water treatment process. 53 p. November 2006. ISBN 951-42-8273-6 32. Mäyrä O, Ahola T & Leiviskä K, Time delay estimation and variable grouping using genetic algorithms. 22 p. November 2006. ISBN 951-42-8297-3 33. Paavola M, Wireless Technologies in Process Automation - A Review and an Application Example. 46 p. December 2007. ISBN 978-951-42-8705-3 34. Peltokangas R & Sorsa A, Real-coded genetic algorithms and nonlinear parameter identification. 28 p. April 2008. ISBN 978-951-42-8785-5. ISBN 978-951-42-8786-2 (pdf). 35. Rami-Yahyaoui O, Gebus S, Juuso E & Ruusunen M, Failure mode identification
through linguistic equations and genetic algorithms. August 2008. ISBN 978-951-42-8849-4, ISBN 978-951-42-8850-0 (pdf).
36. Juuso E, Ahola T & Leiviskä K, Variable selection and grouping. August 2008. ISBN 978-951-42-8851-7. ISBN 978-951-42-8852-4 (pdf). 37. Mäyrä O & Leiviskä K, Modelling in methanol synthesis. December 2008. ISBN 978-951-42-9014-5 38. Ohenoja M, One- and two-dimensional control of paper machine: a literature review. October 2009. ISBN 978-951-42-9316-0 39. Paavola M & Leiviskä K, ESNA – European Sensor Network Architecture. Final
Report. 12 p. December 2009. ISBN 978-951-42-6091-9 40. Virtanen V & Leiviskä K, Process Optimization for Hydrogen Production using Methane, Methanol or Ethanol. ISBN 978-951-42-6102-2 41. Keskitalo J & Leiviskä K, Mechanistic modelling of pulp and paper mill wastewater
treatment plants. January 2010. ISBN 978-951-42-6110-7 42. Kiuttu J, Ruuska J & Yliniemi L, Advanced and sustainable beneficiation of
platinum group minerals (PGM) in sulphide poor platinum (PGE) deposits- BEPGE. Final Report. 27 p. May 2010. ISBN 978-951-42-6234-0