Embed Size (px)
Citation preview

HAL Id: hal-02083060https://hal.umontpellier.fr/hal-02083060
Submitted on 6 Nov 2020
HAL is a multi-disciplinary open accessarchive for the deposit and dissemination of sci-entific research documents, whether they are pub-lished or not. The documents may come fromteaching and research institutions in France orabroad, or from public or private research centers.
L’archive ouverte pluridisciplinaire HAL, estdestinée au dépôt et à la diffusion de documentsscientifiques de niveau recherche, publiés ou non,émanant des établissements d’enseignement et derecherche français ou étrangers, des laboratoirespublics ou privés.
Control of CO2 on flow and reaction paths inolivine-dominated basements: An experimental study
Steve Peuble, Marguerite Godard, Philippe Gouze, Richard Leprovost,Isabelle Martinez, Svetlana Shilobreeva
To cite this version:Steve Peuble, Marguerite Godard, Philippe Gouze, Richard Leprovost, Isabelle Martinez, et al.. Con-trol of CO2 on flow and reaction paths in olivine-dominated basements: An experimental study.Geochimica et Cosmochimica Acta, Elsevier, 2019, 252, pp.16-38. �10.1016/j.gca.2019.02.007�. �hal-02083060�
1
Revision 2 1
2
Control of CO2 on flow and reaction paths in olivine-dominated basements: an 3
experimental study 4
5
Steve Peuble1*
, Marguerite Godard1, Philippe Gouze
1, Richard Leprovost
1, Isabelle Martinez
2 6
and Svetlana Shilobreeva3 7
8 9 10
1 Géosciences Montpellier, Université de Montpellier, CNRS, Place Eugène Bataillon cc060, 11
F-34095 Montpellier Cedex 5, France 12
13
2 Institut de Physique du Globe de Paris, Sorbonne Paris Cité, Université Paris-Diderot, 14
UMR 7154 CNRS, 75238 Paris, France 15
16 3 Vernadsky Institute of Geochemistry and Analytical Chemistry of Russian Academy of 17
Sciences, Moscow, Russia 18
19 20
21
22
23
24
25
26
27
28
29
*Corresponding author. 30
Steve Peuble 31
Now at : Mines Saint-Etienne, Univ Lyon, Univ Jean Moulin, Univ Lumière, Univ Jean 32
Monnet, ENTPE, INSA Lyon, ENS Lyon, CNRS, UMR 5600 EVS, UMR 5307 LGF, Centre 33
SPIN, Département PEG, F - 42023 Saint-Etienne, France 34
Email: [email protected] 35
36
*Manuscript

2
Abstract 37
38
The objective of this paper is to quantify the mass transfers involved in the hydrothermal 39
alteration of olivine-rich peridotites in the presence of CO2-enriched waters, and to determine 40
their effects on the rock hydrodynamic properties. Three flow-through experiments were 41
performed at a temperature of 185 °C and a total pressure of 22.5 ± 2.5 MPa. They consisted 42
in injecting a hydrothermal fluid with different concentrations of carbon dioxide (CO2 = 6.26, 43
62.6 and 659.7 mmol.L-1
i.e. pCO2 = 0.1, 1 and 10 MPa, respectively) into cylinders of 44
sintered San Carlos (Arizona, USA) olivine grains. The results show that for low pCO2 45
conditions (from 0.1 to 1 MPa), olivine is mainly altered into hematite and Mg(Fe)-rich 46
phyllosilicates. Such iddingsitic-type assemblages may clog most of the rock flow paths, 47
resulting in a strong decrease in permeability. Rare Ca-Fe-carbonate minerals also 48
precipitated under these conditions despite the initial Mg-rich system. For higher pCO2 49
conditions (~10 MPa), olivine is more efficiently altered. A greater amount of poorly 50
crystallized Fe(Mg)-rich phyllosilicates and magnesite is produced, and the carbonation rate 51
of olivine is 3 to 11 times higher than when the pCO2 is 10 to 100 times lower. Interestingly, 52
the changes in porosity caused by the formation of carbonated and hydrous minerals are small 53
while a strong decrease in permeability is measured during the experiments. The formation of 54
reduced carbon is also observed. It is located preferentially at the inlet, where pH is the 55
lowest. This testifies to a competition between reduction (probably associated with the 56
oxidation of ferrous iron) and carbonation; two processes involved in the fixation of CO2 in a 57
mineral form. One may speculate that the formation of reduced carbon can also be a 58
significant mechanism of CO2 sequestration in olivine-dominated basements. 59
60
61
62
63
64 65 66 67
68
Keywords: Olivine, carbonation, reduced carbon, reactive-percolation experiments, porosity, 69
permeability, fluid flow. 70
71

3
1. Introduction 72
73
Carbonation of mafic and ultramafic rocks (mainly basalts and peridotites) is a widespread 74
process in nature for example, in the past and present oceanic crust and mantle exposed on the 75
seafloor (e.g., Nakamura and Kato, 2004; Ludwig et al., 2006) and within ophiolites (Matter 76
and Kelemen, 2009; Noël et al., 2018). It occurs through the interaction of carbon dioxide 77
(CO2) with divalent metal ions (Mg2+
, Fe2+
, Ca2+
) contained in mafic silicates (e.g., olivine) to 78
precipitate solid carbonate minerals and quartz (e.g., Oelkers et al., 2008): 79
(Mg1.80Fe0.20)SiO4 + 2 CO2 = 2 (Mg0.90Fe0.10)CO3 + SiO2 (1) 80
Olivine (Fo90) Mg-carbonates Quartz 81
Natural carbonation of mafic and ultramafic basements controls part of the Earth’s carbon 82
cycle by contributing to the uptake of CO2 deriving, for example, from the atmosphere, 83
magmatic degassing and C-bearing mineral leaching (Zeebe and Caldeira, 2008; Coggon et 84
al., 2010; Dasgupta and Hirschmann, 2010; Rausch et al., 2013; Kelemen and Manning, 85
2015). CO2 mineral trapping in mafic and ultramafic aquifers is also envisioned as a safe way 86
for mitigating carbon anthropogenic emissions to the atmosphere (e.g., Seifritz, 1990). This 87
method is being experimented on a large scale via different pilot sites of CO2 injection into 88
basaltic reservoirs (Gislason et al., 2010; McGrail et al., 2011). 89
In both natural and industrial CO2 geological storage sites, carbon trapping will depend on 90
the mass transfer of solute reactants (products) to (from) reaction interfaces. However, 91
modeling the coupled effects of reactive transport mechanisms during in situ mineralization of 92
CO2 in (ultra-)mafic aquifers is challenging because of the complexity of natural systems and 93
the lack of experimental characterization of the effective mechanisms. Most of the laboratory 94
CO2 mineralization experiments are conducted in closed reactors (i.e. with no renewing of the 95
solute) and high water-rock ratios (Pokrovsky and Schott, 2000; Giammar et al., 2005; 96
Hänchen et al., 2006; Hänchen et al., 2008; Daval et al., 2011; Kelemen et al., 2011; Klein 97
and McCollom, 2013; Sissmann et al., 2014). Conversely, aquifers are known to be dynamic 98
systems where local chemical equilibria between fluids and minerals are controlled by low 99
water-rock ratios and pore-scale fluid flow (e.g., Steefel et al., 2005). Extensive outcrops of 100
weathered peridotites show different forms and degrees of CO2 mineralization based on local 101
geological contexts i.e. on small scale variations in the chemistry and hydrodynamic rock 102
properties: carbonates may form large chimneys in deep-sea hydrothermal sites (e.g., Ludwig 103
et al., 2006), travertine deposits from springs in peridotite catchments (Kelemen and Matter, 104
2008), but also geometrical veins through partially hydrated (Noël et al., 2018) to fully 105
4
carbonated peridotites, such as ophicalcite (Bernoulli and Weissert, 1985; Schwarzenbach et 106
al., 2013) and listvenite (Hansen et al., 2005; Nasir et al., 2007). 107
In agreement with these natural analogues, some recent reactive percolation experiments 108
conducted on ultramafic cores pointed out the role of fluid flow velocity and pore geometry 109
on the nature and rate of carbonation reactions by controlling chemical microenvironments at 110
the pore scale (Andreani et al., 2009; Godard et al., 2013; Peuble et al., 2015a; Peuble et al., 111
2015b; Luhmann et al., 2017b). Olivine was proposed to be preferentially dissolved in high 112
flow areas facilitating high fluid-rock disequilibrium conditions while carbonates precipitate 113
mostly in reduced flow zones where diffusion-dominated transport favors the mixing of 114
reactants and their high residence time in the vicinity of the reaction zone (Andreani et al., 115
2009). Similarly, Peuble et al. (2015b) reported that carbonates grow perpendicular to the 116
main fluid flow direction i.e. where the fluid velocity field tends toward zero promoting 117
cationic supersaturation conditions. Chemical microenvironments may vary in space and time 118
within a porous aquifer depending on its structure, flow paths and successive dissolution-119
precipitation reactions. For instance, the pH of the fluid increases during its percolation in 120
olivine cores leading to changes in secondary mineralogy marked by the replacement of 121
carbonates by serpentine-type minerals (Peuble et al., 2015b). Likewise, a lateral and 122
temporal variation of CO2 concentration may also control fluid-rock interaction reactions. 123
Hänchen et al. (2008) observed that the transformation of olivine into magnesite under a 124
partial pressure of CO2 (pCO2) of 0.1 MPa and a temperature of 120 °C is slowed down by 125
intermediate reactions: it occurs through the destabilization and/or dissolution of 126
hydromagnesite which itself nucleates from brucite. On the other hand, olivine can be directly 127
dissolved into magnesite at a pCO2 of 10 MPa for similar temperature conditions (Hänchen et 128
al., 2008). This would induce significant changes in reaction pathways within mafic and 129
ultramafic reservoirs permeated by CO2 influxes, as CO2 injection wells in the context of C-130
sequestration industrial sites. 131
In turn, carbonate formation is likely to have negative feedback effects on fluid flow by 132
decreasing the porosity and permeability of the rock (Oelkers et al., 2008; Jun et al., 2013; 133
Peuble et al., 2015b). The alteration of olivine-dominated basements into carbonates is 134
considered as a volume-increasing process since the volumetric mass density of products 135
(e.g., 3.0 g.cm-3
for magnesite) is lower than that of reactants (e.g., 3.3 g.cm-3
for olivine) 136
(Deer et al., 1992). As a result, the further carbonation of mafic silicates will rely on cracks, 137
induced by tectonic stresses (Andreani et al., 2007) or by crystal-growth (Jamtveit et al., 138
2008; Rudge et al., 2010; Kelemen and Hirth, 2012), to preserve fluid pathways in the host 139
5
rock unless reaction products are leached out by the fluid flow to maintain pore volume and 140
permeability at reaction interfaces (Godard et al., 2013; Peuble et al., 2017). 141
Defining the main parameters controlling the development of one suite of chemical and 142
mineralogical reactions at the expense of another, but also their feedback effects on 143
hydrodynamic rock properties is therefore challenging in systems as complex as natural 144
geological porous media where temperature, pressure, composition and permeability will 145
change along flow paths. Numerical simulations allow to integrate the role of coupling 146
between chemistry, transport and fluid flow e.g., JChess geochemical code (Van der Lee et 147
al., 2003) or PhreeqC geochemical code (Parkhurst and Appelo, 2013). However, these 148
modelling tools are designed to handle transport at the Darcy’s scale for which the primary 149
upscaling of the flow and transport is implicitly performed. This implies that the local spatial 150
variability of the velocity field (controlled by the Stokes flow) inherent to the geometrical 151
heterogeneity of the connected porosity as well as the local mineralogical heterogeneity are 152
averaged into volumes, named as Representative Elementary Volumes (REV) encompassing 153
several pores. For instance, these models assume (i) a full mixing of solutes at the REV scale 154
and comprehensibly a full accessibility of all reactants to reactive surfaces, and (ii) a constant 155
residence time of chemical species into the entire REV. The results of the flow-through 156
experiments cited above indicate clearly that these assumptions cannot be considered a priori, 157
i.e. that pore scale heterogeneities are often controlling overall mass transfers for the space 158
and time characteristics under consideration. Yet, the scarcity of experimental data compared 159
to the large variability of potentially realistic situations makes the derivation of reliable 160
upscaling models challenging. For example, it is critical to study the functional dependencies 161
between chemical, hydrodynamic and mechanical processes for experimental configurations 162
with low degree of freedom, in order to characterize the role of surface processes and kinetics 163
versus equilibrium (Pokrovsky and Schott, 2000; Bearat et al., 2006; Daval et al., 2013). 164
In this paper, we present and discuss the results of three reactive percolation experiments 165
conducted on sintered olivine cores at various CO2 partial pressure (pCO2). All other 166
characteristics are similar for the three experiments. The objective of this study is to 167
investigate olivine alteration processes under different pCO2 in order to reproduce the 168
conditions close and far from a CO2 inflow percolating an ultramafic setting. We aim to 169
characterize the mechanisms controlling fluid chemistry, secondary mineralogy and their 170
consequences on the hydrodynamic rock properties (i.e. porosity and permeability) in the 171
context of CO2-fluids interactions with ultramafic rocks. Results are compared to previous 172

6
experimental studies and discussed in the context of natural and anthropically induced 173
hydrothermal systems in ultramafic rocks. 174
175
2. Methodology 176
177
2.1. Experimental protocol 178
179
Three reactive percolation experiments were performed using the Icare Lab 3 reactive 180
flow-through system (ICARE-RFTS3, Geosciences Montpellier). They were conducted under 181
similar conditions of flow injection rate (0.5 mL.h-1
), temperature (185 °C) and average 182
pressure (22.5 ± 2.5 MPa), but with setting the pCO2 of the injected fluid at 0.1, 1 and 10 MPa 183
respectively in order to investigate only the effect of changes in CO2 concentration on fluid-184
rock interactions. 185
The ICARE-RFTS3 experimental device allows the injection of solutes through 186
permeable samples over the range of pressure and temperature conditions expected in 187
hydrothermal systems and in geological reservoirs targeted for CO2 sequestration: P = 0.5 – 188
40 MPa and T = 50 – 400 °C. It is built for exploring mass transfer processes from kinetic-189
controlled to transport-controlled conditions for samples displaying permeability values 190
ranging from 10-20
to 10-13
m2. 191
ICARE-RFTS3 (Fig. 1) includes (i) a fluid injection system, comprising three computer-192
controlled motorized dual-piston pumps programmed to achieve the mixing of CO2 with 193
water and then inject the mixture through the sample at a constant flow rate, (ii) a heated 194
sample-holder, maintaining the sample at the given confinement pressure using a motorized 195
piston pump, (iii) a back pressure controller equipment, composed of a motorized piston 196
pump coupled with a large volume pneumatic dumper, and (iv) an automatic sampling system, 197
allowing to sample ≈ 3 mL of fluid directly from the rock sample outlet. All surfaces of the 198
ICARE-RFTS3 system in contact with the fluid are made of Hastelloy C22. The motorized 199
piston pumps are equipped with displacement encoders allowing an accurate control of the 200
flow injection rate; fluctuations are less than 0.1% of the flow injection rate. Continuous flow 201
rates ranging from 3.4 × 10⁻³
to 102 mL.h
-1 (9.5 × 10
-13 – 2.8 × 10
-8 m
3.s
-1) can be operated. 202
All pumps, valves and the sampling system are controlled by a LabView® program according 203
to the user requirements. Both axial and radial confining pressures are applied to the sample 204
fitted into a tight Teflon sleeve. The confinement pressure is set to 112% of the inlet fluid 205
pressure during the experiments (from the loading to the unloading of the circuit fluid 206
7
pressure) in order to minimize deviatoric stresses. During reactive percolation experiments, a 207
porous nickel sinter is positioned upstream of the sample to ensure a homogeneous 208
distribution of the flow. 209
The difference in fluid pressure between the inlet and the outlet of the sample, P (in Pa), 210
is monitored during the experiments using a differential pressure sensor (Rosemount® 3051 211
with an accuracy of 3 × 10³ Pa) coupled with two high-resolution pressure sensors (Keller® 212
PA-33x with an accuracy of 3.5 × 10⁴ Pa). Assuming laminar flow conditions, the sample 213
permeability k (in m²) was calculated from Darcy’s law: 214
(2)
where Q is the flow injection rate (m3.s
-1), L and S the length (m) and section area (m²) of 215
the sample, respectively, and µ is the dynamic fluid viscosity set at 1.5 × 10⁻⁴
Pa.s for water at 216
185 °C (Mao and Duan, 2009). 217
218
2.2. Preparation and composition of olivine cores and injected fluids 219
220
The percolation experiments were performed on cores (≈ 16 mm length × 6.35 mm 221
diameter) made of sintered San Carlos (Arizona, USA) olivine grains. The sintering technique 222
was used because it allows obtaining solid aggregates of controlled porosity and composition 223
(Table 1 and Appendix A1). 224
The starting material consisted of millimeter-size grains of San Carlos olivine (Fo90, see 225
Appendix A1). Olivine grains were sorted under binocular microscope to eliminate those 226
having spinels or pyroxenes on their surfaces or as inclusions. The selected grains were 227
crushed and sieved. The 100 – 150 µm olivine fraction was then cleaned ultrasonically for 10 228
min in diluted hydrochloric acid (≈ 2% HCl) to remove any carbonate grains and finally 229
rinsed in MilliQ-water for 15 min. The cleaning and rinsing procedure was repeated three 230
times before drying the powder at 110 °C for 12 hours. Bulk composition of the resulting 231
olivine powder was analyzed by X-ray fluorescence spectroscopy (Geolabs, Canada) and 232
compared to the composition of the olivine grains measured by electron probe micro-analyzer 233
(EPMA, University of Montpellier; Appendix A1). Bulk and mineral compositions were 234
similar indicating that no contamination occurred during the preparation procedure. 235
Three sintered olivine cores were made using the following procedure. First, the 100 – 236
150 µm fraction of the cleaned olivine powder was pressed at 5 MPa and 25 °C in stainless 237
steel capsules. Then, samples were sintered at a temperature of 1180 °C and a confining 238
8
pressure of 150 MPa using a gas medium (Ar) high-pressure and high-temperature vessel 239
(Paterson, 1990) at Geosciences Montpellier. For each core, the initial porosity was measured 240
before the percolation experiment using the triple weight method (Dullien, 1979); it ranged 241
between 10.57 and 11.30 ± 0.10% (Table 1). Experiments were performed on samples named 242
SC1-L, SC2-M and SC3-H, which have similar initial permeability (1.6 – 4.6 × 10⁻¹⁵
m2; 243
Table 1). 244
The inlet fluid was a mineral water (Volvic®) mixed with various concentrations of 245
gaseous CO2. The Volvic® water was selected because of its chemical composition that is 246
stable and typical of aquifers containing mafic minerals (e.g., olivine) under low temperature 247
conditions (50 – 200 °C; Table 2 and Appendix A2). The rationale was to reproduce chemical 248
conditions similar to those anticipated for CO2 industrial storage in igneous basements, close 249
and far from an injection site. The Volvic® water was first vacuumed for three hours at room 250
temperature to degas it and thus reproduce anoxic conditions. Then it was mixed with gaseous 251
CO2 at 30 MPa and 25 °C by repeated back-and-forth pumping between two out of the three 252
injection pumps for three hours (Fig. 1). The pH of Volvic® water at 25 °C is 7.0. After 253
mixing with CO2, the inlet fluid pH at 185 °C and 22.5 ± 2.5 MPa was calculated using 254
PhreeqC and the Lawrence Livermore National Laboratory ‘thermo.com.V8.R6.230’ 255
thermodynamic database (Parkhurst and Appelo, 2013): pH = 4.5, 3.9 and 3.4 for the 256
experiments SC1-L (experiment at the lowest pCO2 = 0.1 MPa; CO2 = 6.26 mmol.L-1
), SC2-257
M (experiment at medium pCO2 = 1 MPa; CO2 = 62.6 mmol.L-1
) and SC3-H (experiment at 258
the highest pCO2 = 10 MPa; CO2 = 659.7 mmol.L-1
), respectively. 259
260
2.3. Analytical methods 261
262
The chemical composition of the inlet and outlet fluids was measured on an Agilent 7700x 263
inductively coupled plasma – mass spectrometer (ICP–MS) at Geosciences Montpellier 264
(AETE platform, France). All fluids were previously diluted by two in an acidified MilliQ-265
water (≈ 2% of nitric acid). Indium (1 ppb) was used as an internal standard during analyses. 266
Both accuracy and reproducibility of the measurements were assessed with the SLRS-5 water 267
standard. The analytical results were within the range of compiled values (Yeghicheyan et al., 268
2013). The external reproducibility was better than 5% for all measured elements. The Si, Mg, 269
Fe and Ca concentrations of the inlet and outlet fluids and of the SLRS-5 water standard are 270
reported in Table 2 and in the Supplementary Materials (Appendix A3). 271

9
Both composition and mineralogy of the reacted aggregates were characterized with the 272
methodology described thereafter. Samples magnetic susceptibility was measured before and 273
after each experiment on a Bartington–MS2 meter susceptibility system operating at 0.565 274
kHz for values ranging from 1 × 10⁻⁸
to 9999 × 10-8
m3.Kg
-1 with an uncertainty of ≈ 1% 275
(Geosciences Montpellier). 276
After magnetic susceptibility measurements, the reacted cores were longitudinally sawn 277
into two semi-cylindrical halves. The first half was polished for microscopic and 278
spectroscopic characterizations (scanning electron microscopy, Raman spectroscopy and 279
electron probe micro-analyzer) according to the protocol described in detail in Peuble et al. 280
(2015a). The second half was crushed for bulk powder analyses (Mössbauer spectroscopy and 281
bulk rock carbon and hydrogen measurements). 282
Polished sections were described optically, then backscattered (BSE) and secondary 283
electron (SE) images were collected on a FEI Quanta FEG 200 scanning electron microscope 284
(SEM) using an acceleration voltage of 15 kV and an ambient pressure of 0.45 torr 285
(University of Montpellier, France). 286
Secondary minerals have been also identified on LabRam Aramis IR2 (Charles Gerhardt 287
Institute, Montpellier, France) and XploRa (Laboratory of Geology of Lyon, France) confocal 288
Raman spectrometers (Jobin-Yvon SA, Horiba, France); both equipped with a charge-coupled 289
device (CCD) detector. Raman analyses were performed with 473 nm (LabRam Aramis IR2) 290
and 532 nm (XploRa) radiations from diode lasers generating less than 1 mW. The spectra 291
resolution is ± 2 cm−1
. Before analyses, Raman spectrometers were calibrated using a 292
crystalline silicon thin-section showing a large band at 521 ± 2 cm-1
. 293
The composition of primary and secondary minerals was measured on carbon-coated 294
polished sections (thus precluding further investigations on C-phases) using a Cameca SX-295
100 EPMA (University of Montpellier) equipped with five wavelength-dispersive X-ray 296
spectrometers (WDS). Analyses were done at an acceleration potential of 20 kV and a beam 297
current of 10 nA. Results are summarized in Appendix A1. 298
The presence (or lack) of ferric iron in the reacted samples was measured by Mössbauer 299
spectroscopy at the Charles Gerhardt Institute (Montpellier, France) with a detection limit of 300
≈ 2%. Mössbauer data were acquired at ambient temperature on ≈ 200 mg bulk rock powders 301
in the constant acceleration mode. 57
Fe Mössbauer spectra were obtained using a source of 302
57Co in rhodium metal. The spectrometer was operated using a triangular velocity waveform. 303
Gamma rays were detected with a NaI scintillation detector. Spectra were fitted with a 304
combination of Lorentzian lines then used to determine the spectral parameters i.e. the isomer 305
10
shift (IS), the electric quadrupole splitting (QS), the full line width at half maximum (LW) 306
and the relative resonance areas (A) of different components of the absorption patterns (see 307
Appendix A4). The magnetic hyperfine field (H) is absent in the case of these samples 308
confirming the paramagnetic character of the analyzed phases. 309
Bulk carbon (in inorganic and organic form) and water compositions were determined 310
using step-heating experiments (Javoy and Pineau, 1991; Pineau and Javoy, 1994) at the IPGP 311
(Institut de Physique du Globe de Paris, France) on ≈ 100 mg aliquots. First, powders were 312
loaded in a quartz tube connected to a vacuum line and degassed one night at room 313
temperature. A vertical cylindrical furnace (with a temperature stability of ± 2 °C) was then 314
used to heat progressively the samples at 100 °C for 1 hour to eliminate all surface 315
contaminants e.g., water and other adsorbed compounds. Finally, samples were heated 1 hour 316
at 700 °C and 1 hour at 1100 °C to extract the carbon trapped in the organic and inorganic 317
form respectively. Heating was made under an oxygen atmosphere raised up to 0.4 MPa after 318
30 min of reaction. Liquid nitrogen was used to cryogenically separate and collect gaseous 319
CO2 and H2O. The amount of CO2 was quantified using a Toepler® pressure gauge with a 320
detection limit of 0.05%. Carbon and water analyses were duplicated to ensure the 321
reproducibility of the data. 322
323
3. Results 324
325
3.1. Permeability 326
327
All reactive percolation experiments displayed a reduction in sample permeability from 328
initial values of 1.6 – 4.6 × 10⁻¹⁵
m² (Table 1) down to 0.075 × 10⁻¹⁵
m² (SC1-L), 0.019 × 10⁻¹⁵
329
m² (SC2-M) and 0.005 × 10⁻¹⁵
m² (SC3-H; Fig. 2). In detail, the way in which permeability 330
decreased varied from one experiment to the other. 331
The permeability of experiment SC1-L decreased slightly in the early hours of injection 332
(dk/dt = 1.40 × 10⁻¹⁷
m².h-1
) before dropping down to 0.08 × 10
-15 m² at t ≈ 36h and declining 333
slightly again until the end of fluid injection (dk/dt = 6.30 × 10⁻¹⁹
m².h-1
). 334
Experiment SC2-M is characterized by four periods of fast permeability drop starting at t 335
≈ 13h (dk/dt = 1.40 × 10⁻¹⁵
m².h-1
), t ≈ 54h (dk/dt = 5.62 × 10⁻¹⁶
m².h-1
), t ≈ 84h (dk/dt = 9.29 336
× 10-17
m².h-1
) and t ≈ 107h (dk/dt = 2.10 × 10⁻¹⁶
m².h-1
). These periods were separated by four 337
intervals of low permeability decrease of about 13, 41, 30 and 23 hours, respectively. 338
11
The permeability of experiment SC3-H is marked by a slow and almost constant decrease 339
of 135 hours (dk/dt = 1.5 × 10⁻¹⁷
m².h-1
), then accelerating sharply at dk/dt = 4.3 × 10⁻¹⁷
m².h-1
. 340
After 168 hours, the decrease in permeability slowed down to dk/dt = 1.4 × 10⁻¹⁸
m².h-1
until 341
the end of injection. 342
343
3.2. Fluid chemistry 344
345
The outlet fluids composition at the time of sampling (Fig. 3) denotes the value integrated 346
over the volume of fluids having flowed and reacted with the olivine cores over the 6 hours of 347
reactive percolation experiments preceding sampling (each fluid sample is 3 mL and fluid flux 348
Q is 0.5 mL.h-1
). The three experiments were marked by significant changes with time in the 349
outlet fluids composition compared to the injected CO2-water. First, all outlet fluids displayed 350
enrichments in the three major components of olivine (i.e. Si, Mg and Fe; Fig. 3a,b,c) 351
testifying to the dissolution of the Mg-silicate during the experiments. Second, the sampled 352
outlet fluids were (or became) depleted in Ca indicating the trapping of this element in the 353
percolated cores through the precipitation of Ca-bearing mineral(s) (Fig. 3d). However, the 354
amount of cations released or trapped per time unit varied between the experiments. It should 355
be noted that the outlet fluids sampled at the earliest stages of all experiments (time of 356
sampling < 20h) systematically displayed chemical compositions at odds with the overall 357
chemical trends showed later in the experiments. These variations are controlled by the 358
dissolution of a minor fraction of small grains produced during the preparation of olivine 359
aggregates (Andreani et al., 2009; Godard et al., 2013; Peuble et al., 2015b). These initial 360
processes will not be discussed in details thereafter and we will mainly focus our analysis to t 361
> 20h. 362
Experiment SC1-L (lowest concentration in CO2 = 6.26 mmol.L-1
) showed a slight 363
increase in the outlet concentrations of Si (from 43.7 to 62.0 ppm), Mg (from 13.5 to 14.8 364
ppm) and Fe (from 0.2 to 0.7 ppm). But the amount of Mg and Fe is low compared to that of 365
Si and to the olivine stoichiometry; the molar ratios of (Mg/Si)(outlet-inlet) and (Fe/Si)(outlet-inlet) in 366
sampled fluids are 0.15 and 0.01, respectively. This indicates either that the dissolution of 367
olivine was non-stoichiometric or, more probably, that some of the Mg and Fe released upon 368
olivine dissolution remained trapped in the percolated core. The concentrations of Ca, brought 369
in by the inlet fluid, decreased with time from 12.6 to 10.8 ppm in the sampled fluids. This 370
decrease, particularly marked in the first 48 hours of injection (Fig. 3d), suggests that the 371
outlet fluids Ca composition is partly controlled by cation trapping mechanisms. It is worth 372
12
noting that the change in chemistry observed in the outlet fluids after 48 hours is close in time 373
to the change in permeability recorded in experiment SC1-L at t ≈ 36h. 374
During experiment SC2-M (medium concentration in CO2 = 62.6 mmol.L-1
), Si, Mg and 375
Fe also displayed an increase in their outlet concentrations with time. However, Si 376
concentrations were high (107 to 261 ppm) and their variations erratic (peaks observed at t ≈ 377
13, 83, 134 and 147 hours; Figure 3a) compared to experiment SC1-L. Mg concentrations 378
increased steadily during about 48 hours before stabilizing around 25 ppm. The increase in Fe 379
concentrations followed two plateaus, the first at ≈ 0.3 ppm (from 13 to 109 hours) and the 380
second at ≈ 0.5 ppm (after 122 hours). Compared to experiment SC1-L, Ca concentration 381
values in experiment SC2-M were overall low, decreasing from 12.2 to 9.1 ppm over time. 382
Chemical trends of Si, Mg, Fe and Ca were interpreted as indicating both dissolution of 383
olivine and trapping of Mg, Fe and Ca in the percolated core. Molar ratios of (Mg/Si)(outlet-inlet) 384
and (Fe/Si)(outlet-inlet) were low compared to experiment SC1-L with values of 0.09 and 0.002, 385
respectively; suggesting that the mechanisms controlling the trapping of Mg and Fe were 386
overall more efficient in experiment SC2-M. The irregular and abrupt changes in fluid 387
chemistry during experiment SC2-M also suggest that complex feedback processes between 388
these trapping mechanisms, olivine dissolution and fluid fluxes occurred. For instance, the 389
increase in Mg relative to Si in the first 48 hours suggests that Mg-trapping became less 390
efficient than olivine dissolution yet this period is associated to a strong permeability drop. 391
After 122 hours, the experiment is marked by an increase in Si, Fe and, to a lesser extent, in 392
Ca revealing a further decrease in trapping efficiency while olivine dissolution continued and 393
permeability remained stable. 394
Compared with experiments SC1-L and SC2-M, the outlet fluids sampled in experiment 395
SC3-H (highest concentration in CO2 = 659.7 mmol.L-1
) are depleted in Fe, but enriched in 396
Mg compared to experiments SC1-L and SC2-M, and in Si compared to experiment SC1-L. 397
Fluid time series are also distinguished by contrasting chemical variations defining two time 398
periods (Fig. 3). The first period, from the start to t ≈ 144h, is characterized by large changes 399
in the concentrations of all elements: Si concentrations increased rapidly then stabilized at ≈ 400
82 ppm at t ≈ 38h; Mg concentrations increased sharply at the beginning then slower after ≈ 401
38h before reaching a peak at 64.1 ppm (at t ≈ 70h) and decreasing down to 38.3 ppm; Fe 402
concentrations were strongly depleted (< 0.03 ppm) except for a peak (up to 0.19 ppm) 403
between 96 and 140 hours; Ca concentrations showed a strong increase during the first hours 404
until a peak (10.5 ppm) was reached at t ≈ 45h followed by a decrease down to 4.7 ppm (at t ≈ 405
135h). In contrast, the second period, starting after t ≈ 144h, is characterized by little to no 406
13
variations in fluid chemistry. Only Si showed a slow increase up to ≈ 106 ppm and Mg 407
displayed a slight increase at ≈ 45 ppm after 216 hours. Molar ratios of (Mg/Si)(outlet-inlet) and 408
(Fe/Si)(outlet-inlet) were low in the SC3-H sampled fluids (0.54 and 0.0005, respectively) 409
suggesting an efficient trapping of Mg and Fe in the olivine aggregate. However, in contrast 410
to the low pCO2 experiments, (Mg/Si)(outlet-inlet) changed significantly from 0.70 to 0.43 after t 411
≈ 144h indicating either a higher release of Si relative to Mg during the dissolution of olivine 412
and/or a more efficient trapping of Mg (together with Ca) during the second period of 413
experiment SC3-H. These chemical changes are associated to variations in rock 414
hydrodynamic properties; the first period is characterized by slow changes in permeability 415
while a significant drop in permeability marks the second period. 416
417
3.3. Characterization of the reacted samples 418
419
Optical observations shows that the three rock samples remained mainly composed of 420
olivine after the percolation experiments. However, the initial green olivine crystals are 421
covered by a red hue decreasing in intensity away from the inlet (Fig. 4). The red hue coating 422
increases with the CO2 partial pressure value used in the experiment; it extends to few mm² in 423
sample SC1-L, three-quarters of sample length for sample SC2-M and the whole sample for 424
sample SC3-H. 425
At the micrometric scale, SEM analyses allow the identification of secondary minerals in 426
the three percolated cores (Fig. 5 and Appendix A1). For the lowest pCO2 experiments (SC1-427
L, SC2-M), some pores contain clusters of an amorphous phyllosilicate enriched in Mg ± Fe 428
(Fig. 5a and Appendix A1). Raman analyses suggest that this phase may represent a poorly 429
crystallized precursor of Mg-Fe-rich hydrous minerals such as Fe(III)-rich serpentine (Fig. 6), 430
which is commonly observed in the earliest stages of serpentinization (Andreani et al., 2013). 431
It has Raman peaks comparable to those of lizardite, with a band at 1104 cm-1
(Auzende et al., 432
2004), and those of iddingsite, a Fe(III)-rich olivine alteration product having a non-definite 433
crystal structure, with a first band observed between 611 and 663 cm-1
and a second in the O-434
H bonds spectral region from 3500 to 3600 cm-1
(Kuebler, 2013). This alteration product is 435
probably localized at the surface of olivine grains, since olivine peaks are also identified on 436
the Raman spectrum at 824 and 857 cm-1
(Cnopnras, 1991). It is associated with hematite 437
showing four Raman bands at 224, 300, 411 and 1322 cm-1
(De Faria et al., 1997). Both 438
hydrous phases and iron oxides are found preferentially along the olivine rims located in the 439
vicinity of the inlet; they account for the red hue covering the reacted samples (Fig. 4). 440
14
Samples SC1-L and SC2-M contain also micro-grains of silica, Mg-Fe-bearing calcite 441
(Ca0.95Mg0.03Fe0.02CO3) and minor siderite (Fe0.95Mg0.04Ca0.01CO3) that are distributed evenly 442
along the percolated cores (Fig. 5b-c and Appendix A1). 443
In sample SC3-H, some olivine surfaces exhibit dissolution features forming conical-444
shaped etch-pits with a maximum length of 1 µm (Fig. 5d-e). Etch-pits are observed along the 445
dissolved olivine surfaces in large pores (10-50 µm) and within the micro-fissures (< 5 µm) 446
that were probably induced by the sample preparation (Peuble et al., 2015a). Sample SC3-H 447
also displays large Mg-carbonate crystals (Mg0.91Ca0.07Fe0.02CO3) forming a matrix of several 448
tens of µm in the pores (Fig. 5f and Appendix A1). This carbonate was identified as 449
magnesite with the typical Raman peak of C-O bonds observed at 1094 cm-1
and three minor 450
peaks at 209, 325 and 738 cm-1
(Rividi et al., 2010 – see Figure 9). In addition to magnesite, a 451
poorly crystallized phyllosilicate enriched in Fe ± Mg was also characterized in sample SC3-452
H (Fig. 5d and Appendix A1). This phase forms a dense network of curled fibers similar to 453
the proto-serpentine observed in previous flow-through experiments (Godard et al., 2013). Its 454
Raman spectrum is comparable to the poorly crystallized phase identified in samples SC1-L 455
and SC2-M, forming an assemblage of hydrous minerals and hematite at the olivine grains 456
surface (Fig. 6). The attenuation of the Raman peaks of olivine compared to this proto-457
serpentine precursor suggests a greater degree of crystallization of the latter in experiment 458
SC3-H than in experiments SC1-L and SC2-M (Kuebler, 2009). 459
Black grains were observed in pores located close to the inlet in the three reacted samples 460
(< 5 mm - see Figs. 4 and 8). These micron-size grains (<20 m) were identified as carbon 461
from the D and G bands observed at respective values of 1310 and 1520 cm-1
on Raman 462
spectra (e.g., Galvez et al., 2013). Carbon grains have a symmetrical G band in Raman 463
analyses indicative of a poorly ordered crystallographic structure also referred to as 464
turbostratic. Reduced turbostratic carbon or graphene is commonly reported under low 465
temperature conditions i.e. < 400 °C (Audier et al., 1981; Beyssac et al., 2003). 466
Magnetic susceptibility and Mössbauer analyses were realized on a subset of powders. 467
They show that the precipitation of ferric iron is minimal in the three reacted cores in spite of 468
the change of color observed optically. Samples magnetic susceptibility did not change 469
significantly during reactive percolation experiments suggesting that magnetite did not 470
precipitate during CO2-fluids injection (see Table 1). Mössbauer measurements identified no 471
ferric iron impurities in the reacted powders in the limit of ≈ 2% (see Fig. 9 and Appendix 472
A4). Note that all Mössbauer spectra were fitted using two doublets (components 1 and 2 473
corresponding to the M1 and M2 sites of olivine), both having the parameters of high spin 474
15
Fe2+
occupying octahedral sites in the olivine crystals. The isomer shifts and the quadrupole 475
splitting are similar to the reported values for olivine (Dyar et al., 2006). The only differences 476
between these samples are the line widths and the relative fractions of components 1 and 2, 477
which are both within the uncertainty of Mössbauer analyses (i.e. less than ≈ 2% relative to 478
the total iron content). 479
Bulk rock hydrogen and carbon analyses indicate that reacted samples were systematically 480
enriched in these two elements relative to the initial olivine (Table 3 and Appendix A5). This 481
is consistent with the presence of secondary hydrous and carbon-bearing phases revealed by 482
the petrological and mineralogical analyses of reacted samples. Bulk powder measurements 483
also show that carbon is present in both inorganic and organic forms in reacted samples SC2-484
M and SC3-H. Inorganic carbon (carbonates) is dominant after the highest pCO2 experiment: 485
it represents 97% of the total carbon measured in sample SC3-H. In contrast, inorganic carbon 486
represents only ~ 40% of the measured total carbon in sample SC2-M; the remaining fraction 487
being organic (i.e. reduced) carbon, which suggests less favorable conditions for carbonates 488
precipitation under a lower pCO2. 489
490
3.4 Mass estimates of dissolved and precipitated minerals 491
492
Both olivine and secondary minerals are mainly composed of Si, Mg, Fe and Ca. The 493
mass balance calculation (expressed as oxides mass) of these cations comparing inlet and 494
outlet fluids provides a first insight of the volatile-free bulk mass lost or gained by the 495
ultramafic cores during the experiments (Peuble et al., 2015b). Calculations indicate a total 496
mass loss of 0.22, 1.60 and 2.39% relative to the initial samples mass in experiments SC1-L, 497
SC2-M and SC3-H, respectively (Appendix A6), even though the Ca brought in by fluids is 498
trapped into the samples. 499
Hydrous minerals, oxides and carbonates were identified as secondary phases in the 500
percolated aggregates. Some identified minerals display unreferenced compositions (such as 501
the hydrous phases interpreted as serpentine precursors), albeit they all contain at least Si, Mg, 502
Fe or Ca. Furthermore, bulk analyses could not be used directly to quantify the amount of 503
carbon and hydrogen trapped in reacted samples. First, due to technical problems, hydrogen 504
was not analyzed in one of the samples (sample SC3-H). Second, the distribution of hydrogen 505
and organic and inorganic carbon in sample SC1-L may have been affected by leakage of 506
containment fluid (MilliQ-water in equilibrium with the atmosphere) into the sample Teflon 507
sleeve, when the experiment was stopped (t ≈ 93h). For these reasons, the quantification of 508
16
dissolved and trapped phases was done only on the basis of fluid time series. In such 509
conditions, estimating the actual mass change of the samples during reactions requires making 510
conjectures on the distribution of cations in secondary minerals (Andreani et al., 2009). For 511
this study, we assume that: 512
(i) The excess of Si measured in the outlet fluids, i.e. Si(outlet-inlet), equals to the Si released 513
by the dissolution of olivine only. In other words, we assumed that the amount of Si trapped 514
in the samples is negligible even if Si-rich secondary phases precipitated in the reacted cores. 515
The calculated mass of dissolved olivine is thus a minimal estimate. Accordingly, we 516
calculated a concentration model of the outlet fluids for Mg and Fe involving the mass of 517
these elements released by olivine dissolution and the mass brought in by the injected fluid. 518
The measured deficits in Mg and Fe relative to this concentration model allow estimating the 519
mass of trapped minerals. 520
(ii) Fe was trapped in carbonates during experiments SC1-L and SC2-M, and Mg was 521
sequestered as magnesite in experiment SC3-H. All Ca was incorporated into carbonates in 522
the three experiments (Fe-bearing calcite in samples SC1-L and SC2-M; Ca-bearing 523
magnesite in sample SC3-H). 524
(iii) The contribution of hydrous silicate minerals associated to (proto-)serpentinization of 525
olivine was approximated from pure end-member components that have been described as 526
‘precursor phases’ of serpentine minerals: brucite (Mg(OH)2) for the Mg(Fe)-rich 527
phyllosilicates in experiments SC1-L and SC2-M (e.g., Ferry, 2000; Tutolo et al., 2018); 528
goethite (FeO(OH)) for the Fe(Mg)-rich phyllosilicates in experiment SC3-H (Delvigne et al., 529
1979; Lee et al., 2015). 530
The calculated mass of dissolved olivine is 8.34, 63.17 and 62.94 mg in experiments SC1-531
L, SC2-M and SC3-H, respectively. This represents a mass loss of 0.48, 3.69 and 4.31% 532
relative to the initial mass of samples SC1-L, SC2-M and SC3-H, respectively (Table 4 and 533
Fig. 10). The calculated mass of hydrous Mg-phases in samples SC1-L and SC2-M is 6.82 534
and 54.08 mg, respectively; this indicates a gain of mass of 0.40 and 3.15% relative to their 535
initial mass, respectively. The calculated mass of hydrous Fe-phases in sample SC3-H is 7.28 536
mg, corresponding to a relative mass gain of 0.50%. The total mass of carbonates is 1.30, 9.98 537
and 45.60 mg in samples SC1-L, SC2-M and SC3-H, respectively, representing a relative 538
mass gain of 0.08, 0.58 and 3.12%. 539
Petrological observations and bulk rock analyses indicated that organic carbon was 540
present in the reacted samples. Bulk rock analyses showed that the carbon content of the 541
initial olivine was below the detection limit, so the only source of carbon is the CO2-bearing 542

17
injected fluid. In order to evaluate the amount of organic carbon in the three reacted samples, 543
we assumed that (i) the measured ratios of organic and inorganic carbon for samples SC3-H 544
and SC2-M were representative of the actual distribution of carbonates versus reduced carbon 545
in the samples, and (ii) the ratio of organic and inorganic carbon in sample SC1-L was the 546
same as that of sample SC2-M. Based on the calculated masses of carbonates, the total mass 547
of reduced carbon is 0.19, 1.77 and 0.20 mg in samples SC1-L, SC2-M and SC3-H, 548
respectively and corresponds to a relative mass gain of 0.01, 0.10 and 0.01%, respectively. 549
Based on these calculations, the mass balance between dissolved olivine and precipitated 550
secondary minerals (hydrous phases, reduced carbon and carbonates) led to a negligible total 551
mass change of the cores: a relative mass gain of 0.01 and 0.14% for samples SC1-L and 552
SC2-M, respectively, and a relative mass loss of 0.68% for sample SC3-H. They also indicate 553
that the alteration of olivine into carbon-bearing phases (reduced carbon and carbonates) 554
resulted in a total sequestration of CO2 of 0.07, 0.60 and 1.66 wt.% in experiments SC1-L, 555
SC2-M and SC3-H, respectively (see Table 4). These values are consistent with bulk rock 556
data measured of samples SC2-M and SC3-H (Fig. 10), which validates a posteriori the 557
assumptions made for the mass balance. Calculations also showed that only 10.5, 4.8 and 558
0.5% of the total amount of CO2 injected in samples SC1-L, SC2-M and SC3-H respectively, 559
remained trapped as carbon–bearing products (reduced carbon and carbonates). This implies 560
that the percolating fluids were still enriched in CO2 at the cores outlet. 561
562
3.5. Porosity variation during olivine alteration 563
564
Changes in rock porosity induced by the percolation of CO2-fluids in the ultramafic cores 565
can be inferred from the calculated mineral masses. A volumetric mass density of 3.3 g.cm-3 566
was assumed for olivine (Deer et al., 1992). The total volume of carbonates was assessed from 567
the volumetric mass density of calcite ( = 2.7 g.cm-3
) and siderite ( = 3.9 g.cm-568
3)
in experiments SC1-L and SC2-M, and of magnesite ( = 3.0 g.cm-3
) in 569
experiment SC3-H (Deer et al., 1992). Two end-member scenarios were used to estimate the 570
volume of hydrous phases considering the density of their expected precursors (brucite in 571
samples SC1-L and SC2-M ( = 2.4 g.cm-3
); goethite in sample SC3-H ( = 4.3 572
g.cm-3
)) or that of lizardite as a serpentine-type mineral ( = 2.6 g.cm-3
) (Deer et al., 573
1992). The precipitation of reduced carbon was considered as negligible. 574
18
Results show that changes in porosity are relatively small during the percolation 575
experiments (Table 4, Fig. 10c and Appendix A7). Samples porosity was reduced from 576
10.96% to 10.80% in experiment SC1-L and from 11.30% to 9.89% in experiment SC2-M 577
according to the different scenarios of carbonate formation (calcite or siderite) and hydration 578
(brucite or lizardite). Compared to the initial samples porosity, these results correspond to a 579
maximum porosity change of ~1% and ~12% in experiments SC1-L and SC2-M, respectively. 580
In experiment SC3-H, the porosity increased by ~5% (from 10.57 to 11.11%) or ~3% (from 581
10.57 to 10.86%) considering the precipitation of magnesite and goethite or the precipitation 582
of magnesite and lizardite, respectively. 583
584
4. Discussion 585
586
All reacted samples show the alteration of olivine into secondary minerals. However, the 587
nature and rate of dissolution and precipitation reactions are variable depending on the inlet 588
fluid pCO2. The experiments with the lowest pCO2 (0.1 – 1 MPa i.e. CO2 = 6.26 – 62.6 589
mmol.L-1
) are characterized by the formation of Mg(Fe)-rich phyllosilicates associated with 590
Ca- and Fe-carbonates. The high pCO2 experiment (10 MPa i.e. CO2 = 659.7 mmol.L-1
) 591
involves the precipitation of magnesite and Fe(Mg)-rich phyllosilicates. All percolated cores 592
contain hematite and reduced carbon. Hereafter, we will discuss the role of CO2 on the 593
hydrothermal alteration of olivine and the fate of carbon in the ultramafic aggregates. 594
595
4.1. Alteration of olivine and formation of carbonates during low CO2 concentration 596
experiments (6.26 – 62.6 mmol.L-1
) 597
598
The comparison of experiments SC1-L and SC2-M shows an increase in the mean 599
dissolution rate of olivine with CO2 partial pressure: 1.43 × 10⁻⁸
s-1
at pCO2 = 0.1 MPa 600
(sample SC1-L); 6.55 × 10⁻⁸
s-1
at pCO2 = 1 MPa (sample SC2-M). These results are 601
consistent with previous studies reporting the effect of CO2 concentration on olivine 602
dissolution rates by controlling the activity of H+ ions in the solution (Rosso and Rimstidt, 603
2000; Hänchen et al., 2006). H+ ions are assumed to govern the kinetics of olivine dissolution 604
by favoring the protonation of Mg–O and Fe–O bonds (in Mg–O–Si and Fe–O–Si 605
arrangements) to form Mg and Fe complexes associated with silicic acid (Casey and Bunker, 606
1990; Wogelius and Walther, 1990; Pokrovsky and Schott, 2000). In our study, the 607
dissolution rate of olivine is correlated to the activity of protons in the fluid: it is multiplied by 608
19
4.6 when the H+ concentration is quadrupled between experiments SC1-L (H
+ = 0.04 mmol.L
-609
1) and SC2-M (H
+ = 0.16 mmol.L
-1) based on PhreeqC calculations (Parkhurst and Appelo, 610
2013). However, the outlet concentrations of Si showed that the dissolution rate of olivine 611
evolved differently between these two experiments: it reached rapidly a steady state in 612
experiment SC1-L while it fluctuated throughout experiment SC2-M. 613
In porous media, the dissolution rate of olivine is controlled by local chemical equilibrium 614
conditions, which are themselves determined by the mass transfer of solutes to reactive sites, 615
the adsorption of such chemical species at the Mg-silicate surface and the residence time of 616
fluids at mineral interfaces (Peuble et al., 2015b). Accordingly, we postulate that the injection 617
of a low concentration of H+ ions in experiment SC1-L (pCO2 = 0.1 MPa) allowed the 618
dissolution rate of olivine to rapidly achieve a steady state at the sample scale, independently 619
of the rock hydrodynamic properties. In experiment SC2-M, CO2 concentrations were 10 620
times greater (pCO2 = 1 MPa), which increased the difference to equilibrium between olivine 621
and fluids. During this experiment, the olivine dissolution rate never reached a steady state. 622
We speculate that this rate varied locally and temporally along the percolated core depending 623
on local fluid flow conditions and reactive surface areas. 624
Unlike the dissolution of olivine, the outlet concentrations of Ca and Fe suggest that the 625
precipitation rate of Ca-carbonates and Fe-bearing phases (carbonates and oxides) reached a 626
steady state in both low pCO2 experiments (except for Fe in sample SC1-L). The precipitation 627
of Ca- and Fe- carbonates (i.e. calcite and siderite) appears contradictory with the Mg-rich 628
composition of the initial ultramafic system (olivine Fo90). Furthermore, the outlet fluids of 629
low pCO2 experiments do contain magnesium coming from the dissolution of olivine (Fig. 630
3b), and PhreeqC geochemical simulations indicate that they are supersaturated with respect 631
to magnesite (Parkhurst and Appelo, 2013). These inconsistencies highlight the competitive 632
processes in the precipitation kinetics between Mg-, Ca- and Fe-carbonates, due to the 633
different chemical affinities of Mg2+
, Ca2+
and Fe2+
ions with water (e.g., Pokrovsky and 634
Schott, 2002). Mg2+
has a highly hydrated character compared to Ca2+
and Fe2+
(Pokrovsky 635
and Schott, 2002; Schott et al., 2009; Gautier, 2012). Hänchen et al. (2008) observed that the 636
crystallization of magnesite is generally hindered by the intermediate precipitation of hydrous 637
Mg-carbonates (e.g., nesquehonite, hydromagnesite) especially under low CO2 partial 638
pressure conditions (< 0.3 MPa). Hence, the precipitation rate of magnesite can be up to six 639
orders of magnitude slower than that of other carbonates such as calcite (Saldi et al., 2009; 640
Saldi et al., 2012). Because of these thermo-kinetic restrictions, the Mg-rich samples SC1-L 641
and SC2-M promoted the crystallization of calcite and siderite at the expense of magnesite. 642
20
This means that the potential for CO2 mineralization in olivine-dominated basements under 643
low pCO2 conditions (0.1 – 1 MPa) is primarily regulated by the amount of iron provided by 644
the mafic silicate and the amount of calcium brought in by the percolating fluids; both 645
mechanisms favoring the precipitation of siderite ± calcite. Magnesium is mainly incorporated 646
into transient, hydrous and amorphous phases (Mg(Fe)-rich (proto-)phyllosilicates) that 647
probably developed from the destabilization of brucite, as it is commonly reported during 648
serpentinization of olivine (Delvigne et al., 1979; Escario et al., 2018; Tutolo et al., 2018). 649
Thus, if we tentatively extrapolate these results to ultramafic reservoirs infiltrated by 650
relatively low pCO2 waters, we can model the hydrothermal alteration of olivine in areas 651
located far from the CO2 input by the following reaction: 652
653
5 Mg1.80Fe0.20SiO4 + CO2 + 8 H2O + 0.01 CaO(aq) 654
= 8 Mg(OH2) + Fe0.95Mg0.04Ca0.01CO3 + 0.96 MgO(aq) + 0.05 FeO(aq) + 5 SiO2(aq) (3) 655
Brucite Siderite 656
657
Under low CO2 concentrations (here defined as being ≤ 62.6 mmol.L-1
), the dissolution of 658
five moles of olivine produces eight moles of hydrous minerals (e.g., brucite) but only one 659
mole of Fe-carbonates. Such olivine alteration products (especially brucite) may then induce 660
negative feedback effects on the completion of the reaction (Malvoisin and Brunet, 2014), but 661
also on the hydrodynamic properties of the rock. Indeed, differential pressure measurements 662
revealed a sharp decrease in the permeability of samples SC1-L and SC2-M even though 663
porosity values display little change over time. This suggests that the decrease in permeability 664
is primarily controlled by the structure of secondary minerals (mainly the hydrous phases) 665
clogging fluid pathways in the host rock, in agreement with the results obtained in previous 666
flow-through serpentinization experiments for similar fluid flow conditions (Godard et al., 667
2013; Peuble et al., 2015b; Farough et al., 2016; Luhmann et al., 2017a). 668
669
4.2. Alteration of olivine and formation of carbonates during a high CO2 concentration 670
experiment (659.7 mmol.L-1
) 671
672
High pCO2 experiment SC3-H has probably the highest dissolution rate of olivine, and 673
paradoxically, lower Si outlet fluid concentrations than in experiment SC2-M. The strong 674
dissolution of olivine in sample SC3-H is characterized by abundant etch-pits, similar to those 675
described on several experimental (e.g., Grandstaff, 1978; Malvoisin et al., 2012; King et al., 676
21
2014; Peuble et al., 2015a) and natural samples (Velbel and Ranck, 2008; Velbel, 2009), and 677
attributed to an anisotropic dissolution of the Mg-silicate (King et al., 2014; Peuble et al., 678
2015a ). The relatively low concentrations of Si in this experiment can be ascribed to the 679
development of large Fe(Mg)-rich phyllosilicates (Fig. 5d), trapping part of the Si released 680
upon olivine dissolution. As for the hydrous minerals of low pCO2 experiments, these 681
phyllosilicates are presumably transitional phases formed before serpentinization. However, 682
their formation appears to be related to the pCO2 since the largest phyllosilicates were 683
observed in sample SC3-H. We postulate that the use of a higher concentration of CO2 in this 684
experiment has facilitated the growth of these phases by increasing the dissolution rate of 685
olivine under lower pH conditions (Wogelius and Walther, 1990; Hänchen et al., 2006; 686
Prigiobbe et al., 2009). 687
The identified serpentine precursors resemble an iddingsitized form of olivine according 688
to optical, microscopic and Raman observations (Figs. 4-6). Iddingsitization of olivine is an 689
oxidation and hydration reaction leading to the conservation of Si, the loss of Mg (that is 690
leached out from the olivine surfaces) and the gain of Fe (being preferentially converted into 691
ferric iron) in weathered ultramafic rocks (Delvigne et al., 1979). The more prominent 692
serpentine precursors in sample SC3-H (compared to samples SC1-L and SC2-M) have 693
depleted the percolating fluids in Si and Fe relative to Mg suggesting an underestimation of 694
the olivine dissolution rate in sample SC3-H (compared to samples SC1-L and SC2-M). They 695
also promoted the concentration of ferric iron micro-particles (hematite) along dissolved 696
olivine surfaces. These Fe-oxides may then have acted as preferential nuclei for the 697
polymerization of Fe(Mg)-rich phyllosilicates, as it was previously observed during late 698
stages of olivine iddingsitization (Lee et al., 2015). 699
In sample SC3-H, most of the Mg released upon olivine dissolution was incorporated into 700
a large matrix of magnesite (Fig. 5f). These results confirm that a high concentration of CO2 701
(659.7 mmol.L-1
), resulting in a high dissolution rate of olivine and consequently a high 702
concentration of Mg2+
in the fluid, is required to overcome the difficulty of Mg-carbonates 703
precipitation (due to the highly hydrated character of Mg2+
compared with Ca2+
and Fe2+
ions 704
- see discussion before). Under these conditions, the main alteration reaction of olivine is 705
dominated by the formation of magnesite according to the following reaction: 706
707
3 Mg1.80Fe0.20SiO4 + CO2 + 0.07 CaO(aq) 708
= Mg0.91Ca0.07Fe0.02CO3 + 0.58 FeO(aq) + 4.49 MgO(aq) + 3 SiO2(aq) (4) 709
Magnesite 710
22
711
The comparison of reactions (3) and (4) shows that, for every mole of CO2 converted into 712
carbonates, five moles of olivine need to be dissolved in the low pCO2 experiments but only 713
three in the high pCO2 experiment. This demonstrates a greater potential of olivine to trap 714
CO2 as carbonates when the inlet fluid has a higher partial pressure of CO2. 715
Magnesite is associated with Fe(Mg)-rich phyllosilicates in sample SC3-H. However, the 716
outlet concentration values of Mg, Fe and Ca indicate that these two secondary minerals 717
precipitated at different times in the ultramafic core. The sharp decrease in Fe outlet 718
concentrations coupled with the increasing release of Mg in the first hours of injection suggest 719
an almost immediate polymerization of serpentine fibrous precursors. This process then 720
slowed down after 84 hours, with the increase in Fe outlet concentrations up to ≈ 0.19 ppm. 721
At t ≈ 45h, magnesite began to crystallize by first incorporating calcium, then magnesium and 722
iron, resulting in a significant decrease in the outlet concentrations of Ca, Mg and Fe after t ≈ 723
45, 71 and 116 hours, respectively. These concentrations stabilized after 135 hours, indicating 724
that the olivine carbonation rate rapidly reached a steady state in the percolated aggregate. 725
The onset of the stable carbonation of olivine is correlated with a linear decrease in 726
permeability after 135 hours in sample SC3-H. As in low pCO2 experiments, this correlation 727
attests to negative feedback effects of some olivine alteration products on rock flow paths by 728
reducing pore hydraulic radius and increasing pore tortuosity over time. However, the 729
porosity of sample SC3-H increased throughout the injection whatever the scenarios 730
considered (Fig. 10c). These results suggest first that the overall decrease in rock pore volume 731
during magnesite and serpentine precursors precipitation is (at least temporarily and locally) 732
offset by the porosity created upon olivine dissolution, maintaining fluid renewal at reaction 733
front interfaces (Peuble et al., 2017). They also show that the decrease in permeability 734
recorded during experiment SC3-H is not controlled by the crystallization of secondary 735
minerals. The decrease in permeability is most likely attributed to the heterogeneous 736
distribution of these secondary minerals in the percolated core, which affects primarily the 737
major fluid pathways. 738
739
4.3. Oxidation of olivine ferrous iron and the fate of carbon 740
741
The characterization of reacted samples revealed the presence of reduced carbon, trapping 742
from 0.04% (sample SC3-H) to 0.17% (sample SC2-M) of the CO2 injected into the 743
percolated olivine aggregates (Fig. 8 and Table 3). To our knowledge, it is the first time that 744
23
reduced carbon was measured after olivine alteration experiments in presence of CO2-bearing 745
fluids although it is observed in oceanic and ophiolitic serpentinites (Ménez et al., 2012; 746
Galvez et al., 2013; Sforna et al., 2018), sometimes in association to carbonates 747
(Schwarzenbach et al., 2016). Also, it is worth to note that the precipitation of reduced carbon 748
has been previously reported after another set of reactive percolation experiments using a 749
different set-up and flow-bench (Luquot et al., 2012). These reactive percolation experiments 750
consisted in injecting of CO2-bearing brines (pCO2 = 6 MPa; CO2 = 402 mmol.L-1
) into 751
chlorite/zeolite-rich sandstones at T=95 °C and P=10 MPa. They produced reduced carbon 752
grains with the same poorly organized crystallographic structure as those observed in our 753
samples. Luquot et al. (2012) proposed that these carbon grains were formed after 754
concomitant reduction of the injected CO2 in association to the oxidation of ferrous iron in 755
chlorite. The oxidation of iron liberates electrons (Eq. 5), inducing locally a more reduced 756
environment, which in turn would favor carbon reduction (Eq. 6). 757
Fe2+
= Fe3+
+ e- (5) 758
CO2 + 4H+ + 4 e
- = C
0 + 2H2O (6) 759
The oxidation of Fe2+
during serpentinization is often associated to the abiotic generation 760
of H2 produced from H2O reduction. Subsequently, H2 can react with CO2 to form a wide 761
range of reduced carbon species including condensed carbonaceous matter (Galvez et al., 762
2013; Martinez et al., 2017; Sforna et al., 2018) and possibly methane (McCollom, 2016). 763
Some studies have shown that the production of reduced carbon-bearing phases may be 764
kinetically favored in serpentinizing ultramafic systems when metal alloys are present (Horita 765
and Berndt, 1999; Fu et al., 2008; Lazar et al., 2012) because they act as catalysts. 766
Accordingly, we can question the fact that the sintered nickel porous disk positionned 767
upstream of the olivine sample can have acted similarly during our experiments thus favoring 768
the formation of reduced carbon phases albeit, to our knowledge, Ni-Fe alloys have been 769
shown to act as catalysts of the methane production only (Horita and Berndt, 1999). 770
Alternatively, Milesi et al. (2016) recently demonstrated on the basis of thermodynamical 771
calculations that solid carbonaceous material can be formed during serpentinization without 772
catalysts. Furthermore, they showed that the compositions of fluids sampled in ultramafic-773
hosted hydrothermal vents were consistent with an equilibrium between CO2(aq) and some 774
condensed carbon phases, thus suggesting that these reactions are probably of major 775
importance in ultramafic basements along oceanic spreading centers. 776
During our experiments, the presence of hematite and iddingsite at the olivine surface 777
indicates that oxidation of ferrous iron did occur at the fluid/mineral interface. The pH and pE 778
24
of the inlet fluids were calculated using the PhreeqC geochemical code (Parkhurst and 779
Appelo, 2013); pH values of 4.5, 3.9 and 3.4 and pE values of 5.4, 6.5 and 7.3 were estimated 780
for experiments SC1-L, SC2-M and SC3-H, respectively. When reported on a pE-pH stability 781
diagram of Fe- and C-species, hematite is thermodynamically stable for the conditions 782
characterizing the inlet fluid, which is consistent with a reaction of Fe2+
oxidation at the 783
sample inlet (Figure 11a, b, and c). This oxidation reaction is probably balanced by the 784
reduction of CO2 into carbon, promoting a strong decrease in the fluid pE down to -2.6, -1.4 785
and -0.3 in experiments SC1-L, SC2-M and SC3-H, respectively. So, assuming that pH stays 786
low and constant (e.g., at the onset of the reaction or close to the CO2 injection point), carbon 787
reduction could be favored over water reduction (and hydrogen production) (Figure 11d, e, 788
and f), in contrast to what is classically suggested in the literature to balance the oxidation of 789
ferrous iron during serpentinization (Klein et al., 2009). However, the field of stability of 790
carbon is very narrow and olivine dissolution will increase the pH of reacting fluids 791
downstream, consuming H+ ions in the solutions (Pokrovsky and Schott, 2000; Escario et al., 792
2018). The observation of carbonates in samples SC1-L, SC2-M and SC3-H suggests an 793
increase of the fluid pH to at least values of 6.3, 5.4 and 4.8, respectively. The precipitation of 794
hydrous phases (Fe(Mg)-rich phyllosilicates) requires an increase of pH to at least values of 795
6.6 in experiments SC1-L – SC2-M and of 7.5 in experiment SC3-H (Fig. 11a-c). This two-796
step mechanism (redox reactions followed by dissolution-precipitation reactions), by which 797
reactions along flow paths are controlled by feedback processes between the dissolution of 798
olivine and the changes in fluid composition (including pH), could explain both the limited 799
distribution of reduced carbon, observed only in the pores close to the inlet (Fig. 8), and the 800
predominance of carbonate and hydrous phases in the reacted samples. It is worth noticing 801
that carbonate (magnesite) precipitation conditions are favored in the high pCO2 experiment 802
(minimum pE-pH variations), which could explain the observed high carbonation efficiency 803
in sample SC3-H. 804
Thermodynamic modeling suggests that carbon reduction is strongly controlled by the low 805
pH of fluids, a condition that is rarely met in natural carbonate bearing serpentinizing 806
ultramafic basements, which are dominated by alkaline fluids (Ludwig et al., 2006; 807
Chavagnac et al., 2013; Milesi et al., 2016). This process should however be taken into 808
account when predicting the fate of carbon in the case of a CO2-injection experiment in an 809
ultramafic basement. 810
811
5. Summary and conclusions 812
25
813
This experimental study explores the role of CO2 and fluid flow on the hydrothermal 814
alteration of olivine. Results provide new information to characterize the fluid-rock reactions 815
in the case of an ultramafic aquifer pervaded by CO2-rich hydrothermal waters. It is the first 816
step to improve the parameterization of future numerical models specifically by allowing the 817
measurement of macroscopic characteristics of the mass transfer mechanisms resulting from 818
complex coupled flow-reaction pore scale processes. 819
Far from the CO2 input i.e. under low pCO2 conditions (from 0.1 to 1 MPa), olivine will 820
be mainly altered into hematite and Mg(Fe)-rich phyllosilicates. These iddingsitic-type 821
assemblages may clog most of the rock flow paths, resulting in a strong decrease in 822
permeability in a few days. Some carbonates can form in these conditions, but they are mainly 823
composed of calcium and iron despite the initial Mg-rich system (Fo90). This denotes less 824
favorable conditions of crystallization for Mg- than for Ca- and Fe-carbonates. 825
Closer to the CO2 input (i.e. pCO2 = 10 MPa), olivine will be more efficiently altered. 826
This causes the formation of abundant etch-pits on the olivine surfaces and a larger amount of 827
poorly crystallized Fe(Mg)-rich phyllosilicates depleting the percolating fluids in Si and Fe 828
relative to Mg. In addition to these hydrous phases, magnesite precipitates as dense clusters in 829
the large pores. The carbonation rate of olivine can be 3 to 11 times higher at a pCO2 of 10 830
MPa than when pCO2 is 10 to 100 times lower, respectively. Both carbonated and hydrous 831
minerals induce apparently little changes in porosity but a strong decrease in permeability, 832
attesting to negative feedback effects of the olivine alteration products on the fluid flow. 833
Despite the differences in secondary mineralogy between the low and high pCO2 834
experiments, all samples contain reduced carbon that may indicate a competition for reduction 835
and carbonation processes; both participating to the mineral sequestration of CO2. Carbon 836
formation suggests reducing conditions probably caused by the oxidation of ferrous iron into 837
ferric iron. For the specific boundary condition of the experiments, carbon deposits are limited 838
to the pores located at the inlet in relation to the low production of hematite and the pH 839
gradient in the samples. Nevertheless, one can speculate that the formation of carbon can be a 840
significant mechanism of CO2 sequestration in olivine-dominated basements. 841
For industrial application, long lasting injection is required. Accordingly, the objective 842
should be to prevent as best as possible precipitation in the vicinity of the well and to favor 843
mineralization as far as possible from the injection well. When investigating the injection of a 844
reactive fluid from a well, the most important feature is that seepage velocity decreases 845
linearly to quadratically as the distance to injection increases and therefore the apparent (or 846
26
dynamic) water/rock ratio decreases rapidly. Consequently, the most important feature for 847
optimizing injection is to inject at the largest flow rate as possible in order to locate 848
mineralization as far as possible from the injection well and thus mitigate permeability 849
reduction effects. From this perspective, one can speculate from the permeability (Fig. 2) and 850
CO2 trapping (Fig. 10) curves that the medium pCO2 value (1 MPa) would be the most 851
favorable option. 852
853
Acknowledgements 854
This research was supported by the ANR (CO2FIX-ANR-08-PCO2-003-02) and Université 855
Montpellier 2 (Programme-Pluridisciplinaire-Energie). We thank C. Nevado and D. Delmas 856
for the preparation of the polished sections, and C. Douchet for analytical assistance during 857
ICP-MS analyses at the AETE-ISO ("Analyses des Eléments en Trace dans l'Environnement 858
et ISOtopes") platform from the OREME observatory (University of Montpellier). We also 859
thank Benjamin M. Tutolo and two anonymous reviewers for their detailed comments and 860
suggestions and Rajdeep Dasgupta for editorial handing 861
862 863
Table captions 864
865
Table 1. Experimental setup and sample characteristics for the three experiments. 866
867
Table 2. Concentrations of major elements (Si, Mg, Fe and Ca, in ppm) measured in the inlet 868
fluid by ICP-MS. 869
870
Table 3. Bulk rock analyses. Hydrogen and carbon contents recalculated as H2O and CO2 871
contents respectively in the initial powder and the percolated olivine cores SC2-M and SC3-H 872
(analytical blanks subtracted). 873
874
Table 4. Mass balance calculations. Estimates of dissolved olivine and precipitated secondary 875
minerals relative to the initial samples mass, and corresponding changes in rock porosity. 876
877
Figure captions 878
879
Figure 1. Diagram of the ICARE-RFTS3 experimental device (Geosciences Montpellier). 880

27
881
Figure 2. Samples permeability k (in 10-15
m²) as a function of time (in hours) during 882
experiments SC1-L (pCO2 = 0.1 MPa; CO2 = 6.26 mmol.L-1
), SC2-M (pCO2 = 1 MPa; CO2 = 883
62.6 mmol.L-1
) and SC3-H (pCO2 = 10 MPa; CO2 = 659.7 mmol.L-1
). Symbols in inset. 884
885
Figure 3. (a) Si, (b) Mg, (c) Fe and (d) Ca outlet fluid concentrations (in ppm) versus the 886
elapsed time of the experiments (in hours). Dotted lines correspond to the inlet fluid 887
composition. Symbols in inset. 888
889
Figure 4. Binocular microscope photography of the olivine aggregates (a) before and (b,c,d) 890
after the percolation experiments: (b) sample SC1-L (pCO2 = 0.1 MPa; CO2 = 6.26 mmol.L-
891
1), (c) sample SC2-M (pCO2 = 1 MPa; CO2 = 62.6 mmol.L
-1) and (d) sample SC3-H (pCO2 = 892
10 MPa; CO2 = 659.7 mmol.L-1
). White arrows denote the fluid flow direction during the 893
experiments. The white square indicates the location of the SEM image displayed in Figure 8. 894
895
Figure 5. SEM images of the samples after the experiments (a,b) SC1-L (pCO2 = 0.1 MPa; 896
CO2 = 6.26 mmol.L-1
), (c) SC2-M (pCO2 = 1 MPa; CO2 = 62.6 mmol.L-1
) and (d,e,f) SC3-H 897
(pCO2 = 10 MPa; CO2 = 659.7 mmol.L-1
). Reacted samples are mainly composed of olivine. 898
(a,b,c) Formation of amorphous Mg(Fe)-rich phyllosilicates (phyll) associated with 899
micrograins of silica, calcite and siderite. (d) Precipitation of poorly crystallized Fe(Mg)-rich 900
phyllosilicates forming a loose network of curled fibers. (e) Strong dissolution of olivine 901
evidenced by the development of conical-shaped etch-pits. (f) Sample SC3-H is also 902
characterized by the formation of dense clusters of magnesite (mgn) in large pores located 903
near dissolved olivine grains. 904
905
Figure 6. Raman analyses performed in the inlet area (< 5 mm) of the three percolated 906
samples. Raman spectra of forsterite, hematite, lizardite and iddingsite are from Cnopnras et 907
al. (1991), De Faria et al. (1997), Auzende et al. (2004), and Kuebler et al. (2003), 908
respectively. 909
910
Figure 7. Raman spectrum of the percolated sample SC3-H (pCO2 = 10 MPa; CO2 = 659.7 911
mmol.L-1
). The standard spectrum of magnesite is shown for comparison (Rividi et al., 2010). 912
913

28
Figure 8. (a, b) SEM images showing organic carbon in pores located at the inlet (< 5 mm). in 914
sample SC2-M (pCO2 = 1 MPa; CO2 = 62.6 mmol.L-1
). (c) Raman spectrum obtained on the 915
corresponding area with the typical D and G bands of reduced carbon at respective values of 916
1310 and 1560 cm-1
(Galvez et al., 2013). 917
918
Figure 9. Room temperature Mössbauer spectra performed on (a) the initial bulk rock and the 919
reacted powders of (b) sample SC1-L (pCO2 = 0.1 MPa; CO2 = 6.26 mmol.L-1
), (c) sample 920
SC2-M (pCO2 = 1 MPa; CO2 = 62.6 mmol.L-1
) and (d) sample SC3-H (pCO2 = 10 MPa; CO2 921
= 659.7 mmol.L-1
). The experimental data are represented with circles, the fitted components 922
with dotted light and dark grey lines. Symbols in inset. 923
924
Figure 10: Mass (a) of dissolved olivine and (b) CO2 trapped as carbon and carbonates 925
normalized to the initial samples mass. CO2 contents deduced from geochemical analyses are 926
also reported. (c) Changes in porosity induced by the alteration of olivine into carbonates 927
(siderite or calcite in samples SC1-L and SC2-M; magnesite in sample SC3-H) and hydrous 928
phases (brucite or lizardite in samples SC1-L and SC2-M; goethite or lizardite in sample SC3-929
H) in relation to the initial samples porosity. See text for details. Symbols in inset. 930
931
Figure 11: pH-pE stability diagram of (a, b, c) iron and (d, e, f) carbon phases . Calculations 932
are made at 185 °C under the CO2 concentration conditions of (a, d) experiment SC1-L (CO2 933
= 6.26 mmol.L-1
), (b, e) experiment SC2-M (CO2 = 62.6 mmol.L-1
) and (c, f) experiment 934
SC3-H (CO2 = 659.7 mmol.L-1
) using the JCHESS geochemical code (Van Der Lee and De 935
Windt, 2001). Crosses represent the initial pE and pH conditions of the fluid in each 936
experiment according to the calculations made with the PhreeqC geochemical code (Parkhurst 937
and Appelo, 2013). Initial pE values were calculated assuming an electric potential of -0.3 for 938
a Volvic® water at 25 °C and 0.1 MPa (Lorne et al., 1999). Abbreviations: mgt: magnetite; 939
Fe-phyll: Fe-rich phyllosilicates, sid: siderite. 940
941 942
References 943
944
Andreani, M., Luquot, L., Gouze, P., Godard, M., Hoise, E., Gibert, B., 2009. Experimental 945
study of carbon sequestration reactions controlled by the percolation of CO2-rich brine 946
through peridotites. Environmental Science & Technology 43, 1226-1231. 947
29
Andreani, M., Mevel, C., Boullier, A.M., Escartin, J., 2007. Dynamic control on serpentine 948
crystallization in veins: constraints on hydration processes in oceanic peridotites. 949
Geochemistry Geophysics Geosystems 8, 1-24. 950
Andreani, M., Munoz, M., Marcaillou, C., Delacour, A., 2013. μXANES study of iron redox 951
state in serpentine during oceanic serpentinization. Lithos 178, 70-83. 952
Audier, M., Oberlin, A., Oberlin, M., Coulon, M., Bonnetain, L., 1981. Morphology and 953
crystalline order in catalytic carbons. Carbon 19, 217-224. 954
Auzende, A.-L., Daniel, I., Reynard, B., Lemaire, C., Guyot, F., 2004. High-pressure 955
behaviour of serpentine minerals: a Raman spectroscopic study. Physics and Chemistry of 956
Minerals 31, 269-277. 957
Bearat, H., McKelvy, M.J., Chizmeshya, A.V.G., Gormley, D., Nunuez, R., Carpenter, R.W., 958
Squires, K., Wolf, G.H., 2006. Carbon sequestration via aqueous olivine mineral carbonation: 959
role of passivating layer formation. Environmental Science & Technology 40, 4802-4808. 960
Bernoulli, D., Weissert, H., 1985. Sedimentary fabrics in Alpine ophicalcites, south Pennine 961
Arosa zone, Switzerland. Geology 13, 755-758. 962
Beyssac, O., Goffe, B., Petitet, J.-P., Froigneux, E., Moreau, M., Rouzaud, J.-N., 2003. On the 963
characterization of disordered and heterogeneous carbonaceous materials by Raman 964
spectroscopy. Spectrochimica Acta Part A 59, 2267-2276. 965
Casey, W.H., Bunker, B., 1990. Leaching of mineral and glass surfaces during dissolution. 966
Reviews in mineralogy and geochemistry 23, 397-426. 967
Chavagnac, V., Monnin, C., Ceuleneer, G., Boulart, C., Hoareau, G., 2013. Characterization 968
of hyperalkaline fluids produced by low‐temperature serpentinization of mantle peridotites 969
in the Oman and Ligurian ophiolites. Geochemistry, Geophysics, Geosystems 14, 2496-2522. 970
Cnopnras, A., 1991. Single crystal Raman spectra of forsterite, fayalite, and monticellite. 971
American Mineralogist 76, 110L1109. 972
Coggon, R.M., Teagle, D.A.H., Smith-Duque, C.E., Alt, J.C., Cooper, M.J., 2010. 973
Reconstructing past seawater Mg/Ca and Sr/Ca from mid-ocean ridge flank calcium carbonate 974
veins. Science 327, 1114-1117. 975
Dasgupta, R., Hirschmann, M.M., 2010. The deep carbon cycle and melting in Earth's 976
interior. Earth and Planetary Science Letters 298, 1-13. 977
Daval, D., Hellmann, R., Saldi, G.D., Wirth, R., Knauss, K.G., 2013. Linking nm-scale 978
measurements of the anisotropy of silicate surface reactivity to macroscopic dissolution rate 979
laws: New insights based on diopside. Geochimica et Cosmochimica Acta 107, 121-134. 980
30
Daval, D., Sissmann, O., Menguy, N., Saldi, G.D., Guyot, F., Martinez, I., Corvisier, J., 981
Garcia, B., Machouk, I., Knauss, K.G., Hellmann, R., 2011. Influence of amorphous silica 982
layer formation on the dissolution rate of olivine at 90°C and elevated pCO2. Chemical 983
Geology 284, 193-209. 984
De Faria, D.L.A., Venâncio Silva, S., De Oliveira, M.T., 1997. Raman microspectroscopy of 985
some iron oxides and oxyhydroxides. Journal of Raman spectroscopy 28, 873-878. 986
Deer, W.A., Howie, R.A., Zussman, J., 1992. An introduction to the rock-forming minerals. 987
Longman Scientific & Technical Hong Kong. 988
Delvigne, J., Bisdom, E.B.A., Sleeman, J., Stoops, G., 1979. Olivines, their pseudomorphs 989
and secondary products. Stiboka. 990
Dullien, F.A.L., 1979. Porous media: fluid transport and pore structure. Academic press, 991
New-York. 992
Dyar, M.D., Agresti, D.G., Schaefer, M.W., Grant, C.A., Sklute, E.C., 2006. Mössbauer 993
Spectroscopy of Earth and Planetary Materials. Annual Review of Earth and Planetary 994
Sciences 34, 83-125. 995
Escario, S., Godard, M., Gouze, P., Leprovost, R., 2018. Experimental study of the effects of 996
solute transport on reaction paths during incipient serpentinization. Lithos. 997
Farough, A., Moore, D.E., Lockner, D.A., Lowell, R.P., 2016. Evolution of fracture 998
permeability of ultramafic rocks undergoing serpentinization at hydrothermal conditions: An 999
experimental study. Geochemistry, Geophysics, Geosystems 17, 44-55. 1000
Ferry, J.M., 2000. Patterns of mineral occurrence in metamorphic rocks. American 1001
Mineralogist 85, 1573-1588. 1002
Fu, Q., Foustoukos, D.I., Seyfried, W.E., 2008. Mineral catalyzed organic synthesis in 1003
hydrothermal systems: An experimental study using time-of-flight secondary ion mass 1004
spectrometry. Geophysical research letters 35. 1005
Galvez, M.E., Beyssac, O., Martinez, I., Benzerara, K., Chaduteau, C., Malvoisin, B., 1006
Malavieille, J., 2013. Graphite formation by carbonate reduction during subduction. Nature 1007
Geoscience 6, 473-477. 1008
Gautier, Q., 2012. Cinétiques de précipitation de minéraux carbonatés magnésiens, influence 1009
de ligands organiques et conséquences pour la séquestration minérale du CO2. Université 1010
Paris-Est. 1011
Giammar, D.E., Bruant, J.R.G., Peters, C.A., 2005. Forsterite dissolution and magnesite 1012
precipitation at conditions relevant for deep saline aquifer storage and sequestration of carbon 1013
dioxide. Chemical Geology 217, 257-276. 1014
31
Gislason, S.R., Wolff-Boenisch, D., Stefansson, A., Oelkers, E., Gunnlaugsson, E., 1015
Sigurdardottir, H., Sigfusson, B., Broecker, W., Matter, J., Stute, M., Axelsson, G., 1016
Fridriksson, T., 2010. Mineral sequestration of carbon dioxide in basalt: the CarbFix project. 1017
International Journal of Greenhouse Gas Control 4, 537–545. 1018
Godard, M., Luquot, L., Andreani, M., Gouze, P., 2013. Incipient hydration of mantle 1019
lithosphere at ridges: a reactive-percolation experiment. Earth and Planetary Science Letters 1020
371, 92-102. 1021
Grandstaff, D.E., 1978. Changes in surface area and morphology and the mechanism of a 1022
forsterite dissolution. Geochimica et Cosmochimica Acta 42, 1899-1901. 1023
Hänchen, M., Prigiobbe, V., Baciocchi, R., Mazzotti, M., 2008. Precipitation in the Mg-1024
carbonate system: effects of temperature and CO2 pressure. Chemical Engineering Science 63, 1025
1012-1028. 1026
Hänchen, M., Prigiobbe, V., Storti, G., Seward, T.M., Mazzoti, M., 2006. Dissolution kinetics 1027
of fosteritic olivine at 90–150°C including effects of the presence of CO2. Geochimica et 1028
Cosmochimica Acta 70, 4403-4416. 1029
Hansen, L.D., Dipple, G.M., Gordon, T.M., Kellett, D.A., 2005. Carbonated serpentinite 1030
(listwanite) at Atlin, British Columbia: A geological analogue to carbon dioxide sequestration. 1031
The Canadian Mineralogist 43, 225-239. 1032
Horita, J., Berndt, M.E., 1999. Abiogenic methane formation and isotopic fractionation under 1033
hydrothermal conditions. Science 285, 1055-1057. 1034
Jamtveit, B., Malthe-Sørenssen, A., Kostenko, O., 2008. Reaction enhanced permeability 1035
during retrogressive metamorphism. Earth and Planetary Science Letters 267, 620-627. 1036
Javoy, M., Pineau, F., 1991. The volatiles record of a popping rock from the Mid-Atlantic 1037
ridge at 14°N: chemical and isotopic composition of gas trapped in the vesicles. Earth and 1038
Planetary Science Letters 107, 598-611. 1039
Jun, Y.-S., Giammar, D.E., Werth, C.J., 2013. Impacts of geochemical reactions on geologic 1040
carbon sequestration. Environmental Science & Technology 47, 3-8. 1041
Kelemen, P.B., Hirth, G., 2012. Reaction-driven cracking during retrograde metamorphism: 1042
Olivine hydration and carbonation. Earth and Planetary Science Letters 345, 81-89. 1043
Kelemen, P.B., Manning, C.E., 2015. Reevaluating carbon fluxes in subduction zones, what 1044
goes down, mostly comes up. Proceedings of the National Academy of Sciences 112, E3997-1045
E4006. 1046
Kelemen, P.B., Matter, J., 2008. In situ carbonation of peridotite for CO2 storage. Proceedings 1047
of the National Academy of Sciences 105, 17295–17300. 1048

32
Kelemen, P.B., Matter, J., Streit, E.E., Rudge, J.F., Curry, W.B., Blusztajn, J., 2011. Rates 1049
and mechanisms of mineral carbonation in peridotite: natural processes and recipes for 1050
enhanced, in situ CO2 capture and storage. Annual Review of Earth and Planetary Sciences 1051
39, 546-576. 1052
King, H.E., Satoh, H., Tsukamoto, K., Putnis, A., 2014. Surface-specific measurements of 1053
olivine dissolution by phase-shift interferometry. American Mineralogist 99, 377-386. 1054
Klein, F., Bach, W., Jöns, N., McCollom, T., Moskowitz, B., Berquó, T., 2009. Iron 1055
partitioning and hydrogen generation during serpentinization of abyssal peridotites from 15°N 1056
on the Mid-Atlantic Ridge. Geochimica et Cosmochimica Acta 73, 6868-6893. 1057
Klein, F., McCollom, T.M., 2013. From serpentinization to carbonation: New insights from a 1058
CO2 injection experiment. Earth and Planetary Science Letters 379, 137-145. 1059
Kuebler, K., 2009. A comparison of iddingsite alteration in two terrestrial basalts and the 1060
ALHA 77005 martian meteorite using Raman spectroscopy and electron microprobe analyses. 1061
Kuebler, K., 2013. A comparison of the iddingsite alteration products in two terrestrial basalts 1062
and the Allan Hills 77005 martian meteorite using Raman spectroscopy and electron 1063
microprobe analyses. Journal of Geophysical Research: Planets (1991–2012) 118, 803-830. 1064
Kuebler, K., Wang, A., Haskin, L.A., Jolliff, B.L., 2003. A study of olivine alteration to 1065
iddingsite using Raman spectroscopy, Lunar and Planetary Institute Science Conference 1066
Abstracts, p. 1953. 1067
Lazar, C., McCollom, T., Manning, C.E., 2012. Abiogenic methanogenesis during 1068
experimental komatiite serpentinization: implications for the evolution of the early 1069
Precambrian atmosphere. Chemical Geology 326, 102-112. 1070
Lee, M.R., Tomkinson, T., Hallis, L.J., Mark, D.F., 2015. Formation of iddingsite veins in the 1071
martian crust by centripetal replacement of olivine: Evidence from the nakhlite meteorite 1072
Lafayette. Geochimica et Cosmochimica Acta 154, 49-65. 1073
Lorne, B., Perrier, F., Avouac, J.-P., 1999. Streaming potential measurements: 1. Properties of 1074
the electrical double layer from crushed rock samples. Journal of Geophysical Research: Solid 1075
Earth (1978–2012) 104, 17857-17877. 1076
Ludwig, K.A., Kelley, D.S., Butterfield, D.A., Nelson, B.K., Früh-Green, G.L., 2006. 1077
Formation and evolution of carbonate chimneys at the Lost City Hydrothermal Field. 1078
Geochimica et Cosmochimica Acta 70, 3625-3645. 1079
Luhmann, A.J., Tutolo, B.M., Bagley, B.C., Mildner, D.F., Scheuermann, P.P., Feinberg, 1080
J.M., Ignatyev, K., Seyfried Jr, W., 2017a. Chemical and physical changes during seawater 1081
33
flow through intact dunite cores: An experimental study at 150–200° C. Geochimica et 1082
Cosmochimica Acta 214, 86-114. 1083
Luhmann, A.J., Tutolo, B.M., Tan, C., Moskowitz, B.M., Saar, M.O., Seyfried, W.E., 2017b. 1084
Whole rock basalt alteration from CO2-rich brine during flow-through experiments at 150 ° C 1085
and 150 bar. Chemical Geology 453, 92-110. 1086
Luquot, L., Andreani, M., Gouze, P., Camps, P., 2012. CO2 percolation experiment through 1087
chlorite/zeolite-rich sandstone (Pretty-Hill Formation – Otway Basin–Australia). Chemical 1088
Geology 294-29, 75-88. 1089
Malvoisin, B., Brunet, F., 2014. Water diffusion-transport in a synthetic dunite: Consequences 1090
for oceanic peridotite serpentinization. Earth and Planetary Science Letters 403, 263-272. 1091
Malvoisin, B., Brunet, F., Carlut, J., Rouméjon, S., Cannat, M., 2012. Serpentinization of 1092
oceanic peridotites: 2. Kinetics and processes of San Carlos olivine hydrothermal alteration. 1093
Journal of Geophysical Research 117. 1094
Mao, S., Duan, Z., 2009. The viscosity of aqueous alkali-chloride solutions up to 623 K, 1000 1095
bar and high ionic strength. International Journal of Thermophysics 30, 1510-1523. 1096
Martinez, I., Vacquand, C., Kularatne, K., Sissmann, O., Milesi, V., Bernard, S., 2017. 1097
Formation of reduced carbon compounds using natural catalysts in hydrothermal experiments, 1098
Goldschmidt Abstract, 2602. 1099
Matter, J.M., Kelemen, P.B., 2009. Permanent storage of carbon dioxide in geological 1100
reservoirs by mineral carbonation. Nature Geoscience 2, 837-841. 1101
McCollom, T.M., 2016. Abiotic methane formation during experimental serpentinization of 1102
olivine. Proceedings of the National Academy of Sciences 113, 13965-13970. 1103
McGrail, B.P., Spane, F.A., Sullivan, E.C., Bacon, D.H., Hund, G., 2011. The Wallula basalt 1104
sequestration pilot project. Energy Procedia 4, 5653-5660. 1105
Ménez, B., Pasini, V., Brunelli, D., 2012. Life in the hydrated suboceanic mantle. Nature 1106
Geoscience 5, 133-137. 1107
Milesi, V., McCollom, T.M., Guyot, F., 2016. Thermodynamic constraints on the formation 1108
of condensed carbon from serpentinization fluids. Geochimica et Cosmochimica Acta 189, 1109
391-403. 1110
Nakamura, K., Kato, Y., 2004. Carbonatization of oceanic crust by the seafloor hydrothermal 1111
activity and its significance as a CO2 sink in the early Archean. Geochimica et Cosmochimica 1112
Acta 68, 4595-4618. 1113
34
Nasir, S., Sayigh, A., Razak, A., Al Harthy, A., Al-Khirbash, S., Al-Jaaidi, O., Musllam, A., 1114
Al-Mishwat, A., Al-Bu'saidi, S., 2007. Mineralogical and geochemical characterization of 1115
listwaenite from the Semail ophiolite, Oman. Chemie Der Erde-Geochemistry 67, 213-228. 1116
Noël, J., Godard, M., Oliot, E., Martinez, I., Williams, M., Boudier, F., Rodriguez, O., 1117
Chaduteau, C., Escario, S., Gouze, P., 2018. Evidence of polygenetic carbon trapping in the 1118
Oman Ophiolite: Petro-structural, geochemical, and carbon and oxygen isotope study of the 1119
Wadi Dima harzburgite-hosted carbonates (Wadi Tayin massif, Sultanate of Oman). Lithos. 1120
Oelkers, E.H., Gislason, S.R., Matter, J., 2008. Mineral carbonation of CO2. Elements 4, 333-1121
337. 1122
Parkhurst, D.L., Appelo, C.A.J., 2013. Description of Input and Examples for PHREEQC 1123
Version 3--a Computer Program for Speciation, Batch-reaction, One-dimensional Transport, 1124
and Inverse Geochemical Calculations: Ch. A43. U.S. Geological Survey Techniques and 1125
Methods book 6. USGS. 1126
Paterson, M.S., 1990. Rock deformation experimentation. Geophysical monograph series 56, 1127
187-194. 1128
Peuble, S., Andreani, M., Godard, M., Gouze, P., Barou, F., Van De Moortèle, B., Mainprice, 1129
D., Reynard, B., 2015a. Carbonate mineralization in percolated olivine aggregates: Linking 1130
effects of crystallographic orientation and fluid flow. American Mineralogist 100, 474-482. 1131
Peuble, S., Andreani, M., Gouze, P., Pollet-Villard, M., Reynard, B., Van de Moortele, B., 1132
2017. Multi-scale characterization of the incipient carbonation of peridotite. Chemical 1133
Geology 476, 150-160. 1134
Peuble, S., Godard, M., Luquot, L., Andreani, M., Martinez, I., Gouze, P., 2015b. CO2 1135
geological storage in olivine rich basaltic aquifers: New Insights from flow-through 1136
experiments. Applied Geochemistry 52, 174-190. 1137
Pineau, F., Javoy, M., 1994. Strong degassing at ridge crests: the behaviour of dissolved 1138
carbon and water in basalt glasses at 14°N, Mid-Atlantic ridge. Earth and Planetary Science 1139
Letters 123, 179-184. 1140
Pokrovsky, O.S., Schott, J., 2000. Kinetics and mechanism of forsterite dissolution at 25°C 1141
and pH from 1 to 12. Geochimica et Cosmochimica Acta 64, 3313–3325. 1142
Pokrovsky, O.S., Schott, J., 2002. Surface chemistry and dissolution kinetics of divalent metal 1143
carbonates. Environmental Science & Technology 36, 426-432. 1144
Prigiobbe, V., Costa, G., Baciocchi, R., Hänchen, M., Mazzotti, M., 2009. The effect of CO2 1145
and salinity on olivine dissolution kinetics at 120°C. Chemical Engineering Science 64, 3510-1146
3515. 1147
35
Rausch, S., Böhm, F., Bach, W., Klügel, A., Eisenhauer, A., 2013. Calcium carbonate veins in 1148
ocean crust record a threefold increase of seawater Mg/Ca in the past 30 million years. Earth 1149
and Planetary Science Letters 362, 215-224. 1150
Rividi, N., Van Zuilen, M., Philippot, P., Menez, B., Godard, G., Poidatz, E., 2010. 1151
Calibration of carbonate composition using micro-Raman analysis: application to planetary 1152
surface exploration. Astrobiology 10, 293-309. 1153
Rosso, J.J., Rimstidt, J.D., 2000. A high resolution study of forsterite dissolution rates. 1154
Geochimica et Cosmochimica Acta 64, 797-811. 1155
Rudge, J.F., Kelemen, P.B., Spiegelman, M., 2010. A simple model of reaction-induced 1156
cracking applied to serpentinization and carbonation of peridotite. Earth and Planetary 1157
Science Letters 291, 215-227. 1158
Saldi, G., Schott, J., Pokrobsky, O., Gautier, Q., Oelkers, E., 2012. An experimental study of 1159
magnesite precipitation rates at neutral to alkaline conditions and 100-200°C as a function of 1160
pH, aqueous solution composition and chemical affinity. Geochimica et Cosmochimica Acta 1161
83, 93-109. 1162
Saldi, G.D., Jordan, G., Schott, J., Oelkers, E.H., 2009. Magnesite growth rates as a function 1163
of temperature and saturation state. Geochimica et Cosmochimica Acta 73, 5646-5657. 1164
Schott, J., Pokrovsky, O.S., Oelkers, E.H., 2009. The link between mineral 1165
dissolution/precipitation kinetics and solution chemistry. Reviews in Mineralogy & 1166
Geochemistry 70, 207-258. 1167
Schwarzenbach, E.M., Früh-Green, G.L., Bernasconi, S.M., Alt, J.C., Plas, A., 2013. 1168
Serpentinization and carbon sequestration: A study of two ancient peridotite-hosted 1169
hydrothermal systems. Chemical Geology 351, 115-133. 1170
Schwarzenbach, E.M., Gill, B.C., Gazel, E., Madrigal, P., 2016. Sulfur and carbon 1171
geochemistry of the Santa Elena peridotites: Comparing oceanic and continental processes 1172
during peridotite alteration. Lithos 252, 92-108. 1173
Seifritz, W., 1990. CO2 disposal by means of silicates. Nature 345, 486. 1174
Sforna, M.C., Brunelli, D., Pisapia, C., Pasini, V., Malferrari, D., Ménez, B., 2018. Abiotic 1175
formation of condensed carbonaceous matter in the hydrating oceanic crust. Nature 1176
Communications 9, 5049. 1177
Sissmann, O., Brunet, F., Martinez, I., Guyot, F., Verlaguet, A., Pinquier, Y., Daval, D., 2014. 1178
Enhanced olivine carbonation within a basalt as compared to single-phase experiments: 1179
reevaluating the potential of CO2 mineral sequestration. Environmental Science & 1180
Technology. 1181
36
Steefel, C.I., DePaolo, D.J., Lichtner, P.C., 2005. Reactive transport modeling: an essential 1182
tool and a new research approach for the Earth sciences. Earth and Planetary Science Letters 1183
240, 539-558. 1184
Tutolo, B.M., Luhmann, A.J., Tosca, N.J., Seyfried, W.E., 2018. Serpentinization as a 1185
reactive transport process: The brucite silicification reaction. Earth and Planetary Science 1186
Letters 484, 385-395. 1187
Van Der Lee, J., De Windt, L., 2001. Present state and future directions of modeling of 1188
geochemistry in hydrogeological systems. Journal of Contaminant Hydrology 47, 265-282. 1189
Van der Lee, J., De Windt, L., Lagneau, V., Goblet, P., 2003. Module-oriented modeling of 1190
reactive transport with HYTEC. Computers and Geosciences 29, 265–275. 1191
Velbel, M.A., 2009. Dissolution of olivine during natural weathering. Geochimica et 1192
Cosmochimica Acta 73, 6098-6113. 1193
Velbel, M.A., Ranck, J.M., 2008. Etch pits on naturally altered olivine from dunites of the 1194
Appalachian Blue Ridge Mountains, North Carolina, USA. Mineralogical Magazine 72, 145-1195
148. 1196
Wogelius, R.A., Walther, J.V., 1990. Olivine dissolution at 25°C: effects of pH, CO2, and 1197
organic acids. Geochimica et Cosmochimica Acta 55, 943-954. 1198
Yeghicheyan, D., Bossy, C., Coz, M.B., Douchet, C., Granier, G., Heimburger, A., Lacan, F., 1199
Lanzanova, A., Rousseau, T., Seidel, J.-L., 2013. A compilation of Silicon, Rare Earth 1200
Element and twenty-one other Trace Element concentrations in the Natural River Water 1201
Reference Material SLRS-5 (NRC-CNRC). Geostandards and Geoanalytical Research. 1202
Zeebe, R.E., Caldeira, K., 2008. Close mass balance of long-term carbon fluxes from ice-core 1203
CO2 and ocean chemistry records. Nature Geoscience 1, 312-315. 1204
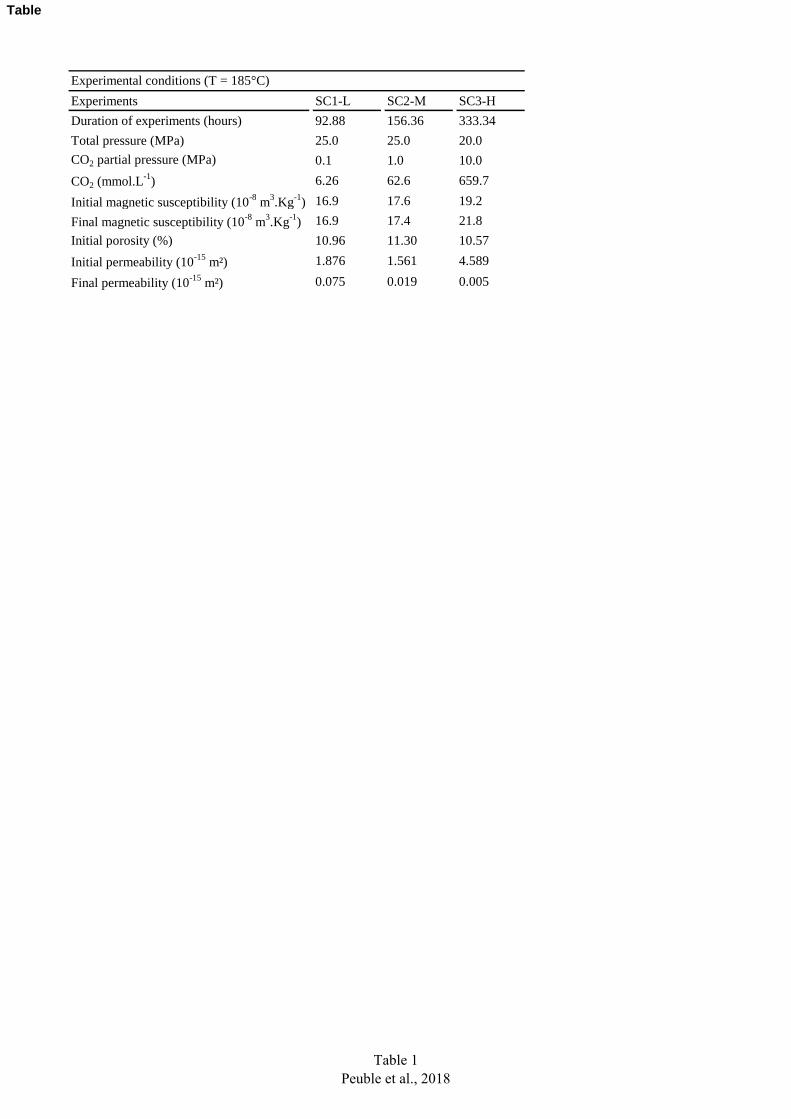
Experiments SC1-L SC2-M SC3-HDuration of experiments (hours) 92.88 156.36 333.34
Total pressure (MPa) 25.0 25.0 20.0
CO2 partial pressure (MPa) 0.1 1.0 10.0
CO2 (mmol.L-1
) 6.26 62.6 659.7
Initial magnetic susceptibility (10-8
m3.Kg
-1) 16.9 17.6 19.2
Final magnetic susceptibility (10-8
m3.Kg
-1) 16.9 17.4 21.8
Initial porosity (%) 10.96 11.30 10.57
Initial permeability (10-15
m²) 1.876 1.561 4.589
Final permeability (10-15
m²) 0.075 0.019 0.005
Experimental conditions (T = 185°C)
Table 1
Peuble et al., 2018
Table
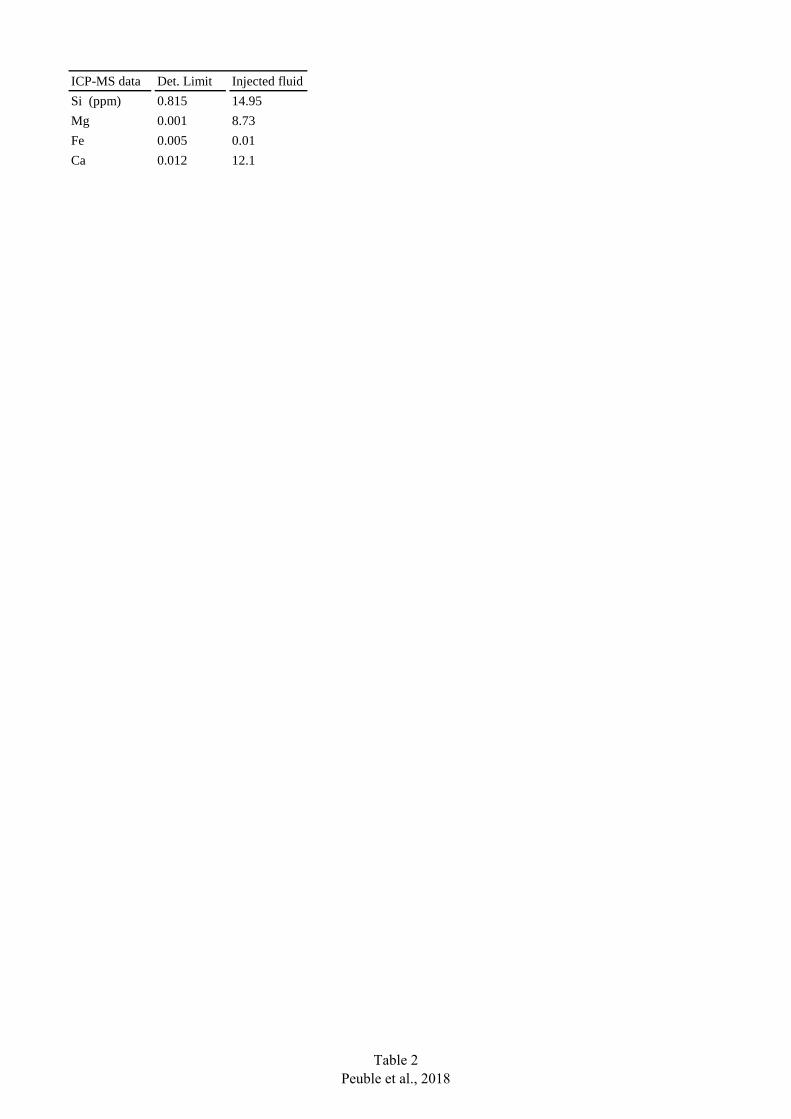
ICP-MS data Det. Limit Injected fluid
Si (ppm) 0.815 14.95
Mg 0.001 8.73
Fe 0.005 0.01
Ca 0.012 12.1
Table 2
Peuble et al., 2018

Table 3Peuble et al., 2018
Bulk rock analyses (wt.%) Initial olivine powder SC2-M SC3-H
H2O 0.04 0.08 n.a.CO2 inorganic < 0.05 0.10 1.31CO2 organic* < 0.05 0.17 0.04CO2 total < 0.05 0.27 1.35
Note. n.a.: not analyzed ; *organic carbon recalculated as CO 2
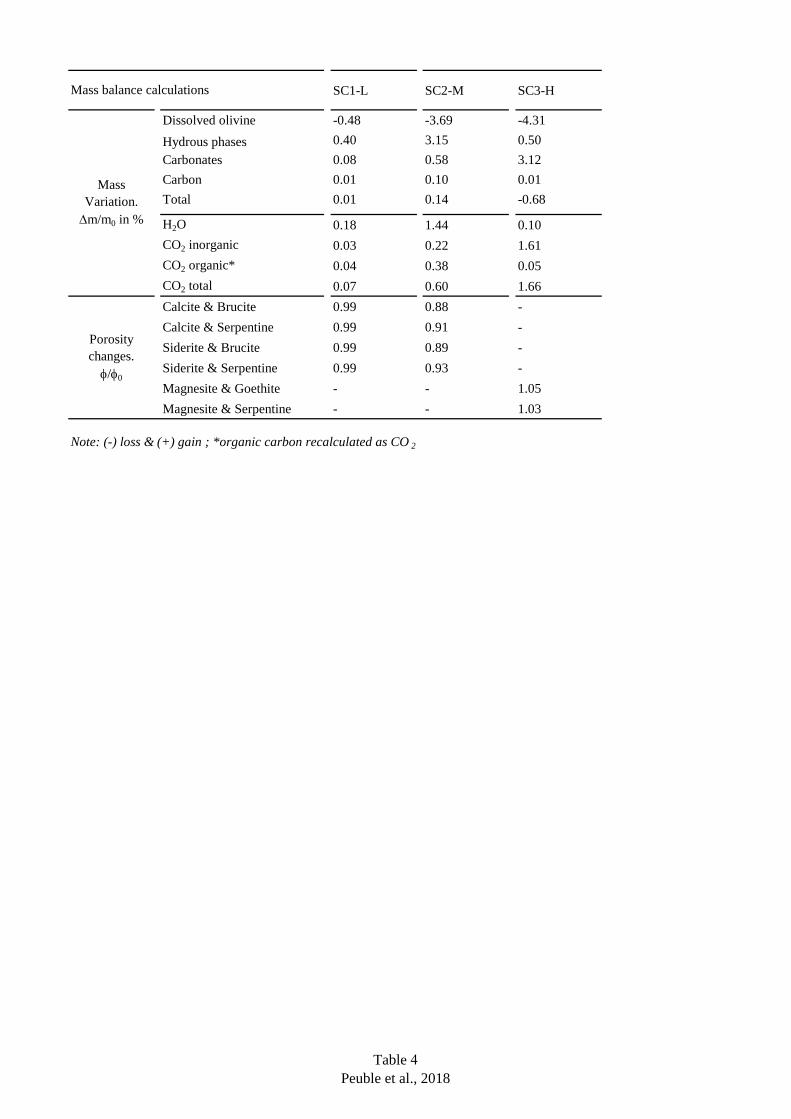
Table 4Peuble et al., 2018
SC1-L SC2-M SC3-H
Dissolved olivine -0.48 -3.69 -4.31Hydrous phases 0.40 3.15 0.50Carbonates 0.08 0.58 3.12Carbon 0.01 0.10 0.01Total 0.01 0.14 -0.68
H2O 0.18 1.44 0.10CO2 inorganic 0.03 0.22 1.61CO2 organic* 0.04 0.38 0.05CO2 total 0.07 0.60 1.66Calcite & Brucite 0.99 0.88 -Calcite & Serpentine 0.99 0.91 -Siderite & Brucite 0.99 0.89 -Siderite & Serpentine 0.99 0.93 -Magnesite & Goethite - - 1.05Magnesite & Serpentine - - 1.03
Note: (-) loss & (+) gain ; *organic carbon recalculated as CO 2
Mass Variation. ∆m/m0 in %
Porosity changes. φ/φ0
Mass balance calculations
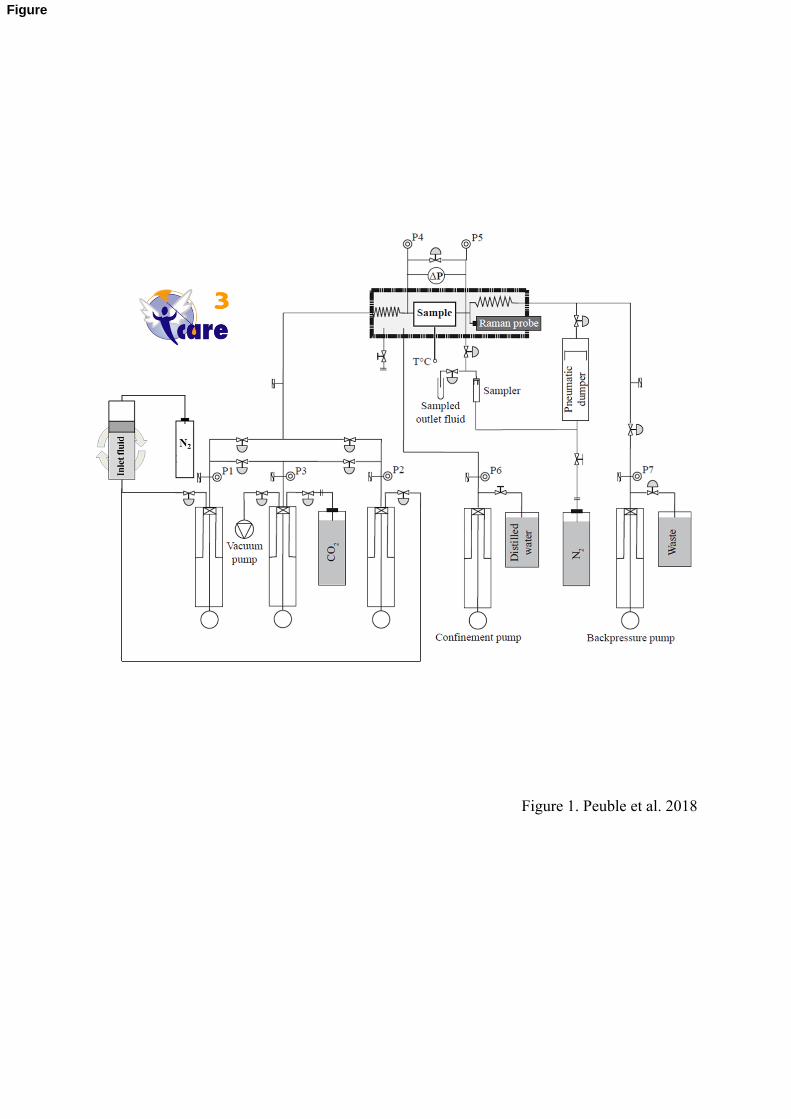
Figure 1. Peuble et al. 2018
Figure

Figure 2. Peuble et al. 2018
10
1
Perm
eabi
lity
in 1
0-15 m
2 (m
D)
0.1
0.01
0.0010 48 96 144 192
Time (hours)240 288 336
SC2-M (pCO2 = 1 MPa)SC1-L (pCO2 = 0.1 MPa)
SC3-H (pCO2 = 10 MPa)
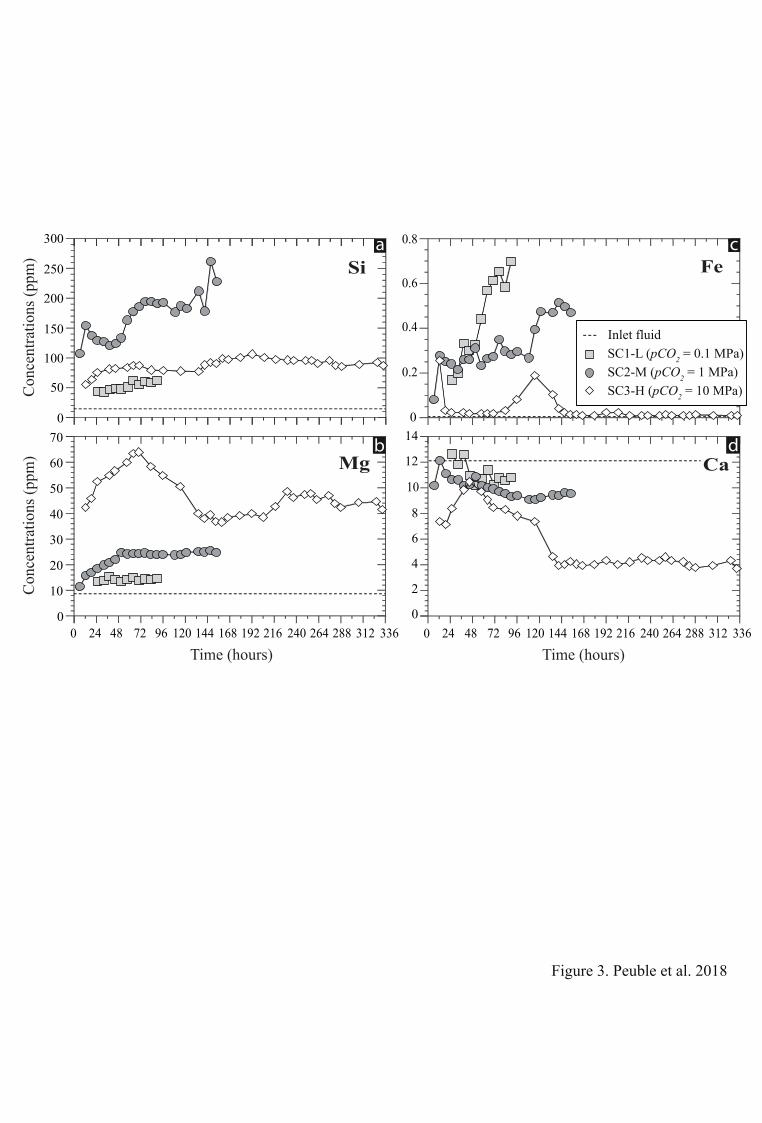
Figure 3. Peuble et al. 2018
0 4824 9672 144120 192168 240216 288264 336312
Time (hours)
Con
cent
ratio
ns (p
pm) Si
0
50
100
150
200
250
300 aa
Time (hours)
e
0
10
20
30
40
50
60
70
Mgb
Con
cent
ratio
ns (p
pm)
0 48 7224 96 144120 192168 240216 288264 336312
Ca14
12
8
6
4
2
0
10
d
Fe
0
0.2
0.4
0.6
0.8 c
SC2-M (pCO2 = 1 MPa)SC1-L (pCO2 = 0.1 MPa)Inlet fluid
SC3-H (pCO2 = 10 MPa)

Figure 4. Peuble et al. 2018
1 mm
1 mm
1 mm
Fluid flow
1 mm
b
a
c
d
Fig.8Fluid flow
Fluid flow

Mgn
Olivine
Mgn
20 µm
Si-grains
20 µm
Olivine
Siderite
10 µm
Olivine
Calcite
5 µm
Olivine
Etch-pits
10 µmOlivine
Fe(Mg)-phyll.
5 µm
Calcite
Olivine
Mg(Fe)-phyll.
Fe(Mg)-phyll.
Figure 5. Peuble et al. 2018
da
b
c
e
f
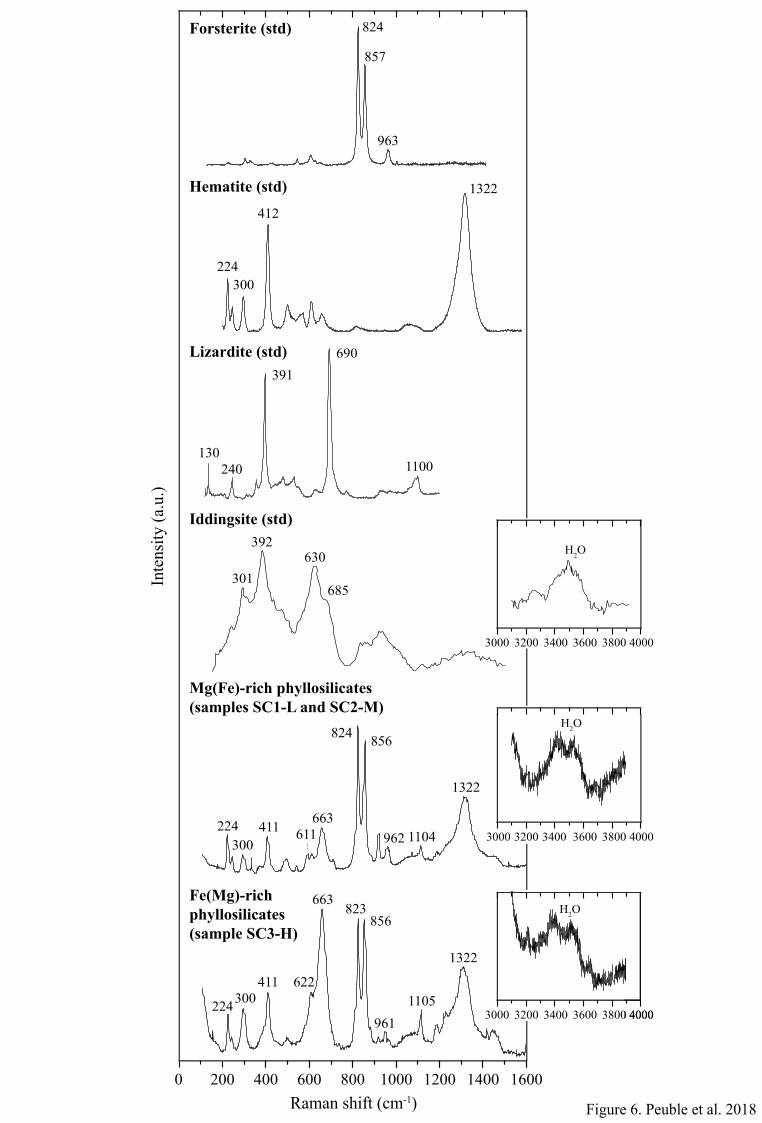
824
Mg(Fe)-rich phyllosilicates(samples SC1-L and SC2-M)
856
663611411
300224
856
962
Iddingsite (std)
824Forsterite (std)
Hematite (std)
857
963
1322
412
224300
630301
392
685
H2OH2O
Fe(Mg)-rich phyllosilicates (sample SC3-H)
200 0 400 600 800 1000 1200 1400 1600
Inte
nsity
(a.u
.)
663
622411300224
Figure 6. Peuble et al. 2018
1322
1322
823
961
Raman shift (cm-1)
Lizardite (std)
130240
391690
1100
1105
1104 3600 3800 4000
H2O
3200 34003000
3600 3800 40003000 3200 3400 3600 3800 4000
H2O
H2O
3000 3200 3400 3600 3800 4000
H2O
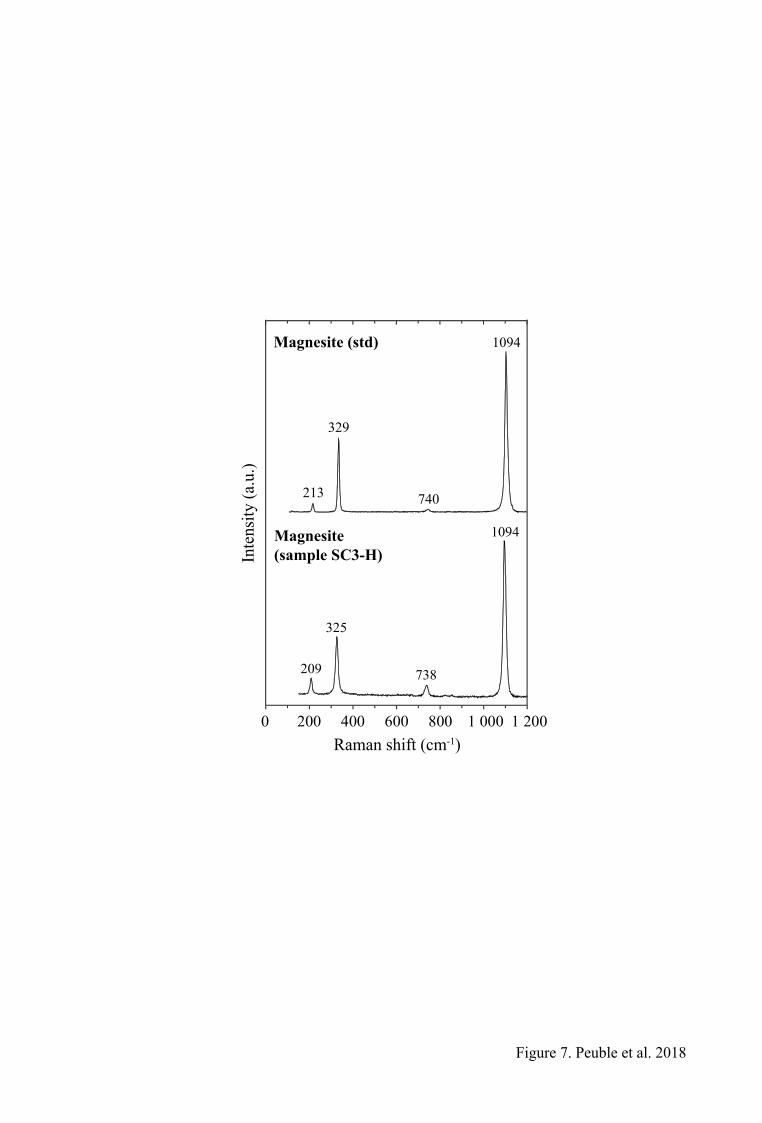
1094
738
325
209
Magnesite (sample SC3-H)
1094
740
329
213
Magnesite (std)
0 200 400 600 800 1 000 1 200Raman shift (cm-1)
Figure 7. Peuble et al. 2018
Inte
nsity
(a.u
.)

Figure 8. Peuble et al. 2018
20 µm
Olivine
Carbon
b
Olivine
a
b
100 µm
200 400 600 800 1 000 1 200 1 400 1 600 1 800 2 000 2 200 2 400 2 600 2 800 3 000 3 200 3 400 3 600 3 800
Raman shift (cm-1)
Inte
nsity
(a.u
.)
D Gc
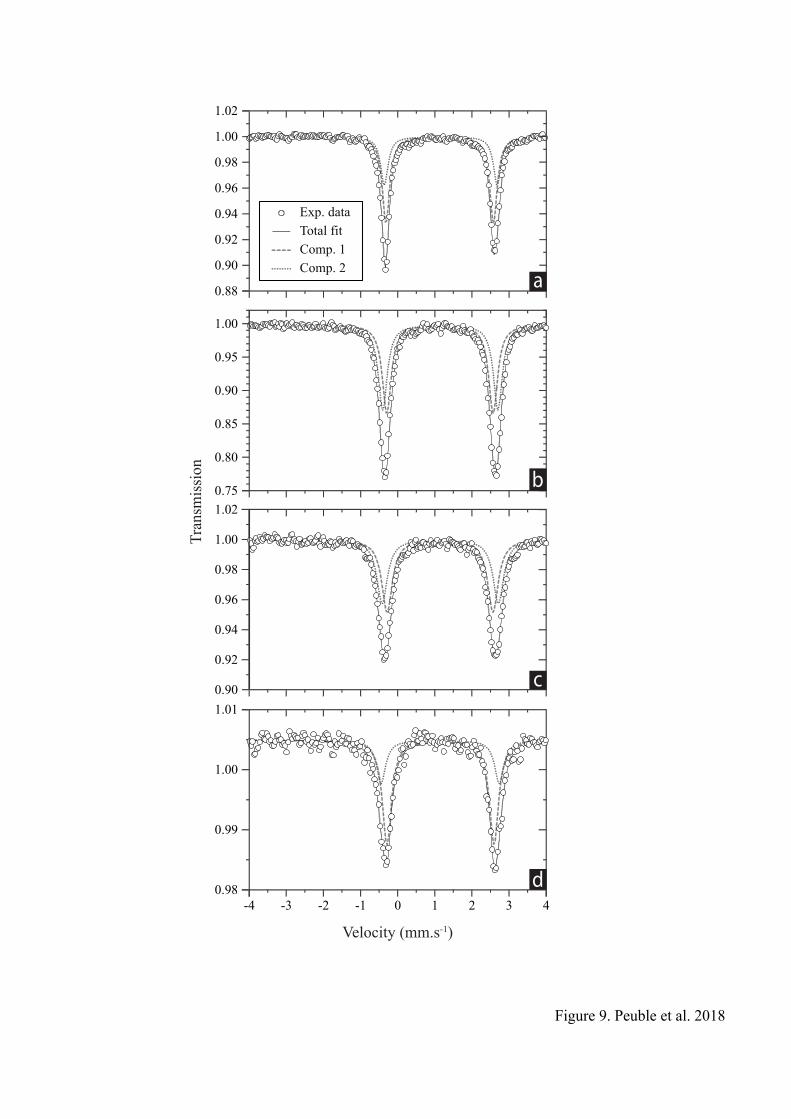
0.88
0.90
0.92
0.94
0.96
0.98
1.00
1.02
0.75
0.80
0.85
0.90
0.95
1.00
0.92
0.94
0.96
0.98
1.00
1.02
0.90
0.98
0.99
1.00
1.01
-4 -3 -2 -1 0 1 2 3 4
Tran
smis
sion
Figure 9. Peuble et al. 2018
Velocity (mm.s-1)
Total fitExp. data
Comp. 1Comp. 2
a
b
c
d
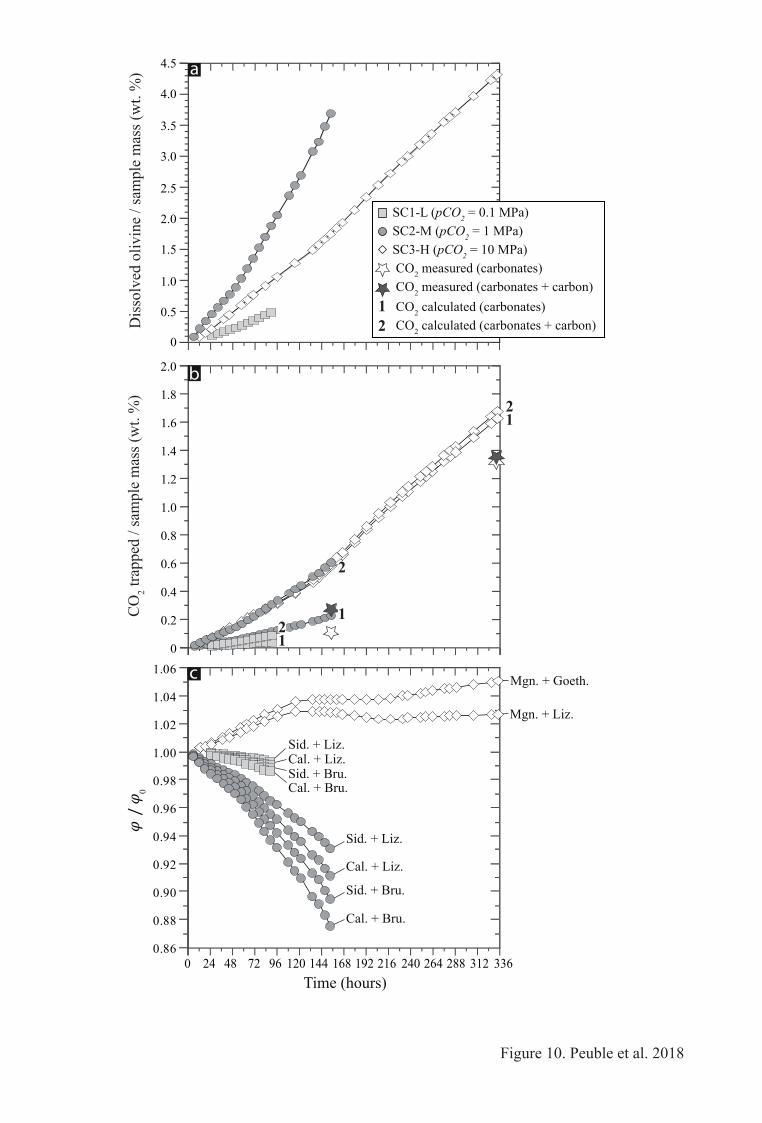
2.0
Figure 10. Peuble et al. 2018
0 4824 9672 144120 192168Time (hours)
240216 288264 336312
0.5
1.0
1.5
2.0
2.5
CO
2 tra
pped
/ sa
mpl
e m
ass (
wt.
%)
Dis
solv
ed o
livin
e / s
ampl
e m
ass (
wt.
%)
0
0.2
0.4
0.6
0.8
1.0
1.2
1.4
1.6
1.8
3.0
3.5
4.0
4.5
SC2-M (pCO2 = 1 MPa)SC1-L (pCO2 = 0.1 MPa)
SC3-H (pCO2 = 10 MPa) CO2 measured (carbonates) CO2 measured (carbonates + carbon) CO2 calculated (carbonates) CO2 calculated (carbonates + carbon)
12
0𝜑
/ 𝜑
Sid. + Liz.Cal. + Liz.Sid. + Bru.Cal. + Bru.
Sid. + Liz.
Cal. + Liz.
Sid. + Bru.
Cal. + Bru.
Mgn. + Goeth.
Mgn. + Liz.
21
21
2
1
0
0.86
0.88
0.90
0.92
0.94
0.96
0.98
1.00
1.02
1.04
1.06
a
c
b
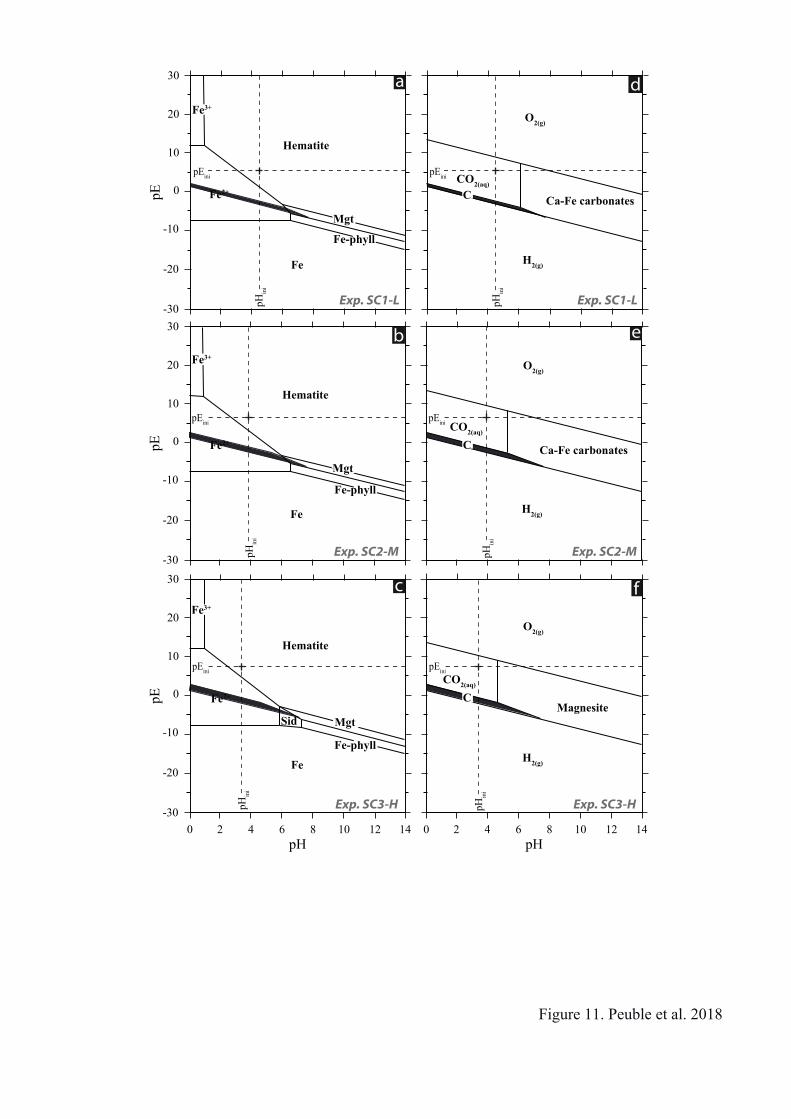
CO2(aq)
CO2(aq)
pEini
pEini
pEini pEini
pEini
pEini
20
10
0
-20
-10
-30
pE
Figure 11. Peuble et al. 2018
30
0 2 4 6 8 10 12 14pH
20
10
0
-20
-10
-30
pE
30
20
10
0
-20
-10
-30
pE
30
O2(g)
H2(g)
Ca-Fe carbonates
0 2 4 6 8 10 12 14pH
CO2(aq)
O2(g)
H2(g)
Magnesite
O2(g)
H2(g)
Ca-Fe carbonates
4
1
pHin
ipH
ini
pHin
i
C
Fe
Fe2+
Hematite
Fe
Fe2+
Hematite
Fe3+
Fe
Fe2+
Sid
Hematite
Fe3+
Fe3+
pHin
i
pHin
i
pHin
i
Mgt
Fe-phyll
Mgt
Fe-phyll
a
b
c
d
e
f
Exp. SC1-L Exp. SC1-L
Exp. SC2-M Exp. SC2-M
Exp. SC3-H Exp. SC3-H
Mgt
Fe-phyll
C
C