Embed Size (px)
Citation preview
Brigham Young University Brigham Young University
BYU ScholarsArchive BYU ScholarsArchive
Theses and Dissertations
2021-07-27
Control of Post-Weld Fracture Toughness in Friction Stir Control of Post-Weld Fracture Toughness in Friction Stir
Processed X-80 HSLA Steel Processed X-80 HSLA Steel
Nolan Tracy Crook Brigham Young University
Follow this and additional works at: https://scholarsarchive.byu.edu/etd
Part of the Engineering Commons
BYU ScholarsArchive Citation BYU ScholarsArchive Citation Crook, Nolan Tracy, "Control of Post-Weld Fracture Toughness in Friction Stir Processed X-80 HSLA Steel" (2021). Theses and Dissertations. 9162. https://scholarsarchive.byu.edu/etd/9162
This Thesis is brought to you for free and open access by BYU ScholarsArchive. It has been accepted for inclusion in Theses and Dissertations by an authorized administrator of BYU ScholarsArchive. For more information, please contact [email protected].
Control of Post-Weld Fracture Toughness in
Friction Stir Processed X-80 HSLA Steel
Nolan Tracy Crook
A thesis submitted to the faculty of Brigham Young University
in partial fulfillment of the requirements for the degree of
Master of Science
Tracy Nelson, Chair Carl Sorensen Michael Miles
Department of Mechanical Engineering
Brigham Young University
Copyright © 2021 Nolan Tracy Crook
All Rights Reserved
ABSTRACT
Control of Post-Weld Fracture Toughness in Friction Stir Processed X-80 HSLA Steel
Nolan Tracy Crook
Department of Mechanical Engineering, BYU Master of Science
The present study investigates the fracture toughness of FSW X-80 HSLA steel welds.
Weld cooling rate and peak temperature were varied among welds; indirectly manipulated through FSW travel speed, rpm, and weld preheat. Fracture toughness was tested according to ASTM 1820 standard along the weld centerline using surface-notched SEB specimen cooled to -40 °C. This study resulted in a reliable, repeatable process for generating friction stir welds with CTOD’s consistently above that of the original base metal. CTOD and microstructure of friction stir welds can be selected by controlling weld cooling rate and peak temperature. Material properties and microstructure similar to the original base metal can be recreated throughout the weld stir zone. CTOD of FSW X80 has a strong inverse linear correlation with post-weld cooling rate.
Keywords: API X80, friction stir welding, CTOD, fracture toughness, heat input, cooling rate
ACKNOWLEDGEMENTS
I would like to thank my committee for their patience and support. Most especially, I am
indebted to Dr. Tracy Nelson for his encouragement, advisement, and patience throughout the
entire process. Also, I appreciate Dr. Steve Gorrell for recommending me for this opportunity.
I would also like to thank Deise Misiuk for her patience and support of this work. In
addition, Dr. Scott Taysom was an indispensable resource in conducting this research.
Funding for this work was provided by the Center for Friction Stir Processing.
iv
TABLE OF CONTENTS
TABLE OF CONTENTS ............................................................................................................... iv
LIST OF TABLES .......................................................................................................................... v
LIST OF FIGURES ....................................................................................................................... vi 1 Introduction ............................................................................................................................. 1
Background of HSLA Steel.............................................................................................. 2 Background of Fusion Welding compared to FSW in Steel ............................................ 3 Background of FSW ......................................................................................................... 4 Background of Fracture Toughness of FSW HSLA Steel ............................................... 5 Background of Thermal Environment as a FSW Process Variable in HSLA steels ........ 7
2 Experimental procedures ....................................................................................................... 10
Material .......................................................................................................................... 10 Welding .......................................................................................................................... 10 Measurement and Testing: ............................................................................................. 13
2.3.1 Fracture Testing: ....................................................................................................... 13
2.3.2 Tensile Testing: ......................................................................................................... 14
2.3.3 Microhardness Testing: ............................................................................................. 15
2.3.4 Microscopy: .............................................................................................................. 15
3 Results and discussion ........................................................................................................... 16
Performed welds and FSW parameter control ............................................................... 16 Fracture Toughness Results ........................................................................................... 16 Relationship between CTOD and CR ............................................................................ 16 Relationship between HI and CTOD: ............................................................................ 20 Relationship between CR and input parameters ............................................................ 22 Relationship between thermal environment and microstructure .................................... 23 Relationship between UTS and CTOD .......................................................................... 25 CTOD Variation ............................................................................................................. 26 FSW Parameter Control ................................................................................................. 27
4 Conclusions ........................................................................................................................... 29
References ..................................................................................................................................... 30
v
LIST OF TABLES
Table 1-1: Comparison of FSW CTOD Study Methodologies ....................................................... 6 Table 2-1: API 5L Chemical Composition ................................................................................... 10 Table 2-2: FSW Parameter Control Methods ............................................................................... 12 Table 3-1: Fracture Toughness Results ......................................................................................... 17 Table 3-2: X80 A3 Temperature Calculations .............................................................................. 19 Table 3-3: Coefficient of Correlation of Input Parameters with CR ............................................ 23 Table 3-4: Comparison of max CTOD variation by study ........................................................... 26 Table 3-5: FSW parameter values ................................................................................................. 28
vi
LIST OF FIGURES
Figure 1-1: CCT Diagram of API X-80 .......................................................................................... 3 Figure 1-2: FSW CTOD Methodologies, (a) Previous Studies (b) Present Study.......................... 8 Figure 2-1: PCBN Tool Drawing .................................................................................................. 11 Figure 2-2: Present Study DOE .................................................................................................... 11 Figure 2-3: SEB Specimen Dimensions ....................................................................................... 13 Figure 3-1: Relationship between CTOD and CR ........................................................................ 18 Figure 3-2: Theoretical Hardness vs Temperature (constant cooling rate) ................................... 19 Figure 3-3: Relationship between CTOD and Heat Input ............................................................ 20 Figure 3-4: CTOD vs HI from raw data reported by (Tribe and Nelson 2015) ............................ 21 Figure 3-5: CR vs Preheat ............................................................................................................. 22 Figure 3-6: Micrographs and Macro Hardness Profiles of Various CR’s .................................... 24 Figure 3-7: Weld Hardness Profiles .............................................................................................. 25 Figure 3-8: UTS vs CTOD ............................................................................................................ 26 Figure 3-9: (a) FSW Parameters for Present Study (b) FSW Parameters from [4] ...................... 27
1
1 INTRODUCTION
High Strength Low Alloy (HSLA) steels have both high fracture toughness and yield
strength; favorable properties for applications such as oil and gas transmission pipelines.
Welding steel is a necessary operation and traditional welding methods such as arc or laser-
beam welding can significantly degrade material properties and introduce residual stress [1].
Reduced fracture toughness in welded HSLA steel can be attributed to microstructural changes
caused by high weld peak temperatures and elevated cooling rates (CR’s).
Friction stir welding (FSW) is a solid-state joining process which presents some
advantages over traditional welding methods. FSW is commonly performed at lower peak
temperatures and CR’s than fusion welding. These key differences, along with wrought
microstructure from localized plastic deformation, make FSW a favorable process for creating
welds with material properties similar to the original base material (BM).
Several studies have investigated crack tip opening displacement (CTOD) of FSW HSLA
steels. These studies focused primarily on the direct relationship between FSW machine input
parameters and weld CTOD including the effect of: RPM on X-65 CTOD [2], base metal alloy
on X-80 CTOD [3], RPM on X-80 CTOD [4], test temperature on X-80 CTOD [5], RPM and
heat input (HI) on X-80 CTOD [6]. These studies have reported varying, and sometimes
opposing conclusions.
2
In contrast to a FSW machine input parameter based approach (see Figure 1-2a), some
researchers have concluded that weld thermal environment is a primary factor in controlling
post-weld microstructure and properties (see Figure 1-2b). Matsushita et al. [7] concluded that
weld thermal cycle influenced material properties more than deformation. Allred [8] reported
that peak temperature and CR were the most influential factors on microstructure as opposed to
strain or strain rate. Nelson and Rose [9] reported the elimination of weld hard zone (HZ)
through manipulation of weld CR.
The purpose of this study is to establish a reliable process for producing high CTOD
friction stir welds in American petroleum institute (API) X-80 steel via indirect control of weld
thermal environment. Thermal environment is manipulated through a combination of FSW
machine parameters and workpiece preheat.
Background of HSLA Steel
API X80 derives its desirable strength and toughness from a refined microstructure
composed of ferrite and lower bainite. The primary strengthening mechanism of X80 is reduced
grain size. Desirable fracture toughness can be attributed to a high fraction of ductile ferrite
micro-grains [10].
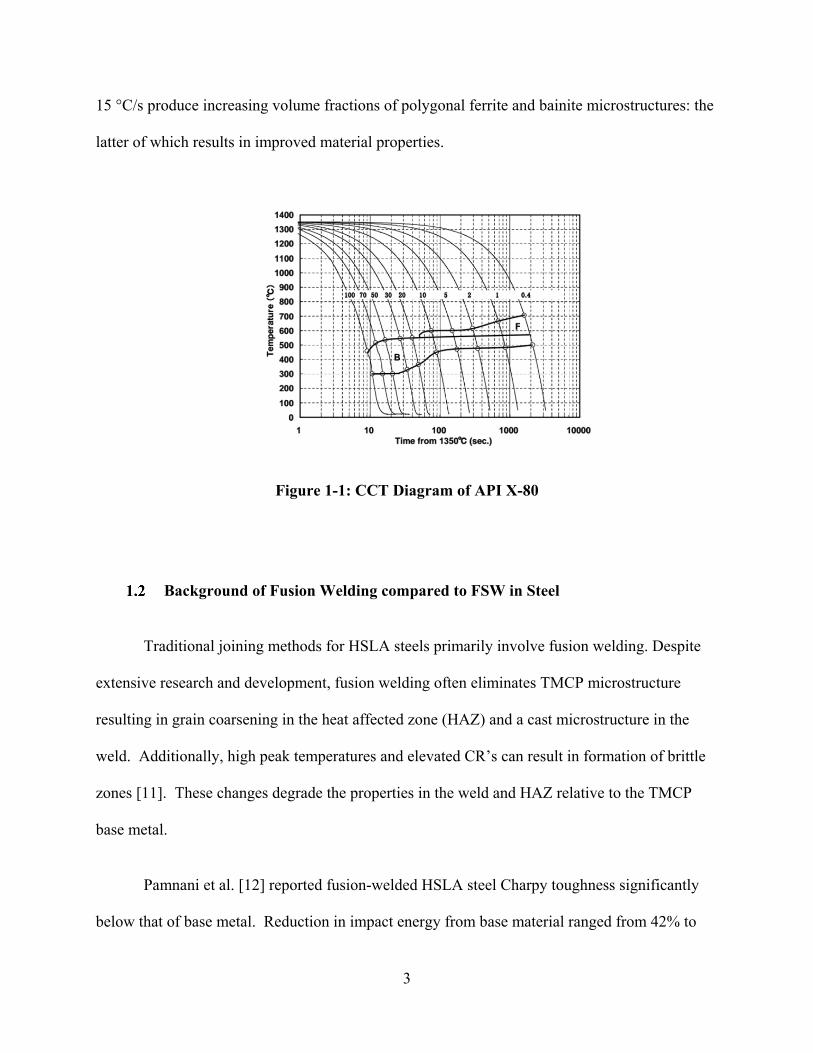
API X-80 is manufactured via thermal mechanical controlled processing (TMCP)
involving repeated rolling at intermediate temperatures followed by controlled cooling. During
TMCP, the base metal microstructure is highly dependent on cooling rate. The resulting
microstructure volume fractions can be determined using a continuous cooling transformation
(CCT) diagram. An example CCT diagram for API X-80 is displayed in Figure 1-1. The
beginning of the ferrite transformation CR is approximately 15 °C/s. CR’s faster than 15 °C/s in
this alloy result in an increased volume fraction of fine bainite, whereas CR’s slower than
3
15 °C/s produce increasing volume fractions of polygonal ferrite and bainite microstructures: the
latter of which results in improved material properties.
Figure 1-1: CCT Diagram of API X-80
Background of Fusion Welding compared to FSW in Steel
Traditional joining methods for HSLA steels primarily involve fusion welding. Despite
extensive research and development, fusion welding often eliminates TMCP microstructure
resulting in grain coarsening in the heat affected zone (HAZ) and a cast microstructure in the
weld. Additionally, high peak temperatures and elevated CR’s can result in formation of brittle
zones [11]. These changes degrade the properties in the weld and HAZ relative to the TMCP
base metal.
Pamnani et al. [12] reported fusion-welded HSLA steel Charpy toughness significantly
below that of base metal. Reduction in impact energy from base material ranged from 42% to
4
57% for A-GTAW and SMAW welds, respectively. Decrease in toughness was attributed to
grain coarsening and weld inclusions.
Yang et al. [13] found similar results in fusion welded HSLA X-80. Fracture toughness
decreased 28-40% in the weld. The authors attributed fracture toughness degradation to grain
coarsening and presence of Widmanstatten ferrite.
Several studies have directly compared fusion welding to FSW. Konkol and Mruczek
[14] reported a 316% increase in weld material toughness for FSW as compared to submerged
arc welding in HSLA X-65. The authors attributed this increase in toughness to refined grains in
the FSW stir zone.
Kumar et al. [1] evaluated fusion welds and FSW on mild steel and reported that FSW
joints have more favorable post-weld properties. The FSW joints exhibited a 46% average
increase in elongation and 7% average increase in yield strength compared to fusion welds. The
authors attributed the increase in elongation and yield to the fine grain wrought microstructure
from FSW.
Background of FSW
FSW employs a rotating, non-consumable tool to join a workpiece through a combination
of friction and high forging forces. This process yields advantages over traditional welding
methods as a result of grain refinement, lower peak temperatures, and reduced CR’s. Grain
refinement is caused by dynamic recrystallization resulting from severe plastic deformation at
elevated temperatures [15].
5
Background of Fracture Toughness of FSW HSLA Steel
FSW has shown promise in generating high CTOD welds in HSLA steels [4]. Some
studies have explored correlations between FSW input parameters and weld CTOD, see Table
1-1. However, causal relationships remain unclear, likely a result of varying methodologies and
high intra-weld CTOD scatter. CTOD scatter creates difficulty in determining relationships
between FSW inputs and material properties.
Fairchild et al. [3] investigated CTOD as a function of FSW tool chemistry and base
metal composition in double-sided welds. Tool material had no impact on CTOD, whereas the
alloy composition produced a significant effect. All FSW CTOD values were below BM values.
Some reported fracture toughness levels from [3] exhibited variation as high as 0.46 mm
within the same weld, despite identical CTOD notch location. This variation may have been the
result of through-thickness notching, where several microstructure zones were sampled from the
root to the surface of the weld. CTOD scatter may be reduced by employing surface-notching in
place of through-thickness notching [16]. Surface-notched samples target a specific
microstructure zone within a weld rather than the entire weld (see Figure 2-3).
Santos et al. [4] reported an inverse relationship between CTOD and RPM in double-
sided FSW API X-80. Low RPM welds yielded CTOD values above offshore standard (DNV-
OS-F101) requirements. The effect of RPM on CTOD was indistinguishable from the effect of
HI. CTOD and HI were found to be inversely related. It should be noted that the same travel
speed was used in all welds. The authors attributed the high toughness of the low RPM welds to
reduced HI.
6
Intra-weld CTOD variance in [4] was also significant. This study reported a range
variance of 0.38 mm and 0.32 mm for the low and medium RPM welds, respectively. It is
unknown if the variance was due to crack front location as the notch position was not reported.
This study employed through-thickness notching.
Avila et al. [5] reported intra-weld CTOD variance of up to 0.54 mm. The authors
attributed CTOD scatter to microstructure heterogeneity. This study employed through-
thickness notching.
Tribe and Nelson [6] investigated the effect of RPM, travels speed and HI on CTOD in
double-sided FSW API X-80. This study reported that fracture toughness correlated inversely
with both RPM and HI. Many CTOD values were above DNV-OS-F101 standard.
Variability in FSW CTOD results in this study were 8x greater than BM samples.
Several welds exhibited total fracture toughness variance greater than 0.3 mm. The authors
attributed this to sampling heterogenous microstructures. This study employed through-
thickness notching.
Table 1-1: Comparison of FSW CTOD Study Methodologies
Study Variables Weld Type
HSLA Grade
CTOD Sample
Crack Orientation
Test Temp
Horschel [2] RPM Double-sided
X-65 CT Through-thickness
Ambient
Kumar et al. [17]
Tool, alloy, test temp
Double-sided
X-65 to X-120
SEB (Bx2B) Through-thickness
-60 °C to Ambient
Santos et al. [4]
RPM Double-sided
X-80 SEB (Bx2B) Through-thickness
Ambient
Avila et al. [5] Test temp Double-sided
X-80 SEB (Bx2B) Through-thickness
-40 to 25 °C
Tribe and Nelson [6]
HI, RPM Double-sided
X-80 CT Through-thickness
Ambient
7
Background of Thermal Environment as a FSW Process Variable in HSLA steels
Prior FSW CTOD studies have attempted to find direct correlations between FSW input
parameters and material properties. This process is outlined in Figure 1-2a. FSW input
parameters include power, travel speed, heat input, rpm, axial force, and thermal boundary
conditions. As discussed previously, this methodology has produced varied and sometimes
opposing conclusions.
Conflicting conclusions may be the result of not capturing interactions between FSW
parameters and thermal environment such as CR and peak temperature. It is well understood that
CR and peak temperature are defining parameters in HSLA steel microstructure formation.
However, many combinations of FSW parameters can produce identical thermal environments.
Nelson and Rose [9] reported identical CR’s generated by different FSW process
parameters. Several welds in this study had CR’s of 16 ± 1 °C/s and HI’s ranging from 1378
J/mm to 2953 J/mm. Microstructures in these welds had similar hardness levels and grain
morphology despite the 114% increase in HI. The approach outlined in Figure 1-2a would have
been insufficient in explaining the similarity in microstructure between the welds. Therefore, a
more effective approach to controlling FSW CTOD would be to decouple the FSW process from
the material response. This methodology is outlined in Figure 1-2b.
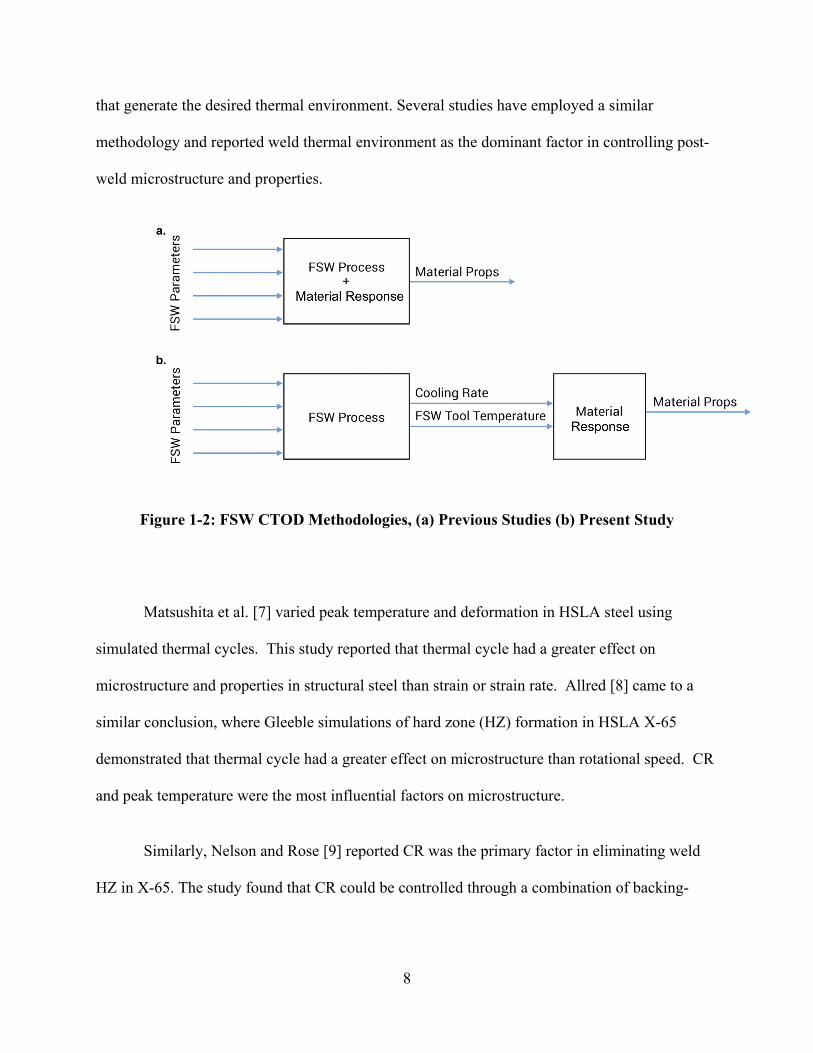
Using Figure 1-2b, two separate models are constructed. The first model relates the FSW
input parameters to the resulting thermal environment, defined by CR and tool temperature. The
second model relates the resulting thermal environment to material properties. This approach
allows a manufacturer to select FSW parameters within the feasible material process window
8
that generate the desired thermal environment. Several studies have employed a similar
methodology and reported weld thermal environment as the dominant factor in controlling post-
weld microstructure and properties.
Figure 1-2: FSW CTOD Methodologies, (a) Previous Studies (b) Present Study
Matsushita et al. [7] varied peak temperature and deformation in HSLA steel using
simulated thermal cycles. This study reported that thermal cycle had a greater effect on
microstructure and properties in structural steel than strain or strain rate. Allred [8] came to a
similar conclusion, where Gleeble simulations of hard zone (HZ) formation in HSLA X-65
demonstrated that thermal cycle had a greater effect on microstructure than rotational speed. CR
and peak temperature were the most influential factors on microstructure.
Similarly, Nelson and Rose [9] reported CR was the primary factor in eliminating weld
HZ in X-65. The study found that CR could be controlled through a combination of backing-
9
plate material and heat input (HI). HI is defined as the ratio of power to travel speed (see
Equation 1-1).
𝐻𝐻𝐻𝐻 = 𝑃𝑃𝑃𝑃𝑃𝑃𝑃𝑃𝑃𝑃/𝑇𝑇𝑇𝑇 (1-1)
[9] found that even with identical HI levels, different weld CR’s could be produced by
altering the thermal conductivity of the backing plate material. Stringham et al. [18] also
reported backing plate thermal conductivity as a factor in predicting weld cooling rate.
The purpose of the present study is to develop methodologies for controlling FSW HSLA
X-80 CTOD using weld thermal environment. This will be accomplished by control of the weld
thermal environment via FSW input parameters and a temperature-controlled anvil.
10
2 EXPERIMENTAL PROCEDURES
Material
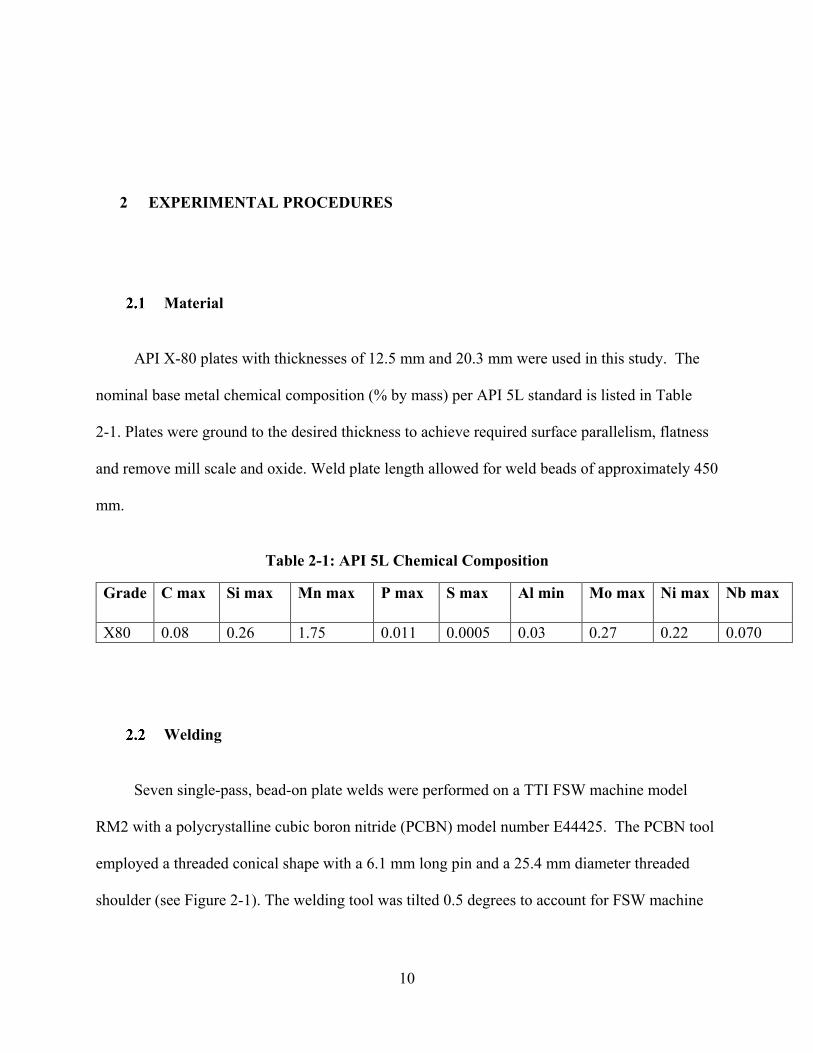
API X-80 plates with thicknesses of 12.5 mm and 20.3 mm were used in this study. The
nominal base metal chemical composition (% by mass) per API 5L standard is listed in Table
2-1. Plates were ground to the desired thickness to achieve required surface parallelism, flatness
and remove mill scale and oxide. Weld plate length allowed for weld beads of approximately 450
mm.
Table 2-1: API 5L Chemical Composition
Grade C max Si max Mn max P max S max Al min Mo max Ni max Nb max
X80 0.08 0.26 1.75 0.011 0.0005 0.03 0.27 0.22 0.070
Welding
Seven single-pass, bead-on plate welds were performed on a TTI FSW machine model
RM2 with a polycrystalline cubic boron nitride (PCBN) model number E44425. The PCBN tool
employed a threaded conical shape with a 6.1 mm long pin and a 25.4 mm diameter threaded
shoulder (see Figure 2-1). The welding tool was tilted 0.5 degrees to account for FSW machine
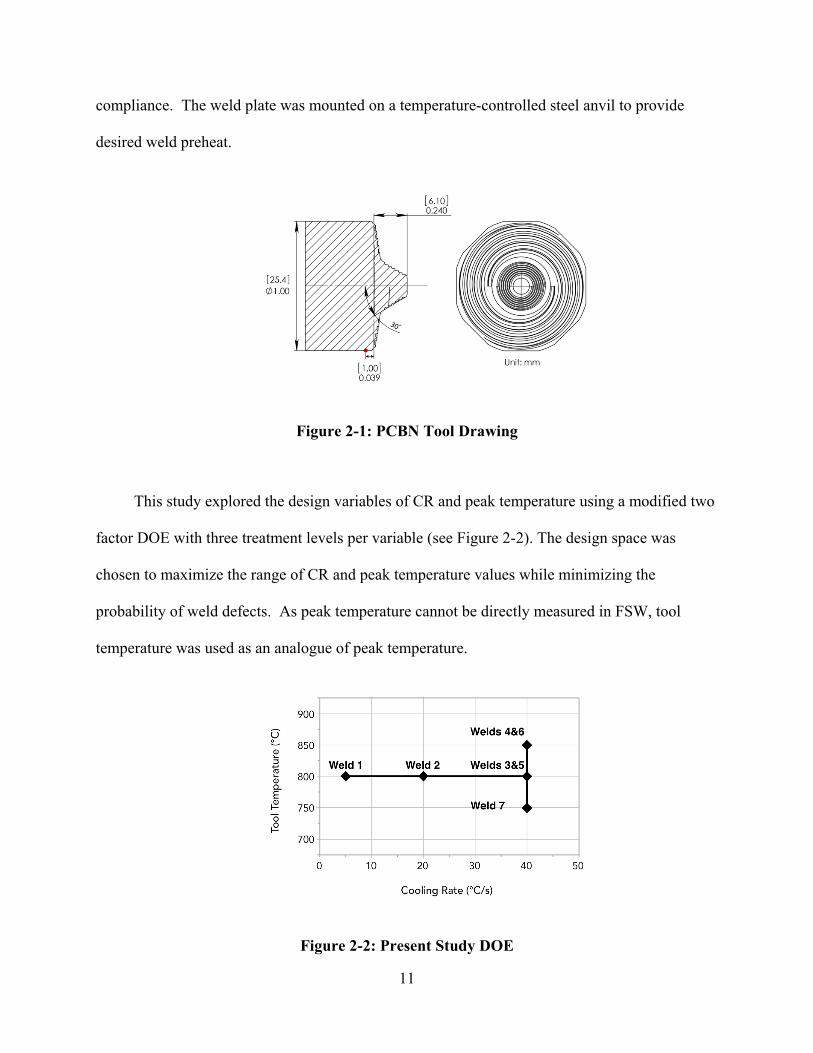
11
compliance. The weld plate was mounted on a temperature-controlled steel anvil to provide
desired weld preheat.
Figure 2-1: PCBN Tool Drawing
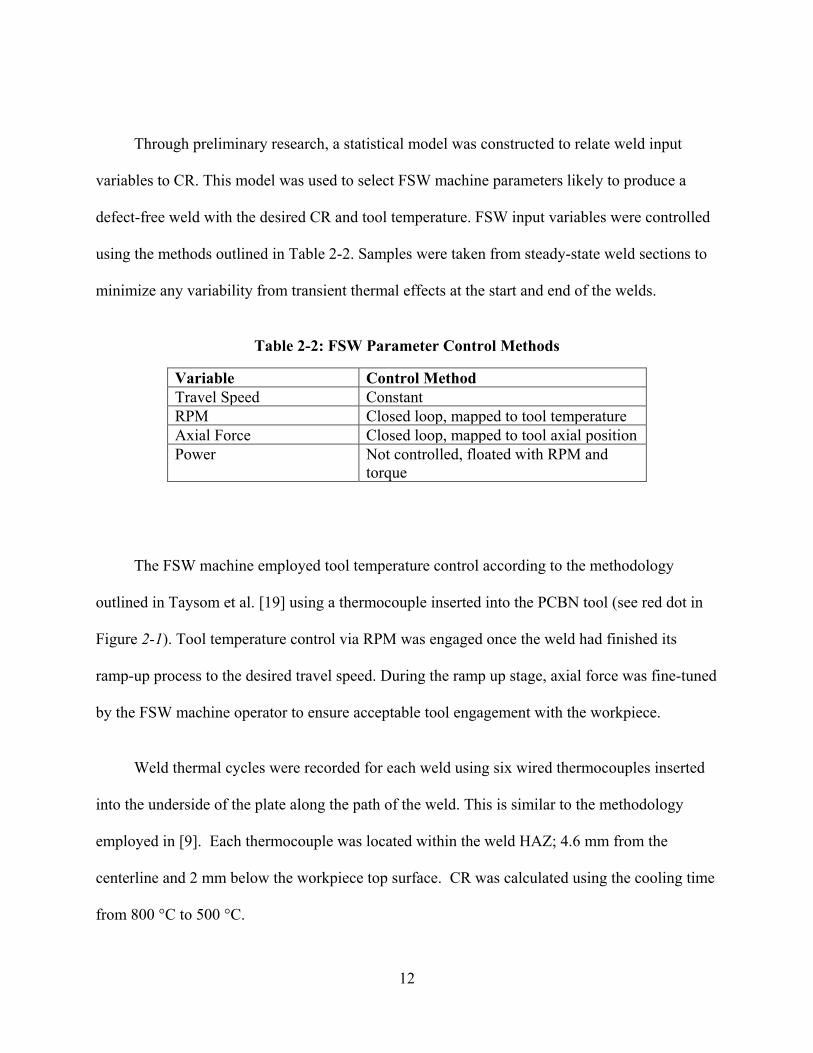
This study explored the design variables of CR and peak temperature using a modified two
factor DOE with three treatment levels per variable (see Figure 2-2). The design space was
chosen to maximize the range of CR and peak temperature values while minimizing the
probability of weld defects. As peak temperature cannot be directly measured in FSW, tool
temperature was used as an analogue of peak temperature.
Figure 2-2: Present Study DOE
12
Through preliminary research, a statistical model was constructed to relate weld input
variables to CR. This model was used to select FSW machine parameters likely to produce a
defect-free weld with the desired CR and tool temperature. FSW input variables were controlled
using the methods outlined in Table 2-2. Samples were taken from steady-state weld sections to
minimize any variability from transient thermal effects at the start and end of the welds.
Table 2-2: FSW Parameter Control Methods
Variable Control Method Travel Speed Constant RPM Closed loop, mapped to tool temperature Axial Force Closed loop, mapped to tool axial position Power Not controlled, floated with RPM and
torque
The FSW machine employed tool temperature control according to the methodology
outlined in Taysom et al. [19] using a thermocouple inserted into the PCBN tool (see red dot in
Figure 2-1). Tool temperature control via RPM was engaged once the weld had finished its
ramp-up process to the desired travel speed. During the ramp up stage, axial force was fine-tuned
by the FSW machine operator to ensure acceptable tool engagement with the workpiece.
Weld thermal cycles were recorded for each weld using six wired thermocouples inserted
into the underside of the plate along the path of the weld. This is similar to the methodology
employed in [9]. Each thermocouple was located within the weld HAZ; 4.6 mm from the
centerline and 2 mm below the workpiece top surface. CR was calculated using the cooling time
from 800 °C to 500 °C.
13
Two of six total welds were performed at preheat temperatures from 20 °C to 300 °C. The
FSW workpieces were heated until reaching the desired temperature prior to initiating the weld.
The anvil heater was turned off once the weld had completed and the embedded workpiece
thermocouples had dropped below 500 °C.
Measurement and Testing:
2.3.1 Fracture Testing:
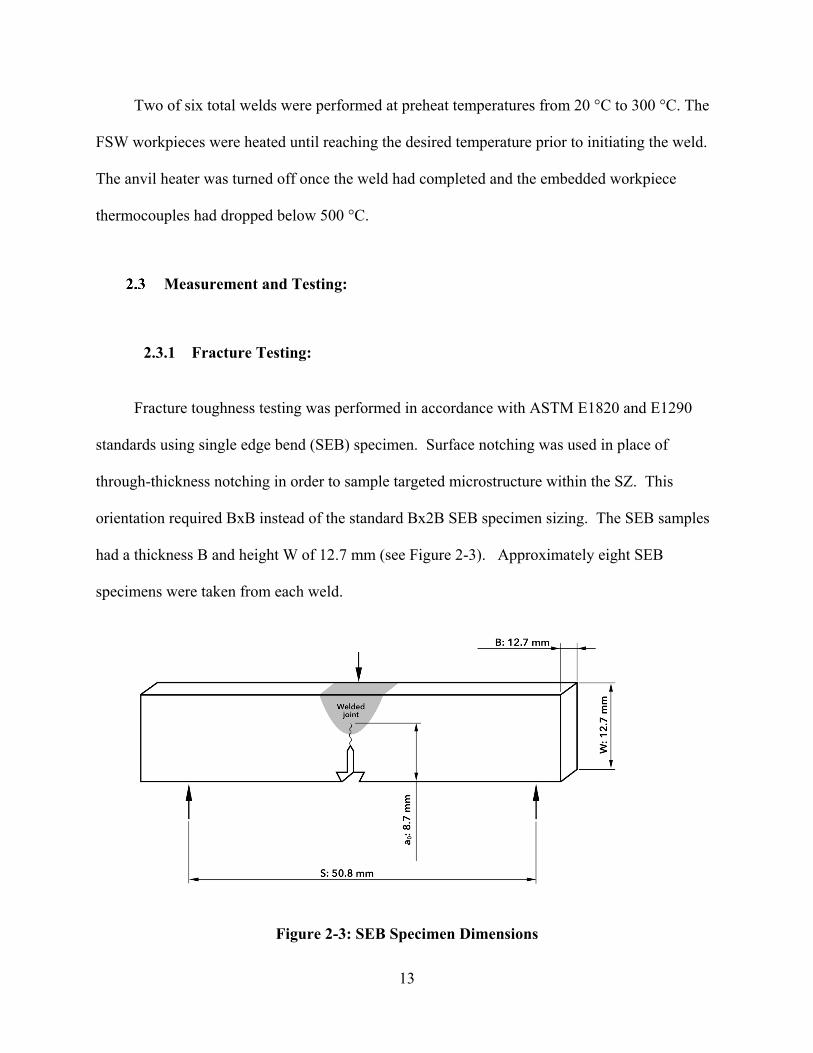
Fracture toughness testing was performed in accordance with ASTM E1820 and E1290
standards using single edge bend (SEB) specimen. Surface notching was used in place of
through-thickness notching in order to sample targeted microstructure within the SZ. This
orientation required BxB instead of the standard Bx2B SEB specimen sizing. The SEB samples
had a thickness B and height W of 12.7 mm (see Figure 2-3). Approximately eight SEB
specimens were taken from each weld.
Figure 2-3: SEB Specimen Dimensions
14
Pre-cracking was carried out at room temperature employing a frequency of 20 Hz and
load ratio of 0.1. A linearly decreasing stress intensity factor was used with a beginning value of
18 Mpa√𝑚𝑚 and ending of 12 Mpa√𝑚𝑚. The final crack length ratio 𝑎𝑎0/𝑊𝑊 was 0.65. All
precracks were positioned at the centerline of the weld in the SZ, with the crack front
approximately 4 mm from the top surface of the weld. Side grooving with a total depth of 0.20B
was applied after pre-cracking.
Fracture testing was performed using the basic procedure outlined in section 8 of the
ASTM E1820 standard [16]. Samples were cooled to -40 °C using a cooled ethanol bath prior to
testing. After testing the samples were heat tinted at 300 °C for 1 hour then cooled to -197 °C
and immediately broken open for crack extension measurement.
Calculation of CTOD was accomplished using the normalization data reduction technique
from section A15 of the ASTM E1820 standard [16]. The authors employed the automated J-R
curve analysis software developed by Chen et al. [20] which is based on the normalization
method. All samples met required crack front straightness as defined in ASTM E1820 8.5.4. All
specimens excluding samples 29 and 39 met the physical crack extension requirement outlined in
ASTM E1820 A15.2.1 [16].
2.3.2 Tensile Testing:
Tensile testing was carried out in accordance with ASTM E8 standard at room
temperature. Samples were oriented perpendicular to the welding direction.
15
2.3.3 Microhardness Testing:
Microhardness testing was performed on two samples from each weld using an automated
hardness tester. Hardness testing indentations were spaced 0.5 x 0.5 mm apart with a load of 200
grams and a dwell time of 13 seconds.
2.3.4 Microscopy:
Optical microscopy was performed on two samples from each weld to characterize weld
microstructure. Samples were polished to 1 um finish and etched with 5% nital solution for
approximately 15 seconds.
16
3 RESULTS AND DISCUSSION
Performed Welds and FSW Parameter Control
Sound welds were created in six out of seven of the weld parameter combinations
investigated. The defect in weld seven was caused by poor weld consolidation due to the
combination of the low tool temperature and high travel speed. Testing was not performed on
this weld.
Fracture Toughness Results
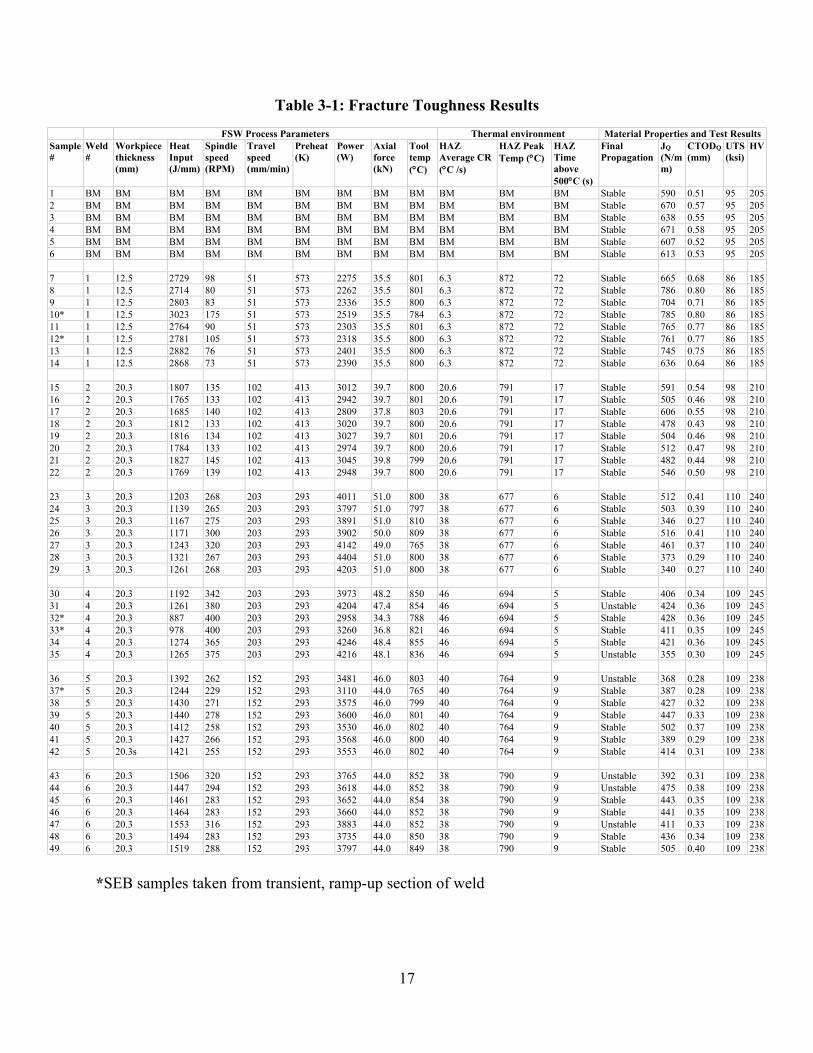
All fracture results and corresponding weld conditions are shown in Table 3-1. The
fracture toughness data reported are geometry dependent JQ as tested samples did not meet
ASTM E1820 geometry independent requirements. CTOD comparison between samples is valid
as all samples have the same geometry.
Relationship between CTOD and CR
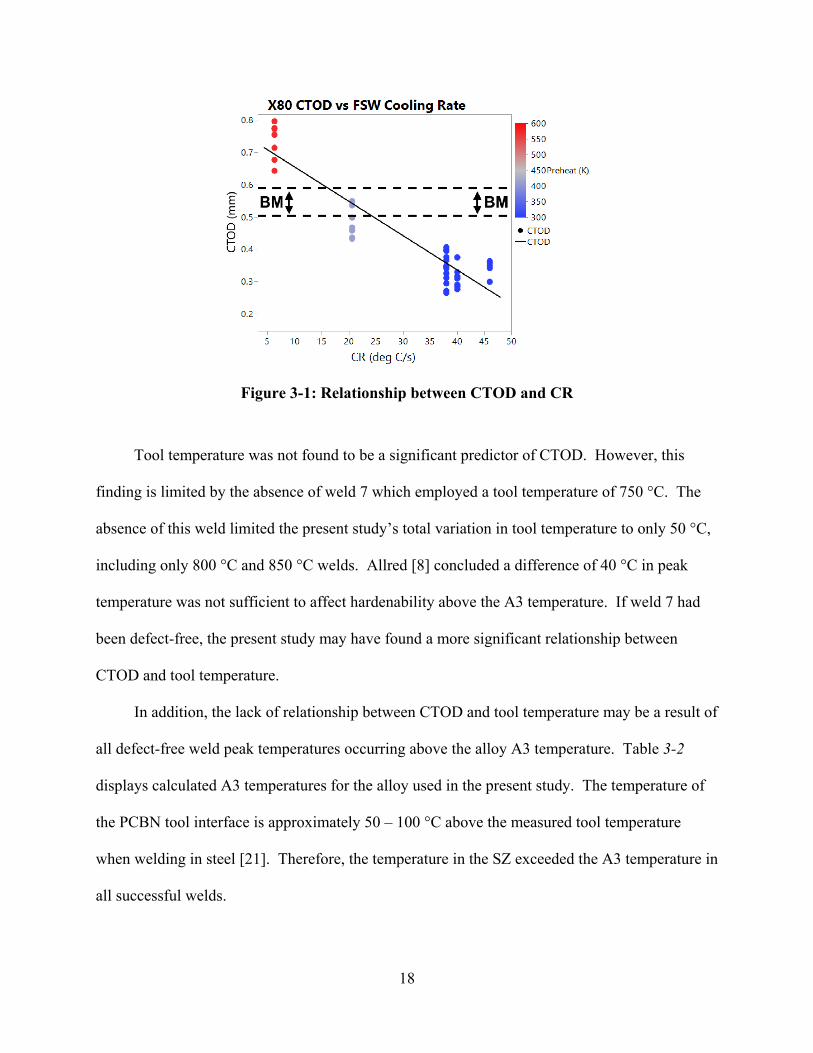
The fracture toughness is plotted against CR for each CTOD sample in Table 3-1 in Figure
3-1. CTOD decreases linearly with increasing CR and has a coefficient of determination of 0.85
using a linear fit. These results demonstrate that CTOD of FSW HSLA steel can be controlled
through manipulation of weld CR. Additionally, weld fracture toughness values at or above BM
can be achieved.
17
Table 3-1: Fracture Toughness Results
FSW Process Parameters Thermal environment Material Properties and Test Results Sample #
Weld #
Workpiece thickness (mm)
Heat Input (J/mm)
Spindle speed (RPM)
Travel speed (mm/min)
Preheat (K)
Power (W)
Axial force (kN)
Tool temp (°C)
HAZ Average CR (°C /s)
HAZ Peak Temp (°C)
HAZ Time above 500°C (s)
Final Propagation
JQ (N/mm)
CTODQ (mm)
UTS (ksi)
HV
1 BM BM BM BM BM BM BM BM BM BM BM BM Stable 590 0.51 95 205 2 BM BM BM BM BM BM BM BM BM BM BM BM Stable 670 0.57 95 205 3 BM BM BM BM BM BM BM BM BM BM BM BM Stable 638 0.55 95 205 4 BM BM BM BM BM BM BM BM BM BM BM BM Stable 671 0.58 95 205 5 BM BM BM BM BM BM BM BM BM BM BM BM Stable 607 0.52 95 205 6 BM BM BM BM BM BM BM BM BM BM BM BM Stable 613 0.53 95 205 7 1 12.5 2729 98 51 573 2275 35.5 801 6.3 872 72 Stable 665 0.68 86 185 8 1 12.5 2714 80 51 573 2262 35.5 801 6.3 872 72 Stable 786 0.80 86 185 9 1 12.5 2803 83 51 573 2336 35.5 800 6.3 872 72 Stable 704 0.71 86 185 10* 1 12.5 3023 175 51 573 2519 35.5 784 6.3 872 72 Stable 785 0.80 86 185 11 1 12.5 2764 90 51 573 2303 35.5 801 6.3 872 72 Stable 765 0.77 86 185 12* 1 12.5 2781 105 51 573 2318 35.5 800 6.3 872 72 Stable 761 0.77 86 185 13 1 12.5 2882 76 51 573 2401 35.5 800 6.3 872 72 Stable 745 0.75 86 185 14 1 12.5 2868 73 51 573 2390 35.5 800 6.3 872 72 Stable 636 0.64 86 185
15 2 20.3 1807 135 102 413 3012 39.7 800 20.6 791 17 Stable 591 0.54 98 210 16 2 20.3 1765 133 102 413 2942 39.7 801 20.6 791 17 Stable 505 0.46 98 210 17 2 20.3 1685 140 102 413 2809 37.8 803 20.6 791 17 Stable 606 0.55 98 210 18 2 20.3 1812 133 102 413 3020 39.7 800 20.6 791 17 Stable 478 0.43 98 210 19 2 20.3 1816 134 102 413 3027 39.7 801 20.6 791 17 Stable 504 0.46 98 210 20 2 20.3 1784 133 102 413 2974 39.7 800 20.6 791 17 Stable 512 0.47 98 210 21 2 20.3 1827 145 102 413 3045 39.8 799 20.6 791 17 Stable 482 0.44 98 210 22 2 20.3 1769 139 102 413 2948 39.7 800 20.6 791 17 Stable 546 0.50 98 210
23 3 20.3 1203 268 203 293 4011 51.0 800 38 677 6 Stable 512 0.41 110 240 24 3 20.3 1139 265 203 293 3797 51.0 797 38 677 6 Stable 503 0.39 110 240 25 3 20.3 1167 275 203 293 3891 51.0 810 38 677 6 Stable 346 0.27 110 240 26 3 20.3 1171 300 203 293 3902 50.0 809 38 677 6 Stable 516 0.41 110 240 27 3 20.3 1243 320 203 293 4142 49.0 765 38 677 6 Stable 461 0.37 110 240 28 3 20.3 1321 267 203 293 4404 51.0 800 38 677 6 Stable 373 0.29 110 240 29 3 20.3 1261 268 203 293 4203 51.0 800 38 677 6 Stable 340 0.27 110 240
30 4 20.3 1192 342 203 293 3973 48.2 850 46 694 5 Stable 406 0.34 109 245 31 4 20.3 1261 380 203 293 4204 47.4 854 46 694 5 Unstable 424 0.36 109 245 32* 4 20.3 887 400 203 293 2958 34.3 788 46 694 5 Stable 428 0.36 109 245 33* 4 20.3 978 400 203 293 3260 36.8 821 46 694 5 Stable 411 0.35 109 245 34 4 20.3 1274 365 203 293 4246 48.4 855 46 694 5 Stable 421 0.36 109 245 35 4 20.3 1265 375 203 293 4216 48.1 836 46 694 5 Unstable 355 0.30 109 245
36 5 20.3 1392 262 152 293 3481 46.0 803 40 764 9 Unstable 368 0.28 109 238 37* 5 20.3 1244 229 152 293 3110 44.0 765 40 764 9 Stable 387 0.28 109 238 38 5 20.3 1430 271 152 293 3575 46.0 799 40 764 9 Stable 427 0.32 109 238 39 5 20.3 1440 278 152 293 3600 46.0 801 40 764 9 Stable 447 0.33 109 238 40 5 20.3 1412 258 152 293 3530 46.0 802 40 764 9 Stable 502 0.37 109 238 41 5 20.3 1427 266 152 293 3568 46.0 800 40 764 9 Stable 389 0.29 109 238 42 5 20.3s 1421 255 152 293 3553 46.0 802 40 764 9 Stable 414 0.31 109 238
43 6 20.3 1506 320 152 293 3765 44.0 852 38 790 9 Unstable 392 0.31 109 238 44 6 20.3 1447 294 152 293 3618 44.0 852 38 790 9 Unstable 475 0.38 109 238 45 6 20.3 1461 283 152 293 3652 44.0 854 38 790 9 Stable 443 0.35 109 238 46 6 20.3 1464 283 152 293 3660 44.0 852 38 790 9 Stable 441 0.35 109 238 47 6 20.3 1553 316 152 293 3883 44.0 852 38 790 9 Unstable 411 0.33 109 238 48 6 20.3 1494 283 152 293 3735 44.0 850 38 790 9 Stable 436 0.34 109 238 49 6 20.3 1519 288 152 293 3797 44.0 849 38 790 9 Stable 505 0.40 109 238
*SEB samples taken from transient, ramp-up section of weld
18
Figure 3-1: Relationship between CTOD and CR
Tool temperature was not found to be a significant predictor of CTOD. However, this
finding is limited by the absence of weld 7 which employed a tool temperature of 750 °C. The
absence of this weld limited the present study’s total variation in tool temperature to only 50 °C,
including only 800 °C and 850 °C welds. Allred [8] concluded a difference of 40 °C in peak
temperature was not sufficient to affect hardenability above the A3 temperature. If weld 7 had
been defect-free, the present study may have found a more significant relationship between
CTOD and tool temperature.
In addition, the lack of relationship between CTOD and tool temperature may be a result of
all defect-free weld peak temperatures occurring above the alloy A3 temperature. Table 3-2
displays calculated A3 temperatures for the alloy used in the present study. The temperature of
the PCBN tool interface is approximately 50 – 100 °C above the measured tool temperature
when welding in steel [21]. Therefore, the temperature in the SZ exceeded the A3 temperature in
all successful welds.
19
Table 3-2: X80 A3 Temperature Calculations
Calculation Method Used Calculated A3 (°C)
Kasatkin et al. [22] 860
Andrews [23] 794
Brandis [24] 869
Considering the A3 temperature was exceeded in the SZ, all base material transformed to
austenite. According to Gleeble tests by [8], CR in HSLA X65 has a 270% greater influence on
hardenability than peak temperature when cooling from above the A3 temperature. The large
influence of CR compared to peak temperature, when cooling from above the A3, masked the
effect of peak temperature on the weld microstructure.
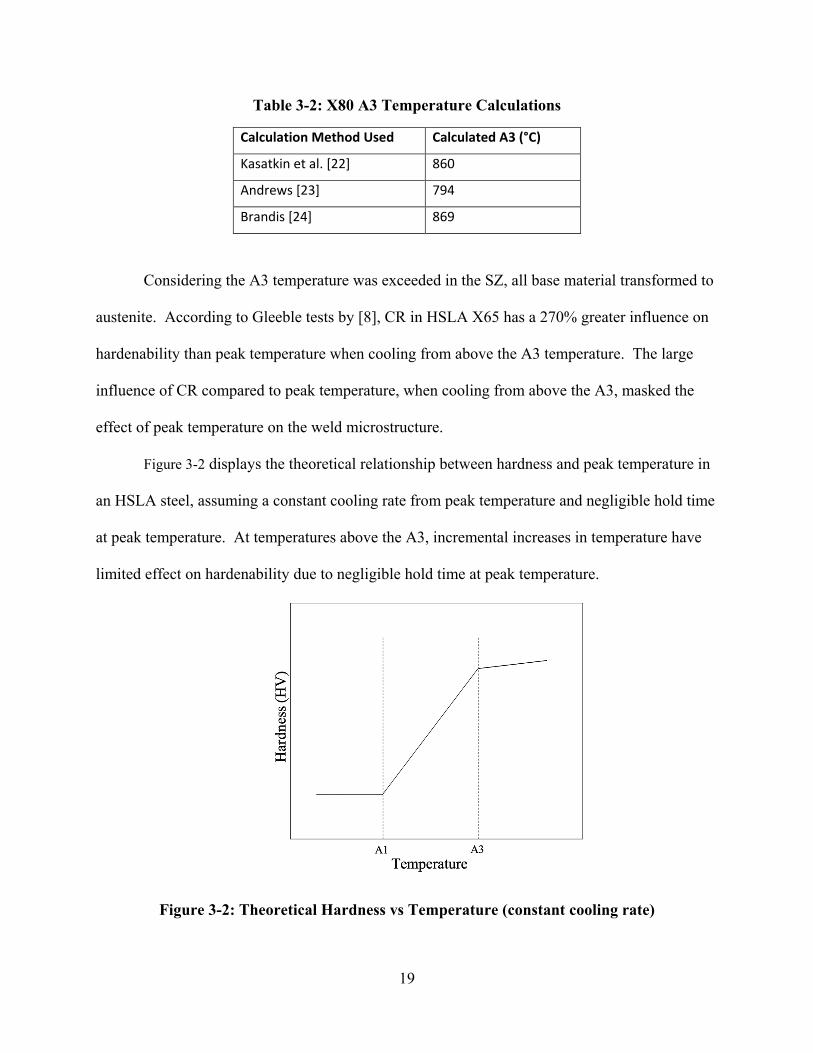
Figure 3-2 displays the theoretical relationship between hardness and peak temperature in
an HSLA steel, assuming a constant cooling rate from peak temperature and negligible hold time
at peak temperature. At temperatures above the A3, incremental increases in temperature have
limited effect on hardenability due to negligible hold time at peak temperature.
Figure 3-2: Theoretical Hardness vs Temperature (constant cooling rate)
20
Within the intercritical zone between the A1 and A3 temperature in Figure 3-2, the peak
temperature has an increased effect on hardenability. In this region, the material is partially
austenitized. The relationship between hardness and temperature is linear, as the ratio of
austenitized material correlates directly to the peak temperature. Therefore, peak temperature
has an increased effect on hardenability for welds with a peak temperature within the intercritical
zone, as compared to welds made at temperatures exceeding the A3.
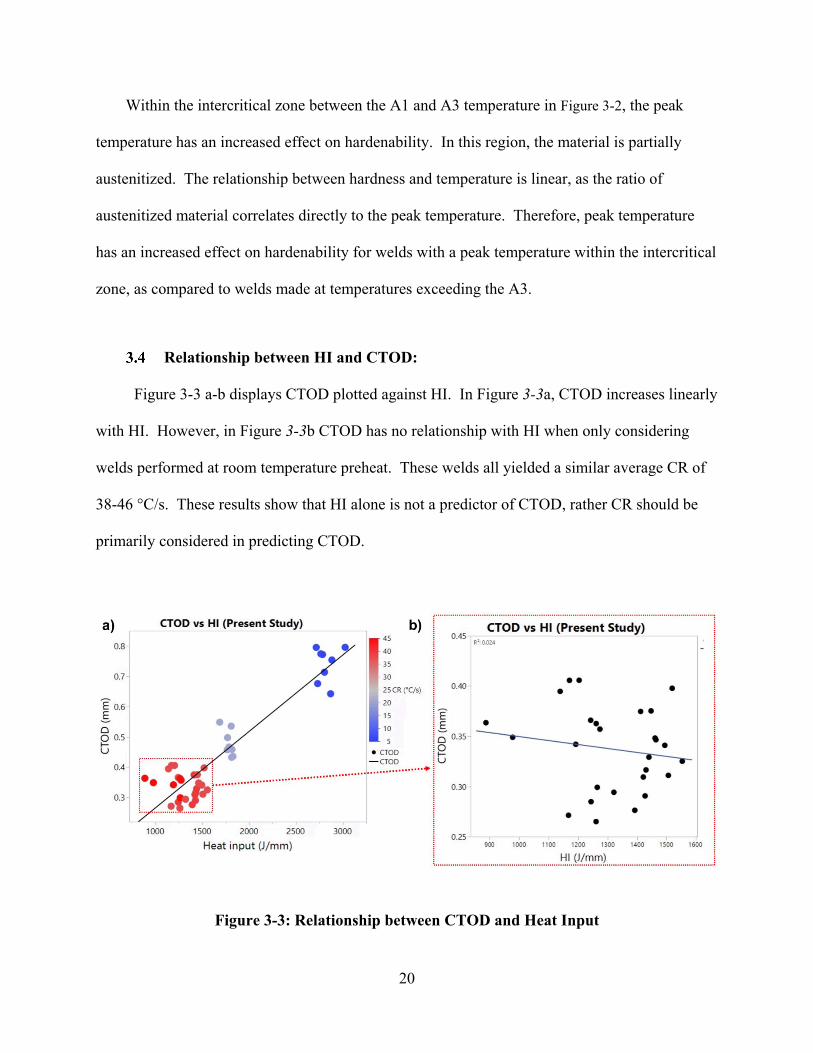
Relationship between HI and CTOD:
Figure 3-3 a-b displays CTOD plotted against HI. In Figure 3-3a, CTOD increases linearly
with HI. However, in Figure 3-3b CTOD has no relationship with HI when only considering
welds performed at room temperature preheat. These welds all yielded a similar average CR of
38-46 °C/s. These results show that HI alone is not a predictor of CTOD, rather CR should be
primarily considered in predicting CTOD.
Figure 3-3: Relationship between CTOD and Heat Input
21
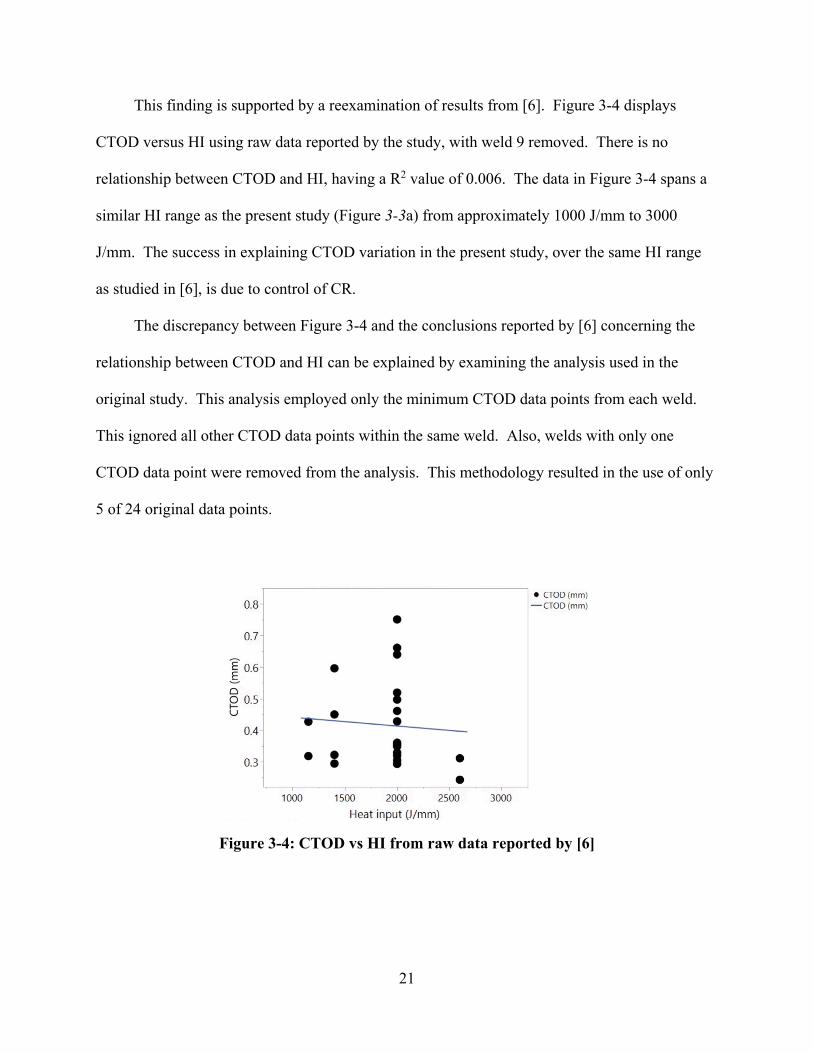
This finding is supported by a reexamination of results from [6]. Figure 3-4 displays
CTOD versus HI using raw data reported by the study, with weld 9 removed. There is no
relationship between CTOD and HI, having a R2 value of 0.006. The data in Figure 3-4 spans a
similar HI range as the present study (Figure 3-3a) from approximately 1000 J/mm to 3000
J/mm. The success in explaining CTOD variation in the present study, over the same HI range
as studied in [6], is due to control of CR.
The discrepancy between Figure 3-4 and the conclusions reported by [6] concerning the
relationship between CTOD and HI can be explained by examining the analysis used in the
original study. This analysis employed only the minimum CTOD data points from each weld.
This ignored all other CTOD data points within the same weld. Also, welds with only one
CTOD data point were removed from the analysis. This methodology resulted in the use of only
5 of 24 original data points.
Figure 3-4: CTOD vs HI from raw data reported by [6]
22
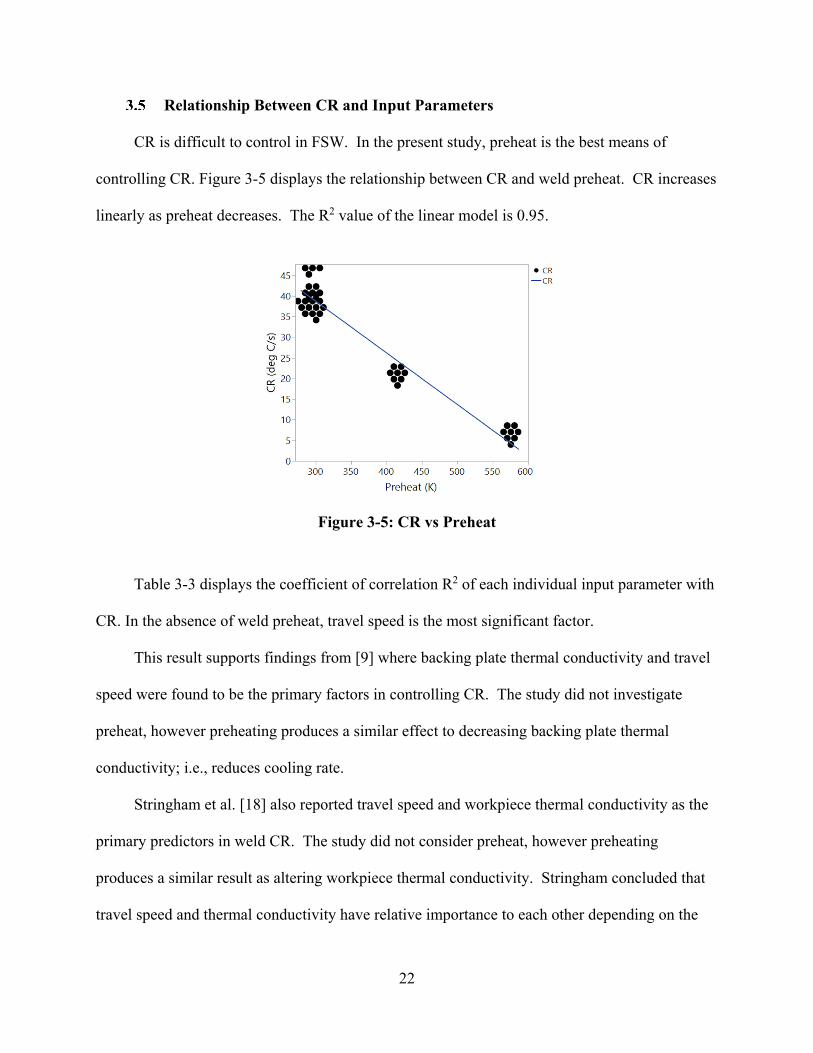
Relationship Between CR and Input Parameters
CR is difficult to control in FSW. In the present study, preheat is the best means of
controlling CR. Figure 3-5 displays the relationship between CR and weld preheat. CR increases
linearly as preheat decreases. The R2 value of the linear model is 0.95.
Figure 3-5: CR vs Preheat
Table 3-3 displays the coefficient of correlation R2 of each individual input parameter with
CR. In the absence of weld preheat, travel speed is the most significant factor.
This result supports findings from [9] where backing plate thermal conductivity and travel
speed were found to be the primary factors in controlling CR. The study did not investigate
preheat, however preheating produces a similar effect to decreasing backing plate thermal
conductivity; i.e., reduces cooling rate.
Stringham et al. [18] also reported travel speed and workpiece thermal conductivity as the
primary predictors in weld CR. The study did not consider preheat, however preheating
produces a similar result as altering workpiece thermal conductivity. Stringham concluded that
travel speed and thermal conductivity have relative importance to each other depending on the
23
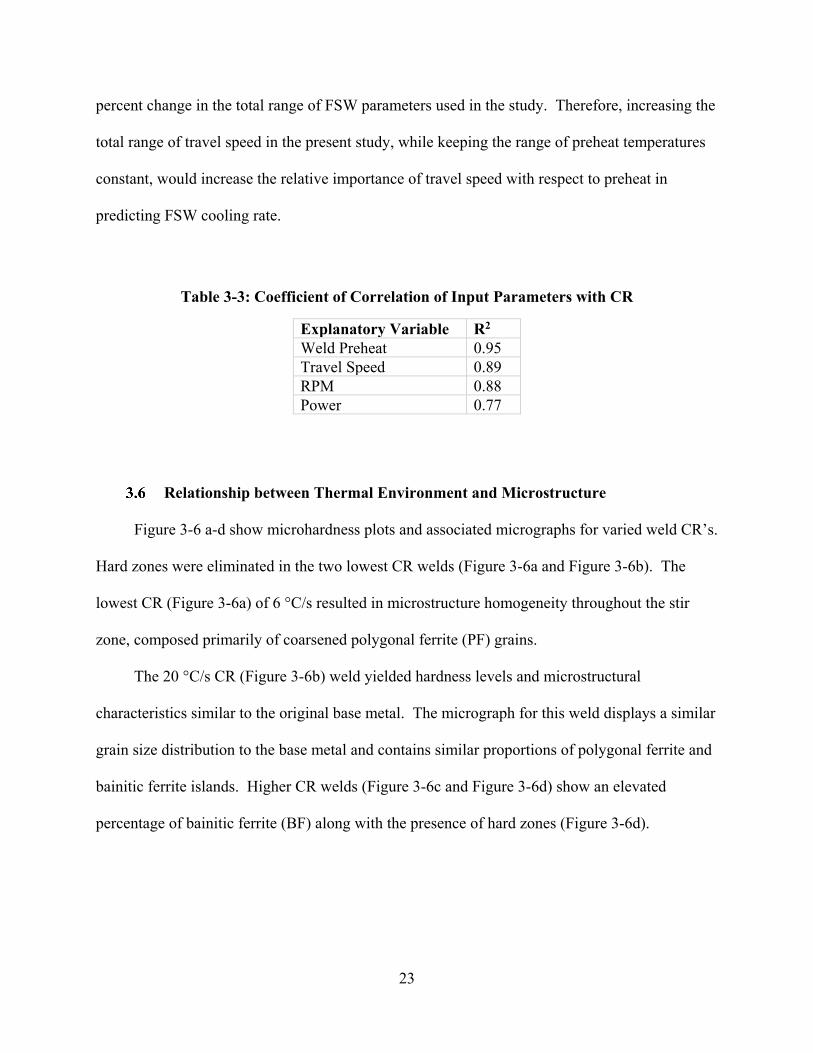
percent change in the total range of FSW parameters used in the study. Therefore, increasing the
total range of travel speed in the present study, while keeping the range of preheat temperatures
constant, would increase the relative importance of travel speed with respect to preheat in
predicting FSW cooling rate.
Table 3-3: Coefficient of Correlation of Input Parameters with CR
Explanatory Variable R2 Weld Preheat 0.95 Travel Speed 0.89 RPM 0.88 Power 0.77
Relationship between Thermal Environment and Microstructure
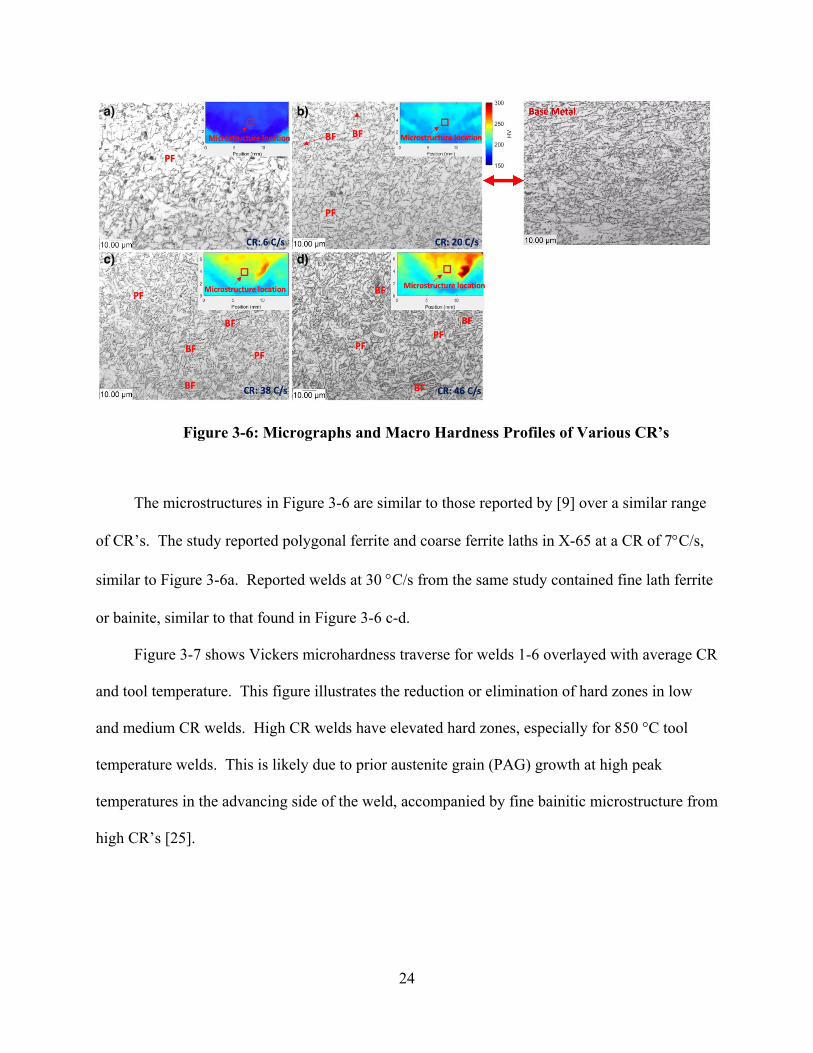
Figure 3-6 a-d show microhardness plots and associated micrographs for varied weld CR’s.
Hard zones were eliminated in the two lowest CR welds (Figure 3-6a and Figure 3-6b). The
lowest CR (Figure 3-6a) of 6 °C/s resulted in microstructure homogeneity throughout the stir
zone, composed primarily of coarsened polygonal ferrite (PF) grains.
The 20 °C/s CR (Figure 3-6b) weld yielded hardness levels and microstructural
characteristics similar to the original base metal. The micrograph for this weld displays a similar
grain size distribution to the base metal and contains similar proportions of polygonal ferrite and
bainitic ferrite islands. Higher CR welds (Figure 3-6c and Figure 3-6d) show an elevated
percentage of bainitic ferrite (BF) along with the presence of hard zones (Figure 3-6d).
24
Figure 3-6: Micrographs and Macro Hardness Profiles of Various CR’s
The microstructures in Figure 3-6 are similar to those reported by [9] over a similar range
of CR’s. The study reported polygonal ferrite and coarse ferrite laths in X-65 at a CR of 7°C/s,
similar to Figure 3-6a. Reported welds at 30 °C/s from the same study contained fine lath ferrite
or bainite, similar to that found in Figure 3-6 c-d.
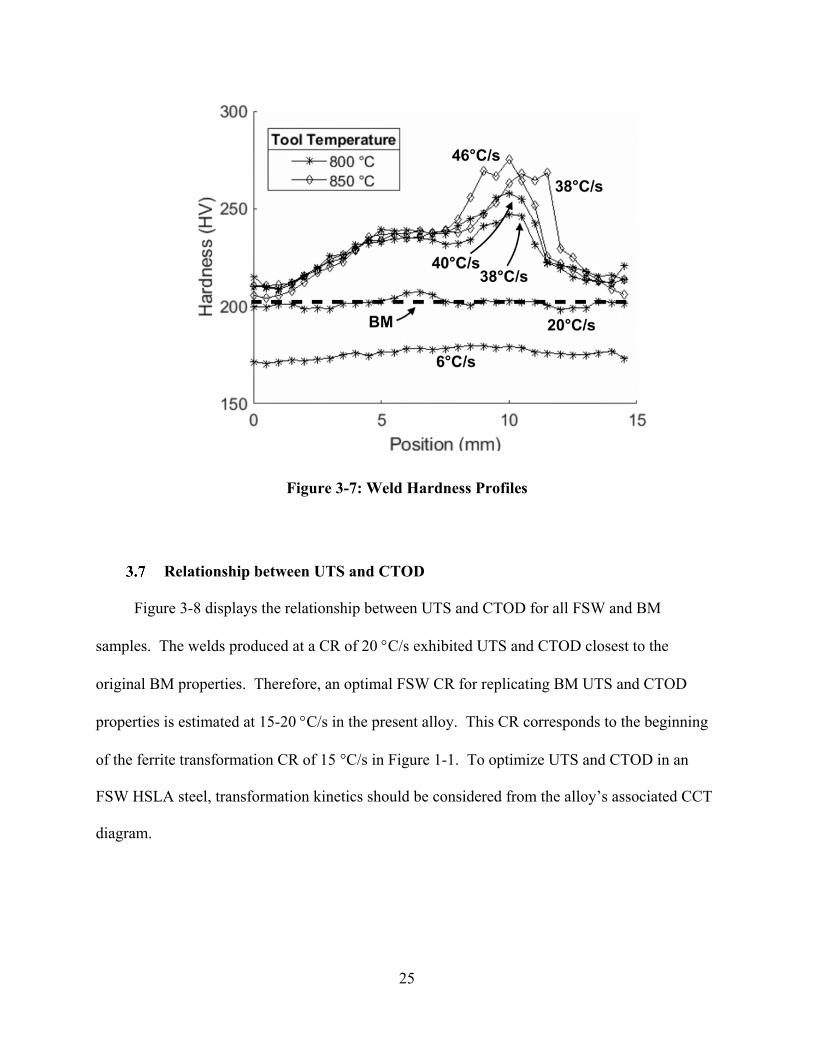
Figure 3-7 shows Vickers microhardness traverse for welds 1-6 overlayed with average CR
and tool temperature. This figure illustrates the reduction or elimination of hard zones in low
and medium CR welds. High CR welds have elevated hard zones, especially for 850 °C tool
temperature welds. This is likely due to prior austenite grain (PAG) growth at high peak
temperatures in the advancing side of the weld, accompanied by fine bainitic microstructure from
high CR’s [25].
25
Figure 3-7: Weld Hardness Profiles
Relationship between UTS and CTOD
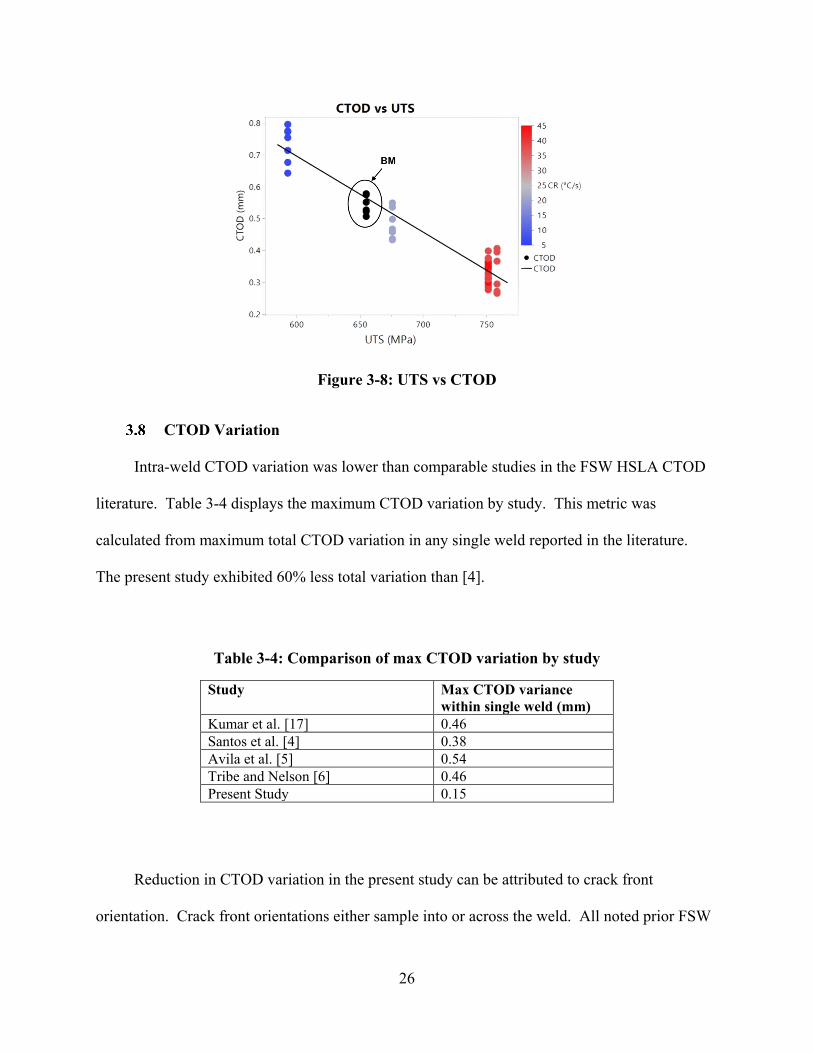
Figure 3-8 displays the relationship between UTS and CTOD for all FSW and BM
samples. The welds produced at a CR of 20 °C/s exhibited UTS and CTOD closest to the
original BM properties. Therefore, an optimal FSW CR for replicating BM UTS and CTOD
properties is estimated at 15-20 °C/s in the present alloy. This CR corresponds to the beginning
of the ferrite transformation CR of 15 °C/s in Figure 1-1. To optimize UTS and CTOD in an
FSW HSLA steel, transformation kinetics should be considered from the alloy’s associated CCT
diagram.
26
Figure 3-8: UTS vs CTOD
CTOD Variation
Intra-weld CTOD variation was lower than comparable studies in the FSW HSLA CTOD
literature. Table 3-4 displays the maximum CTOD variation by study. This metric was
calculated from maximum total CTOD variation in any single weld reported in the literature.
The present study exhibited 60% less total variation than [4].
Table 3-4: Comparison of max CTOD variation by study
Study Max CTOD variance within single weld (mm)
Kumar et al. [17] 0.46 Santos et al. [4] 0.38 Avila et al. [5] 0.54 Tribe and Nelson [6] 0.46 Present Study 0.15
Reduction in CTOD variation in the present study can be attributed to crack front
orientation. Crack front orientations either sample into or across the weld. All noted prior FSW
27
HSLA CTOD studies employed a through-thickness crack front. This approach samples a range
of microstructures across the weld thickness. In contrast, the present study employed a surface-
notched crack front which sampled into the weld. This crack orientation allowed for sampling a
specific microstructure zone (see Figure 2-3).
FSW Parameter Control
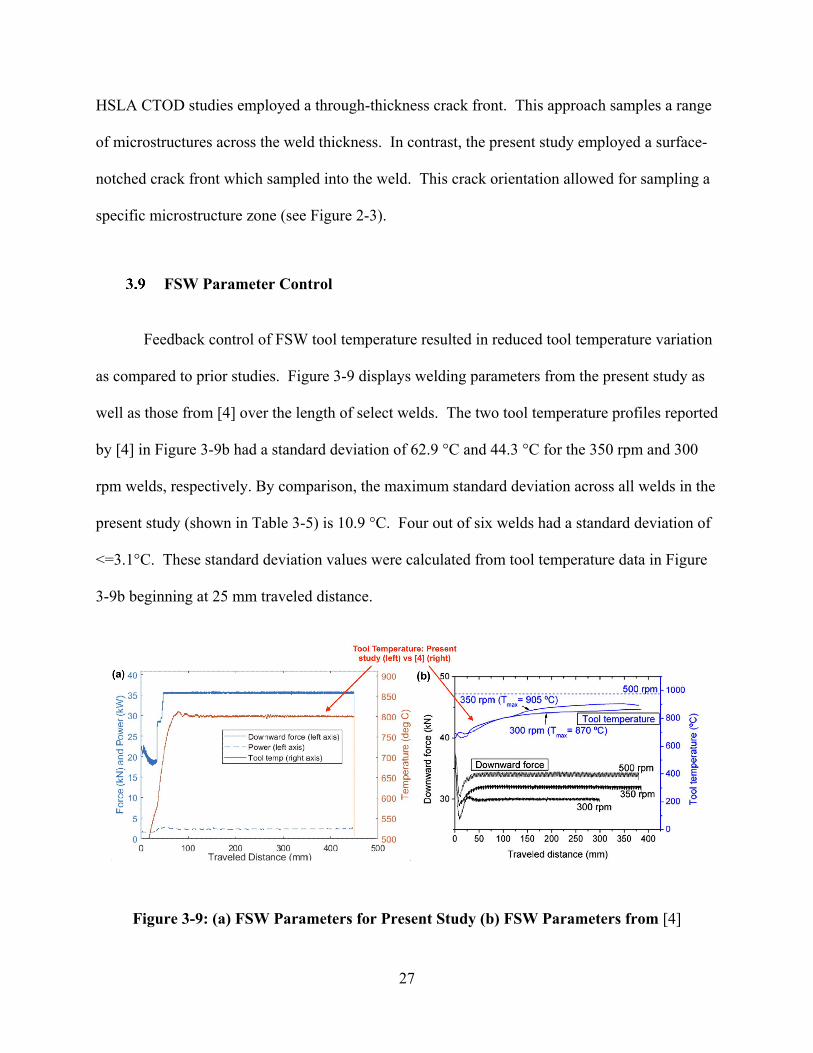
Feedback control of FSW tool temperature resulted in reduced tool temperature variation
as compared to prior studies. Figure 3-9 displays welding parameters from the present study as
well as those from [4] over the length of select welds. The two tool temperature profiles reported
by [4] in Figure 3-9b had a standard deviation of 62.9 °C and 44.3 °C for the 350 rpm and 300
rpm welds, respectively. By comparison, the maximum standard deviation across all welds in the
present study (shown in Table 3-5) is 10.9 °C. Four out of six welds had a standard deviation of
<=3.1°C. These standard deviation values were calculated from tool temperature data in Figure
3-9b beginning at 25 mm traveled distance.
Figure 3-9: (a) FSW Parameters for Present Study (b) FSW Parameters from [4]
28
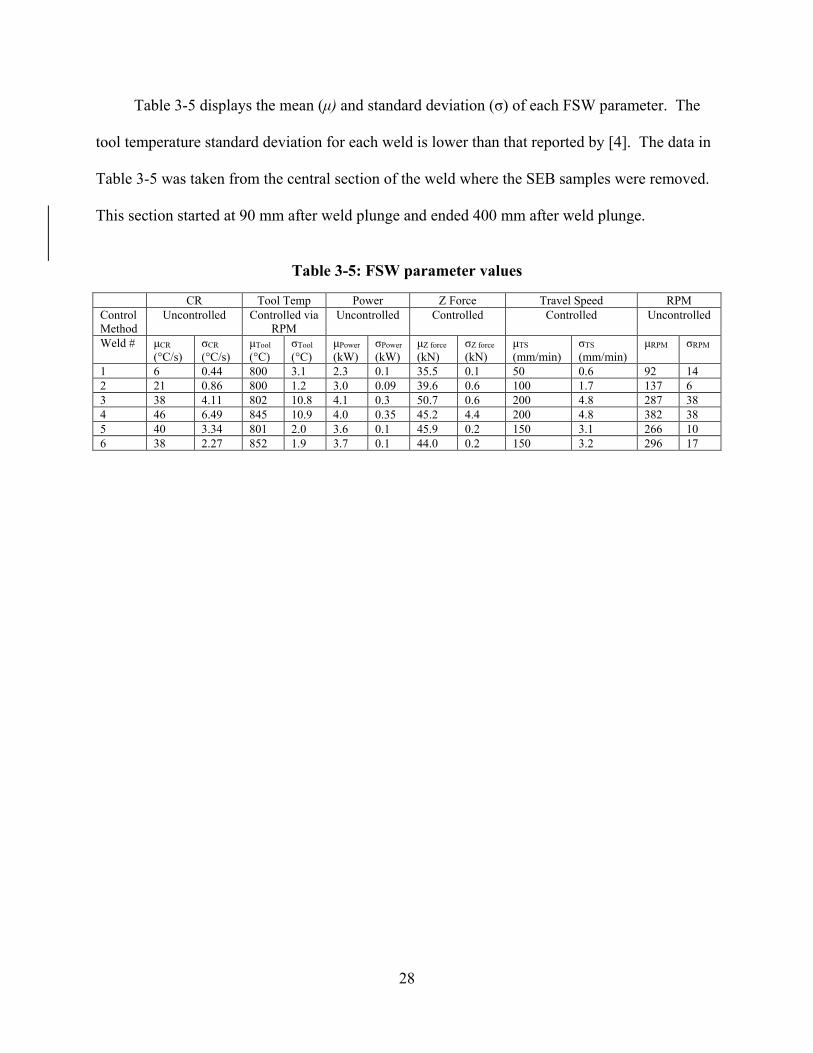
Table 3-5 displays the mean (μ) and standard deviation (σ) of each FSW parameter. The
tool temperature standard deviation for each weld is lower than that reported by [4]. The data in
Table 3-5 was taken from the central section of the weld where the SEB samples were removed.
This section started at 90 mm after weld plunge and ended 400 mm after weld plunge.
Table 3-5: FSW parameter values
CR Tool Temp Power Z Force Travel Speed RPM Control Method
Uncontrolled Controlled via RPM
Uncontrolled Controlled Controlled Uncontrolled
Weld # μCR (°C/s)
σCR (°C/s)
μTool (°C)
σTool (°C)
μPower (kW)
σPower (kW)
μZ force (kN)
σZ force (kN)
μTS (mm/min)
σTS (mm/min)
μRPM σRPM
1 6 0.44 800 3.1 2.3 0.1 35.5 0.1 50 0.6 92 14 2 21 0.86 800 1.2 3.0 0.09 39.6 0.6 100 1.7 137 6 3 38 4.11 802 10.8 4.1 0.3 50.7 0.6 200 4.8 287 38 4 46 6.49 845 10.9 4.0 0.35 45.2 4.4 200 4.8 382 38 5 40 3.34 801 2.0 3.6 0.1 45.9 0.2 150 3.1 266 10 6 38 2.27 852 1.9 3.7 0.1 44.0 0.2 150 3.2 296 17
29
4 CONCLUSIONS
CTOD of FSW HSLA X80 was successfully controlled via indirect manipulation of weld
thermal environment. CR and tool temperature were varied through FSW input parameters and
an anvil heater. The following conclusions can be made:
a. Fracture toughness in FSW API X80 is primarily controlled by CR. Fracture
toughness decreases linearly with increasing CR. The CR for optimal CTOD and
UTS properties is 20 °C/s.
b. Heat input alone is not a general predictor of FSW fracture toughness.
c. Preheat has the largest effect on CR in FSW X80 at the tested range of FSW
parameters.
d. Hard zones in FSW X80 can be reduced or eliminated using a combination of
FSW parameters and weld preheat. X-80 Base metal microstructure and material
properties can be nearly replicated throughout the weld nugget.
30
REFERENCES
[1] L. Kumar, K. U. Yazar, and S. Pramanik, “Effect of fusion and friction stir welding techniques on the microstructure, crystallographic texture and mechanical properties of mild steel,” Mater. Sci. Eng. A, vol. 754, no. February, pp. 400–410, 2019, doi: 10.1016/j.msea.2019.03.100.
[2] J. D. Horschel, “Mode I Fracture Toughness Testing of Friction Stir Processed HSLA-65,” no. August, p. 100, 2008.
[3] D. Fairchild et al., “Research concerning the friction stir welding of linepipe steels,” ASM Int Conf Trends Weld. Res., pp. 371–380, 2009, doi: 10.1361/cp2008twr371.
[4] T. F. a Santos, T. F. C. Hermenegildo, C. R. M. Afonso, R. R. Marinho, M. T. P. Paes, and a. J. Ramirez, “Fracture toughness of ISO 3183 X80M (API 5L X80) steel friction stir welds,” Eng. Fract. Mech., vol. 77, no. 15, pp. 2937–2945, 2010, doi: 10.1016/j.engfracmech.2010.07.022.
[5] J. A. Ávila, C. O. F. T. Ruchert, P. R. Mei, a J. Ramirez, R. M. Reppold, and M. T. P. Piza, “Effect of temperatures in fracture toughness evaluation of FSW welds on API 5L X-80 steel,” Inpress, vol. xxx, no. xxx, p. xxx, 2014, doi: 10.1016/j.engfracmech.2015.08.006.
[6] A. Tribe and T. W. Nelson, “Study on the fracture toughness of friction stir welded API X80,” Eng. Fract. Mech., vol. 150, pp. 58–69, 2015, doi: 10.1016/j.engfracmech.2015.10.006.
[7] M. Matsushita, Y. Kitani, R. Ikeda, S. Endo, and H. Fujii, “Microstructure and Toughness of Friction Stir Weld of Thick Structural Steel,” ISIJ Int., vol. 52, no. 7, pp. 1335–1341, 2012, doi: 10.2355/isijinternational.52.1335.
[8] J. Allred, “An Investigation into the Mechanisms of Formation of the Hard Zone in FSW X65,” no. October 2013, p. 60, 2013.
[9] T. W. Nelson and S. A. Rose, “Controlling hard zone formation in friction stir processed HSLA steel,” J. Mater. Process. Technol., vol. 231, pp. 66–74, 2016, doi: 10.1016/j.jmatprotec.2015.12.013.
[10] A. J. Kneissl, A. C., Garcia, C. I., & DeArdo, “HSLA steels: Processing, properties and applications.,” Miner. Met. Mater. Soc, vol. 99105, 1992.
[11] M. Maalekian, “Solid-State Transformations in Weldments[1],” Weld. Fundam. Process., vol. 6, no. March, pp. 122–145, 2018, doi: 10.31399/asm.hb.v06a.a0005613.
[12] R. Pamnani, T. Jayakumar, M. Vasudevan, and T. Sakthivel, “Investigations on the impact toughness of HSLA steel arc welded joints,” J. Manuf. Process., vol. 21, pp. 75–86, 2016, doi: 10.1016/j.jmapro.2015.11.007.
[13] Y. Yang, L. Shi, Z. Xu, H. Lu, X. Chen, and X. Wang, “Fracture toughness of the materials in welded joint of X80 pipeline steel,” Eng. Fract. Mech., vol. 148, pp. 337–349,
31
2015, doi: 10.1016/j.engfracmech.2015.07.061. [14] P. J. Konkol and M. F. Mruczek, “Comparison of friction stir weldments and submerged
arc weldments in HSLA-65 steel,” Weld. J. (Miami, Fla), vol. 86, no. 7, 2007. [15] F. C. Liu, Y. Hovanski, M. P. Miles, C. D. Sorensen, and T. W. Nelson, “A review of
friction stir welding of steels: Tool, material flow, microstructure, and properties,” J. Mater. Sci. Technol., vol. 34, no. 1, pp. 39–57, 2018, doi: 10.1016/j.jmst.2017.10.024.
[16] Astm-E1820-11E2, “Standard Test Method for Measurement of Fracture Toughness,” Am. Soc. Test. Mater., pp. 1–58, 2013, doi: 10.1520/E1820-11E02.2.
[17] D. P. . M. M. L. Kumar, a; Fairchild, “Research Progress on Friction Stir Welding of Pipeline Steels,” Proc. 8th Int. Pipeline Conf., no. 801, pp. 419–446, 2010, doi: 10.1207/s15327752jpa8502.
[18] B. J. Stringham, T. W. Nelson, and C. D. Sorensen, “temperature and cooling rate in friction stir welding,” vol. 255, no. December 2017, pp. 816–830, 2018.
[19] B. S. Taysom, C. D. Sorensen, and J. D. Hedengren, “A comparison of model predictive control and PID temperature control in friction stir welding,” J. Manuf. Process., vol. 29, pp. 232–241, 2017, doi: 10.1016/j.jmapro.2017.07.015.
[20] & U. Chen, Xiang, Clowers, Logan N., Linares, Alberto Esteban, “Automated J-R Curve Analysis Based on the ASTM E1820 Normalization Method [Computer software].,” p. https://www.osti.gov//servlets/purl/1484357. https.
[21] S. Pal and M. P. Phaniraj, “Determination of heat partition between tool and workpiece during FSW of SS304 using 3D CFD modeling,” J. Mater. Process. Technol., vol. 222, pp. 280–286, 2015, doi: 10.1016/j.jmatprotec.2015.03.015.
[22] O. G. Kasatkin, B. B. Vinokur, and V. L. Pilyushenko, “Calculation models for determining the critical points of steel,” Met. Sci. Heat Treat., vol. 26, no. 1, pp. 27–31, 1984, doi: 10.1007/BF00712859.
[23] K. W. ANDREWS, “Empirical formulae for the calculation of some transformation temperatures,” J. Iron Steel Inst., vol. July, pp. 721–727, 1965, [Online]. Available: https://ci.nii.ac.jp/naid/10030149614/en/.
[24] H. BRANDIS, “RECHNERISCHE BESTIMMUNG DER UMWANDLUNGSTEMPERATUREN VON NIEDRIGLEGIERTEN STAEHLEN.; CALCUL DES TEMPERATURES DE TRANSFORMATION DES ACIERS FAIBLEMENT ALLIES,” 1975.
[25] A. Ozekcin et al., “A Microstructural Study of Friction Stir Welded Joints of Carbon Steels,” Proc. Int. Offshore Polar Eng. Conf., no. November 2015, pp. 61–66, 2004.


![Friction Stir Welding of Shipbuilding Steel with Primer · McPerson et al. [8] compared fatigue behaviour of submerged arc and friction stir weld in DH36 concluding on am improved](https://img.pdfslide.net/doc/110x75/5eb597e5216c0a5a983bbe28/friction-stir-welding-of-shipbuilding-steel-with-mcperson-et-al-8-compared-fatigue.jpg)