Embed Size (px)
Citation preview
Control of Supersonic Cavity Flow Using Plasma Actuators
N. Webb∗ and M. Samimy†
The Ohio State University, Columbus, Ohio 42235
DOI: 10.2514/1.J055720
Cavity flows are present in awide range of aerospace applications. The pressure fluctuations associatedwith cavity
resonance have made them the target of significant flow control efforts aimed at suppressing resonance. A potential
scramjet application for cavity flows may require resonance enhancement in addition to resonance suppression.
Localized arc filament plasma actuators have demonstrated the ability to control a high subsonic cavity flow. This
work investigates the control authority of the localized arc filament plasma actuators in a supersonic (M � 2.24)cavity flow. The localized arc filament plasma actuators significantly suppress the primary cavity resonance of a
naturally and strongly resonating cavity. Additionally, the trend in effectiveness suggests that introducing mode
competition through the excitation of the Kelvin–Helmholtz instability, and thereby influencing the shear-layer
structure formation process, is the likely control mechanism. The effects of two-dimensional and three-dimensional
excitation are explored. Although two-dimensional excitation achieves the greatest resonance suppression, three-
dimensional excitation shows similar suppressionwith significantly less sensitivity to the excitation Strouhal number,
making it more desirable for practical applications. In a weakly resonating cavity, the flow significantly responds to
excitation near the resonance Strouhal numbers. However, electromagnetic interferencemakes it difficult to quantify
the level of resonance enhancement.
I. Introduction
C AVITY flow is a ubiquitous aerodynamic configuration withapplications ranging from aircraft landing gear bays and cargo/
weapons bays to flameholding in scramjets and flow regimes fromlow subsonic to supersonic [1–5]. Cavity flows often resonate,potentially causing serious aerodynamic repercussions [1,5]. Largepressure fluctuations associated with resonance generate significantacoustic radiation, and increased entrainment causes additional drag[6,7]. In some cases, the pressure fluctuations can pose structuralfatigue concerns for nearby aircraft components. In store-releaseapplications, these pressure fluctuations can adversely affect deliveryaccuracy and cause collision hazards postlaunch [8].There are two commonly observed cavity flow resonance
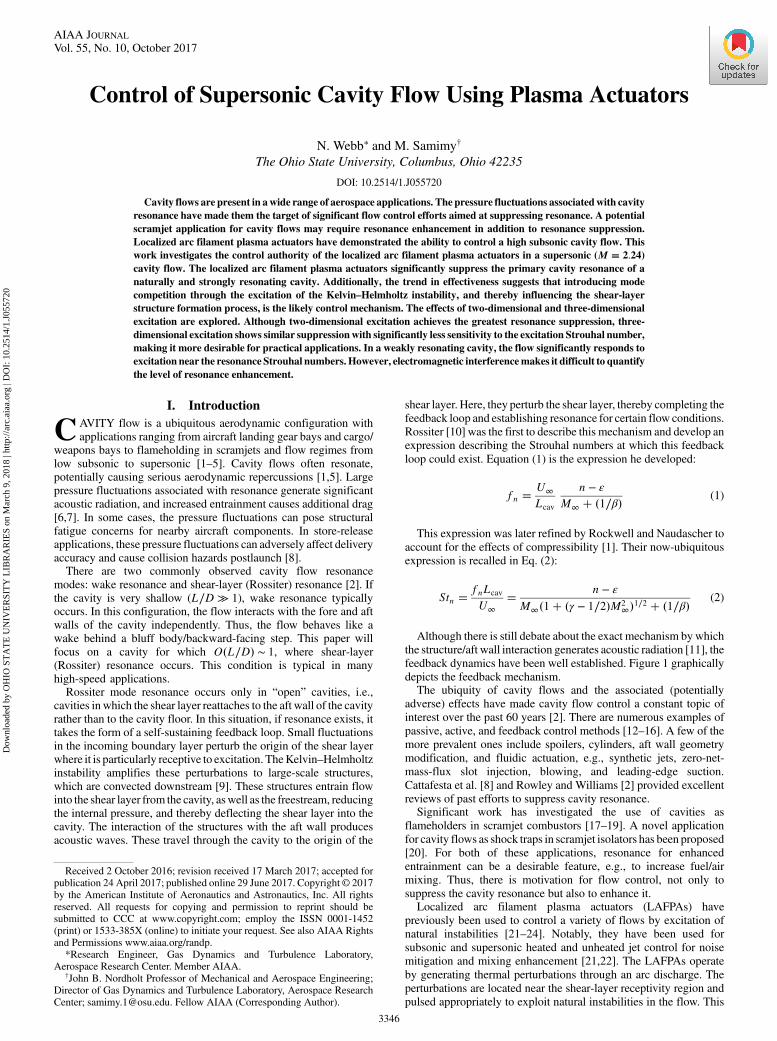
modes: wake resonance and shear-layer (Rossiter) resonance [2]. Ifthe cavity is very shallow (L∕D ≫ 1), wake resonance typicallyoccurs. In this configuration, the flow interacts with the fore and aftwalls of the cavity independently. Thus, the flow behaves like awake behind a bluff body/backward-facing step. This paper willfocus on a cavity for which O�L∕D� ∼ 1, where shear-layer(Rossiter) resonance occurs. This condition is typical in manyhigh-speed applications.Rossiter mode resonance occurs only in “open” cavities, i.e.,
cavities in which the shear layer reattaches to the aft wall of the cavityrather than to the cavity floor. In this situation, if resonance exists, ittakes the form of a self-sustaining feedback loop. Small fluctuationsin the incoming boundary layer perturb the origin of the shear layerwhere it is particularly receptive to excitation. TheKelvin–Helmholtzinstability amplifies these perturbations to large-scale structures,which are convected downstream [9]. These structures entrain flowinto the shear layer from the cavity, aswell as the freestream, reducingthe internal pressure, and thereby deflecting the shear layer into thecavity. The interaction of the structures with the aft wall producesacoustic waves. These travel through the cavity to the origin of the
shear layer. Here, they perturb the shear layer, thereby completing thefeedback loop and establishing resonance for certain flow conditions.Rossiter [10] was the first to describe this mechanism and develop anexpression describing the Strouhal numbers at which this feedbackloop could exist. Equation (1) is the expression he developed:
fn � U∞
Lcav
n − ε
M∞ � �1∕β� (1)
This expression was later refined by Rockwell and Naudascher toaccount for the effects of compressibility [1]. Their now-ubiquitousexpression is recalled in Eq. (2):
Stn � fnLcav
U∞� n − ε
M∞�1� �γ − 1∕2�M2∞�1∕2 � �1∕β� (2)
Although there is still debate about the exact mechanism by whichthe structure/aft wall interaction generates acoustic radiation [11], thefeedback dynamics have been well established. Figure 1 graphicallydepicts the feedback mechanism.The ubiquity of cavity flows and the associated (potentially
adverse) effects have made cavity flow control a constant topic ofinterest over the past 60 years [2]. There are numerous examples ofpassive, active, and feedback control methods [12–16]. A few of themore prevalent ones include spoilers, cylinders, aft wall geometrymodification, and fluidic actuation, e.g., synthetic jets, zero-net-mass-flux slot injection, blowing, and leading-edge suction.Cattafesta et al. [8] and Rowley and Williams [2] provided excellentreviews of past efforts to suppress cavity resonance.Significant work has investigated the use of cavities as
flameholders in scramjet combustors [17–19]. A novel applicationfor cavity flows as shock traps in scramjet isolators has been proposed[20]. For both of these applications, resonance for enhancedentrainment can be a desirable feature, e.g., to increase fuel/airmixing. Thus, there is motivation for flow control, not only tosuppress the cavity resonance but also to enhance it.Localized arc filament plasma actuators (LAFPAs) have
previously been used to control a variety of flows by excitation ofnatural instabilities [21–24]. Notably, they have been used forsubsonic and supersonic heated and unheated jet control for noisemitigation and mixing enhancement [21,22]. The LAFPAs operateby generating thermal perturbations through an arc discharge. Theperturbations are located near the shear-layer receptivity region andpulsed appropriately to exploit natural instabilities in the flow. This
Received 2 October 2016; revision received 17 March 2017; accepted forpublication 24 April 2017; published online 29 June 2017. Copyright © 2017by the American Institute of Aeronautics and Astronautics, Inc. All rightsreserved. All requests for copying and permission to reprint should besubmitted to CCC at www.copyright.com; employ the ISSN 0001-1452(print) or 1533-385X (online) to initiate your request. See also AIAA Rightsand Permissions www.aiaa.org/randp.
*Research Engineer, Gas Dynamics and Turbulence Laboratory,Aerospace Research Center. Member AIAA.
†John B. Nordholt Professor of Mechanical and Aerospace Engineering;Director of Gas Dynamics and Turbulence Laboratory, Aerospace ResearchCenter; [email protected]. Fellow AIAA (Corresponding Author).
3346
AIAA JOURNALVol. 55, No. 10, October 2017
Dow
nloa
ded
by O
HIO
ST
AT
E U
NIV
ER
SIT
Y L
IBR
AR
IES
on M
arch
9, 2
018
| http
://ar
c.ai
aa.o
rg |
DO
I: 1
0.25
14/1
.J05
5720
strategy yields a control technique with extremely low powerrequirements (tens of watts per actuator).These actuators have demonstrated the ability to suppress or excite
resonance in naturally resonating and nonresonating subsonic cavities,respectively [25]. The objective of this work is to demonstrate that theobserved control authority of the LAFPAs extends to the supersonicregime. Specifically, the response of the flow over two differentcavities to excitationwill be investigated. First, the flowover a stronglyresonating cavity will be examined to assess the LAFPAs’ ability tosuppress resonance. Second, the flow over a weakly resonating cavitywill be excited to determine theLAFPAs’ ability to enhance resonance.
II. Experimental Arrangement
A. Facility
Experiments were conducted in a blowdown facility at the GasDynamics and Turbulence Laboratory of the Aerospace ResearchCenter at TheOhio State University. Two high-pressure storage tankswith a total volume of 36 m3 supplied air to the facility. They werefilled with compressed, dried air by three Norwalk compressors. Acomputer-controlled air delivery system held the pressure in thestagnation chamber constant as the tanks drained. The flow passedinto the stagnation chamber and through two perforated plates andthree turbulence-reducing screens before entering a convergingsection through a fourth screen.After the last screen, the flow passes through amodular, contoured,
converging–diverging nozzle, accelerating it to a freestream Machnumber of 2.24 approximately 150 mm upstream of the fore wall ofthe cavity. The test-section cross section is 50.8 by 50.8 mm. Thefreestream stagnation temperature is not controlled and varies fromabout 20°C to about −10°C, depending on outdoor conditions(storage tank temperature) and the tank pressure. The stagnationpressure (Reynolds number) is variable and, for this experiment, isheld constant at 401 kPa (ReD ∼ 660;000).Optical access is available from both sides of the test section,
through nominally 75 by 250mmwindows, and from the top througha nominally 25 by 90 mm window to accommodate opticalmeasurement techniques.The cavity was located in the bottom wall of the test section. The
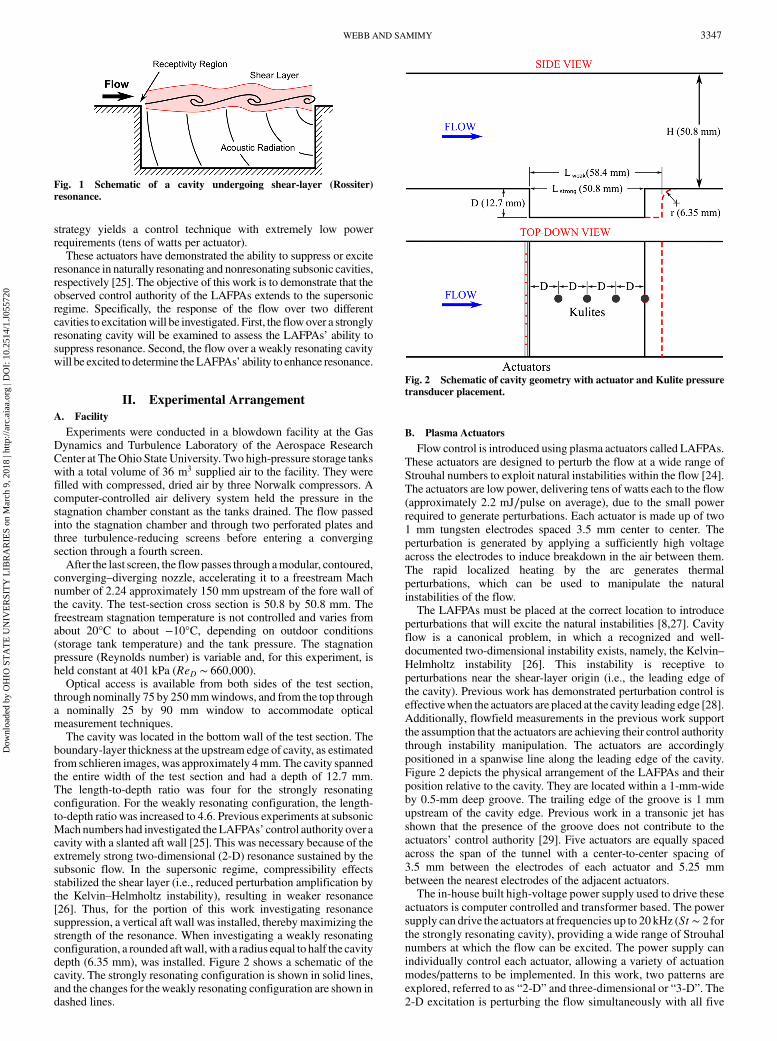
boundary-layer thickness at the upstream edge of cavity, as estimatedfrom schlieren images, was approximately 4mm. The cavity spannedthe entire width of the test section and had a depth of 12.7 mm.The length-to-depth ratio was four for the strongly resonatingconfiguration. For the weakly resonating configuration, the length-to-depth ratio was increased to 4.6. Previous experiments at subsonicMach numbers had investigated theLAFPAs’ control authority over acavity with a slanted aft wall [25]. This was necessary because of theextremely strong two-dimensional (2-D) resonance sustained by thesubsonic flow. In the supersonic regime, compressibility effectsstabilized the shear layer (i.e., reduced perturbation amplification bythe Kelvin–Helmholtz instability), resulting in weaker resonance[26]. Thus, for the portion of this work investigating resonancesuppression, a vertical aft wall was installed, thereby maximizing thestrength of the resonance. When investigating a weakly resonatingconfiguration, a rounded aftwall, with a radius equal to half the cavitydepth (6.35 mm), was installed. Figure 2 shows a schematic of thecavity. The strongly resonating configuration is shown in solid lines,and the changes for theweakly resonating configuration are shown indashed lines.
B. Plasma Actuators
Flow control is introduced using plasma actuators called LAFPAs.These actuators are designed to perturb the flow at a wide range ofStrouhal numbers to exploit natural instabilities within the flow [24].The actuators are low power, delivering tens of watts each to the flow(approximately 2.2 mJ∕pulse on average), due to the small powerrequired to generate perturbations. Each actuator is made up of two1 mm tungsten electrodes spaced 3.5 mm center to center. Theperturbation is generated by applying a sufficiently high voltageacross the electrodes to induce breakdown in the air between them.The rapid localized heating by the arc generates thermalperturbations, which can be used to manipulate the naturalinstabilities of the flow.The LAFPAs must be placed at the correct location to introduce
perturbations that will excite the natural instabilities [8,27]. Cavityflow is a canonical problem, in which a recognized and well-documented two-dimensional instability exists, namely, the Kelvin–Helmholtz instability [26]. This instability is receptive toperturbations near the shear-layer origin (i.e., the leading edge ofthe cavity). Previous work has demonstrated perturbation control iseffectivewhen the actuators are placed at the cavity leading edge [28].Additionally, flowfield measurements in the previous work supportthe assumption that the actuators are achieving their control authoritythrough instability manipulation. The actuators are accordinglypositioned in a spanwise line along the leading edge of the cavity.Figure 2 depicts the physical arrangement of the LAFPAs and theirposition relative to the cavity. They are located within a 1-mm-wideby 0.5-mm deep groove. The trailing edge of the groove is 1 mmupstream of the cavity edge. Previous work in a transonic jet hasshown that the presence of the groove does not contribute to theactuators’ control authority [29]. Five actuators are equally spacedacross the span of the tunnel with a center-to-center spacing of3.5 mm between the electrodes of each actuator and 5.25 mmbetween the nearest electrodes of the adjacent actuators.The in-house built high-voltage power supply used to drive these
actuators is computer controlled and transformer based. The powersupply can drive the actuators at frequencies up to 20 kHz (St ∼ 2 forthe strongly resonating cavity), providing a wide range of Strouhalnumbers at which the flow can be excited. The power supply canindividually control each actuator, allowing a variety of actuationmodes/patterns to be implemented. In this work, two patterns areexplored, referred to as “2-D” and three-dimensional or “3-D”. The2-D excitation is perturbing the flow simultaneously with all five
Fig. 1 Schematic of a cavity undergoing shear-layer (Rossiter)resonance.
Fig. 2 Schematic of cavity geometry with actuator and Kulite pressuretransducer placement.
WEBB AND SAMIMY 3347
Dow
nloa
ded
by O
HIO
ST
AT
E U
NIV
ER
SIT
Y L
IBR
AR
IES
on M
arch
9, 2
018
| http
://ar
c.ai
aa.o
rg |
DO
I: 1
0.25
14/1
.J05
5720
actuators. The 3-D excitation is perturbing the flow at a relativephase delay of 180 deg between adjacent actuators.
C. Measurement Techniques
The primary measurement technique used to interrogate the cavityflow was time-resolved pressure measurements. The static pressureat four centerline locations on the cavity floor was collected byKulite XTL-190-25A pressure transducer(s). The locations of thesetransducers are shown in Fig. 2. All presented datawere collected at asampling rate of 75 kHz (St ∼ 7) and analog low-pass filtered at25 kHz (St ∼ 2.5) to prevent aliasing. The datawere collected in time-resolved blocks of 4096 points in length. For each presented case, 100blocks were collected. The fast Fourier transform of each block wascalculated using aHammingwindowand no overlapping, resulting ina frequency resolution of 18.3 Hz. The power spectral density (PSD)of each block was then obtained and averaged over all the blocks.Note that, when converting the PSD to decibels, the standardreference pressure (20 μPa) was used. This arrangement and theseprocessing parameters resulted in an uncertainty independent of thefrequency or amplitude (i.e., peaks have the same uncertaintydistribution as any other point). Adding error bars to the figuressignificantly clutters them; therefore, the ranges in which the 95%-confidence intervals fall for every PSD point presented in thefollowing have been tabulated in Table 1. Note that the asymmetry inthe uncertainty bands is due to the logarithmic nature of the decibelscale. In addition to this general uncertainty, the measured spectralsubtraction figures have been accompanied with maximum andmedian uncertainty values.One interesting side note from the uncertainty analysis is that,
although the uncertainty did not depend on the frequency oramplitude of the measurement, it did depend on whether themeasurement was part of an electromagnetic interference (EMI) peak(see Sec. II.D titled “Electromagnetic Interference”). In particular,points that were part of an EMI peak had an uncertainty that was, onaverage, below 0.4 dB. The reason for this decrease cannot beverified. However, the fact that the EMI ought to be relativelyconsistent suggests that the primary source of uncertainty in thepressure measurements is the fluctuations in the flow rather than theinherent inaccuracy in the measurement system.
D. Flow Validation
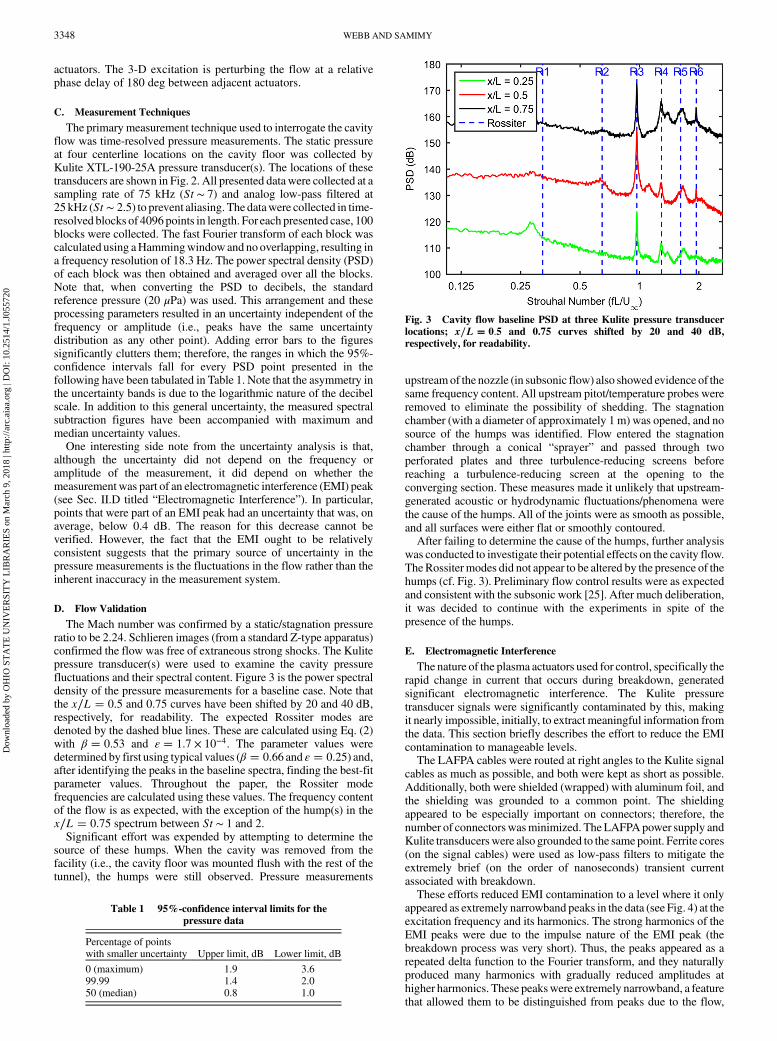
The Mach number was confirmed by a static/stagnation pressureratio to be 2.24. Schlieren images (from a standard Z-type apparatus)confirmed the flow was free of extraneous strong shocks. The Kulitepressure transducer(s) were used to examine the cavity pressurefluctuations and their spectral content. Figure 3 is the power spectraldensity of the pressure measurements for a baseline case. Note thatthe x∕L � 0.5 and 0.75 curves have been shifted by 20 and 40 dB,respectively, for readability. The expected Rossiter modes aredenoted by the dashed blue lines. These are calculated using Eq. (2)with β � 0.53 and ε � 1.7 × 10⁻⁴. The parameter values weredetermined by first using typical values (β � 0.66 and ε � 0.25) and,after identifying the peaks in the baseline spectra, finding the best-fitparameter values. Throughout the paper, the Rossiter modefrequencies are calculated using these values. The frequency contentof the flow is as expected, with the exception of the hump(s) in thex∕L � 0.75 spectrum between St ∼ 1 and 2.Significant effort was expended by attempting to determine the
source of these humps. When the cavity was removed from thefacility (i.e., the cavity floor was mounted flush with the rest of thetunnel), the humps were still observed. Pressure measurements
upstreamof the nozzle (in subsonic flow) also showed evidence of thesame frequency content. All upstream pitot/temperature probes wereremoved to eliminate the possibility of shedding. The stagnationchamber (with a diameter of approximately 1 m) was opened, and nosource of the humps was identified. Flow entered the stagnationchamber through a conical “sprayer” and passed through twoperforated plates and three turbulence-reducing screens beforereaching a turbulence-reducing screen at the opening to theconverging section. These measures made it unlikely that upstream-generated acoustic or hydrodynamic fluctuations/phenomena werethe cause of the humps. All of the joints were as smooth as possible,and all surfaces were either flat or smoothly contoured.After failing to determine the cause of the humps, further analysis
was conducted to investigate their potential effects on the cavity flow.TheRossitermodes did not appear to be altered by the presence of thehumps (cf. Fig. 3). Preliminary flow control results were as expectedand consistent with the subsonic work [25]. After much deliberation,it was decided to continue with the experiments in spite of thepresence of the humps.
E. Electromagnetic Interference
The nature of the plasma actuators used for control, specifically therapid change in current that occurs during breakdown, generatedsignificant electromagnetic interference. The Kulite pressuretransducer signals were significantly contaminated by this, makingit nearly impossible, initially, to extract meaningful information fromthe data. This section briefly describes the effort to reduce the EMIcontamination to manageable levels.The LAFPA cables were routed at right angles to the Kulite signal
cables as much as possible, and both were kept as short as possible.Additionally, both were shielded (wrapped) with aluminum foil, andthe shielding was grounded to a common point. The shieldingappeared to be especially important on connectors; therefore, thenumber of connectorswasminimized. TheLAFPApower supply andKulite transducerswere also grounded to the same point. Ferrite cores(on the signal cables) were used as low-pass filters to mitigate theextremely brief (on the order of nanoseconds) transient currentassociated with breakdown.These efforts reduced EMI contamination to a level where it only
appeared as extremely narrowband peaks in the data (see Fig. 4) at theexcitation frequency and its harmonics. The strong harmonics of theEMI peaks were due to the impulse nature of the EMI peak (thebreakdown process was very short). Thus, the peaks appeared as arepeated delta function to the Fourier transform, and they naturallyproduced many harmonics with gradually reduced amplitudes athigher harmonics. These peakswere extremely narrowband, a featurethat allowed them to be distinguished from peaks due to the flow,
Table 1 95%-confidence interval limits for thepressure data
Percentage of pointswith smaller uncertainty Upper limit, dB Lower limit, dB
0 (maximum) 1.9 3.699.99 1.4 2.050 (median) 0.8 1.0
Fig. 3 Cavity flow baseline PSD at three Kulite pressure transducerlocations; x∕L � 0.5 and 0.75 curves shifted by 20 and 40 dB,respectively, for readability.
3348 WEBB AND SAMIMY
Dow
nloa
ded
by O
HIO
ST
AT
E U
NIV
ER
SIT
Y L
IBR
AR
IES
on M
arch
9, 2
018
| http
://ar
c.ai
aa.o
rg |
DO
I: 1
0.25
14/1
.J05
5720

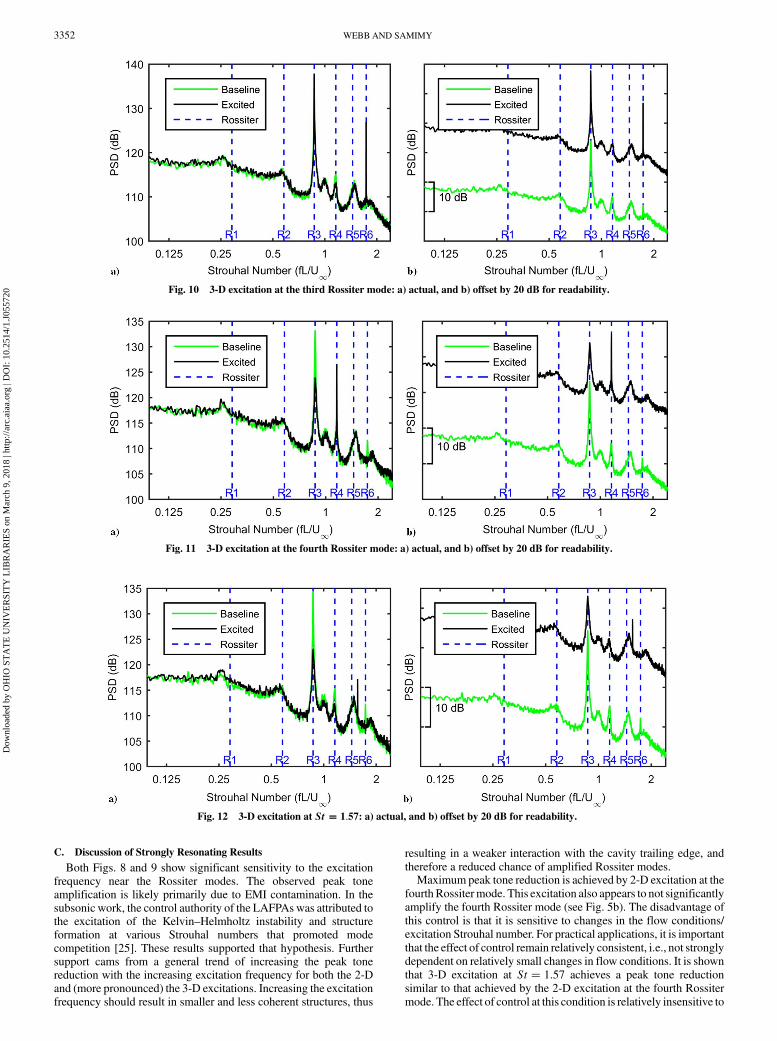
evenwhen they overlapped. Figure 5 shows the zoomed-in spectra ofseveral cases that will be presented later (in Figs. 6 and 7,respectively). The spectra are zoomed in on the third and fourthRossiter modes (as they correspond to the excitation frequencies ineach case), respectively. The zoomed-in view clearly shows thedistinction between a natural, narrowband phenomenon, and theextreme narrowness of the artificially generated EMI peak. To furtherillustrate this difference, the reader is referred to figure 15 in theworkof Yugulis et al. [25], which displayed a case in which the resonancewas enhanced in a weakly resonating cavity. The narrowband natureof the EMI peaks was completely lacking in this case, with thenaturally and strongly resonating peak matching thewidth and shapeof the excited resonance peak quite well.
The EMI peaks were easily identifiable and known a priori, soobtaining useful information from the data became relativelystraightforward, exceptwhen the excitation frequency overlappedwiththe frequency of interest (or one of its subharmonics). For these cases,significant efforts were made to filter the EMI tones. A referencetransducer, located outside the tunnel but wired and recordedidentically to the others, was employed to try to record the EMIamplitudes. However, the (grounded) metal frame of the wind tunnelprovided significant shielding, and the externally measured EMI wassignificantly smaller than that measured inside. After this, a waveletfilter, using the expected time of arrival to distinguish and remove EMIenergy from the signal, was tried. Unfortunately, the nature ofresonance was such that there was coincidence between the arrival
Fig. 4 2-D excitation at St � 1.57: a) actual, and b) offset by 20 dB for readability.
Fig. 5 Horizontally zoomed-in spectra of excited cases for EMI peak identification: a) third Rossiter mode (cf. Fig. 6) and b) fourth Rossiter mode(cf. Fig. 7).
Fig. 6 2-D excitation at the third Rossiter mode: a) actual, and b) offset by 20 dB for readability.
WEBB AND SAMIMY 3349
Dow
nloa
ded
by O
HIO
ST
AT
E U
NIV
ER
SIT
Y L
IBR
AR
IES
on M
arch
9, 2
018
| http
://ar
c.ai
aa.o
rg |
DO
I: 1
0.25
14/1
.J05
5720
times, making this strategy ineffective. Finally, wind-off data werecollected from the measurement Kulites with the actuators firing.However, the changes in ambient, flow, and breakdown characteristicsmade a consistent comparison between thewind-off andwind-on EMIamplitudes impossible. These difficulties were encountered primarilydue to the small output signal of theKulites (on the order ofmillivolts).Other sensors (e.g., condenser microphones), although not suitable forthis environment, had a much higher output signal (on the order of100 V) and have been shown to be immune to contamination by EMI.In the end, the results presented in the following still have some
EMI contamination; however, they make a good contribution to ourunderstanding of cavity flow physics and control. Additionally, someinformation can still be extracted. For example, in Fig. 5a, it is clearthat the amplitude of the physical peak has been reduced. The exactamount is obscured by the EMI peak, but it is clearly on the order of10 dB. Likewise, in Fig. 5b, it is clear that the peak has been amplifiedslightly, perhaps by 2 or 3 dB, although the precise amount isobscured. Throughout the rest of the paper, where necessary, suchqualitative observations are made. In these cases, it is clearly statedthat EMI contamination obscures the true amount of theamplification/suppression.
III. Results
The actuators have demonstrated the ability to both suppress andenhance resonance in a Mach 0.6 cavity flow [25]. It is important toboth demonstrate that the LAFPAs’ control authority extends tosupersonic cavities and to determine the parameters that make theexcitation most effective.In any flow control endeavor, knowledge of the baseline flow is of
paramount importance. Schlieren imageswere collected to verify thatno strong shocks (from the cavity lip, tunnel joints, etc.) impinged onthe cavity shear layer. Figure 3 shows the frequency content of thebaseline cavity flow. The present configuration results in a cavitywith single-mode resonance at the thirdRossitermode. The harmonicof the primary resonance is observed at the sixth Rossiter mode. Themajority of the analysis in the following focuses on modification ofthe “peak tone” (third Rossiter mode) due to its role as the primaryresonance. The fourth and fifthRossitermodes, aswell as the first andsecond Rossiter modes, are also visible in the spectra. It should benoted that, when comparing the data from the present work to thesubsonic experiments, the subsonic cavity primarily resonated at thesecond Rossiter mode, with a secondary peak at the third Rossitermode [25].
A. Strongly Resonating 2-D Excitation
The two-dimensional nature of the fundamental instability andfeedback mechanism responsible for resonance made 2-D excitationa logical place to begin. The LAFPAs provided perturbationsnecessary to excite the Kelvin–Helmholtz instability in the shearlayer, which was responsible for the formation of the structures in the
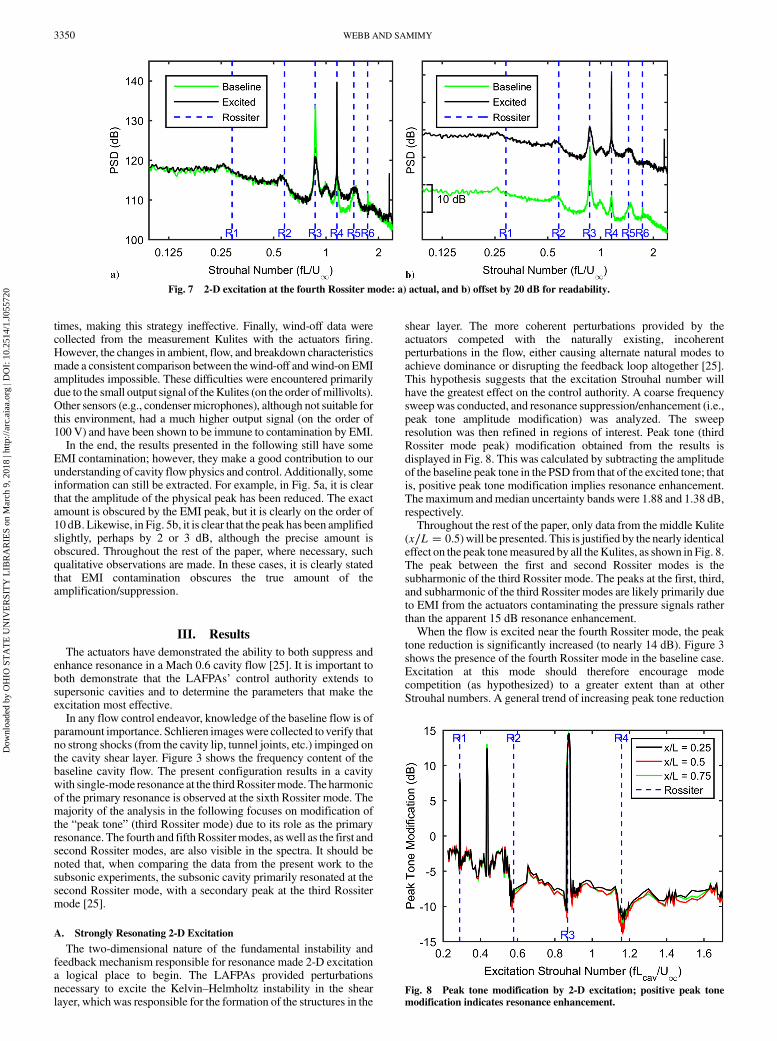
shear layer. The more coherent perturbations provided by theactuators competed with the naturally existing, incoherentperturbations in the flow, either causing alternate natural modes toachieve dominance or disrupting the feedback loop altogether [25].This hypothesis suggests that the excitation Strouhal number willhave the greatest effect on the control authority. A coarse frequencysweepwas conducted, and resonance suppression/enhancement (i.e.,peak tone amplitude modification) was analyzed. The sweepresolution was then refined in regions of interest. Peak tone (thirdRossiter mode peak) modification obtained from the results isdisplayed in Fig. 8. This was calculated by subtracting the amplitudeof the baseline peak tone in the PSD from that of the excited tone; thatis, positive peak tone modification implies resonance enhancement.The maximum andmedian uncertainty bands were 1.88 and 1.38 dB,respectively.Throughout the rest of the paper, only data from the middle Kulite
(x∕L � 0.5) will be presented. This is justified by the nearly identicaleffect on the peak tonemeasured by all theKulites, as shown in Fig. 8.The peak between the first and second Rossiter modes is thesubharmonic of the third Rossiter mode. The peaks at the first, third,and subharmonic of the third Rossiter modes are likely primarily dueto EMI from the actuators contaminating the pressure signals ratherthan the apparent 15 dB resonance enhancement.When the flow is excited near the fourth Rossiter mode, the peak
tone reduction is significantly increased (to nearly 14 dB). Figure 3shows the presence of the fourth Rossiter mode in the baseline case.Excitation at this mode should therefore encourage modecompetition (as hypothesized) to a greater extent than at otherStrouhal numbers. A general trend of increasing peak tone reduction
Fig. 7 2-D excitation at the fourth Rossiter mode: a) actual, and b) offset by 20 dB for readability.
Fig. 8 Peak tone modification by 2-D excitation; positive peak tonemodification indicates resonance enhancement.
3350 WEBB AND SAMIMY
Dow
nloa
ded
by O
HIO
ST
AT
E U
NIV
ER
SIT
Y L
IBR
AR
IES
on M
arch
9, 2
018
| http
://ar
c.ai
aa.o
rg |
DO
I: 1
0.25
14/1
.J05
5720
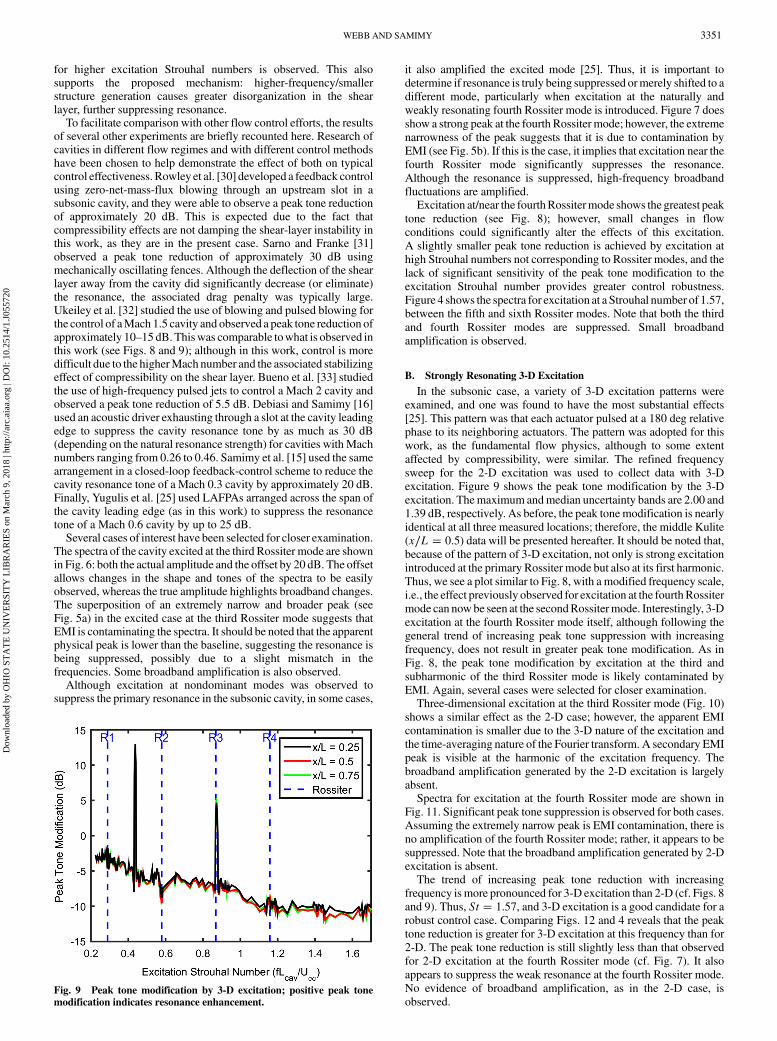
for higher excitation Strouhal numbers is observed. This alsosupports the proposed mechanism: higher-frequency/smallerstructure generation causes greater disorganization in the shearlayer, further suppressing resonance.To facilitate comparison with other flow control efforts, the results
of several other experiments are briefly recounted here. Research ofcavities in different flow regimes and with different control methodshave been chosen to help demonstrate the effect of both on typicalcontrol effectiveness. Rowley et al. [30] developed a feedback controlusing zero-net-mass-flux blowing through an upstream slot in asubsonic cavity, and they were able to observe a peak tone reductionof approximately 20 dB. This is expected due to the fact thatcompressibility effects are not damping the shear-layer instability inthis work, as they are in the present case. Sarno and Franke [31]observed a peak tone reduction of approximately 30 dB usingmechanically oscillating fences. Although the deflection of the shearlayer away from the cavity did significantly decrease (or eliminate)the resonance, the associated drag penalty was typically large.Ukeiley et al. [32] studied the use of blowing and pulsed blowing forthe control of aMach 1.5 cavity and observed a peak tone reduction ofapproximately 10–15 dB. Thiswas comparable towhat is observed inthis work (see Figs. 8 and 9); although in this work, control is moredifficult due to the higherMach number and the associated stabilizingeffect of compressibility on the shear layer. Bueno et al. [33] studiedthe use of high-frequency pulsed jets to control a Mach 2 cavity andobserved a peak tone reduction of 5.5 dB. Debiasi and Samimy [16]used an acoustic driver exhausting through a slot at the cavity leadingedge to suppress the cavity resonance tone by as much as 30 dB(depending on the natural resonance strength) for cavities with Machnumbers ranging from 0.26 to 0.46. Samimy et al. [15] used the samearrangement in a closed-loop feedback-control scheme to reduce thecavity resonance tone of a Mach 0.3 cavity by approximately 20 dB.Finally, Yugulis et al. [25] used LAFPAs arranged across the span ofthe cavity leading edge (as in this work) to suppress the resonancetone of a Mach 0.6 cavity by up to 25 dB.Several cases of interest have been selected for closer examination.
The spectra of the cavity excited at the third Rossiter mode are shownin Fig. 6: both the actual amplitude and the offset by 20 dB. The offsetallows changes in the shape and tones of the spectra to be easilyobserved, whereas the true amplitude highlights broadband changes.The superposition of an extremely narrow and broader peak (seeFig. 5a) in the excited case at the third Rossiter mode suggests thatEMI is contaminating the spectra. It should be noted that the apparentphysical peak is lower than the baseline, suggesting the resonance isbeing suppressed, possibly due to a slight mismatch in thefrequencies. Some broadband amplification is also observed.Although excitation at nondominant modes was observed to
suppress the primary resonance in the subsonic cavity, in some cases,
it also amplified the excited mode [25]. Thus, it is important todetermine if resonance is truly being suppressed ormerely shifted to adifferent mode, particularly when excitation at the naturally andweakly resonating fourth Rossiter mode is introduced. Figure 7 doesshow a strong peak at the fourth Rossiter mode; however, the extremenarrowness of the peak suggests that it is due to contamination byEMI (see Fig. 5b). If this is the case, it implies that excitation near thefourth Rossiter mode significantly suppresses the resonance.Although the resonance is suppressed, high-frequency broadbandfluctuations are amplified.Excitation at/near the fourthRossitermode shows the greatest peak
tone reduction (see Fig. 8); however, small changes in flowconditions could significantly alter the effects of this excitation.A slightly smaller peak tone reduction is achieved by excitation athigh Strouhal numbers not corresponding to Rossiter modes, and thelack of significant sensitivity of the peak tone modification to theexcitation Strouhal number provides greater control robustness.Figure 4 shows the spectra for excitation at a Strouhal number of 1.57,between the fifth and sixth Rossiter modes. Note that both the thirdand fourth Rossiter modes are suppressed. Small broadbandamplification is observed.
B. Strongly Resonating 3-D Excitation
In the subsonic case, a variety of 3-D excitation patterns wereexamined, and one was found to have the most substantial effects[25]. This pattern was that each actuator pulsed at a 180 deg relativephase to its neighboring actuators. The pattern was adopted for thiswork, as the fundamental flow physics, although to some extentaffected by compressibility, were similar. The refined frequencysweep for the 2-D excitation was used to collect data with 3-Dexcitation. Figure 9 shows the peak tone modification by the 3-Dexcitation. Themaximum andmedian uncertainty bands are 2.00 and1.39 dB, respectively. As before, the peak tone modification is nearlyidentical at all three measured locations; therefore, the middle Kulite(x∕L � 0.5) data will be presented hereafter. It should be noted that,because of the pattern of 3-D excitation, not only is strong excitationintroduced at the primary Rossiter mode but also at its first harmonic.Thus, we see a plot similar to Fig. 8, with a modified frequency scale,i.e., the effect previously observed for excitation at the fourthRossitermode can nowbe seen at the secondRossitermode. Interestingly, 3-Dexcitation at the fourth Rossiter mode itself, although following thegeneral trend of increasing peak tone suppression with increasingfrequency, does not result in greater peak tone modification. As inFig. 8, the peak tone modification by excitation at the third andsubharmonic of the third Rossiter mode is likely contaminated byEMI. Again, several cases were selected for closer examination.Three-dimensional excitation at the third Rossiter mode (Fig. 10)
shows a similar effect as the 2-D case; however, the apparent EMIcontamination is smaller due to the 3-D nature of the excitation andthe time-averaging nature of the Fourier transform. A secondary EMIpeak is visible at the harmonic of the excitation frequency. Thebroadband amplification generated by the 2-D excitation is largelyabsent.Spectra for excitation at the fourth Rossiter mode are shown in
Fig. 11. Significant peak tone suppression is observed for both cases.Assuming the extremely narrow peak is EMI contamination, there isno amplification of the fourth Rossiter mode; rather, it appears to besuppressed. Note that the broadband amplification generated by 2-Dexcitation is absent.The trend of increasing peak tone reduction with increasing
frequency ismore pronounced for 3-D excitation than 2-D (cf. Figs. 8and 9). Thus, St � 1.57, and 3-D excitation is a good candidate for arobust control case. Comparing Figs. 12 and 4 reveals that the peaktone reduction is greater for 3-D excitation at this frequency than for2-D. The peak tone reduction is still slightly less than that observedfor 2-D excitation at the fourth Rossiter mode (cf. Fig. 7). It alsoappears to suppress the weak resonance at the fourth Rossiter mode.No evidence of broadband amplification, as in the 2-D case, isobserved.
Fig. 9 Peak tone modification by 3-D excitation; positive peak tonemodification indicates resonance enhancement.
WEBB AND SAMIMY 3351
Dow
nloa
ded
by O
HIO
ST
AT
E U
NIV
ER
SIT
Y L
IBR
AR
IES
on M
arch
9, 2
018
| http
://ar
c.ai
aa.o
rg |
DO
I: 1
0.25
14/1
.J05
5720
C. Discussion of Strongly Resonating Results
Both Figs. 8 and 9 show significant sensitivity to the excitationfrequency near the Rossiter modes. The observed peak toneamplification is likely primarily due to EMI contamination. In thesubsonic work, the control authority of the LAFPAs was attributed tothe excitation of the Kelvin–Helmholtz instability and structureformation at various Strouhal numbers that promoted modecompetition [25]. These results supported that hypothesis. Furthersupport cams from a general trend of increasing the peak tonereduction with the increasing excitation frequency for both the 2-Dand (more pronounced) the 3-D excitations. Increasing the excitationfrequency should result in smaller and less coherent structures, thus
resulting in a weaker interaction with the cavity trailing edge, andtherefore a reduced chance of amplified Rossiter modes.Maximum peak tone reduction is achieved by 2-D excitation at the
fourth Rossitermode. This excitation also appears to not significantlyamplify the fourth Rossiter mode (see Fig. 5b). The disadvantage ofthis control is that it is sensitive to changes in the flow conditions/excitation Strouhal number. For practical applications, it is importantthat the effect of control remain relatively consistent, i.e., not stronglydependent on relatively small changes in flow conditions. It is shownthat 3-D excitation at St � 1.57 achieves a peak tone reductionsimilar to that achieved by the 2-D excitation at the fourth Rossitermode. The effect of control at this condition is relatively insensitive to
Fig. 10 3-D excitation at the third Rossiter mode: a) actual, and b) offset by 20 dB for readability.
Fig. 11 3-D excitation at the fourth Rossiter mode: a) actual, and b) offset by 20 dB for readability.
Fig. 12 3-D excitation at St � 1.57: a) actual, and b) offset by 20 dB for readability.
3352 WEBB AND SAMIMY
Dow
nloa
ded
by O
HIO
ST
AT
E U
NIV
ER
SIT
Y L
IBR
AR
IES
on M
arch
9, 2
018
| http
://ar
c.ai
aa.o
rg |
DO
I: 1
0.25
14/1
.J05
5720
small changes in flow conditions, providing much more consistentresults. Additionally, the 3-D high-frequency excitation alsosuppresses the fourth Rossiter mode, potentially further reducingentrainment. Finally, this is accomplished without the broadbandamplification observed for the 2-D (especially fourth Rossiter mode)excitation.In comparing the 2-D and 3-D resonance cases, it was consistently
observed that 3-D excitation generated less broadband amplificationthan 2-D. This supports the attribution of the broadband reduction tothe 3-D nature of excitation by the subsonic work [25,34]. Figure 13shows 2-D and 3-D excitation spectral differences. These figures arecontours of the excited spectra with the baseline subtracted andstacked vertically with the Strouhal number on the abscissa and withthe excitation Strouhal number on the ordinate. The 2-D excitationclearly generates broadband amplification (dark horizontal lines),particularly when the excitation Strouhal numbers are near the third,fourth, and fifth Rossiter modes. This broadband amplification isabsent for the 3-D excitation.
D. Weakly Resonating 2-D Excitation
In some applications, resonance enhancement may be desirable:for example, in a cavity for flameholding, to increase the entrainmentfor faster and better fuel/air mixing and flame stability. A weaklyresonating cavity geometry was therefore selected (see Fig. 2) inwhich to test the control authority of the LAFPAs to enhance theresonance.The baseline flow was documented by four Kulite pressure
transducer(s) (see Fig. 2). The physical locations of the Kulitesremained the same; however, due to the change in cavity length, noKulitewas in the same relative position (x∕L) within the cavity, as forthe strongly resonating case. The Kulite at x∕L � 0.65 (previously0.75) was similarly positioned. An examination of the effects of
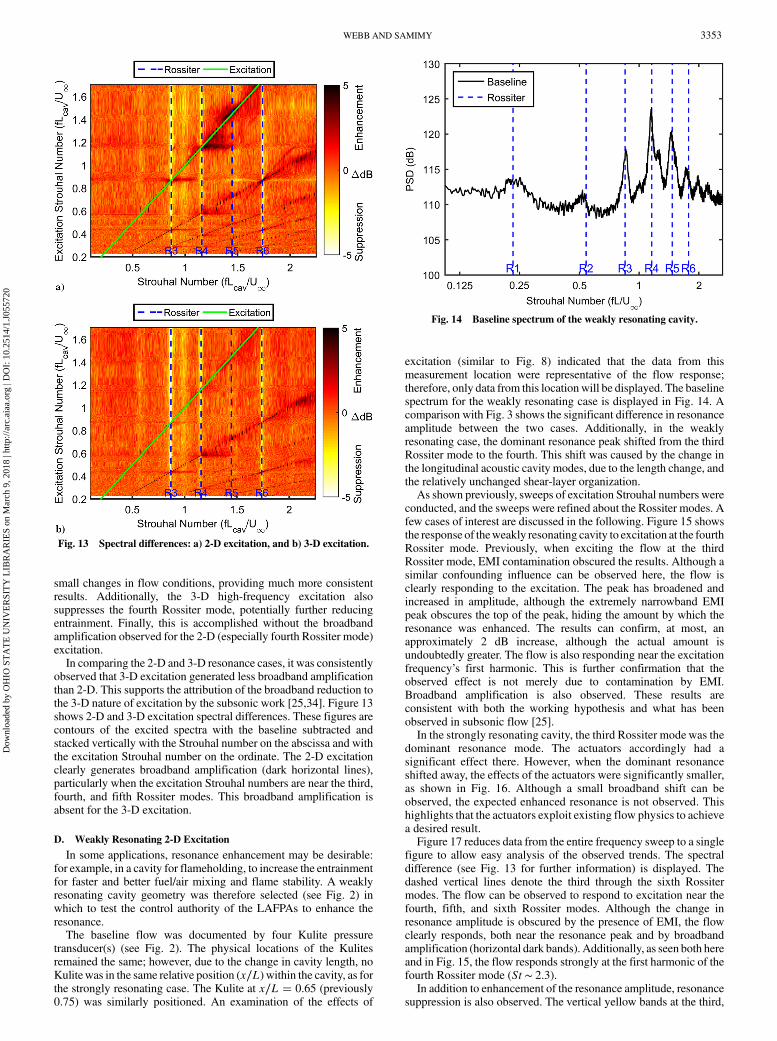
excitation (similar to Fig. 8) indicated that the data from thismeasurement location were representative of the flow response;therefore, only data from this locationwill be displayed. The baselinespectrum for the weakly resonating case is displayed in Fig. 14. Acomparison with Fig. 3 shows the significant difference in resonanceamplitude between the two cases. Additionally, in the weaklyresonating case, the dominant resonance peak shifted from the thirdRossiter mode to the fourth. This shift was caused by the change inthe longitudinal acoustic cavity modes, due to the length change, andthe relatively unchanged shear-layer organization.As shown previously, sweeps of excitation Strouhal numbers were
conducted, and the sweeps were refined about the Rossiter modes. Afew cases of interest are discussed in the following. Figure 15 showsthe response of theweakly resonating cavity to excitation at the fourthRossiter mode. Previously, when exciting the flow at the thirdRossiter mode, EMI contamination obscured the results. Although asimilar confounding influence can be observed here, the flow isclearly responding to the excitation. The peak has broadened andincreased in amplitude, although the extremely narrowband EMIpeak obscures the top of the peak, hiding the amount by which theresonance was enhanced. The results can confirm, at most, anapproximately 2 dB increase, although the actual amount isundoubtedly greater. The flow is also responding near the excitationfrequency’s first harmonic. This is further confirmation that theobserved effect is not merely due to contamination by EMI.Broadband amplification is also observed. These results areconsistent with both the working hypothesis and what has beenobserved in subsonic flow [25].In the strongly resonating cavity, the third Rossiter mode was the
dominant resonance mode. The actuators accordingly had asignificant effect there. However, when the dominant resonanceshifted away, the effects of the actuators were significantly smaller,as shown in Fig. 16. Although a small broadband shift can beobserved, the expected enhanced resonance is not observed. Thishighlights that the actuators exploit existing flow physics to achievea desired result.Figure 17 reduces data from the entire frequency sweep to a single
figure to allow easy analysis of the observed trends. The spectraldifference (see Fig. 13 for further information) is displayed. Thedashed vertical lines denote the third through the sixth Rossitermodes. The flow can be observed to respond to excitation near thefourth, fifth, and sixth Rossiter modes. Although the change inresonance amplitude is obscured by the presence of EMI, the flowclearly responds, both near the resonance peak and by broadbandamplification (horizontal dark bands). Additionally, as seen both hereand in Fig. 15, the flow responds strongly at the first harmonic of thefourth Rossiter mode (St ∼ 2.3).In addition to enhancement of the resonance amplitude, resonance
suppression is also observed. The vertical yellow bands at the third,
Fig. 13 Spectral differences: a) 2-D excitation, and b) 3-D excitation.
Fig. 14 Baseline spectrum of the weakly resonating cavity.
WEBB AND SAMIMY 3353
Dow
nloa
ded
by O
HIO
ST
AT
E U
NIV
ER
SIT
Y L
IBR
AR
IES
on M
arch
9, 2
018
| http
://ar
c.ai
aa.o
rg |
DO
I: 1
0.25
14/1
.J05
5720
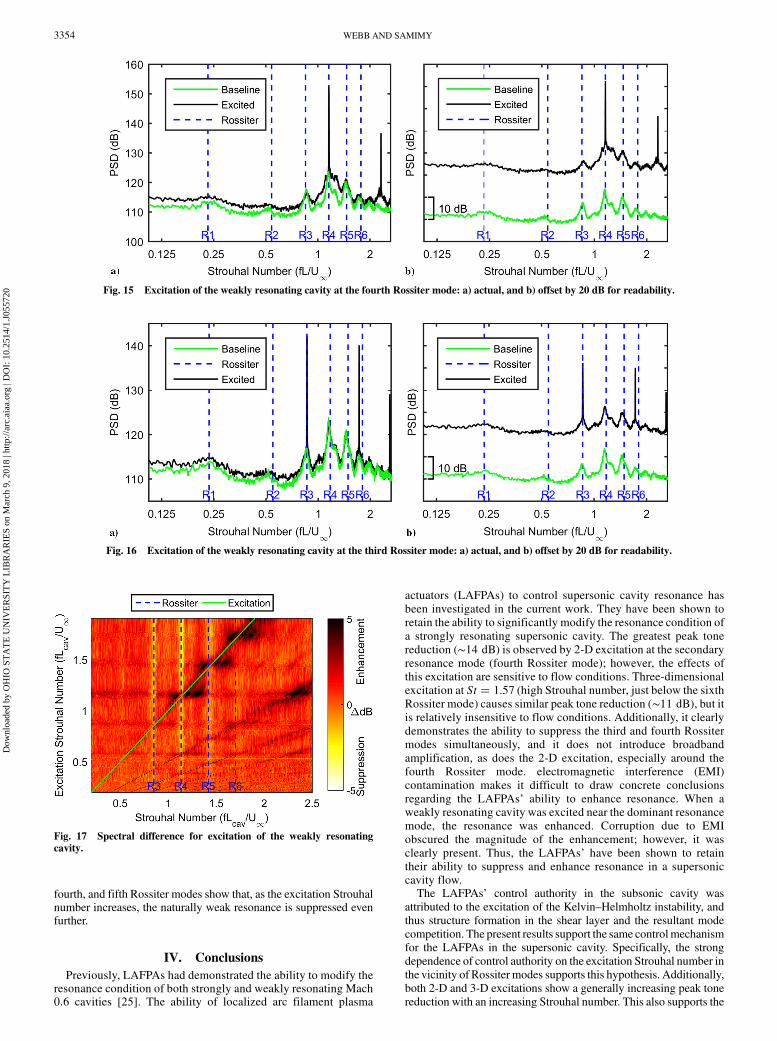
fourth, and fifth Rossiter modes show that, as the excitation Strouhalnumber increases, the naturally weak resonance is suppressed evenfurther.
IV. Conclusions
Previously, LAFPAs had demonstrated the ability to modify theresonance condition of both strongly and weakly resonating Mach0.6 cavities [25]. The ability of localized arc filament plasma
actuators (LAFPAs) to control supersonic cavity resonance hasbeen investigated in the current work. They have been shown toretain the ability to significantly modify the resonance condition ofa strongly resonating supersonic cavity. The greatest peak tonereduction (∼14 dB) is observed by 2-D excitation at the secondaryresonance mode (fourth Rossiter mode); however, the effects ofthis excitation are sensitive to flow conditions. Three-dimensionalexcitation at St � 1.57 (high Strouhal number, just below the sixthRossiter mode) causes similar peak tone reduction (∼11 dB), but itis relatively insensitive to flow conditions. Additionally, it clearlydemonstrates the ability to suppress the third and fourth Rossitermodes simultaneously, and it does not introduce broadbandamplification, as does the 2-D excitation, especially around thefourth Rossiter mode. electromagnetic interference (EMI)contamination makes it difficult to draw concrete conclusionsregarding the LAFPAs’ ability to enhance resonance. When aweakly resonating cavity was excited near the dominant resonancemode, the resonance was enhanced. Corruption due to EMIobscured the magnitude of the enhancement; however, it wasclearly present. Thus, the LAFPAs’ have been shown to retaintheir ability to suppress and enhance resonance in a supersoniccavity flow.The LAFPAs’ control authority in the subsonic cavity was
attributed to the excitation of the Kelvin–Helmholtz instability, andthus structure formation in the shear layer and the resultant modecompetition. The present results support the same controlmechanismfor the LAFPAs in the supersonic cavity. Specifically, the strongdependence of control authority on the excitation Strouhal number inthe vicinity of Rossiter modes supports this hypothesis. Additionally,both 2-D and 3-D excitations show a generally increasing peak tonereduction with an increasing Strouhal number. This also supports the
Fig. 16 Excitation of the weakly resonating cavity at the third Rossiter mode: a) actual, and b) offset by 20 dB for readability.
Fig. 17 Spectral difference for excitation of the weakly resonatingcavity.
Fig. 15 Excitation of the weakly resonating cavity at the fourth Rossiter mode: a) actual, and b) offset by 20 dB for readability.
3354 WEBB AND SAMIMY
Dow
nloa
ded
by O
HIO
ST
AT
E U
NIV
ER
SIT
Y L
IBR
AR
IES
on M
arch
9, 2
018
| http
://ar
c.ai
aa.o
rg |
DO
I: 1
0.25
14/1
.J05
5720
proposed control mechanism because promoting smaller structuresand greater shear-layer disorganization should lead to furthersuppressed resonance.
Acknowledgments
The support of this research by the U.S. Air Force ResearchLaboratory (Jeffrey Donbar) through a Phase II Small BusinessInnovation Research grant contract awarded to Innovative ScientificSolutions, Inc. (Jim Crafton) is gratefully acknowledged.
References
[1] Rockwell, D., andNaudascher, E., “Review-Self-SustainingOscillationof Flow Past Cavities,” Journal of Fluids Engineering, Vol. 100, No. 2,1978, pp. 152–165.doi:10.1115/1.3448624
[2] Rowley, C., and Williams, D., “Dynamics and Control of High-Reynolds-Number Flow over Open Cavities,” Annual Review of Fluid
Mechanics, Vol. 38, No. 1, 2006, pp. 251–276.doi:10.1146/annurev.fluid.38.050304.092057
[3] Beresh, S., Wagner, J., and Pruett, B., “Supersonic Flow over a Finite-Width Rectangular Cavity,” 51st AIAA Aerospace Sciences Meeting,AIAA Paper 2013-0389, 2013.
[4] Rokita, T., Elimelech, Y., Arieli, R., Levy, Y., and Greenberg, J.,“Experimental Characterization of Turbulent Subsonic Transitional-Open Cavity Flow,” Experiments in Fluids, Vol. 57, No. 60, 2016,pp. 1–16.
[5] Immer, M., Allegrini, J., and Carmeliet, J., “Time-Resolved and Time-Averaged Stereo-PIV Measurements of a Unit-Ratio Cavity,”Experiments in Fluids, Vol. 57, No. 101, 2016, pp. 1–18.
[6] McGregor, O., and White, R., “Drag of Rectangular Cavities inSupersonic and Transonic Flow Including the Effects of CavityResonance,” AIAA Journal, Vol. 8, No. 11, 1970, pp. 1959–1964.doi:10.2514/3.6032
[7] Gharib,M., and Roshko, A., “The Effect of FlowOscillations on CavityDrag,” Journal of Fluid Mechanics, Vol. 177, April 1987, pp. 501–530.doi:10.1017/S002211208700106X
[8] Cattafesta, L., Song, Q., Williams, D., Rowley, C., and Alvi, F., “ActiveControl of Flow-Induced Cavity Oscillations,” Progress in Aerospace
Sciences, Vol. 44, Nos. 7–8, 2008, pp. 479–502.doi:10.1016/j.paerosci.2008.07.002
[9] Beresh, S., Wagner, J., Demauro, E., Henfling, J., and Spillers, R.,“Resonance Characteristics of Transonic Flow over a RectangularCavityUsingPulse-Burst PIV,” 54thAIAAAerospace SciencesMeeting,AIAA Paper 2016-1344, 2016.
[10] Rossiter, J., “Wind-Tunnel Experiments on the Flow over RectangularCavities at Subsonic and Transonic Speeds,” Aeronautical ResearchCouncil Reports and Memoranda,” The Aeronautical Research CouncilTechnical Memorandum No. 754, Teddington, England, 1964.
[11] Wagner, J. L., Casper, K. M., Beresh, S. J., Pruett, B., Spillers, R., andHenfling, J., “Relationship BetweenAcoustic Tones and Flow Structurein Transonic Rectangular Cavity Flow,”AIAA Paper 2015-2937, 2015.
[12] Zhang,Y.,Arora,N., Sun,Y., Cattafesta, L.N., Taira,K., andUkeiley, L.S., “Three-Dimensional Control via Mass Injection for Suppression ofCavity Oscillations,” 45th AIAA Fluid Dynamics Conference, AIAAPaper 2015-3219, 2015.
[13] Ashley, J., Szmuk, M., Clemens, N., Akella, M., Gogineni, S., andDonbar, J., “Closed-LoopControl of ShockLocation inMach 1.8DirectConnect Wind Tunnel,” 7th AIAA Flow Control Conference, AIAAPaper 2014-2935, 2014.
[14] Thangamani, V., Knowles, K., and Saddington, A., “An Investigation ofPassive Control Methods for a Large Scale Cavity Model in HighSubsonic Flow,” 19th AIAA/CEAS Aeroacoustics Conference, AIAAPaper 2013-2049, 2013.
[15] Samimy,M., Debiasi, M., Caraballo, E., Serrani, A., Yuan, X., Little, J.,and Myatt, J. H., “Feedback Control of Subsonic Cavity Flows UsingReduced-Order Models,” Journal of Fluid Mechanics, Vol. 579,May 2007, pp. 315–346.doi:10.1017/S0022112007005204
[16] Debiasi, M., and Samimy, M., “Logic-Based Active Control ofSubsonic Cavity Flow Resonance,” AIAA Journal, Vol. 42, No. 9,2004, pp. 1901–1909.doi:10.2514/1.4799
[17] Ben-Yakar, A., and Hanson, R., “Cavity Flame-Holders for Ignition andFlame Stabilization in Scramjets: An Overview,” Journal of Propulsion
and Power, Vol. 17, No. 4, 2001, pp. 869–877.doi:10.2514/2.5818
[18] Gruber, M., Donbar, J., Carter, C., and Hsu, K.-Y., “Mixing andCombustion Studies Using Cavity-Based Flameholders in aSupersonic Flow,” Journal of Propulsion and Power, Vol. 20, No. 5,2004, pp. 769–778.doi:10.2514/1.5360
[19] Denman, Z., Brieschenk, S., Veeraragavan, A.,Wheatley, V., and Smart,M., “Experimental Design of a Cavity Flameholder in a Mach 8 Shape-Transitioning Scramjet,” 19th AIAA International Space Planes and
Hypersonic Systems and Technologies Conference, AIAA Paper 2014-2953, 2014.
[20] Webb,N., and Samimy,M., “Shock-TrappingCapability of aCavity in aSupersonic Flow,” 46th AIAA Plasmadynamics and Lasers Conference,AIAA Paper 2015-2345, 2015.
[21] Samimy, M., Kim, J.-H., Kastner, J., Adamovich, I., and Utkin, Y.,“Active Control of High-Speed and High-Reynolds-Number Jets UsingPlasma Actuators,” Journal of Fluid Mechanics, Vol. 578, No. 1, 2007,pp. 305–330.doi:10.1017/S0022112007004867
[22] Samimy, M., Kim, J.-H., Kastner, J., Adamovich, I., and Utkin, Y.,“Active Control of a Mach 0.9 Jet for Noise Mitigation Using PlasmaActuators,” AIAA Journal, Vol. 45, No. 4, 2007, pp. 890–901.doi:10.2514/1.27499
[23] Samimy, M., Kim, J.-H., Kearney-Fischer, M., and Sinha, A.,“Acoustic and Flow Fields of an Excited High Reynolds NumberAxisymmetric Supersonic Jet,” Journal of Fluid Mechanics, Vol. 656,Aug. 2010, pp. 507–529.doi:10.1017/S0022112010001357
[24] Utkin, Y., Keshav, S., Kim, J.-H., Kastner, J., Adamovich, I., andSamimy,M., “Development and Use of Localized Arc Filament PlasmaActuators for High-Speed FlowControl,” Journal of PhysicsD: AppliedPhysics, Vol. 40, No. 3, 2007, pp. 685–694.doi:10.1088/0022-3727/40/3/S06
[25] Yugulis, K., Hansford, S., Gregory, J., and Samimy, M., “Control ofHigh Subsonic Cavity Flow Using Plasma Actuators,” AIAA Journal,Vol. 52, No. 7, 2014, pp. 1542–1554.doi:10.2514/1.J052668
[26] Yamouni, S., Sipp, D., and Jacquin, L., “Interaction Between FeedbackAeroacoustic andAcoustic ResonanceMechanisms in a Cavity Flow: AGlobal Stability Analysis,” Journal of Fluid Mechanics, Vol. 717,Feb. 2013, pp. 134–165.doi:10.1017/jfm.2012.563
[27] Michalke, A., “On Spatially Growing Disturbances in an InviscidShear Layer,” Journal of Fluid Mechanics, Vol. 23, No. 3, 1965,pp. 521–544.doi:10.1017/S0022112065001520
[28] Little, J., Debiasi,M., Caraballo, E., and Samimy,M., “Effects of Open-Loop and Closed-Loop Control on Subsonic Cavity Flows,” Physics ofFluids, Vol. 19, No. 6, 2007, Paper 065104.doi:10.1063/1.2740302
[29] Hahn, C., Kearney-Fischer, M., and Samimy, M., “On FactorsInfluencing Arc Filament Plasma Actuator Performance in Control ofHigh Speed Jets,” Experiments in Fluids, Vol. 51, No. 6, 2011,pp. 1591–1603 ,
[30] Rowley, C.,Williams, D., Colonius, T., Murray, R., andMacmynowski,D., “LinearModels for Control of Cavity FlowOscillations,” Journal ofFluid Mechanics, Vol. 547, Jan. 2006, pp. 317–330.doi:10.1017/S0022112005007299
[31] Sarno, R., and Franke, M., “Suppression of Flow-Induced PressureOscillations in Cavities,” Journal of Aircraft, Vol. 31, No. 1, 1994,pp. 90–96.doi:10.2514/3.46459
[32] Ukeiley, L., Sheehan, M., Coiffet, F., Alvi, F., Arunajatesan, S., andJansen, B., “Control of Pressure Loads in Complex CavityConfigurations,” 45th AIAA, Aerospace Sciences Meeting and Exhibit,AIAA Paper 2007-1238, 2007, p. 19.
[33] Bueno, P., Ünalmis, O., and Clemens, N., “The Effects of UpstreamMass Injection on a Mach 2 Cavity Flow,” 40th Aerospace Sciences
Meeting, AIAA Paper 2002-0663, 2002.[34] Nayyer, P., Barakos, G., Badcock, K., and Kirkham, D., “Analysis and
Control of Transonic Cavity Flow Using DES and LES,” 35th AIAA
Fluid Dynamics Conference, AIAA Paper 2005-5267, 2005.
L. UkeileyAssociate Editor
WEBB AND SAMIMY 3355
Dow
nloa
ded
by O
HIO
ST
AT
E U
NIV
ER
SIT
Y L
IBR
AR
IES
on M
arch
9, 2
018
| http
://ar
c.ai
aa.o
rg |
DO
I: 1
0.25
14/1
.J05
5720