Embed Size (px)
Citation preview
In-Depth Survey Report
Control Technology for Respirable Crystalline Silica Exposure During Pavement Milling Using a Wirtgen Milling Machine Equipped with a Vacuum Cutting System
Conducted with assistance from the Silica/Milling-Machines Partnership, affiliated with and coordinated through The National Asphalt Pavement Association (NAPA)
Duane R. Hammond, M.S., P.E. Stanley A. Shulman, Ph.D.
Division of Applied Research and Technology Engineering and Physical Hazards Branch EPHB Report No. 282-23a
The report was originally published in May 2013. A new version was published in May 2015 with updated statistics to match the procedures used in NIOSH Publication No. 2015-105. The findings and conclusions remain unchanged.
DEPARTMENT OF HEALTH AND HUMAN SERVICES Centers for Disease Control and Prevention National Institute for Occupational Safety and Health
EPHB Report No. 282-23a
Site Surveyed:
Site 1: State Highway 92 from County Highway G to Mount Horeb, Wisconsin
Site 2: Parking lot of the Eclipse Center in Beloit, Wisconsin
Site 3: State Highway 50 and 75th Street (East of I-94), Kenosha, Wisconsin
Site 4: Sherwood Dr, Jerod Ct, Town Hall Rd, Custer Ln, Bryn Mawr Ct, Shady Ln, Shore Crest Dr, Martin Dr, St Thomas Dr, Menomonee Falls, WI
NAICS Code: 237310 (Highway, Street, and Bridge Construction)
Survey Dates: Site 1: June 26-28, Site 2: June 29-30, Site 3: July 11-13, Site 4: July 30 – August 1, 2012
Surveys Conducted By: Duane Hammond, Jevon Lambright NIOSH/DART
Employer Representatives Contacted
Tony Bodway (Chairman), Payne & Dolan
Mark Zuber, Payne & Dolan
R. Gary Fore, National Asphalt Pavement Association (NAPA) consultant
Donald Elisburg, NAPA consultant
Scott Lyons, Wirtgen America
Analytical Work Performed by: Bureau Veritas North America
Page ii
EPHB Report No. 282-23a
Disclaimer
Mention of any company or product does not constitute endorsement by NIOSH. In addition, citations to Web sites external to NIOSH do not constitute NIOSH endorsement of the sponsoring organizations or their programs or products. Furthermore, NIOSH is not responsible for the content of these Web sites. All Web addresses referenced in this document were accessible as of the publication date.
Page iii
EPHB Report No. 282-23a
Table of Contents
Abstract ............................................................................................ v
Introduction ...................................................................................... 1
Background for Control Technology Studies ........................................ 1
Background for this Study ................................................................ 1
Occupational Exposure Limits and Health Effects .................................... 3
Crystalline Silica Exposure Limits ....................................................... 4
Methodology...................................................................................... 5
Description of Evaluated Sites ........................................................... 6
Control Technology ............................................................................ 8
Description of tested dust-emission control configuration ..................... 8
Results ............................................................................................. 8
Weather Observations ...................................................................... 9
Discussion ......................................................................................... 9
Conclusions and Recommendations .................................................... 10
Acknowledgements .......................................................................... 10
References ...................................................................................... 10
Statistical Appendix .......................................................................... 20
Page iv
EPHB Report No. 282-23a
Abstract
From June through August 2012, National Institute for Occupational Safety and Health (NIOSH) researchers and the Silica/Milling-Machines Partnership coordinated by the National Asphalt Pavement Association (NAPA) conducted field testing of a vacuum cutting system (VCS) on a Wirtgen W 210i cold milling machine. The tests included 11 days of air sampling at four different highway construction sites in Wisconsin. At each site, full-shift personal breathing zone sampling for respirable crystalline silica was conducted for the operator and ground man during the course of normal employee work activities.
The data were analyzed two ways, assuming the data were either normally distributed or lognormally distributed. For small sample sizes it is difficult to distinguish between the two distributions; therefore, results for both are presented. For each distribution a 95% upper confidence limit for the arithmetic mean respirable crystalline silica exposure for each occupation was calculated. For the normal distribution analysis, the arithmetic mean respirable crystalline silica exposure for the operator was 0.0072 mg/m3 with an upper 95% confidence limit of 0.011 mg/m3. The arithmetic mean respirable crystalline silica exposure for the ground man was 0.0066 mg/m3 with an upper 95% confidence limit of 0.0087 mg/m3. For the lognormal distribution analysis, the geometric mean respirable crystalline silica exposure for the operator was 0.0062 mg/m3 with an upper 95% confidence limit for the arithmetic mean of 0.028 mg/m3. The geometric mean respirable crystalline silica exposure for the ground man was 0.0061 mg/m3 with an upper 95% confidence limit for the arithmetic mean of 0.014 mg/m3.
All 22 full-shift personal breathing zone samples collected from the operator and ground man were below the NIOSH recommended exposure limit (REL) of 0.05 mg/m3 for respirable crystalline silica. Based on the results of this study, NIOSH researchers recommend that Wirtgen should consider making the VCS system a standard feature on all Wirtgen half-lane and larger milling machines. NIOSH researchers also recommend that other manufacturers of half-lane and larger cold milling machines should consider implementing local exhaust ventilation as a control for silica exposures.
Page v
EPHB Report No. 282-23a
Introduction
Background for Control Technology Studies
The National Institute for Occupational Safety and Health (NIOSH), Centers for Disease Control and Prevention (CDC) is the primary Federal agency engaged in occupational safety and health research. Located in the Department of Health and Human Services, it was established by the Occupational Safety and Health Act of 1970. This legislation mandated NIOSH to conduct a number of research and education programs separate from the standard setting and enforcement functions carried out by the Occupational Safety and Health Administration (OSHA) in the Department of Labor. An important area of NIOSH research deals with methods for controlling occupational exposure to potential chemical and physical hazards. The Engineering and Physical Hazards Branch (EPHB) of the Division of Applied Research and Technology has been given the lead within NIOSH to study the engineering aspects of health hazard prevention and control.
Since 1976, EPHB has conducted a number of assessments of health hazard control technology on the basis of industry, common industrial process, or specific control techniques. Examples of these completed studies include the foundry industry; various chemical manufacturing or processing operations; spray painting; and the recirculation of exhaust air. The objective of each of these studies has been to document and evaluate effective control techniques for potential health hazards in the industry or process of interest, and to create a more general awareness of the need for or availability of an effective system of hazard control measures.
These studies involve a number of steps or phases. Initially, a series of walk-through surveys is conducted to select plants or processes with effective and potentially transferable control concept techniques. Next, in-depth surveys are conducted to determine both the control parameters and the effectiveness of these controls. The reports from these in-depth surveys are then used as a basis for preparing technical reports and journal articles on effective hazard control measures. Ultimately, the information from these research activities builds the data base of publicly available information on hazard control techniques for use by health professionals who are responsible for preventing occupational illness and injury.
Background for this Study
NIOSH is studying the effectiveness of dust-emission controls during asphalt pavement-milling operations. Pavement-milling is the process of removing the road surface for recycling. The aim of this project is to determine if the dust emission-control systems installed on new pavement-milling machines and operated according to the manufacturers’ recommendations are adequate to control worker exposures to respirable dust, especially that containing crystalline silica, a long-recognized occupational respiratory hazard. Chronic over-exposures to such dust may result in silicosis, a chronic progressive lung disease that eventually may be disabling or even fatal, and an increased risk of lung cancer [NIOSH 2002]. The long term goal of this project is to adequately control worker exposures to
Page 1
EPHB Report No. 282-23a
respirable dust and crystalline silica by providing data to support the development of best practice guidelines for engineering controls on asphalt pavement milling machines.
Many construction tasks have been associated with overexposure to crystalline silica [Rappaport et al. 2003]. Among these tasks are tuck pointing, concrete sawing, concrete grinding, and abrasive blasting [NIOSH 2000; Thorpe et al. 1999; Akbar-Khanzadeh and Brillhart 2002; Glindmeyer and Hammad 1988]. Road milling has also been shown to result in overexposures to respirable crystalline silica [Linch 2002; Rappaport et al. 2003; Valiante et al. 2004]. However, all three of those road-milling studies are limited because they do not provide enough information about the operating parameters and engineering controls present on the milling machines to determine if the overexposures were due to a lack of effective controls or poor work practices. The current study is helping to fill that knowledge gap.
A variety of machinery are employed in asphalt pavement recycling, including cold-planers, heater-planers, cold-millers, and heater-scarifiers [Public Works 1995]. Cold-milling, which uses a toothed, rotating cutter drum to grind and remove the pavement to be recycled, is primarily used to remove surface deterioration on both petroleum-asphalt aggregate and Portland-cement concrete road surfaces [Public Works 1995]. The milling machines used in cold-milling are the focus of this study.
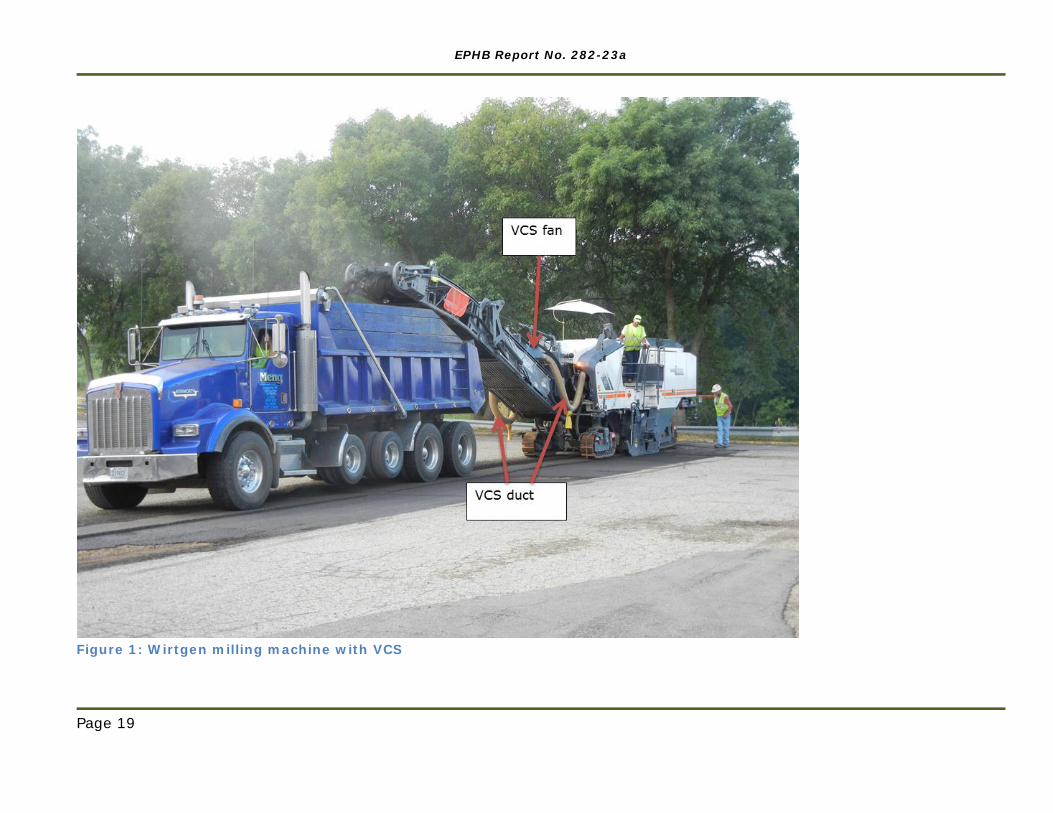
The large cold-milling machine evaluated during this study was a Wirtgen W 210i with dual diesel engines capable of producing 534 kilowatt (kW) (716 horsepower (HP)) that comply with emissions standard EC Stage 3b / US Tier 4i. This machine had a 2000 mm (79-inch) wide cutter drum. Most half-lane cold-milling machines have a spinning cutter drum with teeth to remove pavement from the road surface and transfer it onto a primary conveyor. From the primary conveyor, the reclaimed pavement is transferred to a secondary conveyor and into a dump truck. All production milling machines are also equipped with water-spray systems to cool the cutting teeth and suppress dust. The evaluated Wirtgen W210i cold-milling machine shown in Figure 1 also had a vacuum cutting system (VCS) added to create negative pressure in the drum housing and primary conveyor channel evacuating air with any remaining airborne dust particles through the secondary conveyor channel away from the operators.
This field study evaluated the performance of the VCS using full-shift, time-weighted average personal breathing zone (PBZ) air sampling for respirable dust and respirable crystalline silica exposures of the milling machine operator and ground man during multiple days at each of four sites. The study was conducted during the course of normal employee work activities on typical highway construction milling jobs.
This study was facilitated by the Silica/Milling-Machines Partnership, which is affiliated with and coordinated through the National Asphalt Pavement Association (NAPA). The partnership includes NAPA, the Association of Equipment Manufacturers (AEM), the manufacturers of almost all pavement-milling machines sold in the U.S., numerous construction contractors, the International Union of Operating Engineers (IOUE), the
Page 2
EPHB Report No. 282-23a
Laborers’ International Union of North America (LIUNA), NIOSH, and other interested parties.
Occupational Exposure Limits and Health Effects
As a guide to the evaluation of hazardous workplace exposures, NIOSH investigators use mandatory and recommended Occupational Exposure Limits (OELs) when evaluating chemical, physical, and biological agents in the workplace. Generally, OELs suggest levels of exposure to which most workers may be exposed up to 10 hours per day, 40 hours per week for a working lifetime without experiencing adverse health effects. It is, however, important to note that not all workers will be protected from adverse health effects even though their exposures are maintained below these levels. A small percentage may experience adverse health effects because of individual susceptibility, a pre-existing medical condition, and/or hypersensitivity (allergy). In addition, some hazardous substances may act in combination with other workplace exposures, the general environment, or with medications or personal habits of the worker to produce health effects even if the occupational exposures are controlled at the level set by the exposure limit. Combined effects are often not considered in the OEL. Also, some substances are absorbed by direct contact with the skin and mucous membranes, and thus can increase the overall exposure. Finally, OELs may change over the years as new information on the toxic effects of an agent become available.
Most OELs are expressed as a TWA exposure. A TWA exposure refers to the average airborne concentration of a substance during a normal 8- to 10-hour workday. Some substances have a recommended Short Term Exposure Limit (STEL) or ceiling values which are intended to supplement the TWA where there are recognized toxic effects from higher exposures over the short-term.
In the U.S., OELs have been established by Federal agencies, professional organizations, state and local governments, and other entities. The U.S. Department of Labor OSHA Permissible Exposure Limits (PELs) [29 CFR 1910.1000 2003a] are occupational exposure limits that are legally enforceable in covered workplaces under the Occupational Safety and Health Act. NIOSH recommendations are based on a critical review of the scientific and technical information available on the prevalence of health effects, the existence of safety and health risks, and the adequacy of methods to identify and control hazards [NIOSH 1992]. They have been developed using a weight of evidence approach and formal peer review process. Other OELs that are commonly used and cited in the U.S. include the Threshold Limit Values (TLVs®) recommended by American Conference of Governmental Industrial Hygienists (ACGIH®), a professional organization [ACGIH® 2010]. ACGIH® TLVs® are considered voluntary guidelines for use by industrial hygienists and others trained in this discipline “to assist in the control of health hazards.” Workplace Environmental Exposure Levels™ (WEELs) are recommended OELs developed by the American Industrial Hygiene Association® (AIHA®), another professional organization. WEELs have been established for some chemicals “when no other legal or authoritative limits exist” [AIHA® 2007].
Page 3
EPHB Report No. 282-23a
OSHA requires an employer to furnish employees a place of employment that is free from recognized hazards that are causing or are likely to cause death or serious physical harm [Occupational Safety and Health Act of 1970, Public Law 91–596, sec. 5(a)(1)]. Thus, employers are required to comply with OSHA PELs. Some hazardous agents do not have PELs, however, and for others, the PELs do not reflect the most current health-based information. Thus, NIOSH investigators encourage employers to consider the other OELs in making risk assessment and risk management decisions to best protect the health of their employees. NIOSH investigators also encourage the use of the traditional hierarchy of controls approach to eliminating or minimizing identified workplace hazards. This includes, in preferential order, the use of: (1) substitution or elimination of the hazardous agent, (2) engineering controls (e.g., local exhaust ventilation, process enclosure, dilution ventilation) (3) administrative controls (e.g., limiting time of exposure, employee training, work practice changes, medical surveillance), and (4) personal protective equipment (e.g., respiratory protection, gloves, eye protection, hearing protection).
Crystalline Silica Exposure Limits
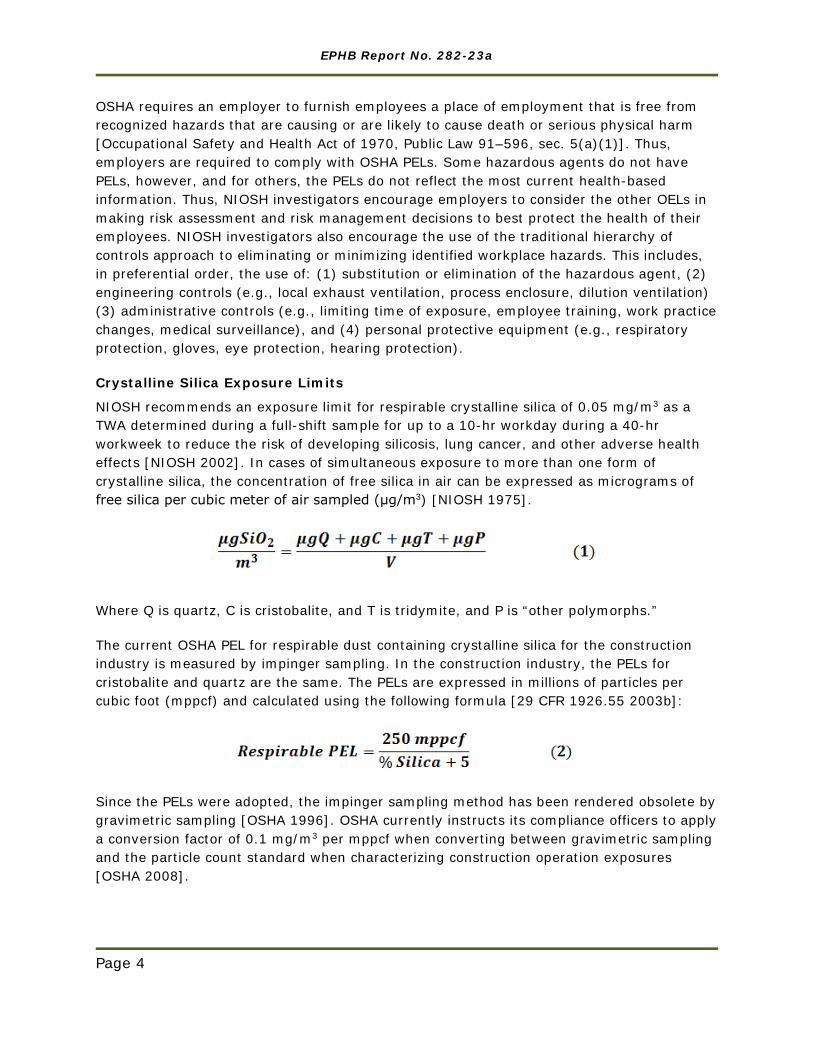
NIOSH recommends an exposure limit for respirable crystalline silica of 0.05 mg/m3 as a TWA determined during a full-shift sample for up to a 10-hr workday during a 40-hr workweek to reduce the risk of developing silicosis, lung cancer, and other adverse health effects [NIOSH 2002]. In cases of simultaneous exposure to more than one form of crystalline silica, the concentration of free silica in air can be expressed as micrograms of free silica per cubic meter of air sampled (μg/m3) [NIOSH 1975].
Where Q is quartz, C is cristobalite, and T is tridymite, and P is “other polymorphs.”
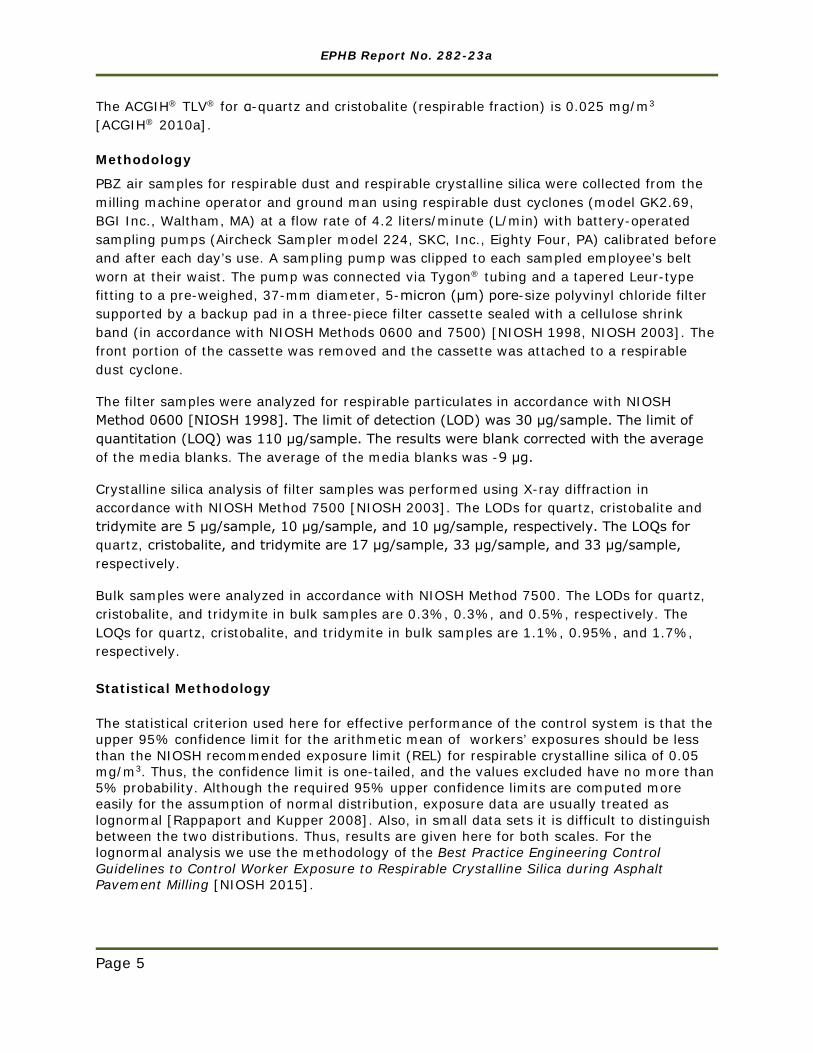
The current OSHA PEL for respirable dust containing crystalline silica for the construction industry is measured by impinger sampling. In the construction industry, the PELs for cristobalite and quartz are the same. The PELs are expressed in millions of particles per cubic foot (mppcf) and calculated using the following formula [29 CFR 1926.55 2003b]:
Since the PELs were adopted, the impinger sampling method has been rendered obsolete by gravimetric sampling [OSHA 1996]. OSHA currently instructs its compliance officers to apply a conversion factor of 0.1 mg/m3 per mppcf when converting between gravimetric sampling and the particle count standard when characterizing construction operation exposures [OSHA 2008].
Page 4
EPHB Report No. 282-23a
The ACGIH® TLV® for α-quartz and cristobalite (respirable fraction) is 0.025 mg/m3 [ACGIH® 2010a].
Methodology
PBZ air samples for respirable dust and respirable crystalline silica were collected from the milling machine operator and ground man using respirable dust cyclones (model GK2.69, BGI Inc., Waltham, MA) at a flow rate of 4.2 liters/minute (L/min) with battery-operated sampling pumps (Aircheck Sampler model 224, SKC, Inc., Eighty Four, PA) calibrated before and after each day’s use. A sampling pump was clipped to each sampled employee’s belt worn at their waist. The pump was connected via Tygon® tubing and a tapered Leur-type fitting to a pre-weighed, 37-mm diameter, 5-micron (μm) pore-size polyvinyl chloride filter supported by a backup pad in a three-piece filter cassette sealed with a cellulose shrink band (in accordance with NIOSH Methods 0600 and 7500) [NIOSH 1998, NIOSH 2003]. The front portion of the cassette was removed and the cassette was attached to a respirable dust cyclone.
The filter samples were analyzed for respirable particulates in accordance with NIOSH Method 0600 [NIOSH 1998]. The limit of detection (LOD) was 30 μg/sample. The limit of quantitation (LOQ) was 110 μg/sample. The results were blank corrected with the average of the media blanks. The average of the media blanks was -9 μg.
Crystalline silica analysis of filter samples was performed using X-ray diffraction in accordance with NIOSH Method 7500 [NIOSH 2003]. The LODs for quartz, cristobalite and tridymite are 5 μg/sample, 10 μg/sample, and 10 μg/sample, respectively. The LOQs for quartz, cristobalite, and tridymite are 17 μg/sample, 33 μg/sample, and 33 μg/sample, respectively.
Bulk samples were analyzed in accordance with NIOSH Method 7500. The LODs for quartz, cristobalite, and tridymite in bulk samples are 0.3%, 0.3%, and 0.5%, respectively. The LOQs for quartz, cristobalite, and tridymite in bulk samples are 1.1%, 0.95%, and 1.7%, respectively.
Statistical Methodology
The statistical criterion used here for effective performance of the control system is that the upper 95% confidence limit for the arithmetic mean of workers’ exposures should be less than the NIOSH recommended exposure limit (REL) for respirable crystalline silica of 0.05 mg/m3. Thus, the confidence limit is one-tailed, and the values excluded have no more than 5% probability. Although the required 95% upper confidence limits are computed more easily for the assumption of normal distribution, exposure data are usually treated as lognormal [Rappaport and Kupper 2008]. Also, in small data sets it is difficult to distinguish between the two distributions. Thus, results are given here for both scales. For the lognormal analysis we use the methodology of the Best Practice Engineering Control Guidelines to Control Worker Exposure to Respirable Crystalline Silica during Asphalt Pavement Milling [NIOSH 2015].
Page 5
EPHB Report No. 282-23a
There were measurements on two workers (one operator and one ground man) for each day at each site. Although the resulting PBZ air sampling data have three variance components (between sites, between days at sites, and within days at sites), the lognormal methodology used here is intended for analysis of each occupation separately. The result is that the between days at site and the within days at sites variance components are combined. The separate analyses by occupation are done for both scales – normal and lognormal. Additional information is provided in the Statistical Appendix.
Description of Evaluated Sites NIOSH researchers conducted full-shift PBZ air sampling for respirable crystalline silica from the operator and ground man of a Wirtgen W210i milling machine. The sampling was conducted for eleven days at four highway construction sites during the course of normal employee work activities of milling asphalt pavement. The following is a description of what was evaluated at each site:
Site 1: State Highway 92 from County Highway G to Mount Horeb, Wisconsin
Full-shift PBZ air sampling for respirable crystalline silica exposures was conducted for three days of asphalt milling on state highway 92 near Mount Horeb, WI. The section of highway being milled was only open to local traffic and located in a rural area with limited other dust sources on site other than typical dump truck traffic and the broom machine from the milling clean-up crew. On all three days, the milling machine removed approximately 2-inches of asphalt pavement at an average speed of approximately 40 feet per minute (fpm) for mostly full-width cuts. Milling was nearly continuous during the sampling time on all three days. The first two days of milling in Mount Horeb were typical full-shift days of milling but the third day was only a half-day of milling. On day 2, the air sampling pump worn by the ground man faulted several time but still operated for more than 8-hours.
Site 2: Parking lot of the Eclipse Center in Beloit, Wisconsin
Full-shift PBZ air sampling for respirable crystalline silica exposure was conducted for two days of asphalt milling at the parking lot of the Eclipse Center in Beloit, WI. The parking lot being milled was closed to traffic with limited other dust sources on site other than dust from typical dump truck traffic and dust generated from the broom machine operated by the milling clean-up crew. The milling machine removed approximately 1.5-inches of asphalt pavement on both days with an average speed of approximately 60 fpm on day 1 and 40 fpm on day 2 with nearly all full-width cuts. Milling was conducted during the entire sampling period, and there were no unexpected delays or stops. However, due to the nature of parking lot milling, the machine travelled back the same distance milled after each pass instead of turning the machine around.
Site 3: State Highway 50 and 75th Street (East of I-94), Kenosha, Wisconsin
Full-shift PBZ air sampling for respirable crystalline silica exposure was conducted for three nights of asphalt milling on State Highway 50 in Kenosha, WI. The section of highway being milled was open to traffic with lane closures for the lanes being milled. Site 3 was in an
Page 6
EPHB Report No. 282-23a
urban area with numerous other sources of dust near the evaluated milling machine. Throughout each night shift, a substantial amount of dust was generated by heavy traffic in the adjacent milled lanes. Another milling machine was also milling the same highway at varying distances from the evaluated machine. Additional dust was also generated from truck traffic and dust generated from the broom machine operated by the milling clean-up crew. The evaluated milling machine removed approximately 2-inches of asphalt pavement on all three nights. The first two nights of milling consisted of mostly full-width milling of the mainline highway at 40-50 fpm. The third night of milling consisted primarily of turn lanes and intersections with 20% or less time spent travelling back to complete additional passes. Milling was conducted during the entire sampling period and there were no unexpected delays or stops. All three nights were considered typical full-shift nights of milling on a highway construction site.
Site 4: Sherwood Dr, Jerod Ct, Town Hall Rd, Custer Ln, Bryn Mawr Ct, Shady Ln, Shore Crest Dr, Martin Dr, St Thomas Dr, Menomonee Falls, WI
Full-shift PBZ air sampling for respirable crystalline silica exposure was conducted for three days of asphalt milling on multiple streets in Menomonee Falls, WI. The first day of milling in Menomonee Falls included milling on Brian Court and Sherwood Drive, between Tamarack Trail and Hunters Ridge Circle as well as Jarod Court off of Hunters Ridge Circle. There was very little traffic and no other dust sources other than typical truck traffic and dust generated from the broom machine operated by the milling clean-up crew. The job was a complete removal of asphalt pavement ranging from 5 to 7-inches with an average milling speed of 40 fpm.
The second day of milling in Menomonee Falls, WI included milling on Town Hall Road, Custer Lane, and Bryn Mawr Court. The majority of the day was spent milling on Town Hall Road and Custer Lane which was in front of a hospital with lane closures and constant heavy traffic at low speed. The VCS was turned off for approximately 45 minutes relying solely on the water-spray controls for the period of time when the crew was milling into the wind heading east on Custer Lane. The milling crew conducted a full-depth removal on all streets which was typically about 4-inches with some areas requiring substantially more removal especially on Bryn Mawr Court.
The third day of milling in Menomonee Falls, WI included a 2-inch removal on Shady Lane, a 3-inch removal on Shore Crest Drive, and a 4-inch to full-depth removal on Martin Drive, and Saint Thomas Drive. It took approximately 30 minutes to move the crew from Shady Lane to Shore Crest Drive and another 45 minutes to move the crew from Shore Crest Drive to Martin Drive. The rest of the day was continuous milling of mostly full-width cuts. Milling speeds ranged from 40 to 60 fpm on most streets with the exception of 90 fpm on Martin Drive. All days were considered typical full-shift days of milling on highway construction sites.
Page 7
EPHB Report No. 282-23a
Control Technology
Description of tested dust-emission control configuration
The equipment evaluated at all four sites was a Wirtgen W 210i cold milling machine with dual diesel engines capable of producing 534 kilowatt (kW) (716 horsepower (HP)) that comply with emissions standard EC Stage 3b / US Tier 4i. The evaluated Wirtgen W 210i had a 2000 mm (79-inch) wide cutter drum with a local exhaust ventilation system referred to as a VCS. The VCS was designed to create a negative pressure in the milling drum housing using a fan and flexible hose system and to exhaust the air away from any workers. The focus of this study was to determine if the VCS was effective at protecting workers from respirable crystalline silica exposures during the course of normal employee work activities on typical highway construction milling jobs. Individual system details of the VCS may be released after testing is conducted with all participating manufacturers.
Results
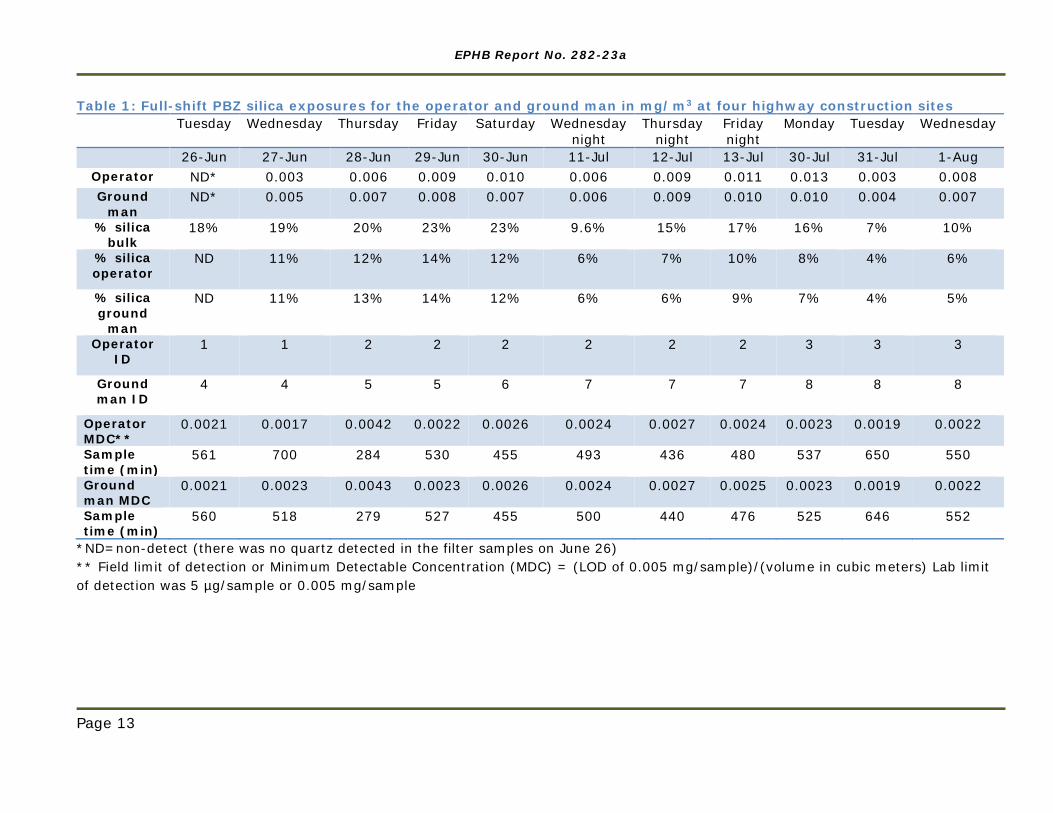
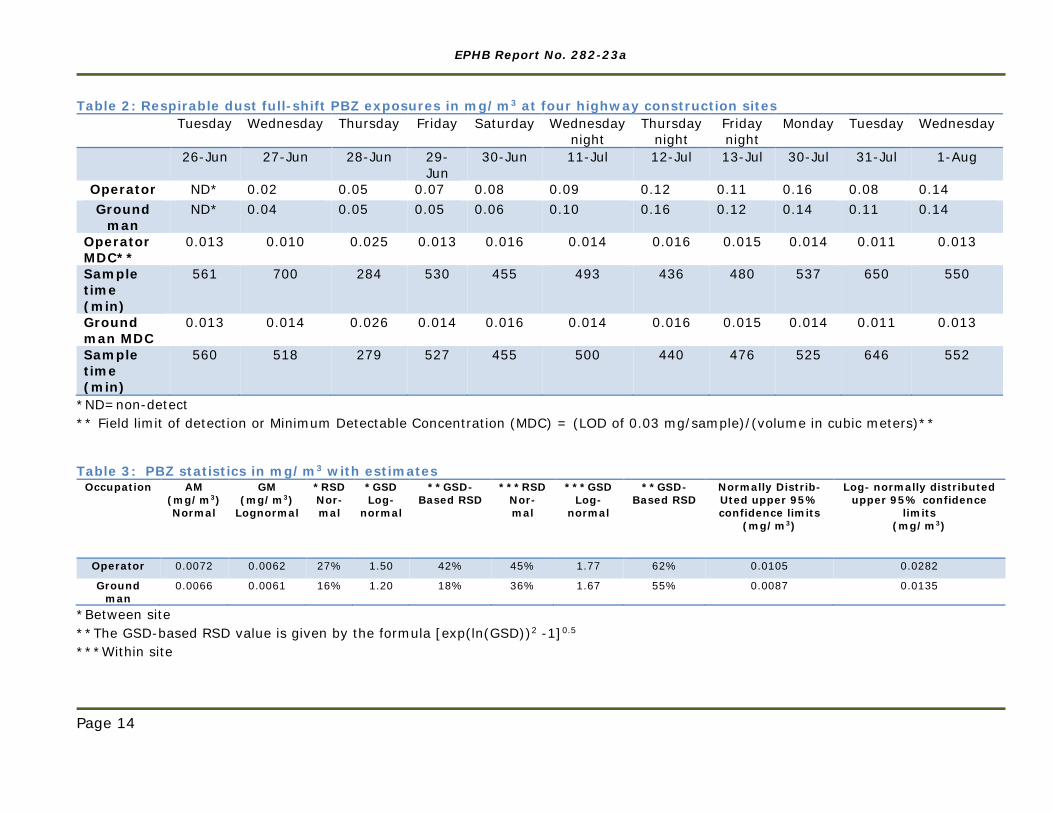
Full-shift PBZ respirable crystalline silica exposures during the eleven days of sampling at four sites for the operator and ground man are shown in Table 1 along with the silica content in the bulk and filter samples for each day. Table 2 shows the full-shift PBZ respirable dust exposures for the operator and the ground man during the eleven days of sampling at the four sites.
At the four sites studied, the percent bulk silica content in the roads being milled ranged from 7 and 23%, with an average of 16%. Silica content in the PBZ filter air samples for the operator and ground man using the asphalt milling machine evaluated here ranged from below the limit of detection to 14%.
The 22 full-shift PBZ air sampling results for the operator and ground man ranged from below the limit of detection (on the first sampling day) to 0.013 mg/m3. Two measurements on the first day of the study were less than the limit of detection (LOD). For the statistical analysis these were replaced by LOD/sqrt(2) [Hornung and Reed 1990]. There were three different operators and five different ground men during the 11 days of air sampling. These different individuals are identified by a numerical id in Table 1. However, there is no indication that worker differences were major sources of variability, based on the statistical analysis. See the Statistical Appendix at the end of this document for discussion.
Because the log of the geometric standard deviation (GSD) is comparable to the relative standard deviation (RSD), it makes sense to compare these quantities as shown in Table 3. The RSD derived from the GSD is the “GSD-based RSD.” The between site GSD-based RSD is 18% for the ground man, compared to 16% for the RSD. The between site GSD-based RSD is 42% for the operator compared to 27% for the operator RSD. The within site GSD-based RSD is 55%, for the ground man, compared to 36% RSD. The within site GSD-based RSD is 62% for the operator compared to 45% for the RSD. Thus, the log scale analysis gives larger variability.
Table 3 also shows the means and upper 95% confidence limits with the data treated as normally and lognormally distributed. From the normal scale analysis, the arithmetic mean
Page 8
EPHB Report No. 282-23a
respirable crystalline silica exposure for the operator was 0.0072 mg/m3 with an upper 95% confidence limit for the arithmetic mean of 0.011 mg/m3. The arithmetic mean respirable crystalline silica exposure for the ground man was 0.0066 mg/m3 with an upper 95% confidence limit for the arithmetic mean of 0.0087 mg/m3. From the lognormal scale analysis, the geometric mean respirable crystalline silica exposure for the operator was 0.0062 mg/m3 with an upper 95% confidence limit for the arithmetic mean of 0.028 mg/m3. The geometric mean respirable crystalline silica exposure for the ground man was 0.0061 mg/m3 with an upper 95% confidence limit for the arithmetic mean of 0.014 mg/m3.
For either approach (normal or lognormal), with at least 95% confidence for each occupation, the mean respirable crystalline silica exposure for the operator and ground man were each less than the NIOSH REL of 0.05 mg/m3. Thus, the REL may be considered to be met for the population of sites from which those studies come.
Weather Observations
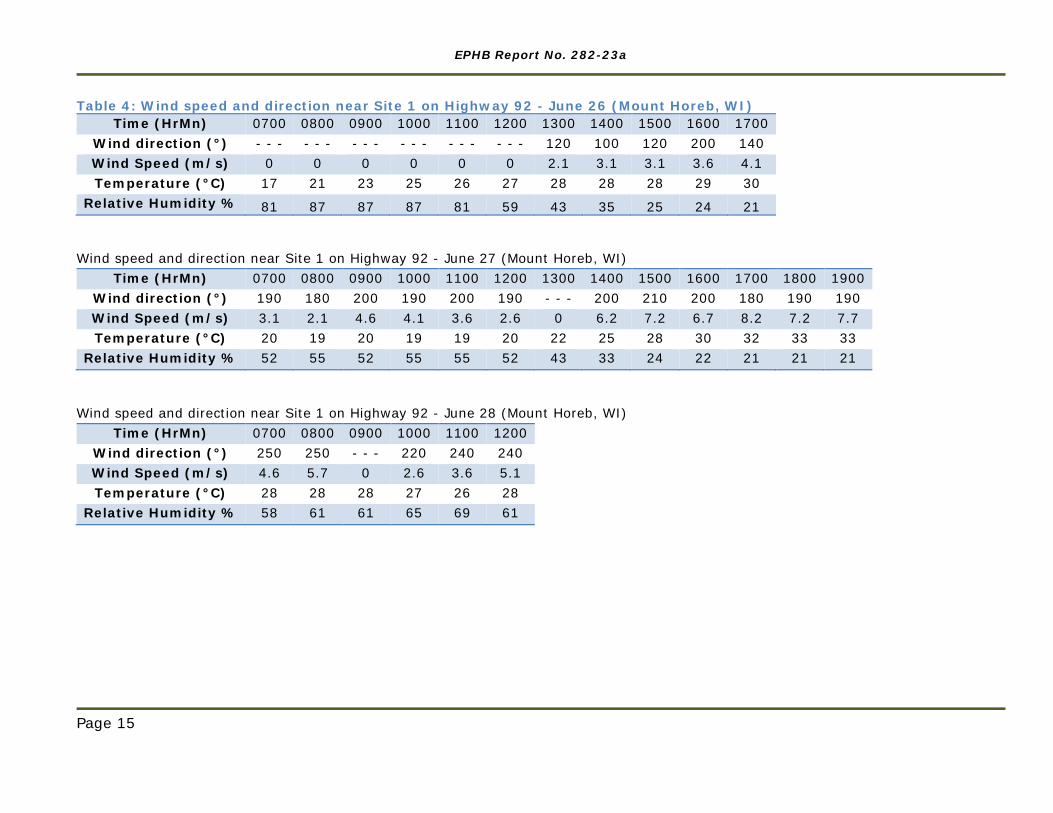
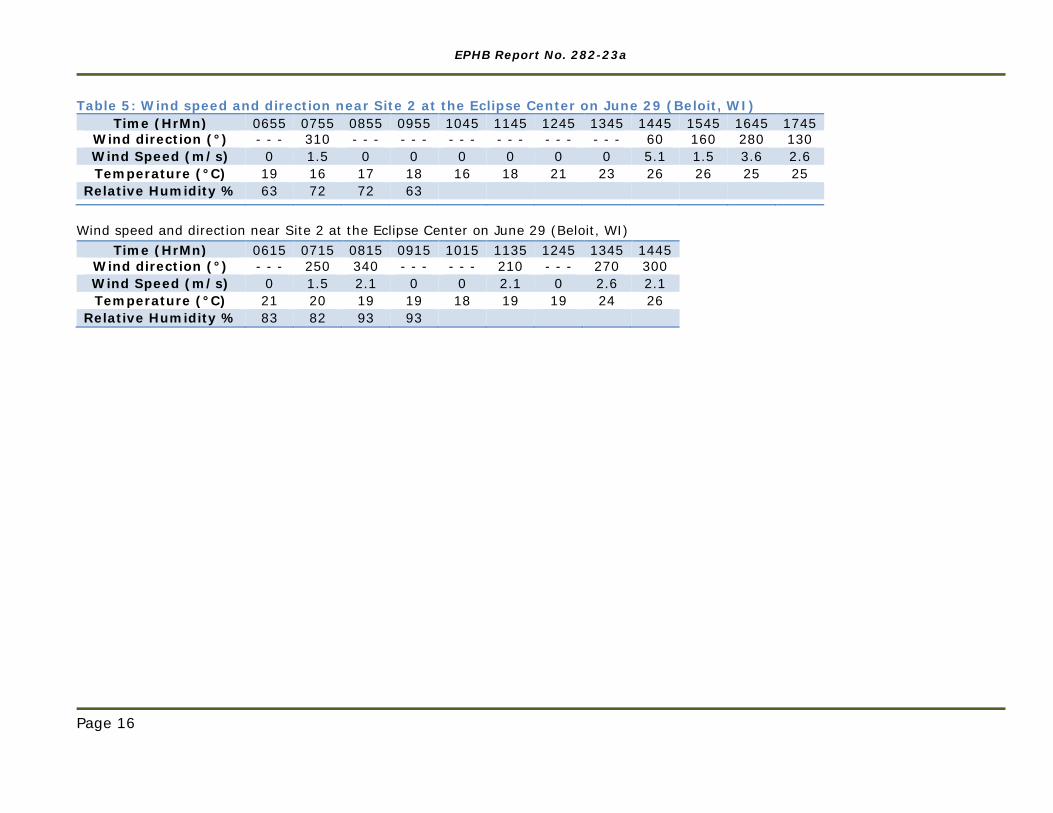
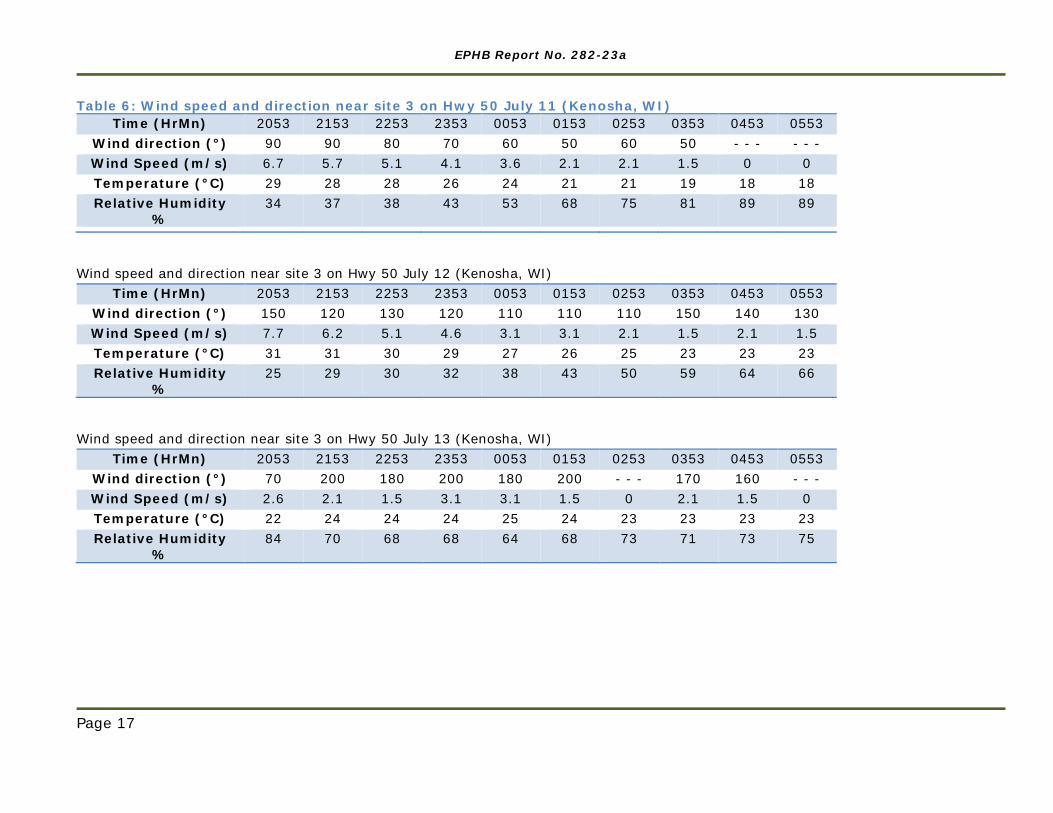
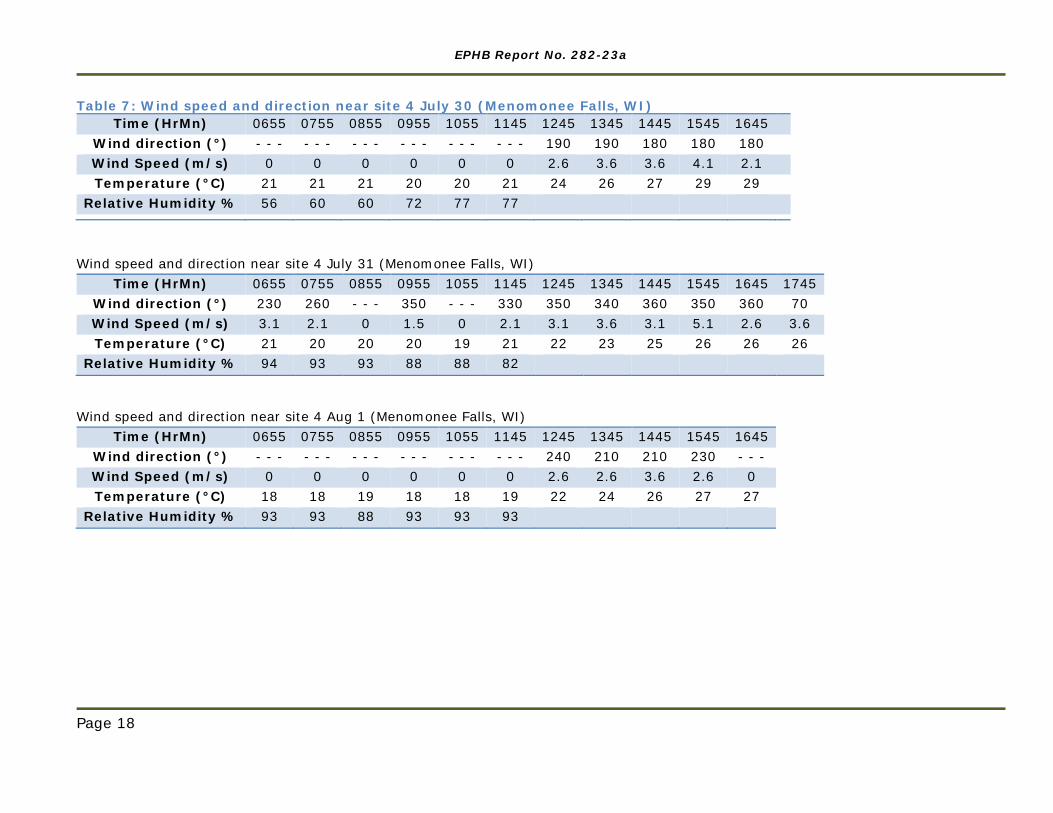
Table 4 through Table 7 show weather observations from the National Oceanic and Atmospheric Administration (NOAA) fixed weather station nearest to each evaluated site. Wind direction is reported as the angle, measured in a clockwise direction, between true north and the direction from which the wind is blowing. Wind speed is reported as the rate of horizontal travel of air past a fixed point in meters per second (m/s). The average wind speed during the evaluation at each site was 3.4, 1.6, 2.8, and 1.7 m/s for sites 1 through 4, respectively. Hourly temperatures during testing at the four evaluated sites ranged from 16°C (61°F) to 33°C (92°F). Relative humidity during testing at the four evaluated sites ranged from 21% to 94%.
Discussion
The evaluated VCS captured dust generated in the drum housing and released the dust at the top of the secondary conveyor at a location away from the workers. During the eleven days of air sampling, the VCS was very effective at reducing exposures to levels well below regulatory and recommended exposure limits for respirable dust and respirable crystalline silica. However, there were times during the evaluation when the crew was milling into the wind and the dust released at the outlet of the VCS was blown back toward the operator and ground man, prompting the operator to turn off the VCS until wind conditions changed. Turning off the VCS when milling into the wind worked well for the limited amount of time that unfavorable wind conditions were present during the eleven days of sampling. It is possible that future milling jobs could require longer periods of milling into the wind. It would be beneficial to equip the VCS with an option to control dust in situations that may require milling into the wind.
Page 9
EPHB Report No. 282-23a
Conclusions and Recommendations
The evaluated Wirtgen W 210i (with VCS) has the potential to significantly reduce worker exposure to respirable crystalline silica during pavement milling operations. All 22 full-shift PBZ air samples collected from the operator and ground man using the evaluated Wirtgen W 210i (with VCS) were below the NIOSH REL for respirable crystalline silica. Based on the results of this study, NIOSH researchers recommend that Wirtgen should consider making the VCS system a standard feature on all Wirtgen half-lane and larger milling machines. NIOSH researchers also recommend that other manufacturers of half-lane and larger cold milling machines should consider implementing dust controls that include local exhaust ventilation as a control for silica exposures.
Acknowledgements
The authors would like to thank management and staff at Payne & Dolan and Wirtgen America for their gracious hospitality and assistance during this testing. Their commitment to the development and testing of engineering controls to reduce occupational exposures to respirable crystalline silica is important to protect worker safety and health.
References
ACGIH® [2010]. 2010 TLVs® and BEIs®: threshold limit values for chemical substances and physical agents and biological exposure indices. Cincinnati, OH: American Conference of Governmental Industrial Hygienists.
AIHA® [2007]. 2007 Emergency Response Planning Guidelines (ERPG) & Workplace Environmental Exposure Levels (WEEL) Handbook. Fairfax, VA: American Industrial Hygiene Association.
CFR [2003a]. 29 CFR 1910.1000. Code of Federal Regulations. Washington, DC: U.S. Government Printing Office, Office of the Federal Register.
CFR [2003b]. 29 CFR 1926.55. Code of Federal Regulations. Washington, DC: U.S. Government Printing Office, Office of the Federal Register.
CFR [2003c]. 29CFR 1910.134. Code of Federal Regulations. Washington, DC: U.S. Government Printing Office, Office of the Federal Register.
Glindmeyer HW, Hammad YY [1988]. Contributing factors to sandblasters' silicosis: inadequate respiratory protection equipment and standards. J Occup Med 30(12):917–921.
Hornung R, Reed L. "Estimation of average concentration in the presence of nondetectable values." Appl Occup Environ Hyg 5(1):46–51 (1990).
Page 10
EPHB Report No. 282-23a
Khanzadeh-Akbar F, Brillhart RL [2001]. Respirable Crystalline Silica Dust Exposure During Concrete Finishing (Grinding) Using Hand-held grinders in the Construction Industry. Ann. Occup. Hyg., Vol. 46, No. 3, pp. 341-346, 2001.
Linch KD [2002]. Respirable concrete dust – silicosis hazard in the construction industry. Appl Occup Environ Hyg 17(3):209–221.
NIOSH [1975]. Criteria for a recommended standard – Occupational exposure to crystalline silica. Cincinnati, OH: U.S. Department of Health, Education, and Welfare, Public Health Service, Center for Disease Control, National Institute for Occupational Safety and Health, HEW Publication No. (NIOSH) 75-120.
NIOSH [1992]. Recommendations for occupational safety and health: compendium of policy documents and statements. Cincinnati, OH: U.S. Department of Health and Human Services, Public Health Service, Centers for Disease Control and Prevention, National Institute for Occupational Safety and Health, DHHS (NIOSH) Publication No. 92-100.
NIOSH [1998]. Particulates not otherwise regulated, respirable. NIOSH Manual of Analytical Methods (NMAM®), 4th ed., 2nd Supplement, Schlecht, P.C. & O'Connor, P.F. Eds. Cincinnati, OH: U.S. Department of Health and Human Services, Public Health Service, Centers for Disease Control and Prevention, National Institute for Occupational Safety and Health, DHHS (NIOSH) Publication No. 98-119.
NIOSH [2000]. Respirable crystalline silica exposures during tuck pointing. Cincinnati, OH: U.S. Department of Health and Human Services, Public Health Service, Centers for Disease Control and Prevention, National Institute for Occupational Safety and Health. DHHS (NIOSH) Publication No. 2000-113.
NIOSH [2002]. NIOSH Hazard Review: Health Effects of Occupational Exposure to Respirable Crystalline Silica. Cincinnati, OH: U.S. Department of Health and Human Services, Public Health Service, Centers for Disease Control and Prevention, National Institute for Occupational Safety and Health, DHHS (NIOSH) Publication No. 2002-129.
NIOSH [2003]. Silica, crystalline, by XRD (filter redeposition). NIOSH Manual of Analytical Methods (NMAM®), 4th ed., 3rd Supplement, Schlecht, P.C. & O'Connor, P.F. Eds. Cincinnati, OH: U.S. Department of Health and Human Services, Public Health Service, Centers for Disease Control and Prevention, National Institute for Occupational Safety and Health, DHHS (NIOSH) Publication No. 2003-154.
NIOSH [2015]. Best Practice Engineering Control Guidelines to Control Worker Exposure to Respirable Crystalline Silica during Asphalt Pavement Milling. Cincinnati, OH: U.S. Department of Health and Human Services, Centers for Disease Control and Prevention, National Institute for Occupational Safety and Health, DHHS (NIOSH) Publication No. 2015–105.DHHS (NIOSH) Publication No. 2015–105.
Page 11
EPHB Report No. 282-23a
OSHA [1996]. Memorandum for regional administrators from: Joseph A. Dear. Subject: special emphasis program (SEP) for silicosis. May 2nd, 1996. Appendix F: Permissible Exposure Limits for Construction and Maritime.
OSHA [2008]. National emphasis program - Crystalline silica. CPL 03-00-007. 01/24/2008. Appendix E: Conversion factor for silica PELs in construction and maritime. Retrieved September 29, 2010 from
http://www.osha.gov/pls/oshaweb/owadisp.show_document?p_table=DIRECTIVES&p_id=3790#e
Public Works [1995]. Pavement recycling. Public Works 126: April 15, 1995.
Rappaport SM, Goldberg M, Susi P, Herrick RF [2003]. Excessive exposure to silica in the U.S. construction industry. Ann Occup Hyg 47(2):111–122.
Rappaport, S.M. and Kupper, L.L. Quantitative Exposure Assessment 2008. pp. 27 and 31.
SAS Institute, Inc. (2004) SAS/STAT 9.1 User’s Guide. Cary, NC: SAS Institute, Inc.
Thorpe A, Ritchie AS, Gibson MJ, Brown RC [1999]. Measurements of the effectiveness of dust control on cut-off saws used in the construction industry. Ann Occup Hyg 43(7):443–456.
Valiante DJ, Schill DP, Rosenman KD, Socie E [2004]. Highway repair: a new silicosis threat. Am J Public Health 94(5):876–880.
Page 12
EPHB Report No. 282-23a
Table 1: Full-shift PBZ silica exposures for the operator and ground man in mg/m3 at four highway construction sites
Tuesday Wednesday Thursday Friday Saturday Wednesday night
Thursday night
Friday night
Monday Tuesday Wednesday
26-Jun 27-Jun 28-Jun 29-Jun 30-Jun 11-Jul 12-Jul 13-Jul 30-Jul 31-Jul 1-Aug Operator ND* 0.003 0.006 0.009 0.010 0.006 0.009 0.011 0.013 0.003 0.008 Ground
man ND* 0.005 0.007 0.008 0.007 0.006 0.009 0.010 0.010 0.004 0.007
% silica bulk
18% 19% 20% 23% 23% 9.6% 15% 17% 16% 7% 10%
% silica operator
ND 11% 12% 14% 12% 6% 7% 10% 8% 4% 6%
% silica ground
man
ND 11% 13% 14% 12% 6% 6% 9% 7% 4% 5%
Operator ID
1 1 2 2 2 2 2 2 3 3 3
Ground man ID
4 4 5 5 6 7 7 7 8 8 8
Operator MDC**
0.0021 0.0017 0.0042 0.0022 0.0026 0.0024 0.0027 0.0024 0.0023 0.0019 0.0022
Sample time (min)
561 700 284 530 455 493 436 480 537 650 550
Ground man MDC
0.0021 0.0023 0.0043 0.0023 0.0026 0.0024 0.0027 0.0025 0.0023 0.0019 0.0022
Sample time (min)
560 518 279 527 455 500 440 476 525 646 552
*ND=non-detect (there was no quartz detected in the filter samples on June 26) ** Field limit of detection or Minimum Detectable Concentration (MDC) = (LOD of 0.005 mg/sample)/(volume in cubic meters) Lab limit of detection was 5 µg/sample or 0.005 mg/sample
Page 13
EPHB Report No. 282-23a
Table 2: Respirable dust full-shift PBZ exposures in mg/m3 at four highway construction sites
Tuesday Wednesday Thursday Friday Saturday Wednesday night
Thursday night
Friday night
Monday Tuesday Wednesday
26-Jun 27-Jun 28-Jun 29-Jun
30-Jun 11-Jul 12-Jul 13-Jul 30-Jul 31-Jul 1-Aug
Operator ND* 0.02 0.05 0.07 0.08 0.09 0.12 0.11 0.16 0.08 0.14 Ground
man ND* 0.04 0.05 0.05 0.06 0.10 0.16 0.12 0.14 0.11 0.14
Operator MDC**
0.013 0.010 0.025 0.013 0.016 0.014 0.016 0.015 0.014 0.011 0.013
Sample time (min)
561 700 284 530 455 493 436 480 537 650 550
Ground man MDC
0.013 0.014 0.026 0.014 0.016 0.014 0.016 0.015 0.014 0.011 0.013
Sample time (min)
560 518 279 527 455 500 440 476 525 646 552
*ND=non-detect ** Field limit of detection or Minimum Detectable Concentration (MDC) = (LOD of 0.03 mg/sample)/(volume in cubic meters)**
Table 3: PBZ statistics in mg/m3 with estimates
Occupation AM (mg/m3) Normal
GM (mg/m3)
Lognormal
*RSD Nor- mal
*GSD Log-
normal
**GSD-Based RSD
***RSD Nor-mal
***GSD Log-
normal
**GSD-Based RSD
Normally Distrib- Uted upper 95% confidence limits
(mg/m3)
Log- normally distributed upper 95% confidence
limits (mg/m3)
Operator 0.0072 0.0062 27% 1.50 42% 45% 1.77 62% 0.0105 0.0282
Ground man
0.0066 0.0061 16% 1.20 18% 36% 1.67 55% 0.0087 0.0135
*Between site **The GSD-based RSD value is given by the formula [exp(ln(GSD))2 -1]0.5 ***Within site
Page 14
EPHB Report No. 282-23a
Table 4: Wind speed and direction near Site 1 on Highway 92 - June 26 (Mount Horeb, WI)
Time (HrMn) 0700 0800 0900 1000 1100 1200 1300 1400 1500 1600 1700 Wind direction (°) - - - - - - - - - - - - - - - - - - 120 100 120 200 140 Wind Speed (m/s) 0 0 0 0 0 0 2.1 3.1 3.1 3.6 4.1 Temperature (°C) 17 21 23 25 26 27 28 28 28 29 30
Relative Humidity % 81 87 87 87 81 59 43 35 25 24 21
Wind speed and direction near Site 1 on Highway 92 - June 27 (Mount Horeb, WI) Time (HrMn) 0700 0800 0900 1000 1100 1200 1300 1400 1500 1600 1700 1800 1900
Wind direction (°) 190 180 200 190 200 190 - - - 200 210 200 180 190 190 Wind Speed (m/s) 3.1 2.1 4.6 4.1 3.6 2.6 0 6.2 7.2 6.7 8.2 7.2 7.7 Temperature (°C) 20 19 20 19 19 20 22 25 28 30 32 33 33
Relative Humidity % 52 55 52 55 55 52 43 33 24 22 21 21 21
Wind speed and direction near Site 1 on Highway 92 - June 28 (Mount Horeb, WI) Time (HrMn) 0700 0800 0900 1000 1100 1200
Wind direction (°) 250 250 - - - 220 240 240 Wind Speed (m/s) 4.6 5.7 0 2.6 3.6 5.1 Temperature (°C) 28 28 28 27 26 28
Relative Humidity % 58 61 61 65 69 61
Page 15
EPHB Report No. 282-23a
Table 5: Wind speed and direction near Site 2 at the Eclipse Center on June 29 (Beloit, WI)
Time (HrMn) 0655 0755 0855 0955 1045 1145 1245 1345 1445 1545 1645 1745 Wind direction (°) - - - 310 - - - - - - - - - - - - - - - - - - 60 160 280 130 Wind Speed (m/s) 0 1.5 0 0 0 0 0 0 5.1 1.5 3.6 2.6 Temperature (°C) 19 16 17 18 16 18 21 23 26 26 25 25
Relative Humidity % 63 72 72 63
Wind speed and direction near Site 2 at the Eclipse Center on June 29 (Beloit, WI) Time (HrMn) 0615 0715 0815 0915 1015 1135 1245 1345 1445
Wind direction (°) - - - 250 340 - - - - - - 210 - - - 270 300 Wind Speed (m/s) 0 1.5 2.1 0 0 2.1 0 2.6 2.1 Temperature (°C) 21 20 19 19 18 19 19 24 26
Relative Humidity % 83 82 93 93
Page 16
EPHB Report No. 282-23a
Table 6: Wind speed and direction near site 3 on Hwy 50 July 11 (Kenosha, WI)
Time (HrMn) 2053 2153 2253 2353 0053 0153 0253 0353 0453 0553 Wind direction (°) 90 90 80 70 60 50 60 50 - - - - - - Wind Speed (m/s) 6.7 5.7 5.1 4.1 3.6 2.1 2.1 1.5 0 0 Temperature (°C) 29 28 28 26 24 21 21 19 18 18 Relative Humidity
% 34 37 38 43 53 68 75 81 89 89
Wind speed and direction near site 3 on Hwy 50 July 12 (Kenosha, WI) Time (HrMn) 2053 2153 2253 2353 0053 0153 0253 0353 0453 0553
Wind direction (°) 150 120 130 120 110 110 110 150 140 130 Wind Speed (m/s) 7.7 6.2 5.1 4.6 3.1 3.1 2.1 1.5 2.1 1.5 Temperature (°C) 31 31 30 29 27 26 25 23 23 23 Relative Humidity
% 25 29 30 32 38 43 50 59 64 66
Wind speed and direction near site 3 on Hwy 50 July 13 (Kenosha, WI) Time (HrMn) 2053 2153 2253 2353 0053 0153 0253 0353 0453 0553
Wind direction (°) 70 200 180 200 180 200 - - - 170 160 - - - Wind Speed (m/s) 2.6 2.1 1.5 3.1 3.1 1.5 0 2.1 1.5 0 Temperature (°C) 22 24 24 24 25 24 23 23 23 23 Relative Humidity
% 84 70 68 68 64 68 73 71 73 75
Page 17
EPHB Report No. 282-23a
Table 7: Wind speed and direction near site 4 July 30 (Menomonee Falls, WI)
Time (HrMn) 0655 0755 0855 0955 1055 1145 1245 1345 1445 1545 1645 Wind direction (°) - - - - - - - - - - - - - - - - - - 190 190 180 180 180 Wind Speed (m/s) 0 0 0 0 0 0 2.6 3.6 3.6 4.1 2.1 Temperature (°C) 21 21 21 20 20 21 24 26 27 29 29
Relative Humidity % 56 60 60 72 77 77
Wind speed and direction near site 4 July 31 (Menomonee Falls, WI)
Time (HrMn) 0655 0755 0855 0955 1055 1145 1245 1345 1445 1545 1645 1745 Wind direction (°) 230 260 - - - 350 - - - 330 350 340 360 350 360 70 Wind Speed (m/s) 3.1 2.1 0 1.5 0 2.1 3.1 3.6 3.1 5.1 2.6 3.6 Temperature (°C) 21 20 20 20 19 21 22 23 25 26 26 26
Relative Humidity % 94 93 93 88 88 82
Wind speed and direction near site 4 Aug 1 (Menomonee Falls, WI) Time (HrMn) 0655 0755 0855 0955 1055 1145 1245 1345 1445 1545 1645
Wind direction (°) - - - - - - - - - - - - - - - - - - 240 210 210 230 - - - Wind Speed (m/s) 0 0 0 0 0 0 2.6 2.6 3.6 2.6 0 Temperature (°C) 18 18 19 18 18 19 22 24 26 27 27
Relative Humidity % 93 93 88 93 93 93
Page 18
EPHB Report No. 282-23a
Figure 1: Wirtgen milling machine with VCS
Page 19
EPHB Report No. 282-23a
Statistical Appendix Description of Statistical Models
The statistical criterion used here for effective performance of the control system is that the upper 95% confidence limit for the arithmetic mean of workers’ exposures should be less than the NIOSH recommended exposure limit (REL) for respirable crystalline silica of 0.05 mg/m3. Thus, the confidence limit is one-tailed, and the values excluded have no more than 5% probability.
Industrial hygiene data are usually considered to be lognormally distributed, but for small samples sizes it can be difficult to differentiate between the two distributions. For either distribution an upper confidence limit for the arithmetic mean is required. Thus, results are given here for both distributions in Table 3.
For the study considered here, there were measurements on two workers (one operator and one ground man) for each day at each site. The model used here for computation of upper confidence limits for the arithmetic means treats each occupation’s data separately. This model on either the original scale or the natural log scale for each occupation’s exposures is a one-way random effects model, expressed here as:
xsd= μ + as + esd, (A-1)
where “s” indexes the sites, “sd” indexes the days at the sites, xsd is the actual sampling result when data are analyzed on the original scale or the natural logarithm of the actual sampling result. µ is the mean on either the original scale or the natural log scale (on the natural log scale it is the log of the geometric mean (GM) for the occupation). Site is treated as a random effect (as) which is normally distributed with mean 0 and between-site variance σ2s. The residual effect, esd, is also treated as random and normally distributed with mean 0 and variance σ2sd. Note that because there is just one measurement for each day, the variance σ2sd includes both between day and within day variability. The two random effects are treated as statistically independent.
a) Normal theory model
For the original scale analysis, the xsd is the measurement at site s on day d. The two variances are defined as they were above. The 95% upper confidence limit, shown in Table 3, for each occupation arithmetic mean on the normal scale uses the standard formula:
UCL =�̅�𝑥 + tdf, 0.95×(𝑠𝑠�̅�𝑥 )
where
UCL = upper confidence limit,
�̅�𝑥 = estimated occupational mean,
Page 20
EPHB Report No. 282-23a
tdf,0.95 = the 95th percentile of the Student’s t distribution with the degrees of freedom df, based on the dfm=kr option in SAS Proc Mixed [SAS Institute 2004] and [Littell et al. 2006], which is recommended for repeated measures data. The degrees of freedom for this study was between 3.02 and 3.23.
𝑠𝑠�̅�𝑥 = standard error of occupation mean estimate.
For operator data, �̅�𝑥=0.00723 and the standard error=0.001383, and tdf,0.95=2.34 for df=3.02. The upper confidence limit is 0.00723 + 2.34x0.001383=0.0105.
For ground man data, �̅�𝑥=0.006634 and the standard error=0.000917, and tdf,0.95 equals 2.29 for df=3.23. The upper confidence limit is 0.006634 + 2.29 x 0.000917 =0.0087.
These results appear in Table 3. The “Rsd Normal” estimates in Table 3 are relative to the above �̅�𝑥 values.
b) Lognormal theory model
There are no exact confidence limits for the arithmetic mean for lognormal data, unless the data are a random sample. The method proposed is applicable for data from a one-way random effects model, such as equation (A-1). In that equation xsd is the natural log of the sampling result. The arithmetic mean associated with model (A-1) is given by exp(μ + 0.5(σ2s + σ2d(s))) for which the following 95% upper confidence limit (A-2) is given for the arithmetic mean. The sample variance of the natural log scale site means is denoted by 𝑠𝑠�̅�𝑥𝑠𝑠
2 . The pooled within-site variance is denoted by astd2ws, for which the within site variances are weighted by their degrees of freedom, summed, and divided by the sum of the degrees of freedom. �̿�𝑥 is the mean of the log scale site means. In Table 3, the geometric mean is 𝑒𝑒�̿�𝑥. nsites is the number of sites, df1= nsites -1; df2 = (number of measurements-number of sites), nbar is the average of the reciprocals of the number of days at the sites. Thus, if there were n days at each site, nbar=1/n. For the study considered here, however, the number of days at each site is not the same. Also, t(0.95,df1) denotes the 95th percentile of the t distribution with df1 degrees of freedom; chisq(0.05,df1) denotes the 5th percentile of the chi square distribution with df1 degrees of freedom; and chisq(1-0.05,df2) denotes the 95th percentile of the chi square distribution with df2 degrees of freedom.
UCL2= (�̿�𝑥 + 0.5𝑠𝑠�̅�𝑥𝑠𝑠2 + 0.5(1 − 𝑛𝑛𝑛𝑛𝑛𝑛𝑛𝑛)𝑛𝑛𝑠𝑠𝑎𝑎𝑎𝑎𝑤𝑤𝑤𝑤2 ) + (A-2)
√((𝑠𝑠_(𝑥𝑥 ̅_𝑠𝑠 ) (t(0.95, df1))/√(𝑛𝑛_𝑠𝑠𝑠𝑠𝑎𝑎𝑒𝑒𝑠𝑠 ))^2 + 〖〖0.5〗^2 𝑠𝑠〗_(𝑥𝑥 ̅_𝑠𝑠)^4 (𝑎𝑎𝑑𝑑1/chisq(0.05, df1) − 1)^2+ (0.5 (1 − 𝑛𝑛𝑛𝑛𝑛𝑛𝑛𝑛))^2 〖〖𝑛𝑛𝑠𝑠𝑎𝑎𝑎𝑎〗_𝑤𝑤𝑠𝑠^4 (𝑎𝑎𝑑𝑑2/chisq(1 − 0.05, df2) − 1)〗^2 )
=Term1 + √( Term2 + Term3 + Term4),
Page 21
EPHB Report No. 282-23a
where Term1=(�̿�𝑥 + 0.5𝑠𝑠�̅�𝑥𝑠𝑠
2 + 0.5(1 − 𝑛𝑛𝑛𝑛𝑛𝑛𝑛𝑛)𝑛𝑛𝑠𝑠𝑎𝑎𝑎𝑎𝑤𝑤𝑤𝑤2 ) , Term2=(𝑠𝑠_(𝑥𝑥 ̅_𝑠𝑠 ) (t(0.95, df1))/√(𝑛𝑛_𝑠𝑠𝑠𝑠𝑎𝑎𝑒𝑒𝑠𝑠 ))^2,
Term3=〖〖0.5〗^2 𝑠𝑠〗_(𝑥𝑥 ̅_𝑠𝑠)^4 (𝑎𝑎𝑑𝑑1/chisq(0.05, df1) − 1)^2, and Term4=(0.5 (1 − 𝑛𝑛𝑛𝑛𝑛𝑛𝑛𝑛))^2 〖〖𝑛𝑛𝑠𝑠𝑎𝑎𝑎𝑎〗_𝑤𝑤𝑠𝑠^4 (𝑎𝑎𝑑𝑑2/chisq(1 − 0.05, df2) − 1)〗^2.
UCLo=eUCL2 is the required upper confidence limit for the arithmetic mean of occupation o. The estimates used in (A-2) are shown in Table A-1. More detailed discussion of the above confidence limit is given in Best Practice Engineering Control Guidelines to Control Worker Exposure to Respirable Crystalline Silica during Asphalt Pavement Milling [NIOSH 2015]. Note that the above methodology is intended to be applied to each occupation’s data separately. Although exact confidence limits are available for the arithmetic mean of lognormal data based on a simple random sample, only approximate limits are available for more complicated designs, such as the designs used in the studies described here [NIOSH 2015].
For the data studied here, there are three sites with 3 measurements per site, and one site with two measurements when the two occupations are considered separately. Thus,
nbar= 1/4 x (1/2 + 3 x 1/3)=0.375
For operator, Term1=(�̿�𝑥 + 0.5𝑠𝑠�̅�𝑥𝑠𝑠2 + 0.5(1 − 𝑛𝑛𝑛𝑛𝑛𝑛𝑛𝑛)𝑛𝑛𝑠𝑠𝑎𝑎𝑎𝑎𝑤𝑤𝑤𝑤2 )=-5.0769 + 0.5 * 0.2896 + 0.5 *
(1-.375)*0.3278=-4.8297;
Term2=(𝑠𝑠_(𝑥𝑥 ̅_𝑠𝑠 ) (t(0.95, df1))/√(𝑛𝑛_𝑠𝑠𝑠𝑠𝑎𝑎𝑒𝑒𝑠𝑠 ))^2 =(sqrt(0.2896) * 2.353/sqrt(4))2 =0.4009, where df1=3 and 2.353 is the 95th percentile of the t distribution with three degrees of freedom.
Term3=〖〖0.5〗^2 𝑠𝑠〗_(𝑥𝑥 ̅_𝑠𝑠)^4 (𝑎𝑎𝑑𝑑1/chisq(0.05, df1) − 1)^2=0.25 * 0.28962*(3/0.3518-1)2=1.188, where 0.3518 is the 5th percentile of the chi square distribution with three degrees of freedom.
Term4=(0.5 (1 − 𝑛𝑛𝑛𝑛𝑛𝑛𝑛𝑛))^2 〖〖𝑛𝑛𝑠𝑠𝑎𝑎𝑎𝑎〗_𝑤𝑤𝑠𝑠^4 (𝑎𝑎𝑑𝑑2/chisq(1 − 0.05, df2) − 1)〗^2= (0.5 * (1-0.375))2*0.32782*(7/14.067 -1)2=0.00265, for df2=7, where 14.067 is the 95th percentile of the chi square distribution with seven degrees of freedom.
Term1+ sqrt(Term2 + Term3 + Term4)=-4.8297 + sqrt(0.4009 + 1.188 + 0.00265)
=-3.568
Exponentiation, e-3.568=0.0282, yields the upper confidence limit for the operator. The ground man estimates are produced analogously.
At the NIOSH website http://www.cdc.gov/niosh/docs/2015-105/ there is a spreadsheet which will produce the above estimates when the data are entered in the “Blank Strategy 1” worksheet.
Page 22
EPHB Report No. 282-23a
Model Fitting
There were several workers who performed the occupations. Three individuals served as operator and five individuals served as ground man. These individuals are identified by id numbers in Table 1. The discussion below is for the lognormal model.
To test for variability between workers within occupation, the data from the two occupations was used in one statistical model. Rewrite equation (A-1), to allow for a model for both occupations with four (statistically independent) variance components:
𝑥𝑥𝑤𝑤𝑠𝑠,𝑜𝑜 =𝛽𝛽𝑜𝑜 + 𝛽𝛽1(𝑜𝑜 = 𝑜𝑜𝑜𝑜) + 𝑛𝑛𝑤𝑤 + 𝑛𝑛𝑤𝑤𝑠𝑠 + 𝑤𝑤(𝑜𝑜) + 𝑒𝑒𝑜𝑜𝑤𝑤𝑠𝑠. (A-3)
Note that because there are two measurements per day, the day random effect(𝑛𝑛𝑤𝑤𝑠𝑠) can be separated from the residual random effect (𝑒𝑒𝑜𝑜𝑤𝑤𝑠𝑠). 𝛽𝛽𝑜𝑜 is the log scale mean for the ground man occupation. The notation 𝛽𝛽1(𝑜𝑜 = 𝑜𝑜𝑜𝑜) indicates that 𝛽𝛽1 only is present for the operator data. Thus, the operator occupation log scale mean is 𝛽𝛽𝑜𝑜 + 𝛽𝛽1. Thus, both 𝛽𝛽𝑜𝑜𝑛𝑛𝑛𝑛𝑎𝑎 𝛽𝛽1 are fixed effects. The other new term in eq (A-3) is w(o), which denotes the particular worker doing the occupation, and is treated as a random effect. Thus, this model allows for between worker variability for each occupation. These individuals who did the occupations are numbered and their variance can be included in the model. There are some complications, discussed below, because some individuals work at more than one site, and others work at only one site. Also, no individual does both occupations.
The question here is whether the model (A-3) can be replaced by the model (A-4):
𝑥𝑥𝑤𝑤𝑠𝑠,𝑜𝑜 =𝛽𝛽𝑜𝑜 + 𝛽𝛽1(𝑜𝑜 = 𝑜𝑜𝑜𝑜) + 𝑛𝑛𝑤𝑤 + 𝑛𝑛𝑤𝑤𝑠𝑠 + 𝑒𝑒𝑜𝑜𝑤𝑤𝑠𝑠 , (A-4)
in which the term w(o) term has been removed, and, thus, the between worker variance is treated as 0.
The statistical significance of the w(o) term can be tested, using SAS Proc Mixed. Littell et al. recommends the use of a Type3 F test, to test the statistical significance of variance components [Littell et. al. 2006].
However, before fitting the model (A-3) the following models were fitted to each occupation’s data:
𝑥𝑥𝑤𝑤𝑠𝑠,𝑔𝑔𝑔𝑔𝑜𝑜𝑔𝑔𝑔𝑔𝑠𝑠 𝑚𝑚𝑚𝑚𝑔𝑔 =𝛽𝛽𝑜𝑜 + 𝑛𝑛𝑤𝑤 + 𝑤𝑤(𝑜𝑜) + 𝑒𝑒𝑤𝑤𝑠𝑠 (A-5)
𝑥𝑥𝑤𝑤𝑠𝑠,𝑜𝑜𝑜𝑜𝑜𝑜𝑔𝑔𝑚𝑚𝑜𝑜𝑜𝑜𝑔𝑔 =𝛽𝛽𝑜𝑜 + 𝛽𝛽1 + 𝑛𝑛𝑤𝑤 + 𝑤𝑤(𝑜𝑜) + 𝑒𝑒𝑤𝑤𝑠𝑠
Like model (A-1) each of these models combines the day at site and within day variance components, here represented by the residual term 𝑒𝑒𝑤𝑤𝑠𝑠. The model tries to separately
Page 23
EPHB Report No. 282-23a
estimate the between-site (𝑛𝑛𝑤𝑤) and between-worker (w(o)) variances. The variance component estimates are quite different for the two occupations. For both occupations the F test for the site variance yields p-value>0.6, which indicates that the site effect can be removed from each occupation’s model. After removal and after refitting each model, the ground man model yields a p-value of about 0.2 for the between-worker variance and the operator model yields a p-value of about 0.01 for the between-worker variance.
However, the Type3 F test of the significance of the worker variance in model (A-3) gives a p-value of about 0.39. This result suggests that it is appropriate to remove the w(o) term from the model. In addition, a likelihood ratio test using maximum likelihood results in the same log-likelihood with or without the w(o) term, which also supports removal of the w(o) term.
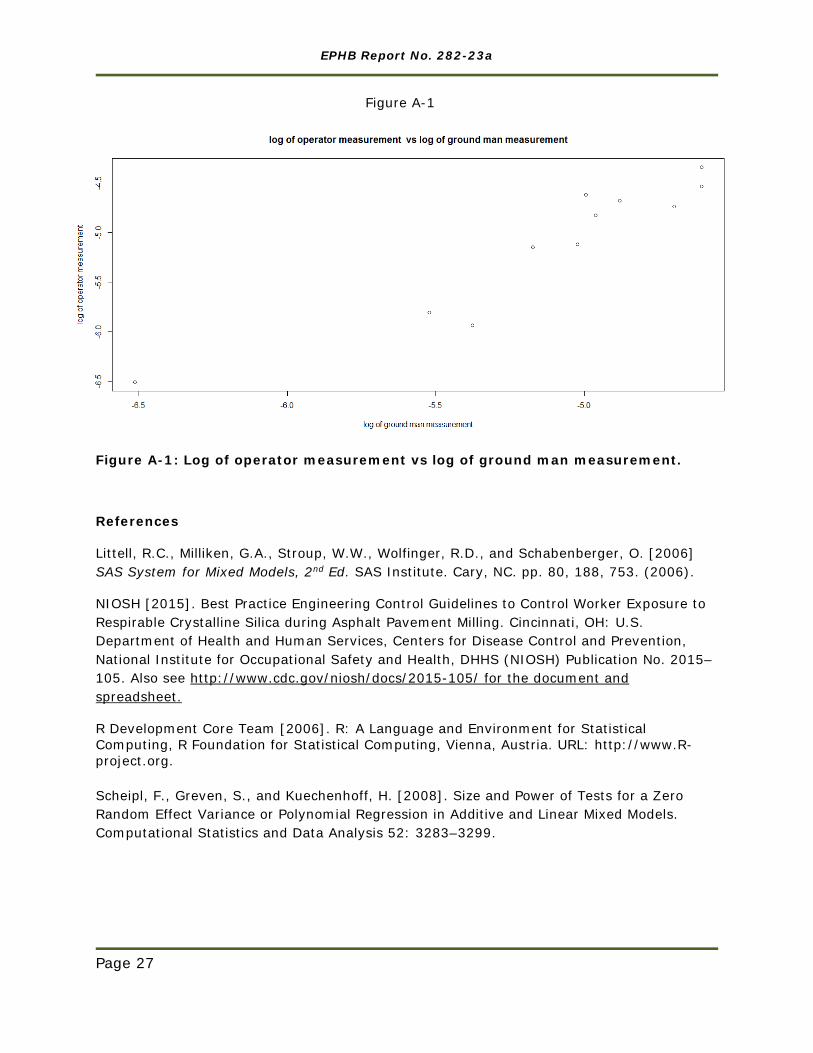
In order to understand the difference in results, Figure (A-1) is shown below to understand the importance of the days at site variance component. It is a plot of the log scale operator measurement versus the corresponding (same day) log scale ground man measurement. For the data in Figure A-1 the correlation of the two variables is about 0.94. From the models (A-3) and (A-4) results, the estimated correlation of the two plotted variables is approximately the sum of the site and day-at-site variances, divided by the total variance: 0.91 and 0.92, respectively. Thus, the model (A-4), without worker variance, agrees as well with the data as model (A-3), with the (average) worker variance.
It is also necessary to test whether the w(o) random effect is statistically significant separately for each of the two occupations, rather than just testing the average w(o) variance. Thus, we wish to fit:
𝑥𝑥𝑤𝑤𝑠𝑠,𝑜𝑜 =𝛽𝛽𝑜𝑜 + 𝛽𝛽1(𝑜𝑜 = 𝑜𝑜𝑜𝑜) + 𝑛𝑛𝑤𝑤 + 𝑛𝑛𝑤𝑤𝑠𝑠 + 𝐼𝐼𝑎𝑎𝐼𝐼𝑛𝑛 ∗ 𝑤𝑤(𝑜𝑜) + 𝐼𝐼𝑎𝑎𝑜𝑜𝑜𝑜 ∗ 𝑤𝑤(𝑜𝑜) + 𝑒𝑒𝑜𝑜𝑤𝑤𝑠𝑠. (A-4)’,
where 𝐼𝐼𝑎𝑎𝐼𝐼𝑛𝑛 is 1 for the ground man occupations and 0 otherwise. Idop is defined analogously for the operator occupation. Table A-2 contains variance estimates for model (A-4)’, except that the variance for Idgr*w(o) is omitted, since it is 0.
In model (A-4)’ a problem is that for Type3 estimation, there are no degrees of freedom to estimate 𝐼𝐼𝑎𝑎𝑜𝑜𝑜𝑜 ∗ 𝑤𝑤(𝑜𝑜), because of confounding the factors. When in (A-4)’ only one interaction term is included, the F test results are: for ∗ 𝑤𝑤(𝑜𝑜) , p-value > 0,2 and for 𝐼𝐼𝑎𝑎𝐼𝐼𝑛𝑛 ∗𝑤𝑤(𝑜𝑜) , p-value > 0.3.
Likewise there are problems for restricted maximum likelihood when both interaction terms are retained. The SAS Proc Mixed G matrix is not positive definite when variance component estimates must be non-negative. When there are no restrictions on the sign of the variance component estimates, the Proc Mixed algorithm does not converge. With this in mind, two approaches for doing likelihood ratio tests were used for the analysis, each with only one of the interaction terms in the model, and requiring variance component estimates to be non-negative:
Page 24
EPHB Report No. 282-23a
a) Simulation approach. The p-values are based on simulations of the restricted maximum likelihood ratio statistic for a selection of true parameter values and also on the R program “exactRLRT “ in the R package “RLRsim” [R Development Core Team 2006], discussed in [Scheipl. et. al 2008]. When only 𝐼𝐼𝑎𝑎𝑜𝑜𝑜𝑜 ∗ 𝑤𝑤(𝑜𝑜) is retained in (A-4)’, the p values obtained is between 0.085 and 0.10. When only 𝐼𝐼𝑎𝑎𝐼𝐼𝑛𝑛 ∗ 𝑤𝑤(𝑜𝑜) alone is retained, the p value is 1.
b) Likelihood ratio approach based on a 50:50 mixture of chi squares with 0 and 1 degree of freedom. This is equivalent to dividing the one degree of freedom chi square p-value of the likelihood ratio test value, by 2 [Littell et al. 2006]. When only 𝐼𝐼𝑎𝑎𝑜𝑜𝑜𝑜 ∗ 𝑤𝑤(𝑜𝑜) is retained in (A-4)’, the p-value is about 0.14. When only 𝐼𝐼𝑎𝑎𝐼𝐼𝑛𝑛 ∗ 𝑤𝑤(𝑜𝑜) is retained, the p value is 1.
Thus, for all these analyses (F test and two versions of likelihood ratio test), the p-value of 𝐼𝐼𝑎𝑎𝐼𝐼𝑛𝑛 ∗ 𝑤𝑤(𝑜𝑜) is never less than 0.3, and the p-value of 𝐼𝐼𝑎𝑎𝑜𝑜𝑜𝑜 ∗ 𝑤𝑤(𝑜𝑜) is never less than 0.085. Since we are testing at the 0.05 significance level, there is no reason to reject the decision that the two variance components are 0.
Thus, it is reasonable to omit all terms involving w(o) from the model and use Model (A-4) (with no terms involving w(o)) as the chosen model. The consequences of including the w(o) term and allowing separate terms for each occupation are, nevertheless, discussed at the end of this section.
Having selected model (A-4), we see that the data, when considered separately by occupation, have two variance components (site and residual), as required by equations (A-1) and (A-2). We calculate the upper confidence limits from Eq (A-2), which are shown in Table 3 for each occupation. The procedure is somewhat indirect, because the method that is available to us for the computation of the upper confidence limits for the arithmetic mean of lognormal data works only for one occupation at a time.
Recall that the above analyses use the substitution of LOD/sqrt(2) for the two values on the first day of the study that were <LOD. As an alternative, the substitution LOD/2 was made. The test of worker variance again indicates that it can be treated as 0. Substitution of LOD/2 also increases the 95% upper confidence limits. The ground man upper confidence limit is increases to 0.016 mg/m3 and the operator upper confidence limit increases to 0.037 µg/m3, both well below the REL.
What would happen if we replace model (A-1) by the one-way random effects model:
𝑦𝑦𝑤𝑤𝑠𝑠 =µ + 𝑤𝑤(𝑜𝑜) + 𝑛𝑛𝑠𝑠 (A-6),
obtained by deleting the statistically insignificant site variance component and fitting the model separately for each occupation? The upper 95% confidence limit for the operator arithmetic mean is >1, obtained by using the upper confidence limit (A-2). The operator meets the 0.05 mg/m3 limit at about the 87% confidence level. The ground man meets it at (much higher confidence) than the 95% confidence level. Thus, the decision to use the model that treats the between worker variances as 0, is quite important here. The statistical
Page 25
EPHB Report No. 282-23a
analysis given above justifies use of the model (A-1) and the corresponding upper confidence limits given by (A-2).
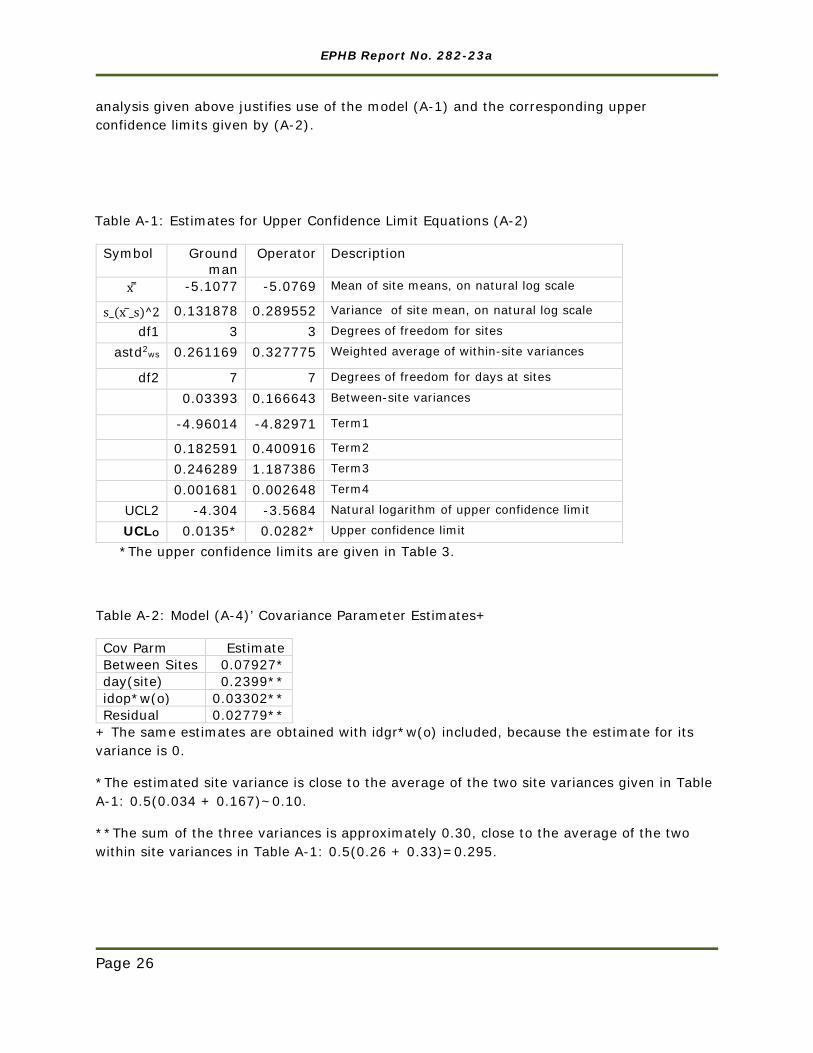
Table A-1: Estimates for Upper Confidence Limit Equations (A-2)
Symbol Ground man
Operator Description
x ̿ -5.1077 -5.0769 Mean of site means, on natural log scale
s_(x ̅_s)^2 0.131878 0.289552 Variance of site mean, on natural log scale
df1 3 3 Degrees of freedom for sites
astd2ws 0.261169 0.327775 Weighted average of within-site variances
df2 7 7 Degrees of freedom for days at sites
0.03393 0.166643 Between-site variances
-4.96014 -4.82971 Term1
0.182591 0.400916 Term2
0.246289 1.187386 Term3
0.001681 0.002648 Term4
UCL2 -4.304 -3.5684 Natural logarithm of upper confidence limit
UCLO 0.0135* 0.0282* Upper confidence limit
*The upper confidence limits are given in Table 3.
Table A-2: Model (A-4)’ Covariance Parameter Estimates+
Cov Parm Estimate Between Sites 0.07927* day(site) 0.2399** idop*w(o) 0.03302** Residual 0.02779**
+ The same estimates are obtained with idgr*w(o) included, because the estimate for its variance is 0.
*The estimated site variance is close to the average of the two site variances given in Table A-1: 0.5(0.034 + 0.167)~0.10.
**The sum of the three variances is approximately 0.30, close to the average of the two within site variances in Table A-1: 0.5(0.26 + 0.33)=0.295.
Page 26
EPHB Report No. 282-23a
Figure A-1
Figure A-1: Log of operator measurement vs log of ground man measurement.
References
Littell, R.C., Milliken, G.A., Stroup, W.W., Wolfinger, R.D., and Schabenberger, O. [2006] SAS System for Mixed Models, 2nd Ed. SAS Institute. Cary, NC. pp. 80, 188, 753. (2006).
NIOSH [2015]. Best Practice Engineering Control Guidelines to Control Worker Exposure to Respirable Crystalline Silica during Asphalt Pavement Milling. Cincinnati, OH: U.S. Department of Health and Human Services, Centers for Disease Control and Prevention, National Institute for Occupational Safety and Health, DHHS (NIOSH) Publication No. 2015–105. Also see http://www.cdc.gov/niosh/docs/2015-105/ for the document and spreadsheet.
R Development Core Team [2006]. R: A Language and Environment for Statistical Computing, R Foundation for Statistical Computing, Vienna, Austria. URL: http://www.R-project.org.
Scheipl, F., Greven, S., and Kuechenhoff, H. [2008]. Size and Power of Tests for a Zero Random Effect Variance or Polynomial Regression in Additive and Linear Mixed Models.Computational Statistics and Data Analysis 52: 3283–3299.
Page 27
Delivering on the Nation’s promise: Safety and health at work for all people through research and prevention.
To receive NIOSH documents or other information about occupational safety and health topics, contact NIOSH at
1-800-CDC-INFO (1-800-232-4636)
TTY: 1-888-232-6348
E-mail: [email protected]
or visit the NIOSH Web site at www.cdc.gov/niosh
For a monthly update on news at NIOSH, subscribe to NIOSH eNews by visiting www.cdc.gov/niosh/eNews
SAFER ● HEALTHIER ● PEOPLE