Embed Size (px)
Citation preview
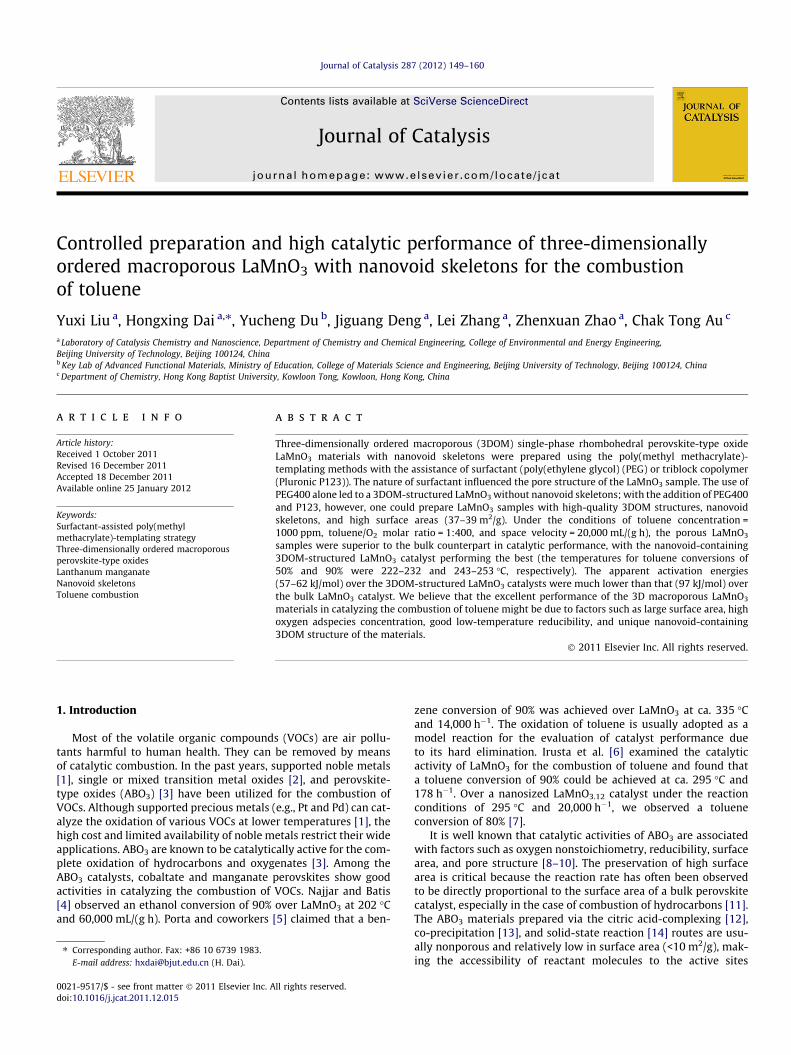
Journal of Catalysis 287 (2012) 149–160
Contents lists available at SciVerse ScienceDirect
Journal of Catalysis
journal homepage: www.elsevier .com/locate / jcat
Controlled preparation and high catalytic performance of three-dimensionallyordered macroporous LaMnO3 with nanovoid skeletons for the combustionof toluene
Yuxi Liu a, Hongxing Dai a,⇑, Yucheng Du b, Jiguang Deng a, Lei Zhang a, Zhenxuan Zhao a, Chak Tong Au c
a Laboratory of Catalysis Chemistry and Nanoscience, Department of Chemistry and Chemical Engineering, College of Environmental and Energy Engineering,Beijing University of Technology, Beijing 100124, Chinab Key Lab of Advanced Functional Materials, Ministry of Education, College of Materials Science and Engineering, Beijing University of Technology, Beijing 100124, Chinac Department of Chemistry, Hong Kong Baptist University, Kowloon Tong, Kowloon, Hong Kong, China
a r t i c l e i n f o a b s t r a c t
Article history:Received 1 October 2011Revised 16 December 2011Accepted 18 December 2011Available online 25 January 2012
Keywords:Surfactant-assisted poly(methylmethacrylate)-templating strategyThree-dimensionally ordered macroporousperovskite-type oxidesLanthanum manganateNanovoid skeletonsToluene combustion
0021-9517/$ - see front matter � 2011 Elsevier Inc. Adoi:10.1016/j.jcat.2011.12.015
⇑ Corresponding author. Fax: +86 10 6739 1983.E-mail address: [email protected] (H. Dai).
Three-dimensionally ordered macroporous (3DOM) single-phase rhombohedral perovskite-type oxideLaMnO3 materials with nanovoid skeletons were prepared using the poly(methyl methacrylate)-templating methods with the assistance of surfactant (poly(ethylene glycol) (PEG) or triblock copolymer(Pluronic P123)). The nature of surfactant influenced the pore structure of the LaMnO3 sample. The use ofPEG400 alone led to a 3DOM-structured LaMnO3 without nanovoid skeletons; with the addition of PEG400and P123, however, one could prepare LaMnO3 samples with high-quality 3DOM structures, nanovoidskeletons, and high surface areas (37–39 m2/g). Under the conditions of toluene concentration =1000 ppm, toluene/O2 molar ratio = 1:400, and space velocity = 20,000 mL/(g h), the porous LaMnO3
samples were superior to the bulk counterpart in catalytic performance, with the nanovoid-containing3DOM-structured LaMnO3 catalyst performing the best (the temperatures for toluene conversions of50% and 90% were 222–232 and 243–253 �C, respectively). The apparent activation energies(57–62 kJ/mol) over the 3DOM-structured LaMnO3 catalysts were much lower than that (97 kJ/mol) overthe bulk LaMnO3 catalyst. We believe that the excellent performance of the 3D macroporous LaMnO3
materials in catalyzing the combustion of toluene might be due to factors such as large surface area, highoxygen adspecies concentration, good low-temperature reducibility, and unique nanovoid-containing3DOM structure of the materials.
� 2011 Elsevier Inc. All rights reserved.
1. Introduction
Most of the volatile organic compounds (VOCs) are air pollu-tants harmful to human health. They can be removed by meansof catalytic combustion. In the past years, supported noble metals[1], single or mixed transition metal oxides [2], and perovskite-type oxides (ABO3) [3] have been utilized for the combustion ofVOCs. Although supported precious metals (e.g., Pt and Pd) can cat-alyze the oxidation of various VOCs at lower temperatures [1], thehigh cost and limited availability of noble metals restrict their wideapplications. ABO3 are known to be catalytically active for the com-plete oxidation of hydrocarbons and oxygenates [3]. Among theABO3 catalysts, cobaltate and manganate perovskites show goodactivities in catalyzing the combustion of VOCs. Najjar and Batis[4] observed an ethanol conversion of 90% over LaMnO3 at 202 �Cand 60,000 mL/(g h). Porta and coworkers [5] claimed that a ben-
ll rights reserved.
zene conversion of 90% was achieved over LaMnO3 at ca. 335 �Cand 14,000 h�1. The oxidation of toluene is usually adopted as amodel reaction for the evaluation of catalyst performance dueto its hard elimination. Irusta et al. [6] examined the catalyticactivity of LaMnO3 for the combustion of toluene and found thata toluene conversion of 90% could be achieved at ca. 295 �C and178 h�1. Over a nanosized LaMnO3.12 catalyst under the reactionconditions of 295 �C and 20,000 h�1, we observed a tolueneconversion of 80% [7].
It is well known that catalytic activities of ABO3 are associatedwith factors such as oxygen nonstoichiometry, reducibility, surfacearea, and pore structure [8–10]. The preservation of high surfacearea is critical because the reaction rate has often been observedto be directly proportional to the surface area of a bulk perovskitecatalyst, especially in the case of combustion of hydrocarbons [11].The ABO3 materials prepared via the citric acid-complexing [12],co-precipitation [13], and solid-state reaction [14] routes are usu-ally nonporous and relatively low in surface area (<10 m2/g), mak-ing the accessibility of reactant molecules to the active sites

150 Y. Liu et al. / Journal of Catalysis 287 (2012) 149–160
unfavorable. It is hence highly desirable to develop a strategy thatis effective for the preparation of ABO3 with porous structures andhigh surface areas in a controlled manner.
Up to now, there have been several reports on the preparationof high-surface-area porous ABO3. For example, Wang et al. [9]synthesized ordered mesoporous LaCoO3 with a surface area ofca. 97 m2/g via an ordered mesoporous silica-nanocasting route.Through the use of block copolymer Pluronic PE 10300, Houet al. [15] prepared nanoporous BaTiO3 with a surface area of70 m2/g. By adopting the evaporation-induced self-assembling(EISA) method, Fan et al. [16] fabricated mesoporous SrTiO3 andBaTiO3 having surface areas of up to 206 and 167 m2/g, respec-tively. In recent years, three-dimensional-ordered macroporous(3DOM) materials with unique 3D pore structures and large sur-face areas have attracted much attention due to their potential cat-alytic applications. Using metal nitrates or acetates as precursorsand well-arrayed polymethyl methacrylate (PMMA) or polystyrene(PS) microspheres as hard templates, Sadakane et al. [17] and Kimet al. [18] prepared 3DOM-structured La1�xSrxFeO3 (surfacearea = 24–49 m2/g) and La0.7Ca0.3�xSrxMnO3 (ca. 24 m2/g), respec-tively. Zhao and coworkers [19,20] synthesized a series of 3DOMAu/LaFeO3 (surface area = 31–32 m2/g) and LaCoxFe1�xO3 catalysts,which exhibited super catalytic performance (the temperature re-quired for 50% soot conversion was 359 �C over 6.3 wt.% Au/LaFeO3
and 397 �C over LaCo0.5Fe0.5O3).All of the mentioned 3DOM-structured perovskites, however,
possessed no mesoporous or nanovoids in the walls, leading to rel-atively low surface areas. Although silica [21] and carbon [22] witha bimodal distribution of meso- and macropores could be fabri-cated, the controlled preparation and catalytic application of3DOM-structured LaMnO3 materials with mesoporous or nano-void-like crystalline walls for the combustion of toluene have notbeen reported in the literature.
In the past years, our group investigated the fabrication, charac-terization, and physicochemical properties of high-surface-areamagnesia [23], calcium oxide [24], alumina [25], and iron oxide[26] by using the surfactant-templating or surfactant-assistedPMMA-templating strategy. We observed that the introductionof a surfactant during the preparation process was beneficialfor the generation of mesoporous or nanovoid-like walls andthus beneficial for the improvement of physicochemical property[24,25]. Recently, we extended our attention to the catalysis of3DOM-structured ABO3 and perovskite-like oxides (A2BO4) of highsurface area for the oxidation of VOCs. In this paper, we report thepreparation and catalytic properties of 3DOM-structured LaMnO3
with nanovoid skeletons for the combustion of toluene.
2. Experimental
2.1. Catalyst preparation
The well-arrayed hard template PMMA microspheres with anaverage diameter of ca. 300 nm were synthesized according tothe procedures described elsewhere [25]. The 3D macroporousLaMnO3 samples were prepared using the surfactant-assistedPMMA-templating strategy. In a typical process, 30 mmol ofLa(NO3)3�6H2O and 30 mmol of Mn(NO3)2 (50 wt.% aqueous solu-tion) were dissolved in a solution of 3 mL poly(ethylene glycol)(PEG, molecular weight = 400 g/mol) and 3 mL methanol understirring at room temperature (RT) for 4 h to obtain a transparentsolution. Then, 7 mL of a methanol solution containing 1.00, 2.00,or 4.00 g of P123 with an average molecular weight of 5800 g/mol was added to the as-obtained transparent solution that wasstirred for 1 h to get a uniform precursor solution. A certainamount of methanol was added to achieve a total metal concentra-
tion of 2 mol/L. Then, ca. 2.0 g of the PMMA hard template wassoaked in the obtained mixed solution for 4 h. After being filteredout, the obtained wet PMMA template was dried in air at RT for48 h and then transferred to a ceramic boat that was placed in atubular furnace. The thermal treatment process was divided intotwo steps: (i) the dried solid was calcined in a N2 flow of 50 mL/min at a ramp of 1 �C/min from RT to 300 �C and kept at this tem-perature for 3 h and then cooled to 50 �C in the same atmosphereand (ii) after being purged in an air flow of 50 mL/min, the solidwas heated from RT to 300 �C in the same atmosphere at a rampof 1 �C/min and held at 300 �C for 2 h and then was heated to750 �C (at the same ramp) and calcined at 750 �C for 4 h. The as-ob-tained 3DOM-structured sample was denoted as LaMnO3–PP-1,LaMnO3–PP-2, and LaMnO3–PP-3 (corresponding to the use ofPEG400 and P123 with PEG400/P123 molar ratio = 48.7, 24.4, and12.2), in which ‘‘PP’’ denotes the use of ‘‘PEG’’ and ‘‘P123.’’
The 3DOM-structured LaMnO3 samples without nanovoid-likewalls were prepared using the PEG-assisted PMMA-templating orsurfactant-free PMMA-templating strategy. In a typical synthesis,no surfactant P123 was added, but other parameters and calcina-tion procedures were the same as those adopted for the prepara-tion of LaMnO3–PP-1–3, the thus-obtained 3DOM sample wasdenoted as LaMnO3–PEG. By using the same method in the absenceof surfactant P123 and PEG, we also prepared the 3DOM-struc-tured LaMnO3 sample (denoted as LaMnO3–MeOH). For compari-son purposes, the bulk LaMnO3 sample was prepared via thecitric acid-complexing route [12] and after calcination in air at850 �C for 4 h. For the sake of better presentation, the main prepa-ration conditions of these materials are summarized in Table 1.
All of the chemicals (A.R. in purity) were purchased from BeijingChemical Company and used without further purification.
2.2. Catalyst characterization
X-ray diffraction (XRD) patterns of the samples were recordedon a Bruker D8 Advance diffractometer with Cu Ka radiation andnickel filter (k = 0.15406 nm), and the operating voltage and cur-rent were 40 kV and 35 mA, respectively. The crystal phases ofthe samples were identified by referring to the JCPDS Database.Thermogravimetric analysis (TGA) and differential scanning calori-metric (DSC) analysis of the uncalcined samples were conducted(from RT to 900 �C) in an air flow of 50 mL/min at a heating rateof 10 �C/min over a SDT Q600 (TA) apparatus. BET (Brunauer–Em-mett–Teller) surface areas of the samples were measured via N2
adsorption at �196 �C on a Micromeritics ASAP 2020 analyzer withthe samples outgassed at 300 �C for 2.5 h under vacuum beforemeasurement. Fourier transform infrared (FT-IR) spectra of thesamples (1 wt.% sample + 99 wt.% KBr) were obtained in the regionof 400–4000 cm�1 with a resolution of 0.4 cm�1 on a Bruker Vertex70 spectrometer. The scanning electron microscopic (SEM) imagesof the samples were recorded on a Gemini Zeiss Supra 55 appara-tus (operating at 10 kV). Transmission electron microscopic (TEM)images of the samples were obtained using the JEOL-2010 equip-ment (operating at 200 kV). X-ray photoelectron spectroscopy(XPS, VG CLAM 4 MCD analyzer) was used to determine the La3d, Mn 2p, O 1s, and C 1s binding energies (BEs) of surface speciesusing MgKa (hv = 1253.6 eV) as the excitation source. The instru-mental resolution was 0.5 eV. In order to minimize the amountsof OH� and carbonate species on the surfaces, the samples werecalcined in O2 (flow rate = 20 mL/min) at 600 �C for 1 h and thencooled in the same atmosphere to RT before XPS measurements.After such a pretreatment, the samples were mounted and trans-ferred to the spectrometer in a transparent Glove Bag (Instrumentsfor Research and Industry, USA) filled with helium. The sampleswere then outgassed in the preparation chamber (10�5 Torr) for0.5 h and introduced into the analysis chamber (3 � 10�9 Torr)

Table 1Preparation parameters, particle sizes, BET surface areas, average pore sizes, and pore volumes of the as-obtained LaMnO3 samples.
Catalyst code Hardtemplate/surfactant
(La + Mn)/P123molarratio(mol/mol)
PEG400/P123molarratio(mol/mol)
Calcinationcondition
Da
(nm)BET surface area (m2/g) Pore
volume(cm3/g)
Average poresize (nm)
Macropore(>50 nm)
Mesopore(650 nm)
Total Macroporeb (>50 nm)
Mesopore(650 nm)
LaMnO3–bulk –/– – – 850 �C 4 h (in air) 118 – – 7.3 – – –LaMnO3–MeOH PMMA/– – – 300 �C 3 h (in N2) ? 300 �C 2 h
(in air) ? 750 �C 4 h (in air)31 1.6 19.8 21.4 0.062 135 7.5
LaMnO3–PEG PMMA/PEG400 – – 300 �C 3 h (in N2) ? 300 �C 2 h(in air) ? 750 �C 4 h (in air)
37 6.4 25.5 31.9 0.093 140 13.9
LaMnO3–PP-1 PMMA/(P123 + PEG400)
348/1 48.7/1 300 �C 3 h (in N2) ? 300 �C 2 h(in air) ? 750 �C 4 h (in air)
35 4.6 33.1 37.7 0.110 90 14.2
LaMnO3–PP-2 PMMA/(P123 + PEG400)
174/1 24.4/1 300 �C 3 h (in N2) ? 300 �C 2 h(in air) ? 750 �C 4 h (in air)
33 4.7 34.7 39.4 0.113 85 20.0
LaMnO3–PP-3 PMMA/(P123 + PEG400)
87/1 12.2/1 300 �C 3 h (in N2) ? 300 �C 2 h(in air) ? 750 �C 4 h (in air)
27 4.3 32.9 37.2 0.096 80 20.6
LaMnO3–PP-2_850 PMMA/(P123 + PEG400)
174/1 24.4/1 300 �C 3 h (in N2) ? 300 �C 2 h(in air) ? 850 �C 4 h (in air)
47 3.4 23.9 27.3 0.064 85 8.1
LaMnO3–PP-2_950 PMMA/(P123 + PEG400)
174/1 24.4/1 300 �C 3 h (in N2) ? 300 �C 2 h(in air) ? 950 �C 4 h (in air)
72 2.8 16.2 19.0 0.031 65 6.8
a Data determined based on XRD results according to the Scherrer’s equation.b Estimated based on TEM images.
Y. Liu et al. / Journal of Catalysis 287 (2012) 149–160 151
for spectrum recording. The C 1s signal at 284.6 eV was taken as areference for BE calibration.
Hydrogen temperature-programmed reduction (H2-TPR) exper-iments were carried out on a chemical adsorption analyzer (Auto-chem II 2920, Micromeritics). Before TPR measurement, ca. 0.02 gof catalyst (40–60 mesh) was first treated in an oxygen flow of30 mL/min at 500 �C for 1 h in a quartz fixed-bed U-shaped mic-roreactor (i.d. = 4 mm). After being cooled at the same atmosphereto RT, the pretreated sample was exposed to a flow (50 mL/min) of5% H2–95% Ar (v/v) mixture and heated from RT to 900 �C at a rampof 10 �C/min. The variation in H2 concentration of the effluent wasmonitored online by the chemical adsorption analyzer. The reduc-tion band was calibrated against that of the complete reduction ofa known standard of powdered CuO (Aldrich, 99.995%).
2.3. Catalytic evaluation
A continuous flow fixed-bed quartz microreactor (i.d. = 4 mm)was used to determine the catalytic activities of the samples atatmospheric pressure for the complete oxidation of toluene. Tominimize the effect of hot spots, quartz sands (40–60 mesh) witha mass equal to that (0.1–0.2 g) of the catalyst sample were usedto dilute the catalyst. The total flow rate of the reactant mixture(1000 ppm toluene + O2 + N2 (balance)) was 33.3 mL/min, givinga toluene/O2 molar ratio of 1:400 and a space velocity (SV) of20,000 mL/(g h). The 1000-ppm toluene was generated by passinga N2 flow through a bottle containing pure toluene (A.R. grade)chilled in an ice-water isothermal bath. For the changes in SVand toluene/O2 molar ratio, we altered the amount of catalystand mass flow of O2, respectively. Reactants and products wereanalyzed online by a gas chromatograph (GC-2010, Shimadzu)equipped with a flame ionization detector (FID) and a thermal con-ductivity detector (TCD), using a 1/8 in Chromosorb 101 column(3 m in length) for VOCs and a 1/8 in Carboxen 1000 column(3 m in length) for permanent gas separation. By using a massspectrometer (HPR20, Hiden), we only detected toluene, carbondioxide, and water in the outlet gas mixture from the microreactor.Based on the peak areas of toluene and carbon dioxide detected byGC-2010, the balance of carbon throughout the investigation wasestimated to be 99.5%. The relative errors for the gas concentrationmeasurements were less than ±1.5%.
3. Results and discussion
3.1. Crystal phase structure
Fig. 1 shows the XRD patterns of as-prepared catalysts. By refer-ring to the XRD pattern of standard LaMnO3 sample (JCPDS PDF#82-1152), one can deduce that all of the as-prepared catalysts weresingle-phase and of rhombohedral crystal structure. Due to thedetection limitation of XRD measurements, we cannot precludethe possible presence of trace amounts of other solid phases (e.g.,manganese oxide and/or lanthanum oxide) in the as-preparedsamples. The Bragg diffraction peaks in the 2h range of 10–80�could be well indexed, as indicated in Fig. 1h and Fig. S1 (Supple-mentary data). It is observed that there was no significant differ-ence in peak intensity across the LaMnO3–MeOH, LaMnO3–PEG,and LaMnO3–PP-1–3 samples, indicating similarity in LaMnO3
crystallinity. With increase of calcination temperature from 750to 850 or 950 �C (Fig. 1g and h), however, the LaMnO3–PP-2 cata-lyst showed improvement in crystallinity, reaching that of bulkLaMnO3 that was calcined at 850 �C. The results of TGA/DSC andFT-IR investigations (Figs. S2 and S3 of the Supplementary data,respectively) confirm that the organic species retained in theuncalcined samples were completely removed after the uncalcinedsamples were thermally treated first in a N2 flow and then in an airflow at or above 750 �C. According to the XRD line-width data andScherrer’s equation, one can estimate the average particle sizes ofthe catalysts. It is found that the particle size increased signifi-cantly with the rise in calcination temperature (Table 1). For exam-ple, the crystallite diameter of 750 �C-calcined LaMnO3–PP-2 wasca. 33 nm, whereas those of the LaMnO3–PP-2_850 and LaMnO3–PP-2_950 samples were ca. 47 and 72 nm, respectively. The resultsdemonstrated that the perovskite structure and crystallinity werepredominantly determined by the temperature adopted for ther-mal treatment.
3.2. Morphology, pore structure, and surface area
Shown in Figs. 2 and 3 are the representative SEM and TEMimages as well as the SAED patterns of the as-prepared LaMnO3
samples. It is clear that all of the samples obtained after calcinationat 750 �C exhibited a 3DOM architecture. The LaMnO3–MeOH sam-

10 20 30 40 50 60 70 80
2 Theta (Deg.)
Inte
nsi
ty (a
.u.)
(012
) (110
)
(202
)
(024
)
(300
)
(220
)
(134
)
(a)
(b)(c)
(d)
(e)
(f)(g)
(122
)
(104
)
(006
)
(116
) (214
)(0
18)
(208
)
(128
)
(h)50
00
Fig. 1. XRD patterns of (a) LaMnO3–bulk, (b) LaMnO3–MeOH, (c) LaMnO3–PEG, (d)LaMnO3–PP-1, (e) LaMnO3–PP-2, (f) LaMnO3–PP-3, (g) LaMnO3–PP-2_850, and (h)LaMnO3–PP-2_950.
152 Y. Liu et al. / Journal of Catalysis 287 (2012) 149–160
ple derived in the absence of PEG400 and P123 displayed a rela-tively poor 3DOM structure with a pore-size range of 130–155 nm (Fig. 2a and b). With the addition of PEG400, a high-quality
(a) (b) (
(e) (f) (
(i) (j) (
(m) (n)
Fig. 2. HRSEM images of (a and b) LaMnO3–MeOH, (c and d) LaMnO3–PEG, (e and f) La2_850, and (m and n) LaMnO3–PP-2_950.
3DOM-architectured LaMnO3–PEG sample with a pore size of ca.140 nm (Fig. 2c and d) and a wall thickness of ca. 35 nm (Fig. 3e)was generated. Highly ordered macroporous structures could beobtained via the long-range replication of the 3D close-packedPMMA template [25]. It is known that the polymer templates,which can support the conversion of the metal precursor(s) to a so-lid-state framework at lower temperatures, play a key role in thesuccessful fabrication of 3DOM metal oxides. In the case of Mnand Co nitrates as metal precursors, the decomposition tempera-tures of the metal nitrates were comparable to the glass transitiontemperature of PMMA. Solidification by nitrate decomposition andmelting of the PMMA would occur at the same time, and some ofthe metal salts were squeezed out from the voids in the templateand thus causing low fraction of 3DOM structure. Therefore, itwould be hard to obtain high-quality 3DOM-structured LaMnO3
materials if only methanol was used as solvent. During the calcina-tion of the PMMA- and PEG400-containing metal nitrates, how-ever, the interaction of the PEG400 and metal nitrates wouldproduce solid metal–PEG complexes [17,27] before the melting ofthe PMMA template and hence generating the desired 3DOM com-plex metal oxide intermediates.
Ueda and coworkers prepared 3DOM LaFeO3 with nanovoids onthe macropore walls in the presence of methanol and ethylene gly-col [27], in which ethylene glycol had an important role to play inthe formation of nanovoids on the skeletons of 3DOM LaFeO3. But
c) (d)
g) (h)
k) (l)
MnO3–PP-1, (g and h) LaMnO3–PP-2, (i and j) LaMnO3–PP-3, (k and l) LaMnO3–PP-
Y. Liu et al. / Journal of Catalysis 287 (2012) 149–160 153
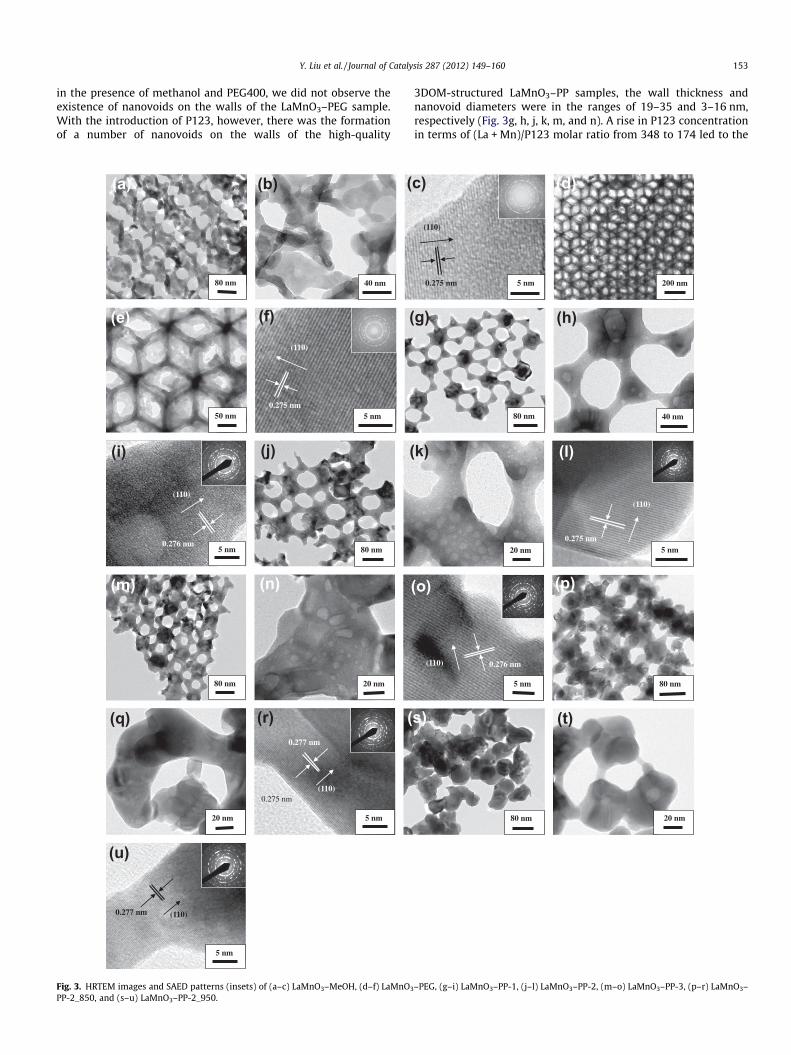
in the presence of methanol and PEG400, we did not observe theexistence of nanovoids on the walls of the LaMnO3–PEG sample.With the introduction of P123, however, there was the formationof a number of nanovoids on the walls of the high-quality
(a) (b) (
(e) (f) (
(i) (j) (
(m) (n) (
(q) (r) (
(u)
Fig. 3. HRTEM images and SAED patterns (insets) of (a–c) LaMnO3–MeOH, (d–f) LaMnO3
PP-2_850, and (s–u) LaMnO3–PP-2_950.
3DOM-structured LaMnO3–PP samples, the wall thickness andnanovoid diameters were in the ranges of 19–35 and 3–16 nm,respectively (Fig. 3g, h, j, k, m, and n). A rise in P123 concentrationin terms of (La + Mn)/P123 molar ratio from 348 to 174 led to the
c) (d)
g) (h)
k) (l)
o) (p)
s) (t)
–PEG, (g–i) LaMnO3–PP-1, (j–l) LaMnO3–PP-2, (m–o) LaMnO3–PP-3, (p–r) LaMnO3–

0
40
80
120
160
200
0.0 0.2 0.4 0.6 0.8 1.0
Relative pressure p/p0
Vol
um
e ad
sorb
ed (c
m3 /g
, ST
P)
(a)
(A)
(b)
(c)
(d)
(e)
(f)
(g)
0.0
0.2
0.4
0.6
0.8
0 20 40 60 80
Pore diameter (nm)
dV/d
(lo
gD)
(a)
(B)
(b)
(c)
(d)
(e)
(f)
(g)
Fig. 4. (A) Nitrogen adsorption–desorption isotherms and (B) pore-size distributions of (a) LaMnO3–MeOH, (b) LaMnO3–PEG, (c) LaMnO3–PP-1, (d) LaMnO3–PP-2, (e)LaMnO3–PP-3, (f) LaMnO3–PP-2_850, and (g) LaMnO3–PP-2_950.
154 Y. Liu et al. / Journal of Catalysis 287 (2012) 149–160
generation of larger amounts of nanovoids on the macropore skel-etons of the LaMnO3–PP-2 sample (Fig. 3j and k). A further rise of(La + Mn)/P123 molar ratio from 174 to 87 would result in 3DOMstructure worse than that of LaMnO3–PP-2 (Fig. 2i and j). The resultreveals that the amount of surfactant P123 had a significant effecton the quality of 3DOM and nanovoid structure on the macroporeskeletons. An excessive amount of P123 was unfavorable for thegeneration of high-quality 3DOM-architectured LaMnO3 materials.Such a result was in agreement with that reported in our previouswork [26]. It is worth mentioning that the employment of the cal-cination procedure (first in N2 at 300 �C and then in air at 300 and750 �C) was essential for the formation of the 3DOM structure. Theglassy temperature, decomposition temperature, and oxidationtemperature of PMMA in air was ca. 130, 290, and 370 �C [25,28],respectively. The PMMA-containing metal precursor was first cal-cined in N2 at 300 �C, possibly leading to the partial carbonizationof PMMA, the as-resulted amorphous carbon could act as a hardtemplate to prevent macro- and mesoporous structure from col-lapsing before the polymer template was completely oxidized ata higher temperature [29], thus beneficial for the preservation of3DOM-structured LaMnO3.
It is well known that the rise in calcination temperature in-creases the size of solid-state crystallites. If the crystallite sizewas big enough, the 3DOM structure would collapse [30]. The3DOM LaMnO3 samples prepared after calcination at 750 �C weresmaller in crystallite size (27–37 nm) as compared to the LaM-nO3–PP-2_850 sample (47 nm) calcined at 850 �C and the LaM-nO3–PP-2_950 sample (72 nm) calcined at 950 �C. Therefore, it isunderstandable that there was significant destruction of 3DOMstructures (Figs. 2k–n, 3p, q, s, and t) and even disappearance ofnanovoids on the macropore skeletons of the LaMnO3 sampleswhen calcination temperature was equal to or above 850 �C.
From the high-resolution TEM images of the as-prepared LaM-nO3 samples (Fig. 3c, f, i, l, o, r, and u), the lattice spacings (d value)of the (110) crystal plane were measured to be in the range of0.275–0.277 nm, not far away from that (0.276 nm) of standardLaMnO3 sample (JCPDS PDF# 82-1152). The observation of multi-ple bright electron diffraction rings in the SAED patterns (insetsof Fig. 3c, f, i, l, o, r, and u) of these LaMnO3 samples suggests theformation of polycrystalline perovskite-phased LaMnO3.
Fig. 4 shows the N2 adsorption–desorption isotherms and pore-size distributions of the LaMnO3 samples prepared under differentconditions, and their BET surface areas and pore properties are
summarized in Table 1. It can be seen from Fig. 4A that the N2
adsorption–desorption isotherm of each sample (except that ofthe LaMnO3–PP-2_950 sample) was characteristic of a combinationof macropore and mesopore structures; the hysteresis loops at thelow and high relative pressure ranges vary from sample to sample,reflecting discrepancy in pore-size distribution (Fig. 4B). For theLaMnO3–PP-1, LaMnO3–PP-2, LaMnO3–PP-3, and LaMnO3–PP-2_850 samples, there was a weak but sharp peak at pore diame-ter = 3.4–4.0 nm (Fig. 4B(c–f) and Fig. S4 of the Supplementarydata). On the other hand, a wide pore-size distribution (from 10to 80 nm) was recorded for the LaMnO3–PEG, LaMnO3–PP-1, LaM-nO3–PP-2, and LaMnO3–PP-3 samples. For all of the samples, theremight also be the presence of a small amount of micropores inview of the decrease of dV/d(log(D)) with the increase of pore sizein the range of 2–4 nm (Fig. S4 of Supplementary data). As can beseen in Table 1, the bulk LaMnO3 sample possesses low surfacearea (7.3 m2/g), whereas the porous LaMnO3 samples exhibitsmuch higher surface areas (19–39 m2/g). With the addition ofPEG and/or P123, there is significant increase of surface area(31–39 m2/g) across the obtained 3DOM-structured LaMnO3 sam-ples, but with the rise of calcination temperature from 750 to850 or 950 �C, there is decline of surface area due to the partialdestruction of 3DOM structure and nanovoids on the macroporeskeletons. It should be noted that the use of PEG or P123 causeda change in average pore size of the macropores and nanovoidsof the LaMnO3 samples (Table 1).
3.3. Surface composition, Mn oxidation state, and oxygen species
The XPS technique is a powerful tool to investigate the surfaceelement compositions, metal oxidation states, and adsorbed spe-cies of solid materials. Table 2 summarizes the surface elementcompositions of the LaMnO3 samples. It can be observed that thesurface La/Mn atomic ratios of the LaMnO3–MeOH and LaMnO3–PEG samples were higher than the nominal (stoichiometric) La/Mn atomic ratio (1.00), indicating La enrichment on the surfaceof the two samples. The surface La/Mn atomic ratio of the LaM-nO3–PP-1 sample was rather close to 1, indicative of the formationof uniform LaMnO3 phase. For the other samples, however, the sur-face La/Mn atomic ratios were lower than 1.00, suggesting thatthere was Mn enrichment on the surface of these samples. Similarphenomena were observed by other researchers [13]. The surface

Table 2Surface element compositions, H2 consumption, and catalytic activities of as-prepared LaMnO3 samples under the conditions of toluene concentration = 1000 ppm, toluene/oxygen molar ratio = 1:400, and SV = 20,000 mL/(g h).
Catalyst La/Mnatomic ratioa
Mn/(La + Mn + O)atomic ratioa
Oads/Olatt2�
molar ratioMn4+/Mn3+
molar ratioH2 consumptionb (mmol/g) Toluene oxidation activity (�C)
<500 �C P500 �C T10% T50% T90%
LaMnO3–bulk 1.01 (1.00) 0.19 (0.20) 0.90 1.20 0.97 2.17 220 267 298LaMnO3–MeOH 1.10 (1.00) 0.17 (0.20) 0.89 1.18 1.45 1.79 201 252 275LaMnO3–PEG 1.07 (1.00) 0.17 (0.20) 0.95 0.97 1.55 1.83 189 241 262LaMnO3–PP-1 1.01 (1.00) 0.18 (0.20) 1.13 1.36 1.52 2.32 181 232 253LaMnO3–PP-2 0.92 (1.00) 0.18 (0.20) 1.39 1.31 1.72 1.87 169 222 243LaMnO3–PP-3 0.95 (1.00) 0.19 (0.20) 1.17 1.16 1.75 1.72 170 225 247LaMnO3–PP-2_850 0.93 (1.00) 0.19 (0.20) 1.13 1.03 1.50 1.85 190 241 258LaMnO3–PP-2_950 0.94 (1.00) 0.19 (0.20) 1.08 0.83 1.24 1.56 198 253 278
a These data in parenthesis are the nominal La/Mn or Mn/(La + Mn + O) atomic ratios.b Data based on quantitative analysis of H2-TPR profiles.
525 527 529 531 533 535
Binding energy (eV)
Inte
nsi
ty (a
.u.)
529.2531.5
(B) O 1s
(a)
(b)
(c)
(d)
(e)
(f)
(g)
637 639 641 643 645 647 649
Binding energy (eV)
Inte
nsi
ty (
a.u
.)
641.5 643.0
(A) Mn 2p3/2
(a)
(b)
(c)
(d)
(e)
(f)
(g)
Fig. 5. (A) Mn 2p3/2 and (B) O 1s XPS spectra of (a) LaMnO3–MeOH, (b) LaMnO3–PEG, (c) LaMnO3–PP-1, (d) LaMnO3–PP-2, (e) LaMnO3–PP-3, (f) LaMnO3–PP-2_850, and (g)LaMnO3–PP-2_950.
Y. Liu et al. / Journal of Catalysis 287 (2012) 149–160 155
Mn/(La + Mn + O) molar ratios of the as-prepared samples werelower than 0.20.
Fig. 5 shows the Mn 2p3/2 and O 1s XPS spectra of the LaMnO3
samples. It is commonly reported that there are Mn4+ and Mn3+
species in LaMnO3. It is observed from Fig. 5A that there was anasymmetrical Mn 2p3/2 signal at BE = ca. 642 eV for each sampleand this signal could be deconvoluted into two components atBE = 641.5 and 643.0 eV, the former was assignable to the Mn3+
species whereas the latter to the Mn4+ species [31]. By quantita-tively analyzing the spectra, one can realize that there was a differ-ence in surface Mn4+/Mn3+ molar ratio of these LaMnO3 samples,indicating that the preparation approach had an influence on sur-face Mn4+ concentration. With the addition of surfactant P123, thesurface Mn4+/Mn3+ molar ratios of the LaMnO3–PP samples in-creased, with the LaMnO3–PP-1 and LaMnO3–PP-2 samples show-ing higher values (1.31–1.36). A rise in calcination temperature,however, resulted in a marked drop in surface Mn4+/Mn3+ molarratio. It means that the surface Mn4+ content tended to decreasewith increasing calcination temperature, in agreement with the re-sult observed by Wang et al. [32].
By using the curve-fitting approach, one can decompose theasymmetrical O 1s XPS peak at BE = ca. 530 eV of each sample intotwo components, one at 529.2 eV and the other at 531.5 eV(Fig. 5B). The peak at BE = 529.2 eV was attributed to the surfacelattice oxygen ðO2�
lattÞ species, whereas that at BE = 531.5 eV to theadsorbed oxygen (O�, O2
� or O2�2 ) species [13,33]. These oxygen
adspecies were strongly adsorbed on the surface oxygen vacanciesof the perovskite-type oxide catalysts [33,34], and most of themcould be retained on the catalyst surface at RT even under vacuumconditions. Among the LaMnO3 samples investigated in the presentstudy, the LaMnO3–PP-2 sample exhibited the highest surfaceOads=O2�
latt molar ratio (1.39), indicating that a higher surface areawas beneficial for the enhancement of oxygen species on the sur-face, in consistence with the result observed in our previous study[26]. With the rise in calcination temperature, there was decline inthe amount of surface oxygen adspecies; nonetheless, the amountwas still higher than that of the bulk LaMnO3 sample.
3.4. Reducibility
H2-TPR experiments were conducted to investigate the reduc-ibility of the LaMnO3 samples, and the recorded profiles are illus-trated in Fig. 6A. For each sample, two reduction steps wereclearly observed, one in the range of 190–500 �C and the other inthe range of 600–890 �C. For the LaMnO3–MeOH, LaMnO3–PEG,LaMnO3–PP-1–3, and LaMnO3–PP-2_850 samples, there was ashoulder centered in the 390–404 �C range. The reduction bandsbelow 450 �C were due to the reduction of Mn4+ to Mn3+ as wellas the removal of a small amount of oxygen adspecies, whereasthe ones above 600 �C were due to the reduction of Mn3+ to Mn2+
[33,35]. The reduction bands of the bulk LaMnO3 sample appearedat temperatures higher than those of the porous counterparts.

0
2
4
6
8
10
1.65 1.75 1.85 1.95 2.05
1000/T (K-1)
+ (a)(b)(c)(d)(e)(f)(g)(h)
(B)
50 150 250 350 450 550 650 750 850
Temperature (oC)
H2
cons
umed
(a.
u.)
768
744
763
295 397
287
320
(a)
(b)
(c)
(d)
(e) 392749
291395294
761
705
721326
327
(f)
(g)
(A)
348830
389
(h)
404
393
Fig. 6. (A) H2-TPR profiles and (B) initial H2 consumption rate as a function of inverse temperature of (a) LaMnO3–bulk, (b) LaMnO3–MeOH, (c) LaMnO3–PEG, (d) LaMnO3–PP-1, (e) LaMnO3–PP-2, (f) LaMnO3–PP-3, (g) LaMnO3–PP-2_850, and (h) LaMnO3–PP-2_950.
156 Y. Liu et al. / Journal of Catalysis 287 (2012) 149–160
The difference in reduction temperature of these porous LaMnO3
samples could be dependent on the preparation method. The H2-TPR results demonstrate that the porous LaMnO3 samples weremore reducible than the bulk counterpart. Through quantitativeanalysis of the H2-TPR profiles, one can obtain the H2 consumptionof each sample, as summarized in Table 2. When the manganeseions in LaMnO3 were Mn3+ or Mn4+, and completely reduced toMn2+, the theoretical H2 consumption of LaMnO3 would be 2.07and 4.13 mmol/g, respectively. Clearly, the total H2 consumption(2.8–3.84 mmol/g) calculated from the H2-TPR profiles of the as-prepared LaMnO3 catalysts fell into the theoretical H2 consumptionrange of 2.07–4.13 mmol/g. Therefore, we deduce that therewas the co-presence of Mn3+ and Mn4+ in the LaMnO3 catalysts,coinciding with the results of XPS investigation (Fig. 5 and Table2). For the bulk LaMnO3 and porous LaMnO3 samples, the H2
consumption at lower temperatures (<500 �C) was 0.97 and 1.24–1.75 mmol/g, whereas that at higher temperatures (P500 �C) was2.17 and 1.56–2.32 mmol/g, respectively. Apparently, the low-temperature H2 consumption of the porous samples was muchlarger than that of the bulk sample. Furthermore, the poroussamples with higher surface areas consumed more amounts ofH2 during the reduction process at low temperatures.
It is known that the reducibility of a catalyst can be effectivelyevaluated by using the initial (where less than 25% oxygen in thesample was consumed for the first reduction band) H2 consumptionrate [36]. Fig. 6B shows the initial H2 consumption rate versus in-verse temperature of the as-prepared LaMnO3 samples. It can beclearly seen that the initial H2 consumption rates of the samplesfollowed the sequences of LaMnO3–PP-2 > LaMnO3–PP-2_850 >LaMnO3–PP-2_950 as well as LaMnO3–PP-2 > LaMnO3–PP-3 > LaM-nO3–PP-1 > LaMnO3–PEG � LaMnO3–MeOH > LaMnO3–bulk. Thetrends are in good agreement with the orders of catalytic perfor-mance shown in Section 3.5.
3.5. Catalytic performance
In the blank experiment (only quartz sands were loaded), noconversion of toluene was observed below 400 �C, indicating thatunder the adopted reaction conditions, there is no occurrence ofhomogeneous reactions. Fig. 7 shows the catalytic performanceof the as-synthesized LaMnO3 samples for the oxidation of toluene.It can be clearly observed that toluene conversion increased withthe rise in reaction temperature, and the porous LaMnO3 catalystsperformed much better than the bulk LaMnO3 catalyst. Accordingto the Weisz–Prater criterion, when the effectiveness factor
g P 0.95 and reaction order n = 1, the dimensionless Weisz–Praterparameter (uWP) value is less than 0.3, which can be considered asufficient condition for the absence of significant pore diffusionlimitations [37]. At toluene conversion 620%, we carried out theWeisz–Prater analysis and calculated the uWP values, which werein the range of 0.011–0.056. Obviously, the uWP values obtainedin our present work were much less than 0.3. Therefore, no signif-icant mass transfer limitations existed in our catalytic system. It isworth pointing out that toluene was completely oxidized to CO2
and H2O over the as-prepared LaMnO3 catalysts, and there is nodetection of products of incomplete oxidation, as confirmed bythe good carbon balance of ca. 99.5% in each run. It is convenientto compare the catalytic activities of these samples by adoptingthe reaction temperatures T10%, T50%, and T90% (corresponding tothe toluene conversion = 10%, 50%, and 90%), as summarized inTable 2. Among the LaMnO3 samples, 3DOM-structured LaMnO3–PP-2 with the highest BET surface area showed the best catalyticactivity, and the T50% and T90% were ca. 222 and 243 �C, respec-tively, which were 45 and 55 �C lower than those achieved overthe bulk LaMnO3 catalyst derived by the conventional citric acid-complexing method (surface area = 7.3 m2/g). Furthermore, therise in calcination temperature resulted in drop of catalytic perfor-mance of LaMnO3 (Fig. 7B and Table 2). When the calcination tem-perature rose from 750 to 850 or 950 �C, the T50% and T90% valuesincreased to 241 and 258 �C, and 253 and 278 �C, respectively.The rise in calcination temperature caused the undermining ofthe 3DOM structure and the growth of LaMnO3 crystallites (Figs.2k–n, 3p, q, s, and t), as reflected in the significant decrease inBET surface area from 39.4 m2/g (at 750 �C) to 27.3 m2/g (at850 �C) or to 19.0 m2/g (at 950 �C). The changing trends in tolueneconsumption rate versus reaction temperature (Fig. 7C and D) weresimilar to those in toluene conversion versus reaction temperature(Fig. 7A and B) obtained over these LaMnO3 catalysts. It is henceconcluded that the catalytic activity decreased in the orders ofLaMnO3–PP-2 > LaMnO3–PP-2_850 > LaMnO3–PP-2_950 as wellas LaMnO3–PP-2 > LaMnO3–PP-3 > LaMnO3–PP-1 > LaMnO3–PEG > LaMnO3–MeOH > LaMnO3–bulk (Fig. 7A and B and Table2), coinciding with the sequences of low-temperature reduc-ibility (i.e., initial H2 consumption rate). According to the activ-ity data and moles of Mn in the LaMnO3 catalysts, we calculatedthe turnover frequencies (TOFs), and the results are shown inTable 3 and Fig. S5 of the Supplementary data. It is observedthat the TOF value over each of the as-prepared catalystsincreased with a rise in reaction temperature. Under thesame temperature, the TOF values over the 3DOM-structured

0
20
40
60
80
100
100 140 180 220 260 300
Temperature (oC)
Tol
uene
con
vers
ion
(%)
LaMnO3-bulkLaMnO3-MeOHLaMnO3-PEGLaMnO3-PP-1
LaMnO 3-PP-2LaMnO3-PP-3
(A)LaMnO3-PP-2LaMnO3-PP-2_850LaMnO3-PP-2_950
(B)
0.00
0.05
0.10
0.15
0.20
0.25
(C)LaMnO3-PP-2LaMnO3-PP-2_850LaMnO3-PP-2_950
(D)
100 140 180 220 260 300
Temperature (oC)100 140 180 220 260 300
Temperature (oC)
0
20
40
60
80
100
Tol
uene
con
vers
ion
(%)
100 140 180 220 260
Temperature (oC)
0.00
0.05
0.10
0.15
0.20
0.25
LaMnO3-bulkLaMnO3-MeOHLaMnO3-PEGLaMnO3-PP-1
LaMnO 3-PP-2LaMnO3-PP-3
Fig. 7. (A and B) Toluene conversion and (C and D) toluene consumption rate as a function of reaction temperature over the as-prepared LaMnO3 catalysts under theconditions of toluene concentration = 1000 ppm, toluene/oxygen molar ratio = 1:400, and SV = 20,000 mL/(g h).
Table 3Turnover frequencies (TOFs), rate constants (k), pre-exponential factors (A), and activation energies (Ea) for the oxidation of toluene over the as-prepared LaMnO3 samples in thetemperature range of 100–200 �C.
Catalyst TOF (lmoltoluene/(molMn s)) k (s�1) A (s�1) Ea (kJ/mol)
100 �C 150 �C 180 �C 200 �C 100 �C 150 �C 180 �C 200 �C
LaMnO3–bulk 0.0058 0.24 1.52 3.93 1.07 � 10�4 4.43 � 10�3 2.85 � 10�2 7.72 � 10�2 4.25 � 109 97LaMnO3–MeOH 0.047 0.68 2.80 5.81 8.61 � 10�4 1.26 � 10�2 5.38 � 10�2 1.18 � 10�1 1.17 � 107 72LaMnO3–PEG 0.10 0.98 3.38 8.15 1.90 � 10�3 1.82 � 10�2 6.56 � 10�2 1.74 � 10�1 2.32 � 106 65LaMnO3–PP-1 0.17 1.87 5.31 9.51 3.11 � 10�3 3.52 � 10�2 1.07 � 10�1 2.09 � 10�1 1.44 � 106 62LaMnO3–PP-2 0.28 2.75 7.00 11.03 5.13 � 10�3 5.27 � 10�2 1.46 � 10�1 2.52 � 10�1 6.13 � 105 58LaMnO3–PP-3 0.29 2.82 7.00 11.27 5.23 � 10�3 5.42 � 10�2 1.46 � 10�1 2.58 � 10�1 6.15 � 105 57LaMnO3–PP-2_850 0.13 1.33 4.51 7.95 2.33 � 10�3 2.49 � 10�2 8.94 � 10�2 1.69 � 10�1 1.69 � 106 63LaMnO3–PP-2_950 0.040 0.71 3.00 5.66 7.26 � 10�4 1.31 � 10�2 5.77 � 10�2 1.15 � 10�1 2.44 � 107 75
Y. Liu et al. / Journal of Catalysis 287 (2012) 149–160 157
LaMnO3 catalysts were much higher than that over the bulkcounterpart, with the LaMnO3–PP-2 and LaMnO3–PP-3 cata-lysts giving the highest TOF values.
The effects of SV and toluene/O2 molar ratio on the catalyticactivity of the LaMnO3–PP-2 sample were examined, and the re-sults are shown in Fig. 8. As expected, there was a general trendof activity decrease at elevated SV values (Fig. 8A). AtSV = 5000 h�1, the T50% and T90% values were 209 and 233 �C,respectively, which were ca. 13 and 10 �C lower than thoseachieved at SV = 20,000 h�1. Further rise of SV to 40,000 h�1 re-sulted in a drop in catalytic activity of the LaMnO3–PP-2 sample.As for the influence of oxygen concentration, a drop of toluene/O2 molar ratio from 1:50 to 1:100 caused the T90% value to decreasefrom 274 to 256 �C; when the toluene/O2 molar ratio was 1:400,the T90% value decreased to 243 �C (Fig. 8B). It is clear that the in-crease in O2 concentration of the reactant feed had a positive effecton the enhancement of toluene conversion. The result implies that
the oxygen adspecies on the catalyst surface played an importantrole in the total oxidation of toluene. In other words, the oxygennonstoichiometry related to structural defects might be a criticalfactor in determining the catalytic performance of the LaMnO3
sample. A higher oxygen concentration in feedstock might be ben-eficial for the better replenishing of active oxygen adspecies thatwere consumed due to their reaction with toluene. To examinethe stability of catalytic performance, we carried out the experi-ments with temperature going down and then up again, and theresults are shown in Fig. S6 of the Supplementary data. Obviously,the catalytic activities measured with temperature going down andthen up again of the samples were rather close, indicating that thecatalysts were stable. The on-stream reaction experiment con-ducted over the LaMnO3–PP-2 catalyst indicates that there wasno significant drop in catalytic activity within 48 h (Fig. 9). In addi-tion, the XRD pattern (Fig. S7 of Supplementary data) of the usedLaMnO3–PP-2 sample was similar to that of the as-prepared

Toluene/O2
molar ratio1/501/1001/2001/400
(B)
0
20
40
60
80
100
100 140 180 220 260
Temperature (oC)
Tol
uene
con
vers
ion
(%)
SV (mL/(g h))5,00010,00020,00040,000
(A)
100 140 180 220 260
Temperature (oC)
0
20
40
60
80
100
Tol
uene
con
vers
ion
(%)
Fig. 8. Catalytic performance of the LaMnO3–PP-2 sample as a function of reaction temperature at (A) toluene concentration = 1000 ppm, toluene/O2 molar ratio = 1:400, anddifferent SV values and (B) toluene concentration = 1000 ppm, SV = 20,000 mL/(g h), and various toluene/O2 molar ratios.
50
60
70
80
90
100
0 10 20 30 40 50
On-stream reaction time (h)
Tol
uene
con
vers
ion
(%)
Fig. 9. Catalytic activity as a function of on-stream reaction time over the LaMnO3–PP-2 catalyst for toluene oxidation under the conditions of toluene concentra-tion = 1000 ppm, toluene/O2 molar ratio = 1:400, reaction temperature = 243 �C,and SV = 20,000 mL/(g h).
158 Y. Liu et al. / Journal of Catalysis 287 (2012) 149–160
counterpart. Therefore, we conclude that the as-prepared 3DOM-structured LaMnO3 samples were catalytically durable.
The catalytic performance (T50% = 222 �C and T90% = 243 �C atSV = 20,000 mL/(g h); T50% = 236 �C and T90% = 261 �C at SV =40,000 mL/(g h)) over our 3DOM-structured LaMnO3–PP-2 catalystwas much better than those (T50% = 254 �C and T90% = 295 �Cat 178 h�1) over LaMnO3 [6], (T50% = 279 �C and T90% = 306 �C at178 h�1) over LaCoO3 [6], (T50% = 233 �C and T90% = 258 �C at36,000 mL/(g h)) over 30 wt.% Co3O4–CeO2 [38], (T50% = 270 �Cand T90% = 300 �C at 186 h�1) over 5 wt.% Au/CeO2 [39], similar tothat (T50% = 175 �C and T90% = 250 �C at 18,000 mL/(g h)) over0.5 wt.% Pd/LaMnO3 [40], but inferior to those (T50% = 235 �C andT90% = 250 �C at 50,000 mL/(g h)) over 50 wt.% MnOx–50 wt.%CeO2 [41] and (T50% = 202 �C and T90% = 221 �C at 20,000 mL/(g h))over the Sr-doped lanthanum manganate (La0.8Sr0.2MnO3) [3].
It is well known that the catalytic performance of an ABO3
material is associated with the surface area, defect nature and den-sity, oxygen adspecies, and reducibility. A higher surface area isbeneficial for the improvement of catalytic activity [11,42]. Thepresence of oxygen deficiencies favors the activation of gas-phaseoxygen molecules for the generation of active oxygen adspecies,the higher the oxygen vacancy density, the better the catalytic per-formance of a perovskite sample [8,43]. The strong redox ability ofABO3 guarantees the recyclability of B-site ions (with at least twooxidation states), thus facilitating the oxidation of organic com-pounds [44]. Compared to bulk LaMnO3, the 3DOM-structuredLaMnO3–PP-1–3 samples are much smaller in particle size, higherin surface area, larger in surface oxygen adspecies and Mn4+ con-centration as well as much better in terms of low-temperaturereducibility (Tables 1 and 2 and Figs. 1–6). These unique charactersof the 3DOM-structured LaMnO3–PP-1–3 samples render thembetter activity in catalyzing the total oxidation of toluene. We de-duce that the excellent catalytic performance of the LaMnO3–PP-1–3 samples is a combined result of the high-quality 3DOM architec-ture with nanovoid skeletons, high oxygen adspecies concentra-tion, and good low-temperature reducibility.
3.6. Kinetic parameters
In the past years, there have been reports on the kinetics of cat-alytic oxidation of VOCs. For example, Wong et al. claimed that theoxidation of butyl acetate over the AgZSM-5 catalyst was first or-der toward butyl acetate concentration and zero toward oxygenconcentration [45]; by assuming a first-order kinetics with respectto toluene and a zero-order kinetics with respect to oxygen, Alifan-ti et al. obtained good linear Arrhenius plots for the oxidation oftoluene over ceria–zirconia-supported LaCoO3 catalysts [46].
Therefore, it is reasonable to suppose that the oxidation of toluenein the presence of excess oxygen (toluene/O2 molar ratio = 1:50–1:400) would obey a first-order reaction mechanism with respectto toluene concentration (c):
r ¼ �kc ¼ ð�A expð�Ea=RTÞÞc ð1Þ
where r is the reaction rate (mol/s), k the rate constant (s�1), A thepre-exponential factor, and Ea the apparent activation energy (kJ/mol). The k values could be calculated from the reaction rates andreactant conversions at different SV and reaction temperatures.
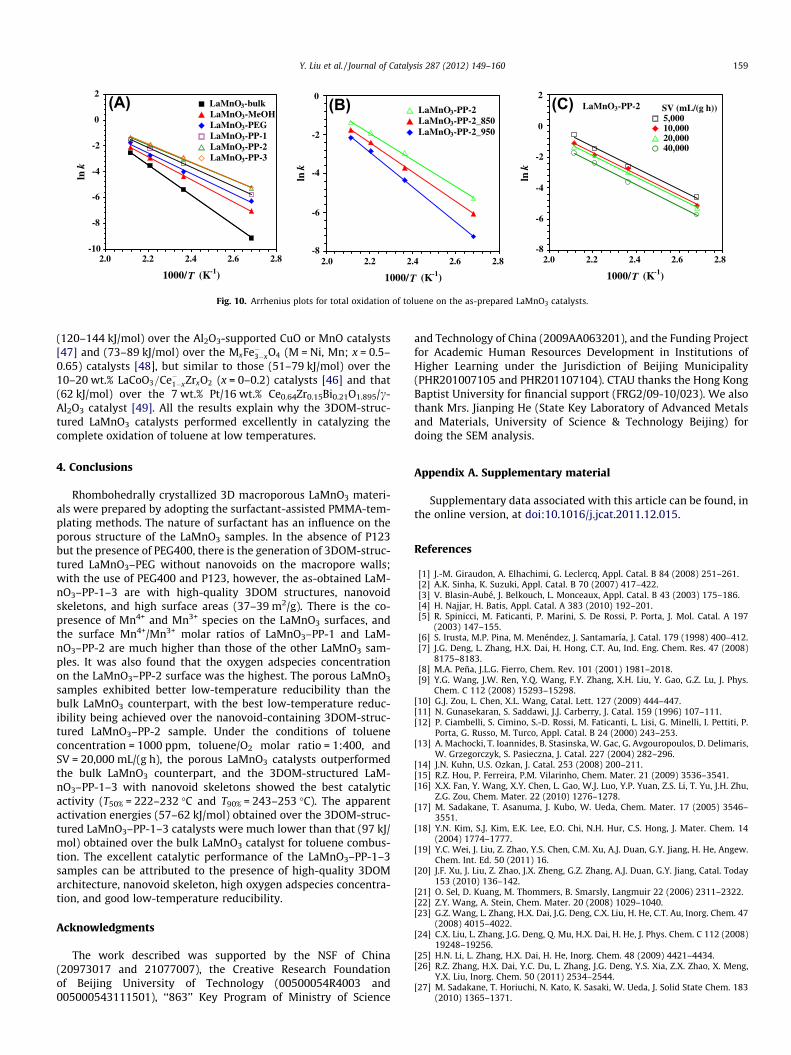
Fig. 10 shows the Arrhenius plots for the oxidation of toluene attoluene conversion <20% (at which the reaction temperature rangewas 100–200 �C) over the as-prepared LaMnO3 catalysts. Accordingto the slopes of the Arrhenius plots, one can calculate the rate con-stants, pre-exponential factors, and apparent activation energies oftoluene oxidation over these catalysts, as summarized in Table 3. Itcan be clearly seen that the k value increased with the rise in tem-perature for each catalyst; at the same temperature, however, the kvalues for the porous LaMnO3 catalysts were much higher than thatfor the bulk LaMnO3 catalyst (despite its A value was the highest),with the highest k values being achieved over the 3DOM-structuredLaMnO3–PP-2 and LaMnO3–PP-3 catalysts (despite lower A values).The Ea value (97 kJ/mol) of the bulk LaMnO3 catalyst was muchhigher than those (57–75 kJ/mol) of the porous LaMnO3 catalysts,with the 3DOM-structured LaMnO3–PP-1 and LaMnO3–PP-3catalysts exhibiting the lowest Ea values (57–58 kJ/mol). The Ea
values obtained over the 3DOM-structured LaMnO3–PP-1–3catalysts for toluene oxidation were much lower than those
-10
-8
-6
-4
-2
0
2
2.0 2.2 2.4 2.6 2.8
1000/T (K-1)
ln k
(A) LaMnO3-bulkLaMnO3-MeOHLaMnO3-PEGLaMnO3-PP-1LaMnO3-PP-2LaMnO3-PP-3
SV (mL/(g h))5,00010,00020,00040,000
(C) LaMnO3-PP-2LaMnO3-PP-2LaMnO3-PP-2_850LaMnO3-PP-2_950
(B)
2.0 2.2 2.4 2.6 2.8
1000/T (K-1)
2.0 2.2 2.4 2.6 2.8
1000/T (K-1)
-8
-6
-4
-2
0
ln k
-8
-6
-4
-2
0
2
ln k
Fig. 10. Arrhenius plots for total oxidation of toluene on the as-prepared LaMnO3 catalysts.
Y. Liu et al. / Journal of Catalysis 287 (2012) 149–160 159
(120–144 kJ/mol) over the Al2O3-supported CuO or MnO catalysts[47] and (73–89 kJ/mol) over the MxFe�3�xO4 (M = Ni, Mn; x = 0.5–0.65) catalysts [48], but similar to those (51–79 kJ/mol) over the10–20 wt.% LaCoO3=Ce�1�xZrxO2 (x = 0–0.2) catalysts [46] and that(62 kJ/mol) over the 7 wt.% Pt/16 wt.% Ce0.64Zr0.15Bi0.21O1.895/c-Al2O3 catalyst [49]. All the results explain why the 3DOM-struc-tured LaMnO3 catalysts performed excellently in catalyzing thecomplete oxidation of toluene at low temperatures.
4. Conclusions
Rhombohedrally crystallized 3D macroporous LaMnO3 materi-als were prepared by adopting the surfactant-assisted PMMA-tem-plating methods. The nature of surfactant has an influence on theporous structure of the LaMnO3 samples. In the absence of P123but the presence of PEG400, there is the generation of 3DOM-struc-tured LaMnO3–PEG without nanovoids on the macropore walls;with the use of PEG400 and P123, however, the as-obtained LaM-nO3–PP-1–3 are with high-quality 3DOM structures, nanovoidskeletons, and high surface areas (37–39 m2/g). There is the co-presence of Mn4+ and Mn3+ species on the LaMnO3 surfaces, andthe surface Mn4+/Mn3+ molar ratios of LaMnO3–PP-1 and LaM-nO3–PP-2 are much higher than those of the other LaMnO3 sam-ples. It was also found that the oxygen adspecies concentrationon the LaMnO3–PP-2 surface was the highest. The porous LaMnO3
samples exhibited better low-temperature reducibility than thebulk LaMnO3 counterpart, with the best low-temperature reduc-ibility being achieved over the nanovoid-containing 3DOM-struc-tured LaMnO3–PP-2 sample. Under the conditions of tolueneconcentration = 1000 ppm, toluene/O2 molar ratio = 1:400, andSV = 20,000 mL/(g h), the porous LaMnO3 catalysts outperformedthe bulk LaMnO3 counterpart, and the 3DOM-structured LaM-nO3–PP-1–3 with nanovoid skeletons showed the best catalyticactivity (T50% = 222–232 �C and T90% = 243–253 �C). The apparentactivation energies (57–62 kJ/mol) obtained over the 3DOM-struc-tured LaMnO3–PP-1–3 catalysts were much lower than that (97 kJ/mol) obtained over the bulk LaMnO3 catalyst for toluene combus-tion. The excellent catalytic performance of the LaMnO3–PP-1–3samples can be attributed to the presence of high-quality 3DOMarchitecture, nanovoid skeleton, high oxygen adspecies concentra-tion, and good low-temperature reducibility.
Acknowledgments
The work described was supported by the NSF of China(20973017 and 21077007), the Creative Research Foundationof Beijing University of Technology (00500054R4003 and005000543111501), ‘‘863’’ Key Program of Ministry of Science
and Technology of China (2009AA063201), and the Funding Projectfor Academic Human Resources Development in Institutions ofHigher Learning under the Jurisdiction of Beijing Municipality(PHR201007105 and PHR201107104). CTAU thanks the Hong KongBaptist University for financial support (FRG2/09-10/023). We alsothank Mrs. Jianping He (State Key Laboratory of Advanced Metalsand Materials, University of Science & Technology Beijing) fordoing the SEM analysis.
Appendix A. Supplementary material
Supplementary data associated with this article can be found, inthe online version, at doi:10.1016/j.jcat.2011.12.015.
References
[1] J.-M. Giraudon, A. Elhachimi, G. Leclercq, Appl. Catal. B 84 (2008) 251–261.[2] A.K. Sinha, K. Suzuki, Appl. Catal. B 70 (2007) 417–422.[3] V. Blasin-Aubé, J. Belkouch, L. Monceaux, Appl. Catal. B 43 (2003) 175–186.[4] H. Najjar, H. Batis, Appl. Catal. A 383 (2010) 192–201.[5] R. Spinicci, M. Faticanti, P. Marini, S. De Rossi, P. Porta, J. Mol. Catal. A 197
(2003) 147–155.[6] S. Irusta, M.P. Pina, M. Menéndez, J. Santamaría, J. Catal. 179 (1998) 400–412.[7] J.G. Deng, L. Zhang, H.X. Dai, H. Hong, C.T. Au, Ind. Eng. Chem. Res. 47 (2008)
8175–8183.[8] M.A. Peña, J.L.G. Fierro, Chem. Rev. 101 (2001) 1981–2018.[9] Y.G. Wang, J.W. Ren, Y.Q. Wang, F.Y. Zhang, X.H. Liu, Y. Gao, G.Z. Lu, J. Phys.
Chem. C 112 (2008) 15293–15298.[10] G.J. Zou, L. Chen, X.L. Wang, Catal. Lett. 127 (2009) 444–447.[11] N. Gunasekaran, S. Saddawi, J.J. Carberry, J. Catal. 159 (1996) 107–111.[12] P. Ciambelli, S. Cimino, S.-D. Rossi, M. Faticanti, L. Lisi, G. Minelli, I. Pettiti, P.
Porta, G. Russo, M. Turco, Appl. Catal. B 24 (2000) 243–253.[13] A. Machocki, T. Ioannides, B. Stasinska, W. Gac, G. Avgouropoulos, D. Delimaris,
W. Grzegorczyk, S. Pasieczna, J. Catal. 227 (2004) 282–296.[14] J.N. Kuhn, U.S. Ozkan, J. Catal. 253 (2008) 200–211.[15] R.Z. Hou, P. Ferreira, P.M. Vilarinho, Chem. Mater. 21 (2009) 3536–3541.[16] X.X. Fan, Y. Wang, X.Y. Chen, L. Gao, W.J. Luo, Y.P. Yuan, Z.S. Li, T. Yu, J.H. Zhu,
Z.G. Zou, Chem. Mater. 22 (2010) 1276–1278.[17] M. Sadakane, T. Asanuma, J. Kubo, W. Ueda, Chem. Mater. 17 (2005) 3546–
3551.[18] Y.N. Kim, S.J. Kim, E.K. Lee, E.O. Chi, N.H. Hur, C.S. Hong, J. Mater. Chem. 14
(2004) 1774–1777.[19] Y.C. Wei, J. Liu, Z. Zhao, Y.S. Chen, C.M. Xu, A.J. Duan, G.Y. Jiang, H. He, Angew.
Chem. Int. Ed. 50 (2011) 16.[20] J.F. Xu, J. Liu, Z. Zhao, J.X. Zheng, G.Z. Zhang, A.J. Duan, G.Y. Jiang, Catal. Today
153 (2010) 136–142.[21] O. Sel, D. Kuang, M. Thommers, B. Smarsly, Langmuir 22 (2006) 2311–2322.[22] Z.Y. Wang, A. Stein, Chem. Mater. 20 (2008) 1029–1040.[23] G.Z. Wang, L. Zhang, H.X. Dai, J.G. Deng, C.X. Liu, H. He, C.T. Au, Inorg. Chem. 47
(2008) 4015–4022.[24] C.X. Liu, L. Zhang, J.G. Deng, Q. Mu, H.X. Dai, H. He, J. Phys. Chem. C 112 (2008)
19248–19256.[25] H.N. Li, L. Zhang, H.X. Dai, H. He, Inorg. Chem. 48 (2009) 4421–4434.[26] R.Z. Zhang, H.X. Dai, Y.C. Du, L. Zhang, J.G. Deng, Y.S. Xia, Z.X. Zhao, X. Meng,
Y.X. Liu, Inorg. Chem. 50 (2011) 2534–2544.[27] M. Sadakane, T. Horiuchi, N. Kato, K. Sasaki, W. Ueda, J. Solid State Chem. 183
(2010) 1365–1371.

160 Y. Liu et al. / Journal of Catalysis 287 (2012) 149–160
[28] M. Sadakane, C. Takahashi, N. Kato, H. Ogihara, Y. Nodasaka, Y. Doi, Y. Hinatsu,W. Ueda, Bull. Chem. Soc. Jpn. 80 (2007) 677–685.
[29] M.C. Orilall, N.M. Abrams, J. Lee, F.J. Disalvo, U. Wiesner, J. Am. Chem. Soc. 130(2008) 8882–8883.
[30] M. Sadakane, T. Horiuchi, N. Kato, C. Takahashi, W. Ueda, Chem. Mater. 19(2007) 5779–5785.
[31] H.B. Deng, L. Lin, Y. Sun, C.S. Pang, J.P. Zhuang, P.K. Ouyang, Z.J. Li, S.J. Liu, Catal.Lett. 126 (2008) 106–111.
[32] X.L. Wang, D. Li, C.X. Shi, B. Li, T.Y. Cui, Z.D. Zhang, Physica B 405 (2010) 1362–1368.
[33] Y.J. Zhu, Y.Q. Sun, X.Y. Niu, F.L. Yuan, H.G. Fu, Catal. Lett. 135 (2010) 152–158.[34] B.P. Barbero, J.A. Gamboa, L.E. Cadús, Appl. Catal. B 65 (2006) 21–30.[35] A. Kaddouri, S. Ifrah, P. Gelin, Catal. Lett. 119 (2007) 237–244.[36] H.X. Dai, A.T. Bell, E. Iglesia, J. Catal. 221 (2004) 491–499.[37] S. Mukherjee, M.Albert Vannice, J. Catal. 243 (2006) 108–130.[38] L.F. Liotta, M. Ousmane, G. Di Carlo, G. Pantaleo, G. Deganello, A. Boreave, A.
Giroir-Fendler, Catal. Lett. 127 (2009) 270–276.
[39] S. Scirè, S. Minicò, C. Crisafulli, C. Satriano, A. Pistone, Appl. Catal. B 40 (2003)43–49.
[40] A. Musialik-Piotrowska, H. Landmesser, Catal. Today 137 (2008) 357–361.[41] D. Delimaris, T. Ioannides, Appl. Catal. B. 84 (2008) 303–312.[42] N. Yi, Y. Cao, Y. Su, W.-L. Dai, H.-Y. He, K.-N. Fan, J. Catal. 230 (2005)
249–253.[43] J.G. Deng, L. Zhang, H.X. Dai, H. He, C.T. Au, Appl. Catal. B 89 (2009)
87–96.[44] T. Nakamura, M. Misono, Y. Yoneda, Chem. Lett. 10 (1981) 1589–1592.[45] C.T. Wong, A.Z. Abdullah, S. Bhatia, J. Hazard. Mater. 157 (2008) 480–489.[46] M. Alifanti, M. Florea, S. Somacescu, V.I. Pârvulescu, Appl. Catal. B 60 (2005)
33–39.[47] S.M. Saqer, D.I. Kondarides, X.E. Verykios, Appl. Catal. B 103 (2011) 275–286.[48] M. Florea, M. Alifanti, V.I. Pârvulescu, D. Mihaila-Tarabasanu, L. Diamandescu,
M. Feder, C. Negrila, L. Frunza, Catal. Today 141 (2009) 361–366.[49] T. Masui, H. Imadzu, N. Matsuyama, N. Imanaka, J. Hazard. Mater. 176 (2010)
1106–1109.