Embed Size (px)
Citation preview
International Journal on Electrical Engineering and Informatics - Volume 10, Number 1, March 2018
Controlling 3-D Movement of Robot
Manipulator using Electrooculography
Muhammad Ilhamdi Rusydi1, Takeo Okamoto2, Satoshi Ito2 and Minoru Sasaki2
1Andalas University, Faculty of Engineering, Electrical Engineering Department, Padang City, Indonesia 2Gifu University, Faculty of Engineering, Mechanical Engineering, Gifu City, Japan
Abstract: EOG is a biosignal generated by eye activities. This research develops the use of
EOG signals in a new way. EOG was used to control a robot manipulator that reaches for a
target in 3-D area. Five properties of EOG signal were used, which were: threshold, polarity
of signal, integral of absolute EOG signals, peak and period of a wave. The use of these
properties allowed the apparatus to detect the EOG signals, estimate gaze distance and dis-
tinguish between gaze motion, voluntary blinks and involuntary blinks. Targets were re-
corded by two cameras that provided front and top views. The images were viewed on a
monitor one at a time with the active camera selected by voluntary blinking. EOG signals
were converted to pixel coordinates using an affine transform. The pixel coordinates were
then transformed into robot coordinates using the correlation between camera position, robot
position and monitor display. Robot coordinates of a target became end-effector position and
joint angles were derived through inverse kinematics. The result shows that this system could
reach target with approximately 90% accuracy. This system successfully improved the flexi-
bility of controlling a robot in three dimensions.
Keywords: biosignal, electrooculography, three dimensions, robot manipulator, camera
1. Introduction
Biosignal controlled technology has the potential to dramatically improve the quality of life
of people whose mobility and capacity to manipulate everyday equipment such as televisions
and telephones are restricted due to physical limitations. The number of people in this category
is increasing as global population ages. On other hand, world society is facing the trend of po-
pulation ageing. In general, the total of older people in the world (with age from 60 years) is
projected to increase from 901 million in 2015 to 1.4 billion to 2050 or an increase of 56 per cent
on average. In Asia, this number is predicted to be 66 per cent which is the second highest below
Latin America and Caribbean which are at 71 per cent [1]. Human ageing is closely related to
decrease of mass and the voluntary contraction of muscle [2]. This condition often causes a di-
sability on older people [3]. Based on WHO report on Ageing and Health 2011 [4], one disad-
vantage caused by the disability is reduced accessibility. People with disabilities might find dif-
ficulty even only to access basic needs, such as the television set and telephones. The contrary
condition happened when a technology is created to help these people. To tackle communication
issue between human and machine, bio-signal has emerged as an alternative method. There are
many types of bio-signals, which were grouped based on the source of signals. Electroencepha-
lography (EEG), electroneurography (ENG) and electroretinography (ERG) are bio-signals from
neural cells. Electrocardiography (ECG) and electromyography (EMG) are types of bio-signals
generated by muscle cells. Electrooculography (EOG) and electronystagmography (ENG) are
generated by other tissues in a human body. There are five main science fields which work to-
gether in the bio-signal subject, which are medicine, biology, physics, electronics and enginee-
ring [5]. The three main bio-signals widely used in augmented and alternative communication
are EEG, EMG and EOG [6].
Received: December 15th, 2016. Accepted: March 23rd, 2018
DOI: 10.15676/ijeei.2018.10.1.12
170
One of the bio-signals that are widely used in neuroscience is electrooculography (EOG) [7].
In 1848, Emis du Bois-Reymond found that polarity around a cornea is relatively positive to the
retina. EOG is generated by eye activities such as gaze motions and blinks [8]. Eye activities
change the magnitude of potential between the cornea and the retina [6]. In a review paper, wrote by Pinheiro, C.G. et al [5], there are two types of communication
between human and machine using bio-signals. The first is a switch based control which has a
binary function belonging to the signal event. The second is a proportional bio-signal system
which has a function as mouse movement. Since the EOG signal compared to EEG and EMG
has relatively high amplitude, linear to the eye movement distance, and is easy to detect, EOG
has a better opportunity to investigate in developing the proportional bio-signal.
Using EOG to perform specific some special tasks in daily activities is being developed in
various areas. These inventions improve the life quality of people in human machine interface.
EOG is usually captured by attaching electrodes to the skin around the subject’s eyes. Beside the
linearity, compared to EEG, EOG is easy to detect and the amplitude is relatively high. This
research used NF Instrument as the EOG sensor. This device had an amplifier (head box), a
processor box, and four electrodes. The electrodes consisted of a ground electrode, minus (refe-
rence) electrode, channel 1 (Ch1) and channel 2 (Ch2) electrodes. Three digital filters were given
by the processor boxes which were 1.6 Hz High Pass Filter, 60 Hz Low Pass Filter and 60 Hz
Ham Filter. Another 60 Hz Low Pass Filter was added to reduce electricity equipment noise.
There are three basic steps in human machine interface using EOG, which are amplifying and
acquisition EOG signal from human, pattern recognition to tracking the gaze motion, and action
to control a machine using the signal [9].
Lv, Zhao et al [10] investigated four eye directions (up, down, left and right) and eye blinks
using linear predictive coding cepstrum (LPCC) as the signal features. Spectral entropy was used
to detect the endpoint of signal. Dynamic time warping (DTW) was implemented to tackle the
duration difference between the reference and testing template. Banarje et al [11] tried to extract
three EOG features, which were wavelet coefficients, Power Spectral Density (PSD),and Auto
Regression (AR) model and combination of these, and classified them by two methods, K-nearest
neighbor (K-NN) and feed forward neural network method. This research concluded that neural
network classifier reached better accuracy than K-NN.
An auto-calibrating algorithm to detect eye movement and blink from EOG measurements
was also developed by [12]. The directions were distinguished into three groups: horizontal,
vertical and oblique. The distances were 2.5°, 5°, 7.5° and 10°. There were two signals: horizon-
tal EOG and vertical EOG, which were differentiated to calculate each peak. The proposed al-
gorithm worked on two threshold types: duration threshold (maximum peak duration and maxi-
mum blink duration) and bound threshold (saccade and blink). Integration of derivative AC
coupled EOG was the feature which was used by [13]. It said that this value had a proportional
correlation with eye displacement. This feature also clearly improved performance of gaze track-
ing compared to the peak amplitude.
EOG can be developed for health monitoring. It was used to classify normal and subnormal
eye condition with Artificial Neural Network (ANN) [14]. Detecting eye movement using EOG
was also implemented for health monitoring [15]. Eye movement also had correlation with driver
behavior [16]. Helped by EOG signal, driver behavior was studied to find characteristic of digital
display, evaluate possible misperceptions from rear view mirror images and to study about
speedometer position inside a car.
Beside the functions of EOG in medical and psychological, EOG also dealt with machine
control. Barea, R. et al [17] was concerned with assisting disabled people to control their wheel-
chairs using EOG. A computer and graphic user interface were attached to the wheelchair. Some
command functions appeared on the monitor to operate the wheelchair. Then a human computer
interface was developed by tackling the fatigue issue when an operator controlled the computer
functions using EOG signal. This study built EOG model through wavelet transform and neural
network with 2° accuracy [18].
Muhammad Ilhamdi Rusydi, et al.
171
Eye movement to control computer functions was studied by [19]. Horizontal and vertical
eye movements captured by EOG were transformed into cursor movements. A user interface
provided some alphabet letters which could be chosen by the operators. For people with a severe
motor disability, i.e., people who cannot move their arms, Lledo, L.D. et al [20] built an internet
browsing system based on EOG. Six operators subjecting themselves as volunteers to examine
this application performed three types of test: writing test, searching test and mouse controlling
test. The consumed times were calculated for each test. The result showed that all operators could
finish the challenges in a reasonable time and there was also a significant improvement with
increasing experience. EOG also control some gadget functions [21].
Combination between Electroencephalography (EEG) and EOG was developed by [22] to
control a robot to pick and place objects in three dimensional spaces. EEG was designed to con-
trol the robot in vertical movement, while the movement of the robot in horizontal was controlled
by EOG signals. Blink signal determined from EOG controlled the gripper to keep and release
the object.
In this study, a system controlled only by EOG to operate robot manipulator in 3-D area was
proposed. Two cameras were integrated into the system to give the front view and top view of
targets. The EOG signals were separated into gaze motions and blinks. The robot moved based
on the gaze motions and blinks switched the active camera. The linear relationship between EOG
signals and gaze motions was determined by affine transform. The system could detect voluntary
and involuntary blink. Active camera was flip-flopped based on the voluntary blink.
2. Electrooculography
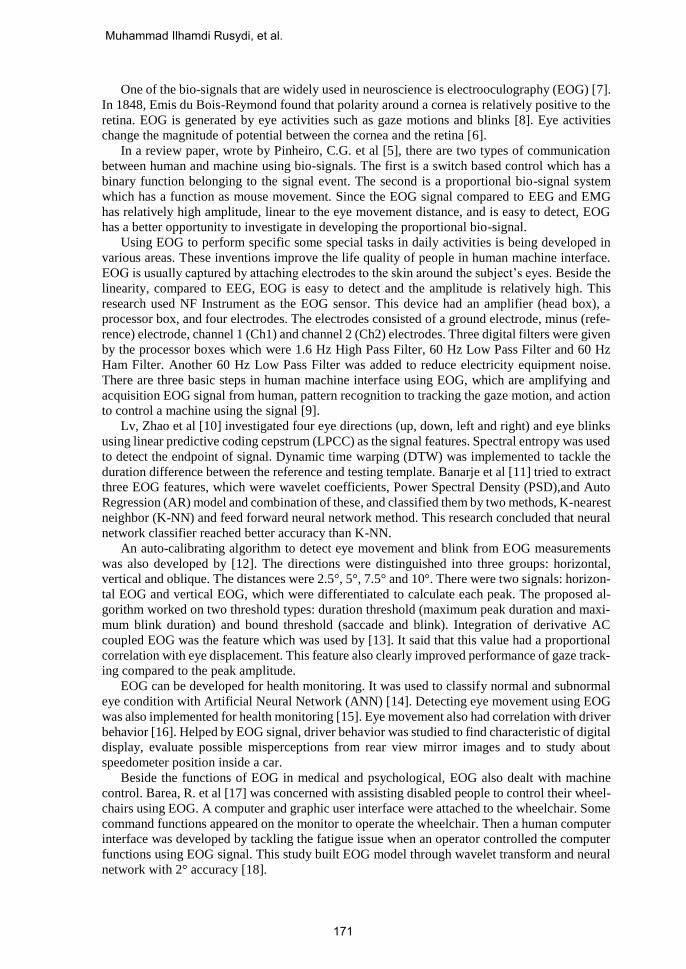
EOG signal was detected by an instrument sensor produced by the NF Corporation (Yoko-
hama, Japan) designed for this purpose. This sensor had four electrodes, channel 1 (Ch1), chan-
nel 2 (Ch2), minus and ground. These were calibrated in a previous research project [23]. Figure
1(a) shows the positions of electrodes on the face. A low impedance and high conductivity gel,
shown by Figure 1(b), (Elefix paste, series Z-401CE) produced by Nihon Konden was applied
to the electrodes where they would be attached to the skin. The NF Instrument consists of a Head
Box and a Processor Box, as shown in Figure 1(c).
(a) (b) (c)
Figure 1. (a) Positions of four electrodes. (b) Elefix paste to attach the electrodes to skin. (c)
5202-EEG Head Box and 5201-Processor Box of NF Instruments as the EOG sensor.
The electrodes on the face sent the data to Head Box. This box amplified the signals before
sending them to the 5201-Processor Box. The signals were filtered by embedded filters in the
processing box. The filters used were a 60 Hz low pass filter (LPF), a 1.6 Hz high-pass filter
(HPF), 60 Hz hum filter and an additional 60 Hz LPF electrical noise reducing low pass filter
(LPF) [24]. The sampling frequency was set to 100 Hz.
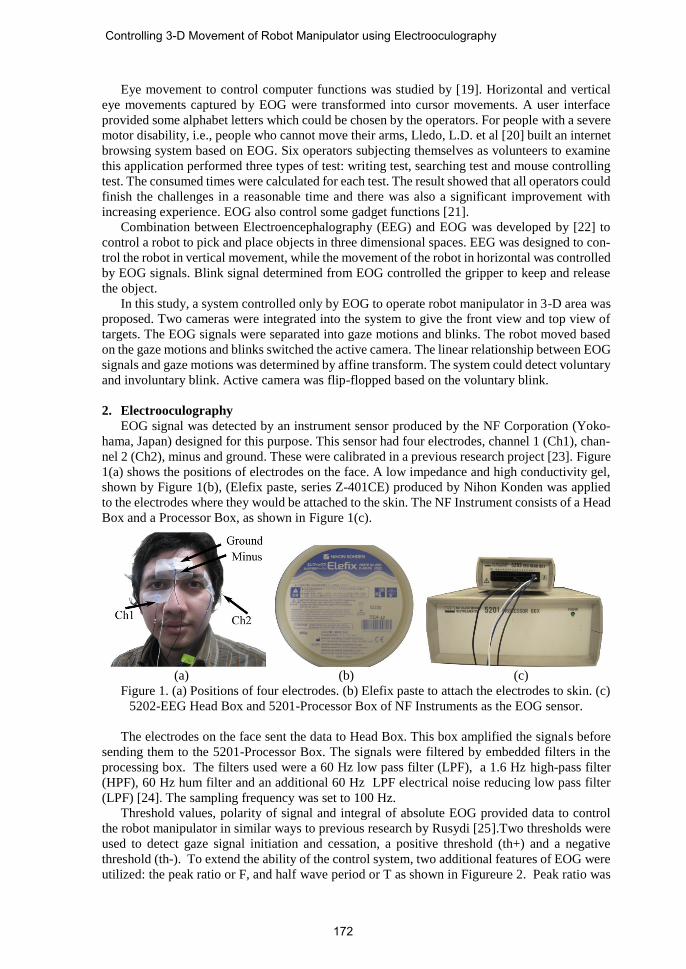
Threshold values, polarity of signal and integral of absolute EOG provided data to control
the robot manipulator in similar ways to previous research by Rusydi [25].Two thresholds were
used to detect gaze signal initiation and cessation, a positive threshold (th+) and a negative
threshold (th-). To extend the ability of the control system, two additional features of EOG were
utilized: the peak ratio or F, and half wave period or T as shown in Figureure 2. Peak ratio was
Controlling 3-D Movement of Robot Manipulator using Electrooculography
172
the ratio between positive and negative peak. Half period of an EOG wave was measured as the
time period between detection of the first gaze motion signal and the first subsequent zero signal
value. Eye activities were immediately detected when the EOG signal rose above the positive
threshold or dropped below the negative threshold. Values of the signal amplitude between po-
sitive and negative threshold indicated that the eye was not blinking or gazing.
Positive polarity of the EOG signal indicated that it was above the positive threshold. Polarity
was negative if a signal was detected passing through the negative threshold. The integral of
absolute EOG was determined by summing the EOG values for a full wave from the last time
the EOG signal was zero after passing the positive or negative threshold.
Figure 2. Five features of EOG signals.
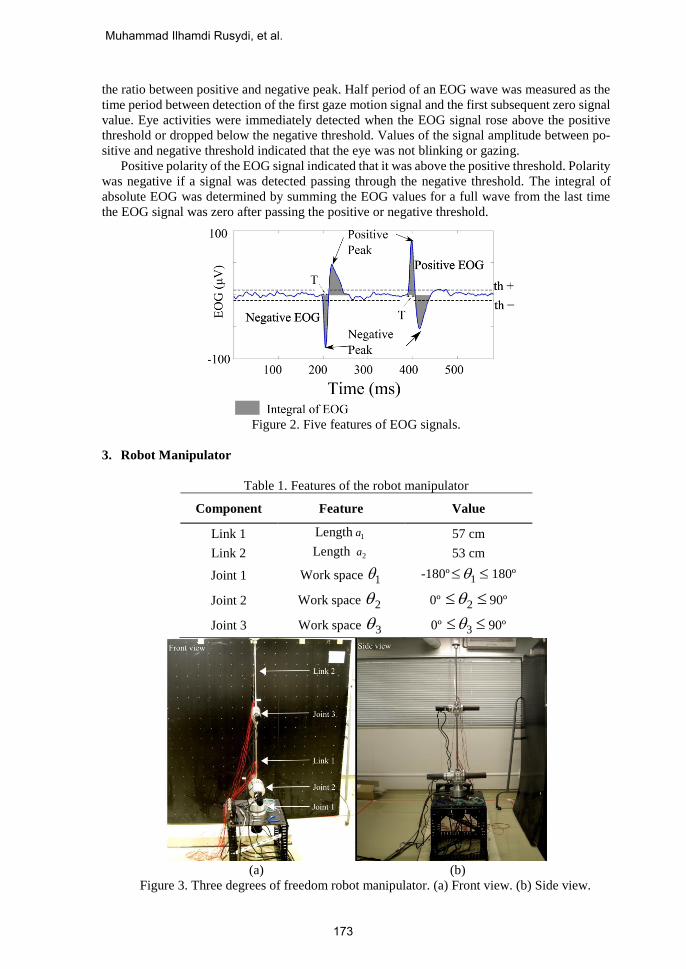
3. Robot Manipulator
Table 1. Features of the robot manipulator
Component Feature Value
Link 1 Length 1a 57 cm
Link 2 Length 2a 53 cm
Joint 1 Work space 1 -180º 1 180º
Joint 2 Work space 2 0º 2 90º
Joint 3 Work space 3 0º 3 90º
(a) (b)
Figure 3. Three degrees of freedom robot manipulator. (a) Front view. (b) Side view.
Muhammad Ilhamdi Rusydi, et al.
173
These signals were used to control a 3-joint robot manipulator consisting of two links. The
first was a 57 cm stainless steel (SUS304) rod and the second was a 53 cm aluminum (A2017)
one. These were connected by three joints with movement limitations of 1 , 2 and 3 respecti-
vely. These were driven by three DC servo motors with 1000 pulse/rotation and 1/100 harmonic
drive. Iron balancers were attached on the other side of the motor for stability. The range of
motion of the robot is given by Table I. Figure. 3 shows robot manipulator from two front views,
front (a) and side (b).
The computer connecting the processed signal to the robot used Matlab Simulink software.
The Real-Time Interface (RTI) function of MATLAB was used to send signals to a DSpace-
1003 board, the output of which then controlled the servo motors. Each servo amplifier produced
voltage to control the velocity of the motors through a digital to analog converter. The maximum
voltage from theDSpace-1003 board was approximately 10 volts. The rotation angle of the servo
motor was measured by the attached encoder which provided feedback for the DSP board which
also had an analog to digital converter.
4. Monitor Display
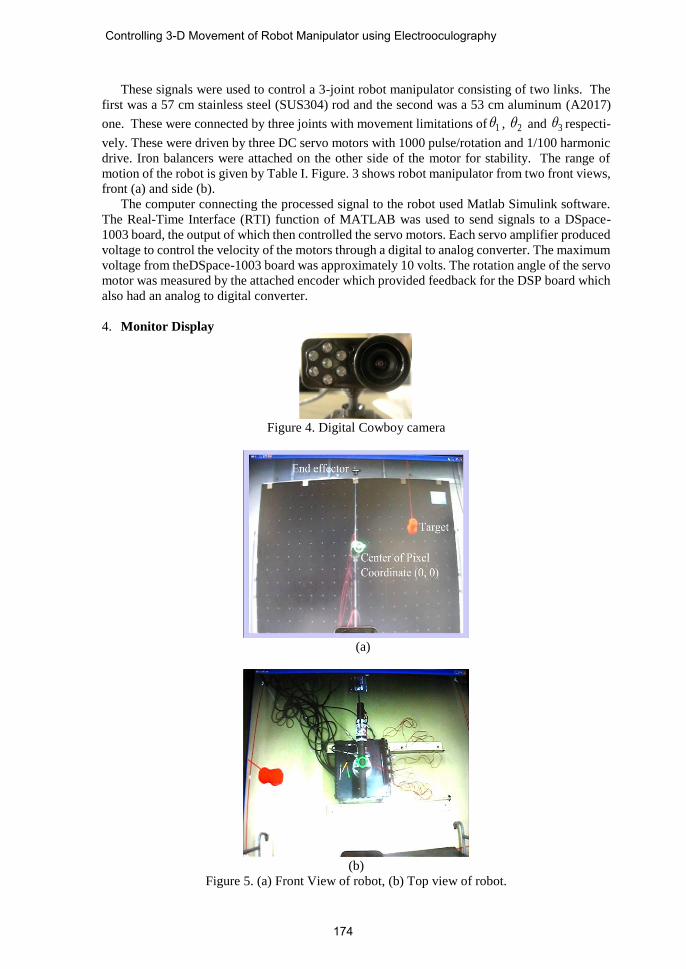
Figure 4. Digital Cowboy camera
(a)
(b)
Figure 5. (a) Front View of robot, (b) Top view of robot.
Controlling 3-D Movement of Robot Manipulator using Electrooculography
174
A monitor was used to display target positions. The monitor size was 32 cm x 27 cm (hori-
zontal x vertical) with resolution 1020 pixels x 720 pixels (horizontal x vertical). This monitor
displayed the targets using the picture from either one of the two cameras. The cameras were
produced by Digital Cowboy and are shown in Figure. 4. The first camera, a DC-NCR20U with
resolution 1600x1200 pixels, provided the front view of the robot manipulator and the second
camera, a DC-NCR13U with 1280x1024 pixels, gave the top view as shown in Figure. 5(a) and
Figure. 5(b).The speed of the cameras was 5 fps.
The system was designed to distinguish whether a blink was voluntary or involuntary with
only voluntary blinks accessing the camera to change the view. Operators looked at the light
green circle as the center pixel, (0, 0), before tracking to the object. This center point was used
as the reference. Operators always gazed back to this point after an eye movement was performed.
The first camera viewed only the XZ-plane of the robot. The second camera viewed the XY-
plane. Hence when the first camera was active the end-effector used gaze motions to move in
the XZ-plane. When the second camera was active the end-effector used gaze motions to move
in the XY-plane. The combinations of these motions allowed the operator to use the robot mani-
pulator to reach the target in three-dimensional space.
5. Methodology
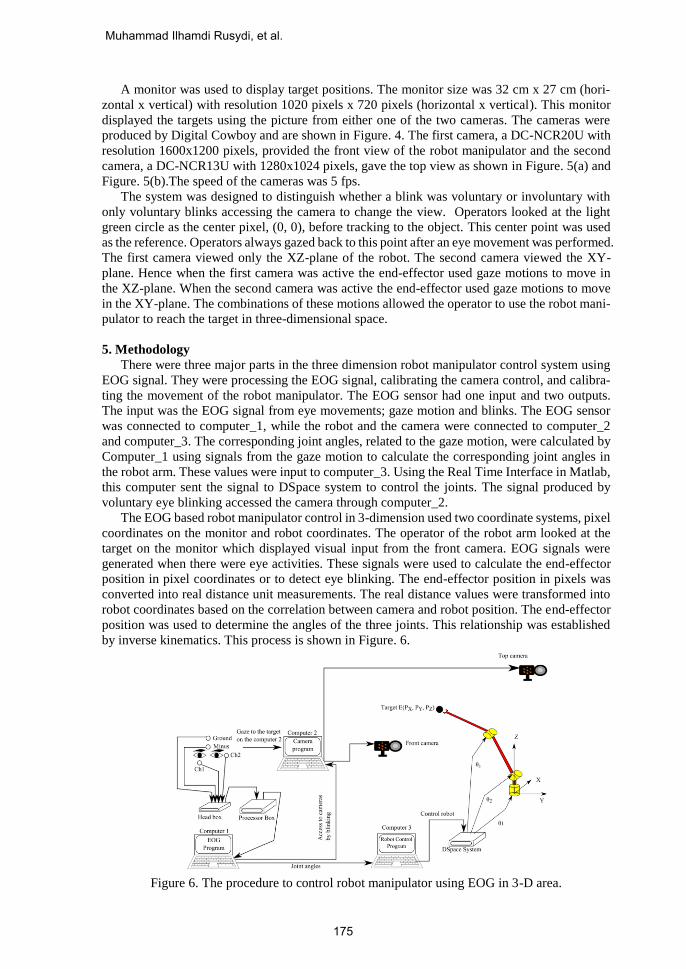
There were three major parts in the three dimension robot manipulator control system using
EOG signal. They were processing the EOG signal, calibrating the camera control, and calibra-
ting the movement of the robot manipulator. The EOG sensor had one input and two outputs.
The input was the EOG signal from eye movements; gaze motion and blinks. The EOG sensor
was connected to computer_1, while the robot and the camera were connected to computer_2
and computer_3. The corresponding joint angles, related to the gaze motion, were calculated by
Computer_1 using signals from the gaze motion to calculate the corresponding joint angles in
the robot arm. These values were input to computer_3. Using the Real Time Interface in Matlab,
this computer sent the signal to DSpace system to control the joints. The signal produced by
voluntary eye blinking accessed the camera through computer_2.
The EOG based robot manipulator control in 3-dimension used two coordinate systems, pixel
coordinates on the monitor and robot coordinates. The operator of the robot arm looked at the
target on the monitor which displayed visual input from the front camera. EOG signals were
generated when there were eye activities. These signals were used to calculate the end-effector
position in pixel coordinates or to detect eye blinking. The end-effector position in pixels was
converted into real distance unit measurements. The real distance values were transformed into
robot coordinates based on the correlation between camera and robot position. The end-effector
position was used to determine the angles of the three joints. This relationship was established
by inverse kinematics. This process is shown in Figure. 6.
Figure 6. The procedure to control robot manipulator using EOG in 3-D area.
Muhammad Ilhamdi Rusydi, et al.
175
A. Electrooculography
Relationship between EOG and Gaze Distance
Ch1 had linear relationship with vertical gaze distance and Ch2 had linear relationship with
horizontal gaze distance. The relationship between gaze motions and EOG in vertical is deter-
mined by (1) and the relationship between the gaze motions and EOG is derived by (2) [25].
Affine transform had been introduced to improve the system accuracy at 0.86° ± 0.67° in the
horizontal direction and 0.54° ± 0.34° [26]. In this research, affine transform was used to calcu-
late the gaze distance based on EOG signal. Based on EOG accuracy, the target diameter on the
monitor was about 2 cm while the operator at 40 cm in front of monitor.
1 1( ) ( )Ch Chv EOG t dt EOG t dt
(1)
2 2( ) ( )Ch Chu EOG t dt EOG t dt
(2)
: ( )
: ( )
{1,2}
t EOGchi t th
t EOGchi t th
i
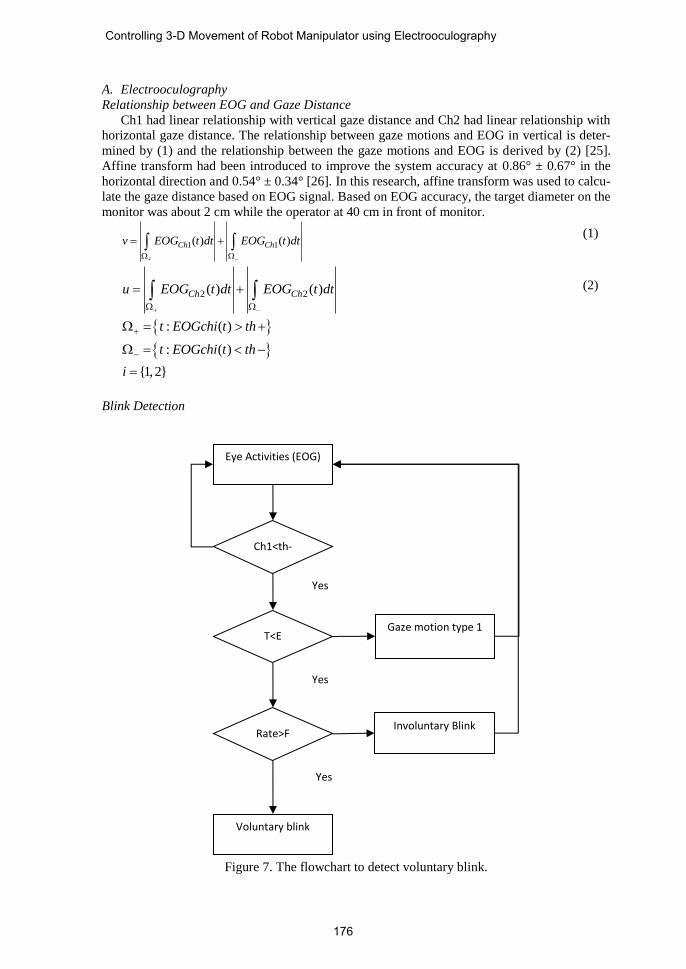
Blink Detection
Figure 7. The flowchart to detect voluntary blink.
Eye Activities (EOG)
Ch1<th-
T<E
Rate>F
Gaze motion type 1
Involuntary Blink
Voluntary blink
Yes
Yes
Yes
Controlling 3-D Movement of Robot Manipulator using Electrooculography
176
Operator needed to work on front view and top view of the robot manipulator to complete
the 3-dimensional tracking object. Two cameras were used to fulfill this requirement. The first
camera was in the front of the robot and the second camera was on the top of the robot. At one
time, only one camera view was displayed on the monitor. Operator could change the display on
the monitor by voluntary blink, while the involuntary blink was recognized by the system as the
no-effect signal. On the other hand, a blink signal also had the same polarity combination with
gaze motion to type 1 where both of the channels had negative polarity. The complete signal
polarities are shown by table 2. This research determined the algorithm to differentiate voluntary
blink, involuntary blink and type 1 gaze motion using EOG signal.
Polarity of signal based on gaze area and blinking
Gaze Blink
Type 1 Type 2 Type 3 Type 4 Voluntary Involuntary
Ch1 Negative Negative Positive Positive Negative Negative
Ch2 Negative Positive Positive Negative Negative Negative
Figure 7 shows the method to detect voluntary blink. Blink activities could be detected from
Ch1 signal properties. The signal from Ch1 should have a negative polarity. Half period of a
wave, T , was used to discriminate the signal between type 1 gaze motion and blink. If the Twas bigger than E , the eye activity was type 1 gaze motion. Peak ratio or F was used to reco-
gnize voluntary blink and involuntary blink. If the Peak ratio was smaller than the rate the eye
activity was voluntary blink.
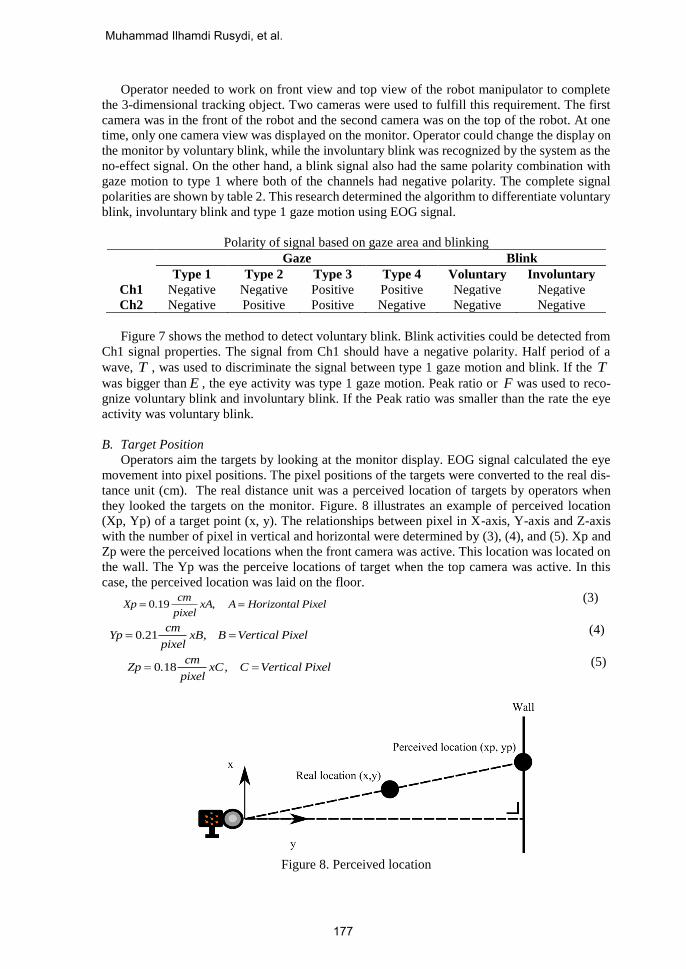
B. Target Position
Operators aim the targets by looking at the monitor display. EOG signal calculated the eye
movement into pixel positions. The pixel positions of the targets were converted to the real dis-
tance unit (cm). The real distance unit was a perceived location of targets by operators when
they looked the targets on the monitor. Figure. 8 illustrates an example of perceived location
(Xp, Yp) of a target point (x, y). The relationships between pixel in X-axis, Y-axis and Z-axis
with the number of pixel in vertical and horizontal were determined by (3), (4), and (5). Xp and
Zp were the perceived locations when the front camera was active. This location was located on
the wall. The Yp was the perceive locations of target when the top camera was active. In this
case, the perceived location was laid on the floor.
0.19 ,
cmXp xA A Horizontal Pixel
pixel
(3)
0.21 ,cm
Yp xB B Vertical Pixelpixel
(4)
0 18cm
Zp . xC, C Vertical Pixelpixel
(5)
Figure 8. Perceived location
Muhammad Ilhamdi Rusydi, et al.
177
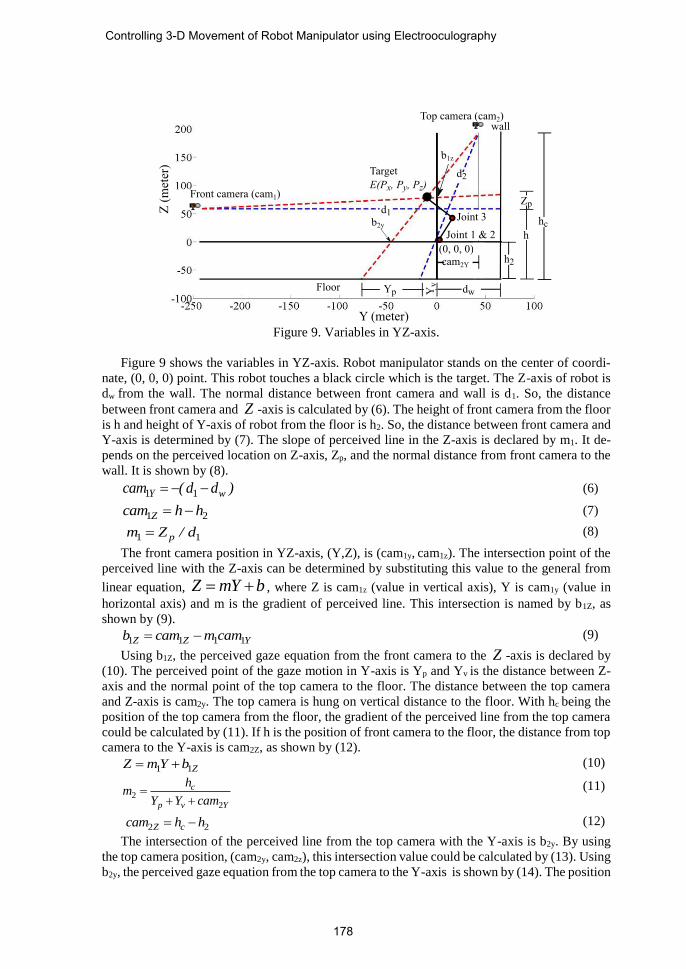
Figure 9. Variables in YZ-axis.
Figure 9 shows the variables in YZ-axis. Robot manipulator stands on the center of coordi-
nate, (0, 0, 0) point. This robot touches a black circle which is the target. The Z-axis of robot is
dw from the wall. The normal distance between front camera and wall is d1. So, the distance
between front camera and Z -axis is calculated by (6). The height of front camera from the floor
is h and height of Y-axis of robot from the floor is h2. So, the distance between front camera and
Y-axis is determined by (7). The slope of perceived line in the Z-axis is declared by m1. It de-
pends on the perceived location on Z-axis, Zp, and the normal distance from front camera to the
wall. It is shown by (8).
1 1Y wcam ( d d ) (6)
1 2Zcam h h (7)
1 1pm Z / d (8)
The front camera position in YZ-axis, (Y,Z), is (cam1y, cam1z). The intersection point of the
perceived line with the Z-axis can be determined by substituting this value to the general from
linear equation, Z mY b , where Z is cam1z (value in vertical axis), Y is cam1y (value in
horizontal axis) and m is the gradient of perceived line. This intersection is named by b1Z, as
shown by (9).
1 1 1 1Z Z Yb cam m cam (9)
Using b1Z, the perceived gaze equation from the front camera to the Z -axis is declared by
(10). The perceived point of the gaze motion in Y-axis is Yp and Yv is the distance between Z-
axis and the normal point of the top camera to the floor. The distance between the top camera
and Z-axis is cam2y. The top camera is hung on vertical distance to the floor. With hc being the
position of the top camera from the floor, the gradient of the perceived line from the top camera
could be calculated by (11). If h is the position of front camera to the floor, the distance from top
camera to the Y-axis is cam2Z, as shown by (12).
1 1ZZ m Y b (10)
2
2
c
p v Y
hm
Y Y cam
(11)
2 2Z ccam h h (12)
The intersection of the perceived line from the top camera with the Y-axis is b2y. By using
the top camera position, (cam2y, cam2z), this intersection value could be calculated by (13). Using
b2y, the perceived gaze equation from the top camera to the Y-axis is shown by (14). The position
Controlling 3-D Movement of Robot Manipulator using Electrooculography
178
of the target is at the intersection of two perceived lines from the front camera and top camera.
Since (10) is equal to (14), the Y position of the target is calculated by (15). The Z position of
target could be calculated by substituting the Y value to the equation (10) or (14).
2 2 2 2Y Z Yb cam m cam (13)
2 2YZ m Y b (14)
2 1
1 2
Y Zb bY
m m
(15)
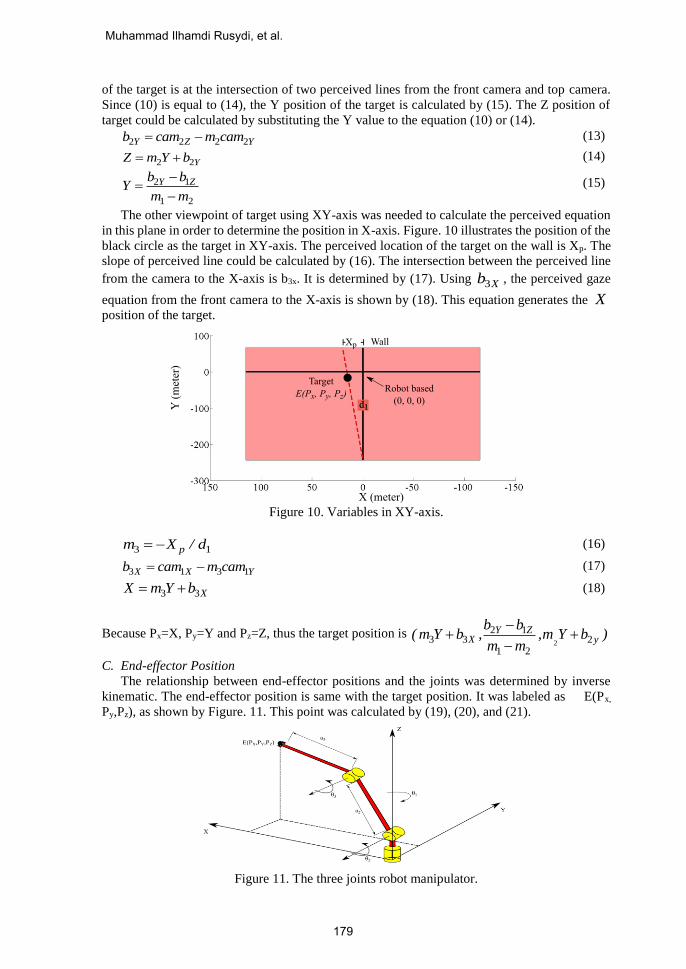
The other viewpoint of target using XY-axis was needed to calculate the perceived equation
in this plane in order to determine the position in X-axis. Figure. 10 illustrates the position of the
black circle as the target in XY-axis. The perceived location of the target on the wall is Xp. The
slope of perceived line could be calculated by (16). The intersection between the perceived line
from the camera to the X-axis is b3x. It is determined by (17). Using 3Xb , the perceived gaze
equation from the front camera to the X-axis is shown by (18). This equation generates the Xposition of the target.
Figure 10. Variables in XY-axis.
3 1pm X / d (16)
3 1 3 1X X Yb cam m cam (17)
3 3XX m Y b (18)
Because Px=X, Py=Y and Pz=Z, thus the target position is 2
2 13 3 2
1 2
Y ZX y
b b( m Y b , ,m Y b )
m m
C. End-effector Position
The relationship between end-effector positions and the joints was determined by inverse
kinematic. The end-effector position is same with the target position. It was labeled as E(Px,
Py,Pz), as shown by Figure. 11. This point was calculated by (19), (20), and (21).
Figure 11. The three joints robot manipulator.
Muhammad Ilhamdi Rusydi, et al.
179

Once the end-effector position is found, 3 could be calculated from 3cos (22) and
3sin (23) using function of 2atan (24). Equations for 2cos (25) and 2sin
(26) are func-
tions of E(Px, Py, Pz), and 3 . Therefore 2 is also calculated by (27) where 3sin is greater
than zero.
1 1 2 2 1 2 3xP a sin cos a cos sin( ) (19)
1 1 2 2 1 2 3yP a sin sin a sin sin (20)
1 2 2 2 3zP a cos a cos( ) (21)
2 2 2 2 2
1 23
1 22
x y zP P P a acos
a a
(22)
23 31sin cos (23)
3 3 32atan sin ,cos (24)
21 2 3
2 3
1 2 3
2 21 2 3 2 3
2 21 1 2 3 22
z
x y z
Pcos
a a cos
a sin
a a cos
P P ( a a cos ) a P sin
xa a a cos a
(25)
2 2
1 2 3 2 3
2 2 21 1 2 3 12
x y zP P ( a a cos ) a P sin
sina a a cos a
(26)
(27)
2 2 22atan (sin ,cos )
Angle value of joint 1 is simple computed from end-effector position Px and Py. Equations
(19) and (20) are rewritten as (28) and (29).
2 21x x yP sin P P (28)
2 21y x yP cos P P (29)
Which give the following solution, as shown by (28).
1 2 x yatan ( P ,P ) (30)
6. Result and Discussion
Figure 12(a) and (b) visualizes the processes of controlling robot manipulator using EOG for
tracking an object. In this example, the object was put on the right-up position from the first
camera and left-bottom side of second camera. Figure 12(a) shows the first view on the screen
when the program was started. At that time, the front camera was active and the operator first
looked at the green light circle in the middle of the screen, then the operator gazed to the target
on the first camera which was the red object. After that, the robot manipulator moved to the
target position on the first camera. Operator could freely move their eyes to the green circle as
Controlling 3-D Movement of Robot Manipulator using Electrooculography
180
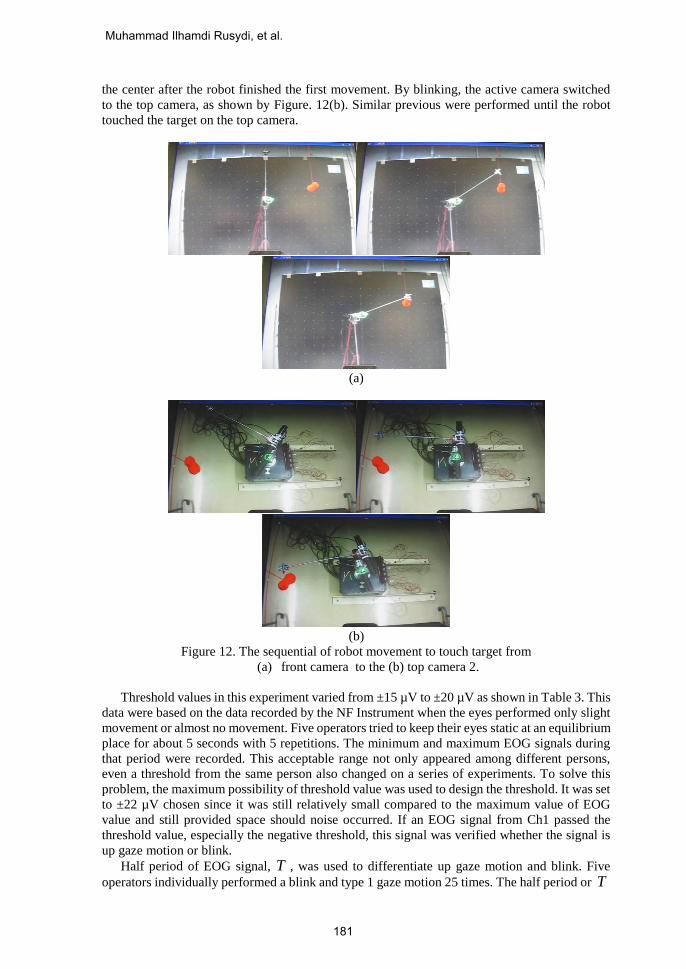
the center after the robot finished the first movement. By blinking, the active camera switched
to the top camera, as shown by Figure. 12(b). Similar previous were performed until the robot
touched the target on the top camera.
(a)
(b)
Figure 12. The sequential of robot movement to touch target from
(a) front camera to the (b) top camera 2.
Threshold values in this experiment varied from ±15 µV to ±20 µV as shown in Table 3. This
data were based on the data recorded by the NF Instrument when the eyes performed only slight
movement or almost no movement. Five operators tried to keep their eyes static at an equilibrium
place for about 5 seconds with 5 repetitions. The minimum and maximum EOG signals during
that period were recorded. This acceptable range not only appeared among different persons,
even a threshold from the same person also changed on a series of experiments. To solve this
problem, the maximum possibility of threshold value was used to design the threshold. It was set
to ±22 µV chosen since it was still relatively small compared to the maximum value of EOG
value and still provided space should noise occurred. If an EOG signal from Ch1 passed the
threshold value, especially the negative threshold, this signal was verified whether the signal is
up gaze motion or blink.
Half period of EOG signal, T , was used to differentiate up gaze motion and blink. Five
operators individually performed a blink and type 1 gaze motion 25 times. The half period or T
Muhammad Ilhamdi Rusydi, et al.
181
was recorded for both activities. With the same technique in designing the threshold value of
EOG signal, the threshold for T, named E, was set 0.27 second. EOG was detected as blinking
activities when the T was smaller than E and it was gaze type 1 if the T was equal or larger than
E.
To distinguish between voluntary and involuntary blinking, the absolute ratios between maxi-
mum and minimum EOG values from five operators were calculated. Five operators individually
performed voluntary blinking and involuntary blinking25 times. The result showed that the ratio
was bigger for voluntary blinking whereas the ratio for involuntary was smaller. The average of
ratio for voluntary blinking was about 1.7. The F value was set to 1.9 for design control. If the
rate was bigger than F, the system detected voluntary blinking; whereas the rate was smaller than
F, the system detected involuntary blinking.
The EOG signal parameters
Operator
Min/Max EOG
(µV)
T
(Second) Ratio
Static eyes Blink Type 1 Voluntary Involuntary
1 -15/+20 0.23 0.35 2.01 0.99
2 -16/+20 0.25 0.32 2.14 1.02
3 -17/+19 0.25 0.35 2.21 0.87
4 -20/+20 0.24 0.33 2.07 1.23
5 -15/+20 0.25 0.34 2.09 1.15
Table 4 shows the accuracy of this design to detect voluntary blinking from five operators
performing blinking 40 times. Accuracy 1 is the accuracy of the system to detect the voluntary
blinking. This system can distinguish very well the between voluntary and involuntary blinking
based on the designed T. There were only two errors from 200 experiments. Accuracy 2 is the
accuracy of the system to differentiate between blinking and up gaze motion. There are a few
acceptable errors for this system caused by varies of eye speed to perform blinking.
Accuracy in detecting voluntary blinking
Operator
Number of
Experiment Detected
Not-detected Accuracy
Involuntary Type 1 Accuracy 1 Accuracy 2
1 40 39 1 0 97.5% 100%
2 40 40 0 0 100% 100%
3 40 38 0 2 100% 95%
4 40 38 0 2 100% 95%
5 40 39 1 0 97.5% 100%
There were four arbitrary targets in this experiment. The position of targets was arranged to
represent four possible areas of the robot, as shown by Figure. 13. Five operators operated the
robot to touch the targets with 10 repetitions. Table 5 shows the performance of system while
the robot was controlled by EOG signal. The result shows that this system successfully reached
the targets in 3D area. It was indicated by the end-effector touching the targets in 3 dimensional
positions. In average, this accuracy of the system is about 90%. There were three reasons that
affect the accuracy of the system. First, the camera changed unexpectedly when an involuntary
blinking was detected as voluntary. Second, the active camera failed to change when a voluntary
blinking detected as involuntary. Third was when the voluntary blinking was detected as type 1
gaze motion where the system failed to change the active camera.
Controlling 3-D Movement of Robot Manipulator using Electrooculography
182
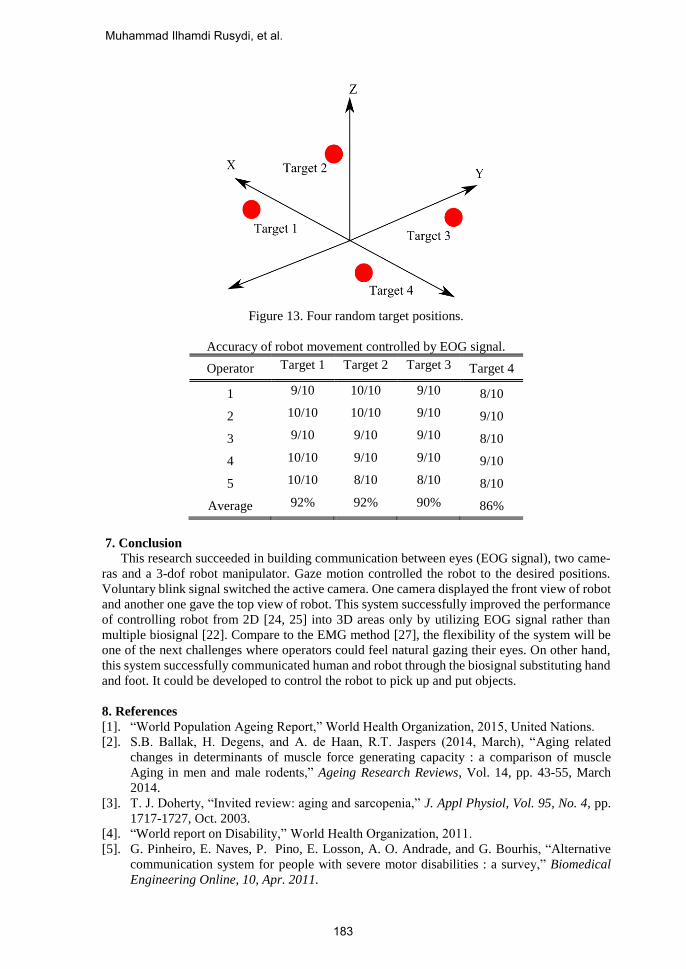
Figure 13. Four random target positions.
Accuracy of robot movement controlled by EOG signal.
Operator Target 1 Target 2 Target 3 Target 4
1 9/10 10/10 9/10 8/10
2 10/10 10/10 9/10 9/10
3 9/10 9/10 9/10 8/10
4 10/10 9/10 9/10 9/10
5 10/10 8/10 8/10 8/10
Average 92% 92% 90% 86%
7. Conclusion
This research succeeded in building communication between eyes (EOG signal), two came-
ras and a 3-dof robot manipulator. Gaze motion controlled the robot to the desired positions.
Voluntary blink signal switched the active camera. One camera displayed the front view of robot
and another one gave the top view of robot. This system successfully improved the performance
of controlling robot from 2D [24, 25] into 3D areas only by utilizing EOG signal rather than
multiple biosignal [22]. Compare to the EMG method [27], the flexibility of the system will be
one of the next challenges where operators could feel natural gazing their eyes. On other hand,
this system successfully communicated human and robot through the biosignal substituting hand
and foot. It could be developed to control the robot to pick up and put objects.
8. References
[1]. “World Population Ageing Report,” World Health Organization, 2015, United Nations.
[2]. S.B. Ballak, H. Degens, and A. de Haan, R.T. Jaspers (2014, March), “Aging related
changes in determinants of muscle force generating capacity : a comparison of muscle
Aging in men and male rodents,” Ageing Research Reviews, Vol. 14, pp. 43-55, March
2014.
[3]. T. J. Doherty, “Invited review: aging and sarcopenia,” J. Appl Physiol, Vol. 95, No. 4, pp.
1717-1727, Oct. 2003.
[4]. “World report on Disability,” World Health Organization, 2011.
[5]. G. Pinheiro, E. Naves, P. Pino, E. Losson, A. O. Andrade, and G. Bourhis, “Alternative
communication system for people with severe motor disabilities : a survey,” Biomedical
Engineering Online, 10, Apr. 2011.
Muhammad Ilhamdi Rusydi, et al.
183
[6]. M. B. I. Raez, M. S. Hussain, and F. Mohd-Yasin, “Signal analysis: Detection, processing,
classification and applications,” Biol Proced Online, Vol. 8, No. 1, pp. 11-35. December
2006.
[7]. R. J. Leigh, “Electrooculogram,” in Encyclopedia of the Neurological Sciences, 1st ed., M.
Aminoff, R. Daroff, San Diego: Academic Press, 2003, pp. 109-110.
[8]. J. Malmmivuo, R. Plonsey, “Bioelectromagnetism,”. New York: Oxford University Press,
1995.
[9]. K. H. Cho, M. Sasaki, “Brain-wave bio potentials based mobile robot control: wavelet-
neural network pattern recognition approach,” IEEE International Conference on Systems,
Man, and Cybernetics, Tucson, AZ, USA, pp. 322 – 328, August 2002.
[10]. Z. Lv, X. P. Wu, M. Li, and D. A. Zhang, “A novel eye movement detection algorithm for
EOG driven human computer interface,” Pattern Recognition Letter, 31(9), pp. 1041-1047,
July 2010.
[11]. A. Banerjee, S. Datta, M. Pal, A. Konar, D. N. Tibarelawa, and R. Janarthanan, “Classifying
electrooculogram to detect directional eye movements,” Proceedia Technology, Vol. 10, pp.
67-75, 2013.
[12]. K. Petterson, S. Jagadeesan, K. Lukander, A. Henelius, and E. Hӕggström, “Algorithm for
automatic analysis of electro-oculographic data,” Biomedical Engineering Online, 12, Oc-
tober 2013.
[13]. N. Itakura and K . Sakamoto, “A new method for calculating eye movement Displacement
from AC coupled-oculographic signals in head mounted eye-gaze input interface,” Biome-
dical Signal Processing and Control, Vol.5, No. 2, pp. 142-146, April 2010.
[14]. A. Guven, K. Kara, “Classification of electro-oculogram signals using artificial neural net-
work,” Expert Syst. Appl., Vol. 31, No. 1, pp. 199-205, July 2006.
[15]. M. Vidal, J. Turner, A. Building and H. Gellersen, “Wearable eye tracking for mental health
monitoring. Computer Communications,” Vol. 35, No. 11, pp. 1306-1311, June 2012.
[16]. N. Galley, “The evaluation of the electrooculogram as a psychological measuring instru-
ment in driver study of driver behaviuor,” Ergonomic, Vol. 36, No. 9, pp. 1063-1070, Sep-
tember 1993.
[17]. R. Barea, L. Boquete, M. Mazo and E. Lopez, “Wheelchair guidance strategies using
EOG,” Journal of Intelligent and Robotic Systems, Vol. 34, No. 3, pp. 279-299, July 2012.
[18]. R. Barea, L. Boquete, S. Ortega and E. Lopez, J. M. R, “EOG-based eye movements codi-
fication for human computer interaction,” Expert Systems with Applications, Vol. 39, No.
3, pp. 2677–2683, February 2012.
[19]. J. J. Tecce, J. Gips, C. P. Olivieri, L. J Pok and M. R. Congsiglio, ”Eye movement control
of computer functions,” International Journal of Psychophysology, 29(3), pp. 319-325, Au-
gust 1998.
[20]. L. D. Lledo, A. Ubeda, E. Ianez and J. M Azorin, “Internet browsing application based on
electrooculography for disabled people,” Expert Systems with Applications, Vol. 40, No. 7,
pp. 2640-2648, June 2013.
[21]. T. Ghandi, M. Trikha, J. Santosh and S. Anand, “Development of an expert multitask gad-
get controlled by voluntary eye movements,” Expert Systems with Applications, Vol. 37,
No. 6, pp. 4204-4211, June 2010.
[22]. Hortal, Enrique, Eduardo Iáñez, Andrés Úbeda, Carlos Perez-Vidal, and José M. Azorín,
"Combining a Brain–Machine Interface and an Electrooculography Interface to perform
pick and place tasks with a robotic arm," Robotics and Autonomous Systems, Vol. 72, pp.
181-188, 2015.
[23]. M. I. Rusydi, T. Okamoto, M. Sasaki and S. Ito, “Optimizing electrode positions for deter-
mination of gaze movement using the NF 5201,” In Proceedings of the 7th Asia Pacific
Symposium on Applied Electromagnetics and Mechanis, Ho Chi Minh City, Vietnam, pp.
266-271, July 2012.
Controlling 3-D Movement of Robot Manipulator using Electrooculography
184

[24]. M. I. Rusydi, Y. Mori, T. Okamoto, M. Sasaki, and S. Ito, “Development of an EOG based
robot manipulator and end point direction control system,” Journal of the Japan Society of
Applied Electromagnetics and Mechanics, Vol. 22, No. 2, pp. 293-299, September 2014.
[25]. M. I. Rusydi, T. Okamoto, S. Ito, M. Sasaki, “Rotation matrix to operate a robot manipu-
lator for 2D analog tracking objects using electrooculography,” Robotics, Vol 3, No. 3, pp
289-309, July 2014.
[26]. M. I. Rusydi, M. Sasaki and S. Ito, “Affine Transform to reform pixel coordinates of EOG
signals for controlling robot manipulators using gaze motions,” Sensor, Vol. 14, No. 6, pp.
10107-10123, June 2014.
[27]. M. I. Rusydi, S. Huda, R. A. Putra, M. Sasaki and F. Rusydi, “Robot manipulator Control
using absolute encoder and electromyography signal,” in Proceeding of Asia-Pacific
Conference in Intelligent Robot Systems, Tokyo, Japan, pp. 190-194, July 2016.
Muhammad Ilhamdi Rusydi, He is currently a lecturer in Electrical Enginee-
ring Department, Faculty of Engineering, Universitas Andalas. He is the chief
of Digital Electronics Laboratory and the coordinator of Master program in
Electrical Engineering Department. He obtained his Bachelor and Master de-
gree from Electrical Engineering, Faculty of Engineering, Bandung Institute of
Technology in 2004 and 2008, respectively. He received the Doctor in Engi-
neering from Mechanical Engineering Department, Faculty of Engineering,
Gifu University.
Takeo Okamoto, He obtained Bachelor and Master Degree from Human and
Information System Department, Engineering Faculty, Gifu University in 2012
and 2014 respectively. On 2014, he was awarded as the best student in his de-
partment. He is currently working at Toyota Industries Corporation.
Satoshi Ito, He obtained his B. Eng. and M. Eng. degrees in information engi-
neering from Nagoya University in 1991 and 1993, respectively. From 1994 to
1996, he was a technical staff member at the Laboratory for Bio-Mimetic Con-
trol Systems, Bio-Mimetic Control Research Center (RIKEN) and from 1997
to 1999, a Frontier researcher at the same laboratory. In 1999, he obtained his
D. Eng. degree from Nagoya University. He was a research associate at the
faculty of Engineering, Gifu University in 1999, and became an associate pro-
fessor in 2004. He has been a professor at Gifu University since 2015.
Minoru Sasaki, He received M. Eng. and D. Eng. Degrees in mechanical en-
gineering from Tohoku University in 1983 and 1985, respectively. He was a
research associate at Tohoku University in 1985 and a lecturer at Miyagi Na-
tional College of Technology, and a visiting professor at the University of Ca-
lifornia, Los Angeles and Georgia Institute of Technology. Since 1991, he has
been with the Faculty of Engineering, Gifu University and is currently a pro-
fessor.
Muhammad Ilhamdi Rusydi, et al.
185