Embed Size (px)
Citation preview
Controlling the number of dendrimers in dendrimicelle nanoconjugates
from 1 to more than 100
Junyou Wang,a Ilja K. Voets,b Remco Fokkink,c Jasper van der Gucht,c Aldrik H. Velders,*a
a: Laboratory of BioNanoTechnology, Wageningen University, Dreijenplein 6, 6703 HB Wageningen,
The Netherlands
b: Institute for Complex Molecular Systems and Laboratory of Macromolecular and Organic
Chemistry, Eindhoven University of Technology, P.O. Box 513, 5600 MB Eindhoven, The Netherlands
c: Laboratory of Physical Chemistry and Colloid Science, Wageningen University, Dreijenplein 6,
6703 HB Wageningen, The Netherlands
*To whom correspondence should be addressed:
E-mail: [email protected]
This file includes:
1. Experimental section; (Table S1)
2. Determination of the micellar mass and aggregation number (Figure S1 & Table S2)
3. Determination of CMC (Figure S2 & Table S3)
4. CONTIN analysis of micellar size and size distribution; (Figure S3)
4. Determination of micellar core size and shell thickness; (Figure S4 & Table S4)
5. References.
1
Electronic Supplementary Material (ESI) for Soft Matter.This journal is © The Royal Society of Chemistry 2014

Experiment section
1. Materials
The diblock copolymer, poly(N-methyl-2-vinyl-pyridinium iodide)-b-poly(ethylene
oxide) (P2MVP128-b-PEO477), was obtained by quaternization of poly(2-vinylpyridine)-
b-poly(ethylene oxide) (P2MVP128-b-PEO477) (Polymer Source, Mw/Mn= 1.10, Mn=
34.5 k) following a procedure described elsewhere.1 The degree of quaternization is
about 87% determined by titration with poly(acrylic acid) (PAA, Polymer Source,
Mw/Mn= 1.16, Mn= 2.2 k) in 20 mM NaHCO3/Na2CO3 buffer at pH 10. The PAMAM
dendrimers with sodium carboxylate surface groups were purchased from Sigma
Aldrich (G0-G7) or Dendritech Inc. (G8, G9). The original solvent methanol was
evaporated carefully under N2 and the obtained compound was dissolved in nanopure
water. The micelles were prepared by mixing solutions of P2MVP128-b-PEO477 and
PAMAM dendrimer in 20 mM NaHCO3/Na2CO3 buffer at pH 10 ± 0.1.
2. Method
Dynamic and static light scattering
Light scattering at an angle of 90º was performed with an ALV light scattering-
apparatus, equipped with a 300 mW cobalt samba DPSS laser operating at a
wavelength of 532.0 nm. All measurements were performed at room temperature.
Titrations were carried out using a Schott-Geräte computer-controlled titration setup
to control sequential addition of titrant and cell stirring. After every dosage, the laser
light-scattering intensity (I) and the correlation function were recorded. The
hydrodynamic radius and the scattered intensity are studied as a function of the mole
fraction of positive charge fraction, f+, which is defined as follows:
(1)
nnnf +
where n+ and n- are the numbers of positive and negative charges.
2
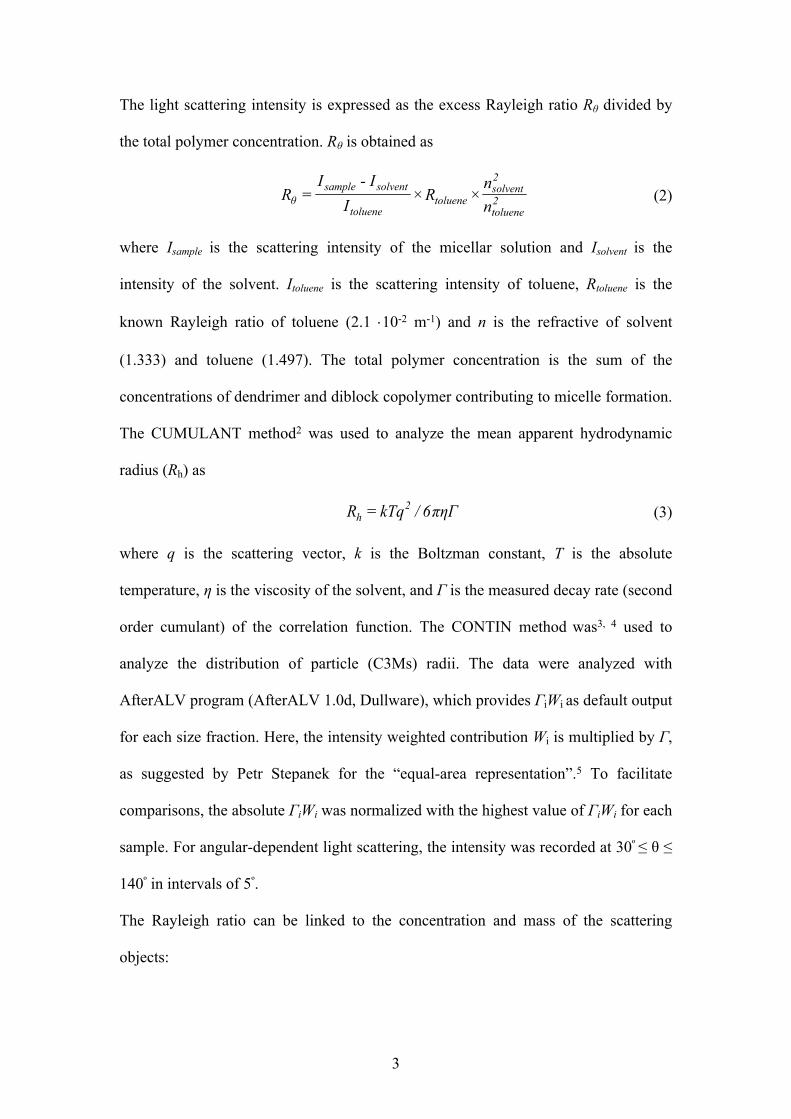
The light scattering intensity is expressed as the excess Rayleigh ratio Rθ divided by
the total polymer concentration. Rθ is obtained as
(2)2toluene
2solvent
toluenetoluene
solventsampleθ n
nR
II-I
R ××=
where Isample is the scattering intensity of the micellar solution and Isolvent is the
intensity of the solvent. Itoluene is the scattering intensity of toluene, Rtoluene is the
known Rayleigh ratio of toluene (2.1 10-2 m-1) and n is the refractive of solvent
(1.333) and toluene (1.497). The total polymer concentration is the sum of the
concentrations of dendrimer and diblock copolymer contributing to micelle formation.
The CUMULANT method2 was used to analyze the mean apparent hydrodynamic
radius (Rh) as
(3) Γπη6/kTqR 2h =
where q is the scattering vector, k is the Boltzman constant, T is the absolute
temperature, η is the viscosity of the solvent, and Γ is the measured decay rate (second
order cumulant) of the correlation function. The CONTIN method was3, 4 used to
analyze the distribution of particle (C3Ms) radii. The data were analyzed with
AfterALV program (AfterALV 1.0d, Dullware), which provides ГiWi as default output
for each size fraction. Here, the intensity weighted contribution Wi is multiplied by Г,
as suggested by Petr Stepanek for the “equal-area representation”.5 To facilitate
comparisons, the absolute ГiWi was normalized with the highest value of ГiWi for each
sample. For angular-dependent light scattering, the intensity was recorded at 30º ≤ θ ≤
140º in intervals of 5º.
The Rayleigh ratio can be linked to the concentration and mass of the scattering
objects:
3

(4))q(S1
)qR(P1
M1
RCK
θ
R ××=
where C is the weight concentration of micelles, M is their molecular mass, and R is
the radius of the object that contribute to scatter light. P(qR) and S(q) are the form
factor and the structure factor, respectively. KR is an optical constant defined as:
(5)
2
40Av
22
R dcdn
λNn4πK
where n is the refractive index of solvent, NAv is Avogadro’s number, λ0 is the
wavelength of the incoming beam (532.0 nm), and dn/dc is the refractive index
increment of the micelles. dn/dc of the micelles formed with PAMAM dendrimers at
different generation is measured by a differential refractive index detector (Shodex
RI-71), see the following table,
Generation 2 3 4 5 6 7 8 9
dn/dc*104
m3 kg-1 1.97 1.97 2.02 2.05 1.95 1.94 1.90 1.89
Table S1 Measured dn/dc of Gn-C3Ms formed at different dendrimer generation.
In our experiments, the scattering vector q = (4n/0)sin(/2) is approximately 0.023
nm-1 ( = 90), so that qR is small for the micelles (which have a radius on the order
of 25 nm). We therefore assume that P(qR)=1. At low concentrations, the structure
factor can be approximated as
(6)MC
B21)q(S
12+=
4

where B2 is the second virial coefficient. Substitution into equation 4, we get
(7)22θ
R
MC
B2M1
RCK
+=
By plotting KRC/R versus C, we can obtain the molar mass M from the intercept. In
our study, M corresponds to the molar mass of micelles, Mmicelle, from which we can
calculate the aggregation number of the micelles, see Figure S1.
Depolarized light scattering
The depolarized light scattering experiments were carried out on the same DLS
instrument mentioned above but with a Glan-Laser prism polarizer (Melles Griot, 03
PGL 301/A, extinction ratio < 5 x 10⁻⁵) in front of the detector. The detection angle
was fixed at 90º and the polarizer was adjusted to transmit only vertically (Ivv) or only
horizontally (Ivh) polarized light, allowing to determine the depolarization ratio
(8)0
0
vvvv
vhvhvh II
II
with I and I0 denoting the scattering intensity from sample and solvent, respectively.
Small angle X-ray scattering
Small angle X-ray scattering experiments were performed on a Ganesha lab
instrument equipped with a GeniX-Cu ultra low divergence source producing X-rays
with a wavelength of 1.54 Å and a flux of 1x10⁸ ph/s. Scattering patterns were
collected on a Pilatus 300K silicon pixel detector (487 x 619 pixels of 172 μm2) at
two sample-to-detector distances corresponding to 730 and at 1530 mm covering a q
range of 6.7 x 10⁻² < q < 4.45 nm-1. The position of the beam center and the q range
were calibrated using the diffraction peaks of silver behenate. The liquid samples
were contained in 2 mm quartz capillaries sealed and fixed in a stainless steel holder
kept at room temperature. The sample concentration was fixed at a dendrimer charge
5

concentration of 2mM in all cases. The scattering data were corrected for background
contributions (such as scattering from the buffer solution), detector response and
primary beam intensity fluctuations. The SAXS data were treated and analyzed using
the software packages SAXSGUI and SASVIEW. The experimental scattering
profiles given in Figure S3 are well described by a polydisperse core-shell sphere
model, from which we extract the micellar core size Rcore and shell thickness Hshell.
6

Determination of the micellar mass and aggregation number
Figure S1 KRC/R90 is plotted as a function of total concentration of P2MVP128-b-
PEO477 polymer and dendrimer. (C = Coverall – CMC, and CMC is obtained from Table
S3)
The intercept of the line gives the micellar mass, Mmicelle. Here we take G5 line as an
example, to show how to calculate the aggregation number:
Mmicelle = 1/0.00084 = 1190.476 kg/mol = 1190476 g/mol
The charge numbers, Z and molecular weights of dendrimer and polymer are
ZG5 = 128, MG5 = 26252, (g/mol)
Zpolymer = 128*0.87 = 111, Mpolymer = 50313 (g/mol)
7
0
0.0005
0.001
0.0015
0.002
0 0.2 0.4 0.6 0.8
y = 0.00036x + 0.00091
KRC
/R90
(mol
/kg)
C (kg/m3)
G2
0
0.0005
0.001
0.0015
0.002
0 0.2 0.4 0.6 0.8
y = 0.000042x + 0.00084
KRC
/R90
(mol
/kg)
C (kg/m3)
G9
0
0.0005
0.001
0.0015
0.002
0 0.2 0.4 0.6 0.8
y = 0.000136x + 0.00080
KRC
/R90
(mol
/kg)
C (kg/m3)
G8
0
0.0005
0.001
0.0015
0.002
0 0.2 0.4 0.6 0.8
y = 0.00015x + 0.00081
KRC
/R90
(mol
/kg)
C (kg/m3)
G7
0
0.0005
0.001
0.0015
0.002
0 0.2 0.4 0.6 0.8
y = 0.000090x + 0.00086
KRC
/R90
(mol
/kg)
G3
C (kg/m3)
0
0.0005
0.001
0.0015
0.002
0 0.2 0.4 0.6 0.8
y = 0.00012x + 0.00087
KRC
/R90
(mol
/kg)
C (kg/m3)
G4
0
0.0005
0.001
0.0015
0.002
0 0.2 0.4 0.6 0.8
y = 0.000030x + 0.00082
KRC
/R90
(mol
/kg)
C (kg/m3)
G6
0
0.0005
0.001
0.0015
0.002
0 0.2 0.4 0.6 0.8
y = 0.000082x + 0.00084
KRC
/R90
(mol
/kg)
C (kg/m3)
G5

By taking into account of the PMC f+ shift, we get
Npolymer*111 / (NG5*128 + Npolymer*111) = 0.48 (9)
Moreover, the molar masses of dendrimer, polymer and micelle are recorded as
follows:
NG5*26252 + Npolymer*50313 = 1190476 (10)
Finally, we combine and solve equation 9 and 10, we find that
NG5 = 15.0 and Npolymer = 15.8 Then we take 15 and 16 as average dendrimer and
polymer numbers within one micelle.
The calculations with other generations follow the same strategy, and micellar mass
and aggregation numbers are included in the below table:
Generation 2 3 4 5 6 7 8 9
NPAMAM 108.2 56.1 28.5 15.0 8.0 4.0 2.1 1.0
Npolymer 15.5 16.1 15.5 15.8 15.8 16.0 16.0 15.0
Table S2 Micellar mass and calculated aggregations numbers of Gn-C3Ms.
8
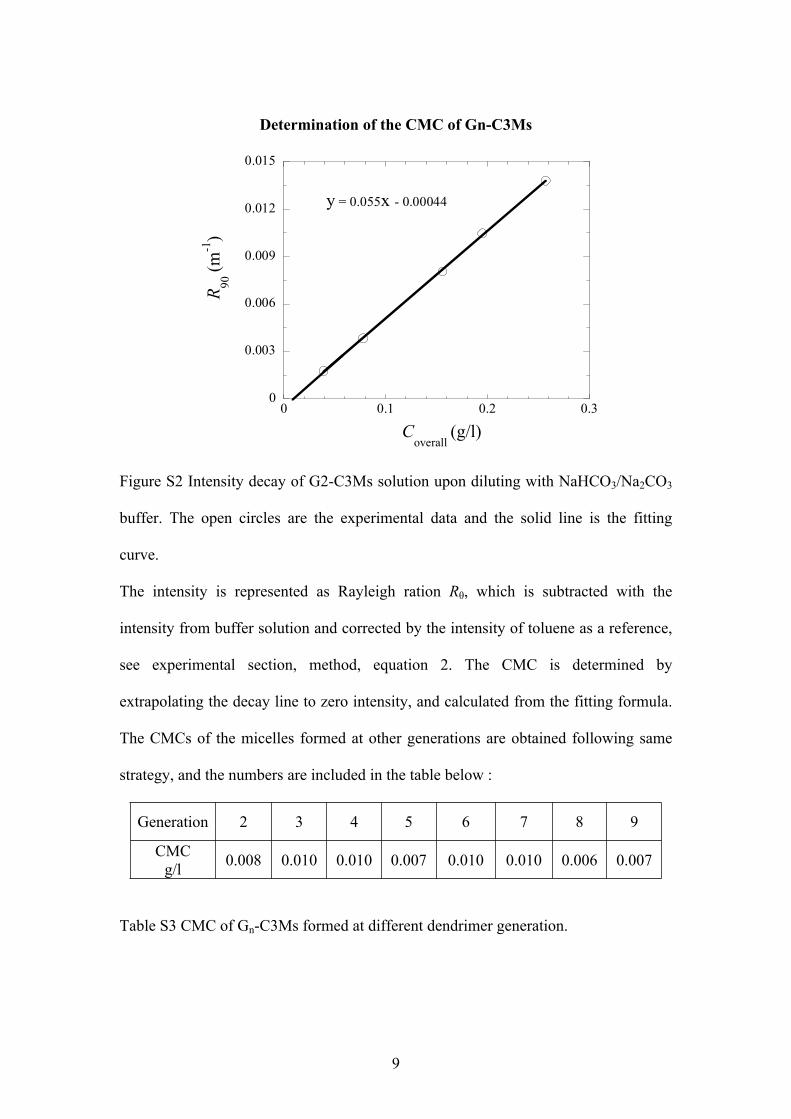
Determination of the CMC of Gn-C3Ms
0
0.003
0.006
0.009
0.012
0.015
0 0.1 0.2 0.3
y = 0.055x - 0.00044R 90
(m-1
)
Coverall
(g/l)
Figure S2 Intensity decay of G2-C3Ms solution upon diluting with NaHCO3/Na2CO3
buffer. The open circles are the experimental data and the solid line is the fitting
curve.
The intensity is represented as Rayleigh ration Rθ, which is subtracted with the
intensity from buffer solution and corrected by the intensity of toluene as a reference,
see experimental section, method, equation 2. The CMC is determined by
extrapolating the decay line to zero intensity, and calculated from the fitting formula.
The CMCs of the micelles formed at other generations are obtained following same
strategy, and the numbers are included in the table below :
Generation 2 3 4 5 6 7 8 9
CMCg/l 0.008 0.010 0.010 0.007 0.010 0.010 0.006 0.007
Table S3 CMC of Gn-C3Ms formed at different dendrimer generation.
9

CONTIN analysis of micellar size and size distribution
Figure S3 size and size distribution of micelles obtained by CONTIN analysis. For
clearity reason, we plot the curve in two plots. In fact, there is no big difference
between Gn-C3Ms at different generations.
10
-0.2
0
0.2
0.4
0.6
0.8
1
1.2
1 10 100 1000
G6G7
G8G9
Rh (nm)
W
(s-1
)
-0.2
0
0.2
0.4
0.6
0.8
1
1.2
1 10 100 1000
G2
G3G4G5
W
(s-1
)
Rh (nm)

Determination of the micellar core size and shell thickness
Figure S4 SAXS profiles of Gn-C3Ms at different dendrimer generations. The open
circles shows the experimental data and the solid red line corresponds to the fits with
a form factor for polydisperse (Gaussian distribution) core-shell spheres. The
obtained core radius Rcore and shell thickness Hshell are shown in main text, Table 1.
The fitting parameters are adapted from literature:6
ρsolvent(1010 cm-2)
ρshell(1010 cm-2)
ρcore(1010 cm-2)
PD ratio (%)(core and
shell)
9.37 9.45 11.11 16
Table S4 Fitting parameters applied in SasView program. ρ: scattering length density;
PD: polydispersity.
11
10-5
10-4
10-3
10-2
10-1
100
101
0.01 0.1 1 10q (nm-1)
I (q)
(cm
-1)
G2
10-5
10-4
10-3
10-2
10-1
100
101
102
0.01 0.1 1 10q (nm-1)
I (q)
(cm
-1)
G3
10-5
10-4
10-3
10-2
10-1
100
101
0.01 0.1 1 10q (nm-1)
G9
I (q)
(cm
-1)
10-5
10-4
10-3
10-2
10-1
100
101
0.01 0.1 1 10q (nm-1)
G8
I (q)
(cm
-1)
10-5
10-4
10-3
10-2
10-1
100
101
0.01 0.1 1 10q (nm-1)
G7
I (q)
(cm
-1)
10-5
10-4
10-3
10-2
10-1
100
101
0.01 0.1 1 10q (nm-1)
G6
I (q)
(cm
-1)
10-5
10-4
10-3
10-2
10-1
100
101
0.01 0.1 1 10
q (nm-1)
G5
I (q)
(cm
-1)
10-5
10-4
10-3
10-2
10-1
100
101
0.01 0.1 1 10q (nm-1)
I (q)
(cm
-1)
G4

Reference:
1. M. Biesalski, D. Johannsmann and J. Ruhe, J. Chem. Phys., 2004, 120, 8807-8814.
2. D. E. Koppel, J. Chem. Phys., 1972, 57, 4814-4820.
3. S. W. Provencher, Comput. Phys. Commun., 1982, 27, 213-227.
4. S. W. Provencher, Comput. Phys. Commun., 1982, 27, 229-242.
5. P. Stepanek, In Dynamic Light Scattering: the method and some applications; Brown, D., Ed.;
Clarendon Press: Oxford, U. K., 1993, Chapter 4, 177.
6. H. M. van der Kooij, E. Spruijt, I. K. Voets, R. Fokkink, M. A. Cohen Stuart and J. van der
Gucht, Langmuir, 2012, 28, 14180-14191.
12