Embed Size (px)
Citation preview
ECMWF Seminar on Data assimilation for atmosphere and ocean, 6 - 9 September 2011 265
Convective Scale Data Assimilation and Nowcasting
Susan P Ballard1, Bruce Macpherson2, Zhihong Li1, David Simonin1, Jean-Francois Caron1, Helen Buttery1, Cristina Charlton-Perez1,
Nicolas Gaussiat2, Lee Hawkness-Smith1 ,Chiara Piccolo2, Graeme Kelly1, Robert Tubbs1, Gareth Dow2 and Richard Renshaw2
1 Met Office, Dept of Meteorology, University of Reading, RG6 6BB [email protected]
2 Met Office, FitzRoy Road, Exeter, EX31 3PB
Abstract
Increasing availability of computer power and nonhydrostatic models has made limited area NWP at convective scales, 1-4km resolution, a reality for National Met Services in the past few years.
At this time around the world nudging, variational data assimilation and ensemble Kalman filters are being used or developed for high resolution data assimilation in research centres and weather services, and are already operational in some Weather Services, for high resolution models in the range 1-10km.
This paper reviews some of the issues relating to convective scale limited area data assimilation and in particular their application in NWP-based nowcasting.
1. Introduction
Increasing availability of computer power and nonhydrostatic models has made limited area NWP at convective scales, 1-4km resolution, a reality for National Met Services in the past few years.
Many services are already using these systems operationally for short-range forecasting up to about T+36hours every 3 or 6hours (Honda et al 2005, Saito et al 2006, Stephan et al 2008, Seity et al 2011, Brousseau et al 2011, Bauer et al 2011). These forecasts are also used for merging with traditional nowcasting techniques to extend the skilful forecast range e.g. Bowler et al 2006. Now centres are looking to use the NWP forecast systems themselves for nowcasting.
The vital component of NWP-based nowcasting is the data assimilation of high resolution in space and time observations, especially radar (Sun et al 2010) and geostationary satellite data. Data assimilation into NWP models potentially offers the ability to use all observations in a consistent and synergistic manner to provide the best estimate of the state of the atmosphere from which to produce a nowcast. At this time, around the world, nudging, variational data assimilation and ensemble Kalman filters (Sun 2005) are being used or developed for high resolution data assimilation in research centres and weather services, and are already operational in some Weather Services, for high resolution models in the range 1-10km. Most of this work relies heavily on exploitation of Doppler radar radial wind
BALLARD, S.P. ET AL.: CONVECTIVE SCALE DATA ASSIMILATION AND NOWCASTING
266 ECMWF Seminar on Data assimilation for atmosphere and ocean, 6 - 9 September 2011
(Montmerle and Faccani 2009) and reflectivity data (Caumont et al 2010) or derived surface rain rates (Macpherson et al., 1996, Jones & Macpherson, 1997, Dixon et al., 2009).
Section 2 of this paper describes progress in skill in limited area forecasting for the UK using the UK Met Office data assimilation and forecast systems. Section 3 describes current developments around the world in convective scale data assimilation. Sections 4 to 12 describe some of the issues to be considered in convective scale limited area data assimilation. Section 13 describes the Met Office Nowcasting Demonstration Project , NDP, system and section 14 compares the NDP and current nowcast system. Sections 15-23 discuss availability of observations and different types of observations and their use in convective scale data assimilation and nowcasting and Section 24 discusses scientific challenges and section 25 the conclusions.
2. Progress in skill in limited area forecasting for the UK
We often see presented the increasing skill of global NWP with the skill in the southern hemisphere now matching that in the northern hemisphere through use of satellite radiances in 4D-Var and a gain of 1 day in skill over 10 years.
We less frequently see presentations of the increase in skill of high resolution, limited area forecasts of the surface weather elements. In the UK Met Office these are measured using the so called UK Index.
In brief, in 2011 the UK Index was based on
a) Verification of hourly forecasts of temperature and vector wind, hourly yes/no threshold forecasts of cloud cover, cloud base height and visibility together with six-hourly yes/no threshold forecasts of precipitation amount. Three thresholds are used for each of the parameters assessed as a categorical forecast.
b) A persistence skill score measure is adopted for temperature and wind. The categorical forecasts are measured using equitable threat scores. The five parameters (temperature, wind, cloud, visibility and precipitation) are equally weighted.
c) Best available automated forecast (currently provided by UK 1.5km model) contributes to the UK Index out to a 36 hour lead time. All 4 forecasts each day are assessed.
d) Truth is provided by quality controlled UK Synoptic Observations. Currently 118 sites which report hourly and have been assessed as reliable, but with only automated cloud reports contributing to the cloud assessment.
e) A 36 month rolling average (aggregate in the case of categorical scores) is used to provide a smoother trend.
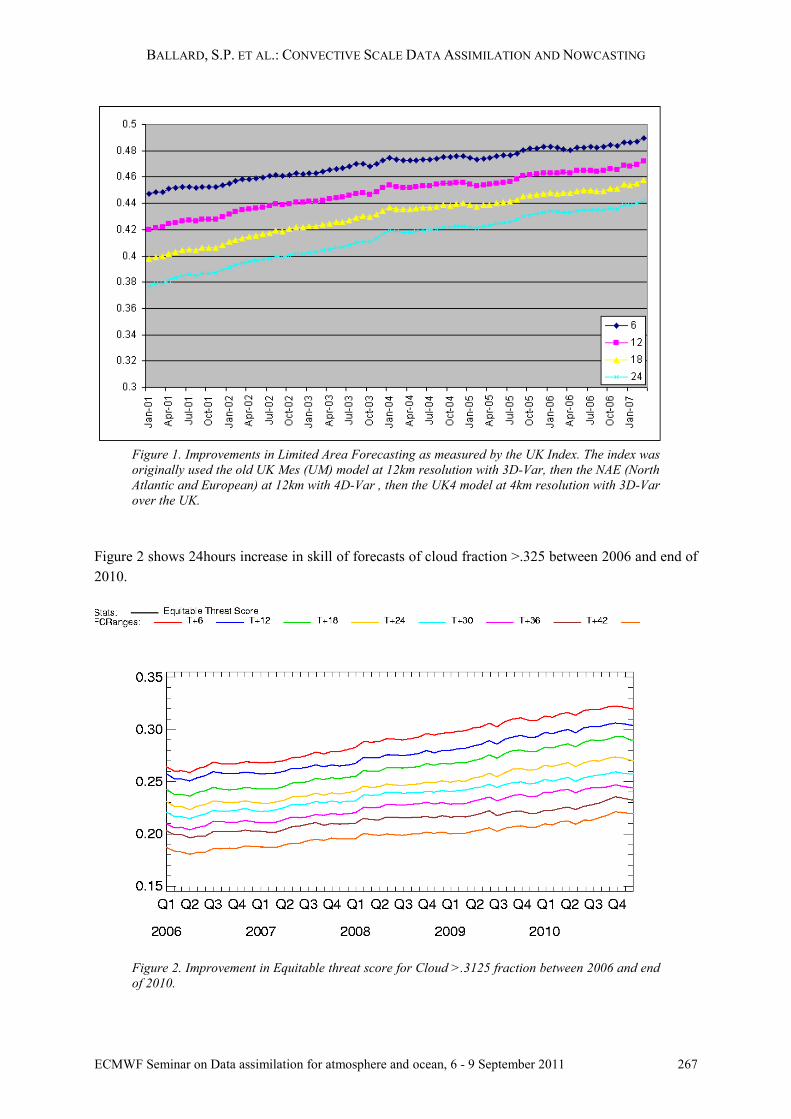
Figure 1 shows that over a period of 6 years from 2001 to 2007 there has been 18hours gain in skill.
BALLARD, S.P. ET AL.: CONVECTIVE SCALE DATA ASSIMILATION AND NOWCASTING
ECMWF Seminar on Data assimilation for atmosphere and ocean, 6 - 9 September 2011 267
Figure 1. Improvements in Limited Area Forecasting as measured by the UK Index. The index was originally used the old UK Mes (UM) model at 12km resolution with 3D-Var, then the NAE (North Atlantic and European) at 12km with 4D-Var , then the UK4 model at 4km resolution with 3D-Var over the UK.
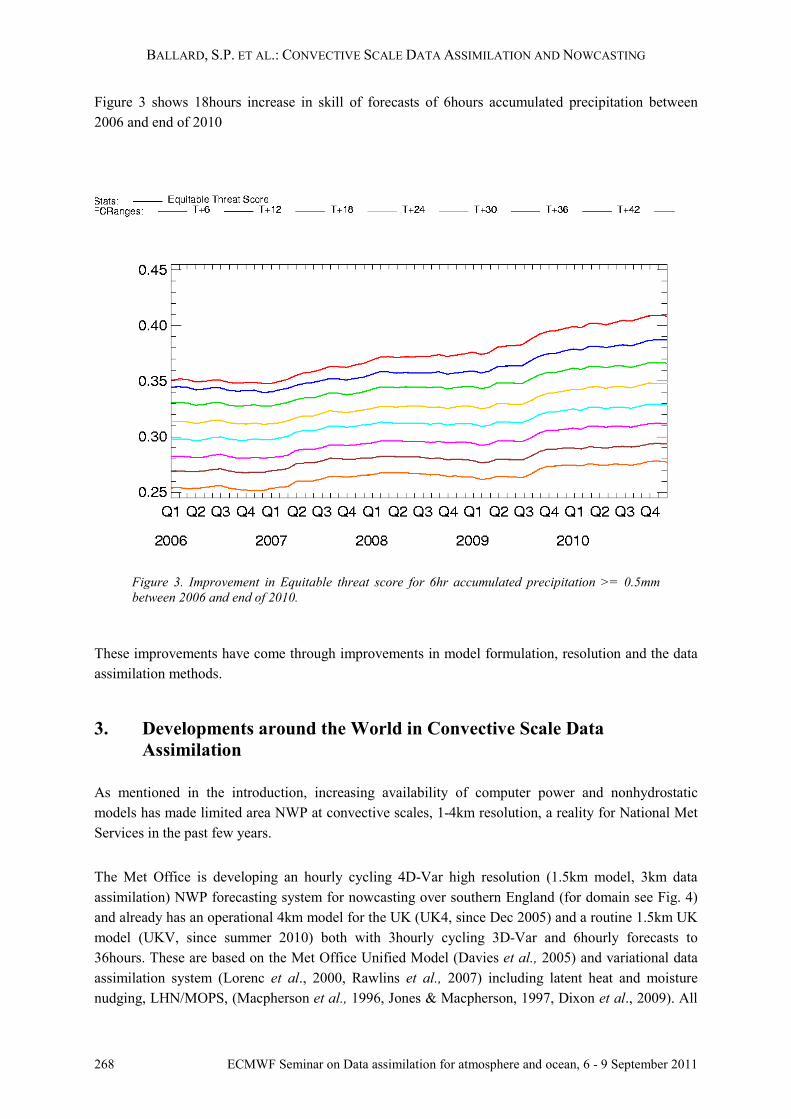
Figure 2 shows 24hours increase in skill of forecasts of cloud fraction >.325 between 2006 and end of 2010.
Figure 2. Improvement in Equitable threat score for Cloud >.3125 fraction between 2006 and end of 2010.
BALLARD, S.P. ET AL.: CONVECTIVE SCALE DATA ASSIMILATION AND NOWCASTING
268 ECMWF Seminar on Data assimilation for atmosphere and ocean, 6 - 9 September 2011
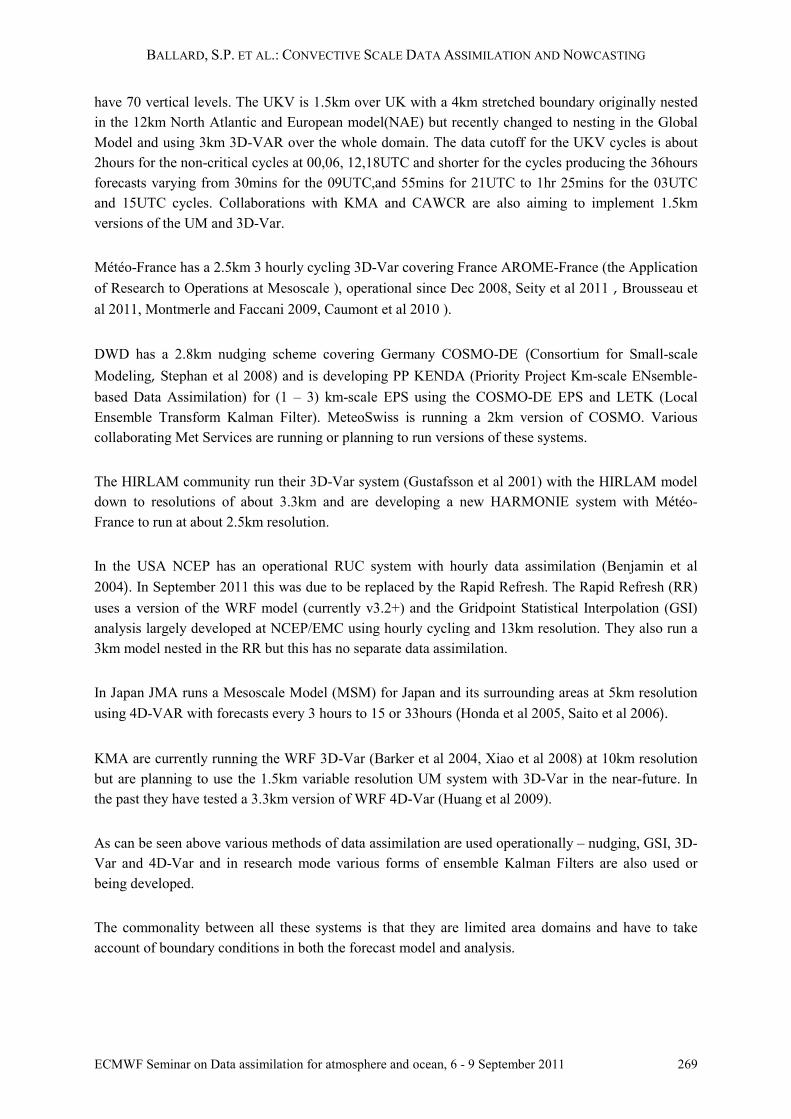
Figure 3 shows 18hours increase in skill of forecasts of 6hours accumulated precipitation between 2006 and end of 2010
Figure 3. Improvement in Equitable threat score for 6hr accumulated precipitation >= 0.5mm between 2006 and end of 2010.
These improvements have come through improvements in model formulation, resolution and the data assimilation methods.
3. Developments around the World in Convective Scale Data Assimilation
As mentioned in the introduction, increasing availability of computer power and nonhydrostatic models has made limited area NWP at convective scales, 1-4km resolution, a reality for National Met Services in the past few years.
The Met Office is developing an hourly cycling 4D-Var high resolution (1.5km model, 3km data assimilation) NWP forecasting system for nowcasting over southern England (for domain see Fig. 4) and already has an operational 4km model for the UK (UK4, since Dec 2005) and a routine 1.5km UK model (UKV, since summer 2010) both with 3hourly cycling 3D-Var and 6hourly forecasts to 36hours. These are based on the Met Office Unified Model (Davies et al., 2005) and variational data assimilation system (Lorenc et al., 2000, Rawlins et al., 2007) including latent heat and moisture nudging, LHN/MOPS, (Macpherson et al., 1996, Jones & Macpherson, 1997, Dixon et al., 2009). All
BALLARD, S.P. ET AL.: CONVECTIVE SCALE DATA ASSIMILATION AND NOWCASTING
ECMWF Seminar on Data assimilation for atmosphere and ocean, 6 - 9 September 2011 269
have 70 vertical levels. The UKV is 1.5km over UK with a 4km stretched boundary originally nested in the 12km North Atlantic and European model(NAE) but recently changed to nesting in the Global Model and using 3km 3D-VAR over the whole domain. The data cutoff for the UKV cycles is about 2hours for the non-critical cycles at 00,06, 12,18UTC and shorter for the cycles producing the 36hours forecasts varying from 30mins for the 09UTC,and 55mins for 21UTC to 1hr 25mins for the 03UTC and 15UTC cycles. Collaborations with KMA and CAWCR are also aiming to implement 1.5km versions of the UM and 3D-Var.
Météo-France has a 2.5km 3 hourly cycling 3D-Var covering France AROME-France (the Application of Research to Operations at Mesoscale ), operational since Dec 2008, Seity et al 2011 , Brousseau et al 2011, Montmerle and Faccani 2009, Caumont et al 2010 ).
DWD has a 2.8km nudging scheme covering Germany COSMO-DE (Consortium for Small-scale Modeling, Stephan et al 2008) and is developing PP KENDA (Priority Project Km-scale ENsemble-based Data Assimilation) for (1 – 3) km-scale EPS using the COSMO-DE EPS and LETK (Local Ensemble Transform Kalman Filter). MeteoSwiss is running a 2km version of COSMO. Various collaborating Met Services are running or planning to run versions of these systems.
The HIRLAM community run their 3D-Var system (Gustafsson et al 2001) with the HIRLAM model down to resolutions of about 3.3km and are developing a new HARMONIE system with Météo-France to run at about 2.5km resolution.
In the USA NCEP has an operational RUC system with hourly data assimilation (Benjamin et al 2004). In September 2011 this was due to be replaced by the Rapid Refresh. The Rapid Refresh (RR) uses a version of the WRF model (currently v3.2+) and the Gridpoint Statistical Interpolation (GSI) analysis largely developed at NCEP/EMC using hourly cycling and 13km resolution. They also run a 3km model nested in the RR but this has no separate data assimilation.
In Japan JMA runs a Mesoscale Model (MSM) for Japan and its surrounding areas at 5km resolution using 4D-VAR with forecasts every 3 hours to 15 or 33hours (Honda et al 2005, Saito et al 2006).
KMA are currently running the WRF 3D-Var (Barker et al 2004, Xiao et al 2008) at 10km resolution but are planning to use the 1.5km variable resolution UM system with 3D-Var in the near-future. In the past they have tested a 3.3km version of WRF 4D-Var (Huang et al 2009).
As can be seen above various methods of data assimilation are used operationally – nudging, GSI, 3D-Var and 4D-Var and in research mode various forms of ensemble Kalman Filters are also used or being developed.
The commonality between all these systems is that they are limited area domains and have to take account of boundary conditions in both the forecast model and analysis.
BALLARD, S.P. ET AL.: CONVECTIVE SCALE DATA ASSIMILATION AND NOWCASTING
270 ECMWF Seminar on Data assimilation for atmosphere and ocean, 6 - 9 September 2011
4. Boundary conditions
At present available computer resources only allow 1-3km resolution NWP systems to be run in limited area mode. This means that lateral boundary conditions (lbcs) have to be provided by larger domain (or global) coarser resolution NWP models. This limits the accuracy of the higher resolution forecasts and the time period of impact of the initial conditions and analysis improvements in the small domain convective scale model. Frequently the small domain high resolution system produces its analysis and forecast before the system providing the boundary conditions is updated. Therefore not only are boundary conditions provided by a coarser resolution and less detailed forecast but they are inherently less accurate due to being longer range forecasts.
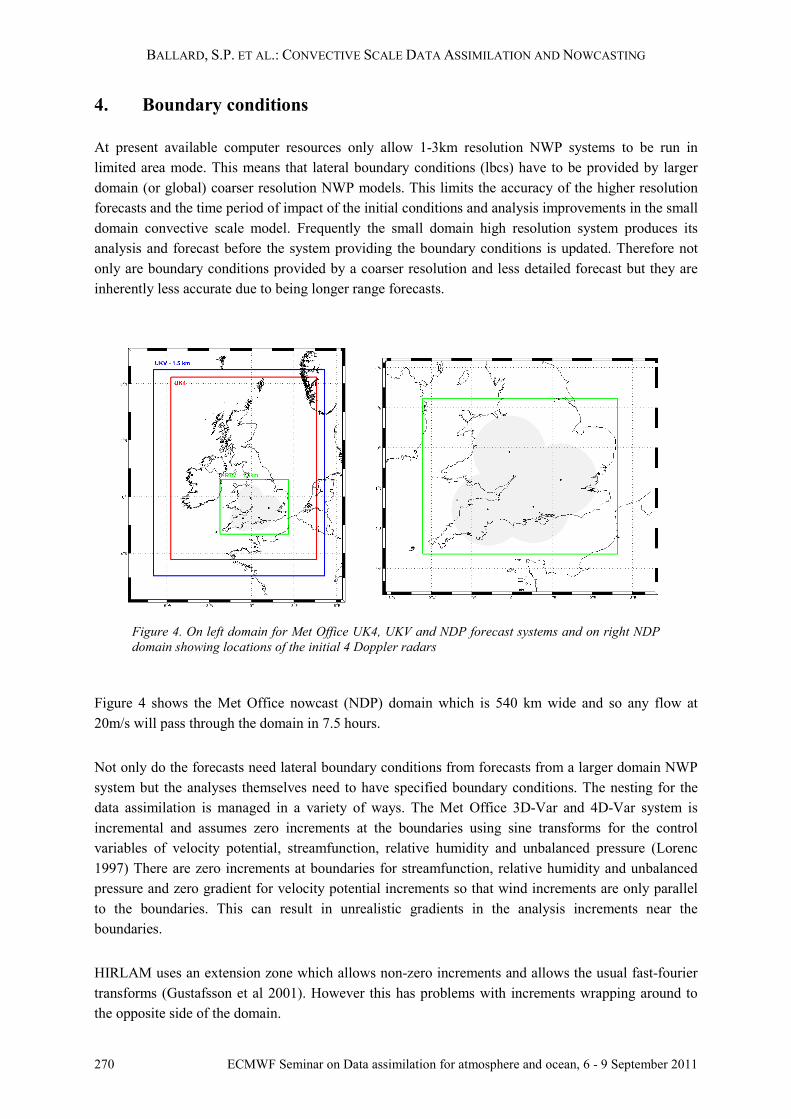
Figure 4. On left domain for Met Office UK4, UKV and NDP forecast systems and on right NDP domain showing locations of the initial 4 Doppler radars
Figure 4 shows the Met Office nowcast (NDP) domain which is 540 km wide and so any flow at 20m/s will pass through the domain in 7.5 hours.
Not only do the forecasts need lateral boundary conditions from forecasts from a larger domain NWP system but the analyses themselves need to have specified boundary conditions. The nesting for the data assimilation is managed in a variety of ways. The Met Office 3D-Var and 4D-Var system is incremental and assumes zero increments at the boundaries using sine transforms for the control variables of velocity potential, streamfunction, relative humidity and unbalanced pressure (Lorenc 1997) There are zero increments at boundaries for streamfunction, relative humidity and unbalanced pressure and zero gradient for velocity potential increments so that wind increments are only parallel to the boundaries. This can result in unrealistic gradients in the analysis increments near the boundaries.
HIRLAM uses an extension zone which allows non-zero increments and allows the usual fast-fourier transforms (Gustafsson et al 2001). However this has problems with increments wrapping around to the opposite side of the domain.
BALLARD, S.P. ET AL.: CONVECTIVE SCALE DATA ASSIMILATION AND NOWCASTING
ECMWF Seminar on Data assimilation for atmosphere and ocean, 6 - 9 September 2011 271
The COSMO nudging system works in model space so has no need for specific boundary conditions for the analysis, just for the forecast itself.
The lateral boundary conditions for the analyses/data assimilation can also be considered as control variables and this has been investigated in research mode by the HIRLAM group and CMC etc (Gustafsson 2012)
The issue of boundary conditions could be more complex in 4D-Var due to the time variation but essentially the same types of options are used as in 3D-VAR. In the Met Office limited area Unified model the boundary conditions are provided using a blending zone with the values from the coarser resolution forecast at the outer edge and in the linear model in 4D-VAR the increments are set to zero in that region, the linearization states have a blend of high resolution forecast and values from the forcing model. Gustafsson 2012 concludes that “Although the impact of the control of the lateral boundaries, as verified by forecast verification scores, turned out to be quite modest, the qualitative evidence provided by the single simulated observation experiments motivates us to recommend the control of LBCs in 4D-Var data assimilation for LAMs”. This has not been investigated in the Met Office LAM 4D-VAR which is used operationally in the North Atlantic and European Model at 36km resolution and in the 3km 4D-Var for the NDP.
5. Continuous cycling or intermittent analyses
Choices can be made as to whether to run the high resolution limited area analysis forecast system in continuous cycling mode or intermittently starting from a downscaled coarser resolution analysis and running just one or a number of high resolution analysis forecast cycles. The advantage of continuous cycling is that the high resolution features of the forecasts are retained in the next analysis. The advantage of intermittent systems is that any deviation of the high resolution forecast away from the correct synoptic evolution can be corrected by starting again from the coarser resolution analysis produced on a larger domain and hence potentially able to provide a better analysis of the larger scale synoptic features. The Met Office systems are now all continuously cycling.
6. Problems with Balance due to additions of analysis increments and changes in lateral boundary conditions between cycles
The addition of analysis increments to background forecast fields can result in loss of balance and production of gravity waves which are visible in the time evolution of surface pressure tendency. In the Met Office 3D-Var system this is dealt with by using the IAU (Bloom et al 1996).
Balance has been investigated in the Met Office NDP system with both 3D-Var and 4D-Var hourly cycling.
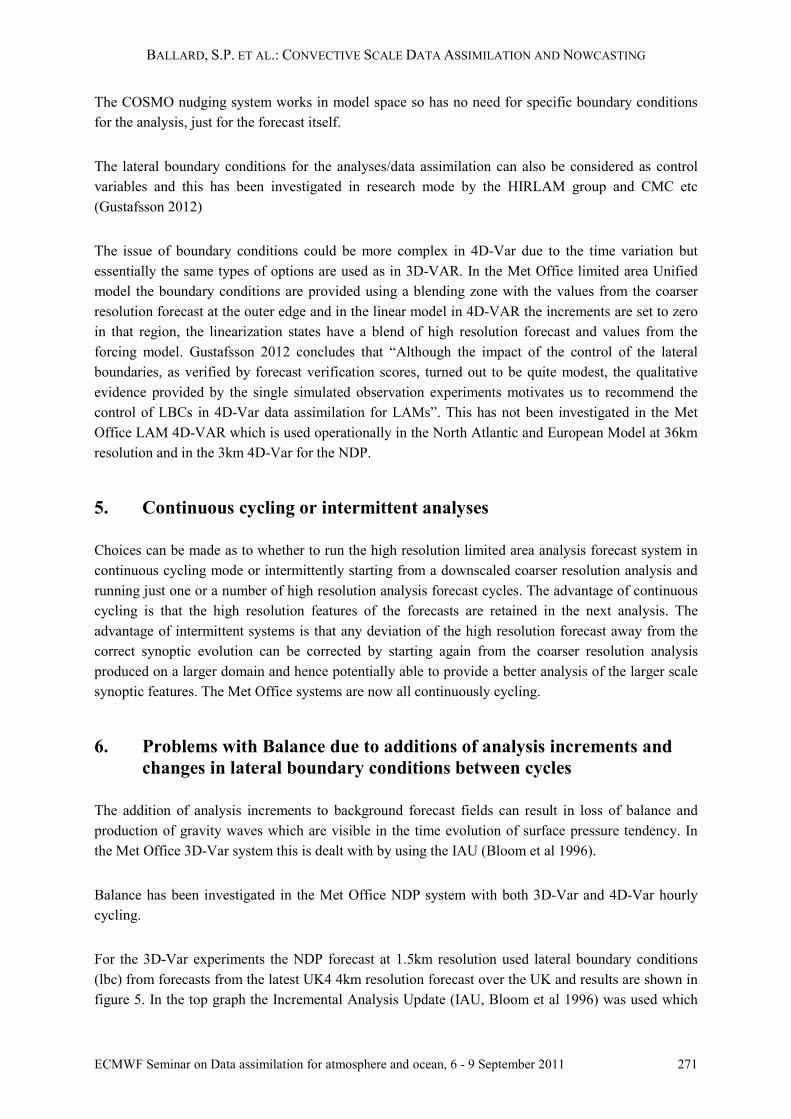
For the 3D-Var experiments the NDP forecast at 1.5km resolution used lateral boundary conditions (lbc) from forecasts from the latest UK4 4km resolution forecast over the UK and results are shown in figure 5. In the top graph the Incremental Analysis Update (IAU, Bloom et al 1996) was used which
BALLARD, S.P. ET AL.: CONVECTIVE SCALE DATA ASSIMILATION AND NOWCASTING
272 ECMWF Seminar on Data assimilation for atmosphere and ocean, 6 - 9 September 2011
damps out gravity waves by adding a fraction of the analysis increments each timestep over a period of 1 hour from T-30mins to T+30mins. It can be seen that the level of gravity wave noise during the IAU period is very similar to that in the ensuing forecast period out to T+90mins . In the middle graph the IAU and MOPS/LHN are not used and the analysis increments are all added at the analysis time ie T+0 and it can be seen that, in fact, any imbalance decays very quickly, possibly because the domain size is relatively small and for these studies the data availability was low as radar Doppler radial winds were not used. However the lower graph shows a forecast with IAU where the boundary conditions are updated to the next UK4 run (these are available every 6 hours) at T-30mins. It can be seen that the change in boundary conditions, which are inconsistent with the interior flow in the NDP background, generates gravity waves that decay over a period of 30 minutes.
Figure 5. rms pstar tendency from Southern UK NDP 3D-Var hourly cycles (courtesy J-F Caron) with horizontal scale minutes starting at -30mins at start of observation window. Top shows with use of IAU from T-30mins to T+30mins and MOPS/LHN nudging also from T-30mins to T+30mins. Middle shows result with no IAU or MOPS/LHN nudging and analysis increments added at T+0. Bottom is as top but for a cycle where boundary conditions are updated to new UK4 forecast run.
BALLARD, S.P. ET AL.: CONVECTIVE SCALE DATA ASSIMILATION AND NOWCASTING
ECMWF Seminar on Data assimilation for atmosphere and ocean, 6 - 9 September 2011 273
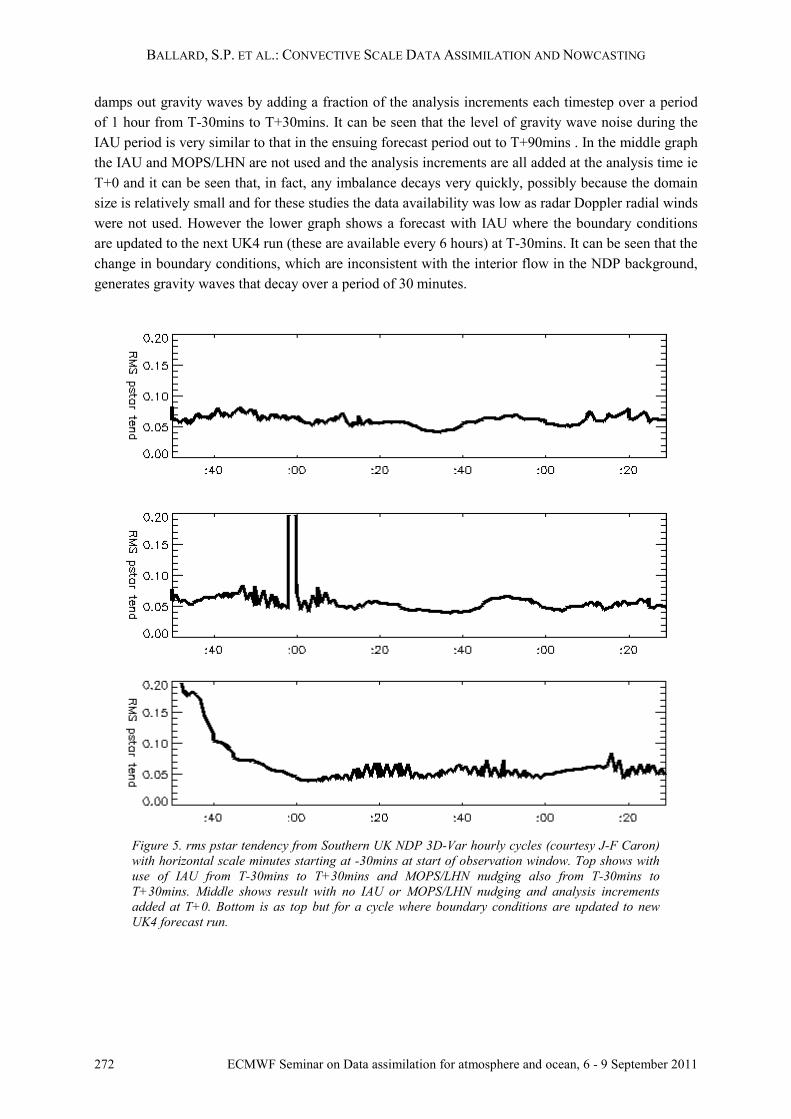
Figure 6 shows a similar plot for the NDP 4D-Var system using, in this case, UKV lateral boundary conditions(UKV) where both the NDP and the UKV providing the lbc are run at 1.5km resolution. In this system the IAU is not used and the increments are all added at the start of the time window which in this case is -30mins. In hourly cycles where the boundary conditions are not updated to a new UKV forecast cycle there is very little gravity wave noise from the addition of the analysis increments. However when the boundary conditions change gravity waves are generated which decay over a period of about 1 hour. The noise in the plots has been reduced compared to figure 5 by running the GCR solver in the version of the Unified Model used in the NDP forecasts to higher accuracy than in the 3D-Var forecasts
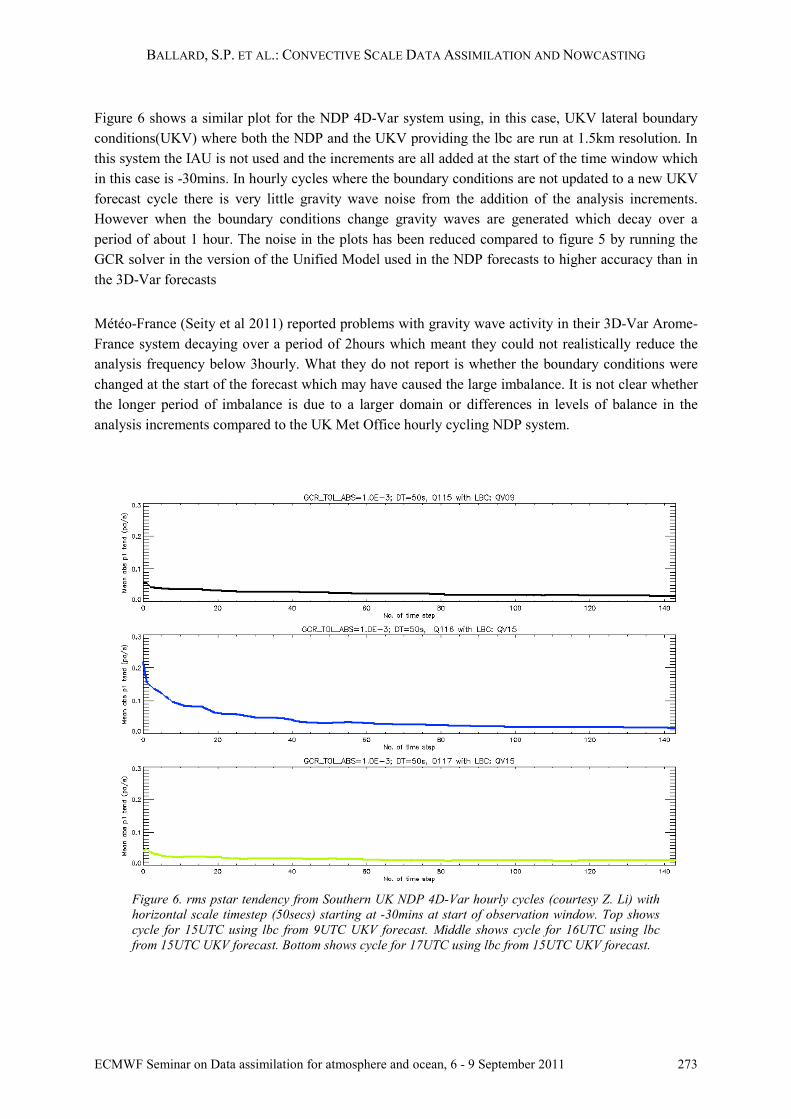
Météo-France (Seity et al 2011) reported problems with gravity wave activity in their 3D-Var Arome-France system decaying over a period of 2hours which meant they could not realistically reduce the analysis frequency below 3hourly. What they do not report is whether the boundary conditions were changed at the start of the forecast which may have caused the large imbalance. It is not clear whether the longer period of imbalance is due to a larger domain or differences in levels of balance in the analysis increments compared to the UK Met Office hourly cycling NDP system.
Figure 6. rms pstar tendency from Southern UK NDP 4D-Var hourly cycles (courtesy Z. Li) with horizontal scale timestep (50secs) starting at -30mins at start of observation window. Top shows cycle for 15UTC using lbc from 9UTC UKV forecast. Middle shows cycle for 16UTC using lbc from 15UTC UKV forecast. Bottom shows cycle for 17UTC using lbc from 15UTC UKV forecast.
BALLARD, S.P. ET AL.: CONVECTIVE SCALE DATA ASSIMILATION AND NOWCASTING
274 ECMWF Seminar on Data assimilation for atmosphere and ocean, 6 - 9 September 2011
Figure 7. From Seity et al 2011. Temporal evolution of the surface pressure tendency rmse over a single time step (60 s) averaged over the model domain from 2.5 km Arome-France. Data points are taken every 5 min of integration.
7. Blending Synoptic Scale Information with convective scale analysis In addition to issues with specification of boundary conditions and issues with balance and gravity waves when they are changed from one forecast run to another the issue of accurate analysis of the larger, synoptic scales needs to be considered. A small area domain may not contain the full horizontal extent of synoptic scale features so that observations within the high resolution limited area domain may not be able to accurately represent the larger scale features. Synoptic scale forcing is provided by the boundary conditions. As alluded to earlier this forcing may change, and be more accurate, in boundary conditions from shorter period forecasts from a later analysis time. This new synoptic forcing may not be consistent with the synoptic situation in the high resolution limited area forecast produced using boundary conditions from an older larger scale forecast. Various attempts have been made to try to improve treatment of the larger scales.
The Met Office have tried incorporating larger scale information from the coarser resolution analysis and only analysing the smaller scales in the higher resolution limited area domain (Zhihong Li personal communication]. The Met Office have also tried correcting the larger scales in a continuously cycling analysis forecast system by updating the background with the difference between the old and the new boundary conditions when the new boundary conditions become available to reduce mismatch between the analysis and the boundary conditions (Gordon Inverarity personal communication). This work will be looked at again once a new background error model is available.
MétéoFrance have tried using the larger scale analysis as an extra source of information in an additional penalty term (Guidard and Fischer 2008).
Dahlgren and Gustafsson 2012 have also investigated constraining the larger scales in the analysis in HIRLAM 3D-Var and 4D-Var to those of the host model providing the lateral boundary conditions. They added an extra term, which they called the host model constraint, Jk, measuring the distance to the large-scale vorticity of the host model, to the cost-function of the variational data-assimilation. By constraining only vorticity, the remaining model variables, divergence, temperature, surface pressure and specific humidity can be allowed to adapt to the modified vorticity field in accordance with the

BALLARD, S.P. ET AL.: CONVECTIVE SCALE DATA ASSIMILATION AND NOWCASTING
ECMWF Seminar on Data assimilation for atmosphere and ocean, 6 - 9 September 2011 275
internal balance constraints of the regional model. The vorticity field, provided by the European Centre for Medium-range Weather Forecasts (ECMWF) operational model, was assimilated into the HIRLAM model during an experiment period of 33 d in winter with positive impact on forecast verification statistics for upper air variables and mean sea level pressure.
8. Control variables
Global and coarse resolution analyses typically use control variables assuming geostrophic and hydrostatic balance e.g. increments of velocity potential, stream function, unbalanced pressure and relative humidity or some form of humidity transform in the Met Office system and WRF, vorticity, divergence, temperature, surface pressure and specific humidity in ALADIN.
One expects these balance constraints to break down at high resolutions and new control variables to be required. Bannister et al 2011 found that geostrophic and hydrostatic balances decay as the horizontal scale decreases with geostrophic balance becoming less important < 75 km and hydrostatic balance becomes less important < 35 km. Vetra-Carvalho et al 2012 using an ensemble of Met Office Unified Model Forecasts showed that at 1.5 km resolution hydrostatic balance did not hold in the perturbations in the regions of convection, but did hold in the regions where convection is not present. They also show that 20 km horizontal resolution is the lower limit at which the hydrostatic balance became valid over the entire domain.
However although work is ongoing to investigate what constraints to apply at convective scale – if any at all – no changes have yet been applied to operational convective scale data assimilation systems.
JMA (Kawabata et al 2007) have tested a 2km 4D-Var system using control variables of horizontal wind (u,v), vertical wind(w), nonhydrostatic pressure, potential temperature, surface pressure and pseudo relative humidity (Dee and Da Silva 2002) with a 50km lengthscale.
In convective scale NWP systems direct prediction of weather features such as cloud and precipitation becomes the essential aim of the forecasts – particularly to predict severe flooding events. This makes it important to initialize cloud and to make use of cloud and precipitation affected observations such as satellite radiances, radar reflectivity and surface precipitation rates or accumulations. In order to assimilate these observations one may expect to need to extend the control variables to include hydrometeors such as cloud liquid water, cloud ice and precipitation. This has been done in research systems around the world but not yet in operational systems. The Met Office humidity control variable is currently based around total humidity, qt, with a cloud incrementing operator to diagnose the cloud variables for use in observation operators.
9. Background errors
As with global data assimilation background errors are produced in various ways for the limited area high resolution models. Typically the NMC method (Parrish and Derber 1992, Parrish et al 1997, Derber and Bouttier 1999) or ensemble assimilation techniques are used (Brousseau et al 2011).
BALLARD, S.P. ET AL.: CONVECTIVE SCALE DATA ASSIMILATION AND NOWCASTING
276 ECMWF Seminar on Data assimilation for atmosphere and ocean, 6 - 9 September 2011
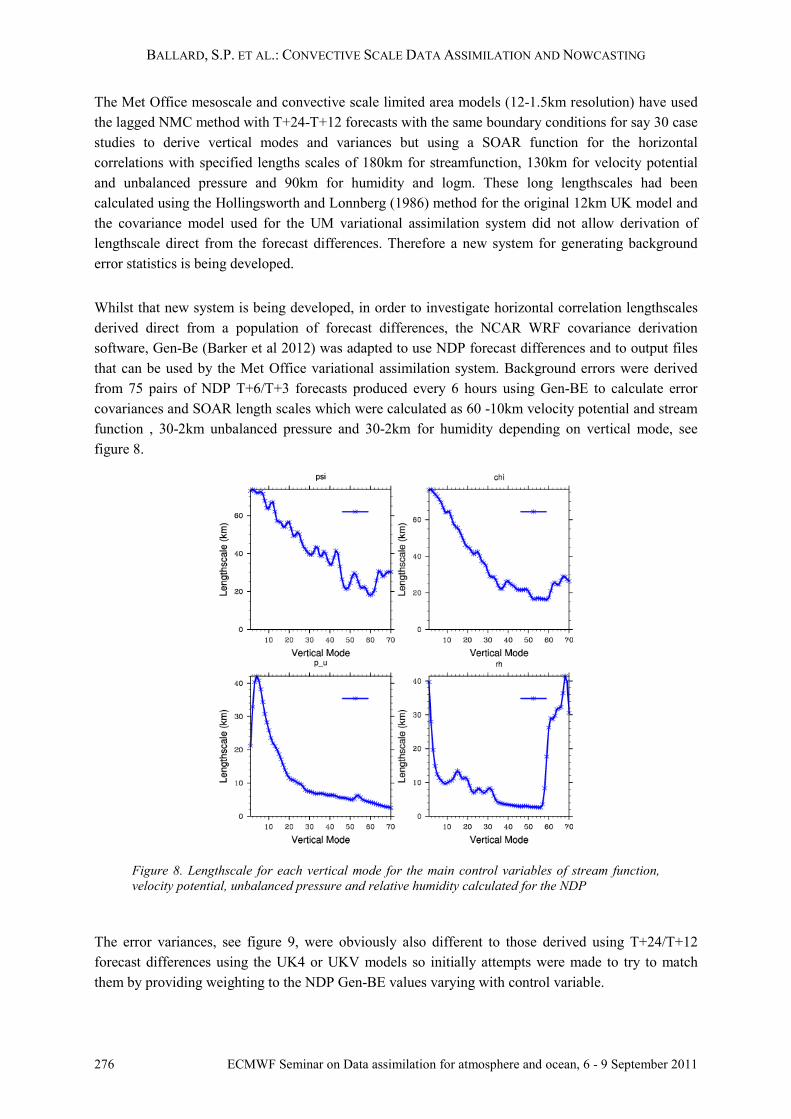
The Met Office mesoscale and convective scale limited area models (12-1.5km resolution) have used the lagged NMC method with T+24-T+12 forecasts with the same boundary conditions for say 30 case studies to derive vertical modes and variances but using a SOAR function for the horizontal correlations with specified lengths scales of 180km for streamfunction, 130km for velocity potential and unbalanced pressure and 90km for humidity and logm. These long lengthscales had been calculated using the Hollingsworth and Lonnberg (1986) method for the original 12km UK model and the covariance model used for the UM variational assimilation system did not allow derivation of lengthscale direct from the forecast differences. Therefore a new system for generating background error statistics is being developed.
Whilst that new system is being developed, in order to investigate horizontal correlation lengthscales derived direct from a population of forecast differences, the NCAR WRF covariance derivation software, Gen-Be (Barker et al 2012) was adapted to use NDP forecast differences and to output files that can be used by the Met Office variational assimilation system. Background errors were derived from 75 pairs of NDP T+6/T+3 forecasts produced every 6 hours using Gen-BE to calculate error covariances and SOAR length scales which were calculated as 60 -10km velocity potential and stream function , 30-2km unbalanced pressure and 30-2km for humidity depending on vertical mode, see figure 8.
Figure 8. Lengthscale for each vertical mode for the main control variables of stream function, velocity potential, unbalanced pressure and relative humidity calculated for the NDP
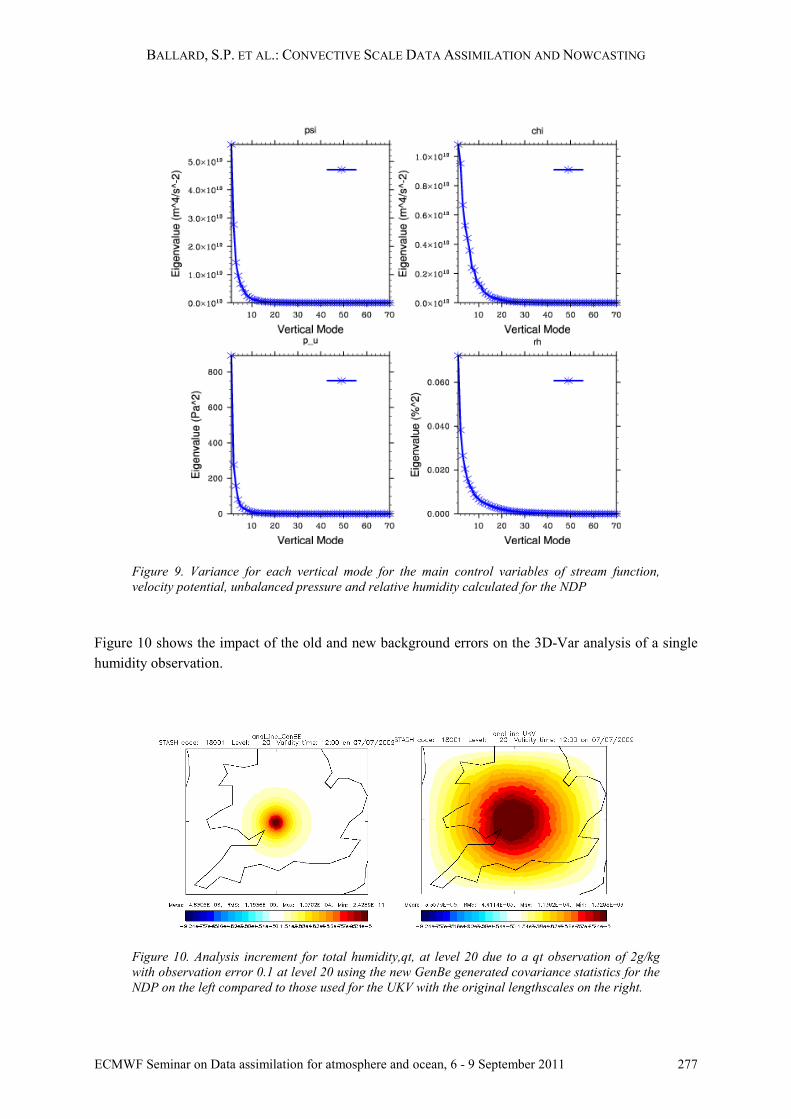
The error variances, see figure 9, were obviously also different to those derived using T+24/T+12 forecast differences using the UK4 or UKV models so initially attempts were made to try to match them by providing weighting to the NDP Gen-BE values varying with control variable.
BALLARD, S.P. ET AL.: CONVECTIVE SCALE DATA ASSIMILATION AND NOWCASTING
ECMWF Seminar on Data assimilation for atmosphere and ocean, 6 - 9 September 2011 277
Figure 9. Variance for each vertical mode for the main control variables of stream function, velocity potential, unbalanced pressure and relative humidity calculated for the NDP
Figure 10 shows the impact of the old and new background errors on the 3D-Var analysis of a single humidity observation.
Figure 10. Analysis increment for total humidity,qt, at level 20 due to a qt observation of 2g/kg with observation error 0.1 at level 20 using the new GenBe generated covariance statistics for the NDP on the left compared to those used for the UKV with the original lengthscales on the right.
BALLARD, S.P. ET AL.: CONVECTIVE SCALE DATA ASSIMILATION AND NOWCASTING
278 ECMWF Seminar on Data assimilation for atmosphere and ocean, 6 - 9 September 2011
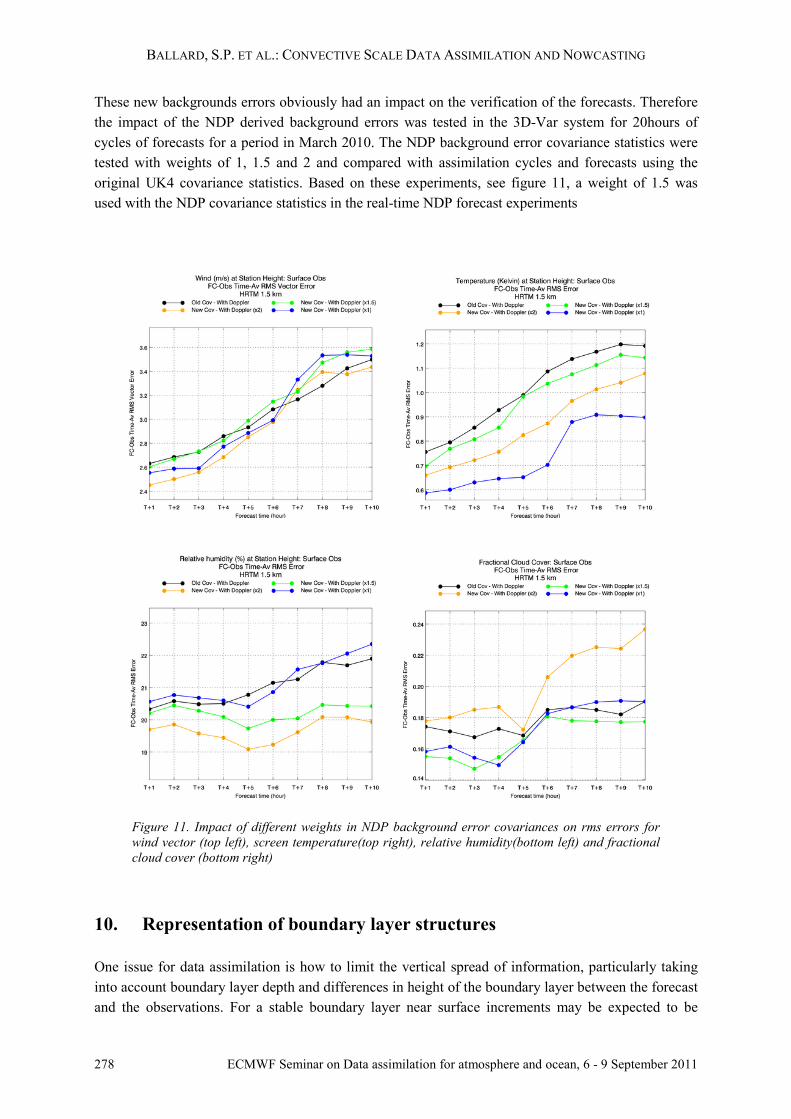
These new backgrounds errors obviously had an impact on the verification of the forecasts. Therefore the impact of the NDP derived background errors was tested in the 3D-Var system for 20hours of cycles of forecasts for a period in March 2010. The NDP background error covariance statistics were tested with weights of 1, 1.5 and 2 and compared with assimilation cycles and forecasts using the original UK4 covariance statistics. Based on these experiments, see figure 11, a weight of 1.5 was used with the NDP covariance statistics in the real-time NDP forecast experiments
Figure 11. Impact of different weights in NDP background error covariances on rms errors for wind vector (top left), screen temperature(top right), relative humidity(bottom left) and fractional cloud cover (bottom right)
10. Representation of boundary layer structures
One issue for data assimilation is how to limit the vertical spread of information, particularly taking into account boundary layer depth and differences in height of the boundary layer between the forecast and the observations. For a stable boundary layer near surface increments may be expected to be
BALLARD, S.P. ET AL.: CONVECTIVE SCALE DATA ASSIMILATION AND NOWCASTING
ECMWF Seminar on Data assimilation for atmosphere and ocean, 6 - 9 September 2011 279
limited to near the surface whereas for a well mixed boundary layer any increments are likely to need to be spread throughout the boundary layer. In convective scale data assimilation and NWP prediction of boundary layer cloud such as stratocumulus is very important but it can be hard to ensure the capping inversion is at the correct altitude and to correct the height if necessary.
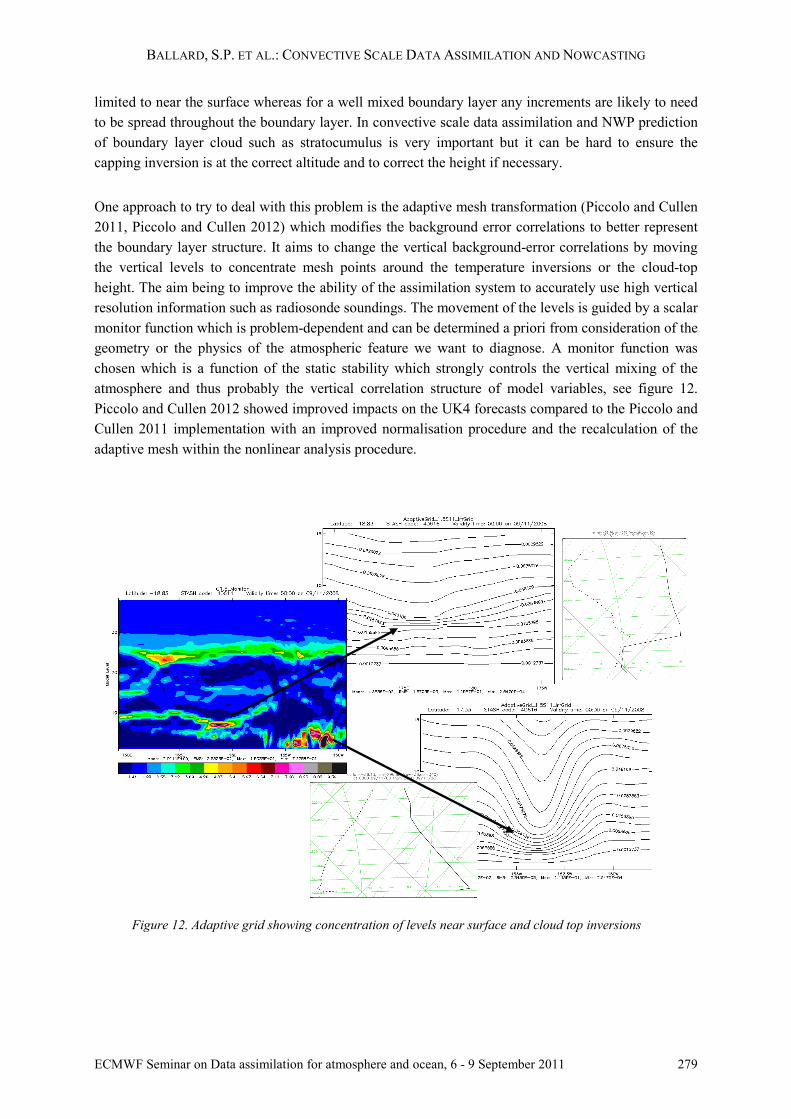
One approach to try to deal with this problem is the adaptive mesh transformation (Piccolo and Cullen 2011, Piccolo and Cullen 2012) which modifies the background error correlations to better represent the boundary layer structure. It aims to change the vertical background-error correlations by moving the vertical levels to concentrate mesh points around the temperature inversions or the cloud-top height. The aim being to improve the ability of the assimilation system to accurately use high vertical resolution information such as radiosonde soundings. The movement of the levels is guided by a scalar monitor function which is problem-dependent and can be determined a priori from consideration of the geometry or the physics of the atmospheric feature we want to diagnose. A monitor function was chosen which is a function of the static stability which strongly controls the vertical mixing of the atmosphere and thus probably the vertical correlation structure of model variables, see figure 12. Piccolo and Cullen 2012 showed improved impacts on the UK4 forecasts compared to the Piccolo and Cullen 2011 implementation with an improved normalisation procedure and the recalculation of the adaptive mesh within the nonlinear analysis procedure.
Figure 12. Adaptive grid showing concentration of levels near surface and cloud top inversions
BALLARD, S.P. ET AL.: CONVECTIVE SCALE DATA ASSIMILATION AND NOWCASTING
280 ECMWF Seminar on Data assimilation for atmosphere and ocean, 6 - 9 September 2011
11. Observations
The traditional Met Office NWP systems, both 3D and 4D-Var, make use of hourly observations in 3 or 6 hourly time windows either as FGAT (first guess at time of observation and innovation assumed at centre of time window in 3D-Var) or innovations at the time of the observation in 4D-VAR. With hourly cycling and 1 hour time-windows subhourly data can potentially be exploited.
Observations already used in the UKV model are 3hourly cloud cover analysis derived from surface cloud base/cover and satellite imagery data, hourly radar derived surface precipitation rate composite, hourly synop data including screen T, RH, wind, pressure and visibility, radiosonde when available, hourly SEVIRI IR – 2 upper tropospheric water vapour channels over land plus 3 low level window/humidity channels over sea, hourly AMDARS, satellite winds, wind profiler, GPS time delay and scatterometer winds.
Running forecasts explicitly resolving convection and with rapid update cycles implies the need for high space and time resolution observations. This places a special emphasis on exploiting high resolution novel observations such as radar radial Doppler winds, reflectivity data and Meteosat SEVIRI IR imagery data both clear and cloudy. Many of these observations can also be used within the UKV system so development at the Met Office covers use in the NDP and UKV.
12. First-guess at time of observations (FGAT)
As mentioned in section 11 incremental 3DVar systems have traditionally adopted FGAT – first-guess at time of observations – to calculate O-B increments relating to observations throughout the time window using a B calculated from time interpolated forecast fields. All the increments are then assumed to apply to the analysis time. This was introduced mainly to allow use of polar orbiter satellite soundings in global or regional models for 24hour to 10day forecasts. It is not clear whether this can cause benefit or harm in high resolution frequently cycling systems where the space and time accuracy of weather systems is better resolved, subhourly observations at fixed locations are available and the aim is very accurate short-range forecasts or nowcasts. For instance when geostationary imagery is used including cloudy pixels it is not clear that there is still a need for FGAT. Obviously in 4D-Var the data is used at the correct time so that the higher time frequency of observations are expected to be beneficial in that system. The impact when trying to capture fast moving features with high time frequency observations at the same location in 3D-VAR needs to be investigated. Ideally they should be used at actual observation time as within 4D-VAR.
13. Met Office NWP-based Nowcasting System, NDP
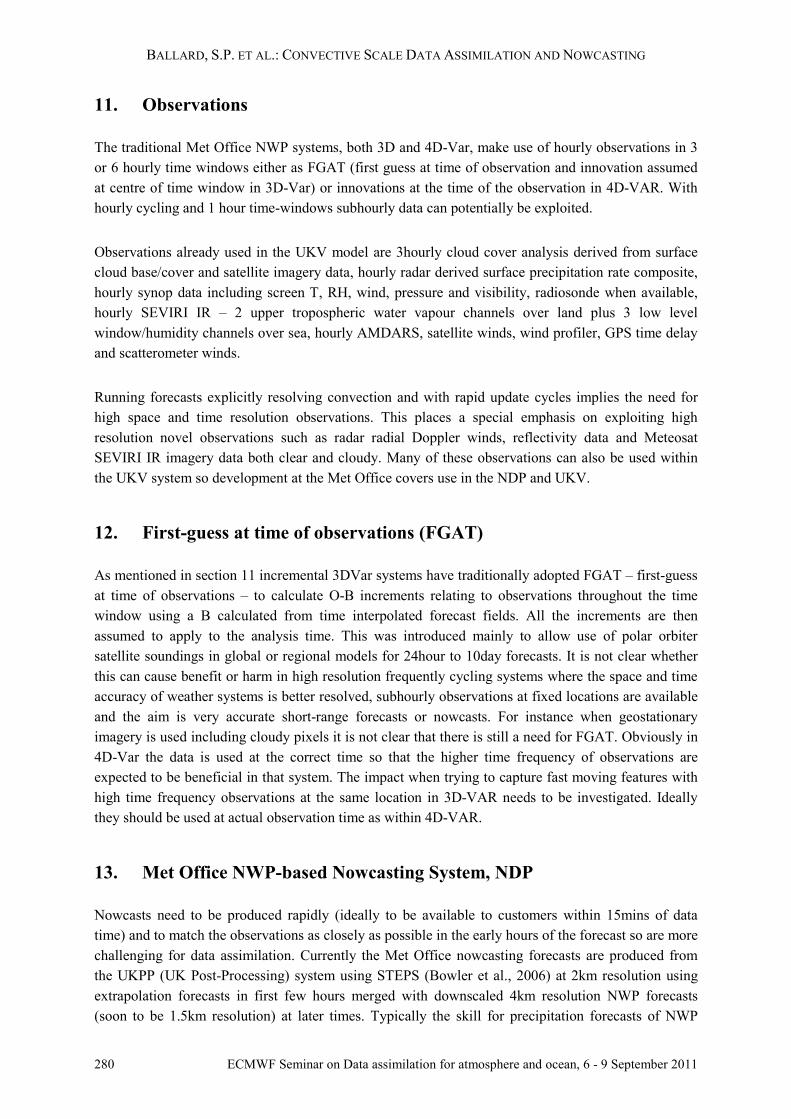
Nowcasts need to be produced rapidly (ideally to be available to customers within 15mins of data time) and to match the observations as closely as possible in the early hours of the forecast so are more challenging for data assimilation. Currently the Met Office nowcasting forecasts are produced from the UKPP (UK Post-Processing) system using STEPS (Bowler et al., 2006) at 2km resolution using extrapolation forecasts in first few hours merged with downscaled 4km resolution NWP forecasts (soon to be 1.5km resolution) at later times. Typically the skill for precipitation forecasts of NWP
BALLARD, S.P. ET AL.: CONVECTIVE SCALE DATA ASSIMILATION AND NOWCASTING
ECMWF Seminar on Data assimilation for atmosphere and ocean, 6 - 9 September 2011 281
models is better than the advection type nowcasts beyond the first 2-3 hours of forecast. This is illustrated in figure 13 which compares the skill for STEPS, UKV and UK4 forecasts.
The Met Office NWP-based nowcast system, NDP, is principally for prediction of convective storms for flood forecasting but also to take over from existing nowcasting and site specific forecasting techniques. Boundary conditions will be provided by the 6 hourly 1.5km resolution forecast system. NWP has the potential to improve nowcasts of precipitation through its ability to predict the full life-cycle of convection, and other forms of precipitation, from initiation, growth and decay using the equations of motion and representation of physical processes. However the real challenge is to improve the NWP forecast skill in the first few hours of the forecast or to gain benefit by improved forecasts beyond that period compared to the current system.
An hourly analysis and forecast system has been run over a limited number of cases of summer rain and convection using conventional data and 3D-Var or 4D-Var. The current aim is to use 4D-VAR, if affordable and beneficial, in a real-time continuously running NWP-based nowcast system to exploit the high time and spatial coverage of radar Doppler radial winds and reflectivity or derived surface rain rates directly within the variational analysis scheme. Direct use in 4D-VAR should allow optimum extraction of information through interaction with other data sources and the potential to modify the dynamical and physical forcing of precipitation and convective storms. High temporal resolution data e.g. every 5-15mins may help to offset poor or limited horizontal resolution of observations. Since March 2012 the NDP system has been running continuously with 4D-Var in near-real time.
Figure 13. Root Mean Squared Factor errors for November 2009 based on hourly accumulations greater than 1mm, smoothed to a scale of 6km, and measured using radar derived accumulations as the reference observation. The performance of 1.5 km (green) and 4 km (red) grid length, UK configurations of the Met Office’s Unified Model are compared with control member STEPS nowcasts blending radar extrapolation with UM: 1.5 km (purple) and UM: 4km (blue) model forecasts. The performance of the STEPS nowcast blending extrapolation with the UM: 1.5 km forecast does not asymptote to that of UM: 1.5 km model because this was an experimental configuration run without prior calibration (figure courtesy of Clive Pierce, Met Office)
BALLARD, S.P. ET AL.: CONVECTIVE SCALE DATA ASSIMILATION AND NOWCASTING
282 ECMWF Seminar on Data assimilation for atmosphere and ocean, 6 - 9 September 2011
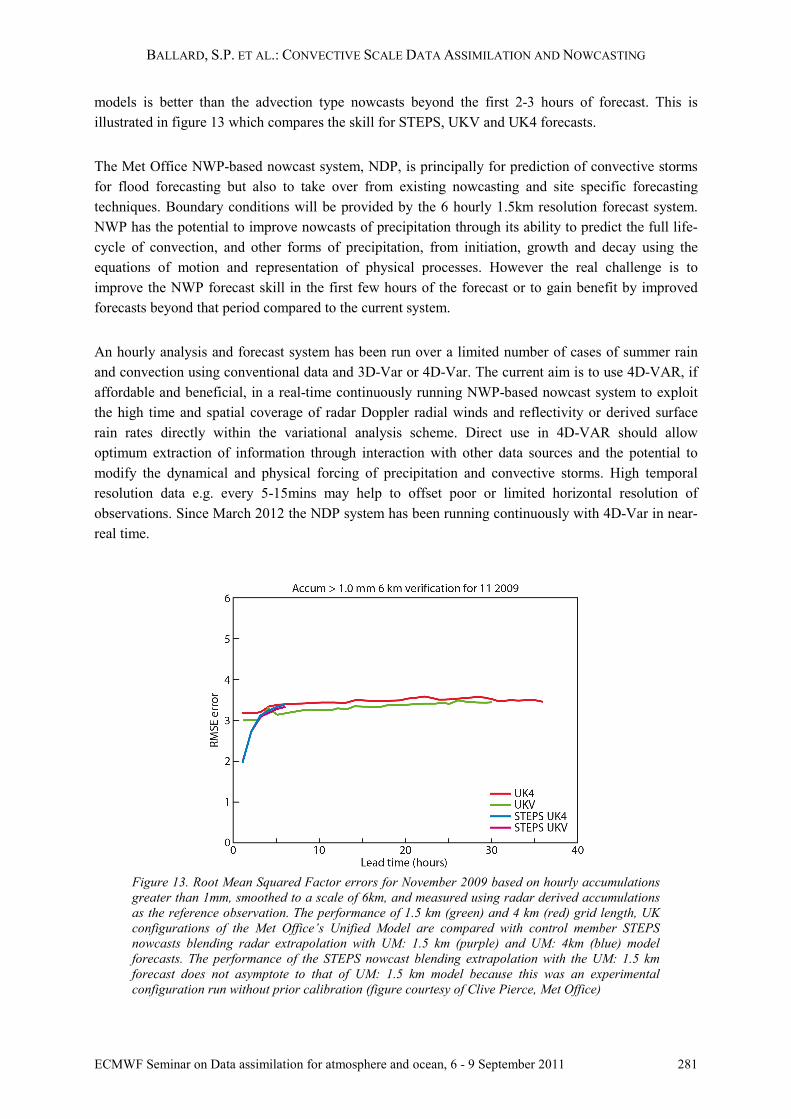
As well as 3D-Var and 4D-Var the convective scale data assimilation at the Met Office uses latent heat nudging to exploit radar derived surface rain rates and also nudging of RH derived from a 3D cloud cover analysis (MOPS) or direct use in the variational analysis (cloud in Var), see figure 14.
Figure 14. Schematic diagram of the NDP data assimilation suite
Strictly the idea behind latent heat nudging breaks down when the precipitation system is resolved and the precipitation falls a number of gridpoints away from the updraft and latent heat release (Stephan et al 2008). However the latent heat nudging scheme has still been found to be beneficial with 3D-Var at 4km resolution (Dixon et al 2009) and in Dec 2005 3hourly 3D-Var was introduced operationally for the 4km UK domain model using LHN with hourly rain rates. For the high resolution, following Dixon et al 2009, negative latent heat increments are not allowed and the filter and search radius are tuned to match the grid-length changes. In Summer 2010 3hourly 3D-Var with LHN using hourly rain rates was implemented for the UKV model (1.5km over UK and 4km stretched boundary nested in 12km NAE and using 3km 3D-VAR over the whole domain). The filter lengthscale for the resulting temperature increments is 21km in the NAE and 6km in UKV and UK4 and a search radius (to find nearest similar precipitating point in the UM forecast) of 72 km is used in the NAE and UK4 and 27km in the UKV. The UKV settings have been used in the initial real-time NDP suite.
14. Comparison of NWP-Based Nowcasting and UKPP forecasts
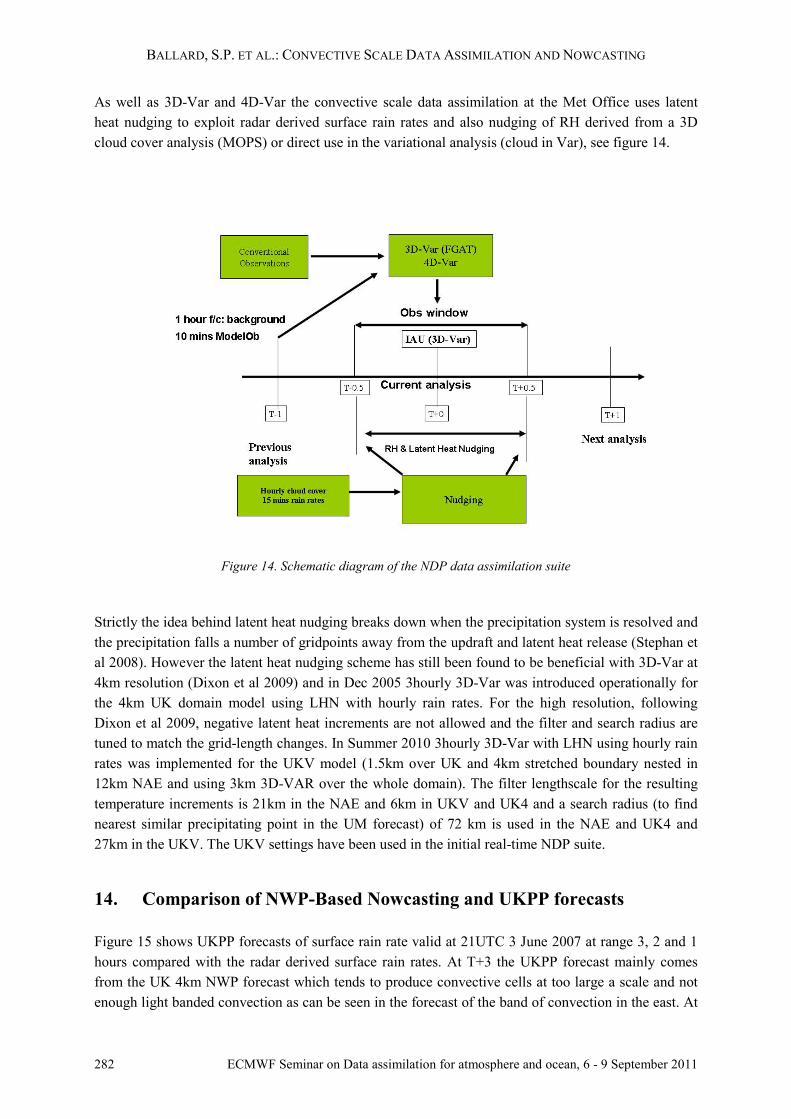
Figure 15 shows UKPP forecasts of surface rain rate valid at 21UTC 3 June 2007 at range 3, 2 and 1 hours compared with the radar derived surface rain rates. At T+3 the UKPP forecast mainly comes from the UK 4km NWP forecast which tends to produce convective cells at too large a scale and not enough light banded convection as can be seen in the forecast of the band of convection in the east. At
BALLARD, S.P. ET AL.: CONVECTIVE SCALE DATA ASSIMILATION AND NOWCASTING
ECMWF Seminar on Data assimilation for atmosphere and ocean, 6 - 9 September 2011 283
T+2 the STEPS scheme has produced the line of convection in the east but it is too narrow, presumably due to convergence in the diagnosed advection. By T+1 a reasonable forecast has been produced.
Figure 15. UKPP forecasts of surface rain rate valid at 21UTC 3 June 2007
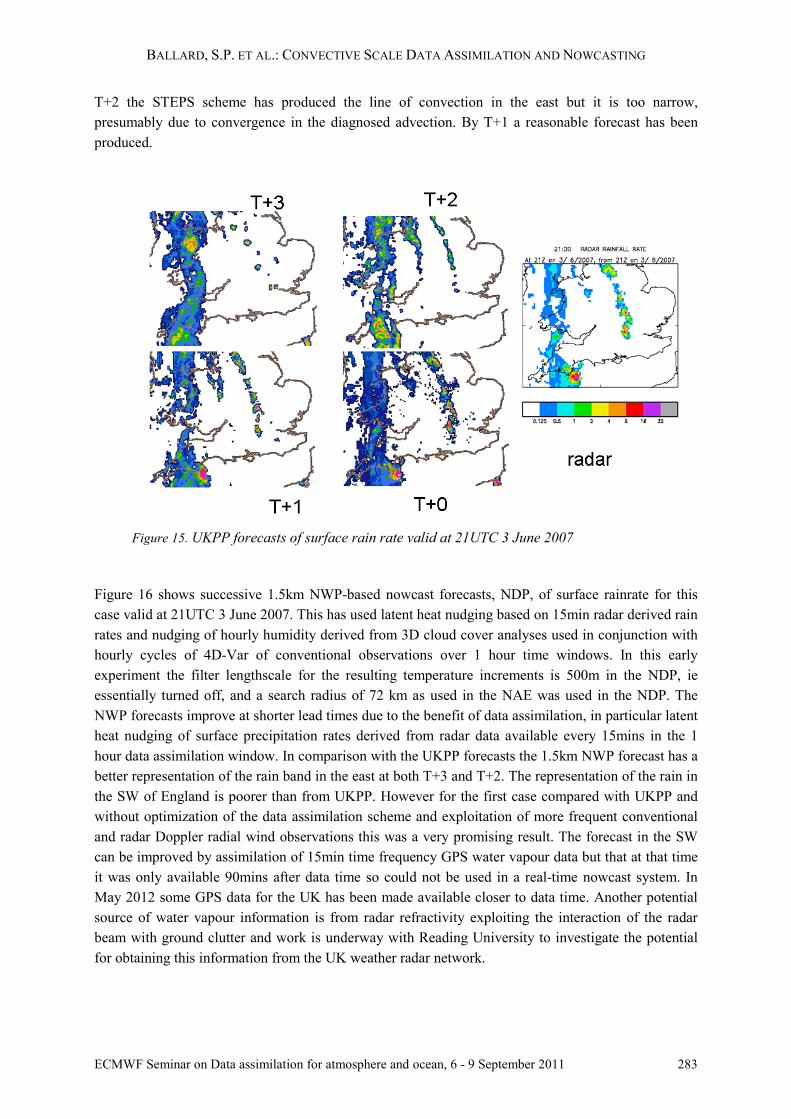
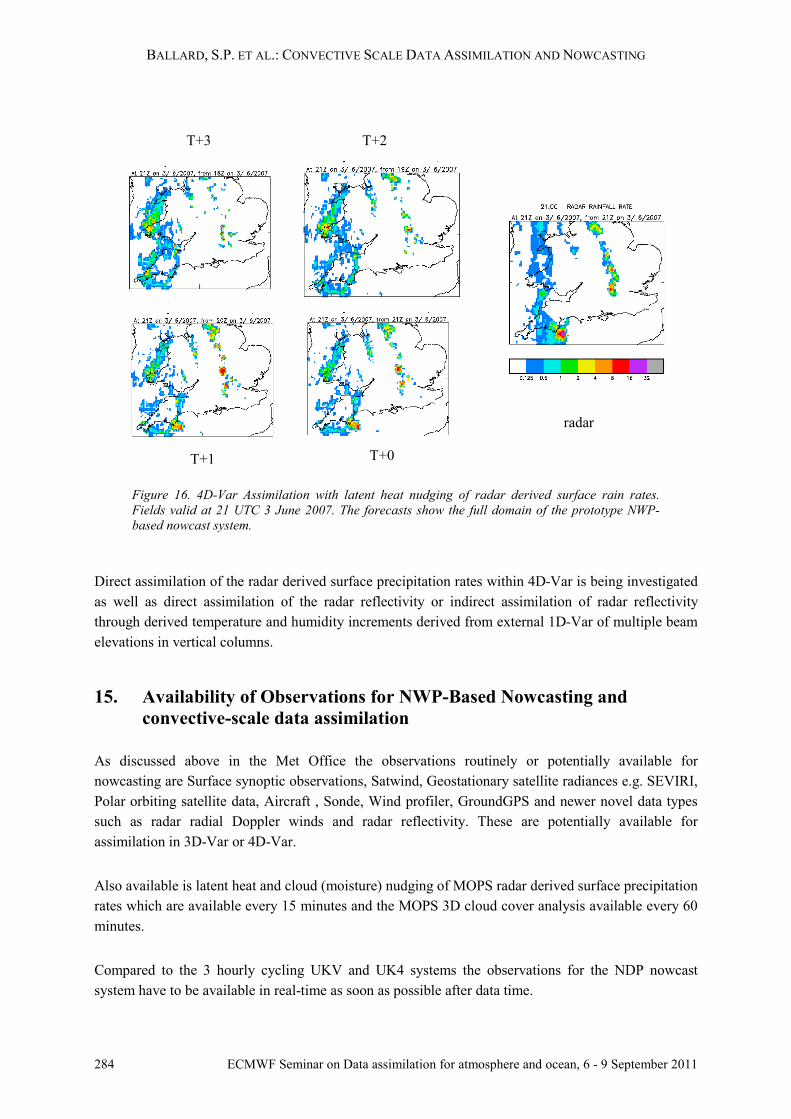
Figure 16 shows successive 1.5km NWP-based nowcast forecasts, NDP, of surface rainrate for this case valid at 21UTC 3 June 2007. This has used latent heat nudging based on 15min radar derived rain rates and nudging of hourly humidity derived from 3D cloud cover analyses used in conjunction with hourly cycles of 4D-Var of conventional observations over 1 hour time windows. In this early experiment the filter lengthscale for the resulting temperature increments is 500m in the NDP, ie essentially turned off, and a search radius of 72 km as used in the NAE was used in the NDP. The NWP forecasts improve at shorter lead times due to the benefit of data assimilation, in particular latent heat nudging of surface precipitation rates derived from radar data available every 15mins in the 1 hour data assimilation window. In comparison with the UKPP forecasts the 1.5km NWP forecast has a better representation of the rain band in the east at both T+3 and T+2. The representation of the rain in the SW of England is poorer than from UKPP. However for the first case compared with UKPP and without optimization of the data assimilation scheme and exploitation of more frequent conventional and radar Doppler radial wind observations this was a very promising result. The forecast in the SW can be improved by assimilation of 15min time frequency GPS water vapour data but that at that time it was only available 90mins after data time so could not be used in a real-time nowcast system. In May 2012 some GPS data for the UK has been made available closer to data time. Another potential source of water vapour information is from radar refractivity exploiting the interaction of the radar beam with ground clutter and work is underway with Reading University to investigate the potential for obtaining this information from the UK weather radar network.
BALLARD, S.P. ET AL.: CONVECTIVE SCALE DATA ASSIMILATION AND NOWCASTING
284 ECMWF Seminar on Data assimilation for atmosphere and ocean, 6 - 9 September 2011
Figure 16. 4D-Var Assimilation with latent heat nudging of radar derived surface rain rates. Fields valid at 21 UTC 3 June 2007. The forecasts show the full domain of the prototype NWP-based nowcast system.
Direct assimilation of the radar derived surface precipitation rates within 4D-Var is being investigated as well as direct assimilation of the radar reflectivity or indirect assimilation of radar reflectivity through derived temperature and humidity increments derived from external 1D-Var of multiple beam elevations in vertical columns.
15. Availability of Observations for NWP-Based Nowcasting and convective-scale data assimilation
As discussed above in the Met Office the observations routinely or potentially available for nowcasting are Surface synoptic observations, Satwind, Geostationary satellite radiances e.g. SEVIRI, Polar orbiting satellite data, Aircraft , Sonde, Wind profiler, GroundGPS and newer novel data types such as radar radial Doppler winds and radar reflectivity. These are potentially available for assimilation in 3D-Var or 4D-Var.
Also available is latent heat and cloud (moisture) nudging of MOPS radar derived surface precipitation rates which are available every 15 minutes and the MOPS 3D cloud cover analysis available every 60 minutes.
Compared to the 3 hourly cycling UKV and UK4 systems the observations for the NDP nowcast system have to be available in real-time as soon as possible after data time.
radar
T+1 T+0
T+3 T+2
BALLARD, S.P. ET AL.: CONVECTIVE SCALE DATA ASSIMILATION AND NOWCASTING
ECMWF Seminar on Data assimilation for atmosphere and ocean, 6 - 9 September 2011 285
16. Radar Radial Doppler Winds
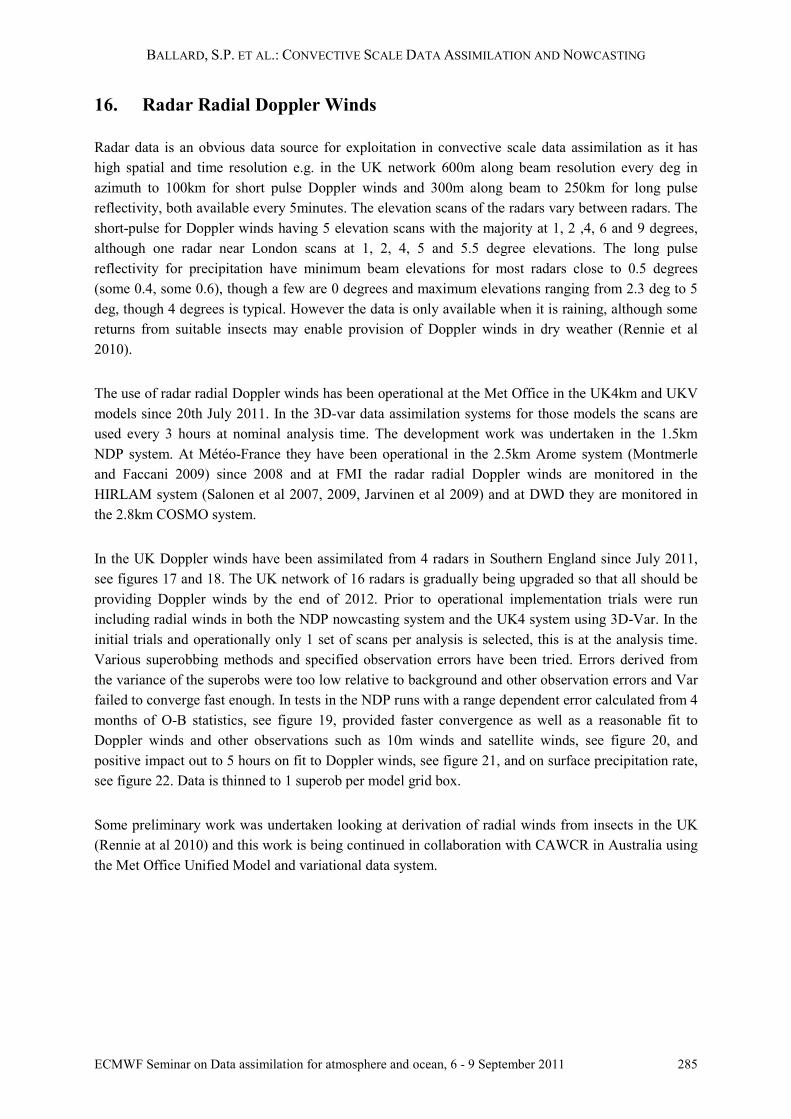
Radar data is an obvious data source for exploitation in convective scale data assimilation as it has high spatial and time resolution e.g. in the UK network 600m along beam resolution every deg in azimuth to 100km for short pulse Doppler winds and 300m along beam to 250km for long pulse reflectivity, both available every 5minutes. The elevation scans of the radars vary between radars. The short-pulse for Doppler winds having 5 elevation scans with the majority at 1, 2 ,4, 6 and 9 degrees, although one radar near London scans at 1, 2, 4, 5 and 5.5 degree elevations. The long pulse reflectivity for precipitation have minimum beam elevations for most radars close to 0.5 degrees (some 0.4, some 0.6), though a few are 0 degrees and maximum elevations ranging from 2.3 deg to 5 deg, though 4 degrees is typical. However the data is only available when it is raining, although some returns from suitable insects may enable provision of Doppler winds in dry weather (Rennie et al 2010).
The use of radar radial Doppler winds has been operational at the Met Office in the UK4km and UKV models since 20th July 2011. In the 3D-var data assimilation systems for those models the scans are used every 3 hours at nominal analysis time. The development work was undertaken in the 1.5km NDP system. At Météo-France they have been operational in the 2.5km Arome system (Montmerle and Faccani 2009) since 2008 and at FMI the radar radial Doppler winds are monitored in the HIRLAM system (Salonen et al 2007, 2009, Jarvinen et al 2009) and at DWD they are monitored in the 2.8km COSMO system.
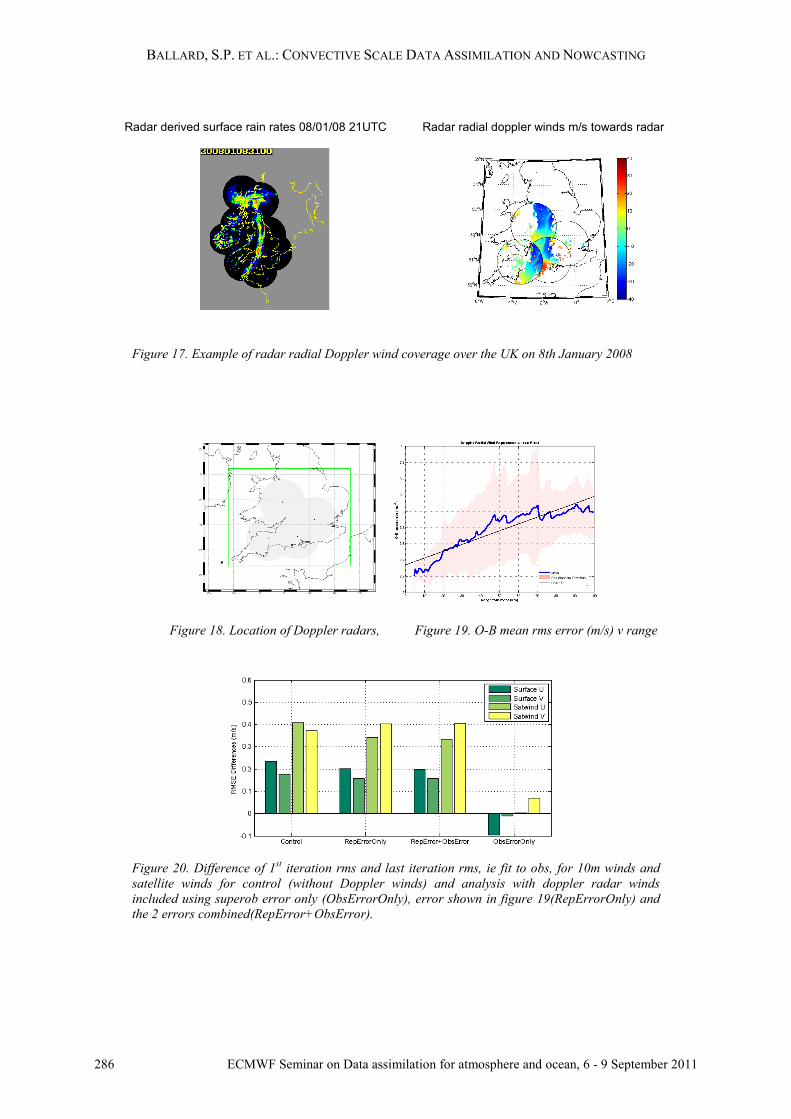
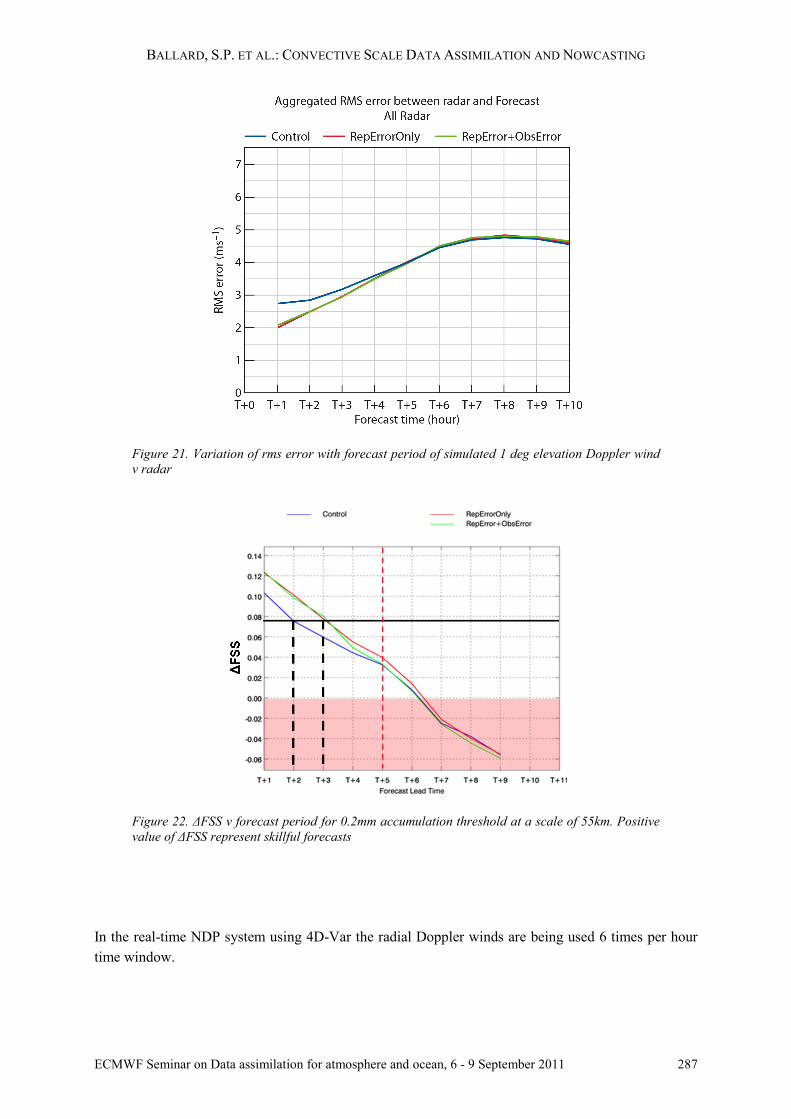
In the UK Doppler winds have been assimilated from 4 radars in Southern England since July 2011, see figures 17 and 18. The UK network of 16 radars is gradually being upgraded so that all should be providing Doppler winds by the end of 2012. Prior to operational implementation trials were run including radial winds in both the NDP nowcasting system and the UK4 system using 3D-Var. In the initial trials and operationally only 1 set of scans per analysis is selected, this is at the analysis time. Various superobbing methods and specified observation errors have been tried. Errors derived from the variance of the superobs were too low relative to background and other observation errors and Var failed to converge fast enough. In tests in the NDP runs with a range dependent error calculated from 4 months of O-B statistics, see figure 19, provided faster convergence as well as a reasonable fit to Doppler winds and other observations such as 10m winds and satellite winds, see figure 20, and positive impact out to 5 hours on fit to Doppler winds, see figure 21, and on surface precipitation rate, see figure 22. Data is thinned to 1 superob per model grid box.
Some preliminary work was undertaken looking at derivation of radial winds from insects in the UK (Rennie at al 2010) and this work is being continued in collaboration with CAWCR in Australia using the Met Office Unified Model and variational data system.
BALLARD, S.P. ET AL.: CONVECTIVE SCALE DATA ASSIMILATION AND NOWCASTING
286 ECMWF Seminar on Data assimilation for atmosphere and ocean, 6 - 9 September 2011
Figure 17. Example of radar radial Doppler wind coverage over the UK on 8th January 2008
Figure 18. Location of Doppler radars, Figure 19. O-B mean rms error (m/s) v range
Figure 20. Difference of 1st iteration rms and last iteration rms, ie fit to obs, for 10m winds and satellite winds for control (without Doppler winds) and analysis with doppler radar winds included using superob error only (ObsErrorOnly), error shown in figure 19(RepErrorOnly) and the 2 errors combined(RepError+ObsError).
Radar derived surface rain rates 08/01/08 21UTC Radar radial doppler winds m/s towards radar
BALLARD, S.P. ET AL.: CONVECTIVE SCALE DATA ASSIMILATION AND NOWCASTING
ECMWF Seminar on Data assimilation for atmosphere and ocean, 6 - 9 September 2011 287
Figure 21. Variation of rms error with forecast period of simulated 1 deg elevation Doppler wind v radar
Figure 22. ΔFSS v forecast period for 0.2mm accumulation threshold at a scale of 55km. Positive value of ΔFSS represent skillful forecasts
In the real-time NDP system using 4D-Var the radial Doppler winds are being used 6 times per hour time window.
BALLARD, S.P. ET AL.: CONVECTIVE SCALE DATA ASSIMILATION AND NOWCASTING
288 ECMWF Seminar on Data assimilation for atmosphere and ocean, 6 - 9 September 2011
17. Other Radar data
Surface rainfall rate composites derived from radar reflectivity data have been used for a number of years in high resolution data assimilation system via Latent Heat Nudging.
Latent heat nudging (LHN) was initially used at larger scales (order 10km) (and in hydrostatic models) with success (Jones and Macpherson 1997; Macpherson et al 1996; Krishnamurti et al 1991) and has recently been applied to the convective scale and non-hydrostatic models (Leuenberger 2005;Leuenberger and Rossa 2007;Stephan et al 2008; Dixon et al 2009).
The methods involve an adjustment of model latent heat release according to the ratio of observed-to-model surface precipitation rate.
The Met Office has been assimilating radar derived instantaneous surface rain rates via latent heat nudging since 1996 (Jones and Macpherson 1997) . This was initially using 3hourly radar derived rain rates at 15km resolution (derived from 5km source data) over the UK and near continent within the 3hourly continuous assimilation analysis correction scheme (Lorenc et al 1991) for the then 17km resolution UK version of the original hydrostatic Unified Model (Cullen and Davies 1991). As discussed in earlier sections latent heat nudging is still used in addition to 4D-Var for the 12km NAE model and the real-time NDP system and in addition to 3D-Var in the UK4 and UKV systems and a test version of the NDP. CAWCR in Australia are testing LHN with the Met Office system using their local radar derived rain rate composites. In the Met Office NDP system 15min time frequency rain rates are used and hourly cloud cover analysis for the MOPS moisture nudging.
LHN is also used in the COSMO nudging DA system at Meteo Swiss (Leuenberger 2005, Leuenberger and Rossa, 2007) and DWD(Stephan et al 2008) and Arpa in Italy (Poli et al 2008).
The Met Office has also developed a system for direct assimilation of surface rainfall rate composites in 4D-Var but that has not been implemented operationally. It will be extended to allow assimilation of surface rainfall accumulations for the European reanalysis project EURO4M. In Japan, JMA (Japan Meteorological Agency) runs a Mesoscale Model (MSM) for Japan and until 2011 they assimilated in 4D-Var rain rate using a radar/raingauge-analyzed precipitation field (Tsuyuki et al 2002)
Work is underway at the Met Office to develop and test direct assimilation of radar reflectivity data in 4D-Var and also an indirect method using 1D-Var to provide temperature and humidity information at the locations of radar reflectivity for potential use in 3D-Var or 4D-Var. KMA are looking at assimilation using an extension of the technique used in WRF.
Meteo-France’s 2.5 km, 3-hourly cycling 3D-Var scheme covering France AROME-France includes assimilation of humidity profiles derived from radar reflectivity (Caumont et al., 2010). JMA started using a version of this method in June 2011 (Ikuta and Honda 2011).
BALLARD, S.P. ET AL.: CONVECTIVE SCALE DATA ASSIMILATION AND NOWCASTING
ECMWF Seminar on Data assimilation for atmosphere and ocean, 6 - 9 September 2011 289
Reading University have been working with the Met Office to derive and investigate low level refractivity information from clutter returns(currently hourly changes) and future work may investigate direct use of the phase shift information. The availability of dual polarization data from 2011 will allow better classification of insect returns, microphysical phase and improved quality control.
18. Geostationary Satellite Imagery
Geostationary Satellite Imagery data from the SEVIRI instrument is potentially available every 5 or 15mins.
At the Met Office work is underway to assimilate clear and cloudy IR radiances in the UKV and nowcasting systems. Hourly clear upper tropospheric water vapour channels are already being assimilated along with near surface channels, the latter over sea only. Use of clear radiances over land is being investigated and but has shown a diurnal variation in skin temperature bias in the UM which has made it hard to use. Currently data is used once per analysis time in the UKV, UK4 (3hourly) and NDP(hourly) systems but experiments in the NDP are starting to use the data every 15mins in 4D-Var for the real-time suite. Problems were found in the operational models with drying out of the mid troposphere over low cloud due to the interaction of MOPS cloud and GPS IWC data – if the GPS data showed that the model was too moist MOPS constrained the humidity in the boundary layer so the only place the humidity could be reduced was above cloud top, whereas in fact the excess moisture was due to erroneous cloud top heights. This problem has been reduced by including assimilation of SEVIRI channel 5 data over low cloud. Météo-France already assimilates this data over low cloud in AROME.
The Met Office is also investigating the optimum horizontal thinning for satellite imagery data in the convective scale data assimilation systems.
Assimilation of AMSU-B polar orbiting data is also being tested to supplement use of the SEVIRI upper tropospheric water vapour channels in the high resolution systems.
19. Cloud Observations
Along with the LHN the Met Office has for many years used moisture nudging to assimilate information from a 3D cloud cover analysis derived from satellite imagery and surface cloud cover and base observations (MOPS).
Work at Exeter has led to the direct assimilation of the MOPS cloud cover data in VAR (Renshaw and Francis 2011) and investigations of the direct assimilation of satellite derived cloud cover and cloud top pressure. This is now operational in the NAE, UKV and UK4 systems. Initial work with the NDP system used the moisture nudging but the real-time suite is now using the cloud in VAR method.
BALLARD, S.P. ET AL.: CONVECTIVE SCALE DATA ASSIMILATION AND NOWCASTING
290 ECMWF Seminar on Data assimilation for atmosphere and ocean, 6 - 9 September 2011
Work is also underway at Exeter to investigate direct assimilation of surface cloud observations. The ceilometer data that is processed to provide the surface cloud observations could also potentially be assimilated directly similar to the cloudy radiances and work is being undertaken at Reading to derive an observation operator and to investigate the quality of the data compared to model background fields and the potential for direct assimilation.
In the UKV and UK4 systems 3hourly cloud cover analysis data is used and in the NDP hourly data. The satellite information is potentially available every 5-15mins and the surface observations every minute.
20. Satellite Winds, AMVs
Satellite derived Atmospheric Motion Vectors (AMV) have given positive benefit to operational large-scale NWP forecasts for many years. Their use in Nowcasting systems has been limited due to the relative large tracking box size (20x20 pixels) used by operational AMV produces. The use of the NWCSAF AMV package enables local AMV production to use smaller tracking boxes which make the AMVs represent smaller scales and more suitable for Nowcasting systems. The delay in the reception of the AMV product is also important for Nowcasting. Local AMVs can be produced five minutes after the satellite image reception whereas the operational product may takes 30 minutes. The NWCSAF system has been setup at the Met Office to cover the UKV area and produces AMVs every 15 minutes. Work is currently underway to add the data to the Met Office observational database archive(METDB). A set of experiments is underway using the UK4 3DVAR system and the data is also being set up for use in the NDP system.
21. Wind Profiler
Data is available from 6 wind profilers in the UK as 15min and 30min averages. All the operational wind profilers have 2 modes of operations - Low mode and high mode. The uhf ( Camborne, Dunkeswell, Wattisham , Isle of Man ) starting at around 250 m for the low mode with 75 m resolution until 1800m and starting at 450 m for the high mode with 205m resolution until 7800m. The vhf at South Uist has a low mode starting at 1119m at 147m resolution until 5088m and high mode starting at 3462m at 430m resolution until 15924m. A test profiler at Chilbolton was sending only a low mode from ~200m until 5000m with 70 m resolution with a 30minute average time. Originally only 15min and 30min low and high mode for South Uist, 15min and 30min high mode for Wattisham, Camborne and Dunkeswell and 30min low mode and 15min high mode from Isle of Man. Therefore more vertical resolution data is available than was being assimilated. Recently the low mode data has been made available for all the profilers and is now assimilated operationally by using the low mode where available and then the high mode for higher levels. The wind profiler data is treated as if it is radiosonde data which is not optimal use of the data. The wind profiler often has data gaps where the atmosphere is very dry or has poor signal to noise ratio. This is not currently taken into account in the observation processing which interpolates over the data gaps (assuming they are significant levels) so that some extremes in wind and details in the wind profile can be lost. Hourly data is used in the UKV and UK4 system and 15min data in the NDP.
BALLARD, S.P. ET AL.: CONVECTIVE SCALE DATA ASSIMILATION AND NOWCASTING
ECMWF Seminar on Data assimilation for atmosphere and ocean, 6 - 9 September 2011 291
22. GPS, Amdar and Surface data
Humidity information from GPS data is available throughout the UK at 15min frequency but standardly only arrives 90mins after data time so cannot currently be used for nowcasting. However a new fast processing system is available with data being available every 15mins at 0 and 14 mins after data time and this will be tested in the NDP system. The UKV and UK4 use hourly data and the NDP will test 15min data.
Currently the only observation type providing vital temperature profile information, important for definition of boundary layer height and capping inversions is AMDAR. The current network in the UK has recently been enhanced by use of hourly data on EasyJet flights into provincial airports.
Radiosondes are not available very frequently but extra vertical resolution could be obtained using the 2second data. Work at Exeter has just coded processing of the 2second data. The data assimilation system does not currently take account of wind drift of the sondes which becomes important in high resolution analyses. However as there are now very few radiosonde sites and soundings are only a few times a day this is not a major source of observations for the nowcasting and convective scale data assimilation systems.
1min surface data is available but not yet in the MetDB or assessed for assimilation. 10m wind is available as 10min averages. The benefit in 1.5km 4D-Var needs to be assessed and whether instantaneous or average data is beneficial. Fluctuations in the observations dependent on static stability may yield valuable representativeness information. Use of standard synoptic station observations is being supplemented by use of observations made by other government agencies e.g. for road surface temperature forecasting.
23. Impact of Different Observation Types
23.1. 18th May 2011 case study
On the 18th May 2011 a front with 2 precipitation bands aligned SW/NE moved in south-easterly direction across the UK. The intensity in the bands varied throughout the day with initially the forward band more intense and then the rearward band more intense.
BALLARD, S.P. ET AL.: CONVECTIVE SCALE DATA ASSIMILATION AND NOWCASTING
292 ECMWF Seminar on Data assimilation for atmosphere and ocean, 6 - 9 September 2011
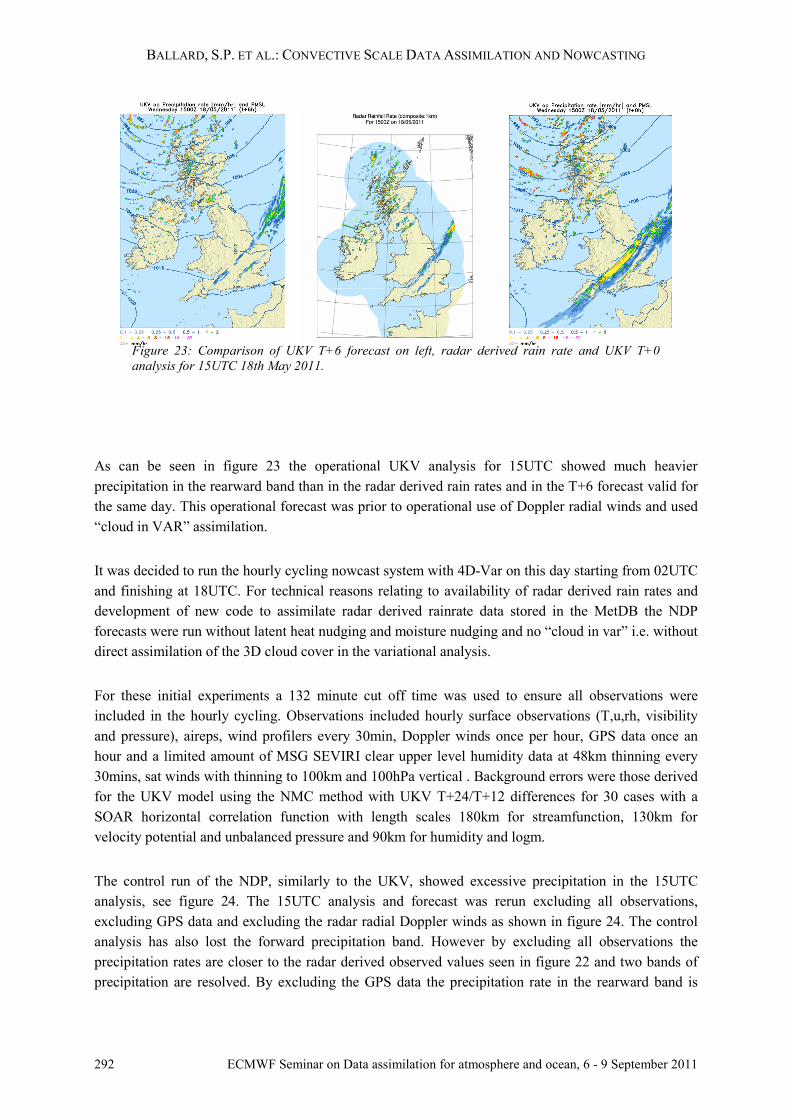
Figure 23: Comparison of UKV T+6 forecast on left, radar derived rain rate and UKV T+0 analysis for 15UTC 18th May 2011.
As can be seen in figure 23 the operational UKV analysis for 15UTC showed much heavier precipitation in the rearward band than in the radar derived rain rates and in the T+6 forecast valid for the same day. This operational forecast was prior to operational use of Doppler radial winds and used “cloud in VAR” assimilation.
It was decided to run the hourly cycling nowcast system with 4D-Var on this day starting from 02UTC and finishing at 18UTC. For technical reasons relating to availability of radar derived rain rates and development of new code to assimilate radar derived rainrate data stored in the MetDB the NDP forecasts were run without latent heat nudging and moisture nudging and no “cloud in var” i.e. without direct assimilation of the 3D cloud cover in the variational analysis.
For these initial experiments a 132 minute cut off time was used to ensure all observations were included in the hourly cycling. Observations included hourly surface observations (T,u,rh, visibility and pressure), aireps, wind profilers every 30min, Doppler winds once per hour, GPS data once an hour and a limited amount of MSG SEVIRI clear upper level humidity data at 48km thinning every 30mins, sat winds with thinning to 100km and 100hPa vertical . Background errors were those derived for the UKV model using the NMC method with UKV T+24/T+12 differences for 30 cases with a SOAR horizontal correlation function with length scales 180km for streamfunction, 130km for velocity potential and unbalanced pressure and 90km for humidity and logm.
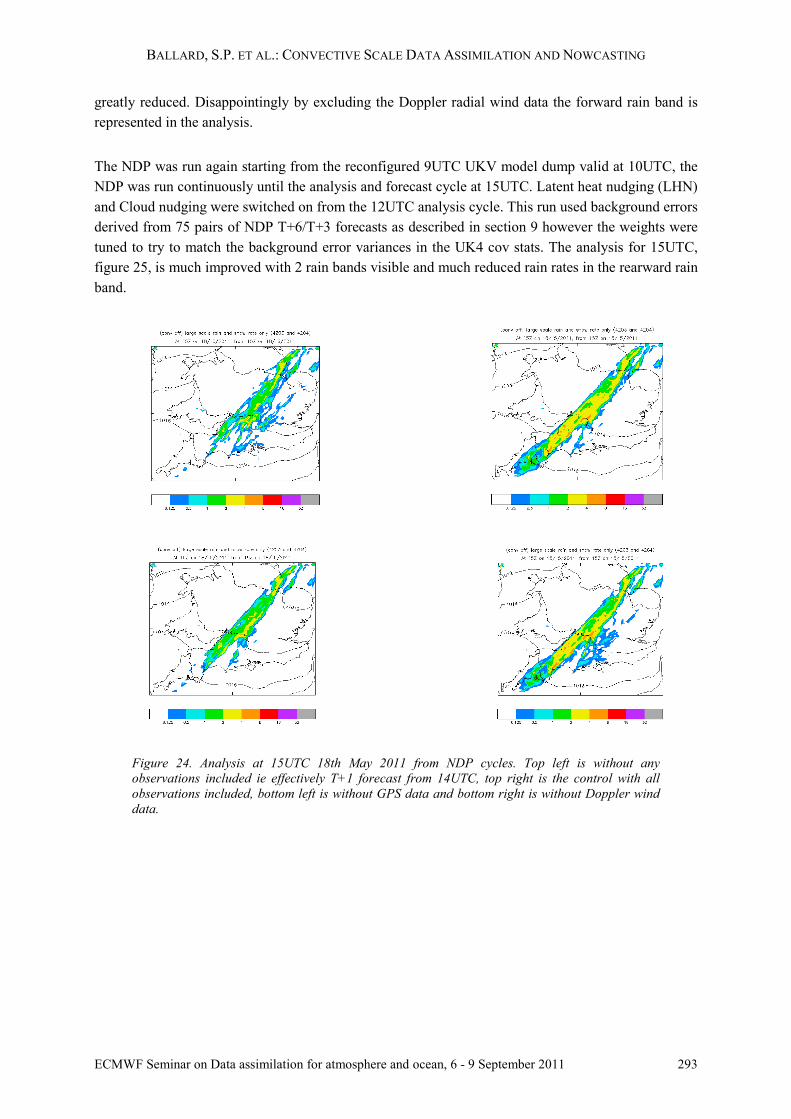
The control run of the NDP, similarly to the UKV, showed excessive precipitation in the 15UTC analysis, see figure 24. The 15UTC analysis and forecast was rerun excluding all observations, excluding GPS data and excluding the radar radial Doppler winds as shown in figure 24. The control analysis has also lost the forward precipitation band. However by excluding all observations the precipitation rates are closer to the radar derived observed values seen in figure 22 and two bands of precipitation are resolved. By excluding the GPS data the precipitation rate in the rearward band is
BALLARD, S.P. ET AL.: CONVECTIVE SCALE DATA ASSIMILATION AND NOWCASTING
ECMWF Seminar on Data assimilation for atmosphere and ocean, 6 - 9 September 2011 293
greatly reduced. Disappointingly by excluding the Doppler radial wind data the forward rain band is represented in the analysis.
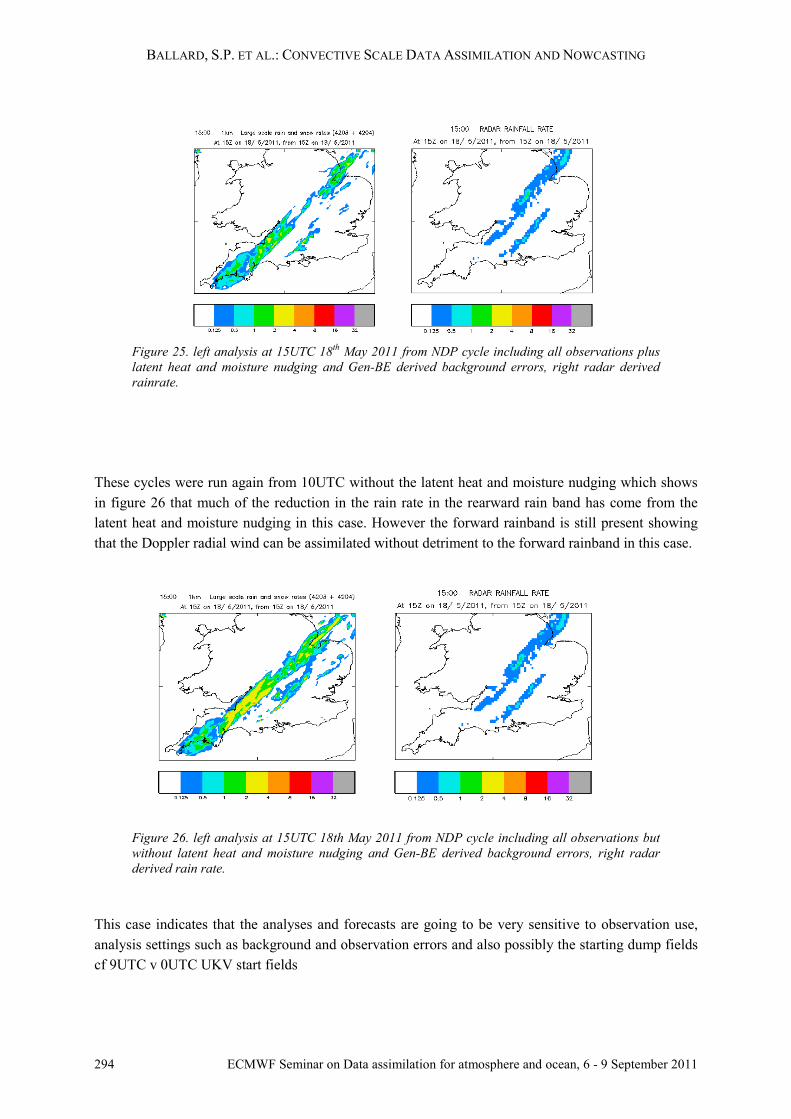
The NDP was run again starting from the reconfigured 9UTC UKV model dump valid at 10UTC, the NDP was run continuously until the analysis and forecast cycle at 15UTC. Latent heat nudging (LHN) and Cloud nudging were switched on from the 12UTC analysis cycle. This run used background errors derived from 75 pairs of NDP T+6/T+3 forecasts as described in section 9 however the weights were tuned to try to match the background error variances in the UK4 cov stats. The analysis for 15UTC, figure 25, is much improved with 2 rain bands visible and much reduced rain rates in the rearward rain band.
Figure 24. Analysis at 15UTC 18th May 2011 from NDP cycles. Top left is without any observations included ie effectively T+1 forecast from 14UTC, top right is the control with all observations included, bottom left is without GPS data and bottom right is without Doppler wind data.
BALLARD, S.P. ET AL.: CONVECTIVE SCALE DATA ASSIMILATION AND NOWCASTING
294 ECMWF Seminar on Data assimilation for atmosphere and ocean, 6 - 9 September 2011
Figure 25. left analysis at 15UTC 18th May 2011 from NDP cycle including all observations plus latent heat and moisture nudging and Gen-BE derived background errors, right radar derived rainrate.
These cycles were run again from 10UTC without the latent heat and moisture nudging which shows in figure 26 that much of the reduction in the rain rate in the rearward rain band has come from the latent heat and moisture nudging in this case. However the forward rainband is still present showing that the Doppler radial wind can be assimilated without detriment to the forward rainband in this case.
Figure 26. left analysis at 15UTC 18th May 2011 from NDP cycle including all observations but without latent heat and moisture nudging and Gen-BE derived background errors, right radar derived rain rate.
This case indicates that the analyses and forecasts are going to be very sensitive to observation use, analysis settings such as background and observation errors and also possibly the starting dump fields cf 9UTC v 0UTC UKV start fields
BALLARD, S.P. ET AL.: CONVECTIVE SCALE DATA ASSIMILATION AND NOWCASTING
ECMWF Seminar on Data assimilation for atmosphere and ocean, 6 - 9 September 2011 295
24. Scientific challenges for NWP-based Nowcasting
There are many scientific challenges in producing a system that sufficiently matches the observations at analysis time and the first few hours of the forecast to give forecasters and customers confidence in the analysis and forecast.
For such short range forecasts it is vital that the observations are inserted in a balanced manner and spin-up/spin-down must be minimized. This can be done through specification of balance constraint and control variables. We have discussed some of the issues above but work is still required to ensure that the impact of cloud and precipitation observations last throughout the forecast.
Although cloud and precipitation data has been used operationally for many years we are trying to optimize the use of the data and to extract as much vertical information as possible and to exploit the synergy of other data by using it within a variational framework. Biases exist in precipitation rates and areal coverage and the solution will lie in both improvements of data assimilation and the forecast model and land and surface constraints such as use of coupled DA.
Improvements in the nowcasts don’t just depend on the analysis techniques and observation availability but also the model formulation. Although the model at 1.5km is explicitly representing convection that does not mean it is fully realistic as many convective and turbulent processes and plumes are still unresolved and need to be parametrized. There is a still a tendency for isolated cells of convection on the grid scale rather than smoother continuous fields of precipitation and this is an area of ongoing research.
There is a lot of data currently available that we still need to exploit within data assimilation - both new observations or more frequent observations or in more direct forms. For some we basically know how to try to use the information but expect further improvements by improved specification of background errors to make the most of high spatial resolution or to improve vertical spread of information. Some work has been done in this area in (Piccolo and Cullen 2011, 2012) to modify vertical spread of data based on the stratification of the atmosphere.
Work at Exeter and Reading is ongoing to improve the background error specification using lagged or ETKF ensembles and to try to ensure consistency between synoptic scale analyses and boundary conditions and high resolution limited area analysis increments and perturbations.
Instrument providers tell us they can provide information on boundary layer height but as yet we do not know how to assimilate that directly – vertical profiles providing temperature inversions, horizontal wind shear or moisture discontinuities can be assimilated and if used well will define the dry and cloudy boundary layer structure in the model through the physical parametrization schemes or dynamics but we don’t know how to change prognostic model fields based on information on boundary layer height alone. It could possibly be used to tell us how to spread or limit the spread of observation-model differences in the vertical but this is an area requiring research. Some work related to this was reported in Fowler et al 2012.
BALLARD, S.P. ET AL.: CONVECTIVE SCALE DATA ASSIMILATION AND NOWCASTING
296 ECMWF Seminar on Data assimilation for atmosphere and ocean, 6 - 9 September 2011
We don’t yet know which data is going to be most beneficial or whether new observation types are required. We do know that we need to ensure timely stable, reliable, well calibrated data streams with good quality control that are easy to access and with a good archive to enable case studies and trials before operational use. There is much still to be done to exploit current and future data. At present computer resources limit us to 3D-Var for the full UK domain and 4D-Var can only be used for small domains at high resolution.
Due to the tight time constraints on forecasts it may be necessary to move away from use of a time window centered on the analysis time to one finishing at the analysis time. There are many sources of information on different variables (e.g. GPS, radar refractivity, satellite imagery and surface observations for low level humidity) and the usefulness of the different data sources will be investigated to provide an optimum system.
25. Conclusions
This paper has discussed the progress in skill of short-range forecasts of surface weather over the UK in the last decade and has reviewed the different types of data assimilation methods used and some of the issues that need to be dealt with in limited area and high-resolution data assimilation. It has also reviewed the different sources of observations that can be potentially used in convective scale and high frequency cycling data assimilation. We found that much in operational centres was geared around hourly synoptic observations and many changes had to be made to allow use of sub-hourly data and to ensure data was available in real-time.
We also showed that operational convective scale NWP is beating advection type precipitation nowcasts from about T+2.5hours and described the progress being made with a real-time hourly NWP-based nowcast system.
Progress is being made in moving to direct use of radar from research to operations. However many challenges still to extract the full benefit from the radar data and other observations. We are only just getting access to observations to test their real benefit in NWP-based nowcasting and convective scale data assimilation.
The use of radar and other observational data in NWP high resolution data assimilation has the potential to improve on current extrapolation based nowcasts. To achieve this we need high quality observations and good quality control, fast processing (techniques and computer power), careful specification of observation and forecast background error covariances and correlations through the scientific design of the data assimilation system and a good representation of the dynamical and microphysical processes in the NWP forecast model. In future it is hoped to exploit ensemble techniques in both the data assimilation and production of forecasts.
BALLARD, S.P. ET AL.: CONVECTIVE SCALE DATA ASSIMILATION AND NOWCASTING
ECMWF Seminar on Data assimilation for atmosphere and ocean, 6 - 9 September 2011 297
References
Bannister R. N.; Migliorini S.; Dixon M. A. G. 2011, Ensemble prediction for nowcasting with a convection-permitting model - II: forecast error statistics, Tellus, 63A, 497-512.
Barker, D. M., W. Huang, Y.-R. Guo, and Q. N. Xiao, 2004: A Three-Dimensional (3DVAR) Data Assimilation System For Use With MM5: Implementation and Initial Results. Mon. Wea. Rev., 132, 897-914.
Barker, D., X.-Y Huang, Z. Liu, T. Auligné, X. Zhang, S. Rugg, R. Ajjaji, A. Bourgeois, J. Bray, Y. Chen, M. Demitras, Y.-R. Guo, T. Henderson, W. Huang, H.-C. Lin, J. Michalakes, S. Rizvi, X. Zhang, 2012: The Weather Research and Forecasting (WRF) Models Community Variational/Ensemble Data Assimilation System: WRFDA. Bull. Amer. Meteor. Soc., In press.
Bauer P., Auligne T., Bell W., Geer,A., Guidard,V., Heilliette,S., Kazumori, M., Kim, M-J., Liu, E., , McNally, A., Macpherson, B., Okamoto, K., Renshaw,R., and Riishøjgaard, L-P., 2011, Satellite cloud and precipitation assimilation at operational NWP centres, Q.J. Royal Meteor. Soc., 137, SI 661, 1934-1951
Bloom, S.C., Takaks, L.L., Da Silva, A.M. and Ledvina, D. 1996 , Data assimilation using incremental analysis updates. Mon. Wea. Rev., 124, 1256-12
Bowler, N.E., Pierce,C.E. & Seed, A.W. (2006): STEPS: A probabilistic precipitation forecasting scheme which merges an extrapolation nowcast with downscaled NWP, Quart. J. Roy. Met. Soc., 132, 2127-2155
Brousseau, P., and Coauthors, 2008: A prototype convective-scale data assimilation system for operation: The AROME-RUC. HIRLAM Tech. Rep. 68, 23–30.
Brousseau, P., Berre, L., Bouttier, F. & Desroziers G. (2011) : Background-error covariances for a convective-scale data-assimilation system : AROME-France 3D-Var. Quart. J. Roy. Meteor. Soc. 137 409-422
Caumont, O., Ducrocq, V., Wattrelot, E., Jaubert, G. & Pradie-vabre, S. (2010). 1D+3DVar assimilation of radar reflectivity data: a proof of concept, Tellus A, 62, 173-187
Davies, T., Cullen, M. J. P., Malcolm, A. J.,Mawson, M. H.,Staniforth, A., White, A. A. & Wood, N. (2005): A new dynamical core for the Met Office's global and regional modelling of the atmosphere. Quart. J. Roy. Met. Soc., 131, 1759-1782.
Derber J & Bouttier F (1999): A reformulation of the background error covariance in the ECMWF global data assimilation system. Tellus A, 51, 195-221
BALLARD, S.P. ET AL.: CONVECTIVE SCALE DATA ASSIMILATION AND NOWCASTING
298 ECMWF Seminar on Data assimilation for atmosphere and ocean, 6 - 9 September 2011
Dixon M, Li Z, Lean H, Roberts N, & Ballard S.P. (2009): Impact of data assimilation on forecasting convection over the United Kingdom using a high-resolution version of the Met Office Unified Model, Monthly Weather Rev., 137,, 1562–1584
Fowler A., Bannister R., Eyre J., 2012, A new floating model level scheme for the assimilation of boundary-layer top inversions: the univariate assimilation of temperature, Quart. J. Roy. Met. Soc, 138, 682-698.
Gustafsson, N, Kallen, E. and Thorsteinsson, S. 1998 Sensitivity of forecast errors to initial and lateral boundary conditions, Tellus, 50A, 167-185.
Gustafsson, N., Berre, L., Hornquist, S., Huang, X.-Y., Lindskog, M., Navascues, B., Mogensen, K.S. and Thorsteinsson, S. 2001. Three-dimensional variational data assimilation for a limited area model. Part I: General formulation and the background error constraint. Tellus, 53A, 425-446.
Gustafsson, N. 2012 Control of lateral boundary conditions in four-dimensional variational data assimilation for a limited area model, Tellus, 64A, 17518, DOI: 10.3402/tellusa.v64i0.17518
Hollingsworth A., Lonnberg P., 1986, The statistical structure of short-range forecast errors as determined from radiosonde data. 1. The wind-field, Tellus A, 38, 111-136
Honda, Y., Nishijima, M., Koizumi, K., Ohta, Y., Tamiya, K., Kawabata, T. & Tsuyuki, T. (2005). A pre-operational variational data assimilation system for a non-hydrostatic model at the Japan Meteorological Agency: Formulation and preliminary results, Quart. J. Roy. Met. Soc., 131, 3465-3475
Huang, X., Xiao Y.Q., Barker D.M., X. Zhang X., Michalakes J., Huang W., Henderson T., Bray J., Chen Y., Ma Z., Dudhia J., Guo Y.R., Zhang X., Won D.J., Lin H.C., and Kuo Y.H., 2009: Four-Dimensional Variational Data Assimilation for WRF: Formulation and Preliminary Results. Mon. Wea. Rev., 137, 299-314.
Ikuta, Y, and Y. Honda, 2011: Development of 1D+4DVAR data assimilation of radar reflectivity in JNoVA. CAS/JSC WGNE Res. Activ. Atmos. Oceanic. Model., 41, 9-10.
Jarvinen H., Salonen K., Lindskog M., Huuskonen A., Niemela S., Eresmaa R., 2009, Doppler radar radial winds in HIRLAM. Part I: observation modelling and validation, Tellus A, 61, 278-287
Jones, C. D. & Macpherson, B. (1997): A latent heat nudging scheme for the assimilation of precipitation data into an operational mesoscale model. Meteorol. Appl. , 4, 269-277
Krishnamurti, T. N., Xue, J., Bedi, H. S., Ingles, K. and Oosterhof, D. 1991 Physical initialization for numerical weather prediction over the Tropics. Tellus , 43A-B, 53-81
BALLARD, S.P. ET AL.: CONVECTIVE SCALE DATA ASSIMILATION AND NOWCASTING
ECMWF Seminar on Data assimilation for atmosphere and ocean, 6 - 9 September 2011 299
Leuenberger D.,2005: High-resolution Radar Rainfall Assimilation: Exploratory Studies with Latent Heat Nudging, Dissertation Nr. 15884, ETH Zuerich. Available from http://e-collection.ethbib.ethz.ch/cgi-bin/show.pl?type=diss&nr=15884
Leuenberger, D. and A. Rossa, 2007: Revisiting the latent heat nudging scheme for the rainfall assimilation of a simulated convective storm, Meteorology and Atmospheric Physics, 98, 195-215 (DOI 10.1007/s00703-007-0260-9)
Lorenc, A.C. 1997 Development of an operational variational assimilation scheme, J. Meteorol Soc Japan, 75, 339-346
Lorenc, A. C., Ballard,S.P, Bell,R.S., Ingleby,N.B., Andrews, P.L.F., Barker,D.M., Bray, J.R., Clayton,A.M., Dalby, T., Li,D., Payne T.J., & Saunders,F.W. (2000): The Met. Office global 3-Dimensional variational data assimilation scheme. Quart. J. Roy. Met. Soc., 126, 2991-3012.
Macpherson B., Wright B.J., Hand W.H. & Maycock A.J. (1996): The impact of MOPS moisture data in the U.K. Meteorological Office mesoscale data assimilation scheme. Monthly Weather Rev., 124(8), 1746-1766
Montmerle T, Faccani C. 2009. Mesoscale assimilation of radial velocities from Doppler radar in a pre-operational framework. Mon. Weather Rev. 137, 1937–1953.
Parrish DF & Derber JC (1992): The National Meteorological Centre’s spectral statistical interpolation analysis system. Monthly Weather Rev, 120, 1747-1763
Parrish DF, Derber JC, Purser R, Wu WS & Pu ZX (1997): The NCEP global analysis system: recent improvements and future plans. J. Met Soc Japan, 75, 359-365
Piccolo,C. and Cullen,M. 2011: "Adaptive mesh method in the Met Office variational data assimilation system", Quart. J. Roy. Met. Soc, 137, 631-640.
Piccolo,C. and Cullen,M. 2012: "A new implementation of the Adaptive Mesh Transform in the Met Office 3D-Var System", accepted in Quart. J. Roy. Met. Soc..
Poli V., Alberoni P. P., Cesari D., 2008, Intercomparison of two nowcasting methods: preliminary analysis, Meteorology and Atmospheric Physics , 101, 229-244.
Rawlins, F.R., Ballard,S.P., Bovis, K.R.. Clayton,A.M., Li, DingMin, Inverarity,G.W., Lorenc, A.C. & Payne,T.J. (2007): The Met Office global 4-Dimensional data assimilation system. Quart. J. Roy. Met. Soc. 133, 347-362.
Rennie, S.J., Dance,S.L., Illingworth,A.J., Ballard,S.P & Simonin,D. (2010): 3D-Var assimilation of insect-derived Doppler radar radial winds in convective cases using a high resolution model, Monthly Weather Rev. ,139, 1148-1163
BALLARD, S.P. ET AL.: CONVECTIVE SCALE DATA ASSIMILATION AND NOWCASTING
300 ECMWF Seminar on Data assimilation for atmosphere and ocean, 6 - 9 September 2011
Renshaw R., Francis P. N. 2011 Variational assimilation of cloud fraction in the operational Met Office Unified Model. Quart. J. Roy. Met. Soc, 137, 1963-1974.
Roberts, N. M. & Lean, H. W. ( 2008) Scale-selective verification of rainfall accumulations from high-resolution forecasts of convective events, Monthly Weather Rev., 136, 78-97
Saito, K., Fujita, T., Yamada, Y., Ishida, J., Kumagai, Y., Aranami, K., Ohmori, S., Nagasawa, R., Kumagai, S., Muroi, C., Kato, T., Eito, H. & Yamazaki, Y. (2006). The operational JMA nonhydrostatic mesoscale model, Monthly Weather Review, 134, 1266-1298
Salonen, K, H. Järvinen, R. Eresmaa, S. Niemelä 2007, Bias estimation of Doppler-radar radial-wind observations, Quart. J. Roy. Met. Soc, 133, Part B, 1501-1507
Salonen ,K., Jarvinen H, Haase G, Niemela R, Eresmaa R., 2009, Doppler radar radial winds in HIRLAM. Part II: optimizing the super-observation processing, Tellus A , 61, 288-295
Seity Y, Brousseau P, Malardel S, Hello G, Benard P, Boutiier F, Lac C, Mason V (2011): The AROME-France convective scale operational model. Monthly Weather Rev, 139, 976-991
Stephan K., S. Klink, and C. Schraff, (2008): Assimilation of radar derived rain rates into the convective scale model COSMO-DE at DWD. Quart. J. Roy. .Met. .Soc. 134, 1315-1326
Sun, J. (2005). Convective-scale assimilation of radar data: progress and challenges, Quart. J. Roy. Met. Soc, 31, 3439-3463
Sun, J., Chen, M. & Wang, Y. (2010). A frequent-updating analysis system based on radar, surface, and mesoscale model data for the Beijing 2008 Forecast Demonstration Project, Weather and Forecasting, 25, 1715-1735
Tsuyuki, T., K. Koizumi, and Y. Ishikawa, 2002: The JMA mesoscale 4D-Var system and assimilation of precipitation and moisture data. Proc. ECMWF Workshop on Humidity Analysis, Reading, United Kingdom, ECMWF, 59–67.
Vetra-Carvalho, S, Dixon,M., Migliorini,S., Nichols,N.K. and Ballard, S.P., 2012, Breakdown of hydrostatic balance at convective scales in the forecast errors in the Met Office Unified Model, Quart J Roy Met Soc, in press
Xiao, Q., Lim, E., Won, D., Sun, J., Lee, W., Lee, M., Lee, W., Cho, J., Kuo, Y., Barker, D. M., Lee, D., Lee, H. S., 2008: A successful collaboration between research institutions and operational center: Realization of doppler radar data assimilation with WRF 3D-VAR in KMA operational forecasting. Bulletin of the American Meteorological Society, 89, 39-43.