Embed Size (px)
Citation preview
2 9 T H R C I I N T E R N A T I O N A L C O N V E N T I O N A N D T R A D E S H O W • M A R C H 2 0 - 2 5 , 2 0 1 4 F I N C H E T A L . • 1
Conventional Roofing Assemblies: Measuringthe Thermal Benefits of Light to Dark Roof
Membranes and Alternate Insulation Strategies
Graham Finch, PEng.;Marcus Dell, PEng.; Brittany Hanam, PEng, BEMP;
and Lorne RickettsRDH Building Engineering Ltd.
224 West 8th Ave., Vancouver, BC V5Y 1N5 CanadaPhone: 604-873-1181 • Fax: 604-873-0933 • E-mail: [email protected]
Abstract
This is the latest publication concerning a large, multiyear conventional roofing study being performed by the authors. This paper builds off of the 2013 RCI Building Envelope Technology Symposium (Minneapolis 2013) publication, “Monitored Field Performance of Conventional Roofing Assemblies – Measuring the Benefits of Insulation Strategy” and applies the newer findings from this study to the wider North American audience. The 2013 publication focused on the differences in insulation performance, whereas this 2014 publication looks at both insulation and roof membrane color and utilizes calibrated energy modeling to look at the impact in different climate zones.
Speaker
Graham Finch – RDH Building Engineering Ltd.
GRAhAM FINCh is a principal and research engineer with RDh Building Engineering Ltd. in Vancouver, BC. he has a passion for technology and for making better buildings. he leads RDh’s building science research group and is actively involved in a wide range of projects from building research studies to forensic investigations, building monitoring, hygrothermal modeling, and new construction. Finch has helped develop numerous indus-try guideline documents related to durable building enclosures and roofing and energy use in buildings. In addition, he is a part-time instructor at the British Columbia Institute of Technology, where he teaches building science courses at the undergraduate and masters’ levels.
2 • F I N C H E T A L . 2 9 T H R C I I N T E R N A T I O N A L C O N V E N T I O N A N D T R A D E S H O W • M A R C H 2 0 - 2 5 , 2 0 1 4
ABSTRACTA field monitoring study was implement-
ed to measure the impacts and benefits of membrane color (white, gray, and black) and insulation strategy on the performance of conventional roofing assemblies. The same roof membrane cap sheet type with three dif-ferent surface granule colors was placed over three different conventional insulation strate-gies, creating a total of nine unique roofing assemblies (each 16 squares, 1,600 sq. ft. [150 m2] in size) on the same building. The thicknesses of the different insulation prod-ucts were varied to achieve approximately the same R-value for each of the nine roof assem-blies. Sensors were installed to measure tem-perature, relative humidity, moisture content, and heat flux at various points within each of the roof assemblies. Displacement sen-sors were also installed within the insulation boards to measure the dimensional stability of the different insulation products, and solar radiation sensors were installed above the cap sheet to document the long-term reflec-tivity and soiling of the roofing membranes. In conjunction with the sensors, webcam photos were captured to study the impact of night sky cooling, wetting/frost, and other differences among the assemblies. To comple-ment the field study, supplemental labora-tory testing of the insulation products was performed to measure the installed insulation R-values, and whole-building energy simula-tions were performed to apply the calibrated results from the study to other building types and climate zones across North America.
Presented in this paper are findings from the study that highlight the impact of both roof membrane color and insulation strategy on the thermal behavior and energy gains/losses through conventional roofing assemblies. Whole-building energy model-ing is used to synthesize the study find-ings and demonstrate how whole-building heating and cooling energy consumption is affected by different roof membrane col-ors and insulation types/strategies within North American climate zones.
BACkGRounDExposed membrane roofs (i.e., roofs with
exposed roofing membrane on top of the roof insulation and structure—also called conventional roofs) make up the majority of low-slope roofing assemblies in North America. Membrane colors from dark to light are chosen based on product availabil-ity, aesthetics, building type/use, energy efficiency, and standard practices, which vary from southern to northern latitudes. Lighter, more-reflective membrane colors or finishes (high solar reflectivity index [SRI]) are common in the southern U.S. where required by energy code (AShRAE 90.1); though with Leadership in Energy and Environmental Design® (LEED®) projects and some other energy-rating programs, light- or white-colored roofs are often used regardless of geography. In northern cli-mates, the benefit of using white mem-brane roofs to achieve cooling savings is often small and can be offset by higher wintertime heating loads (DOE Cool Roof Calculator, 2013; Roof Savings Calculator, 2013; Smith, 2001).
The thermal insulation used within new conventional roofing assemblies typically consists of rigid polyisocyanurate (varying from <R-5 to R-6/inch), expanded polysty-rene (EPS, R-4 to R-4.5/inch), or rigid stone wool1 (R-3.7 to R-4.3/inch). (The R-value of insulation products varies depending on age, density, moisture content, etc.; and some variation can even exist among batches of the same product.) Wood fiber-board, rigid fiberglass, extruded polystyrene (XPS), and spray polyurethane foam insula-tions are also used in some applications, but these additional insulation types are less common in new conventional roofs. It is also common to use a combination of insulation layers within conventional roofs, thus blending the positive attributes of each insulation type in “hybrid systems.”
An example of a hybrid system would be using polyisocyanurate over tapered EPS or the use of rigid stone wool over polyisocy-
anurate as investigated in this research. In this hybrid system, the stone wool is used on top of the polyisocyanurate, as it is gen-erally more dimensionally stable than poly-isocyanurate (diurnal movement and long-term shrinkage), which reduces exposed membrane stresses and keeps the lower polyisocyanurate insulation layer within a tighter temperature range, closer to the interior temperature (depending on the ratio of outboard insulation to polyisocyanurate insulation). This also results in conditions that optimize the apparent R-value of the polyisocyanurate insulation as covered later within this paper.
The research study investigates the thermal differences and net heat flux through conventional roof assemblies utiliz-ing light- to dark-colored (low to high solar absorptivity) roof membranes in conjunc-tion with different insulation material com-binations, including polyisocyanurate and stone wool. It then extends these findings using whole-building energy modeling to demonstrate how building energy consump-tion is affected by these roof characteristics.
FIELD MonIToRInG PRoGRAM AnD STuDy BuILDInG
A large-scale field monitoring study was implemented in the Lower Mainland of British Columbia with the intent of measuring the impacts and benefits of roof membrane color and insulation strategy on the long-term thermal and hygrothermal behavior and performance of conventional roofing assemblies.
The roofing variables consist of three dif-ferent 2-ply SBS membrane cap sheet colors placed over three different conventional insu-lation strategies (polyisocyanurate, stone wool, and a hybrid combination of both), creating a total of nine unique roofing assem-blies (each 16 squares, 1,600 sq. ft. [150 m2] in size) on the same building. The thick-nesses of the insulation combinations were varied to achieve approximately the same total effective R-value in each assembly.
Conventional Roofing Assemblies: Measuringthe Thermal Benefits of Light to Dark Roof
Membranes and Alternate Insulation Strategies
2 9 T H R C I I N T E R N A T I O N A L C O N V E N T I O N A N D T R A D E S H O W • M A R C H 2 0 - 2 5 , 2 0 1 4 F I N C H E T A L . • 3
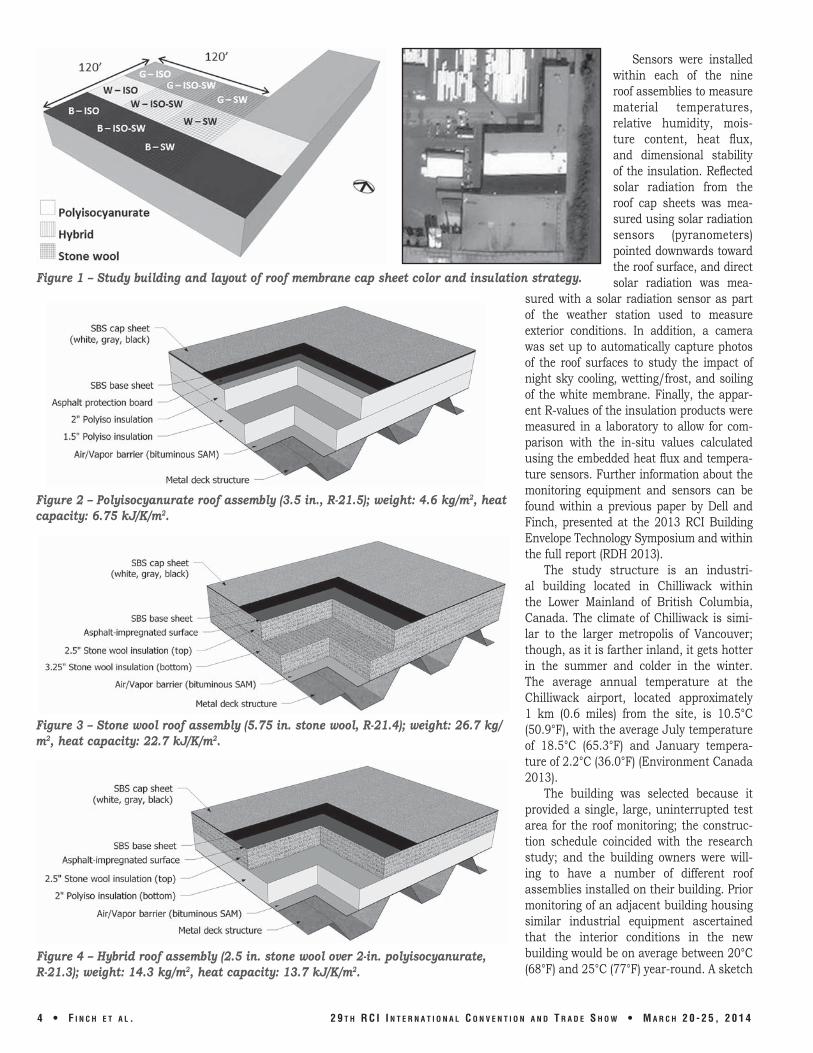
Sensors were installed within each of the nine roof assemblies to measure material temperatures, relative humidity, mois-ture content, heat flux, and dimensional stability of the insulation. Reflected solar radiation from the roof cap sheets was mea-sured using solar radiation sensors (pyranometers) pointed downwards toward the roof surface, and direct solar radiation was mea-
sured with a solar radiation sensor as part of the weather station used to measure exterior conditions. In addition, a camera was set up to automatically capture photos of the roof surfaces to study the impact of night sky cooling, wetting/frost, and soiling of the white membrane. Finally, the appar-ent R-values of the insulation products were measured in a laboratory to allow for com-parison with the in-situ values calculated using the embedded heat flux and tempera-ture sensors. Further information about the monitoring equipment and sensors can be found within a previous paper by Dell and Finch, presented at the 2013 RCI Building Envelope Technology Symposium and within the full report (RDh 2013).
The study structure is an industri-al building located in Chilliwack within the Lower Mainland of British Columbia, Canada. The climate of Chilliwack is simi-lar to the larger metropolis of Vancouver; though, as it is farther inland, it gets hotter in the summer and colder in the winter. The average annual temperature at the Chilliwack airport, located approximately 1 km (0.6 miles) from the site, is 10.5°C (50.9°F), with the average July temperature of 18.5°C (65.3°F) and January tempera-ture of 2.2°C (36.0°F) (Environment Canada 2013).
The building was selected because it provided a single, large, uninterrupted test area for the roof monitoring; the construc-tion schedule coincided with the research study; and the building owners were will-ing to have a number of different roof assemblies installed on their building. Prior monitoring of an adjacent building housing similar industrial equipment ascertained that the interior conditions in the new building would be on average between 20°C (68°F) and 25°C (77°F) year-round. A sketch
4 • F I N C H E T A L . 2 9 T H R C I I N T E R N A T I O N A L C O N V E N T I O N A N D T R A D E S H O W • M A R C H 2 0 - 2 5 , 2 0 1 4
Figure 1 – Study building and layout of roof membrane cap sheet color and insulation strategy.
Figure 2 – Polyisocyanurate roof assembly (3.5 in., R-21.5); weight: 4.6 kg/m2, heat capacity: 6.75 kJ/K/m2.
Figure 4 – Hybrid roof assembly (2.5 in. stone wool over 2-in. polyisocyanurate, R-21.3); weight: 14.3 kg/m2, heat capacity: 13.7 kJ/K/m2.
Figure 3 – Stone wool roof assembly (5.75 in. stone wool, R-21.4); weight: 26.7 kg/m2, heat capacity: 22.7 kJ/K/m2.
of the building showing the three different mem-brane colors and three insulation combinations, as discussed in the following section, is presented in Figure 1.
As shown, a total of nine unique roof as-semblies, each 40 x 40 ft. in area (16 squares, 1,600 sq. ft. [150 m2]) were constructed and monitored at the west part of the building. The adja-cent section of the roof along the east side is insulated with stone wool but is not moni-tored or included within the study.
RooF ASSEMBLIES AnDInSuLATIon R-vALuES
Each roof assembly consists of a 2-ply, torch-on SBS cap (white, gray, or black) and base sheet over asphalt protection board (only over polyisocyanurate), insulation lay-ers (as indicated), reinforced air/vapor bar-rier membrane, and metal Q-deck over open-web steel joists. The air/vapor barrier membrane spans between the metal deck flutes and has been designed and tested by the manufacturer to do so without sagging in this application. The use of a continuous rigid gypsum board over the deck flutes with standard self-adhered membrane is generally more common in this application.
The asphalt protection board (where used) and insulation layers are structurally adhered together and to the air/vapor barri-er membrane using a low-rise, two-part ure-thane adhesive, negating the need for mechanical fasteners in the assembly and associated perfora-tions in the air barrier membrane. The top surface of the stone wool insulation contains an integral asphalt-impregnated surface and does not require an additional overlay protection board.
The three SBS cap sheet colors include standard black, gray, and white (LEED®-compliant SRI cap). The thickness of each insulation combination was varied to achieve approximately the same design R-value of R-21.5 (at standard test conditions of 23.9°C [75°F]).
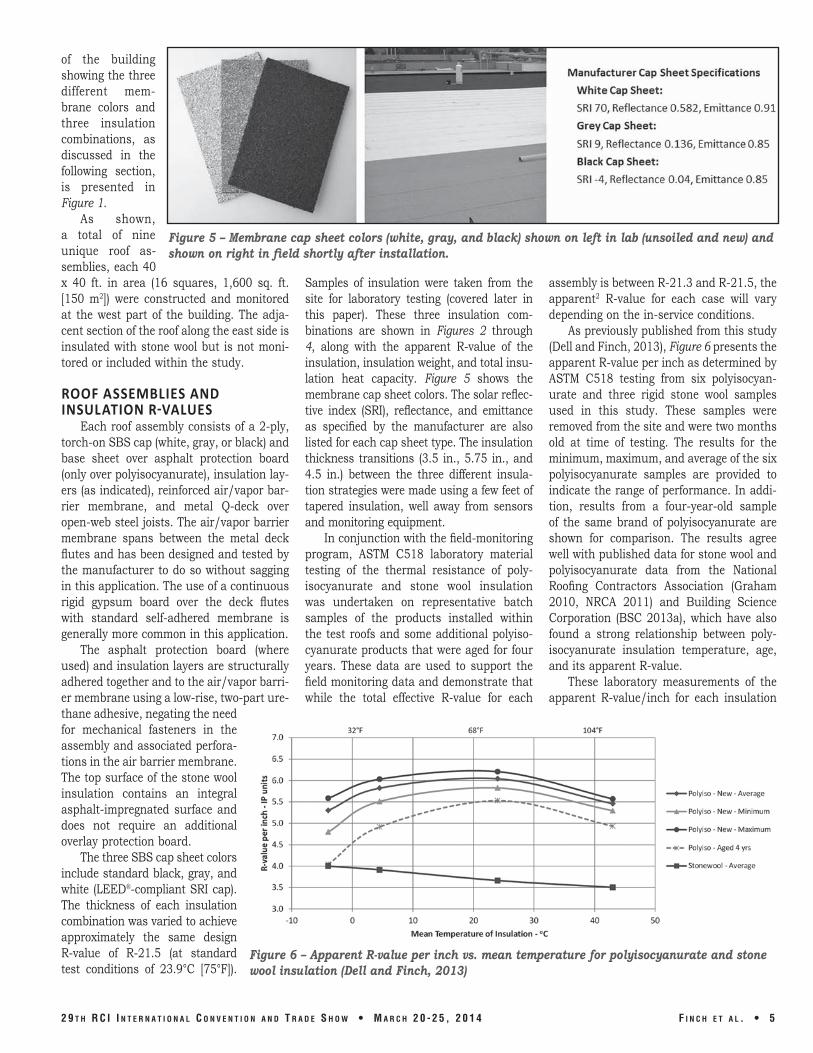
Samples of insulation were taken from the site for laboratory testing (covered later in this paper). These three insulation com-binations are shown in Figures 2 through 4, along with the apparent R-value of the insulation, insulation weight, and total insu-lation heat capacity. Figure 5 shows the membrane cap sheet colors. The solar reflec-tive index (SRI), reflectance, and emittance as specified by the manufacturer are also listed for each cap sheet type. The insulation thickness transitions (3.5 in., 5.75 in., and 4.5 in.) between the three different insula-tion strategies were made using a few feet of tapered insulation, well away from sensors and monitoring equipment.
In conjunction with the field-monitoring program, ASTM C518 laboratory material testing of the thermal resistance of poly-isocyanurate and stone wool insulation was undertaken on representative batch samples of the products installed within the test roofs and some additional polyiso-cyanurate products that were aged for four years. These data are used to support the field monitoring data and demonstrate that while the total effective R-value for each
assembly is between R-21.3 and R-21.5, the apparent2 R-value for each case will vary depending on the in-service conditions.
As previously published from this study (Dell and Finch, 2013), Figure 6 presents the apparent R-value per inch as determined by ASTM C518 testing from six polyisocyan-urate and three rigid stone wool samples used in this study. These samples were removed from the site and were two months old at time of testing. The results for the minimum, maximum, and average of the six polyisocyanurate samples are provided to indicate the range of performance. In addi-tion, results from a four-year-old sample of the same brand of polyisocyanurate are shown for comparison. The results agree well with published data for stone wool and polyisocyanurate data from the National Roofing Contractors Association (Graham 2010, NRCA 2011) and Building Science Corporation (BSC 2013a), which have also found a strong relationship between poly-isocyanurate insulation temperature, age, and its apparent R-value.
These laboratory measurements of the apparent R-value/inch for each insulation
2 9 T H R C I I N T E R N A T I O N A L C O N V E N T I O N A N D T R A D E S H O W • M A R C H 2 0 - 2 5 , 2 0 1 4 F I N C H E T A L . • 5
Figure 5 – Membrane cap sheet colors (white, gray, and black) shown on left in lab (unsoiled and new) and shown on right in field shortly after installation.
Figure 6 – Apparent R-value per inch vs. mean temperature for polyisocyanurate and stone wool insulation (Dell and Finch, 2013)
product were then applied to the three roof-ing assemblies from this study to determine the apparent R-value of the roof assemblies:
• Stone wool (5.75 in. [146 mm] stone wool, R-21.4)
• hybrid (2.5 in. (64 mm) stone wool over 2 in. [51 mm] polyisocyanurate, R-21.5)
• Polyisocyanurate (3.5 in. [89 mm] polyisocyanurate, R-21.3)
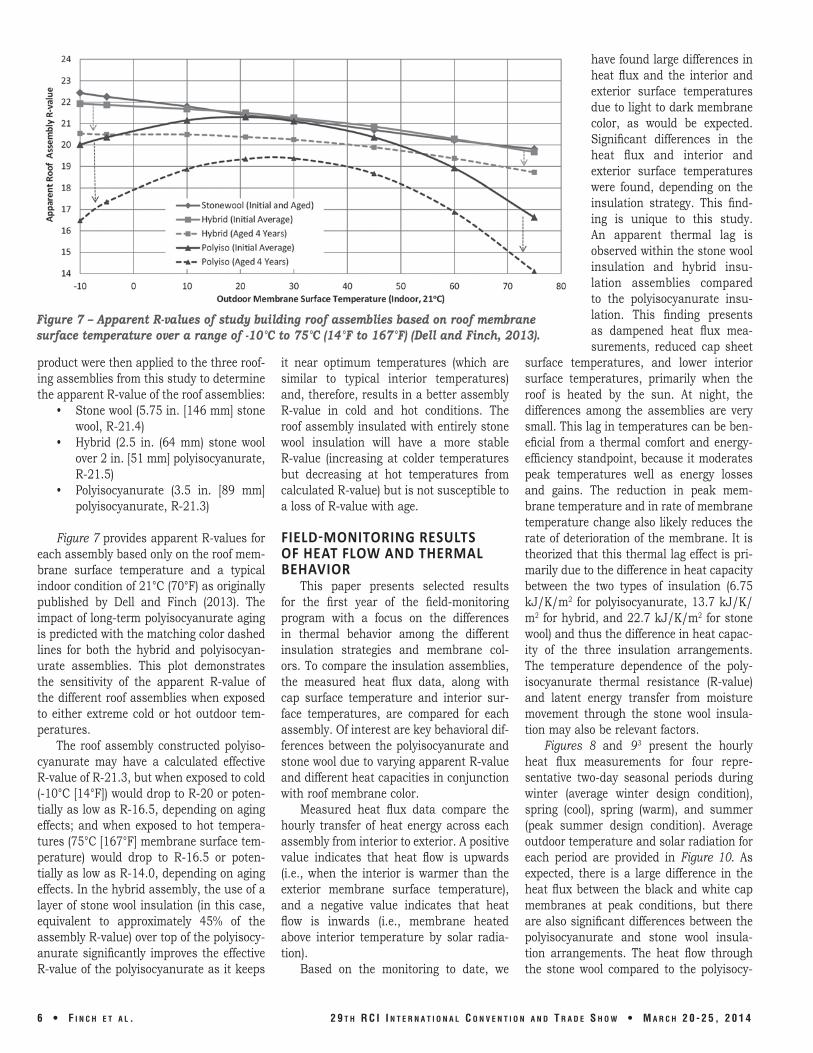
Figure 7 provides apparent R-values for each assembly based only on the roof mem-brane surface temperature and a typical indoor condition of 21°C (70°F) as originally published by Dell and Finch (2013). The impact of long-term polyisocyanurate aging is predicted with the matching color dashed lines for both the hybrid and polyisocyan-urate assemblies. This plot demonstrates the sensitivity of the apparent R-value of the different roof assemblies when exposed to either extreme cold or hot outdoor tem-peratures.
The roof assembly constructed polyiso-cyanurate may have a calculated effective R-value of R-21.3, but when exposed to cold (-10°C [14°F]) would drop to R-20 or poten-tially as low as R-16.5, depending on aging effects; and when exposed to hot tempera-tures (75°C [167°F] membrane surface tem-perature) would drop to R-16.5 or poten-tially as low as R-14.0, depending on aging effects. In the hybrid assembly, the use of a layer of stone wool insulation (in this case, equivalent to approximately 45% of the assembly R-value) over top of the polyisocy-anurate significantly improves the effective R-value of the polyisocyanurate as it keeps
it near optimum temperatures (which are similar to typical interior temperatures) and, therefore, results in a better assembly R-value in cold and hot conditions. The roof assembly insulated with entirely stone wool insulation will have a more stable R-value (increasing at colder temperatures but decreasing at hot temperatures from calculated R-value) but is not susceptible to a loss of R-value with age.
FIELD-MonIToRInG RESuLTSoF HEAT FLow AnD THERMALBEHAvIoR
This paper presents selected results for the first year of the field-monitoring program with a focus on the differences in thermal behavior among the different insulation strategies and membrane col-ors. To compare the insulation assemblies, the measured heat flux data, along with cap surface temperature and interior sur-face temperatures, are compared for each assembly. Of interest are key behavioral dif-ferences between the polyisocyanurate and stone wool due to varying apparent R-value and different heat capacities in conjunction with roof membrane color.
Measured heat flux data compare the hourly transfer of heat energy across each assembly from interior to exterior. A positive value indicates that heat flow is upwards (i.e., when the interior is warmer than the exterior membrane surface temperature), and a negative value indicates that heat flow is inwards (i.e., membrane heated above interior temperature by solar radia-tion).
Based on the monitoring to date, we
have found large differences in heat flux and the interior and exterior surface temperatures due to light to dark membrane color, as would be expected. Significant differences in the heat flux and interior and exterior surface temperatures were found, depending on the insulation strategy. This find-ing is unique to this study. An apparent thermal lag is observed within the stone wool insulation and hybrid insu-lation assemblies compared to the polyisocyanurate insu-lation. This finding presents as dampened heat flux mea-surements, reduced cap sheet
surface temperatures, and lower interior surface temperatures, primarily when the roof is heated by the sun. At night, the differences among the assemblies are very small. This lag in temperatures can be ben-eficial from a thermal comfort and energy-efficiency standpoint, because it moderates peak temperatures well as energy losses and gains. The reduction in peak mem-brane temperature and in rate of membrane temperature change also likely reduces the rate of deterioration of the membrane. It is theorized that this thermal lag effect is pri-marily due to the difference in heat capacity between the two types of insulation (6.75 kJ/K/m2 for polyisocyanurate, 13.7 kJ/K/m2 for hybrid, and 22.7 kJ/K/m2 for stone wool) and thus the difference in heat capac-ity of the three insulation arrangements. The temperature dependence of the poly-isocyanurate thermal resistance (R-value) and latent energy transfer from moisture movement through the stone wool insula-tion may also be relevant factors.
Figures 8 and 93 present the hourly heat flux measurements for four repre-sentative two-day seasonal periods during winter (average winter design condition), spring (cool), spring (warm), and summer (peak summer design condition). Average outdoor temperature and solar radiation for each period are provided in Figure 10. As expected, there is a large difference in the heat flux between the black and white cap membranes at peak conditions, but there are also significant differences between the polyisocyanurate and stone wool insula-tion arrangements. The heat flow through the stone wool compared to the polyisocy-
6 • F I N C H E T A L . 2 9 T H R C I I N T E R N A T I O N A L C O N V E N T I O N A N D T R A D E S H O W • M A R C H 2 0 - 2 5 , 2 0 1 4
Figure 7 – Apparent R-values of study building roof assemblies based on roof membrane surface temperature over a range of -10°C to 75°C (14°F to 167°F) (Dell and Finch, 2013).
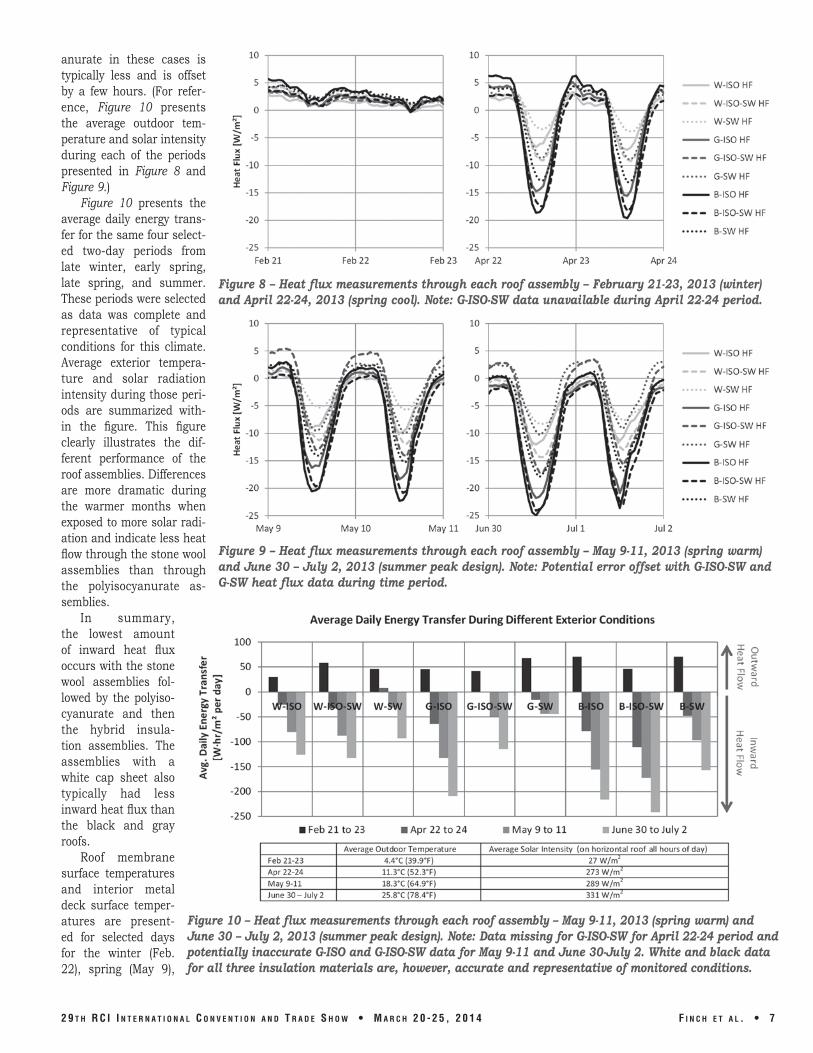
anurate in these cases is typically less and is offset by a few hours. (For refer-ence, Figure 10 presents the average outdoor tem-perature and solar intensity during each of the periods presented in Figure 8 and Figure 9.)
Figure 10 presents the average daily energy trans-fer for the same four select-ed two-day periods from late winter, early spring, late spring, and summer. These periods were selected as data was complete and representative of typical conditions for this climate. Average exterior tempera-ture and solar radiation intensity during those peri-ods are summarized with-in the figure. This figure clearly illustrates the dif-ferent performance of the roof assemblies. Differences are more dramatic during the warmer months when exposed to more solar radi-ation and indicate less heat flow through the stone wool assemblies than through the polyisocyanurate as-semblies.
In summary, the lowest amount of inward heat flux occurs with the stone wool assemblies fol-lowed by the polyiso-cyanurate and then the hybrid insula-tion assemblies. The assemblies with a white cap sheet also typically had less inward heat flux than the black and gray roofs.
Roof membrane surface temperatures and interior metal deck surface temper-atures are present-ed for selected days for the winter (Feb. 22), spring (May 9),
2 9 T H R C I I N T E R N A T I O N A L C O N V E N T I O N A N D T R A D E S H O W • M A R C H 2 0 - 2 5 , 2 0 1 4 F I N C H E T A L . • 7
Figure 8 – Heat flux measurements through each roof assembly – February 21-23, 2013 (winter) and April 22-24, 2013 (spring cool). Note: G-ISO-SW data unavailable during April 22-24 period.
Figure 9 – Heat flux measurements through each roof assembly – May 9-11, 2013 (spring warm) and June 30 – July 2, 2013 (summer peak design). Note: Potential error offset with G-ISO-SW and G-SW heat flux data during time period.
Figure 10 – Heat flux measurements through each roof assembly – May 9-11, 2013 (spring warm) and June 30 – July 2, 2013 (summer peak design). Note: Data missing for G-ISO-SW for April 22-24 period and potentially inaccurate G-ISO and G-ISO-SW data for May 9-11 and June 30-July 2. White and black data for all three insulation materials are, however, accurate and representative of monitored conditions.
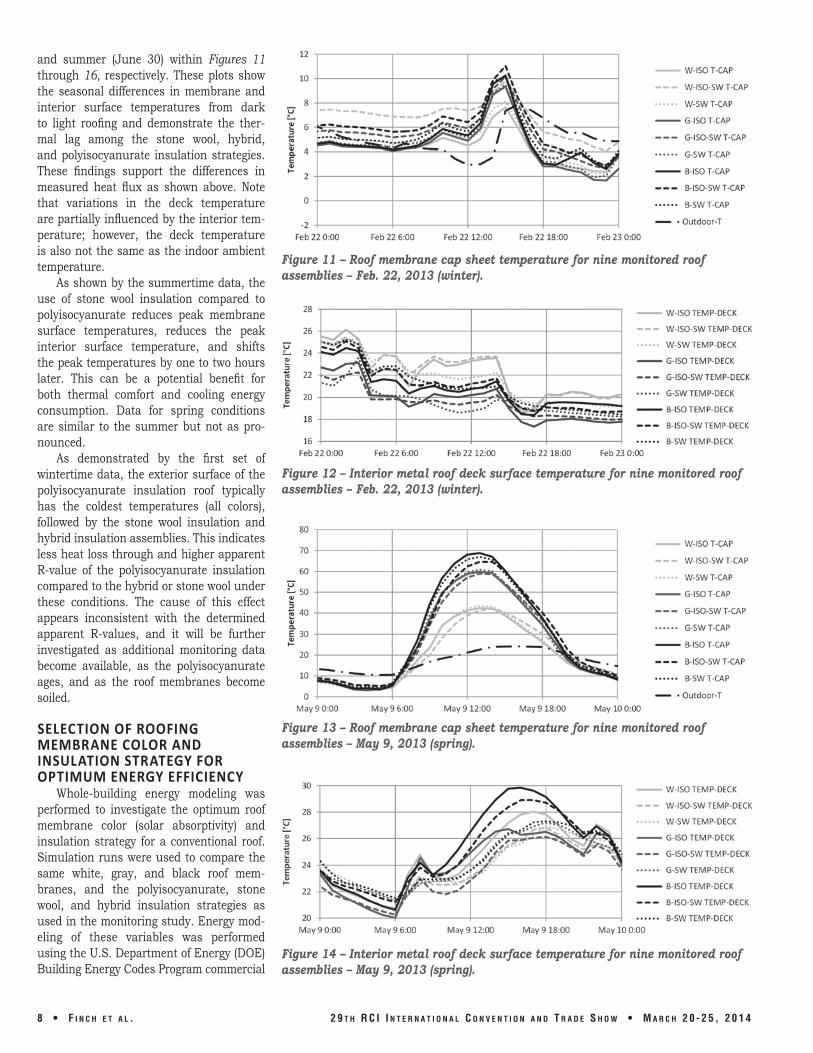
and summer (June 30) within Figures 11through 16, respectively. These plots show the seasonal differences in membrane and interior surface temperatures from dark to light roofing and demonstrate the ther-mal lag among the stone wool, hybrid, and polyisocyanurate insulation strategies. These findings support the differences in measured heat flux as shown above. Note that variations in the deck temperature are partially influenced by the interior tem-perature; however, the deck temperature is also not the same as the indoor ambient temperature.
As shown by the summertime data, the use of stone wool insulation compared to polyisocyanurate reduces peak membrane surface temperatures, reduces the peak interior surface temperature, and shifts the peak temperatures by one to two hours later. This can be a potential benefit for both thermal comfort and cooling energy consumption. Data for spring conditions are similar to the summer but not as pro-nounced.
As demonstrated by the first set of wintertime data, the exterior surface of the polyisocyanurate insulation roof typically has the coldest temperatures (all colors), followed by the stone wool insulation and hybrid insulation assemblies. This indicates less heat loss through and higher apparent R-value of the polyisocyanurate insulation compared to the hybrid or stone wool under these conditions. The cause of this effect appears inconsistent with the determined apparent R-values, and it will be further investigated as additional monitoring data become available, as the polyisocyanurate ages, and as the roof membranes become soiled.
SELECTIon oF RooFInGMEMBRAnE CoLoR AnDInSuLATIon STRATEGy FoRoPTIMuM EnERGy EFFICIEnCy
Whole-building energy modeling was performed to investigate the optimum roof membrane color (solar absorptivity) and insulation strategy for a conventional roof. Simulation runs were used to compare the same white, gray, and black roof mem-branes, and the polyisocyanurate, stone wool, and hybrid insulation strategies as used in the monitoring study. Energy mod-eling of these variables was performed using the U.S. Department of Energy (DOE) Building Energy Codes Program commercial
8 • F I N C H E T A L . 2 9 T H R C I I N T E R N A T I O N A L C O N V E N T I O N A N D T R A D E S H O W • M A R C H 2 0 - 2 5 , 2 0 1 4
Figure 11 – Roof membrane cap sheet temperature for nine monitored roof assemblies – Feb. 22, 2013 (winter).
Figure 12 – Interior metal roof deck surface temperature for nine monitored roof assemblies – Feb. 22, 2013 (winter).
Figure 13 – Roof membrane cap sheet temperature for nine monitored roof assemblies – May 9, 2013 (spring).
Figure 14 – Interior metal roof deck surface temperature for nine monitored roof assemblies – May 9, 2013 (spring).
building prototype model for a stand-alone retail building designed to meet AShRAE 90.1-2010. These files are available online and use the hourly energy modeling pro-gram EnergyPlus (DOE, 2012). Models were run for one representative city in each of the eight AShRAE North American climate zones.
One goal of the energy modeling was to investigate the impact of temperature-dependent insulation R-values on whole-building energy consumption. While the material testing discussed earlier in the paper identified that thermal conductivity variations with temperature are different for polyisocyanurate and stone wool insulation,
this effect is typically not modeled in most whole-building simulation programs but can be modeled in EnergyPlus.
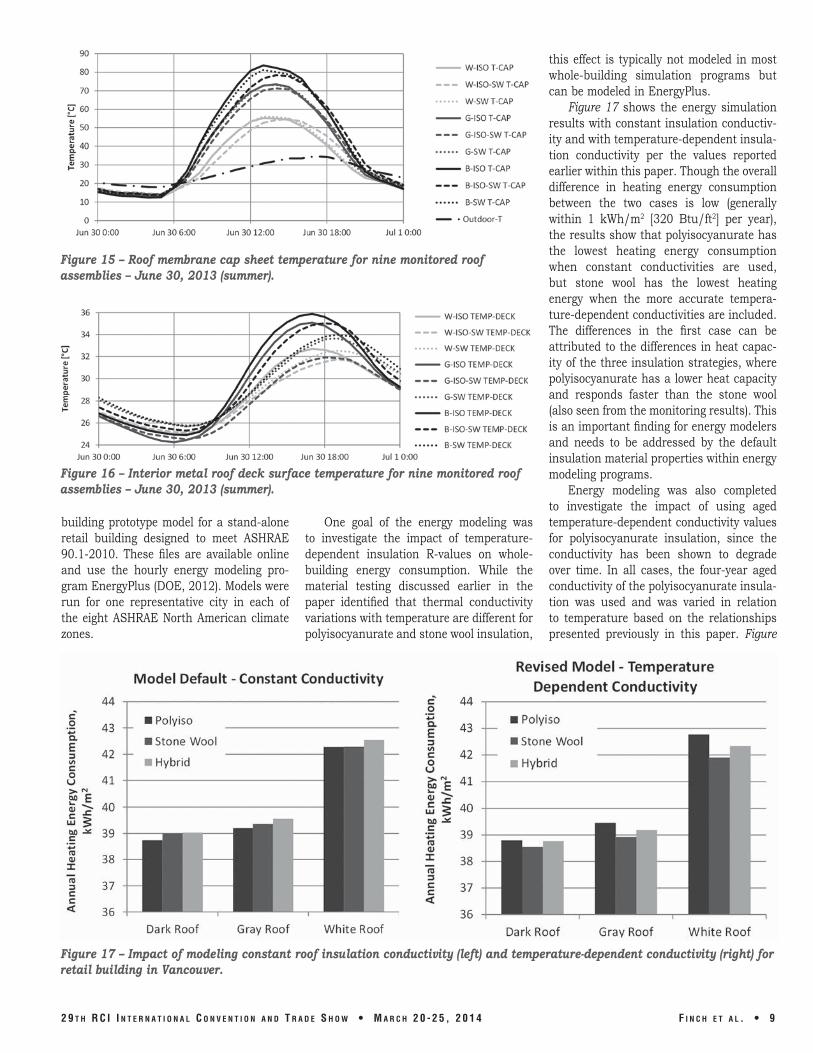
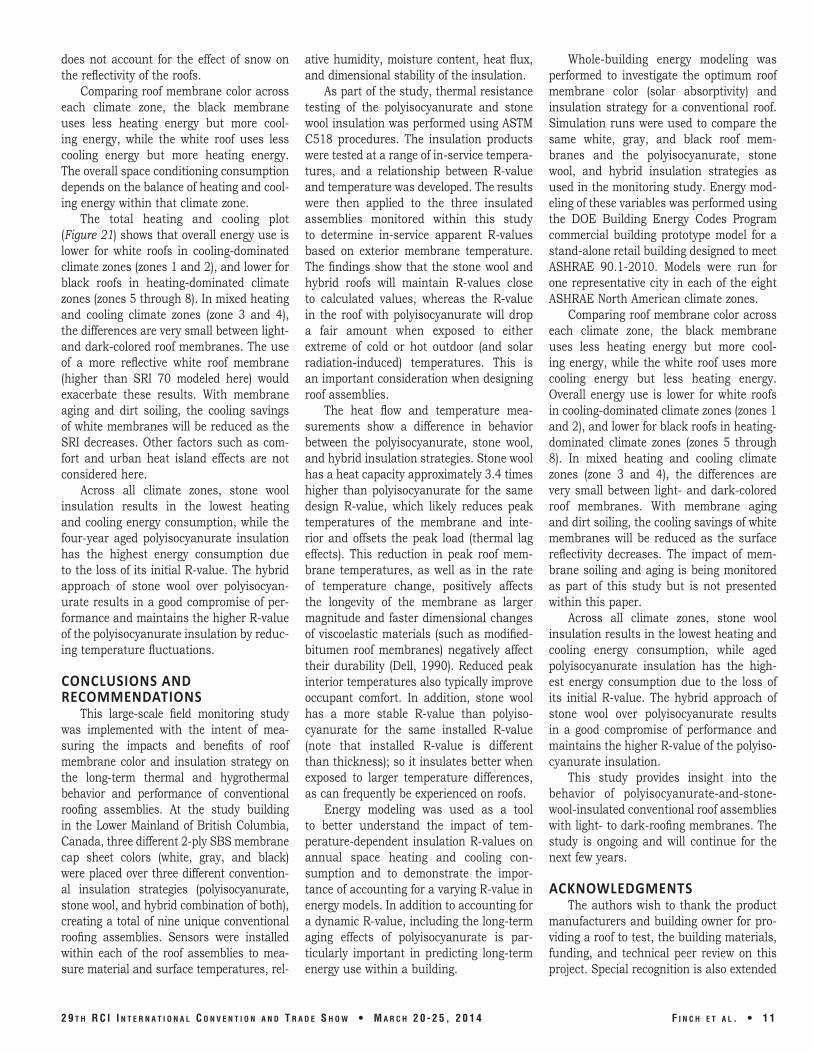
Figure 17 shows the energy simulation results with constant insulation conductiv-ity and with temperature-dependent insula-tion conductivity per the values reported earlier within this paper. Though the overall difference in heating energy consumption between the two cases is low (generally within 1 kWh/m2 [320 Btu/ft2] per year), the results show that polyisocyanurate has the lowest heating energy consumption when constant conductivities are used, but stone wool has the lowest heating energy when the more accurate tempera-ture-dependent conductivities are included. The differences in the first case can be attributed to the differences in heat capac-ity of the three insulation strategies, where polyisocyanurate has a lower heat capacity and responds faster than the stone wool (also seen from the monitoring results). This is an important finding for energy modelers and needs to be addressed by the default insulation material properties within energy modeling programs.
Energy modeling was also completed to investigate the impact of using aged temperature-dependent conductivity values for polyisocyanurate insulation, since the conductivity has been shown to degrade over time. In all cases, the four-year aged conductivity of the polyisocyanurate insula-tion was used and was varied in relation to temperature based on the relationships presented previously in this paper. Figure
2 9 T H R C I I N T E R N A T I O N A L C O N V E N T I O N A N D T R A D E S H O W • M A R C H 2 0 - 2 5 , 2 0 1 4 F I N C H E T A L . • 9
Figure 15 – Roof membrane cap sheet temperature for nine monitored roof assemblies – June 30, 2013 (summer).
Figure 16 – Interior metal roof deck surface temperature for nine monitored roof assemblies – June 30, 2013 (summer).
Figure 17 – Impact of modeling constant roof insulation conductivity (left) and temperature-dependent conductivity (right) for retail building in Vancouver.

18 shows the total energy consumption (heating and cooling) simulation results for Vancouver, including new and aged polyiso-cyanurate insulation. The results show a clear increase in energy consumption for aged polyisocyanurate as expected from the lower R-value, making it the highest energy consumption case.
Whole-building energy simulations were run for one repre-sentative city in each of the eight AShRAE/DOE climate zones. Figures 19 through 21 show the annual heating, cooling, and total heating and cooling energy, respectively, for the eight AShRAE climate zones with the same black and white roof membranes (SRI -4 and +70 respectively) as used in the study, and aged polyisocy-anurate, stone wool, or hybrid insulation. Note that this modeling
1 0 • F I N C H E T A L . 2 9 T H R C I I N T E R N A T I O N A L C O N V E N T I O N A N D T R A D E S H O W • M A R C H 2 0 - 2 5 , 2 0 1 4
Figure 18 – Impact of modeling aged conductivity of polyisocyanurate insulation on total building energy consumption in Vancouver.
Figure 19 – Commercial retail building annual heating energy use intensity in eight climate zones.
Figure 20 – Commercial retail building annual cooling energy use intensity in eight climate zones.
Figure 21 – Commercial retail building annual combined heating and cooling energy use intensity in eight climate zones.
does not account for the effect of snow on the reflectivity of the roofs.
Comparing roof membrane color across each climate zone, the black membrane uses less heating energy but more cool-ing energy, while the white roof uses less cooling energy but more heating energy. The overall space conditioning consumption depends on the balance of heating and cool-ing energy within that climate zone.
The total heating and cooling plot (Figure 21) shows that overall energy use is lower for white roofs in cooling-dominated climate zones (zones 1 and 2), and lower for black roofs in heating-dominated climate zones (zones 5 through 8). In mixed heating and cooling climate zones (zone 3 and 4), the differences are very small between light- and dark-colored roof membranes. The use of a more reflective white roof membrane (higher than SRI 70 modeled here) would exacerbate these results. With membrane aging and dirt soiling, the cooling savings of white membranes will be reduced as the SRI decreases. Other factors such as com-fort and urban heat island effects are not considered here.
Across all climate zones, stone wool insulation results in the lowest heating and cooling energy consumption, while the four-year aged polyisocyanurate insulation has the highest energy consumption due to the loss of its initial R-value. The hybrid approach of stone wool over polyisocyan-urate results in a good compromise of per-formance and maintains the higher R-value of the polyisocyanurate insulation by reduc-ing temperature fluctuations.
ConCLuSIonS AnDRECoMMEnDATIonS
This large-scale field monitoring study was implemented with the intent of mea-suring the impacts and benefits of roof membrane color and insulation strategy on the long-term thermal and hygrothermal behavior and performance of conventional roofing assemblies. At the study building in the Lower Mainland of British Columbia, Canada, three different 2-ply SBS membrane cap sheet colors (white, gray, and black) were placed over three different convention-al insulation strategies (polyisocyanurate, stone wool, and hybrid combination of both), creating a total of nine unique conventional roofing assemblies. Sensors were installed within each of the roof assemblies to mea-sure material and surface temperatures, rel-
ative humidity, moisture content, heat flux, and dimensional stability of the insulation.
As part of the study, thermal resistance testing of the polyisocyanurate and stone wool insulation was performed using ASTM C518 procedures. The insulation products were tested at a range of in-service tempera-tures, and a relationship between R-value and temperature was developed. The results were then applied to the three insulated assemblies monitored within this study to determine in-service apparent R-values based on exterior membrane temperature. The findings show that the stone wool and hybrid roofs will maintain R-values close to calculated values, whereas the R-value in the roof with polyisocyanurate will drop a fair amount when exposed to either extreme of cold or hot outdoor (and solar radiation-induced) temperatures. This is an important consideration when designing roof assemblies.
The heat flow and temperature mea-surements show a difference in behavior between the polyisocyanurate, stone wool, and hybrid insulation strategies. Stone wool has a heat capacity approximately 3.4 times higher than polyisocyanurate for the same design R-value, which likely reduces peak temperatures of the membrane and inte-rior and offsets the peak load (thermal lag effects). This reduction in peak roof mem-brane temperatures, as well as in the rate of temperature change, positively affects the longevity of the membrane as larger magnitude and faster dimensional changes of viscoelastic materials (such as modified-bitumen roof membranes) negatively affect their durability (Dell, 1990). Reduced peak interior temperatures also typically improve occupant comfort. In addition, stone wool has a more stable R-value than polyiso-cyanurate for the same installed R-value (note that installed R-value is different than thickness); so it insulates better when exposed to larger temperature differences, as can frequently be experienced on roofs.
Energy modeling was used as a tool to better understand the impact of tem-perature-dependent insulation R-values on annual space heating and cooling con-sumption and to demonstrate the impor-tance of accounting for a varying R-value in energy models. In addition to accounting for a dynamic R-value, including the long-term aging effects of polyisocyanurate is par-ticularly important in predicting long-term energy use within a building.
Whole-building energy modeling was performed to investigate the optimum roof membrane color (solar absorptivity) and insulation strategy for a conventional roof. Simulation runs were used to compare the same white, gray, and black roof mem-branes and the polyisocyanurate, stone wool, and hybrid insulation strategies as used in the monitoring study. Energy mod-eling of these variables was performed using the DOE Building Energy Codes Program commercial building prototype model for a stand-alone retail building designed to meet AShRAE 90.1-2010. Models were run for one representative city in each of the eight AShRAE North American climate zones.
Comparing roof membrane color across each climate zone, the black membrane uses less heating energy but more cool-ing energy, while the white roof uses more cooling energy but less heating energy. Overall energy use is lower for white roofs in cooling-dominated climate zones (zones 1 and 2), and lower for black roofs in heating-dominated climate zones (zones 5 through 8). In mixed heating and cooling climate zones (zone 3 and 4), the differences are very small between light- and dark-colored roof membranes. With membrane aging and dirt soiling, the cooling savings of white membranes will be reduced as the surface reflectivity decreases. The impact of mem-brane soiling and aging is being monitored as part of this study but is not presented within this paper.
Across all climate zones, stone wool insulation results in the lowest heating and cooling energy consumption, while aged polyisocyanurate insulation has the high-est energy consumption due to the loss of its initial R-value. The hybrid approach of stone wool over polyisocyanurate results in a good compromise of performance and maintains the higher R-value of the polyiso-cyanurate insulation.
This study provides insight into the behavior of polyisocyanurate-and-stone-wool-insulated conventional roof assemblies with light- to dark-roofing membranes. The study is ongoing and will continue for the next few years.
ACknowLEDGMEnTSThe authors wish to thank the product
manufacturers and building owner for pro-viding a roof to test, the building materials, funding, and technical peer review on this project. Special recognition is also extended
2 9 T H R C I I N T E R N A T I O N A L C O N V E N T I O N A N D T R A D E S H O W • M A R C H 2 0 - 2 5 , 2 0 1 4 F I N C H E T A L . • 1 1
to SMT Research for installing and trou-bleshooting the sensors and data-logging equipment, and to Building Science Labs for the ASTM C518 material testing.
REFEREnCESASTM Standard C518, 2010, Standard
Test Method for Steady-State Thermal Transmission Properties by Means of the Heat Flow Meter Apparatus, ASTM International, West Conshohocken, PA. Available at http://www.astm.org/Standards/C518.htm.
AShRAE Standard 90.1, “Energy Standard for Buildings Except Low-Rise Residential Buildings,” I-P and S-I Editions. 2007 and 2010, ANSI/AShRAE/IESNA. American Society of heating, Refrigerating and Air-Conditioning Engineers, Inc. Available at http://www.ashrae.org.
Building Science Corporation (BSC). 2013a. BSC Information Sheet 502: Understanding the Temperature Dependence of R-values for Polyisocyanurate Roof Insulation. Available at www.buildingscience.com.
Building Science Corporation (BSC). 2013b. The Thermal Metric Project. Available at http://www.building-science.com/documents/special/thermal-metric/
M. Dell, Behavioral Characteristics of Fully Adhered Modified-Bitumen Roof Membranes When Subjected to In-Plane Loads. University of Waterloo, 1990. Waterloo, Ontario.
M. Dell and G. Finch, “Monitored Field Performance of Conventional Roofing Assemblies – Measuring the Benefits of Insulation Strategy,” Proceedings From the 2013 RCI Symposium on Building Envelope Technology, November 13-14, 2013, RCI, Inc., Minneapolis, Minnesota.
DOE. 2012. Building Energy Codes Program – Commercial Prototype Building Models. Available at http://www.energycodes.gov/develop-ment/commercial/90.1_models
DOE Cool Roof Calculator. 2013, Oak Ridge National Laboratory, Software Version 1.2. Available at http://web.ornl.gov/sci/roofs+walls/facts/CoolCalcEnergy.htm.
Environment Canada. 2013. “Canadian Climate Normals, Chilliwack Airport,” Available at http://climate.weather.gc.ca/climate_normals/
M. Graham, “Revised R-Values,” Professional Roofing, May 2010. Available at http://www.profession-alroofing.net/.
C.P. hedlin, “Seasonal Variations in the Modes of heat Transfer in Moisture Porous Thermal Insulation in a Flat Roof,” Journal of Thermal Insulation, Vol. 11, pp. 54-66, July 1987, (IRC Paper No. 1496).
RDh Building Engineering. 2013, Conventional Roofing Monitoring Study – Year 1 Summary Report.
Roof Savings Calculator (RSC), 2013, Oak Ridge National Laboratory and Lawrence Berkeley National Laboratory. Software Version v0.92.
Available at http://www.roofcalc.com/index.shtml.
T.L. Smith, “Benefits of Reflective Roofs in Northern Areas of the U.S.,” Proceedings of the 16th RCI International Convention & Trade Show, RCI, Inc., April 20-24, 2001, Baltimore, Maryland.
FooTnoTES1. Stone wool is within the class of
mineral wool/fiber insulation prod-ucts. Within this paper, it is used to describe a stone fiber insulation material with a higher fiber den-sity (typically above 10 pcf) and is intended for roofing rather than wall applications.
2. Apparent R-value is the actual ther-mal resistance of the insulation at a given point in time. It varies with temperature and due to other fac-tors such as age.
3. In all of the subsequent plots within the legend code, “W” refers to the white roof membrane, “G” for gray, and “B” for black. ISO refers to the polyiso insulation, ISO-SW refers to the hybrid (stone wool over polyiso), and SW refers to the stone wool. The nine different test areas are defined in short form using a combination of these letters. Within the heat flux plots, negative values indicate gain of energy through the roof insulation (e.g., due to solar loading), and posi-tive values indicate a loss of energy (e.g., due to colder outdoor condi-tions).
1 2 • F I N C H E T A L . 2 9 T H R C I I N T E R N A T I O N A L C O N V E N T I O N A N D T R A D E S H O W • M A R C H 2 0 - 2 5 , 2 0 1 4