Embed Size (px)
Citation preview

Regional andUrban Policy
Working PapersA series of short papers on regional research and indicators produced by the Directorate-General for Regional and Urban Policy
WP 02/2020
CONVERGENCE OF EU REGIONS REDUX
RECENT TRENDS IN REGIONAL DISPARITIES
PHILIPPE MONFORT

LEGAL NOTICE
This document has been prepared for the European Commission Directorate-General for Regional and Urban policy. The views expressed in this article are the sole responsibility of the authors and do not neces-sarily correspond to those of the European Commission.
More information on the European Union is available on the Internet (http://www.europa.eu).
Luxembourg: Publications Office of the European Union, 2020
© Cover image: iStock/DaLiu
© European Union, 2020
Reproduction is authorised provided the source is acknowledged.
ABSTRACTBefore the economic crisis, which started in 2008, the EU was nicknamed a ‘convergence machine’ as disparities among EU regions had been decreasing significantly. The crisis had a deep impact on economic and social cohesion in the EU and the surge in disparities is now frequently cited as one of the main causes for the current lack of popular support for the project to build the European Union.
The issue of regional disparities is therefore as relevant as ever. This paper intends to provide an updated analysis of their recent trends. It relies on a battery of instruments and methods to take the pulse of the convergence process among EU regions, both at EU and Member State level, taking a long-term perspective where possible and comparing the EU with other places in the world.
The paper reaches three key conclusions. First, the crisis stopped convergence within the EU-28 where the level of disparity has been more or less stable since 2008. Second, disparities are growing within many Member States. Third, the impact of the crisis has been long-lasting as convergence has yet to restart despite sustained economic recovery. This is worrying since the EU as a whole has recovered from the crisis but the convergence process has not.
JEL O41, R11, R12Keywords: convergence, regional disparities, regions, European Union

CONTENTS1 Inequalities in the world and in the EU – analysis at the country level 3
2 Regional inequalities in the EU 6
3 Regional inequalities within Member States 17
4 Drivers of regional disparities 21
5 Conclusions 22
6 References 23
CONVERGENCE OF EU REGIONS REDUX: RECENT TRENDS IN REGIONAL DISPARITIES 1

INTRODUCTIONAs mentioned in the Treaty establishing the European Union, one of the key mandates of EU Cohesion Policy is to reduce disparities in the level of development among EU regions. Their performance is constantly being monitored and every three years, the main observations are compiled in the Cohesion Report which provides a wide-ranging overview on the state of the Union's regions and territories.
The extent of disparities among EU regions and how they change over time have been given particular attention. This is a key indicator for gauging if EU regions have converged towards some common standards and, in particular, if the less developed regions are catching up with the more developed ones.
Monfort (2008) reviewed a range of methods frequently used to analyse convergence and dispersion among various economies and applied them to the EU regions. The main conclusion was that the EU deserved its nickname of ‘convergence machine’ as all measures indicated that disparities among EU regions had declined in the preceding decades, rapidly at the EU-28 level and at a slower but still visible pace at the EU-15 level.
Since then, European economies have been profoundly affected by the crisis, although not all of them in the same way. In some regions, the impact of the crisis was limited, while its negative consequences proved devastating in others. Between 2008 and 2012, GDP per head (PPS) in the Greek Ionian Islands fell by 29 % while in the Polish region of Mazowiecki, it grew by 30 %. In Andalusia, the unemployment rate increased from 18 % in 2008 to 36 % in 2013. During the same period, in Saxony-Anhalt, it fell from 15 % to 9 %.
Given the wide variety of its consequences on Member States and their regions, the crisis had a deep impact on economic and social cohesion in the Union. Probably for the first time in its history, growing disparities seriously threaten popular support for the European project. The crisis and its unevenly distributed negative effects are increasingly seen as one of the main explanations for the surge of votes for anti-system and/or Eurosceptic parties (see, for instance, Algan et al., 2017; Rodriguez-Pose, 2018; Dijkstra et al., 2019). Protest movements have appeared in many places across Europe to voice their concerns about a lack of economic justice.
Therefore, the issue of regional disparities is as relevant as ever. This paper provides an updated analysis of recent trends. Section 1 focuses on the EU-28 at the Member State level, taking a long-term perspective and comparing the EU with other places in the world. Section 2 analyses the evolution of regional disparities within the EU, using a series of analytical instruments to highlight changes affecting the convergence process in the Union. Section 3 looks at the evolution of regional disparities within the Member States, while Section 4 attempts to identify the key factors behind regional disparities in the EU. Finally, Section 5 concludes. Note that, in the absence of counterfactuals, no inference on the effectiveness of Cohesion Policy can be drawn from the analysis presented in this paper.
2

1. INEQUALITIES IN THE WORLD AND IN THE EU – ANALYSIS AT THE COUNTRY LEVEL
In recent decades, income inequalities have increased significantly in industrialised countries currently reaching historical highs in most OECD countries (see, for instance, Lakner and Branko, 2013; Alvaredo et al., 2018; OECD, 2019).
1. The Bruegel dataset includes annual data on global and regional Gini coefficient estimates, using various methodologies, for various groups of countries. For the EU-28, figures are available from 1988 to 2016 (see Darvas, 2019). The Standardized World Income Inequality Database (SWIID) provides comparable Gini indices of gross and net income inequality for 192 countries. For the countries presented in Figure 1, the most recent data available included in the last update of the database are for 2016 or 2017 (see Solt, 2016).
As highlighted in Figure 1, the Gini coefficient measuring the dispersion of disposable income has significantly increased since the early 1980s in the United States, Australia, Canada, Japan and China. Europe seems to be an exception. Although income inequalities increased sharply when the centrally planned economies of Eastern and Central Europe rapidly transited to market economies, they have steadily declined since 1993 (see, for instance, Darvas, 2019).1
FIGURE 1: Income inequalities in selected countries and the EU-28
20
25
30
35
40
45
1960
1962
1964
1966
1968
1970
1972
1974
1976
1978
1980
1982
1984
1986
1988
1990
1992
1994
1996
1998
2000
2002
2004
2006
2008
2010
2012
2014
2016
Gin
i ind
ex
United StatesChina
JapanCanada
AustraliaEU-28
Source: Bruegel dataset for the EU; Standardized World Income Inequality Database for other countries1.
CONVERGENCE OF EU REGIONS REDUX: RECENT TRENDS IN REGIONAL DISPARITIES 3

Although with a somewhat different timing, the same type of trend is generally observed for regional disparities within these areas. Figure 2 shows the dispersion of GDP per head (PPS) as measured by the coefficient of variation (weighted by population2) for the United States, Korea, Australia and Japan at the OECD TL 2 level3 and the EU-28 at the country (NUTS 0) level. Between 2000 and 2018, regional disparities either remained stable or increased. Once again, the exception is the EU-28 where disparities fell significantly until 2008 when the crisis halted the strong convergence process.
At first sight, the EU presents a rather atypical profile relative to the evolution of disparities compared to other industrialised countries. It also shows why the Union was referred to as a convergence machine, at least until the financial and economic crisis in 2008.
However, the EU average hides the division of the Union into (at least) two very different groups of countries. This is best seen when comparing historical figures for the EU-154, the
2. In this paper, measures of regional disparities are systematically weighted by the appropriate population. See Gluschenko (2018) for a discussion on this issue.3. Regions in OECD member countries have been classified according to two territorial levels (TL), to facilitate international comparability. The higher level (territorial
level 2) comprises macroregions and corresponds to states/territories in Australia, regions in Korea, groups of prefectures in Japan, and states in the United States.4. The EU-15 refers to the group of countries which were EU Member States before 2004. The group of countries which joined after this date is referred to as the EU-13.5. Data for the EU are taken from the Maddison Project Database, version 2018 (Bolt et al., 2018), This Database provides information on comparative economic
growth and income levels in the very long term. The 2018 version covers 169 countries and the period up to 2016: https://www.rug.nl/ggdc/historicaldevelop-ment/maddison/releases/maddison-project-database-2018. Missing data for Czechia (1950-1969) and Slovakia (1950-1984) has been extrapolated from the data available for Czechoslovakia. Missing data for the three Baltic States (1950-1979), Croatia (1950-1951) and Slovenia (1950-1951) have been extrapo-lated by applying the average growth rate available for first 10 years.
6. Data for the USA are taken from the U.S. Bureau of Economic Analysis database. Although data are available up to 2019, for the sake of comparing US and EU data, we only report figures up to 2016: https://apps.bea.gov/iTable/index_regional.cfm
EU-28 and the USA. Figure 3 presents the coefficient of variation calculated on the basis of the EU-28 and EU-15 national real GDP per head from 1950 to 20165. It also shows the same dispersion index calculated for the US states real GDP per head6.
From the 1950s to the end of the 1970s, the EU-28 and the EU-15 showed roughly similar patterns, with steadily decreasing internal disparities. Then, and up to the late 1990s, disparities continued to decline among EU-15 Member States, albeit at a slower pace. At the EU-28 level, they remained relatively stable and even increased at the end of the 1980s, which coincided with the fall of the Berlin Wall and the profound changes in Eastern and Central European economies. Between 2000 and 2008, disparities rapidly decreased at the EU-28 level but did not change much at the EU-15 level. This process stopped abruptly in 2008 with the economic crisis, the impact of which varied significantly among EU countries. Since then, disparities were more or less stable at the EU-28 level, while increasing significantly at the EU-15 level.
FIGURE 2: Regional disparities in selected OECD countries and the EU-28, GDP per head (PPS)
0.05
0.1
0.15
0.2
0.25
0.3
0.35
2000
2001
2002
2003
2004
2005
2006
2007
2008
2009
2010
2011
2012
2013
2014
2015
2016
2017
Coeffi
cien
t of
var
iatio
n %
of
mea
n
United States Korea Japan Australia EU-28
Source: EUROSTAT for the EU; OECD for other countries; DG REGIO calculations.
4

Figure 3 also shows that the evolution of disparities within the EU-15 parallels that observed in the USA where disparities among states declined until the mid-1990s, then stabilised and eventually increased with the crisis to reach levels comparable to the early 2000s. In that sense, the EU-15 pattern is consistent with those of other industrialised economies. However, in the EU-15, disparities increased to levels observed at the end of the 1980s. In contrast, the EU-28 pattern is rather peculiar and reflects the fact that it includes a group of less developed countries, corresponding to most of the EU-13, which have rapidly converged during a strong catching-up process.
Such a process is in line with what economic theory would predict and has been observed in many instances, places and periods (see, for instance, Abramovitz, 1979 and 1986; Baumol, 1986; Dollar and Wolff, 1988; Dowrick and Nguyen, 1989;
Sala-i-Martin, 1990; Verspagen, 1991; Pritchett, 1997; Sala-i-Martin, 1996; Jones, 1997; Caselli, 2005; Baldwin, 2016). The catching-up of EU-13 countries is likely to have been substantially accelerated by their accession to the EU, which provided better access to the Union's Single Market, allowed massive inflows of capital from the more developed EU-15 countries, and facilitated technology transfer (see, for instance, Rapacki and Próchniak, 2009). Their economies have developed at an impressive pace, thereby strongly contributing to fewer disparities in the EU-28. In 1995, GDP per head (PPS) in the EU-15 was around EUR 17 700 per inhabitant and per year, 2.6 times as high as in the EU-13, where it was around EUR 6 800. By 2018, the ratio had dropped to 1.6, GDP per head in the EU-13 being at over EUR 22 000 as against around EUR 33 000 in the EU-15.
FIGURE 3: State-level disparities in the USA, EU-28 and EU-15, real GDP per head
0
0.05
0.1
0.15
0.2
0.25
0.3
0.35
0.4
0.45
0.5
195019
5119
5219
5319
5419
5519
5619
5719
5819
5919
6019
6119
6219
6319
6419
6519
6619
6719
6819
6919
7019
7119
7219
7319
7419
7519
7619
7719
7819
7919
8019
8119
8219
8319
8419
8519
8619
8719
8819
8919
9019
9119
9219
9319
9419
9519
9619
9719
9819
9920
0020
0120
0220
0320
0420
0520
0620
0720
0820
0920
1020
1120
1220
1320
1420
1520
16
Coeffi
cien
ty o
f va
riatio
n, %
of
mea
n
EU-28 EU-15 USA
Source: Maddison Project Database for the EU; Bureau of Economic Analysis Database for the USA; DG REGIO calculations.
CONVERGENCE OF EU REGIONS REDUX: RECENT TRENDS IN REGIONAL DISPARITIES 5

2. REGIONAL INEQUALITIES IN THE EU
2.1. AT NUTS 2 LEVEL
Are these trends also observed at the regional level? Data is scarcer than at the national level, especially when it comes to long-time series, and it is more likely that regional data includes outliers which can strongly influence the results.
Also, there are a number of regions where people work but do not live, commuting between the region where they live and the region where they work. For these regions, the concept of GDP per head does not make sense as a measure of the level of development. Thus, for the sake of this analysis, a number of urban NUTS 2 regions where commuting is important have been combined with NUTS 2 regions that approximate the city and their commuting zone, i.e. a functional urban area7.
7. The areas considered here are Amsterdam, Berlin, Budapest, Brussels, London, Prague and Vienna.
Figure 4 below shows the coefficient of variation calculated on the regional GDP per head (PPS) at this hybrid NUTS 2 level. Within the EU-28, regional disparities rapidly shrank during the period prior to the economic crisis, the coefficient of variation dropping from 42.2 % in 2000 to 35.2 % in 2009. Since then, there has been no significant change in the level of disparities. The financial and economic turmoil and the recession which followed substantially affected convergence among EU regions, which is partly explained by the fact that the crisis impacted EU regions in very different ways. While GDP per head in some regions fell by more than 25 % during the years when the crisis had the greatest impact (2008-2012), it continued to grow at almost unaffected rates in others.
Disparities also declined within the EU-15 but at a much slower pace than in the EU-28, the coefficient of variation falling from 27.5 % in 2000 to 26.0 % in 2006. Disparities started to increase significantly from 2009, the coefficient of variation reaching 31.1 % in 2018. Here, too, the crisis implied a clear break in trend and triggered a sharp increase in the extent of regional disparities.
FIGURE 4: Regional (NUTS 2) disparities, EU-28 and EU-15, GDP per head (PPS)
0.25
0.27
0.29
0.31
0.33
0.35
0.37
0.39
0.41
0.43
0.45
2000
2001
2002
2003
2004
2005
2006
2007
2008
2009
2010
2011
2012
2013
2014
2015
2016
2017
2018
Coeffi
cien
t of
var
iatio
n, %
of
mea
n
EU-28 EU-15Source: EUROSTAT and DG REGIO calculations.
6

This is consistent with the findings of Biscari et al. (2020) that convergence in the EU-28 has been strongest during high-growth periods, the early stages of EU integration among the EU-15 Member States, and just before and after the accession of the Eastern and Central European countries.
Another classical dispersion measure is the inter-percentile range which expresses the extent of disparities between the groups of top and bottom performers. It is usually calculated as the ratio (or the difference) between the 90th and 10th percentiles. When used to evaluate regional disparities and in order to consider population, the indicator can be calculated as the ratio between GDP per head of the most-developed regions accounting for 10 % of the total population and GDP per head of the least-developed regions accounting for 10 % of the total population.
This metric confirms that regional disparities have significantly decreased within the EU-28 (Figure 5). In 2000, GDP per head in the most-developed regions accounting for 10 % of the Union’s population was 6.1 times higher than GDP per head of the least-developed regions also accounting for 10 % of the EU’s population. In 2018, the ratio dropped to 3.4. Over this period, growth of GDP per head in the regions included in the group of the least-developed regions in 2000 stood at 6.1 % on average per annum against 2.1 % for the group of most-developed regions. Again, the impact of the crisis on the convergence process is clear. Between 2000 and 2009, the ratio of GDP per head between the most and the least-developed regions fell from 6.1 to 4.0 while between 2009 and 2018, it decreased at a much slower pace, from 4.0 to 3.4.
FIGURE 5: Inter-percentile range (90-10 %), GDP per head (PPS), NUTS 2 regions, EU-28
0.2
1.2
2.2
3.2
4.2
5.2
6.2
7.2
0
10
20
30
40
50
60
2000
2001
2002
2003
2004
2005
2006
2007
2008
2009
2010
2011
2012
2013
2014
2015
2016
2017
2018
Ratio
GD
P pe
r he
ad in
mos
t to
leas
t de
velo
ped
regi
ons
GD
P pe
r he
ad (P
PS),
in E
UR
thou
sand
s
Most developed Least developed Ratio
Source: EUROSTAT and REGIO calculations.
CONVERGENCE OF EU REGIONS REDUX: RECENT TRENDS IN REGIONAL DISPARITIES 7

This is due to the fact that the crisis affected growth in GDP per head quite differently in the two groups of regions. In the least-developed regions, in 2000, the yearly average growth rate of GDP per head fell from 9.0 % per annum on average between 2000 and 2008 to 4.8 % between 2009 and 2018, dropping by 4.2 percentage points. Growth of GDP per head in the most-developed regions during the same periods was respectively 2.8 % and 2.5 %, hence falling by only 0.3 percentage points.
The differentiated impact of the crisis on growth is confirmed by examining the correlation between the change in GDP per head growth between the two sub-periods and the level of GDP per head in 2000 (Figure 6). On average, GDP per head growth in less developed regions dropped more/increased less between pre- and post-crisis periods, meaning that, in general, these regions were affected more by the crisis than the more developed regions. However, for most of them, the GDP growth rate remained higher than the EU average. For instance, between 2000 and 2008, growth of GDP per head was higher than in the EU in 90 % of the regions with a GDP per head less than 75 % of the EU average in 2000. During the period 2009-2018, this share dropped to 72 %.
This means that, even if least-developed regions continued to grow faster than the most-developed, thereby still contributing to convergence, their GDP per head growth was more negatively impacted by the crisis. This, and the dramatic impact of the crisis on some regions, notably in Southern Europe, explain the slowdown of the convergence process within the EU-28.
This pattern is clearly revealed when distinguishing three groups of regions by their level of development. For this analysis, the group of less developed regions refers to regions with a GDP per head of less than 75 % of the EU average in 2000, moderately developed regions to regions with a GDP per head between 75 % and 100 %, and more developed regions to regions with a GDP per head of over 100 %. In 2000, GDP per head in the group of less developed regions was around EUR 9 500, or 48 % of the EU average. By 2017, their GDP per head had increased to more than EUR 18 000, reaching 61 % of the EU average. Less developed regions have rapidly caught up with and converged to the EU average and, in general, continued to do so after the crisis, although at a slower pace. In contrast, the group of moderately developed regions started drifting away from the EU average after the crisis. Their GDP per head was more or less stable at around 85 % of the EU average up to 2007 when it started to steadily decrease. In 2017, GDP per head in the moderately developed regions corresponded to around 78 % of the EU average.
FIGURE 6: Change in GDP per head (PPS) growth 2000-2008 and 2009-2018 vs. GDP per head 2000, NUTS 2 regions, EU-28
y = 0.0239x - 3.6717R² = 0.1889
-10.0
-8.0
-6.0
-4.0
-2.0
0.0
2.0
4.0
6.0
8.0
0.0 50.0 100.0 150.0 200.0 250.0
Chan
ge in
GD
P pe
r he
ad g
row
th r
ate,
pp
GDP per head 2000, EU-28=100
Source: EUROSTAT and REGIO calculations.
8

2.2. BETA-CONVERGENCE
There is beta-convergence when disparities decline because poor regions grow faster than rich ones and therefore can catch them up (see, for example, Barro, 1994; Baumol, 1986; Barro, 1991; Barro and Sal-i-Martin, 1992). Beta-convergence implies that the partial correlation between growth in GDP per head over a given period of time and its initial level is negative. The methodology used to test for beta-convergence generally consists in estimating an equation in the following form:
(1)
where
Ý (1/T) log(i,T / yi0) is the average yearly growth rate during the period t0 to T;
Ý yi,0 is the level of GDP per head in region i at time 0; Ý ui0,T is a standard error term with 0 mean and variance
σ2, independent of ln(yi0); Ý a and β are the parameters to be estimated.
8. In fact, the half-life corresponds to the time necessary for the distance between (log of) GDP per head at the starting date and its steady state value to be halved.
A negative relationship between growth and the initial level of GDP per head, i.e. β is significant and negative, is the sign of a beta-convergence process. The estimated value of β also indicates the rate at which regions approach their steady state. Based on this value, the speed of convergence (the rate at which distance between log(yi,t) and its steady state value decreases in time) can be computed as:
and the half-life, i.e. the time span necessary for current disparities to be halved8 (see, for instance, Barro and Sal-i-Martin, 1992) as:
FIGURE 7: GDP per head (PPS), less-, moderately and more-developed NUTS 2 regions, 2000-2018
40
50
60
70
80
90
100
110
120
130
2000
2001
2002
2003
2004
2005
2006
2007
2008
2009
2010
2011
2012
2013
2014
2015
2016
2017
2018
Inde
x EU
-28=
100
Less developed
Moderately developed
More developed
EU-28
Source: EUROSTAT and REGIO calculations.
(1/T)log(yi,T/ yi0) = α + β. log(yi,0) + ui0,T
SC= (1/T)*log(1+Tβ)
T = (1/2)
(1/T)log(yi,T/ yi0) = α + β. log(yi,0) + ui0,T
SC= (1/T)*log(1+Tβ)
T = (1/2)
(1/T)log(yi,T/ yi0) = α + β. log(yi,0) + ui0,T
SC= (1/T)*log(1+Tβ)
T = (1/2)
CONVERGENCE OF EU REGIONS REDUX: RECENT TRENDS IN REGIONAL DISPARITIES 9

FIGURE 8a: GDP per head growth 2000-2008 vs. GDP per head 2000, NUTS 2 regions, EU-28
-4.0 %
-2.0 %
0.0 %
2.0 %
4.0 %
6.0 %
8.0 %
10.0 %
12.0 %
14.0 %
0 10 20 30 40 50 60
Gro
wth
GD
P pe
r he
ad P
PS, y
early
ave
rage
200
0-20
08
GDP per head PPS, in EUR thousands, 2000
Source: EUROSTAT.
FIGURE 8b: GDP per head growth 2008-2018 vs. GDP per head 2008, NUTS 2 regions, EU-28
-4.0 %
-2.0 %
0.0 %
2.0 %
4.0 %
6.0 %
8.0 %
10.0 %
12.0 %
14.0 %
10 20 30 40 50 60 70 80
Gro
wth
GD
P pe
r he
ad P
PS, y
early
ave
rage
200
8-20
18
GDP per head PPS, in EUR thousands, 2008
0
Source: EUROSTAT.
Figure 8a shows the growth of GDP per head between 2000 and 2008 (yearly average rate) and its levels in 2000. The relationship is clearly negative as, on average, less developed regions have higher growth rates than more developed ones. For this period, the estimated value of the beta coefficient is 0.015, meaning that, each year, disparities have been reduced by around 1.5 %. The half-life is 20 years. The R2 of the regression is 0.53, i.e. the initial level of GDP per head explains 53 % of the variation in regional GDP per head growth.
For the period 2008-2018 (Figure 8b), the value of the estimated beta drops to 0.006, implying a half-life of 47 years. Although still at work, the beta-convergence process has significantly slowed down. The initial level of GDP per head only explains 13 % of the variation in GDP per head growth which reflects the fact that the crisis has profoundly affected the relationship between GDP per head and GDP per head growth which is now much looser.
10

The impact of the crisis is particularly visible when estimating the beta coefficient over rolling periods of five years between 2000 and 2017. Figure 9 shows the evolution of the estimated beta coefficient from the period 2000-2005 to the period 2012-2017. Once the period includes years after 2008, the absolute value of the beta coefficient starts to fall,
indicating that the speed at which less-developed regions converge with more-developed ones slows down. Accordingly, the half-life of the process increases. From the sub-periods 2000-2005 to 2012-2017, the beta coefficient fell by almost two-thirds, from 0.014 to 0.005, while the half-life increased from 22 to 57 years.
Source: EUROSTAT and REGIO calculations.
FIGURE 9: Estimated beta coefficient (absolute value), NUTS 2 regions EU-28
0
20
40
60
80
100
120
0.001
0.003
0.005
0.007
0.009
0.011
0.013
0.015
0.017
0.019
β Half-life
Hal
f-lif
e, y
ears
Estim
ated
Bet
a co
efici
ent
2000
-200
5
2001
-200
6
2002
-200
7
2003
-200
8
2004
-200
9
2005
-201
0
2006
-201
1
2007
-201
2
2008
-201
3
2009
-201
4
2010
-201
5
2011
-201
6
2012
-201
7
CONVERGENCE OF EU REGIONS REDUX: RECENT TRENDS IN REGIONAL DISPARITIES 11

2.3. TRANSITION DYNAMICS
More information on convergence among EU regions can be obtained by looking at the trajectory of regions in the distribution of GDP per head. This can be done by calculating transition matrices which show the frequency of regions moving (or not) between different GDP-per-head classes, expressed as a percentage of the EU average. This approach enables intra-distribution dynamics and changes in the relative position of regions over time to be captured (see, for instance, Quah, 1993a,b; Neven and Gouyette, 1995; Quah, 1996; Fingleton, 1999; Lopez-Bazo et al., 1999).
If we assume that the distribution of regional GDP per head follows a Markov process9, the transition matrix describes the dynamics of the distribution and it is possible to infer several interesting metrics, such as the stationary distribution corresponding to a steady state towards which the distribution will converge in time, the half-life which measures the speed at which the distribution converges to this steady state, as well as the stability of the process10 (see Monfort, 2008, for a more detailed discussion of the approach).
9. A Markov chain is ergodic if it is possible to go from every state (distribution) to any other state in a finite number of steps. Ergodicity and the existence of a stationary distribution is ensured when the modulus of the second eigenvalue of the transition matrix is strictly smaller than 1.
10. Following Pellegrini (2002), this is captured by calculating the probability of remaining in the same GDP per head class. The stability indicator is denoted by S in the tables below.
The transition matrices below are calculated for GDP per head intervals of [0-50], ]50-75], ]75-100], ]100-150] and above 150. We consider two periods of five years, 2002-2007 and 2012-2017, respectively. The first period represents the years before the crisis, while the second one corresponds to years when the economic turmoil triggered by the crisis settled down (the first signs of the recovery were detected at the end of 2012) and is meant to capture the post-crisis features of the European economic scene.
The 2002-2007 period is characterised by convergence among EU regions (Table 1). Around 23 % of the regions with a GDP per head of less than 50 % of the EU average in 2002 moved up to the GDP per head class of 50 % to 75 % by 2007, while almost 14 % of the regions in the category of GDP per head of 50 % to 75 % in 2002 moved to the 75 % to 100 % class during the same period. Only 2.1 % of the less and moderately developed regions dropped to a lower GDP per head class between 2002 and 2007 while, for the more developed regions, this share was more than 21 %.
TABLE 1: Transition matrix, GDP/head, EU-28 NUTS 2 regions, 2002-2007, %
Source: EUROSTAT and REGIO calculations.
2017
2002
0-50 50-75 75-100 100-150 150- Total
0-50 76.9 23.1 0.0 0.0 0.0 100
50-75 0.0 86.2 13,8 0.0 0.0 100
75-100 0.0 4.2 90.3 5.6 0.0 100
100-150 0.0 0.0 20.4 77.7 1.9 100
150- 0.0 0.0 0.0 25.0 75.0 100
0-50 50-75 75-100 100-150 150- Total
2002 14.8 11.0 27.4 39.2 7.6 100
2007 11.4 14.1 34.2 33.8 6.5 100
Stationary 0.0 18.9 62.7 17.1 1.3 100
Half-life 2.7
S 81.2
12

TABLE 2: Transition matrix, GDP/head, EU-28 NUTS 2 regions, 2012-2017, %
The pace of convergence is high (with a half-life of 2.7 periods) and the system tends towards a stationary distribution which shows a high degree of concentration around the EU average. While in 2000, 26 % of EU regions were less developed (15 % with a GDP per head of less than 50 % of the EU average and 11 % with a GDP per head between 50 % and 75 %), they accounted for only 19 % of the EU regions in the stationary distribution, none of which have a GDP per head below 50 %. In 2000, 67 % of regions had a GDP per head between 75 % and 150 % of the EU average, a share that was predicted to stabilise to 80 % according to the pre-crisis dynamics of the system.
Things are quite different for the period 2012-2017. The share of less- and moderately-developed regions dropping to lower GDP classes was much higher, at 9 %, while for more-
developed regions it was 11 %, much lower than for the pre-crisis period. The system roughly shows the same stability (the stability index S is at 81.2 and 82.6 for the 2002-2007 and 2012-2017 periods, respectively) although the larger number of less and moderately developed regions falling behind implies a tendency towards divergence. As indicated by comparing the actual distributions for 2012 and 2017 with the stationary distribution, if current trends were maintained, the share of regions with a GDP per head of less than 75 % of the EU average is expected to increase while in the centre of the distribution, the share of regions with a GDP per head between 75 % and 150 % is expected to fall.
The crisis has substantially changed the dynamics within the distribution of regional GDP per head. Prior to the crisis, movements to a lower class of income were almost entirely restricted to more-developed regions. Only three less and moderately developed regions went down a class between 2002 and 2007 (Map 2). After the crisis, the frequency of such movements became much higher. Between 2012 and 2017, 15 less and moderately developed regions moved to a lower class. Note that such moves are not due to the crisis itself (the period considered for the analysis does not include the years of crisis) but rather to the more structural downwards trends it induced in some regions.
The less and moderately developed regions falling behind in the post-crisis period were mainly located in the EU-15. a number of Greek regions which previously had a GDP per head in the class 50 % to 75 % of the EU average dropped into the 0 % to 50 % class. Some regions in Italy, France and Belgium also dropped from the 75 % to 100 % class to the 50 % to 75 % one.
Source: EUROSTAT and REGIO calculations.
2017
2002
0-50 50-75 75-100 100-150 150- Total
0-50 84.2 15.8 0.0 0.0 0.0 100
50-75 6.7 81.7 11.7 0.0 0.0 100
75-100 0.0 13.3 83.1 3.6 0.0 100
100-150 0.0 0.0 7.4 88.9 3.7 100
150- 0.0 0.0 0.0 25.0 75.0 100
0-50 50-75 75-100 100-150 150- Total
2002 7.2 22.8 31.6 30.8 7.6 100
2007 7.6 24.0 31.2 30.4 6.8 100
Stationary 15.1 35.8 31.5 15.4 2.3 100
Half-life 10.6
S 82.6
CONVERGENCE OF EU REGIONS REDUX: RECENT TRENDS IN REGIONAL DISPARITIES 13

MAP 1: Transition matrix, GDP/head, EU-28 NUTS 2 regions, 2002-2007
Guadeloupe Martinique
Canarias
Guyane
Açores
Mayotte Réunion
Madeira
Evolution of regional GDP/head (PPS), 2002-2007
Source: DG REGIO based on Eurostat data
© EuroGeographics Association for the administrative boundaries
0 500 km
REGIOgis
< 50
< 50
50 - 75 75 - 100 100 - 150 > 150
50 - 75
75 - 100
100 - 150
> 150
2002\2007
14

MAP 2: Transition matrix, GDP/head, EU-28 NUTS 2 regions, 2012-2017
Guadeloupe Martinique
Canarias
Guyane
Açores
Mayotte Réunion
Madeira
Evolution of regional GDP/head (PPS), 2012-2017
Source: DG REGIO based on Eurostat data
© EuroGeographics Association for the administrative boundaries
0 500 km
REGIOgis
< 50
< 50
50 - 75 75 - 100 100 - 150 > 150
50 - 75
75 - 100
100 - 150
> 150
2012\2017
CONVERGENCE OF EU REGIONS REDUX: RECENT TRENDS IN REGIONAL DISPARITIES 15

Alternatively, the population weighted equivalent of the transition matrices can be computed by considering the shares of the regions’ population in each class of GDP per head. For instance, the table below indicates that, in 2002, 15.6 % of the EU population lived in regions with a GDP per head below 50 % of the EU average. Among those, 75.2 % lived in regions which had remained in the same class of GDP per head up to 2007, while 24.8 % lived in regions which had moved up to the next category.
The main message remains, i.e. the convergence process within the EU-28 was interrupted by the crisis. Between 2002 and 2007, around 25 % of the EU population lived in less developed regions (with GDP per head of less than 75 % of the EU average). In 2017, this share increased to 27 % and, if it remains unchanged, the dynamics of the system will eventually lead to a distribution whereby less developed regions will host 40 % of the EU population.
TABLE 3: Transition matrix, GDP/head, EU-28 NUTS 2 regions population, 2002-2007, %
Source: EUROSTAT and REGIO calculations.
2017
2002
0-50 50-75 75-100 100-150 150- Total
0-50 75.1 24.9 0.0 0.0 0.0 100
50-75 0.0 76.0 24.0 0.0 0.0 100
75-100 0.0 13.8 83.7 2.5 0.0 100
100-150 0.0 0.0 20.5 78.9 0.6 100
150- 0.0 0.0 0.0 24.4 75.6 100
0-50 50-75 75-100 100-150 150- Total
2002 15.5 9.7 21.8 40.3 12.7 100
2007 11.1 14.0 29.1 35.8 10.0 100
Stationary 0.0 33.9 58.9 7.1 0.2 100
Half-life 3.3
S 77.9
TABLE 4: Transition matrix, GDP/head, EU-28 NUTS 2 regions population, 2012-2017, %
Source: EUROSTAT and REGIO calculations.
2017
2002
0-50 50-75 75-100 100-150 150- Total
0-50 80.2 19.8 0.0 0.0 0.0 100
50-75 1.8 88.3 10.0 0.0 0.0 100
75-100 0.0 9.4 88.3 2.3 0.0 100
100-150 0.0 0.0 6.4 89.9 3.7 100
150- 0.0 0.0 0,0 9.9 90.1 100
0-50 50-75 75-100 100-150 150- Total
2002 6.4 20.5 26.0 36.0 11.1 100
2007 5.2 21.4 27.2 34.5 11.7 100
Stationary 3.4 37.2 39.5 14.5 5.4 100
Half-life 14.9
S 87.3
16

3. REGIONAL INEQUALITIES WITHIN MEMBER STATES
Standard dispersion indicators, such as the coefficient of variation, show that at the EU-28 level convergence among EU regions has decelerated and even stopped, but has not reversed. However, as shown by the changes at the EU-15 level and by the transition matrices, the EU-28 average can conceal quite different trends if the focus is on more restricted areas in particular countries. When people compare their situation to a societal benchmark, it is much more likely that EU citizens
11. See, for instance, Rajan (2019) who shows how the coexistence of flourishing central hubs and a left-behind periphery contributes to growing despair, social unrest and polarising political tensions; or Winkler (2019) for the link between regional income inequality and greater political polarisation in European regions.
12. The margin of error is likely to be too large for less than four observations.
consider the average income or GDP per head in their own country rather than the EU-28 average. If there is concern about regional disparities as a source of popular discontent, the country level is definitely relevant11. As an increase in regional disparities within countries worldwide has been documented in a number of contributions (see, for instance, Gennaioli et al., 2014; Dabla-Norris et al., 2015; OECD, 2018; IMF, 2019), this section aims to verify if such findings are also observed for the EU.
The figures below show disparities in terms of GDP per head within the Member States with at least 4 NUTS 2 regions, as measured by the coefficient of variation12 for the years 2000 and 2018, as well as the change in the dispersion index between these two dates.
Source: EUROSTAT and REGIO calculations.
FIGURE 10a: Coefficient of variation within Member States, GDP per head (PPS), NUTS 2 regions, 2000 and 2017
0
0.05
0.1
0.15
0.2
0.25
0.3
0.35
0.4
0.45
0.5
SK RO BG PL HU FR UK CZ BE IT EL ES DK DE SE PT FI NL AT
2018 2000
Coeffi
cien
t of
var
iatio
n, G
DP
per
head
CONVERGENCE OF EU REGIONS REDUX: RECENT TRENDS IN REGIONAL DISPARITIES 17
Source: EUROSTAT and REGIO calculations.
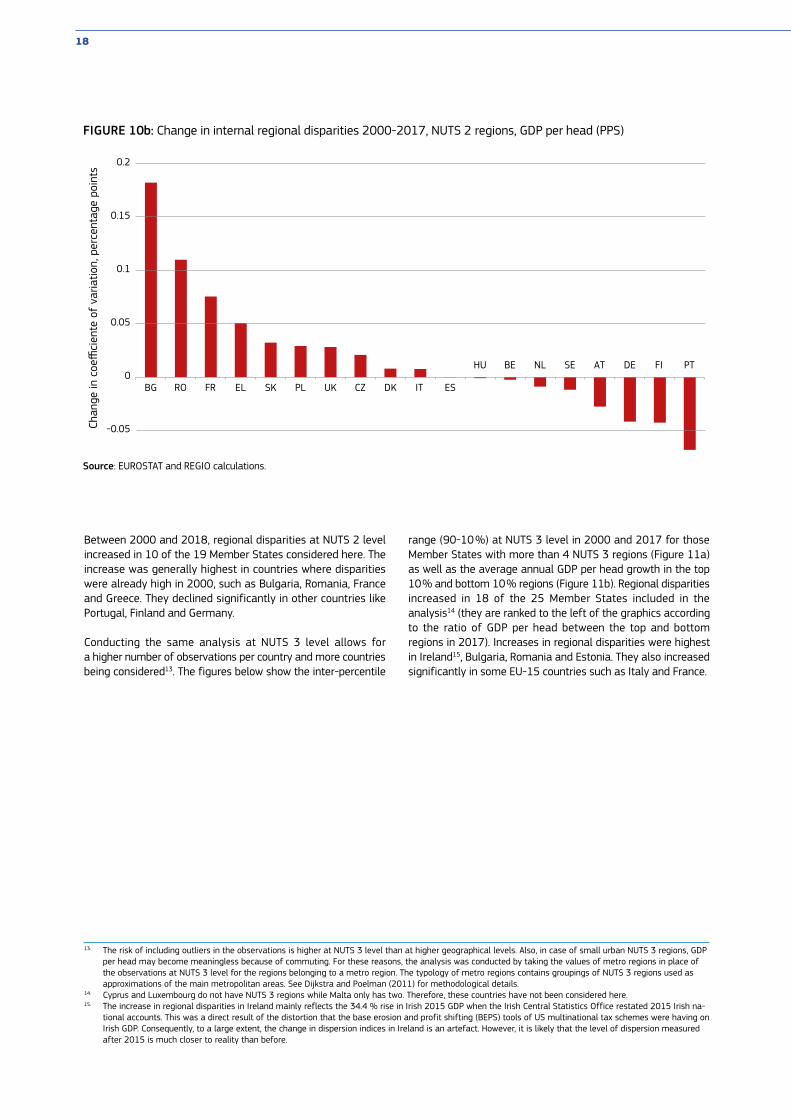
FIGURE 10b: Change in internal regional disparities 2000-2017, NUTS 2 regions, GDP per head (PPS)
-0.05
0
0.05
0.1
0.15
0.2
BG RO FR EL SK PL UK CZ DK IT ES
HU BE NL SE AT DE FI PT
Chan
ge in
coe
ffici
ente
of
varia
tion,
per
cent
age
poin
ts
Between 2000 and 2018, regional disparities at NUTS 2 level increased in 10 of the 19 Member States considered here. The increase was generally highest in countries where disparities were already high in 2000, such as Bulgaria, Romania, France and Greece. They declined significantly in other countries like Portugal, Finland and Germany.
Conducting the same analysis at NUTS 3 level allows for a higher number of observations per country and more countries being considered13. The figures below show the inter-percentile
13. The risk of including outliers in the observations is higher at NUTS 3 level than at higher geographical levels. Also, in case of small urban NUTS 3 regions, GDP per head may become meaningless because of commuting. For these reasons, the analysis was conducted by taking the values of metro regions in place of the observations at NUTS 3 level for the regions belonging to a metro region. The typology of metro regions contains groupings of NUTS 3 regions used as approximations of the main metropolitan areas. See Dijkstra and Poelman (2011) for methodological details.
14. Cyprus and Luxembourg do not have NUTS 3 regions while Malta only has two. Therefore, these countries have not been considered here.15. The increase in regional disparities in Ireland mainly reflects the 34.4 % rise in Irish 2015 GDP when the Irish Central Statistics Office restated 2015 Irish na-
tional accounts. This was a direct result of the distortion that the base erosion and profit shifting (BEPS) tools of US multinational tax schemes were having on Irish GDP. Consequently, to a large extent, the change in dispersion indices in Ireland is an artefact. However, it is likely that the level of dispersion measured after 2015 is much closer to reality than before.
range (90-10 %) at NUTS 3 level in 2000 and 2017 for those Member States with more than 4 NUTS 3 regions (Figure 11a) as well as the average annual GDP per head growth in the top 10 % and bottom 10 % regions (Figure 11b). Regional disparities increased in 18 of the 25 Member States included in the analysis14 (they are ranked to the left of the graphics according to the ratio of GDP per head between the top and bottom regions in 2017). Increases in regional disparities were highest in Ireland15, Bulgaria, Romania and Estonia. They also increased significantly in some EU-15 countries such as Italy and France.
18

Source: EUROSTAT and REGIO calculations.
FIGURE 11b: Growth of GDP per head (PPS), least-developed, most-developed NUTS 3 regions and EU-28, 2000-2017
Source: EUROSTAT and REGIO calculations.
FIGURE 11a: Inter-percentile range (90-10 %), GDP per head (PPS), NUTS 3, 2000 and 2017
0
0.5
1
1.5
2
2.5
3
3.5
4
4.5
5
RO IE SK BG PL IT HU EE FR BE UK HR LT SI EL CZ SE DK LV DE PT ES NL FI AT
Ratio
GD
P pe
r he
ad in
mos
t- a
nd le
ast-
deve
lope
d re
gion
s
2000 2017
0.00
0.50
1.00
1.50
2.00
2.50
3.00
3.50
4.00
4.50
5.00
0.0 %
1.0 %
2.0 %
3.0 %
4.0 %
5.0 %
6.0 %
7.0 %
8.0 %
9.0 %
10.0 %
RO IE SK BG PL IT HU EE FR BE UK HR LT SI EL CZ SE DK LV DE PT ES NL FI AT
Ratio
GD
P pe
r he
ad t
op 1
0 %
-bot
tom
10%
reg
ions
Gro
wth
rat
e 20
00-2
016;
yea
rly a
vera
ge
Bottom 10 % regions Top 10 % regions EU-28
CONVERGENCE OF EU REGIONS REDUX: RECENT TRENDS IN REGIONAL DISPARITIES 19

However, the examination of GDP per head growth reveals different patterns. In countries like Bulgaria or Romania, increases in disparities have been driven by the very high growth rates in the most-developed regions (typically the capital city region). Their other regions, however, still experienced higher growth than the EU average and hence converged, albeit at a slower pace. In Italy, France or Greece, internal disparities increased because growth of GDP per head in the least-developed regions was particularly low – lower than in the most-developed regions of the country but also lower than in the EU, meaning that these regions were drifting away from the EU average.
16. Again, Luxembourg and Cyprus are not included in the calculation since they do not have NUTS 3 regions.
Today, disparities within countries account for the bulk of regional disparities in the EU. The figure below shows the Theil index calculated on the basis of regional GDP per head at NUTS 3 level16. This index can be broken down into the part of disparities due to disparities within areas (in our case, countries) and the part that is due to differences between areas. In 2000, disparities between countries accounted for more than two thirds of the total disparities in the EU. Disparities between countries had been falling rapidly up to 2008 and then remained more or less stable. At the same time, disparities within countries started rising in 2004 and since then have increased by more than 16 %. In 2017, they accounted for around 66 % of regional disparities in the EU.
Source: EUROSTAT and REGIO calculations.
FIGURE 12: Theil index, GDP per head, NUTS 3 regions
0.00
0.02
0.04
0.06
0.08
0.10
0.12
0.14
2000 2001 2002 2003 2004 2005 2006 2007 2008 2009 2010 2011 2012 2013 2014 2015 2016 2017
Thei
l ind
ex
Total
Within countries
Across countries
20

4. DRIVERS OF REGIONAL DISPARITIES
GDP per head can be broken down into its fundamental elements, i.e. labour productivity (GDP to employment ratio), the employment rate (employment to labour force ratio) and the ratio of the labour force to total population:
where Pop is total population, Emp is total employment and LF is the working-age population.
Regional disparities in GDP per head therefore reflect disparities in terms of labour productivity as well as labour market performance and demographics, as captured by the employment rate and the share of people of working age in the total population. We can use a format of the mean log deviation (MLD) index to decompose the dispersion of regional GDP per head into the dispersions of its components. Indeed, let us define the MLD index for variable y as:
Where wi is the weight associated to observation yi and y is the EU average. If wi corresponds to the share of population in region i, then:
i.e. the extent of regional disparities in terms of GDP per head is equal to the sum of disparities in terms of labour productivity, the employment rate and the share of people of working age in the total population. The figure below shows the share of GDP per head dispersion explained by dispersion in labour productivity in 2000, 2010 and 2016.
In all Member States, labour productivity explains most of the regional disparities in terms of GDP per head. This is consistent with previous findings in the literature on the relationship between differences in economic development across EU regions and labour or total factor productivity (see, for instance, Beugelsdijk et al., 2017). However, the contribution of labour productivity to GDP per head dispersion is lower in countries like Italy and Spain, where the performance of the labour market shows much more variation than in other countries. For instance, in Romania, the 2017 employment rates range between 78.1 % and 63.9 %. In Italy, the most-performing region has an employment rate of 79.0 % while for the least-performing region it is only 44.1 %.
In some countries, the contribution of labour productivity to GDP per head dispersion has also increased significantly. In general, this corresponds to a situation whereby regional disparities in terms of labour productivity have increased while disparities in regional labour markets have decreased. This is the case, for instance, in Poland where labour productivity accounted for 74.8 % of GDP per head dispersion in 2000 and 97.3 % in 2017.
( / ) = ∗=1
//
=
∗=1
//
+ ∗=1
//
+ ∗=1
//
=
� � �
�
( / ) + ( / ) + ( / )
= ∗ ∗
( ) = ∗=1
�
Source: EUROSTAT and REGIO calculations.
FIGURE 13: Share of regional disparities in GDP per head (PPS) explained by disparities in labour productivity, NUTS 2, 2000, 2010 and 2017
50.0 %
55.0 %
60.0 %
65.0 %
70.0 %
75.0 %
80.0 %
85.0 %
90.0 %
95.0 %
100.0 %
RO NL PT DK CZ DE EL BE AT SE UK SK HU FR BG FI PL ES IT
2000 2010 2017
CONVERGENCE OF EU REGIONS REDUX: RECENT TRENDS IN REGIONAL DISPARITIES 21

5. CONCLUSIONSThis paper has provided an overview of regional disparities in the EU over the last two decades. The analysis was conducted at various geographical levels, namely country (NUTS 0), NUTS 2 and NUTS 3 levels. It also compared the EU with other areas in the world, in particular other industrialised countries. Disparities were assessed using a variety of methods and instruments which are most frequently used in the analysis of economic and social inequalities.
The main findings can be summarised as follows. First, the financial and economic crisis which began in 2008 has profoundly affected the convergence process which was ongoing in the EU. Prior to the crisis, disparities among EU-28 Member States and regions were rapidly falling, due to strong catching up by the less developed parts of the Union, mainly located in Eastern and Central Europe. This process was substantially accelerated by the accession of these countries to the Single European Market.
In 2008, the convergence process stopped abruptly and the dynamics of the distribution of regional GDP per head now show a trend towards more disparities in the future. The reason for this break in the trend is twofold: (i) the impact of the crisis varies widely across EU regions. While some regions were hardly affected, the economy of others was severely hit, notably those of less or moderately developed regions in Southern Europe; (ii) the negative impact of the crisis on GDP growth was on average higher in the EU’s less developed regions of the Union which were also those generally recording the highest growth rates of the Union, hence providing most of the fuel for the EU convergence machine. Following the economic crisis, their growth rate remains generally higher than the EU average but has dropped more than in the developed regions. As a result, the convergence process has slowed down.
Since 2008, regional disparities in the EU-28 have stopped falling and remain more or less stable. However, this average hides important differences. In particular, disparities have increased significantly in the EU-15 and within the majority of Member States. In some countries, notably a number of Eastern and Central European countries, growing disparities stem from the (still) very high growth experienced by some regions
(typically urban, capital city regions). Other regions in the country also grow at high rates – higher than the EU average – and hence still converge. In other countries, notably in Southern Europe but also in other EU-15 Member States, growing disparities are due to the fact that growth in some regions is particularly low, which results in these regions drifting away from both the national and the EU average. Indeed, several moderately developed regions have been struggling for a long time to maintain their competitiveness and to adapt to the changes linked to globalisation and technology, putting them on a path where they are progressively losing ground compared to the best performers.
The recession that followed the economic and financial turmoil of 2008 has been over for a long time. At the start of 2020, the European economy was in its seventh consecutive year of growth and was forecast to continue expanding in the future. However, the underlying negative impact of the crisis on the EU convergence machine remains. The devastating impact of the COVID-19 outbreak will have significant negative effects on the European economy as a whole. Logically, it should affect EU regions asymmetrically, depending on factors such as the extent to which the sanitary situation deteriorated, the weight of severely affected sectors in the economy, or its dependency on international trade. According to the latest economic forecast (European Commission, 2020), the current pandemic has plunged the EU into the deepest economic recession in its history. In the last few weeks, economic activity has dropped rapidly as a result of the containment measures, and economic output is expected to have collapsed in the first half of 2020. The evidence presented in this paper demonstrates that such a large-scale shock, even if temporary, can have permanent or at least long-lasting effects on convergence. This will need to be factored into the recovery process from the COVID-19 outbreak.
Just as happened in the 2008 crisis, the economic downturn to come is expected to significantly weaken a number of EU regions and hence to have deep structural effects on regional disparities within the Union. In the face of this challenge, not only does the EU need a recovery plan endowed with means proportionate to the future unprecedented challenges, but it must also carefully think about directing them to the regions most affected to avoid this crisis resulting in an irreversible fragmentation of our societies.
22

6. REFERENCESAbramovitz, M. (1979), ‘Rapid Growth Potential and Its Realization: The Experience of the Capitalist Economies in the Postwar Period’, in Economic Growth and Resources, Vol. I, ed. by Edmond Malinvaud, London and New York: The MacMillan Press.
Abramovitz, M. (1986), ‘Catching Up, Forging Ahead, and Falling Behind’, The Journal of Economic History, 46, 2, 385-406.
Algan, Y., Guriev, S., Papaioannou, E. and E. Passari (2017), ‘The European trust crisis and the rise of populism’, Brookings Papers on Economic Activity, 2017(2), 309-400.
Alvaredo, F., Chancel, L., Piketty, T.E. Saez, E. and G. Zucman (2018), ‘The Elephant Curve of Global Inequality and Growth’, AEA Papers and Proceedings, 108: 103-08. DOI: 10.1257/pandp.20181073
Baldwin, R. (2016), The Great Convergence: Information Technology and the New Globalization, Cambridge, MA: Belknap Press.
Barro, R. (1991), ‘Economic Growth in a Cross-Section of Countries’, Quarterly Journal of Economics, 106, 407-43.
Barro, R. and X. Sala-i-Martin (1992), ‘Convergence’, Journal of Political Economy, 100, 223-251.
Beugelsdijk, S., Mariko, J. and P. Milionis (2017), ‘Regional economic development in Europe: the role of total factor productivity’, Regional Studies, 52, 4, 461-476.
Bolt, J., Robert, I, de Jong, H. and J. Luiten van Zanden (2018), ‘Rebasing “Maddison”: new income comparisons and the shape of long-run economic development’, Maddison Project Working paper 10.
Baumol, W. (1986), ‘Productivity Growth, Convergence, and Welfare: What the Long-run Data Show’, American Economic Review, 76, 5, 1072-85.
Biscari, P., Essers, D. and E. Vincent (2020), ‘Does the EU convergence machine still work?’, forthcoming in NBB Economic Review.
Caselli, F. (2005), ‘Accounting for Cross-Country Income Differences’, in Handbook of Economic Growth, ed. Aghion P. and S.N. Durlauf, Vol. 1A, 679-741. North-Holland: Elsevier.
Darvas, Z. (2019), ‘Global interpersonal income inequality decline: the role of China and India’, World Development 121, 16-32.
Dijkstra, L., Poelman, H. and A. Rodríguez-Pose (2019), ‘The geography of EU discontent’, Regional Studies, 1-17.
Dollar, D. and E. Wolff (1988), ‘Convergence of industry labor productivity among advanced economies, 1963-1982’, Review of Economics and Statistics, 70.
Dowrick, S. and D. Nguyen (1989), ‘OECD Comparative Economic Growth 1950-85: Catch-Up and Convergence’, American Economic Review, 1989, 79, 1010-30.
European Commission (2020), European Economic Forecast Spring 2020, European Economy, Institutional Paper 125, Luxembourg: Publications Office of the European Union.
Fingleton, B. (1999), ‘Estimates of time to economic convergence: an analysis of regions of the European Union’, International Regional Science Review, 22, 5-34.
Geppert, K. and A. Stephan (2008), ‘Regional disparities in the European Union: Convergence and agglomeration’, Papers in Regional Science, 87, 2, 193-217.
Gennaioli, N. (2014), ‘Growth in Regions’, Journal of Economic Growth, 19, 3, 259-309.
Gluschenko, K. (2018) Measuring regional inequality: to weight or not to weight?, Spatial
IMF (2019), World Economic Outlook, Chapter 2: Closer Together or Further Apart? Subnational Regional Disparities and Adjustment in Advanced Economies, Washington, DC. Economic Analysis, 13:1, 36-59, DOI: 10.1080/17421772.2017.1343491
Lakner, C. and M. Branko (2013), ‘Global Income Distribution: From the Fall of the Berlin Wall to the Great Recession’, Policy Research Working Paper No. 6719, World Bank: https://openknowledge.worldbank.org/handle/10986/16935 License: CC BY 3.0 IGO.
Lopez-Bazo, E., Vaya, E., Mora, A.J. and J. Surinach (1999), ‘Regional economic dynamics and convergence in the European Union’, Annals of Regional Science, 33, 343-70.
Monfort, P. (2008), ‘Convergence of EU regions: Measures and evolution’, Regio Working Paper Series, 01/2008.
Neven, D. and C. Gouyette (1995), ‘Regional convergence in the European Community’, Journal of Common Market Studies, 33, 47-65.
OECD (2018), Regions and Cities at a Glance 2018, OECD Publishing, Paris.
CONVERGENCE OF EU REGIONS REDUX: RECENT TRENDS IN REGIONAL DISPARITIES 23

OCDE (2019), Under Pressure: The Squeezed Middle Class, OECD Publishing, Paris: https://doi.org/10.1787/689afed1-en
Pellegrini, G. (2002), ‘Proximity, polarization, and local labour market performances’, Networks and Spatial Economics, 2, 151-173.
Pritchett, L. (1997), ‘Divergence, Big Time’, Journal of Economic Perspectives, 11, 3, 3-17.
Quah, D. (1993a), ‘Empirical cross-section dynamics in economic growth’, European Economic Review, 37, 426-34.
Quah, D. (1993b), ‘Galton's fallacy and tests of the convergence hypothesis’, Scandinavian Journal of Economics, 95, 427-43.
Quah, D. (1996), ‘Regional convergence clusters across Europe’, European Economic Review, 40, 951-58.
Rajan, R. (2019), The Third Pillar: How Markets and the State Leave the Community Behind, Penguin Press, New York.
Rapacki, R. and M. Próchniak (2009), ‘The EU enlargement and economic growth in the CEE new member countries’, European Economy - Economic Papers 367, Directorate-General Economic and Financial Affairs (DG ECFIN), European Commission.
Rodríguez-Pose, A. (2018). The revenge of the places that don’t matter (and what to do about it), Cambridge Journal of Regions, Economy and Society, 11(1), 189-209.
Sala-i-Martin, X. (1990), On growth and states, PhD dissertation, Harvard University, Cambridge, MA.
Sala-i-Martin, X. (1996), ‘Regional cohesion: evidence and theories of regional growth and convergence’, European Economic Review, 40, 6, 1325-52.
Verspagen, B. (1991), ‘A new empirical approach to catching up or falling behind’, Structural Change and Economic Dynamics, 2, 2, 359-80.

Getting in touch with the EU
IN PERSONAll over the European Union there are hundreds of Europe Direct Information Centres. You can find the address of the centre nearest you at: http://europa.eu/contact
ON THE PHONE OR BY E-MAILEurope Direct is a service that answers your questions about the European Union. You can contact this service – by freephone: 00 800 6 7 8 9 10 11 (certain operators may charge for these calls), – at the following standard number: +32 22999696 or – by electronic mail via: http://europa.eu/contact
Finding information about the EU
ONLINEInformation about the European Union in all the official languages of the EU is available on the Europa website at: http://europa.eu
EU PUBLICATIONSYou can download or order free and priced EU publications from EU Bookshop at: https://bookshop.europa.eu. Multiple copies of free publications may be obtained by contacting Europe Direct or your local information centre (see http://europa.eu/contact)
EU LAW AND RELATED DOCUMENTSFor access to legal information from the EU, including all EU law since 1951 in all the official language versions, go to EUR-Lex at: http://eur-lex.europa.eu
OPEN DATA FROM THE EUThe EU Open Data Portal (http://data.europa.eu/euodp/en/data) provides access to datasets from the EU. Data can be downloaded and reused for free, both for commercial and non-commercial purposes.
CONVERGENCE OF EU REGIONS REDUX: RECENT TRENDS IN REGIONAL DISPARITIES 25

Any question, comment or contribution should be sent to the following address: [email protected]
Editor: Lewis Dijkstra, European Commission, Regional policyThe texts of this publication do not bind the Commission
© European Union, 2020Reuse is authorised provided the source is acknowledged.
doi:10.2776/27556 ISBN 978-92-76-20730-6
KN-04-20-404-EN
-N