Embed Size (px)
Citation preview
European Research Studies, Volume XIII, Issue (4), 2010
Convergence of Greek Economy with the EU and Some
Comparisons with Polish Experience
Magdalena Osinska* and Karolina Kluth** Abstract:
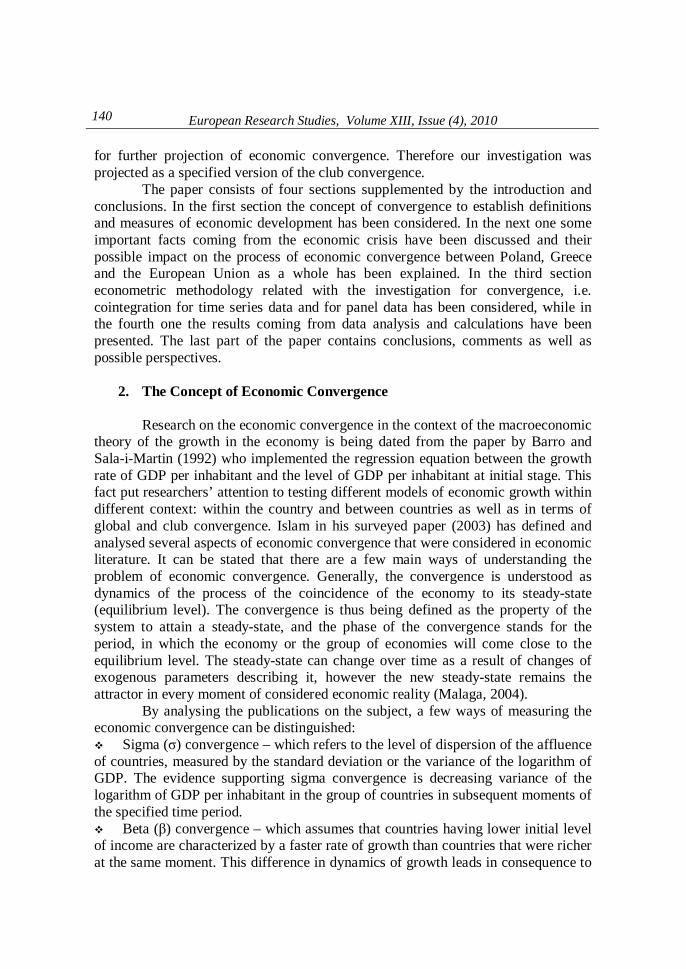
The paper aims to analyze economic situation in Greece and in Poland with comparison to the European Union. The basis for the analysis has been made by the theory of economic convergence. The newest statistical data concerning GDP per inhabitant were used in the study. In the analysed countries only for time series approach both unconditional and conditional convergence between the countries was confirmed, i.e. GDP per inhabitant in Greece, Poland and both the EU sections were co integrated. The results of the test for integration and co integration based on the panel data did not support the unconditional convergence.
JEL Classification: E0, C3.
Keywords: convergence, economic growth, co integration, economic crisis.
1. Introduction The EU enlargement process in the last decade as well as the financial and economic crisis that started in the USA in 2007 and was spread over the world in 2008 put our attention to economic position of specific countries in comparison with the others. In the paper economic situation in Greece and in Poland has been analysed and compared with that in the European Union, presented in different dimensions, i.e. EU15 and EU25. The basis for the analysis had been made by the theory of economic convergence introduced by Barro and Sala-i-Martin (1992), however newest empirical facts coming from the economic crisis of the last years have been taken into account, too. The choice of the countries was followed not only by the analysis of some economic indicators but also by our interest in the current position of the two countries: Poland, that was relatively robust for impulses coming from outside and Greece, which suffers from the last years’ global crisis very much. The comparison of economies of the two mentioned countries presented on the background of the EU economy as a whole seems to give many important indicators
*, ** Nicolaus Copernicus University of Torun, Poland
140
European Research Studies, Volume XIII, Issue (4), 2010 for further projection of economic convergence. Therefore our investigation was projected as a specified version of the club convergence.
The paper consists of four sections supplemented by the introduction and conclusions. In the first section the concept of convergence to establish definitions and measures of economic development has been considered. In the next one some important facts coming from the economic crisis have been discussed and their possible impact on the process of economic convergence between Poland, Greece and the European Union as a whole has been explained. In the third section econometric methodology related with the investigation for convergence, i.e. cointegration for time series data and for panel data has been considered, while in the fourth one the results coming from data analysis and calculations have been presented. The last part of the paper contains conclusions, comments as well as possible perspectives.
2. The Concept of Economic Convergence Research on the economic convergence in the context of the macroeconomic
theory of the growth in the economy is being dated from the paper by Barro and Sala-i-Martin (1992) who implemented the regression equation between the growth rate of GDP per inhabitant and the level of GDP per inhabitant at initial stage. This fact put researchers’ attention to testing different models of economic growth within different context: within the country and between countries as well as in terms of global and club convergence. Islam in his surveyed paper (2003) has defined and analysed several aspects of economic convergence that were considered in economic literature. It can be stated that there are a few main ways of understanding the problem of economic convergence. Generally, the convergence is understood as dynamics of the process of the coincidence of the economy to its steady-state (equilibrium level). The convergence is thus being defined as the property of the system to attain a steady-state, and the phase of the convergence stands for the period, in which the economy or the group of economies will come close to the equilibrium level. The steady-state can change over time as a result of changes of exogenous parameters describing it, however the new steady-state remains the attractor in every moment of considered economic reality (Malaga, 2004).
By analysing the publications on the subject, a few ways of measuring the economic convergence can be distinguished: Sigma (σ) convergence – which refers to the level of dispersion of the affluence of countries, measured by the standard deviation or the variance of the logarithm of GDP. The evidence supporting sigma convergence is decreasing variance of the logarithm of GDP per inhabitant in the group of countries in subsequent moments of the specified time period. Beta (β) convergence – which assumes that countries having lower initial level of income are characterized by a faster rate of growth than countries that were richer at the same moment. This difference in dynamics of growth leads in consequence to
Convergence of Greek Economy with the EU and some Comparisons with Polish Experience
141
equalizing the level of GDP per inhabitant within the group of countries (Ciołek, 2003). In β convergence it is further distinguished: Beta (β) unconditional convergence – describing relations between the growth
rate of GDP per inhabitant in the certain time horizon and the level of GDP per inhabitant in the initial moment (Ciołek, 2003). When for the given period the growth rate of GDP per inhabitant in the group of countries is negatively correlated with the level of GDP per inhabitant in the initial moment in these countries, then the hypothesis about beta unconditional convergence is confirmed by the data (Malaga, 2004).
Beta (β) conditional convergence – is fulfilled for negative correlation between the rate of return of GDP per inhabitant and GDP per inhabitant (GDP p. i. here after) in the initial moment if for the given group of countries the values of some parameters move close. The verification of this hypothesis is bringing itself to estimating the regression model explaining the growth rate of GDP p. i. in the certain horizon of time by GDP p. i. in the initial moment and by other variables. If the coefficient standing by the variable describing GDP p. i. in the initial moment is negative and statistically significant, then the hypothesis on the conditional convergence is fulfilled.
The EU enlargement in 2004 resulted in numerous economic publications concerning the problem whether “the new” EU member states may reach the level of the “the old” EU countries’ economic development and when it may happen. Varblane and Vahter (2005) have shown that -convergence hypothesis across the countries can be thought to be true. They have also concluded that in 1993-2004 there was a negative correlation between the initial ratio of the countries’ GDP per inhabitant and the sub-period average yearly growth rate. Reza and Zahra (2008) have analysed the catching-up process and convergence of ten new members of the European Union towards EU15 in 1995-2005 using panel integration tests. They found the evidence that favoured the unconditional convergence, but rejected the conditional one. Currently the convergence concept serves as a basis for discussion on monetary union within the EU (Rubaszek, 2009). Earlier papers on this subject put researchers’ attention to the convergence in the OECD countries, investigated on the basis of the growth models. For example, Baumol (1986) found some evidence supporting beta unconditional convergence within the group of 16 OECD countries, while Barro (1991), who implemented human capital to the regression, showed existence of conditional convergence. Empirical evidences supporting economic convergence within different economic zones are rather weak in the sense that they have occurred true only in small samples while for large samples of countries data have usually rejected that hypothesis. This fact was analysed by Plosser (1992), who concluded that in the period between 1960 and 1990 the distance between the rich countries and the poor ones in the world not only did not decrease but also even increased. The concept of convergence is sometimes being applied in comparing the levels of development between regions of one country or specified regions of the
142
European Research Studies, Volume XIII, Issue (4), 2010 world, which is called a club convergence. For Poland the results of such an investigation were described by Kliber (2007), while for the USA by Evans and Carras (1996).
3. Economies of Greece and Poland after Joining the EU Structures
Greece was included into the European Community (the predecessor of the
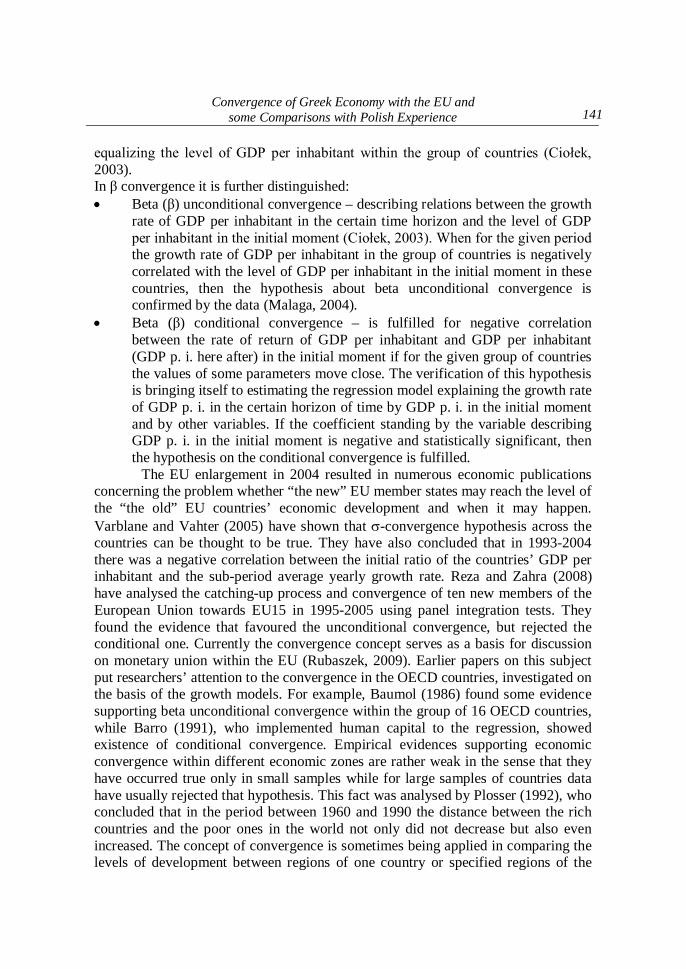
European Union) in 1981 and into the European monetary union in 2002. Almost thirty years of experience give some light to understanding the Europeanization process in this country. There is an important question to be asked: what kind of experience can be useful for young European democracies, such as for example the one in Poland? After joining the EU, a very high level of economic growth could have been observed in Greece, higher than an average growth in the EU, concerning member countries of EU15 as well as EU25, practically till the end of 2008 (see figure 1).
Figure 1: Growth rate of GDP in Greece and Poland in comparison to EU25 in per cent
Source: Eurostat.
Convergence of Greek Economy with the EU and some Comparisons with Polish Experience
143
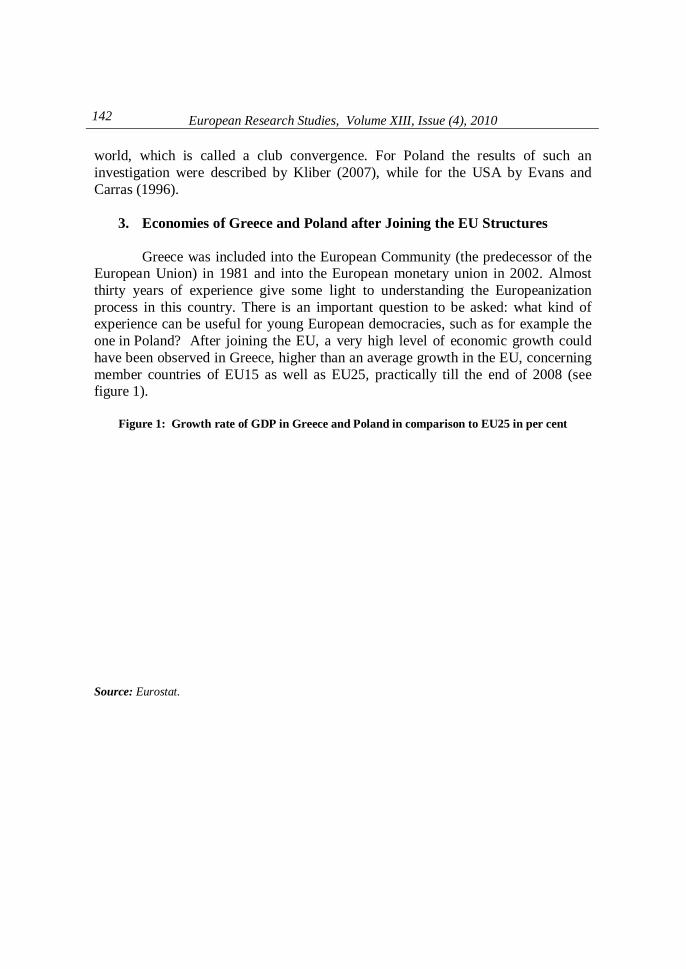
Today Greece is a country representing a “very high” level of Human Development Index (25 position in the world in 2007) and according to the Eurostat data, GDP per inhabitant was at about 95 per cent of the EU15 average in 2008 (figure 2). Figure 2: GDP per inhabitant in Greece and in Poland in comparison to EU25. Original series in millions of euro (since 1999) and millions of ECU (1995-1998) according to PPP
Source: Own calculations based on Eurostat.
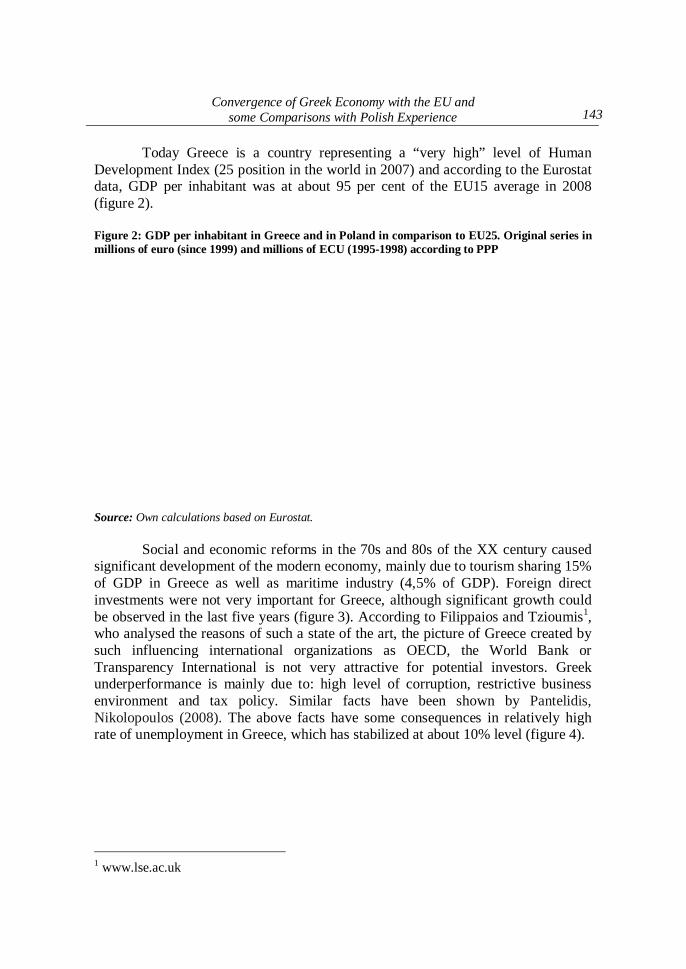
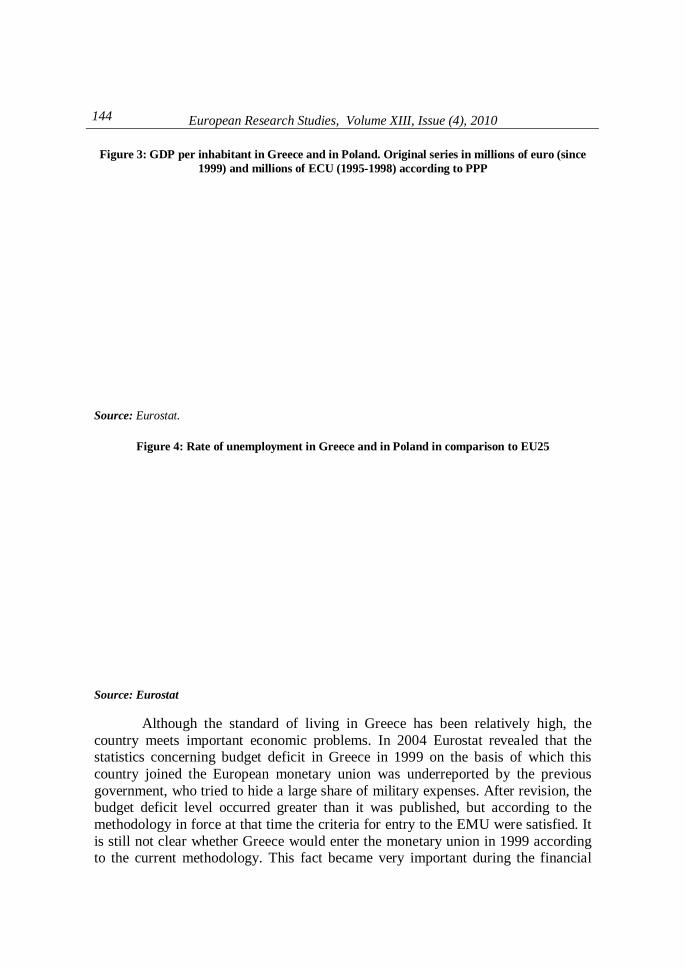
Social and economic reforms in the 70s and 80s of the XX century caused significant development of the modern economy, mainly due to tourism sharing 15% of GDP in Greece as well as maritime industry (4,5% of GDP). Foreign direct investments were not very important for Greece, although significant growth could be observed in the last five years (figure 3). According to Filippaios and Tzioumis1, who analysed the reasons of such a state of the art, the picture of Greece created by such influencing international organizations as OECD, the World Bank or Transparency International is not very attractive for potential investors. Greek underperformance is mainly due to: high level of corruption, restrictive business environment and tax policy. Similar facts have been shown by Pantelidis, Nikolopoulos (2008). The above facts have some consequences in relatively high rate of unemployment in Greece, which has stabilized at about 10% level (figure 4).
1 www.lse.ac.uk
144
European Research Studies, Volume XIII, Issue (4), 2010 Figure 3: GDP per inhabitant in Greece and in Poland. Original series in millions of euro (since
1999) and millions of ECU (1995-1998) according to PPP
Source: Eurostat.
Figure 4: Rate of unemployment in Greece and in Poland in comparison to EU25
Source: Eurostat
Although the standard of living in Greece has been relatively high, the country meets important economic problems. In 2004 Eurostat revealed that the statistics concerning budget deficit in Greece in 1999 on the basis of which this country joined the European monetary union was underreported by the previous government, who tried to hide a large share of military expenses. After revision, the budget deficit level occurred greater than it was published, but according to the methodology in force at that time the criteria for entry to the EMU were satisfied. It is still not clear whether Greece would enter the monetary union in 1999 according to the current methodology. This fact became very important during the financial
Convergence of Greek Economy with the EU and some Comparisons with Polish Experience
145
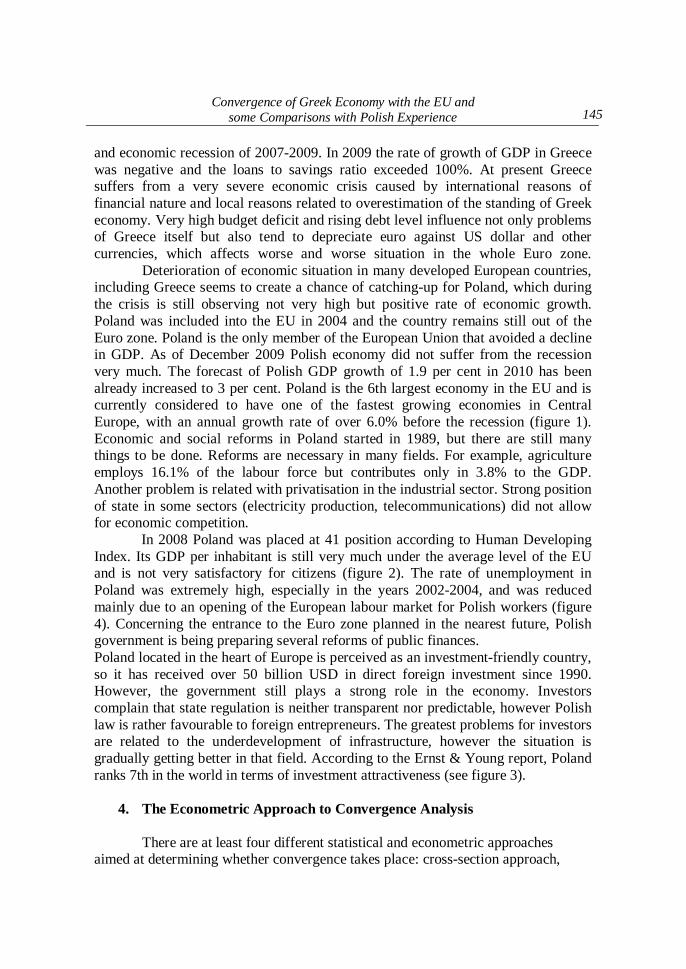
and economic recession of 2007-2009. In 2009 the rate of growth of GDP in Greece was negative and the loans to savings ratio exceeded 100%. At present Greece suffers from a very severe economic crisis caused by international reasons of financial nature and local reasons related to overestimation of the standing of Greek economy. Very high budget deficit and rising debt level influence not only problems of Greece itself but also tend to depreciate euro against US dollar and other currencies, which affects worse and worse situation in the whole Euro zone. Deterioration of economic situation in many developed European countries, including Greece seems to create a chance of catching-up for Poland, which during the crisis is still observing not very high but positive rate of economic growth. Poland was included into the EU in 2004 and the country remains still out of the Euro zone. Poland is the only member of the European Union that avoided a decline in GDP. As of December 2009 Polish economy did not suffer from the recession very much. The forecast of Polish GDP growth of 1.9 per cent in 2010 has been already increased to 3 per cent. Poland is the 6th largest economy in the EU and is currently considered to have one of the fastest growing economies in Central Europe, with an annual growth rate of over 6.0% before the recession (figure 1). Economic and social reforms in Poland started in 1989, but there are still many things to be done. Reforms are necessary in many fields. For example, agriculture employs 16.1% of the labour force but contributes only in 3.8% to the GDP. Another problem is related with privatisation in the industrial sector. Strong position of state in some sectors (electricity production, telecommunications) did not allow for economic competition.
In 2008 Poland was placed at 41 position according to Human Developing Index. Its GDP per inhabitant is still very much under the average level of the EU and is not very satisfactory for citizens (figure 2). The rate of unemployment in Poland was extremely high, especially in the years 2002-2004, and was reduced mainly due to an opening of the European labour market for Polish workers (figure 4). Concerning the entrance to the Euro zone planned in the nearest future, Polish government is being preparing several reforms of public finances. Poland located in the heart of Europe is perceived as an investment-friendly country, so it has received over 50 billion USD in direct foreign investment since 1990. However, the government still plays a strong role in the economy. Investors complain that state regulation is neither transparent nor predictable, however Polish law is rather favourable to foreign entrepreneurs. The greatest problems for investors are related to the underdevelopment of infrastructure, however the situation is gradually getting better in that field. According to the Ernst & Young report, Poland ranks 7th in the world in terms of investment attractiveness (see figure 3).
4. The Econometric Approach to Convergence Analysis There are at least four different statistical and econometric approaches
aimed at determining whether convergence takes place: cross-section approach,
146
European Research Studies, Volume XIII, Issue (4), 2010 panel approach, time series approach and distribution approach (Islam, 2003). The first three aproaches concern conditional and unconditional beta-convergence and the last one allows for determing the occurence of sigma convergence. In the paper time series and panel approaches have been applied to analyse convergence within the group of countries: Greece, Poland and EU15 as well as EU25.
In the time series apprach convergence is usually intepreted in terms of integration and cointegration. Having in mind Barro’s definition, a natural representation of convergence within the country is the Dickey-Fuller type regression (Dickey, Fuller 1979)
ttt yy 1 , (1) with 0 , which implies stationarity of ty .
Another aspect of time series analysis is convergence between countries that can be analysed according to cointegration concept (Engle, Granger, 1987). Cointegration assumes the same order of integration of time series under study. This is in opposition to the previous definition. But it is worth noting that even if two (or more) economies do not converge within ( 0 ) there can still be convergence between them if the time series cointegrate. In the empirical part of the paper cointegration analysis was made according to the procedure proposed by Johansen (1988, 1991), where the number of cointegrating vectors is the subject of verification.
Another approach is related to panel data analysis. Taking into account several countries at several times units gives a new light onto club or global convergence interpretation. Tests for integration for panel data have been proposed by Im, Pesaran and Shin (IPS hereafter) (1995, 1997, 2003) and Hardi (2000).
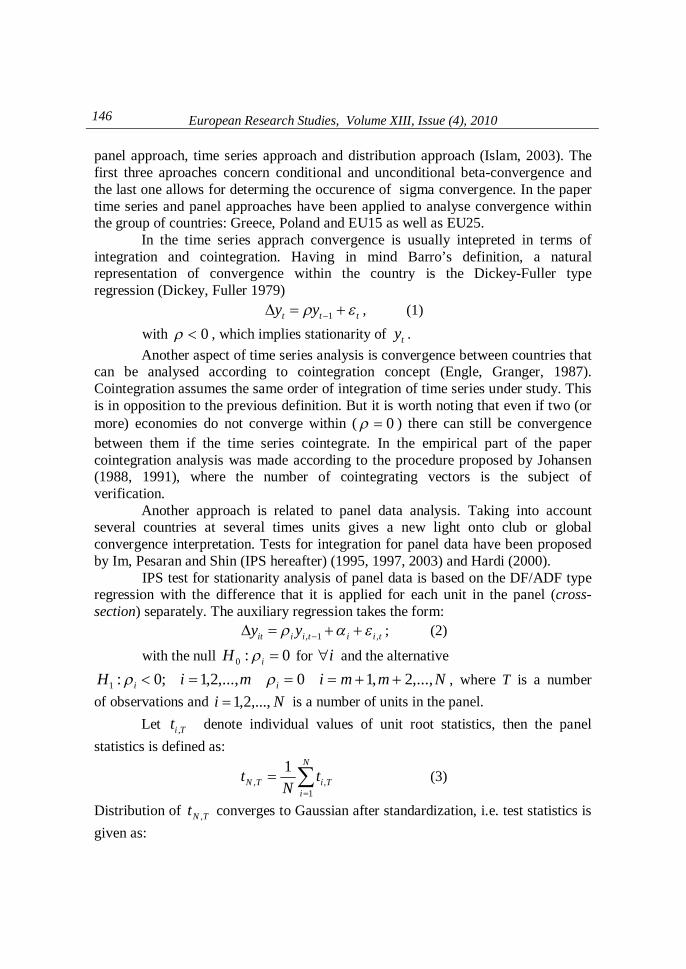
IPS test for stationarity analysis of panel data is based on the DF/ADF type regression with the difference that it is applied for each unit in the panel (cross-section) separately. The auxiliary regression takes the form:
tiitiiit yy ,1, ; (2)
with the null 0:0 iH for i and the alternative NmmimiH ii ,...,2,10,...,2,1;0:1 , where T is a number
of observations and Ni ,...,2,1 is a number of units in the panel. Let Tit , denote individual values of unit root statistics, then the panel
statistics is defined as:
N
iTiTN t
Nt
1,,
1 (3)
Distribution of TNt , converges to Gaussian after standardization, i.e. test statistics is given as:
Convergence of Greek Economy with the EU and some Comparisons with Polish Experience
147
)1,0(~
,
, NtVar
tEtN
Ti
iTTN . (4)
Monte Carlo estimates of )( ,TitE and )( ,TitV are published in Im, Pesaran and Shin (1997, 2003). It is important to notice, that rejecting the null hypothesis does not mean ‘no unit root in the panel’. It stands that at least one unit root in the time series collected in the panel cannot be accepted. In the case of autocorrelation of the error term ti, , the test statistics is modified in two versions, similarly to ADF test (see Im, Pesaran and Shin, 1997, 2003). The first one consists in applying the same structure of augmentations for each unit in the panel; the second allows including different structures of augmentations between units.
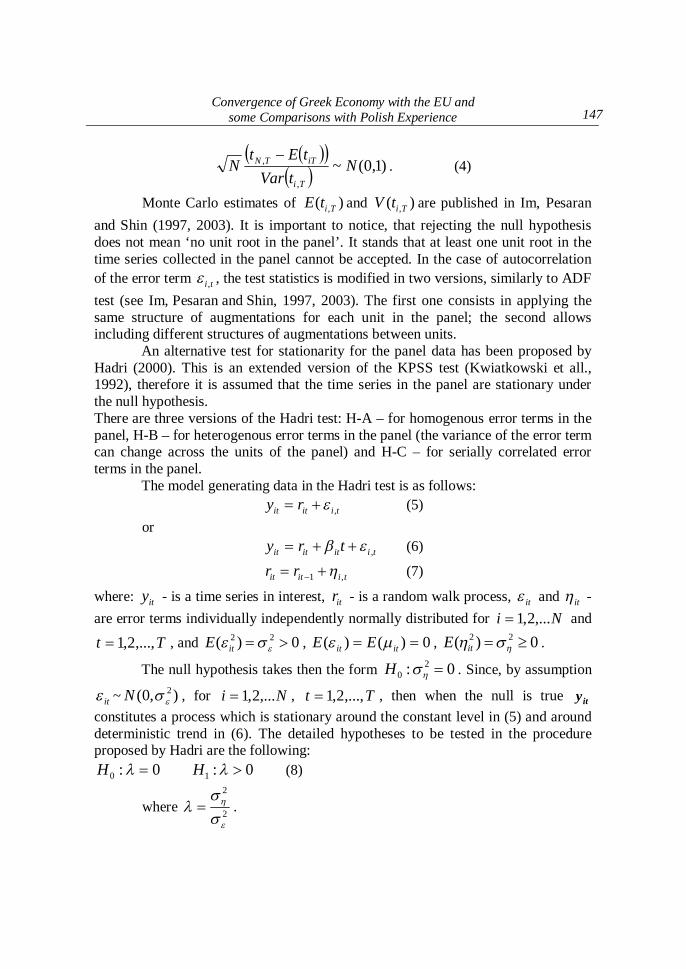
An alternative test for stationarity for the panel data has been proposed by Hadri (2000). This is an extended version of the KPSS test (Kwiatkowski et all., 1992), therefore it is assumed that the time series in the panel are stationary under the null hypothesis. There are three versions of the Hadri test: H-A – for homogenous error terms in the panel, H-B – for heterogenous error terms in the panel (the variance of the error term can change across the units of the panel) and H-C – for serially correlated error terms in the panel.
The model generating data in the Hadri test is as follows: tiitit ry , (5)
or tiititit try , (6)
tiitit rr ,1 (7)
where: ity - is a time series in interest, itr - is a random walk process, it and it - are error terms individually independently normally distributed for Ni ,...2,1 and
Tt ,...,2,1 , and 0)( 22 itE , 0)()( itit EE , 0)( 22 itE .
The null hypothesis takes then the form 0: 20 H . Since, by assumption
it ~ ),0( 2N , for Ni ,...2,1 , Tt ,...,2,1 , then when the null is true ity
constitutes a process which is stationary around the constant level in (5) and around deterministic trend in (6). The detailed hypotheses to be tested in the procedure proposed by Hadri are the following:
0:0 H 0:1 H (8)
where 2
2
.

148
European Research Studies, Volume XIII, Issue (4), 2010
Denoting by ^
it residuals from the regression 5 or 6, and assuming homogeneity of the error term in the panel, one-sided LM statistics is given as:
n
I
T
t itST
NLM
12
12
2
ˆ
11
(9)
where itS is a partial sum of residuals:
t
jijitS
1
^ , and
^2 is the consistent
estimator of the residual variance 2 . It is assumed that the test statistics is
sequentially convergent to Gaussian distribution when T - N and takes the following forms for regression (5) and (6), respectively:
)1,0(
ˆ2 N
MLNZ
jt
jtjtjt
and )1,0(ˆ2 NMLNZ
(10)
where jt , 2jt and , 2
denote the expected value and variance of specifically
defined random variables. The values of 451;
61 2
21 jtjt and
630011;
151 2
21 as well as the extensions of the test for the case of
heterogenous error terms as well as for serially correlated error terms are available in Hadri (2000).
The absence of unit roots in the panel supports the economic convergence hypothesis within considered group of economies while panel cointegration can be interpreted in terms of existence of common steady state for two (or more) panels of data. The tests for panel cointegration were introduced by Pedroni (1999, 2004). The mentioned tests were widely used in international statistics for empirical panel data analysis. For example, Dreger and Reimers (2005) have analysed a level of expenditures for the health care in OECD countries; Chontanawat (2008) has searched for cointegration between the energy consumption and GDP in developing Asian countries and Liu, Shumway, Rosenman and Ball (2008) have analysed conditional β-convergence of the growth of productivity in agriculture in 48 states of North America. Pedroni’s test for cointegration allows for individual constants and trend coefficients for each member of the panel. The following regression is estimated for testing purposes:
(11) for t = 1,2,…,T; i = 1,2,…, N; m = 1,2,…, M; where yit and xit are assumed to be I(1). Parameters and may vary individually for each panel member.
Convergence of Greek Economy with the EU and some Comparisons with Polish Experience
149
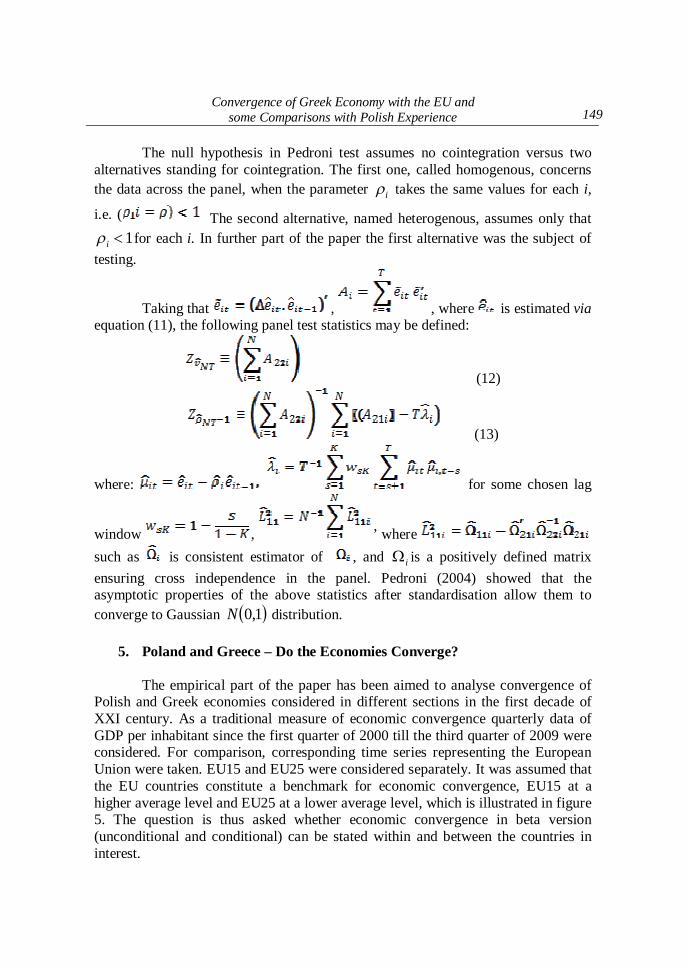
The null hypothesis in Pedroni test assumes no cointegration versus two alternatives standing for cointegration. The first one, called homogenous, concerns the data across the panel, when the parameter i takes the same values for each i,
i.e. ( The second alternative, named heterogenous, assumes only that 1i for each i. In further part of the paper the first alternative was the subject of
testing.
Taking that , , where is estimated via equation (11), the following panel test statistics may be defined:
(12)
(13)
where: for some chosen lag
window , ’ where such as is consistent estimator of , and i is a positively defined matrix ensuring cross independence in the panel. Pedroni (2004) showed that the asymptotic properties of the above statistics after standardisation allow them to converge to Gaussian 1,0N distribution.
5. Poland and Greece – Do the Economies Converge? The empirical part of the paper has been aimed to analyse convergence of
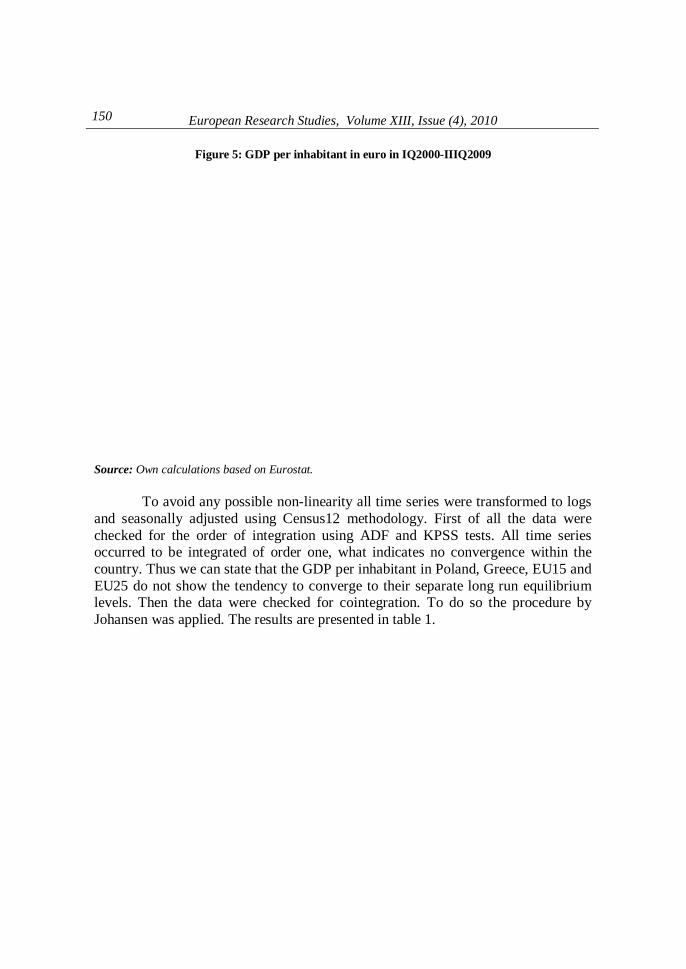
Polish and Greek economies considered in different sections in the first decade of XXI century. As a traditional measure of economic convergence quarterly data of GDP per inhabitant since the first quarter of 2000 till the third quarter of 2009 were considered. For comparison, corresponding time series representing the European Union were taken. EU15 and EU25 were considered separately. It was assumed that the EU countries constitute a benchmark for economic convergence, EU15 at a higher average level and EU25 at a lower average level, which is illustrated in figure 5. The question is thus asked whether economic convergence in beta version (unconditional and conditional) can be stated within and between the countries in interest.
150
European Research Studies, Volume XIII, Issue (4), 2010 Figure 5: GDP per inhabitant in euro in IQ2000-IIIQ2009
Source: Own calculations based on Eurostat.
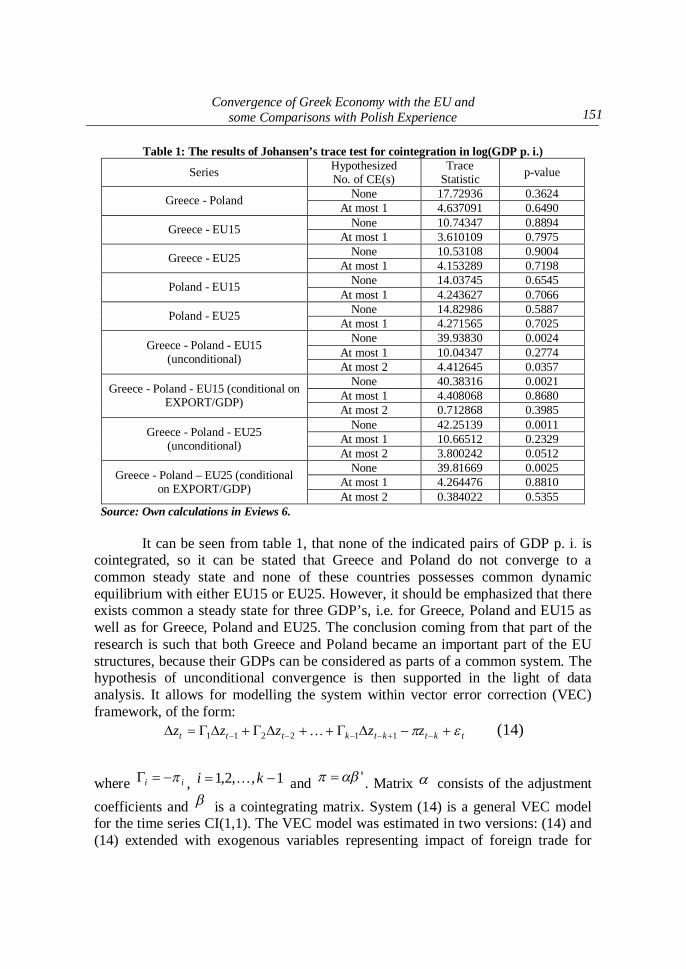
To avoid any possible non-linearity all time series were transformed to logs and seasonally adjusted using Census12 methodology. First of all the data were checked for the order of integration using ADF and KPSS tests. All time series occurred to be integrated of order one, what indicates no convergence within the country. Thus we can state that the GDP per inhabitant in Poland, Greece, EU15 and EU25 do not show the tendency to converge to their separate long run equilibrium levels. Then the data were checked for cointegration. To do so the procedure by Johansen was applied. The results are presented in table 1.
Convergence of Greek Economy with the EU and some Comparisons with Polish Experience
151
Table 1: The results of Johansen’s trace test for cointegration in log(GDP p. i.)
Series Hypothesized No. of CE(s)
Trace Statistic p-value
None 17.72936 0.3624 Greece - Poland At most 1 4.637091 0.6490 None 10.74347 0.8894 Greece - EU15 At most 1 3.610109 0.7975 None 10.53108 0.9004 Greece - EU25 At most 1 4.153289 0.7198 None 14.03745 0.6545 Poland - EU15
At most 1 4.243627 0.7066 None 14.82986 0.5887 Poland - EU25 At most 1 4.271565 0.7025 None 39.93830 0.0024
At most 1 10.04347 0.2774 Greece - Poland - EU15 (unconditional)
At most 2 4.412645 0.0357 None 40.38316 0.0021
At most 1 4.408068 0.8680 Greece - Poland - EU15 (conditional on EXPORT/GDP) At most 2 0.712868 0.3985
None 42.25139 0.0011 At most 1 10.66512 0.2329 Greece - Poland - EU25
(unconditional) At most 2 3.800242 0.0512 None 39.81669 0.0025
At most 1 4.264476 0.8810 Greece - Poland – EU25 (conditional on EXPORT/GDP)
At most 2 0.384022 0.5355 Source: Own calculations in Eviews 6.
It can be seen from table 1, that none of the indicated pairs of GDP p. i. is cointegrated, so it can be stated that Greece and Poland do not converge to a common steady state and none of these countries possesses common dynamic equilibrium with either EU15 or EU25. However, it should be emphasized that there exists common a steady state for three GDP’s, i.e. for Greece, Poland and EU15 as well as for Greece, Poland and EU25. The conclusion coming from that part of the research is such that both Greece and Poland became an important part of the EU structures, because their GDPs can be considered as parts of a common system. The hypothesis of unconditional convergence is then supported in the light of data analysis. It allows for modelling the system within vector error correction (VEC) framework, of the form:
tktktkttt zzzzz 112211 (14)
where ii , 1,,2,1 ki and ' . Matrix consists of the adjustment coefficients and is a cointegrating matrix. System (14) is a general VEC model for the time series CI(1,1). The VEC model was estimated in two versions: (14) and (14) extended with exogenous variables representing impact of foreign trade for
152
European Research Studies, Volume XIII, Issue (4), 2010
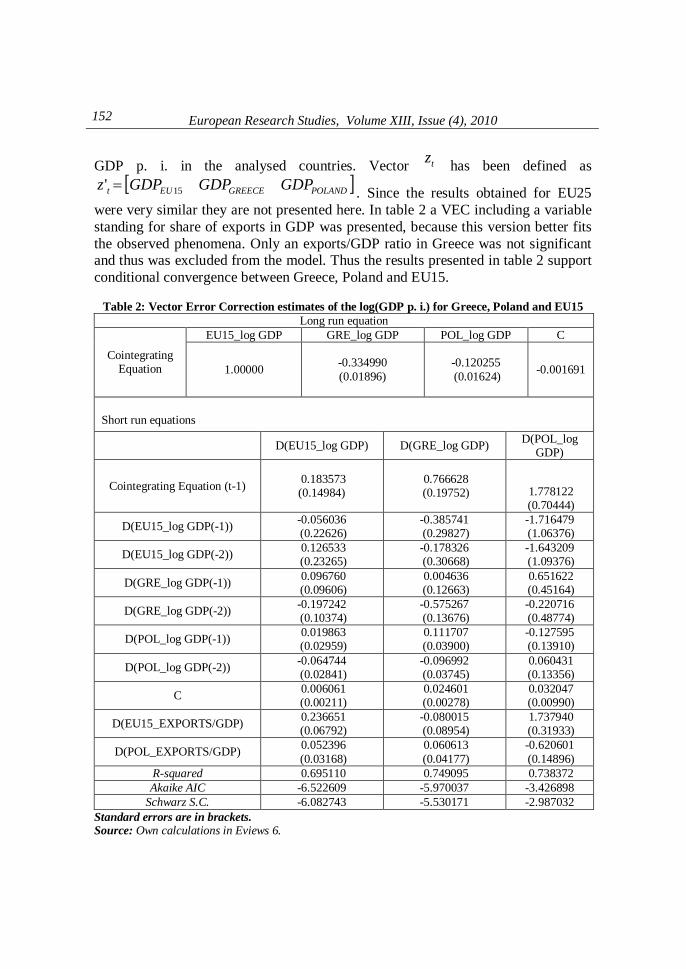
GDP p. i. in the analysed countries. Vector tz has been defined as POLANDGREECEEUt GDPGDPGDPz 15' . Since the results obtained for EU25
were very similar they are not presented here. In table 2 a VEC including a variable standing for share of exports in GDP was presented, because this version better fits the observed phenomena. Only an exports/GDP ratio in Greece was not significant and thus was excluded from the model. Thus the results presented in table 2 support conditional convergence between Greece, Poland and EU15.
Table 2: Vector Error Correction estimates of the log(GDP p. i.) for Greece, Poland and EU15
Long run equation EU15_log GDP GRE_log GDP POL_log GDP C
Cointegrating Equation 1.00000 -0.334990
(0.01896) -0.120255 (0.01624) -0.001691
Short run equations
D(EU15_log GDP) D(GRE_log GDP) D(POL_log GDP)
Cointegrating Equation (t-1) 0.183573 (0.14984)
0.766628 (0.19752) 1.778122
(0.70444)
D(EU15_log GDP(-1)) -0.056036 (0.22626)
-0.385741 (0.29827)
-1.716479 (1.06376)
D(EU15_log GDP(-2)) 0.126533 (0.23265)
-0.178326 (0.30668)
-1.643209 (1.09376)
D(GRE_log GDP(-1)) 0.096760 (0.09606)
0.004636 (0.12663)
0.651622 (0.45164)
D(GRE_log GDP(-2)) -0.197242 (0.10374)
-0.575267 (0.13676)
-0.220716 (0.48774)
D(POL_log GDP(-1)) 0.019863 (0.02959)
0.111707 (0.03900)
-0.127595 (0.13910)
D(POL_log GDP(-2)) -0.064744 (0.02841)
-0.096992 (0.03745)
0.060431 (0.13356)
C 0.006061 (0.00211)
0.024601 (0.00278)
0.032047 (0.00990)
D(EU15_EXPORTS/GDP) 0.236651 (0.06792)
-0.080015 (0.08954)
1.737940 (0.31933)
D(POL_EXPORTS/GDP) 0.052396 (0.03168)
0.060613 (0.04177)
-0.620601 (0.14896)
R-squared 0.695110 0.749095 0.738372 Akaike AIC -6.522609 -5.970037 -3.426898
Schwarz S.C. -6.082743 -5.530171 -2.987032 Standard errors are in brackets. Source: Own calculations in Eviews 6.
Convergence of Greek Economy with the EU and some Comparisons with Polish Experience
153
The parameters standing by error correction in the short run equation inform about the speed of catching-up with the joint equilibrium level. The coefficients’ estimates are statistically significant. Greece with the estimated parameter of quarterly adjustment 0,766 can be perceived as if it is tending to the average steady state of the system faster than EU15 countries and slower in comparison with Poland. On the other hand, Poland with the corresponding coefficient estimate of 1.778 is developing its inner standard of living very fast what gives positive perspectives for the nearest future.
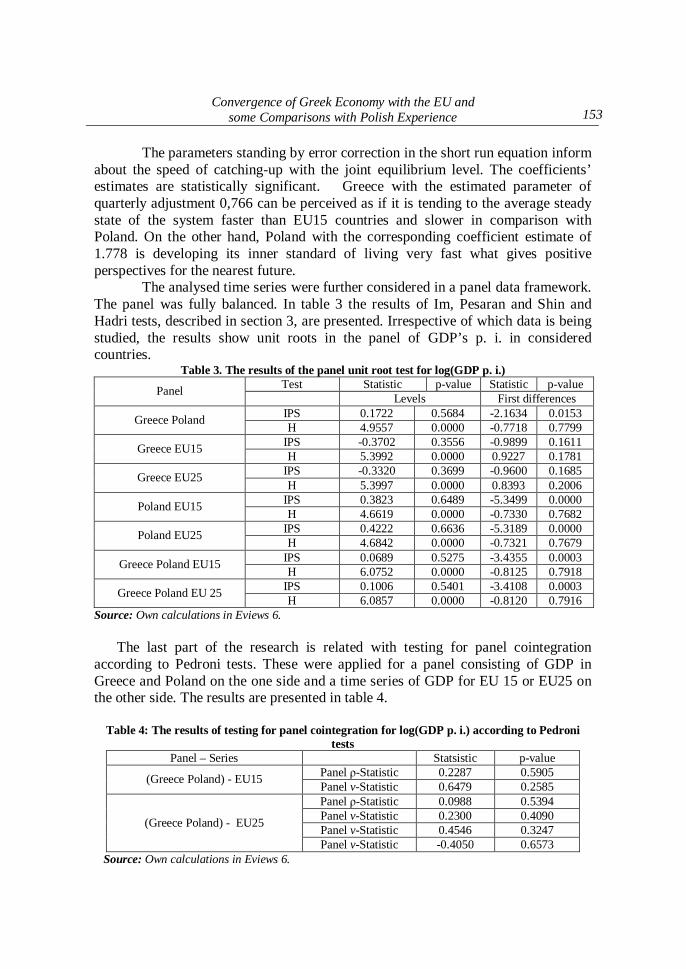
The analysed time series were further considered in a panel data framework. The panel was fully balanced. In table 3 the results of Im, Pesaran and Shin and Hadri tests, described in section 3, are presented. Irrespective of which data is being studied, the results show unit roots in the panel of GDP’s p. i. in considered countries.
Table 3. The results of the panel unit root test for log(GDP p. i.) Test Statistic p-value Statistic p-value Panel Levels First differences IPS 0.1722 0.5684 -2.1634 0.0153 Greece Poland H 4.9557 0.0000 -0.7718 0.7799 IPS -0.3702 0.3556 -0.9899 0.1611 Greece EU15 H 5.3992 0.0000 0.9227 0.1781 IPS -0.3320 0.3699 -0.9600 0.1685 Greece EU25 H 5.3997 0.0000 0.8393 0.2006
IPS 0.3823 0.6489 -5.3499 0.0000 Poland EU15 H 4.6619 0.0000 -0.7330 0.7682 IPS 0.4222 0.6636 -5.3189 0.0000 Poland EU25 H 4.6842 0.0000 -0.7321 0.7679 IPS 0.0689 0.5275 -3.4355 0.0003 Greece Poland EU15 H 6.0752 0.0000 -0.8125 0.7918 IPS 0.1006 0.5401 -3.4108 0.0003 Greece Poland EU 25 H 6.0857 0.0000 -0.8120 0.7916
Source: Own calculations in Eviews 6. The last part of the research is related with testing for panel cointegration according to Pedroni tests. These were applied for a panel consisting of GDP in Greece and Poland on the one side and a time series of GDP for EU 15 or EU25 on the other side. The results are presented in table 4.
Table 4: The results of testing for panel cointegration for log(GDP p. i.) according to Pedroni
tests Panel – Series Statsistic p-value
Panel ρ-Statistic 0.2287 0.5905 (Greece Poland) - EU15 Panel v-Statistic 0.6479 0.2585 Panel ρ-Statistic 0.0988 0.5394 Panel v-Statistic 0.2300 0.4090 Panel v-Statistic 0.4546 0.3247 (Greece Poland) - EU25
Panel v-Statistic -0.4050 0.6573 Source: Own calculations in Eviews 6.
154
European Research Studies, Volume XIII, Issue (4), 2010
As a result of Pedroni test the hypothesis of no cointegration cannot be
rejected, what implies no economic convergence between the panel consisting of Greece, Poland and EU15 or EU25.
6. Conclusions
In the paper the problem of economic convergence has been raised. Only
two countries were taken for analysis, which was caused by the interest in the dynamics of Greece and Poland mainly during the economic recession. The measure of economic convergence was traditionally GDP per inhabitant observed quarterly in 2000-2009. It was compared with the EU15 and EU25 average level. It has been emphasised that after a few years of positive economic growth, the last two years of global economic recession have changed the hitherto trends. However it has happened for different reasons and has different impact on the analysed economies. In 2008-2009 the GDP level decreased in the whole European Union and its rate of growth took negative values. The similar situation, deepened by internal problems with budget deficit could be observed in Greece. On the other hand Poland occurred as the only country with positive growth rate among the injured economies of developed and developing EU member countries.
The statistical and econometric analysis of economic convergence in beta version between Greece, Poland and the EU resulted in approving the unconditional and conditional hypotheses based on time series data (cointegration based on Johansens test) and rejecting the same hypotheses while data were collected into a panel (panel integration and cointegration tests). Although, the obtained results can be seen as dubious, cointegration within time series framework allowed estimating a VEC model for GDP p.i. The adjustment parameters show great speed of catching-up with the average European level generated by the Polish economy.
One of possible explanations of the lack of convergence is due to relatively short time series, but another one is related with the recession observed in the last years that violates the prevailing structure of the level of economic welfare. Rich countries of EU15 became poorer; the average countries like Greece, Ireland or Spain have many troubles, while the situation of developing ones is very complicated. The example of Poland is exceptional because its own currency, not stiffened with euro, supported by the standing of the national economy managed to weaken the strength of the global recession.
Convergence of Greek Economy with the EU and some Comparisons with Polish Experience
155
References
1. Barro R., Sala-i-Martin X., 1992, “Convergence”, Journal of Political Economy 100, 223-251.
2. Baumol W. J., 1986, “Productivity growth, convergence and welfare: What the long-run data show?”, American Review 76.
3. Carvalho, V. H. and A. C. Harvey, 2002, “Growth, cycles and convergence in US regional time series”, Faculty of Economics and Politics 26.
4. Chontanawat J., 2008, “Causality between Electricity Consumption and GDP in Asia Developing Countries”, The 2nd IAEE Asian Conference “Energy Security and Economic Development under Environmental Constraints in the Asia/Pacific Region (Perth, Western Australia).
5. Ciołek D., 2003, “Badanie konwergencji krajów Europy Środkowo-Wschodniej z wykorzystaniem danych panelowych” [in:] Dynamiczne modele ekonometryczne, (UMK, Toruń).
6. Ciołek, D., 2005, Konwergencja do Unii Europejskiej krajów w okresie transformacji, (Uniwersytet Gdański, Sopot).
7. Dickey, D.A. and W.A. Fuller, 1979, “Distribution of the Estimators for Autoregressive Time Series with a Unit Root,” Journal of the American Statistical Association, 74, p. 427–431.
8. Dreger, C. and H-E. Reimers, 2005, „Health care expenditures in OECD countries: a Panel unit root and cointegration analysis”, International Journal of Applied Econometrics and Quantitative Studies 2-2.
9. Evans P. and G. Karras, 1996, “Do Economies Converge? Evidence from a Panel of US States”, Review of Economics and Statistics 78, 384–388.
10. Hadri K., 2000, “Testing for stationarity in heterogenous panel data”, The Econometrics Journal 3, 148-161.
11. Im, K., H. Pesaran and Y. Shin, 2003, “Testing for unit roots in heterogenous panels”, Journal of Econometrics 115, 53-74.
12. Islam N., 2003, “What have we learned from the convergence debate?”, Journal of Economic Surveys 17, 309-362.
13. Jabłoński Ł., 2006, “Dylematy konwergencji ekonomicznej w warunkach globalizacji”, Nierówności społeczne a wzrost gospodarczy 8 (1) - Problemy globalizacji i regionalizacji 1, 235-251.
14. Johansen S., 1988, “Statistical analysis of cointegration vectors”, Journal of Economic Dynamics and Control 12, 231-254.
15. Johansen S., 1991, “Estimation and hypothesis testing of cointegration vectors in Gaussian vector autoregressive models”, Econometrica 59, 1551-1580.
16. Kliber P., 2007, “Ekonometryczna analiza konwergencji regionów Polski metodami panelowymi”, Studia Regionalne i Lokalne 1 (27), 74-87.
17. Kwiatkowski D., P. C. B. Phillips, P. Schmidt and Y. Shin, 1992, Testing the Null Hypothesis of Stationarity against the Alternative of a Unit Root. Journal of Econometrics 54, 159–178.
18. Liu, Y., C.R. Shumway, R.Rosenman and V.E. Ball, 2008, “Productivity Growth and Convergence in U.S. Agriculture: New Cointegration Panel Data Results”, School of Economic Sciences 4.
156
European Research Studies, Volume XIII, Issue (4), 2010
19. Malaga, K., 2004, “Konwergencja gospodarcza w krajach OECD w świetle zagregowanych modeli wzrostu”, (Akademia Ekonomiczna, Poznań).
20. Pantelis P. and E. Nikolopoulos, 2008, “FDI Attractiveness in Greece” International Advances in Economic Research 14, 90–100.
21. Pesaran, M.H. and Y. Shin, 1996, “Cointegration and speed of convergence to equilibrium”, Journal of Econometrics 71.
22. Plosser C. I., 1992, “The search for growth”, [in:] Policies for long-run economic growth, A symposium sponsored by the Federal Reserve Bank of Kansas City, (Jackson Hole, Wyoming).
23. Reza R. and K. Takanlou Zahra, 2008, “Evaluation of the Income Convergence Hypothesis in Ten New Members of the European Union. A Panel Unit Root Approach”, Panoeconomicus 2, 157-166.
24. Rubaszek M., 2009, “Economic convergence and the fundamental equilibrium exchange rate in Poland”, Bank i Kredyt 40 (1), 7–22.
25. United Nations Development Programme, 2009, “Human development indices”, (http://hdr.undp.org/en/media/HDR_2009_EN_Complete.pdf)
26. Varblane U. and P. Vahter, 2005, “An analysis of the economic convergence process in the transition countries”, (http://infutik.mtk.ut.ee/www/kodu/RePEc/mtk/ febpdf/febawb37.pdf, Faculty of Economics and Business Administration, Tartu University of Tartu).