Embed Size (px)
Citation preview

From Invention to Innovation: Conversion Ability in Product DevelopmentAuthor(s): Rajesh Chandy, Brigitte Hopstaken, Om Narasimhan and Jaideep PrabhuSource: Journal of Marketing Research, Vol. 43, No. 3 (Aug., 2006), pp. 494-508Published by: American Marketing AssociationStable URL: http://www.jstor.org/stable/30162421 .
Accessed: 11/11/2013 09:07
Your use of the JSTOR archive indicates your acceptance of the Terms & Conditions of Use, available at .http://www.jstor.org/page/info/about/policies/terms.jsp
.JSTOR is a not-for-profit service that helps scholars, researchers, and students discover, use, and build upon a wide range ofcontent in a trusted digital archive. We use information technology and tools to increase productivity and facilitate new formsof scholarship. For more information about JSTOR, please contact [email protected].
.
American Marketing Association is collaborating with JSTOR to digitize, preserve and extend access toJournal of Marketing Research.
http://www.jstor.org
This content downloaded from 152.3.152.120 on Mon, 11 Nov 2013 09:07:58 AMAll use subject to JSTOR Terms and Conditions
RAJESH CHANDY, BRIGITTE HOPSTAKEN, OM NARASIMHAN, and JAIDEEP PRABHU*
The ability to convert inputs into outputs is a critical determinant of success in many fields of endeavor. In this research, the authors study the ability of firms to convert ideas into products, that is, their conversion ability. Specifically, they address the question, Why are some firms better at conversion than others? In contrast to much of the existing literature, the authors propose that a strong focus on speed and on generating many ideas may actually hurt firms by lowering their conversion ability. The authors test their arguments on data between 1960 and 2001 from a cross-national sample of pharmaceutical firms. They find that firms vary widely in their ability to convert promising drug ideas into launched drugs. Firms with the highest conversion ability are those that (1) focus on a moderate number of ideas, in areas of importance, and in areas in which they have expertise and (2) deliberate for a moderate length of
time on promising ideas.
From Invention to Innovation: Conversion Ability in Product Development
The quest to convert inventions (promising ideas for products) into innovations (commercialized products) is a central feature of technological progress and economic growth. Firms, whether they work out of tiny garages or in sprawling research labs, sink much hard-earned capital to generate inventions and bring them speedily to market. Every stage of product development adds substantially (and cumulatively) to costs. These costs have large implications for firms, policy makers, and consumers.
For example, DiMasi, Hansen, and Grabowski (2003) estimate that the average research and development (R&D) cost for a new chemical entity launched in the U.S. pharma-
*Rajesh Chandy is Carlson School Professor of Marketing and an asso- ciate professor (e-mail: [email protected]), and Om Narasimhan is Assistant Professor of Marketing (e-mail: [email protected]), Carlson School of Management, University of Minnesota. Brigitte Hop- staken is Project Leader of Research, Daphne Communication Manage- ment, the Netherlands (e-mail: [email protected]). Jaideep Prabhu is Professor of Marketing, Tanaka Business School, Imperial Col- lege London (e-mail: [email protected]). The authors are grateful for valuable inputs from Ed Blair; Jane Ebert; Mike Houston; Akshay Rao; Alina Sorescu; Raji Srinivasan; Stefan Wuyts; and participants at the Euro- INFORMS Conference in Istanbul, Turkey, and at research seminars at Bocconi University, INSEAD, Maastricht University, the University of Minnesota, and the University of Texas at Austin. The authors appreciate the financial assistance provided by the University of Minnesota's Grant in Aid of Research program, the McKnight Business and Economics grant program, and the 3M Award for nontenured faculty. They thank Bill Hedg- cock, Raghunath Rao, and Aiwen Tan for their help in the data collection process. The order of authorship is alphabetical; the authors contributed equally to this research.
(c) 2006, American Marketing Association ISSN: 0022-2437 (print), 1547-7193 (electronic)
ceutical market is $802 million. Such estimates (see also DiMasi 2001; Hansen 1979) are frequently used in policy debates and decisions (see U.S. Congress, Congressional Budget Office 1994; U.S. Congress, Office of Technology Assessment 1993). Part of the reason these estimates are so large and controversial is that they take into account the cost of ideas that failed to make it to launch (Danzon, Nicholson, and Pereira 2003). On average, the odds of a promising idea making it past the various stages of drug development to eventual product launch are less than one in five.
However, the odds can vary substantially across firms. If this is indeed the case, estimates of development costs per launched product will also vary substantially across firms (see Stevens and Burley 1997). Efficiency in product devel- opment due to higher conversion rates can yield resource savings that can be reallocated in other ways, such as in lower prices, higher profits, or greater investment in future innovation. Yet differences in conversion rates are rarely discussed in policy debates. The implicit assumption appears to be that firms have little control over conversion rates, and all firms are subject to the same odds of conver- sion. The drivers of conversion ability remain a mystery, and research on the issue is rare.
This article studies conversion ability in the pharmaceuti- cal industry. We define "conversion ability" as a firm's abil- ity to translate a given idea into a launched product. As such, a firm is deemed to have high conversion ability if its likelihood of converting a given idea into a launched prod- uct is higher than that of other firms. We show that firms
Journal of Marketing Research 494 Vol. XLIII (August 2006), 494-508
This content downloaded from 152.3.152.120 on Mon, 11 Nov 2013 09:07:58 AMAll use subject to JSTOR Terms and Conditions
Conversion Ability in Product Development 495
vary dramatically in their conversion ability, and we address the question, Why are some firms better at conversion than others?
Part of the difficulty in answering questions about con- version is data availability for both inputs (i.e., promising ideas) and outputs (i.e., launched products). Greenley and Bayus (1994) review the literature on product launch and note that despite an extensive search, they were unable to find any empirical studies on why some products make it to launch and others do not (see also Scott Morton 1999; ThOlke, Hultink, and Robben 2001). The problem of data availability is even worse at the input stage. Empirical research on conversion requires data on the number of promising ideas in a firm. These data are exceedingly diffi- cult to quantify. Ideas are dispersed across many individuals and many areas within firms. Moreover, firms have highly varying propensities to record and report information on development projects. Failures are quickly forgotten and are difficult to track. For secrecy and policy reasons, many firms keep projects in development strictly under wraps, or deep inside a file drawer, as the case may be. For all these reasons, it is extraordinarily difficult to obtain comparable data across firms. Although researchers have noted the importance of conversion ability in contexts ranging from academia (Taylor et al. 1984) to advertising copy selection (Gross 1972) to chemicals (Stevens and Burley 1997), large-scale empirical research on conversion is almost impossible in most contexts.
The pharmaceutical industry is an important exception. Researchers have access to reliable data on both ends of the conversion process in this industry. On the output side, pharmaceutical regulatory bodies provide detailed data on all drugs that have been approved for launch within their areas of jurisdiction. On the input side, some institutional characteristics of the pharmaceutical industry facilitate the collection of accurate, comprehensive, and comparable data on the promising ideas in individual firms (Arundel and Kabla 1998; Cohen, Nelson, and Walsh 2000).
Moreover, product development is the lifeblood of the pharmaceutical industry. New drugs have dramatically affected the lives of many patients (Gambardella 1995) and the bank accounts of many shareholders (Sorescu, Chandy, and Prabhu 2003). Nevertheless, as we noted previously, drug development is an extraordinarily expensive proposi- tion, and converting promising ideas into launched drugs is no easy task.
Given strong pressures to innovate and bring forth a steady stream of launched products, many managers have gravitated toward two popular solutions: (1) generate larger numbers of promising ideas, and (2) increase the speed with which ideas are brought to market. Indeed, these pressures have spawned a vast literature in new product development on methods to increase idea generation (Sowrey 1987, 1990; Verhage, Waalewijn, and Van Weele 1981). An implicit assumption in the idea generation literature is that a greater number of ideas leads to greater innovation outputs.
A large body of literature has also addressed the advan- tages of bringing a product to market quickly (Choperena 1996; Griffin 1997; Kessler and Chakrabarti 1996). In the context of the pharmaceutical industry, for example, Getz and De Bruin (2000, p. 78) note that "by shortening devel- opment cycle time, companies can both extend patent- protected product sales and create ... time savings with
which they can generate sales, enter markets early and grow those markets quickly, and invest in future R&D initiatives." It is claimed that greater speed leads to the possibility of building brand loyalty, moving down experience curves faster, building channel relationships, and creating switch- ing costs (Schilling and Hill 1998).
However, we propose that a strong focus on speed and the generation of many ideas may actually hurt firms by lowering their conversion ability. By integrating research on problem solving (e.g., Davidson and Sternberg 2003; Duncker 1945) with variables studied in the product devel- opment literature, we argue and show empirically that the firms with the highest conversion ability are those that have (1) focus and (2) deliberation in their approach to product development.
THEORY We view the conversion of ideas into new products as a
problem-solving process (see Davidson and Sternberg 2003; Duncker 1945). In studying conversion ability, our focus is at the most disaggregate level, namely, on the like- lihood of conversion of each idea a firm pursues. We bring together research on problem solving and research on new product development to identify key drivers of conversion ability.
Research on problem solving in psychology and manage- ment suggests several factors that drive problem-solving ability (for a recent review, see Davidson and Sternberg 2003). Four of these factors intersect with variables in the product development context that we study herein: work- load, time pressure, expertise, and task importance. "Work- load" refers primarily to the number of tasks that are being solved at a given time (e.g., Bluedorn, Kaufman, and Lane 1992), "time pressure" refers to the time within which these tasks must be solved (Karau and Kelly 1992), "expertise" refers to the domain-specific knowledge that the problem solver brings to the task (Ericsson and Lehmann 1996), and "task importance" is the value attached to succeeding at a particular task (Sanchez and Levine 1989).
Each of these factors has a correlate in the new product development (conversion) context (see also Cooper, Edgett, and Kleinschmidt 2004; Griffin 1997; Henard and Szyman- ski 2001; Montoya-Weiss and Calantone 1994). Workload is a direct function of the number of ideas that the firm is attempting to convert at any given time. The greater the number of ideas the firm is working on, the greater is the workload (Barnett and Freeman 2001). Time pressure is a function of the speed with which the firm is attempting to convert ideas into products; the greater the speed for a given number of ideas, the greater is the time pressure on the firm (Crawford 1992; Kessler and Chakrabarti 1996). Firms also differ in the extent to which they have prior experience with certain domains or areas of knowledge; the greater their experience with certain areas of knowledge, the greater is the expertise they bring to tasks that involve those areas of knowledge. Finally, new product ideas differ in their com- mercial and technical importance; if some ideas are con- verted into new products, they are likely to be major inno- vations, with huge technical, marketing, and financial gains for the firm involved (Hall, Jaffe, and Trajtenberg 2000).
These four factors can be integrated under the umbrella of "focus" and "deliberation," and they form the drivers of conversion ability, which we study in this research. We sug-
This content downloaded from 152.3.152.120 on Mon, 11 Nov 2013 09:07:58 AMAll use subject to JSTOR Terms and Conditions
496 JOURNAL OF MARKETING RESEARCH, AUGUST 2006
gest that the firms with the highest conversion ability are those that focus (on a moderate number of ideas, on ideas of importance, and in the firms' areas of expertise) and delib- erate (by adopting a moderate level of speed in conversion). We develop specific hypotheses that link focus and delib- eration to conversion ability.
HYPOTHESES Deliberation in Conversion: Speed of Development and Conversion Ability
Considerable work in psychology and management has examined the role of time and time pressure on problem- solving ability in individuals and organizations (see Karau and Kelly 1992; Svenson and Maule 1993). Integrating these disparate findings suggests a nonlinear (inverted U-shaped) effect of speed on conversion ability. The inverted U-shaped effect we propose contrasts with that implied in the bulk of the literature on speed in product development, which emphasizes the benefits of increased speed and time pressure (Crawford 1992).
Research in psychology suggests many reasons to believe that too much time pressure can hinder problem solving. When time pressure is great, problem solvers resort to the use of heuristic rather than systematic problem solving, which can result in subpar outcomes (see Bettman, John- son, and Payne 1991). Moreover, decision makers may ignore crucial information (Bronner 1982) and fail to learn from mistakes (e.g., Luchins 1942). They also tend to emphasize negative information over positive information (Ben Zur and Breznitz 1981), and this emphasis may cause managers to drop projects before they are converted.
Conversely, research also suggests that too little time pressure hinders problem solving (see Karau and Kelly 1992; Svenson and Maule 1993). The literature on organi- zational decision making (e.g., Bourgeois and Eisenhardt 1988; Glazer and Weiss 1993) argues that this happens because managers may underweight both the time sensitiv- ity of information and the decisions that are time sensitive (Glazer and Weiss 1993). Moreover, they may make deci- sions based on obsolete information (Bourgeois and Eisen- hardt 1988). Finally, coordination is likely to be loose, and controls are likely to be lax (Pelz and Andrews 1966). For these reasons, decision makers may lack the urgency needed to concentrate on product conversion goals. Taking these two sets of arguments together, we propose that speed of conversion and, thus, time pressure have inverted U-shaped effects on conversion.
H1: Firms with either very high or very low emphasis on speed in product development have a lower likelihood of convert- ing a given idea than those with a moderate emphasis on speed.
Focus in Conversion Number of ideas and conversion ability. Having too
many ideas may be bad for conversion ability. As with speed and time pressure, prior research on problem solving implies a nonlinear (inverted U-shaped) effect of number of ideas on conversion ability (e.g., Barnett and Freeman 2001; Damos 1991). In turn, this suggests the importance to firms of focusing on a moderate number of ideas in the con- version process. (Note that because the optimum number of
ideas for a firm is likely to vary by its size, we control for this empirically by scaling our number-of-ideas variable by firm size in our empirical test. Throughout our conceptual discussion, we use "number of ideas" to mean this number per unit firm size.) On the one hand, some prior research implies that working on too many ideas at any given time is likely to reduce the conversion likelihood of any particular idea (see Pashler 1994). Capacity-sharing explanations for the effect suggest that working on too many tasks simulta- neously causes lower attention to any individual task (Navon and Gopher 1979). Bottleneck explanations argue that when multiple tasks need the same resources at the same time, bottlenecks arise, and all tasks are impaired (DeJong 1993; Pashler 1994). Cross-talk explanations argue that some tasks may produce outputs or side effects that are harmful to the processing of other tasks (Navon and Miller 1987). The deleterious effects of cross-talk become espe- cially severe as the number of tasks becomes larger (see Kinsbourne 1981). Overall, these arguments suggest that processing too many tasks at the same time is likely to lead to lower conversion.
On the other hand, prior research also implies that work- ing on too few ideas at any given time can lead to lower conversion ability. Working on too few ideas diminishes the spillovers in knowledge that can arise when several ideas interact (see Irwin and Klenow 1994; Udayagiri and Schuler 1999). Such spillover effects exist only when multi- ple ideas are considered simultaneously (e.g., Bluedorn, Kaufman, and Lane 1992; Hall 1983). Integrating these two sets of arguments, we propose that the number of ideas the firm is working on at any given time has an inverted U-shaped effect on conversion:
H2: Firms that work on either too many ideas or too few ideas have a lower likelihood of converting a given idea than those that work on a moderate number of ideas at a given time.
Expertise and conversion ability. The research on prob- lem solving suggests that expertise has a positive effect on conversion ability. First, experts perceive meaningful pat- terns that novices miss; specifically, experts can redefine and reclassify problems by noting underlying principles, whereas novices tend to classify problems on the basis of their surface features (see Chase and Simon 1973). Second, experts use their domain-specific knowledge to implement solutions with greater ease, thus freeing them to concentrate on the effectiveness of the solution strategies (Zimmerman and Campillo 2003). Third, experts have a finer ear for sig- nals (sometimes faint or noisy) received during the problem-solving process and thus are able to monitor per- formance more carefully. Moreover, they are able to antici- pate more accurately the outcomes of actions taken during the problem-solving process (Ericsson 2003). Therefore, they are better placed to determine whether the actions are working toward end goals and to make changes when nec- essary. Finally, experts tend to be less dissuaded by obsta- cles because they are better able to visualize ways around them (e.g., Bandura 1997). Taken together, these arguments suggest that increasing expertise increases a firm's conver- sion ability.
H3: Firms with ideas in their areas of expertise have a higher likelihood of converting these ideas than firms with ideas outside their areas of expertise.
This content downloaded from 152.3.152.120 on Mon, 11 Nov 2013 09:07:58 AMAll use subject to JSTOR Terms and Conditions
Conversion Ability in Product Development 497
Idea importance and conversion ability. As with expert- ise, research on problem solving suggests a positive effect of the importance of the ideas the firm is working on and its conversion ability. In turn, this suggests that firms should focus on converting important ideas; firms that do so will have higher conversion ability than those that do not. Although we recognize that importance is a complex variable that potentially includes technical, market, and financial dimensions, we do not make a distinction among these dimensions conceptually; rather, we assume that they all cause firms to behave similarly with respect to the con- version task.
Increasing the importance of tasks increases problem solvers' motivation to solve these tasks (e.g., Chaiken and Maheswaran 1994; Zimmerman and Campillo 2003). There are at least three reasons that important tasks are more likely to be completed (Locke 2000). First, task importance regulates the direction of action by focusing attention and activity on goal-relevant actions at the expense of other actions. Therefore, problem solvers make better judgments and increase the likelihood of successfully completing important tasks. Second, task importance affects the inten- sity with which problem solvers undertake goal-relevant actions. People put more energy into tasks that are impor- tant. They may also receive more positive feedback from others for working on important tasks than for working on unimportant tasks. Third, task importance affects the per- sistence of actions. When problem solvers are faced with important tasks, they sustain their efforts over time and in the face of difficulty (LaPorte and Nath 1976). For these reasons, we hypothesize the following:
H4: Firms with more important ideas have a higher likelihood of converting these ideas than firms with less important ideas.
In summary, H1-H4 predict that firms with the highest conversion ability are those that (1) focus on a moderate number of ideas, on ideas of importance, and on ideas in their areas of expertise and (2) deliberate by adopting a moderate level of speed in product development. Little research in management has explicitly argued for or tested the predictions implicit in our hypotheses. Moreover, we know of no work in the new product development literature that empirically examines the factors that drive conversion ability. To fill this gap, we now turn to an empirical test of our hypotheses that links focus and deliberation to conver- sion ability.
METHOD
Empirical Context The pharmaceutical industry provides an especially suit-
able context in which to test our hypotheses. In the United States, the Food and Drug Administration (FDA) regulates the pharmaceutical industry closely, documenting every stage of the drug development process. In other countries, equivalent government bodies provide a similar regulatory framework within which pharmaceutical firms operate. Therefore, the pharmaceutical industry provides a unique source of reliable data on the inputs and outputs of the con- version process.
Limiting the empirical context of our study to one spe- cific industry eliminates cross-industry factors as possible explanations for differences in conversion ability. We do not
deny that cross-industry factors may be relevant. However, the focus of this study is on firm-specific differences that cause some firms to convert better than others. Studying one industry helps us focus on this objective and reduces concerns about internal validity.
Our sample is based on all drug patents from 1980 to 1985. We obtained this information from the Pharmapro- jects database. We examine the primary patents associated with all drugs during our sample period. The total number of such patents is 1573. Of these patents, only 18.30% were eventually converted to drugs, reinforcing our point about the demanding nature of the conversion task. We apply two additional filters to arrive at our final sample. First, we eliminate firms with two or fewer primary drug patents in the 1980-1985 period. We do this to reduce the possibility of conversion due to idiosyncratic events, to focus on firms that have a sustained history of product development, and to account for firm-specific unobserved heterogeneity. Sec- ond, we drop patents that were acquired from another firm, whether through licensing or acquisition. We do this because it would be incorrect to draw conclusions about a firm's ability to convert products it did not create in the first place.
There are at least two important reasons for dropping such patents. First, it is often unclear at what stage the licensor or acquirer obtained the patent. Thus, it might well be that the patent was acquired or licensed very close to conversion. In such a case, though it could be said that the acquirer firm's picking ability is high, little could be said about its conversion ability. A related issue is that there are fundamental differences between licensing and acquisition. The choice of which patents to license is often highly selec- tive, and in general, an acquisition leads to the acquiring firm gaining access to the entire portfolio of the acquired firm, important and unimportant patents alike. As such, comparing conversion abilities across such different sam- ples can be meaningless. A second concern is a practical one; if we were to include licensed and acquired patents, it would be unclear which firm we should consider for the purposes of measuring our explanatory variables. Was it the firm that generated the idea and perhaps initiated the process of conversion, or was it the firm that finally com- pleted the task? It is difficult to understand how either choice could be based on anything but subjective criteria.
These filters lead to a sample of 654 ideas developed by 88 firms. However, the need to account for the resource endowments of firms (both as a direct covariate and as a normalizing factor for the number of ideas variable, as we discuss in greater detail subsequently) and the lack of avail- ability of such data further reduces our sample to 322 drug ideas developed by 38 firms. This is our final sample, for which we have data on all variables of interest. Note that results for both the larger sample and the final sample that we report in the rest of the article are very similar (albeit with slightly different variables; e.g., the larger sample does not normalize the number of ideas with a firm's resources). Testing our hypotheses entails compiling data on this sam- ple of drugs and the firms associated with them from seven different databases (see Table 1). The following paragraphs describe these in greater detail.
Conversion. We measure conversion as a binary variable, that is, whether or not an idea (drug patent) was converted to an actual drug launched anywhere on the world market
This content downloaded from 152.3.152.120 on Mon, 11 Nov 2013 09:07:58 AMAll use subject to JSTOR Terms and Conditions
498 JOURNAL OF MARKETING RESEARCH, AUGUST 2006
Table 1 VARIABLES AND DATA SOURCES
Number of promising ideas Number of primary drug patents owned by the firm, normalized by log(assets)
Expertise Overlap in therapeutic areas between patented drug and firm's drug portfolio (number of drugs in area)
Idea importance Total number of forward citations for patented drug
Control variables Idea novelty: total number of backward citations for patented drug (reverse coded)
Priority country Primary therapeutic code Resources (rolling window)
.Net income
.Net sales
.Assets
.R&D expenditures
Conceptual Variable Measure
Conversion Conversion of patented ideas into launched drugs
Speed Number of days from patenting of drug idea to drug approval (reverse coded)
Data Source
Pharmaprojects FDA Orange Book
Pharmaprojects FDA Orange Book
Pharmaprojects Delphion
Pharmaprojects
Delphion
Delphion
Pharmaprojects Pharmaprojects Worldscope
COMPUS TAT Million Dollar Directory
Principal International Businesses
by the end of 2001. We obtained this information from the Pharmaprojects database. This database identifies and mon- itors the progress of all new drug applications. In particular, it follows each application through the various stages of drug development and testing up to market launch or dis- continuation. We cross-check data from Pharmaprojects by examining FDA approval dates for U.S.-launched drugs as reported in the FDA Orange Book; the correspondence between these two sources is almost perfect.
The conversion of an idea by a firm deals with the proba- bility that the firm converts a particular idea into a launched drug. An alternative metric of conversion would be a pro- portion between 0 and 1 that measures the number of ideas the firm converts. However, this seemingly obvious meas- ure suffers from several drawbacks. First, the probability of any idea being converted depends on both firm-specific and idea-specific factors. A measure of conversion ability at the
firm level would not be able to capture any idea-specific factors; if anything, such a measure would overemphasize the role of firm-specific factors. Our measure avoids this error and accounts for both idea-specific and firm-specific factors. Second, conversion modeled at the idea level is at its most disaggregate; aggregating across diverse ideas and over different periods risks the introduction of biases for which we cannot control.
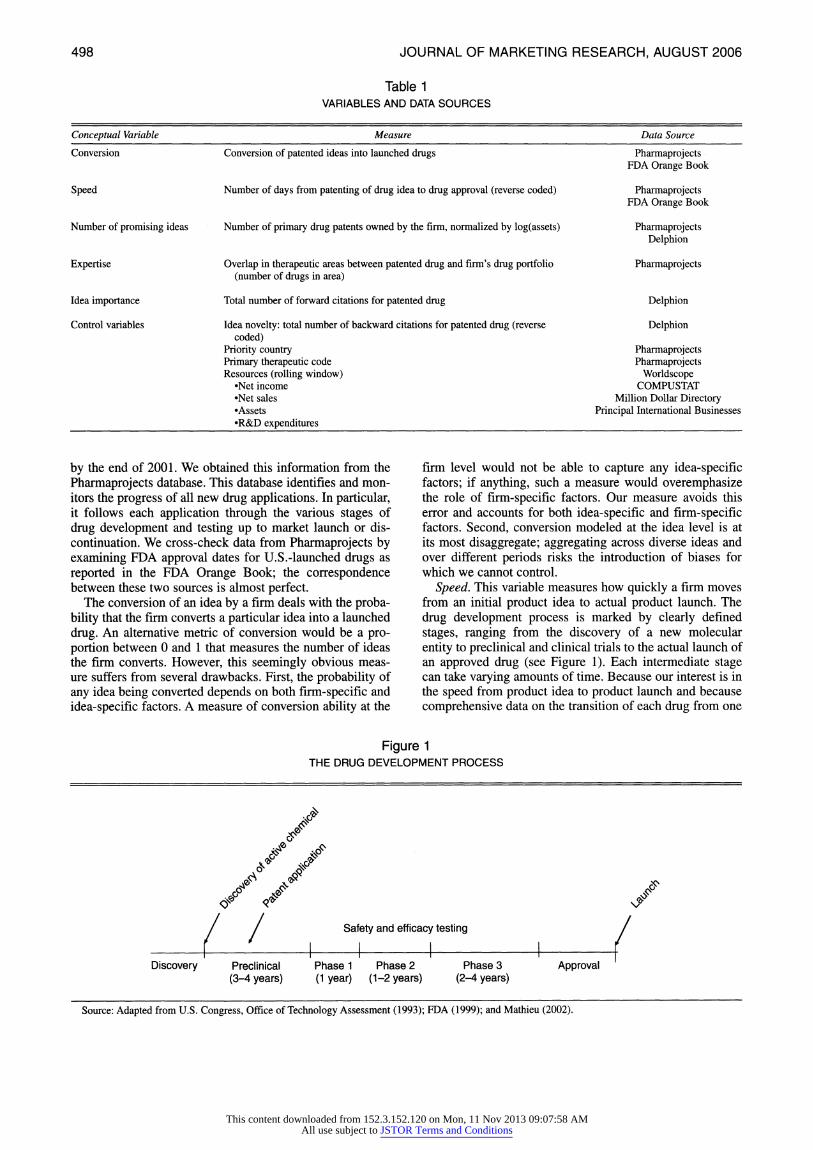
Speed. This variable measures how quickly a firm moves from an initial product idea to actual product launch. The drug development process is marked by clearly defined stages, ranging from the discovery of a new molecular entity to preclinical and clinical trials to the actual launch of an approved drug (see Figure 1). Each intermediate stage can take varying amounts of time. Because our interest is in the speed from product idea to product launch and because comprehensive data on the transition of each drug from one
Figure 1 THE DRUG DEVELOPMENT PROCESS
Safety and efficacy testing
Discovery Launch
Discovery Preclinical Phase 1 Phase 2 Phase 3 Approval (3-4 years) (1 year) (1-2 years) (2-4 years)
Source: Adapted from U.S. Congress, Office of Technology Assessment (1993); FDA (1999); and Mathieu (2002).
This content downloaded from 152.3.152.120 on Mon, 11 Nov 2013 09:07:58 AMAll use subject to JSTOR Terms and Conditions
Conversion Ability in Product Development 499
intermediate stage to another are unavailable, we do not examine the time taken in each intermediate stage; rather, we consider only the total time taken.
At the level of the individual idea, speed can be measured in a reverse-coded manner as the number of days it takes to move from the filing of a patent to the first launch of the product anywhere in the world. This assumes that the date of filing a patent is synonymous with the birth of a product idea. There are other potential ways to identify the birth of a product idea. It would be ideal to identify the date of the original flash of insight on the part of the scientist or R&D team involved. However, even if there were unlimited access to such people, querying them retrospectively would be unlikely to produce reliable data. An analogy to academ- ics is illustrative. Who can recall the exact (or even approx- imate) date that an idea for a paper was born? Even if a par- ticular respondent were to remember the date of the birth of a particular idea, it is unlikely that we would be able to identify precisely the date of birth of every idea in our sam- ple. People move on, memories fade, and the origins of ideas get lost in the mists of time.
The patent-filing date provides an objective measure of the birth of an idea that is readily available to researchers. A criticism of this measure could be that not many ideas are patented. However, this is not the case in the pharmaceuti- cal industry, in which promising ideas are patented at very high rates, ranging from 79.2% in Europe to 95.5% in the United States (Arundel and Kabla 1998; Cohen, Nelson, and Walsh 2000). Because we do not observe the date of the original flash of insight, it is important to ensure that the duration from inception to patenting is not excessively large and that there are no systematic variations in this duration across firms or patents. Dranove and Meltzer (1994, p. 405), who address this point in the context we study, note that "it seems plausible that ... long times to approval might provide an incentive for firms to delay patent application somewhat in order to postpone the date of patent expiration. We raised this issue with several individuals within the pharmaceutical industry and found no one who was aware of such behavior." Another criticism of this measure could be that ideas vary in the extent to which they need work and time to be converted into products. We acknowledge that our measure does not control for this variance.
For all the aforementioned reasons, patent-filing dates provide a reasonable proxy for the birth of a promising idea in our research context (Dranove and Meltzer 1994). We use the worldwide priority filing date associated with the pri- mary patent for each drug idea as our measure of the birth of an idea. We obtain this data from Pharmaprojects, the Delphion database, and the FDA Orange Book.
Although speed can be operationalized in this manner for each individual idea, recall that our interest in testing H1 is to determine the impact of a firm's focus on speed on its conversion ability. To create a firm-level measure, we exam- ine all drugs launched by a firm in the 20-year period before the start of our sample period (i.e., before 1980). We calcu- late the average speed of conversion for all these drugs and call this variable the speed of a firm (we use data on 603 drugs in total to compute speed for our sample).
There are at least two advantages to operationalizing speed in the manner we describe. First, this helps us over- come the problem of measuring speed for ideas that have been abandoned and, thus, not converted. Effectively, such
ideas are "infinitely slow," or have a speed of zero. This problem could be solved if it was known precisely when a particular idea was abandoned. However, such data are almost impossible to find, and when they exist, they are extremely noise prone and subjective. This suggests that a measure of speed at the idea level would be of little use for the vast majority of ideas (approximately 80%), which are not converted successfully. Second, by measuring speed using data from a presample calibration period, we avoid the contamination that would be inherent in using the same patents to compute both conversion and firm speed. We also conduct additional analyses with calibration periods that began 15 and 30 years before the start of our sample period; our results remain essentially unchanged. To check the robustness of our measure further, we calculated the aver- age firm speed for the period 1980-2000 (using only launched drugs). This measure gives us an average of 9.60 years to conversion versus an average of 9.47 years for our current measure (which we calculated using a sample 20 years before 1980). The standard deviation of speed to con- version in the sample period (1980-2000) is 1.62 years ver- sus 1.73 years in the sample we actually use. Furthermore, we conducted a two-sample t-test to determine whether the differences between the speed numbers in the 1980-2000 period were significantly different from those we use in our estimation. We cannot reject the hypothesis of no difference at any reasonable significance level (p > .75). This gives us confidence that our measure of speed indeed captures the construct we study.
Number of promising ideas. There are several ways to measure the notion of a promising idea. The most obvious way is to ask people who actually work in the industry. However, there are several problems with such an approach. First, human memory is selective; ideas that were eventu- ally converted are more likely to be viewed in hindsight as having been the most promising. The selective nature of memory would introduce a systematic bias into data obtained in this manner. Second, ideas that do not progress beyond a certain minimum stage in the development process are likely to go unrecorded and be eventually for- gotten. Third, relying on a subjective interpretation of what is "promising" is likely to be ambiguous. At what stage should the idea have shown promise for it to be rated as such?
To avoid these problems, we use primary drug patents to measure the number of promising ideas a firm is working on converting at a given point. As we noted previously, patents are an excellent proxy for new product ideas in the pharmaceutical context, given the extremely high patenting rates in the industry. Moreover, every drug idea has a pri- mary patent associated with it, and information on all granted patents is recorded and publicly available, which adds credibility and verifiability to our results.
For every idea in our sample, we compute the number of other patented ideas the firm is simultaneously working on from the time the focal idea is first patented to the end of a firm-specific window. This window is equal to the firm's speed. Thus, if a firm's speed is eight years and the focal idea is patented in 1981, we would consider all ideas that the firm had from 1981 to 1988, inclusive. We construct similar rolling windows for every patent idea for every firm. Furthermore, because large firms are more likely to have the capacity to work on more ideas at any one time than
This content downloaded from 152.3.152.120 on Mon, 11 Nov 2013 09:07:58 AMAll use subject to JSTOR Terms and Conditions
500 JOURNAL OF MARKETING RESEARCH, AUGUST 2006
small firms, we divide the number of ideas by a measure of the firm's resources. We use the log of the firm's assets (more precisely, a six-year rolling window of the firm's assets) as the normalizing factor. (Analyses using a nonnor- malized measure of number of ideas yield qualitatively similar results.) In the following discussion, all references to the number-of-ideas variable are to the normalized meas- ure of number of ideas. We obtained the information neces- sary to construct this variable from the Pharmaprojects, Delphion, Worldscope, Million Dollar Directory, COMPU- STAT, and Principal International Businesses databases.
Expertise. Drug development is a knowledge-intensive process that requires high levels of expertise. Therapeutic categories differ greatly, and success in, for example, devel- oping drugs to combat diabetes rarely translates into a competitive advantage in developing antiviral drugs. For this reason, firms differ greatly in their conversion ability. For example, Merck is renowned for its expertise in cardio- vascular ailments, and GlaxoSmithKline is well known for its expertise in infectious diseases (The Economist 1998).
The variable of interest to us is the extent to which a firm has prior expertise in the therapeutic categories relevant to the focal patent in question (i.e., the patented idea the firm wishes to convert into a product). To measure this, we first need to measure a firm's expertise. We measure expertise by constructing an array of all the therapeutic categories in which the firm has ideas in development or on the market during our 20-year calibration period (again, 15- and 30- year calibration periods yield similar results). We use the Pharmaprojects therapeutic classification system to develop this array. The Pharmaprojects classification is a hierarchi- cal system that classifies drugs by the disease area on which they exert their effect. The system covers the entire spec- trum of therapeutic areas (there are 197 categories in total) and is tailored specifically to drugs in R&D. We compare the categories of expertise of the firm, which we obtained using the previously described method, with the therapeutic categories of the patent itself. We then compute a weighted sum of the overlapping categories using the number of drugs owned by the firm in that category as weights for each category. The higher this number, the greater is the firm's expertise that is relevant to the conversion of the focal patent. Admittedly, this measure of expertise ignores the types of process skills that firms may have for commer- cializing patents. We attempt to capture such skills through the unobserved heterogeneity component of our empirical model, which we describe in greater detail subsequently.
Idea importance. A large body of prior literature has sug- gested that important ideas can be identified by the number of forward citations they receive; specifically, the greater the number of forward citations, the higher is the impor- tance of the original idea (Griliches 1984; Jaffe, Trajten- berg, and Henderson 1993). Forward citations have a pre- cise definition in the patent context; they refer to the number of times the focal patent has been cited by other patents. This measure has the following merits: First, it is objective and readily available. Second, market and institu- tional forces ensure that this number is neither inflated nor understated. It is not inflated because no firm has an incen- tive to cite another patent if it is not necessary to do so. Indeed, the more patents a firm cites in its own patent, the smaller is the scope of the monopoly of its own patent. Fur- thermore, this measure is not understated, because the
patent examiner checks firms' tendencies to understate by ensuring that they cite all patents that represent the prior art. The tension between the incentives of firms not to overstate and the incentives of the patent examiner to guard against understatement ensures that our measure accurately reflects an idea's importance. We obtained the data for this measure from the Delphion database.
There are several issues to clarify regarding the use of our measure of importance. First, a potential drawback of this measure is that forward citations are available after the fact, whereas importance, according to our conceptualiza- tion, has a role at the time the idea is patented. However, the firm (and other interested parties) can be viewed as having ex ante conjectures about the importance of an idea. It is reasonable to suppose that absent systematic bias, the firm's conjectures are likely to be closest to the true mean, which our measure represents.
Second, forward citations follow a temporal distribution with some heterogeneity. The implication of this is that the number of citations can be greatly influenced by when we choose to measure them. To understand this, suppose that Idea A is patented in 1980, and Idea B is patented in 1985, and suppose we measure their importance in 1988. Idea A has had 8 years to collect forward citations, whereas B has had only 3 years. Even if A and B are equally important ideas, our measure would erroneously identify A as more important. This possible bias arises because of the temporal right truncation of our sample. In our case, we measure cita- tions through 2002, which amounts to a period of more than 17 years. The length of our period minimizes concerns about bias due to right truncation.
A third issue with our measure of importance is that of reverse causality. Our hypothesis suggests that more impor- tant ideas (those that are cited more) are more likely to be converted. However, it could be argued that it is precisely because patents are converted that they are cited more. To understand this, suppose Patent A was filed in 1980 and converted in 1990. Suppose also that the patent received 10 forward citations by 1990 and 50 citations overall (i.e., by 2002, the end of our sample period). It could be argued that the bump upward due to conversion (the "bump ratio") is the ratio of the number of citations after conversion to the number of citations before conversion (i.e., 40/10 = 4). If such a bump exists, it would exist only for converted patents; no such bump should be found for patents that were not converted.
As a check, we compare the bump ratio for converted patents with an equivalent ratio for nonconverted patents. For the latter, we use the mean number of years to conver- sion for the entire sample as the bump cutoff point. If there is a significant bump due to conversion, the bump ratio for converted patents should be significantly greater than that for nonconverted patents. We find that this is not the case; the bump ratios for converted and nonconverted patents are .62 and .70, respectively.
As a further robustness check, we create another impor- tance measure that adjusts the preceding measure by the respective bump ratios for converted and unconverted ideas. Essentially, to obtain a measure that is "uncontaminated" by the impact of conversion, we need to count citations until the point of conversion. This requires multiplying the for- ward citation numbers for converted and nonconverted patents by .38(= and .30(= respectively.
This content downloaded from 152.3.152.120 on Mon, 11 Nov 2013 09:07:58 AMAll use subject to JSTOR Terms and Conditions
Conversion Ability in Product Development 501
We find that our results for idea importance are robust to this alternative measure of importance. Control Variables
To control for various effects on conversion ability beyond those we hypothesize, we develop several control variables. We discuss these next.
Novelty of ideas. We measure the novelty of an idea by computing the number of backward citations that the patent associated with the idea uses (Hall, Jaffe, and Trajtenberg 2000). Higher backward citations imply lower novelty.
Country heterogeneity. There are considerable differ- ences in the drug regulatory environment across countries. There may also exist other unobserved factors that make it easier to convert drugs in some countries than in others. In all, we have four country-based categories: Japan, United States, Europe, and Other. We compute an index of each firm's propensity to launch in a particular regulatory envi- ronment by measuring the percentage of previous launches by the firm in each of these country categories. Thus, although we have four categories, each of the categories is a number between 0 and 1, with the categories summing to 1. For example, if a firm had four products and the locations of first launch for these products were Japan, the United States, Europe, and Other, respectively, this firm would have .25 as its propensity in each of the country categories. Note that this measure does not refer to the idea in question, because the vast majority of the ideas in our sample have not been launched; the firm-level propensity refers to previ- ous launches by that firm.
Primary therapeutic category. It is conceivable that the probability of conversion of an idea can vary significantly across therapeutic categories. To control for such variation and still preserve degrees of freedom, we use a more aggre- gate version of the Pharmaprojects classification system than the one we use to develop our expertise measure. Pharmaprojects employs a system developed by the Euro- pean Pharmaceutical Market Research Association to aggregate the entire spectrum of therapeutic areas (197 in total) and create 17 therapeutic groups, each representing a broad disease area or the body compartment affected (e.g., alimentary, cardiovascular). We operationalize therapeutic categories as 16 dummy variables that correspond to these therapeutic groups.
Resources. We use assets to measure firm resources. Because drug development takes considerable time (on average, 6-10 years), we need to consider the firm's resources not only at the time of idea generation but also into the future over the process of conversion. To do this, we create variables with rolling windows. For example, for a patent in 1980, we calculate the average assets of the firm to which the patent belonged for the 6-year period (1980- 1985). As a robustness check and to account for the consid- erable variance in conversion times, we also created 9- and 13-year rolling window measures.
Time. To control for the effects of time, we create dummy variables for each of the six years that constitute our sample period (1980-1985). Model Specification
Recall that we define conversion ability as a firm's ability to translate a promising idea into a launched product. Therefore, our dependent variable is dichotomous, namely,
whether an idea is converted to a launched product or not. Accordingly, we use a discrete choice specification, that is, a logit specification. The logit model has been widely used in marketing to model discrete outcomes. Formally, the model specification can be written as (Greene 2000) y if y* > 0 (i.e., converted), and y = 0 if y* 5_ 0, where y* repre- sents the net benefit of conversion associated with product j from firm i in period t and is given by (1)
=130 Two remarks are in order about this specification. First, given the nature of our dependent variable, a possible com- plication here could be the presence of right censoring; that is, it might be that an idea is still in the process of conver- sion and cannot really be counted as "not converted." We examined our data closely and determined that only seven drugs in our sample (1.07% of the total) were still in the preclinical or clinical trial stages at the end of our study period (2001). As such, right censoring is not a major issue, and we do not account for it in our model. Second, our specification aims to be as general as possible, while con- forming to our theoretical arguments. The quadratic specifi- cation for the speed and number-of-ideas measures is dic- tated by theory, and the logarithmic specification for the other variables ensures generality.
The probability of observing a conversion by firm i of product j in period t is
(2) Pr(yiit = 1) = Pr(yllt > 0) = F(33'Xi1t).
If we assume the ciit are distributed with an extreme value distribution, we obtain the logit specification with
(3) Liit
This specification assumes that the parameters are homoge- neous across firms. However, unobserved factors could also affect firm behavior. For example, we have not measured managerial ability differences between firms; however, this could have a significant impact on conversion ability. We can control for such firm-specific heterogeneity by specify- ing a random intercept. A similar argument can be made for each of the coefficients. For example, the impact of speed on the probability of conversion might differ across firms. This might be because some firms are better organized to deal rapidly with changing technological conditions, whereas others are not. These intangible and unobservable processes constitute the heart of firm-specific differences in the resource-based view of the firm, and it is vital that we
This content downloaded from 152.3.152.120 on Mon, 11 Nov 2013 09:07:58 AMAll use subject to JSTOR Terms and Conditions
502 JOURNAL OF MARKETING RESEARCH, AUGUST 2006
account for such differences. We do so by using a random coefficients specification (Revelt and Train 1998). If the parameters [3 are distributed as f((310), we have
(4) fLut(p)f(Rio)dp. In line with prior literature, we assume that the param-
eters are distributed as N(f3, E) (i.e., with mean vector (3 and covariance matrix E). The likelihood function is given as Li(8) = llfItLit((3), and the log-likelihood function is
(5) in[Li(0)].
We estimate our model by maximizing this log-likelihood function.
RESULTS
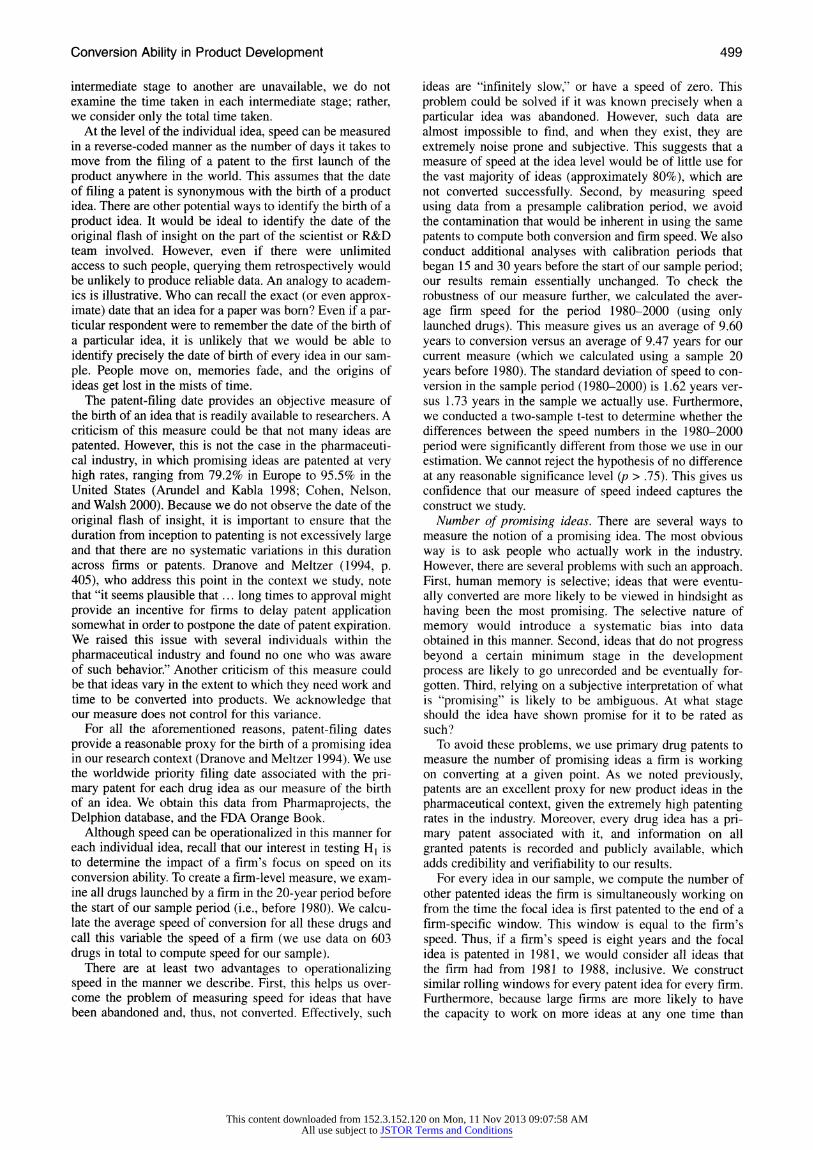
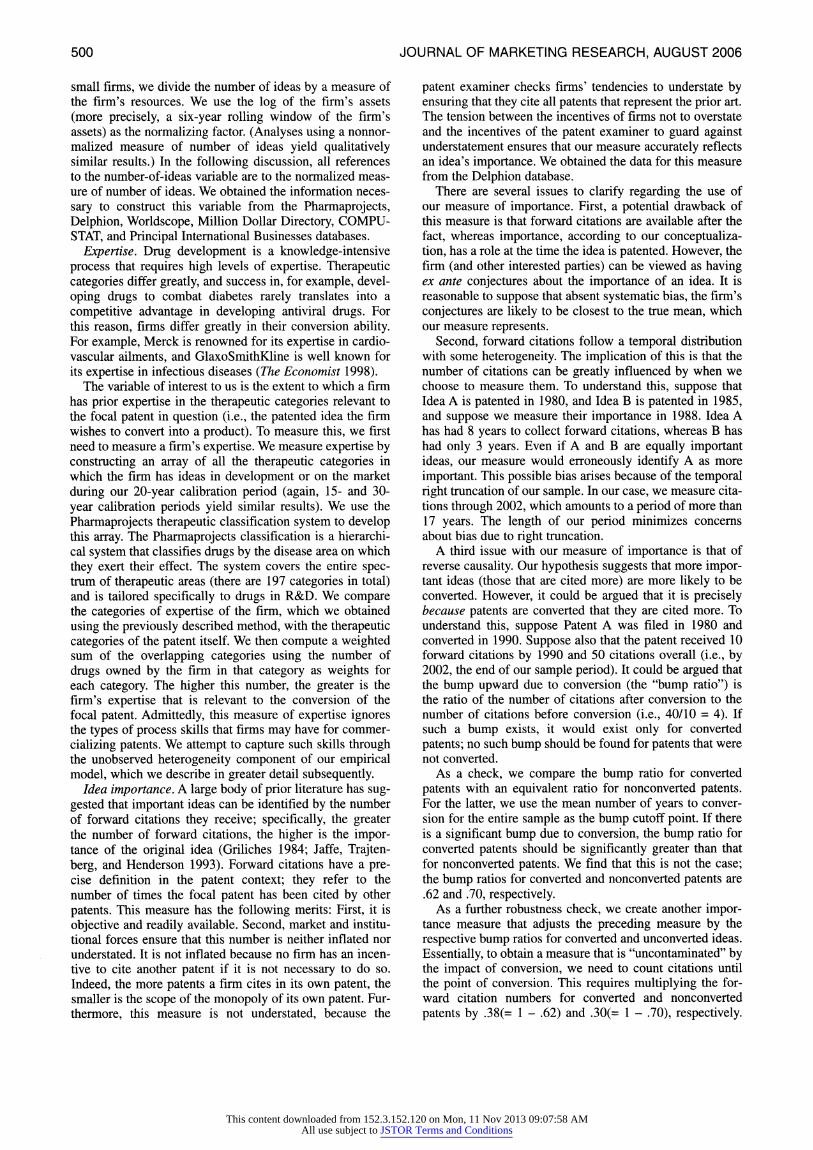
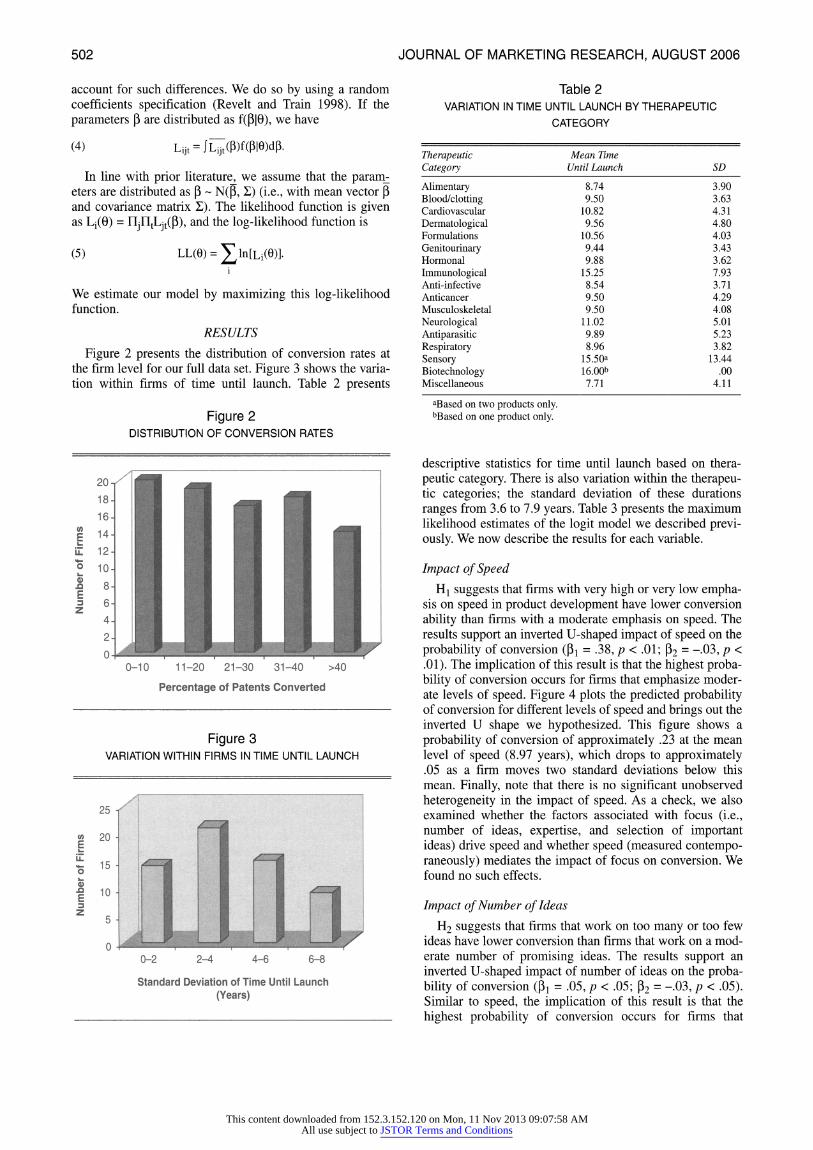
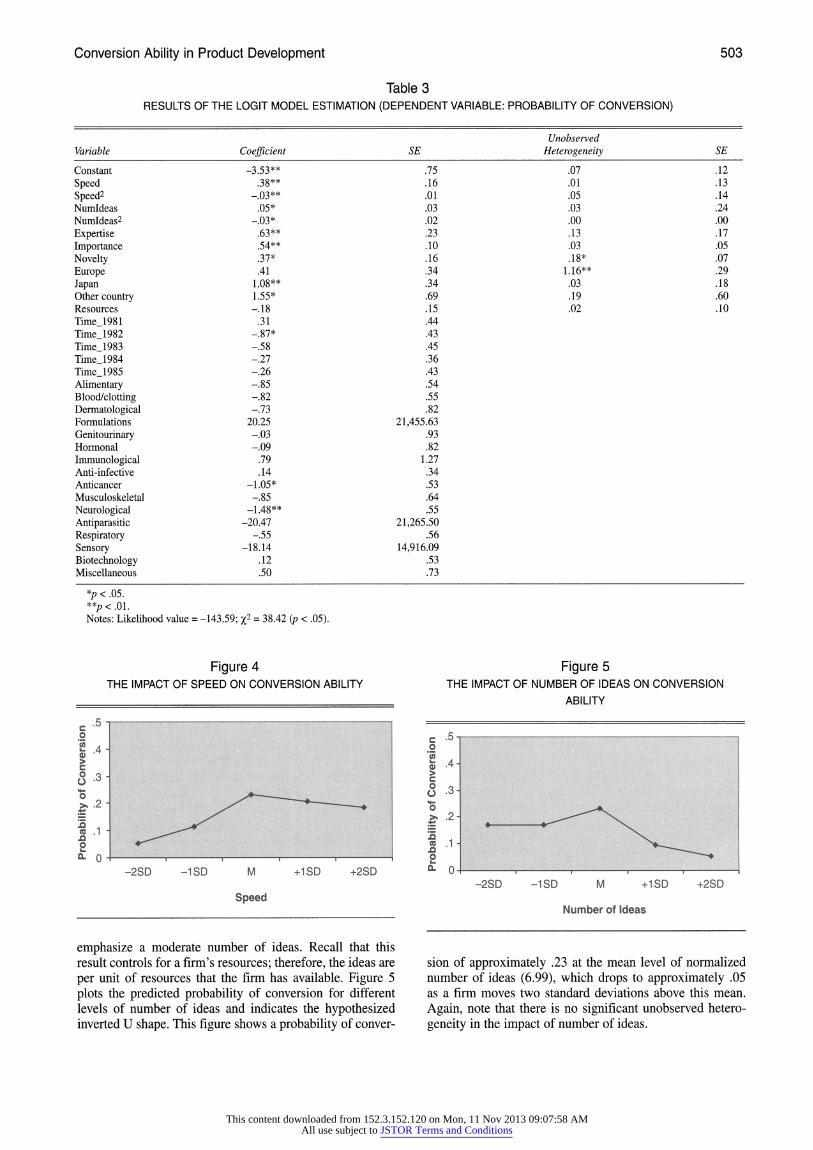
Figure 2 presents the distribution of conversion rates at the firm level for our full data set. Figure 3 shows the varia- tion within firms of time until launch. Table 2 presents
Figure 2 DISTRIBUTION OF CONVERSION RATES
0-10 11-20 21-30 31-40 >40
Percentage of Patents Converted
Figure 3 VARIATION WITHIN FIRMS IN TIME UNTIL LAUNCH
Standard Deviation of Time Until Launch (Years)
Table 2 VARIATION IN TIME UNTIL LAUNCH BY THERAPEUTIC
CATEGORY
Therapeutic Category
Mean Time Until Launch SD
Alimentary 8.74 3.90 Blood/clotting 9.50 3.63 Cardiovascular 10.82 4.31 Dermatological 9.56 4.80 Formulations 10.56 4.03 Genitourinary 9.44 3.43 Hormonal 9.88 3.62 Immunological 15.25 7.93 Anti-infective 8.54 3.71 Anticancer 9.50 4.29 Musculoskeletal 9.50 4.08 Neurological 11.02 5.01 Antiparasitic 9.89 5.23 Respiratory 8.96 3.82 Sensory 15.50a 13.44 Biotechnology 16.00b .00 Miscellaneous 7.71 4.11
aBased on two products only. bBased on one product only.
descriptive statistics for time until launch based on thera- peutic category. There is also variation within the therapeu- tic categories; the standard deviation of these durations ranges from 3.6 to 7.9 years. Table 3 presents the maximum likelihood estimates of the logit model we described previ- ously. We now describe the results for each variable.
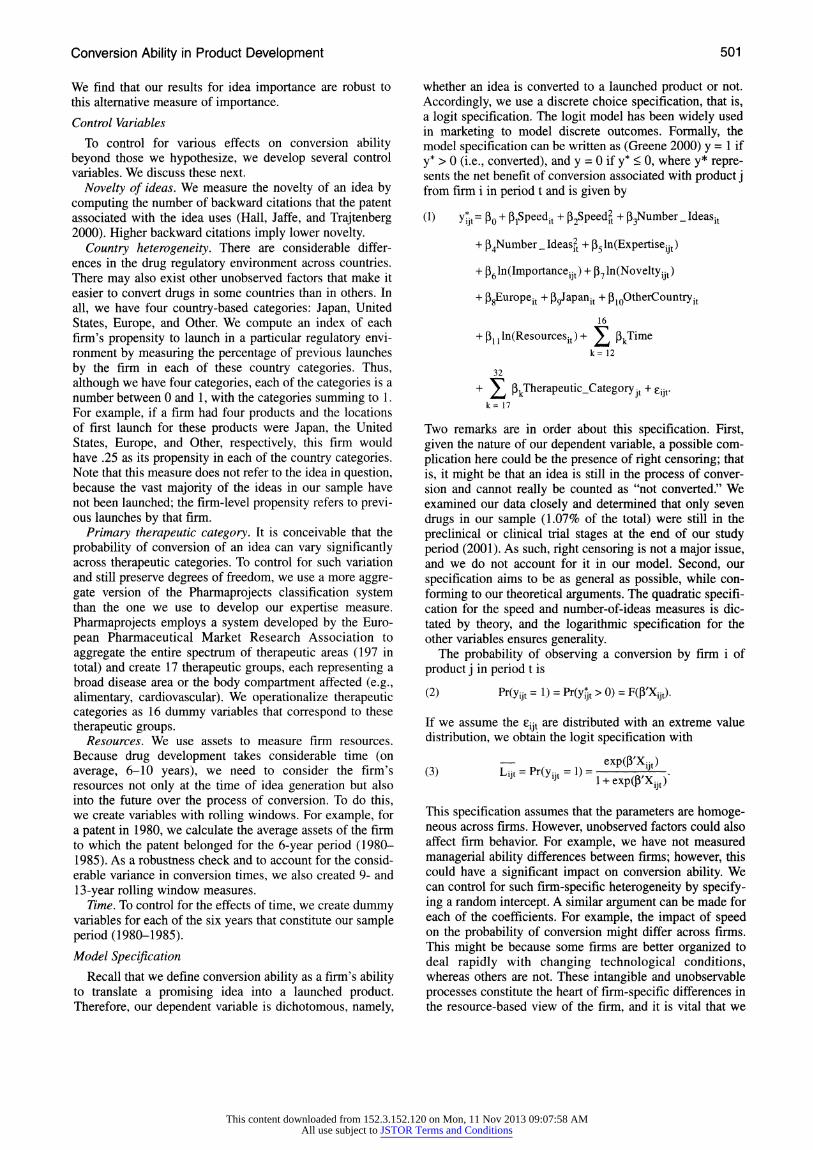
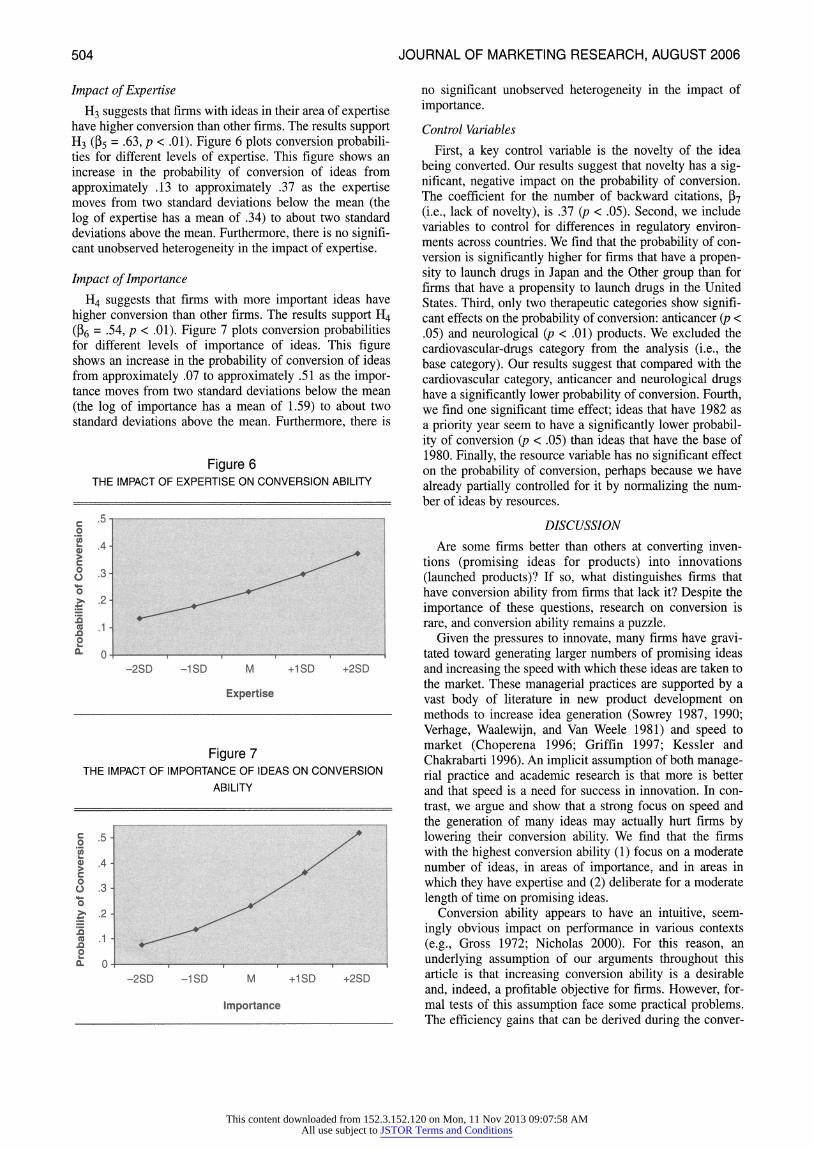
Impact of Speed H1 suggests that firms with very high or very low empha-
sis on speed in product development have lower conversion ability than firms with a moderate emphasis on speed. The results support an inverted U-shaped impact of speed on the probability of conversion (131 = .38, p < .01; 132 = -.03, p < .01). The implication of this result is that the highest proba- bility of conversion occurs for firms that emphasize moder- ate levels of speed. Figure 4 plots the predicted probability of conversion for different levels of speed and brings out the inverted U shape we hypothesized. This figure shows a probability of conversion of approximately .23 at the mean level of speed (8.97 years), which drops to approximately .05 as a firm moves two standard deviations below this mean. Finally, note that there is no significant unobserved heterogeneity in the impact of speed. As a check, we also examined whether the factors associated with focus (i.e., number of ideas, expertise, and selection of important ideas) drive speed and whether speed (measured contempo- raneously) mediates the impact of focus on conversion. We found no such effects.
Impact of Number of Ideas
H2 suggests that firms that work on too many or too few ideas have lower conversion than firms that work on a mod- erate number of promising ideas. The results support an inverted U-shaped impact of number of ideas on the proba- bility of conversion (131 = .05, p < .05; (32 = -.03, p < .05). Similar to speed, the implication of this result is that the highest probability of conversion occurs for firms that
20
18
16
14-
12-
10-
8-
6
4-
2-
0
25
20
15
10
5-
0 0-2 2-4 4-6 6-8
Number
of Firms
Number
of Firms
This content downloaded from 152.3.152.120 on Mon, 11 Nov 2013 09:07:58 AMAll use subject to JSTOR Terms and Conditions
Conversion Ability in Product Development 503
Table 3 RESULTS OF THE LOGIT MODEL ESTIMATION (DEPENDENT VARIABLE: PROBABILITY OF CONVERSION)
Variable Coefficient SE Unobserved
Heterogeneity SE
Constant -3.53** .75 .07 .12 Speed .38** .16 .01 .13 Speed2 -.03** .01 .05 .14 NumIdeas .05* .03 .03 .24 Numldeas2 -.03* .02 .00 .00 Expertise .63** .23 .13 .17 Importance .54** .10 .03 .05 Novelty .37* .16 .18* .07 Europe .41 .34 1.16** .29 Japan 1.08** .34 .03 .18 Other country 1.55* .69 .19 .60 Resources -.18 .15 .02 .10 Time_1981 .31 .44 Time_1982 -.87* .43 Time_1983 -.58 .45 Time_1984 -.27 .36 Time_1985 -.26 .43 Alimentary -.85 .54 Blood/clotting -.82 .55 Dermatological -.73 .82 Formulations 20.25 21,455.63 Genitourinary -.03 .93 Hormonal -.09 .82 Immunological .79 1.27 Anti-infective .14 .34 Anticancer -1.05* .53 Musculoskeletal -.85 .64 Neurological -1.48** .55 Antiparasitic -20.47 21,265.50 Respiratory -.55 .56 Sensory -18.14 14,916.09 Biotechnology .12 .53 Miscellaneous .50 .73
*p < .05. **p < .01. Notes: Likelihood value = -143.59; x2 = 38.42 (p < .05).
Figure 4
Probability
of Conversion
Probability
of Conversion
THE IMPACT OF SPEED ON CONVERSION ABILITY Figure 5
THE IMPACT OF NUMBER OF IDEAS ON CONVERSION ABILITY
-2SD -1 SD +1 SD +2SD
emphasize a moderate number of ideas. Recall that this result controls for a firm's resources; therefore, the ideas are per unit of resources that the firm has available. Figure 5 plots the predicted probability of conversion for different levels of number of ideas and indicates the hypothesized inverted U shape. This figure shows a probability of conver-
Number of Ideas
sion of approximately .23 at the mean level of normalized number of ideas (6.99), which drops to approximately .05 as a firm moves two standard deviations above this mean. Again, note that there is no significant unobserved hetero- geneity in the impact of number of ideas.
-2SD -1 SD M +1 SD +2SD M
Speed
.5
.4
.3
.2
.1
0
.5
.4
.3
.2
.1
0
This content downloaded from 152.3.152.120 on Mon, 11 Nov 2013 09:07:58 AMAll use subject to JSTOR Terms and Conditions
504 JOURNAL OF MARKETING RESEARCH, AUGUST 2006
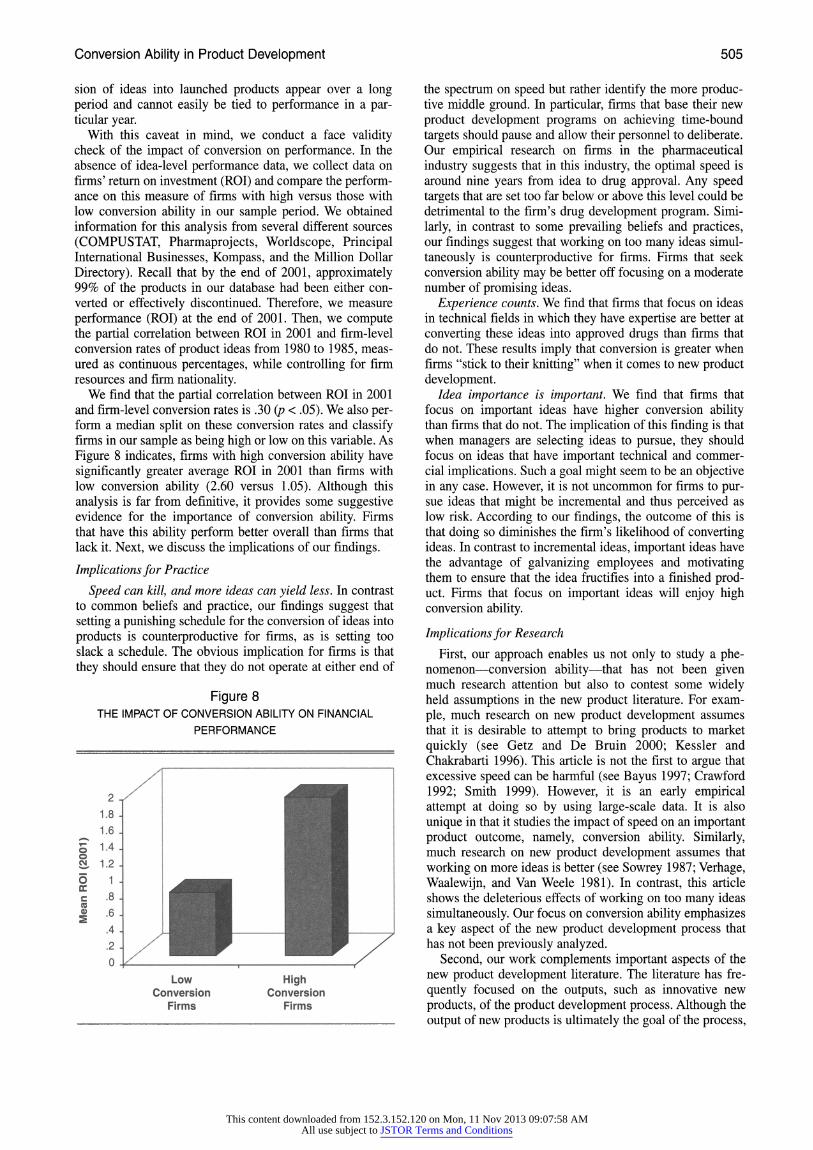
Impact of Expertise H3 suggests that firms with ideas in their area of expertise
have higher conversion than other firms. The results support H3 (135 = .63, p < .01). Figure 6 plots conversion probabili- ties for different levels of expertise. This figure shows an increase in the probability of conversion of ideas from approximately .13 to approximately .37 as the expertise moves from two standard deviations below the mean (the log of expertise has a mean of .34) to about two standard deviations above the mean. Furthermore, there is no signifi- cant unobserved heterogeneity in the impact of expertise.
Impact of Importance H4 suggests that firms with more important ideas have
higher conversion than other firms. The results support H4 036 = .54, p < .01). Figure 7 plots conversion probabilities for different levels of importance of ideas. This figure shows an increase in the probability of conversion of ideas from approximately .07 to approximately .51 as the impor- tance moves from two standard deviations below the mean (the log of importance has a mean of 1.59) to about two standard deviations above the mean. Furthermore, there is
Figure 6
Probability
of Conversion
Probability
of Conversion
THE IMPACT OF EXPERTISE ON CONVERSION ABILITY
Expertise
Figure 7 THE IMPACT OF IMPORTANCE OF IDEAS ON CONVERSION
ABILITY
Importance
no significant unobserved heterogeneity in the impact of importance.
Control Variables First, a key control variable is the novelty of the idea
being converted. Our results suggest that novelty has a sig- nificant, negative impact on the probability of conversion. The coefficient for the number of backward citations, 137 (i.e., lack of novelty), is .37 (p < .05). Second, we include variables to control for differences in regulatory environ- ments across countries. We find that the probability of con- version is significantly higher for firms that have a propen- sity to launch drugs in Japan and the Other group than for firms that have a propensity to launch drugs in the United States. Third, only two therapeutic categories show signifi- cant effects on the probability of conversion: anticancer (p < .05) and neurological (p < .01) products. We excluded the cardiovascular-drugs category from the analysis (i.e., the base category). Our results suggest that compared with the cardiovascular category, anticancer and neurological drugs have a significantly lower probability of conversion. Fourth, we find one significant time effect; ideas that have 1982 as a priority year seem to have a significantly lower probabil- ity of conversion (p < .05) than ideas that have the base of 1980. Finally, the resource variable has no significant effect on the probability of conversion, perhaps because we have already partially controlled for it by normalizing the num- ber of ideas by resources.
DISCUSSION Are some firms better than others at converting inven-
tions (promising ideas for products) into innovations (launched products)? If so, what distinguishes firms that have conversion ability from firms that lack it? Despite the importance of these questions, research on conversion is rare, and conversion ability remains a puzzle.
Given the pressures to innovate, many firms have gravi- tated toward generating larger numbers of promising ideas and increasing the speed with which these ideas are taken to the market. These managerial practices are supported by a vast body of literature in new product development on methods to increase idea generation (Sowrey 1987, 1990; Verhage, Waalewijn, and Van Weele 1981) and speed to market (Choperena 1996; Griffin 1997; Kessler and Chakrabarti 1996). An implicit assumption of both manage- rial practice and academic research is that more is better and that speed is a need for success in innovation. In con- trast, we argue and show that a strong focus on speed and the generation of many ideas may actually hurt firms by lowering their conversion ability. We find that the firms with the highest conversion ability (1) focus on a moderate number of ideas, in areas of importance, and in areas in which they have expertise and (2) deliberate for a moderate length of time on promising ideas.
Conversion ability appears to have an intuitive, seem- ingly obvious impact on performance in various contexts (e.g., Gross 1972; Nicholas 2000). For this reason, an underlying assumption of our arguments throughout this article is that increasing conversion ability is a desirable and, indeed, a profitable objective for firms. However, for- mal tests of this assumption face some practical problems. The efficiency gains that can be derived during the conver-
-25D SD M SD +2SD
-2SD -1 SD M +1 SD +2SD
.5
.4
.3
.2
.1
0
.5
.4
.3
.2
.1
0
This content downloaded from 152.3.152.120 on Mon, 11 Nov 2013 09:07:58 AMAll use subject to JSTOR Terms and Conditions
Conversion Ability in Product Development 505
sion of ideas into launched products appear over a long period and cannot easily be tied to performance in a par- ticular year.
With this caveat in mind, we conduct a face validity check of the impact of conversion on performance. In the absence of idea-level performance data, we collect data on firms' return on investment (ROI) and compare the perform- ance on this measure of firms with high versus those with low conversion ability in our sample period. We obtained information for this analysis from several different sources (COMPUSTAT, Pharmaprojects, Worldscope, Principal International Businesses, Kompass, and the Million Dollar Directory). Recall that by the end of 2001, approximately 99% of the products in our database had been either con- verted or effectively discontinued. Therefore, we measure performance (ROI) at the end of 2001. Then, we compute the partial correlation between ROI in 2001 and firm-level conversion rates of product ideas from 1980 to 1985, meas- ured as continuous percentages, while controlling for firm resources and firm nationality.
We find that the partial correlation between ROI in 2001 and firm-level conversion rates is .30 (p < .05). We also per- form a median split on these conversion rates and classify firms in our sample as being high or low on this variable. As Figure 8 indicates, firms with high conversion ability have significantly greater average ROI in 2001 than firms with low conversion ability (2.60 versus 1.05). Although this analysis is far from definitive, it provides some suggestive evidence for the importance of conversion ability. Firms that have this ability perform better overall than firms that lack it. Next, we discuss the implications of our findings.
Implications for Practice
Speed can kill, and more ideas can yield less. In contrast to common beliefs and practice, our findings suggest that setting a punishing schedule for the conversion of ideas into products is counterproductive for firms, as is setting too slack a schedule. The obvious implication for firms is that they should ensure that they do not operate at either end of
Figure 8
Mean
ROI (2001)
THE IMPACT OF CONVERSION ABILITY ON FINANCIAL PERFORMANCE
Low High Conversion Conversion
Firms Firms
the spectrum on speed but rather identify the more produc- tive middle ground. In particular, firms that base their new product development programs on achieving time-bound targets should pause and allow their personnel to deliberate. Our empirical research on firms in the pharmaceutical industry suggests that in this industry, the optimal speed is around nine years from idea to drug approval. Any speed targets that are set too far below or above this level could be detrimental to the firm's drug development program. Simi- larly, in contrast to some prevailing beliefs and practices, our findings suggest that working on too many ideas simul- taneously is counterproductive for firms. Firms that seek conversion ability may be better off focusing on a moderate number of promising ideas.
Experience counts. We find that firms that focus on ideas in technical fields in which they have expertise are better at converting these ideas into approved drugs than firms that do not. These results imply that conversion is greater when firms "stick to their knitting" when it comes to new product development.
Idea importance is important. We find that firms that focus on important ideas have higher conversion ability than firms that do not. The implication of this finding is that when managers are selecting ideas to pursue, they should focus on ideas that have important technical and commer- cial implications. Such a goal might seem to be an objective in any case. However, it is not uncommon for firms to pur- sue ideas that might be incremental and thus perceived as low risk. According to our findings, the outcome of this is that doing so diminishes the firm's likelihood of converting ideas. In contrast to incremental ideas, important ideas have the advantage of galvanizing employees and motivating them to ensure that the idea fructifies into a finished prod- uct. Firms that focus on important ideas will enjoy high conversion ability.
Implications for Research First, our approach enables us not only to study a phe-
nomenon-conversion ability that has not been given much research attention but also to contest some widely held assumptions in the new product literature. For exam- ple, much research on new product development assumes that it is desirable to attempt to bring products to market quickly (see Getz and De Bruin 2000; Kessler and Chakrabarti 1996). This article is not the first to argue that excessive speed can be harmful (see Bayus 1997; Crawford 1992; Smith 1999). However, it is an early empirical attempt at doing so by using large-scale data. It is also unique in that it studies the impact of speed on an important product outcome, namely, conversion ability. Similarly, much research on new product development assumes that working on more ideas is better (see Sowrey 1987; Verhage, Waalewijn, and Van Weele 1981). In contrast, this article shows the deleterious effects of working on too many ideas simultaneously. Our focus on conversion ability emphasizes a key aspect of the new product development process that has not been previously analyzed.
Second, our work complements important aspects of the new product development literature. The literature has fre- quently focused on the outputs, such as innovative new products, of the product development process. Although the output of new products is ultimately the goal of the process,
2 1.8 1.6 1.4
1.2 1 .8 .6 .4 .2
0
This content downloaded from 152.3.152.120 on Mon, 11 Nov 2013 09:07:58 AMAll use subject to JSTOR Terms and Conditions
506 JOURNAL OF MARKETING RESEARCH, AUGUST 2006
our work emphasizes the importance of efficiency in the process (i.e., outputs relative to inputs).
Third, our results suggest a great deal of variance among firms in their conversion ability. This finding has a direct implication for policy-related research. It suggests that average numbers, such as $802 million for the cost of devel- oping a new drug (U.S. Congress, Office of Technology Assessment 1993; see also DiMasi, Hansen, and Grabowski 2003), could be a poor basis for policy making. This num- ber might be significantly lower, for example, for firms that focus on a few ideas in their areas of expertise. In recent years, the pharmaceutical industry has come under heavy criticism for the high prices it sometimes charges for life- saving drugs that consumers in many parts of the world can barely afford (Scherer 1993). Critics also note that many of these drugs are based on publicly funded research, that firms' expenditure on sales force activities is greater than that on R&D, and that the industry has been extremely prof- itable for the past two decades or so. The argument that drug companies use in their defense is that (1) drugs cost huge amounts to develop and (2) if firms are not assured of recouping these costs (by pricing high), they would not have the incentive to develop these drugs in the first place. A crucial input in this argument is the cost of drug develop- ment. The numbers presented are often based on average development costs and conversion rates across firms. Our research suggests that firms vary in their conversion ability; some firms are more efficient than others at converting ideas into drugs. Researchers may wish to consider this variance when formulating policy prescriptions.
This article is among the first to study conversion ability. As with many early studies in a research area, it has several limitations, some of which could provide fruitful avenues for further research. First, it would be interesting to gather more evidence on the performance implications of conver- sion ability, such as the quality and performance of the products that are converted. The ROI-based evidence we offer here, though it is confirmatory, is clearly limited.
Second, it would be useful to examine the generalizabil- ity of our research systematically by studying conversion ability in contexts other than the pharmaceutical context. Generalizability can be viewed along various dimensions. Efficiency in converting inputs to outputs is likely to be desirable in many new product development contexts beyond the pharmaceutical context. The theoretical under- pinnings of this article as they relate to the impact of con- structs such as focus and deliberation on conversion should also be fairly generalizable across industries. However, the measures we used may not be as generalizable. In particu- lar, patents and product launch may not have the same sig- nificance in other contexts as they do in pharmaceuticals. Other inputs (e.g., development expenditures) and outputs (e.g., product sales) may be more relevant in other industry contexts.
Third, we have not examined several alternative strate- gies that firms could follow (e.g., focusing on novel drugs that have a low conversion probability but a large payoff). Examining such issues would require financial data on each converted drug. Similarly, it is possible that some firms are good at picking ideas (through acquisition or licensing), whereas other firms specialize in inventing good ideas that they then seek to convert. We do not address the extent to
which different types of firms pursue either or both of these strategies. We leave the exploration of these and related questions to further research.
Finally, our arguments on deliberation and focus empha- size the importance of attention and consideration in con- version ability. Research that examines these and other behavioral underpinnings of conversion in more detail (e.g., by more explicitly measuring the consideration and atten- tion process in firms) could be valuable. In particular, sur- vey data would be helpful in this regard.
REFERENCES Arundel, Anthony and Isabelle Kabla (1998), "What Percentage of
Innovations Are Patented? Empirical Estimates for European Countries," Research Policy, 27 (2), 127-41.
Bandura, A. (1997), Self-Efficacy: The Exercise of Control. New York: W.H. Freeman.
Barnett, William P. and John Freeman (2001), "Too Much of a Good Thing? Product Proliferation and Organizational Failure," Organization Science, 12 (5), 539-58.
Bayus, Barry L. (1997), "Speed-to-Market and New Product Per- formance Trade-Offs," Journal of Product Innovation Manage- ment, 14 (6), 485-97.
Ben Zur, H. and S.J. Breznitz (1981), "The Effect of Time Pres- sure on Risky Choice Behavior," Acta Psychologica, 47 (2), 89-104.
Bettman, James R., Eric J. Johnson, and John W. Payne (1991), "Consumer Decision-Making," in Handbook of Consumer Behavior, T.S. Robertson and H.H. Kassarjain, eds. Englewood Cliffs, NJ: Prentice Hall, 50-84.
Bluedorn, A.C., C.F. Kaufman, and P.M. Lane (1992), "How Many Things Do You Like to Do at Once? An Introduction to Monochronic and Polychronic Time," Academy of Management Executive, 6 (4), 17-26.
Bourgeois, L.J. and Kathleen M. Eisenhardt (1988), "Strategic Decision Process in High Velocity Environments: Toward A Mid-Range Theory," Management Science, 31 (4), 737-70.
Bronner R. (1982), Decision Making Under Time Pressure. Lex- ington, MA: D.C. Heath.
Chaiken, Shelly and Durairaj Maheswaran (1994), "Heuristic Pro- cessing Can Bias Systematic Processing: Effects of Source Credibility, Argument Ambiguity, and Task Importance on Atti- tude Judgment," Journal of Personality and Social Psychology, 66 (3), 460-73.
Chase, W.G. and H.A. Simon (1973), "Perception in Chess," Cog- nitive Psychology, 4 (1), 55-81.
Choperena, A.M. (1996), "Fast Cycle Time: Driver of Innovation and Quality," Research-Technology Management, 39 (May-June), 36-40.
Cohen, Wesley M., Richard R. Nelson, and John P. Walsh (2000), "Protecting Their Intellectual Assets: Appropriability Condi- tions and Why U.S. Manufacturing Firms Patent (or Not)," working paper, National Bureau of Economic Research.
Cooper, Robert, Scott Edgett, and Elko Kleinschmidt (2004), "Benchmarking Best NPD Practices: II," Research Technology Management, 47 (3), 50-59.
Crawford, C. Merle (1992), "The Hidden Costs of Accelerated Product Development," Journal of Product Innovation Manage- ment, 9 (3), 188-99.
Damos, D.L. (1991), Multiple-Task Performance. London: Taylor & Francis.
Danzon, Patricia M., Sean Nicholson, and Nuno Sousa Pereira (2003), "Productivity in Pharmaceutical-Biotechnology R&D: The Role of Experience and Alliances," working paper, The Wharton School, University of Pennsylvania.
Davidson, Janet and Robert Sternberg (2003), The Psychology of Problem Solving. New York: Cambridge University Press.
This content downloaded from 152.3.152.120 on Mon, 11 Nov 2013 09:07:58 AMAll use subject to JSTOR Terms and Conditions
Conversion Ability in Product Development 507
DeJong, Ritske (1993), "Multiple Bottlenecks in Overlapping Task Performance," Journal of Experimental Psychology: Human Perception and Performance, 19 (5), 965-80.
DiMasi, Joseph A. (2001), "Risks in New Drug Development: Approval Success Rates for Investigational Drugs," Clinical Pharmacology & Therapeutics, 29 (May), 297-307.
, Ronald W. Hansen, and Henry G. Grabowski (2003), "The Price of Innovation: New Estimates of Drug Development Costs," Journal of Health Economics, 22 (2), 151-85.
Dranove, David and David Meltzer (1994), "Do Important Drugs Reach the Market Sooner?" RAND Journal of Economics, 25 (3), 402-423.
Duncker, K. (1945), "On Problem Solving," Psychological Mono- graphs, 58 (270), 1-113.
The Economist (1998), "Drug Mergers: Popping the Question," (January 24), 64.
Ericsson, K.A. (2003), "Motivating Self-Regulated Problem Solvers," in The Psychology of Problem Solving, Janet E. Davidson and Robert J. Sternberg, eds. New York: Cambridge University Press, 31-86.
- and A.C. Lehmann (1996), "Expert and Exceptional Per- formance: Evidence of Maximal Adaptation to Task Con- straints," Annual Review of Psychology, 47,273-305.
FDA (1999), From Test Tube to Patient: Improving Health Through Human Drugs. Washington, DC: U.S. Government Printing Office.
Gambardella, Alfonso (1995), Science and Innovation: The U.S. Pharmaceutical Industry During the 1980s. Cambridge, UK: Cambridge University Press.
Getz, Kenneth A. and Annick De Bruin (2000), "Speed Demons of Drug Development," Pharmaceutical Executive, 20 (July). 78-84.
Glazer, Rashi and Allen M. Weiss (1993), "Marketing in Turbulent Environments: Decision Processes and the Time Sensitivity of Information," Journal of Marketing Research, 30 (November), 509-522.
Greene, William (2000), Econometric Analysis. Englewood Cliffs, NJ: Prentice Hall.
Greenley, Gordon E. and Barry L. Bayus (1994), "A Comparative Study of Product Launch and Elimination Decisions in U.K. and U.S. Companies," European Journal of Marketing, 28 (2), 5-29.
Griffin, Abbie (1997), "The Effects of Project and Process Charac- teristics on Product Development Cycle Time," Journal of Mar- keting Research, 34 (February), 24-35.
Griliches, Z. (1984), R&D, Patents, and Productivity. Chicago: University of Chicago Press.
Gross, A. (1972), "The Creative Aspects of Advertising," Sloan Management Review, 14 (1), 83-109.
Hall, Bronwyn H., Adam Jaffe, and Manuel Trajtenberg (2000), "Market Value and Patent Citations: A First Look," working paper, National Bureau of Economic Research.
Hall, E.T. (1983), The Dance of Life: The Other Dimensions of Time. New York: Anchor Press.
Hansen, R.W. (1979), "The Pharmaceutical Development Process: Estimates of Current Development Costs and Times and the Effects of Regulatory Changes," in Issues in Pharmaceutical Economics, R.I. Chien, ed. Lexington, MA: Lexington Books, 151-87.
Henard, David H. and David M. Szymanski (2001), "Why Some New Products Are More Successful Than Others," Journal of Marketing Research, 38 (August), 362-75.
Irwin, D. and P. Klenow (1994), "Learning-by-Doing Spillovers in the Semiconductor Industry," Journal of Political Economy, 102 (6), 1200-27.
Jaffe, Adam B., M. Trajtenberg, and R. Henderson (1993), "Geo- graphic Localization of Knowledge Spillovers as Evidenced by
Patent Citations," Quarterly Journal of Economics, 108 (3), 577-98.
Karau, Steven J. and Janice R. Kelly (1992), "The Effects of Time Scarcity and Time Abundance on Group Performance Quality and Interaction Processes," Journal of Experimental Social Psy- chology, 28 (6), 542-71.
Kessler, Eric H. and Alok K. Chakrabarti (1996), "Innovation Speed: A Conceptual Model of Context, Antecedents, and Out- comes," Academy of Management Review, 21 (4), 1143-91.
Kinsbourne, M. (1981), "Single Channel Theory," in Human Skills, D. Holding, ed. New York: John Wiley & Sons, 65-89.
LaPorte, R.E. and R. Nath (1976), "Role of Performance Goals in Prose Learning," Journal of Educational Psychology, 68 (3), 260-64.
Locke, E.A. (2000), "Motivation, Cognition, and Action: An Analysis of Studies of Task Goals and Knowledge," Applied Psychology: An International Review, 49 (3), 408-429.
Luchins, A.S. (1942), "Mechanization in Problem Solving," Psy- chological Monographs, 54 (248), 1-95.
Mathieu, Mark P. (2002), New Drug Development: A Regulatory Overview. Waltham, MA: Parexel International Corporation.
Montoya-Weiss, M. and Roger Calantone (1994), "Determinants of New Product Performance: A Review and Meta-Analysis," Journal of Product Innovation Management, 11 (November), 397-417.
Navon, D. and D. Gopher (1979), "On the Economy of the Human Processing System," Psychological Review, 86 (3), 254-84.
and J.O. Miller (1987), "Role of Outcome Conflict in Dual-Task Interference," Journal of Experimental Psychology: Human Perception and Performance, 13 (3), 435-48.
Nicholas, Michael S. (2000), An Actor's Guide: Your First Year in Hollywood. New York: Allworth Press.
Pashler, Harold (1994), "Dual-Task Interference in Simple Tasks: Data and Theory," Psychological Bulletin, 116 (2), 220-44.
Pelz, D.C. and Frank M. Andrews (1966), Scientists in Organiza- tions: Productive Climates for Research and Development. New York: John Wiley & Sons.
Sanchez, Juan I. and Edward L. Levine (1989), "Determining Important Tasks Within Jobs: A Policy-Capturing Approach," Journal of Applied Psychology, 74 (2), 336-42.
Scherer, F.M. (1993), "Pricing, Profits and Technological Progress in the Pharmaceutical Industry," Journal of Economic Perspec- tives, 7 (3), 97-115.
Schilling, M.A. and C.W.L. Hill (1998), "Managing the New Product Development Process: Strategic Imperatives," Academy of Management Executive, 12 (3), 67-81.
Scott Morton, Fiona M. (1999), "Entry Decisions in the Generic Pharmaceutical Industry," RAND Journal of Economics, 30 (3), 421-40.
Smith, Preston G. (1999), "From Experience: Reaping Benefit from Speed to Market," Journal of Product Innovation Manage- ment, 16 (3), 222-30.
Sorescu, Alina B., Rajesh K. Chandy, and Jaideep C. Prabhu (2003), "Sources and Financial Consequences of Radical Inno- vation: Insights from Pharmaceuticals," Journal of Marketing, 67 (October), 82-101.
Sowrey, J. Trevor (1987), The Generation of Ideas for New Prod- ucts. London: Kogan Page.
(1990), "Idea Generation: Identifying the Most Useful Techniques," European Journal of Marketing, 24 (5), 20-29.
Stevens, Greg A. and James Burley (1997), "3,000 Raw Ideas = 1 Commercial Success !" Research Technology Management, 40 (May-June), 16-27.
Svenson, Ola and A. John Maule, eds. (1993), Time Pressure and Stress in Human Decision Making. New York: Plenum Press.
Taylor, M.S., E.A. Locke, C. Lee, and M.E. Gist (1984), "Type A Behavior and Faculty Research Productivity: What Are the
This content downloaded from 152.3.152.120 on Mon, 11 Nov 2013 09:07:58 AMAll use subject to JSTOR Terms and Conditions

508 JOURNAL OF MARKETING RESEARCH, AUGUST 2006
Mechanisms?" Organizational Behavior & Human Perfor- mance, 34 (3), 402-418.
ThOlke, Jiirg M., Erik Jan Hultink, and Henry S.J. Robben (2001), "Launching New Product Features: A Multiple Case Examina- tion," Journal of Product Innovation Management, 18 (1), 3-14.
Udayagiri, Naren D. and Douglas A. Schuler (1999), "Cross- Product Spillovers in the Semiconductor Industry: Implications for Strategic Trade Policy," International Trade Journal, 13 (3), 249-71.
U.S. Congress, Congressional Budget Office (1994), How Care Reform Affects Pharmaceutical Research and Development. Washington, DC: U.S. Government Printing Office.
U.S. Congress, Office of Technology Assessment (1993), Pharma- ceutical R&D: Costs, Risks, and Rewards. Washington, DC: U.S. Government Printing Office.
Verhage, Bronislaw, Philip Waalewijn, and A.J. van Weele (1981), "New Product Development in Dutch Companies: The Idea Generation Stage," European Journal of Marketing, 15 (5), 73-85.
Zimmerman, Barry J. and Magda Campillo (2003), "Motivating Self-Regulated Problem Solvers," in The Psychology of Prob- lem Solving, Janet E. Davidson and Robert J. Sternberg, eds. New York: Cambridge University Press, 233-62.
This content downloaded from 152.3.152.120 on Mon, 11 Nov 2013 09:07:58 AMAll use subject to JSTOR Terms and Conditions


![Broadband higher order mode conversion using chirped … · sensing [6]. The ability to achieve a broader and tailorable conversion bandwidth is thus highly desirable. This is possible](https://img.pdfslide.net/doc/110x75/6012678fe6fd735865413d3b/broadband-higher-order-mode-conversion-using-chirped-sensing-6-the-ability-to.jpg)