Embed Size (px)
Citation preview
Purdue UniversityPurdue e-PubsInternational Refrigeration and Air ConditioningConference School of Mechanical Engineering
2016
Conversion of cold beverage dispenser'srefrigeration system to R744 refrigerantMatej VisekCreative Thermal Solutions, United States of America, [email protected]
Stefan [email protected]
Pega [email protected]
Follow this and additional works at: http://docs.lib.purdue.edu/iracc
This document has been made available through Purdue e-Pubs, a service of the Purdue University Libraries. Please contact [email protected] foradditional information.Complete proceedings may be acquired in print and on CD-ROM directly from the Ray W. Herrick Laboratories at https://engineering.purdue.edu/Herrick/Events/orderlit.html
Visek, Matej; Elbel, Stefan; and Hrnjak, Pega, "Conversion of cold beverage dispenser's refrigeration system to R744 refrigerant"(2016). International Refrigeration and Air Conditioning Conference. Paper 1794.http://docs.lib.purdue.edu/iracc/1794
2556, Page 1
16th International Refrigeration and Air Conditioning Conference at Purdue, July 11-14, 2016
Conversion of cold beverage dispenser’s refrigeration system to R744 refrigerant
Matej VISEK(1,*), Stefan ELBEL(1,2), Pega HRNJAK(1,2)
1Creative Thermal Solutions, Inc.
2209 North Willow Road, Urbana, IL 61802, USA
2University of Illinois at Urbana-Champaign
Department of Mechanical Science and Engineering
1206 West Green Street, Urbana, IL 61801, USA
* Corresponding Author Email: [email protected]
ABSTRACT
Cold beverage dispensers belong to the group of light commercial refrigeration machines that includes beverage
coolers, ice machines and storage units for food items. Beverage dispensers use a vapor compression system to charge
a thermal storage, usually an ice bank, which is used to indirectly cool tap water and beverage concentrate. For these
machines, R290 (propane) and R744 (carbon dioxide) are among the favorite candidates to completely replace high
GWP HFC refrigerants in the future. Because of flammability and charge restrictions for R290, carbon dioxide is in
some cases preferred even if some of its thermodynamic and transport properties are less favorable than those of R290,
especially at high ambient temperature.
This study evaluated the performance of a baseline R134a beverage dispenser machine by experimentally measuring
initial pull down time and energy consumption during compressor cycling operation at 24°C and 38°C ambient
temperatures, respectively. Another important performance criteria for dispensers is the burst capacity, which is the
number of 350 ml drinks dispensed at the rate of 3 drinks per minute while maintaining a beverage temperature below
5°C. This test simulates the typical load profile of the machine during peak serving time in hotels and motels. Burst
capacity is closely related to thermal storage capacity and therefore the ice amount was also closely monitored. The
machine’s refrigeration system was afterwards converted to R744 refrigerant, using a transcritical cycle. Special
attention was given to optimization of capillary tube size, refrigerant charge amount and gas cooler design where the
strongest impact on the performance at different ambient temperatures was expected. Appropriate instrumentation and
theoretical analysis helped to identify optimum selection of capillary tube and R744 refrigerant charge. The optimized
R744 system used 385g of charge and pulled down in approximately half the time and dispensed at least 25% more
drinks while keeping the energy consumption comparable with its baseline R134a system. Slight increase in gas cooler
cost was well overcome by the benefits of larger burst capacity and significantly shorter pull down time allowing: the
redesigned beverage dispenser can be kept off longer and needs to be turned on shortly before the serving time.
1. INTRODUCTION
Cold beverage dispensers belong to the group of light commercial refrigeration machines that includes beverage
coolers, ice machines and storage units for food items. The light commercial refrigeration is gradually transforming
to natural refrigerants all over the world. There are two typical groups of natural refrigerants which can replace
currently used HFCs in light commercial refrigeration units. The first group consists of flammable refrigerants such
as propane and isobutane and second group includes carbon dioxide (R744). Flammable refrigerant have disadvantage
of flammability risks which can be mitigated but not completely removed. The HC refrigerants are also limited in
amount of charge to 150g by government standards. Certainly there is a limit to the refrigeration capacity reachable
with 150g of charge. As it was shown by Fuentes et al. (2014) on the two door commercial beverage cooler, it is
possible to push the cooling capacity limit very high by carful design of system components for low charge.
On the other side R744 is non-flammable and non-toxic with no limit of charge. Though its working pressures are
considerably higher at usual operating ambient conditions of light commercial unit. The system components have to
be redesigned from mechanical point of view to withstand higher burst pressure. Carbon dioxide has low critical
2556, Page 2
16th International Refrigeration and Air Conditioning Conference at Purdue, July 11-14, 2016
temperature and transcritical operation of the system is necessary at most operating conditions. CO2 fluid efficiency
degrades rapidly above the critical point. Many researches such as DeAngelis and Hrnjak (2005), Kim et al. (2004),
Boccardi et al. (2013) and Fuentes et al. (2015) have shown that it’s possible to build energy efficient commercial
equipment operating with R744 at comparable cost with equivalent R134a unit. One of the largest beverage company
in US committed to the use of R744 in its beverage coolers and already successfully introduce thousands of functional
and efficient coolers to the market (TCCC, 2014).
This study demonstrates that in addition to regular beverage coolers also beverage juice dispensers can be successfully
converted to R744 refrigerant with relatively low cost changes of the refrigeration system and reach on par energy
efficiency at usual operating ambient temperatures.
2. PRINCIPLE OF OPERATION AND PERFORMANCE CRITERIA
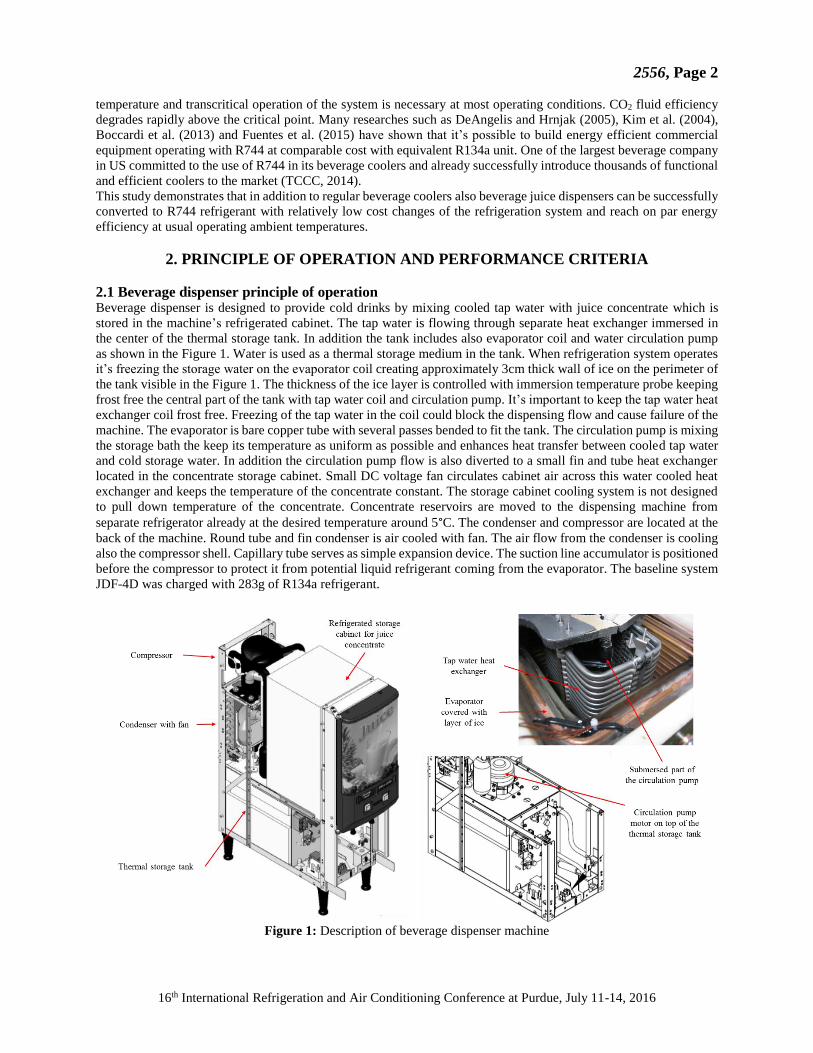
2.1 Beverage dispenser principle of operation
Beverage dispenser is designed to provide cold drinks by mixing cooled tap water with juice concentrate which is
stored in the machine’s refrigerated cabinet. The tap water is flowing through separate heat exchanger immersed in
the center of the thermal storage tank. In addition the tank includes also evaporator coil and water circulation pump
as shown in the Figure 1. Water is used as a thermal storage medium in the tank. When refrigeration system operates
it’s freezing the storage water on the evaporator coil creating approximately 3cm thick wall of ice on the perimeter of
the tank visible in the Figure 1. The thickness of the ice layer is controlled with immersion temperature probe keeping
frost free the central part of the tank with tap water coil and circulation pump. It’s important to keep the tap water heat
exchanger coil frost free. Freezing of the tap water in the coil could block the dispensing flow and cause failure of the
machine. The evaporator is bare copper tube with several passes bended to fit the tank. The circulation pump is mixing
the storage bath the keep its temperature as uniform as possible and enhances heat transfer between cooled tap water
and cold storage water. In addition the circulation pump flow is also diverted to a small fin and tube heat exchanger
located in the concentrate storage cabinet. Small DC voltage fan circulates cabinet air across this water cooled heat
exchanger and keeps the temperature of the concentrate constant. The storage cabinet cooling system is not designed
to pull down temperature of the concentrate. Concentrate reservoirs are moved to the dispensing machine from
separate refrigerator already at the desired temperature around 5°C. The condenser and compressor are located at the
back of the machine. Round tube and fin condenser is air cooled with fan. The air flow from the condenser is cooling
also the compressor shell. Capillary tube serves as simple expansion device. The suction line accumulator is positioned
before the compressor to protect it from potential liquid refrigerant coming from the evaporator. The baseline system
JDF-4D was charged with 283g of R134a refrigerant.
Figure 1: Description of beverage dispenser machine
2556, Page 3
16th International Refrigeration and Air Conditioning Conference at Purdue, July 11-14, 2016
2.2 Installation, performance requirements and challenges of conversion to transcritical R744 The beverage dispenser must be connected to a cold water system with operating pressure between 138kPa and
690kPa. This water source must be capable of producing a minimum flow rate of 89ml per second. Inlet water is
required to have temperature less than 24°C. The dispenser requires a minimum of 100mm of air clearance at the rear
and 200mm above the dispenser for proper air flow across the condenser. The ambient temperature should not exceed
38°C. Before initial use, the thermal storage tank needs to be filled up according to the procedure described in the
installation manual (BUNN-O-MATIC Corp. 2012). The dispensing flow rate and mixing ratio with concentrate have
to be tuned according to the Table 1. These requirements are essential in order to achieve correct functionality and
sufficient capacity of the dispenser during testing.
Table 1: Dispensing flow rates and mixing ratios depending on the product (BUNN-O-MATIC Corp. 2012).
* Maximum flow rate may be less depending on the water pressure supply at each location.
Mix Ratio
(water + concentrate) Adjust water flow rate to: Product Brix %
2+1 *3.0 fl. oz (89 ml)
Per 3-second test
Prune Juice 16.0%
Other *
4+1
*3.0 fl. oz (89 ml)
Per 3-second test
Orange Juice 11.8%
Pineapple Juice 12.8%
Cranberry Fruit Juice 14.0%
5+1
Lemonade
Apple Juice 12.0%
Fruit Punch
Grape Juice 13.0%
3+1 through 7+1 Other *
Above 7+1 *4.0 fl. oz (118 ml)
Per 3-second test Other *
High Viscosity Juice *3.0 fl. oz (89 ml)
Per 3-second test As Required -
The usual drinks dispensing rate is 3 drinks per minute with volume 355ml each. The beverage juice dispenser capacity
(also called burst capacity) is then determined by number of drinks that can be dispensed with temperature less than
5°C with inlet tap water temperature 24°C. The baseline R134a system had specified burst capacity of 145 drinks at
24°C ambient temperature. Obviously at higher ambient temperature the burst capacity is expected to be lower.
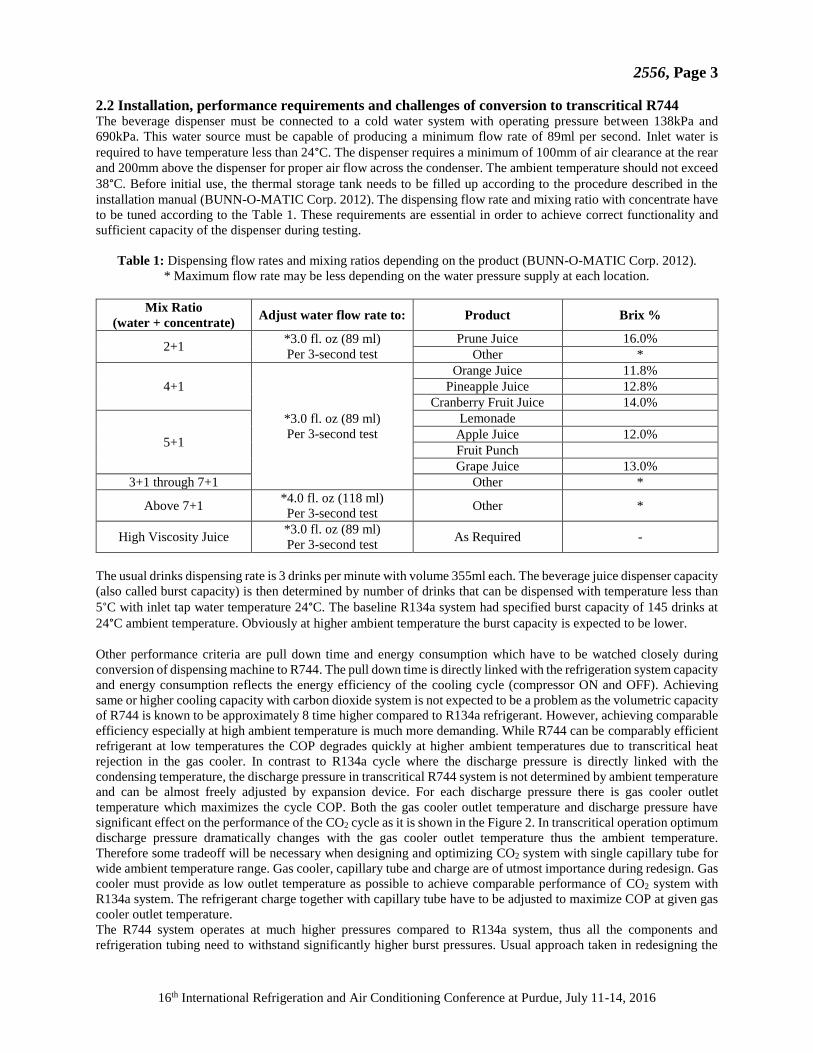
Other performance criteria are pull down time and energy consumption which have to be watched closely during
conversion of dispensing machine to R744. The pull down time is directly linked with the refrigeration system capacity
and energy consumption reflects the energy efficiency of the cooling cycle (compressor ON and OFF). Achieving
same or higher cooling capacity with carbon dioxide system is not expected to be a problem as the volumetric capacity
of R744 is known to be approximately 8 time higher compared to R134a refrigerant. However, achieving comparable
efficiency especially at high ambient temperature is much more demanding. While R744 can be comparably efficient
refrigerant at low temperatures the COP degrades quickly at higher ambient temperatures due to transcritical heat
rejection in the gas cooler. In contrast to R134a cycle where the discharge pressure is directly linked with the
condensing temperature, the discharge pressure in transcritical R744 system is not determined by ambient temperature
and can be almost freely adjusted by expansion device. For each discharge pressure there is gas cooler outlet
temperature which maximizes the cycle COP. Both the gas cooler outlet temperature and discharge pressure have
significant effect on the performance of the CO2 cycle as it is shown in the Figure 2. In transcritical operation optimum
discharge pressure dramatically changes with the gas cooler outlet temperature thus the ambient temperature.
Therefore some tradeoff will be necessary when designing and optimizing CO2 system with single capillary tube for
wide ambient temperature range. Gas cooler, capillary tube and charge are of utmost importance during redesign. Gas
cooler must provide as low outlet temperature as possible to achieve comparable performance of CO2 system with
R134a system. The refrigerant charge together with capillary tube have to be adjusted to maximize COP at given gas
cooler outlet temperature.
The R744 system operates at much higher pressures compared to R134a system, thus all the components and
refrigeration tubing need to withstand significantly higher burst pressures. Usual approach taken in redesigning the
2556, Page 4
16th International Refrigeration and Air Conditioning Conference at Purdue, July 11-14, 2016
components is to reduce internal tube diameter and increase wall thickness. High volumetric capacity of CO2 reduces
required refrigerant volume flow and thus also velocity in the pipes. Because of higher absolute pressures the
potentially higher pressure drop in the small diameter tubes impact CO2 system performance less than equivalent
pressure drop in R134a system.
Figure 2: COP of ideal R744 cycle as a function of gas cooler outlet temperature close to critical point
3. INSTRUMENTATION, TEST PROCEDURES AND BASELINE PEROFRMANCE
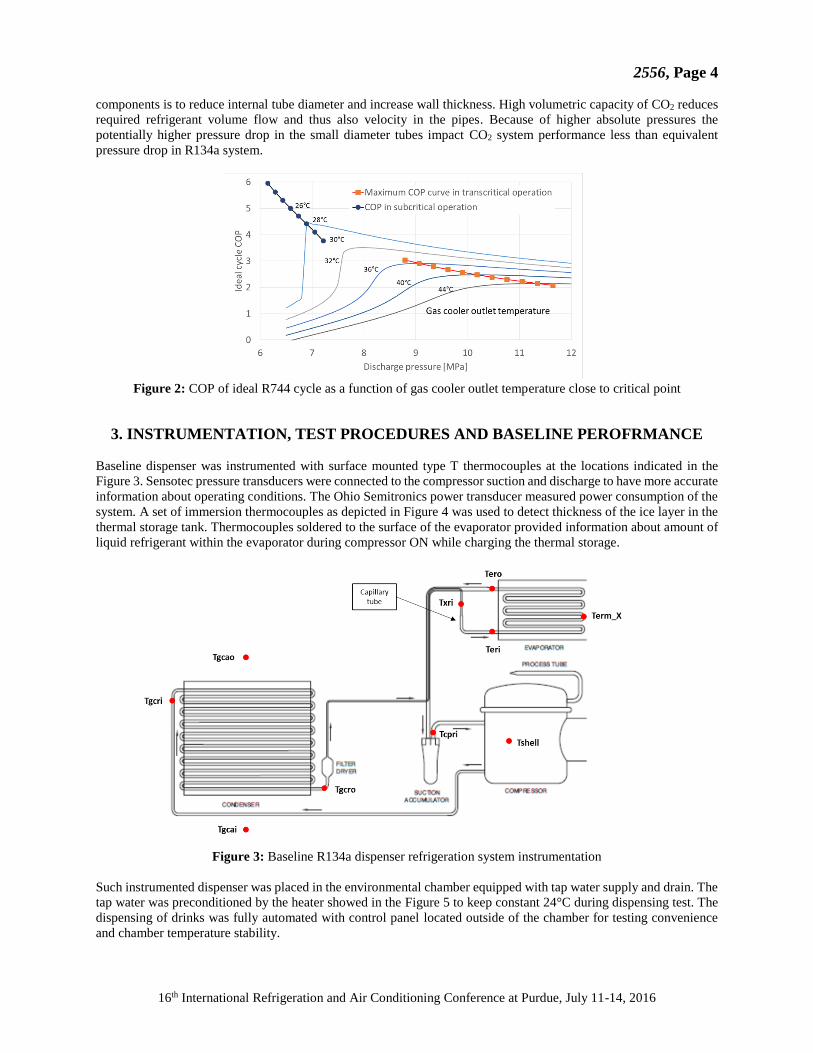
Baseline dispenser was instrumented with surface mounted type T thermocouples at the locations indicated in the
Figure 3. Sensotec pressure transducers were connected to the compressor suction and discharge to have more accurate
information about operating conditions. The Ohio Semitronics power transducer measured power consumption of the
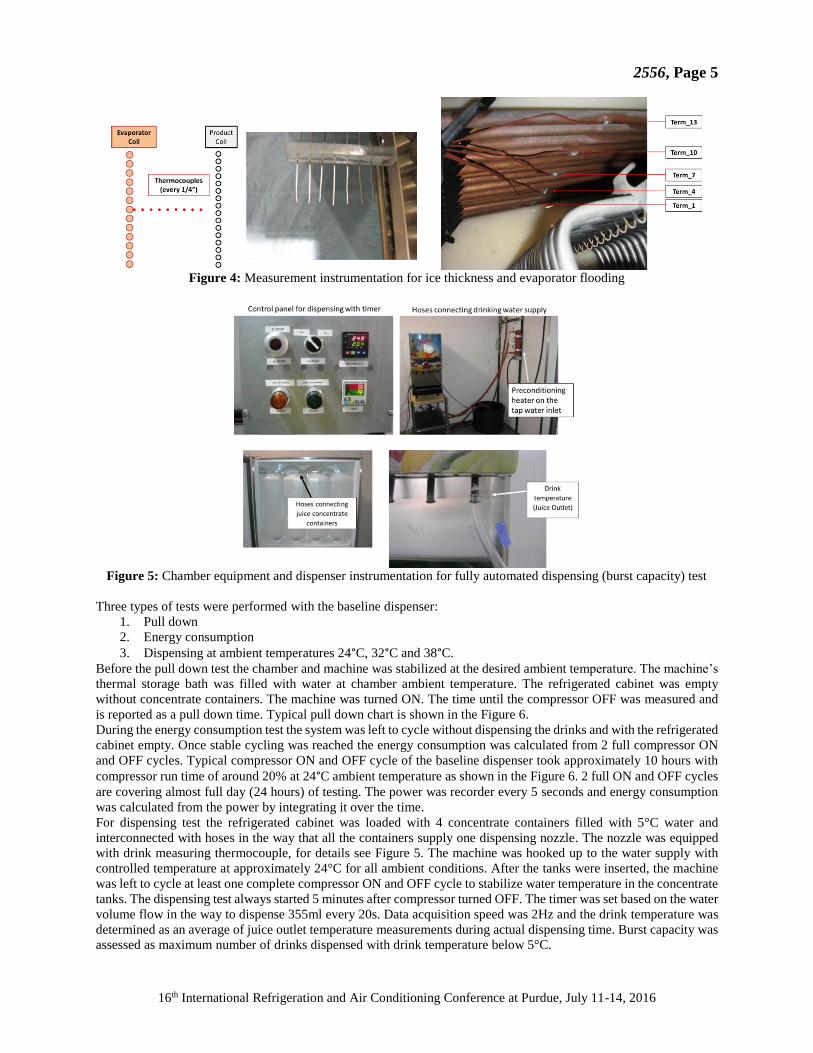
system. A set of immersion thermocouples as depicted in Figure 4 was used to detect thickness of the ice layer in the
thermal storage tank. Thermocouples soldered to the surface of the evaporator provided information about amount of
liquid refrigerant within the evaporator during compressor ON while charging the thermal storage.
Figure 3: Baseline R134a dispenser refrigeration system instrumentation
Such instrumented dispenser was placed in the environmental chamber equipped with tap water supply and drain. The
tap water was preconditioned by the heater showed in the Figure 5 to keep constant 24°C during dispensing test. The
dispensing of drinks was fully automated with control panel located outside of the chamber for testing convenience
and chamber temperature stability.
2556, Page 5
16th International Refrigeration and Air Conditioning Conference at Purdue, July 11-14, 2016
Figure 4: Measurement instrumentation for ice thickness and evaporator flooding
Figure 5: Chamber equipment and dispenser instrumentation for fully automated dispensing (burst capacity) test
Three types of tests were performed with the baseline dispenser:
1. Pull down
2. Energy consumption
3. Dispensing at ambient temperatures 24°C, 32°C and 38°C.
Before the pull down test the chamber and machine was stabilized at the desired ambient temperature. The machine’s
thermal storage bath was filled with water at chamber ambient temperature. The refrigerated cabinet was empty
without concentrate containers. The machine was turned ON. The time until the compressor OFF was measured and
is reported as a pull down time. Typical pull down chart is shown in the Figure 6.
During the energy consumption test the system was left to cycle without dispensing the drinks and with the refrigerated
cabinet empty. Once stable cycling was reached the energy consumption was calculated from 2 full compressor ON
and OFF cycles. Typical compressor ON and OFF cycle of the baseline dispenser took approximately 10 hours with
compressor run time of around 20% at 24°C ambient temperature as shown in the Figure 6. 2 full ON and OFF cycles
are covering almost full day (24 hours) of testing. The power was recorder every 5 seconds and energy consumption
was calculated from the power by integrating it over the time.
For dispensing test the refrigerated cabinet was loaded with 4 concentrate containers filled with 5°C water and
interconnected with hoses in the way that all the containers supply one dispensing nozzle. The nozzle was equipped
with drink measuring thermocouple, for details see Figure 5. The machine was hooked up to the water supply with
controlled temperature at approximately 24°C for all ambient conditions. After the tanks were inserted, the machine
was left to cycle at least one complete compressor ON and OFF cycle to stabilize water temperature in the concentrate
tanks. The dispensing test always started 5 minutes after compressor turned OFF. The timer was set based on the water
volume flow in the way to dispense 355ml every 20s. Data acquisition speed was 2Hz and the drink temperature was
determined as an average of juice outlet temperature measurements during actual dispensing time. Burst capacity was
assessed as maximum number of drinks dispensed with drink temperature below 5°C.
2556, Page 6
16th International Refrigeration and Air Conditioning Conference at Purdue, July 11-14, 2016
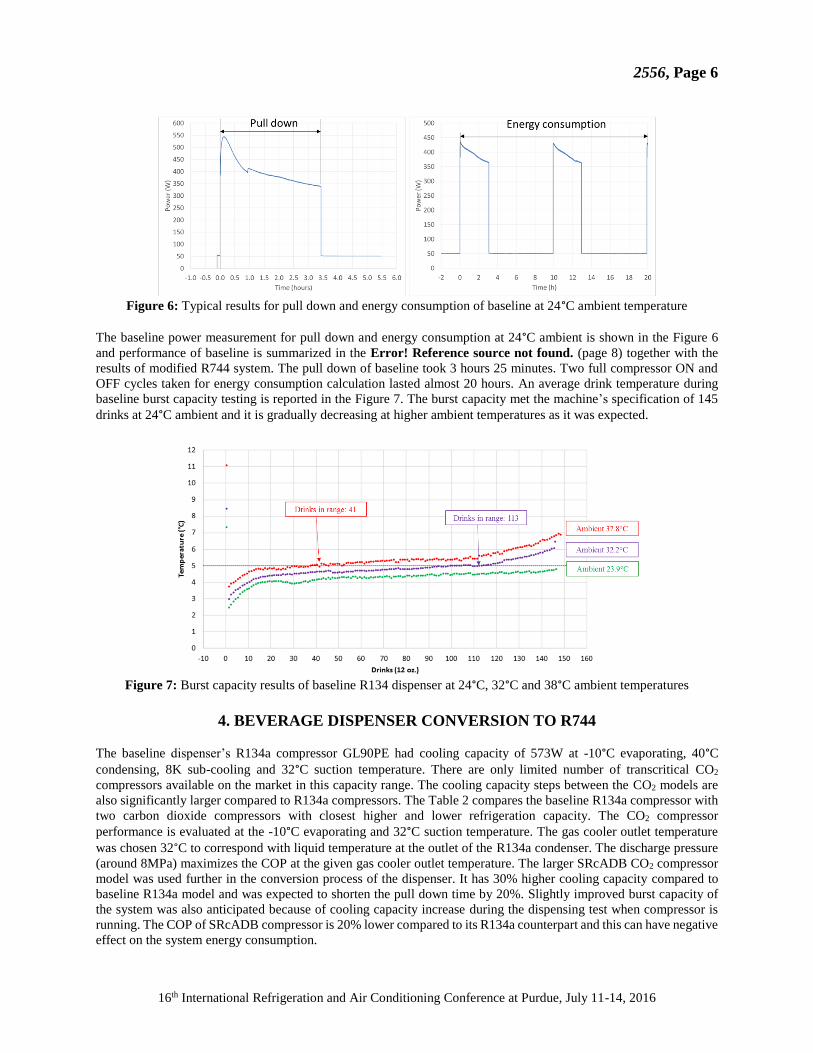
Figure 6: Typical results for pull down and energy consumption of baseline at 24°C ambient temperature
The baseline power measurement for pull down and energy consumption at 24°C ambient is shown in the Figure 6
and performance of baseline is summarized in the Error! Reference source not found. (page 8) together with the
results of modified R744 system. The pull down of baseline took 3 hours 25 minutes. Two full compressor ON and
OFF cycles taken for energy consumption calculation lasted almost 20 hours. An average drink temperature during
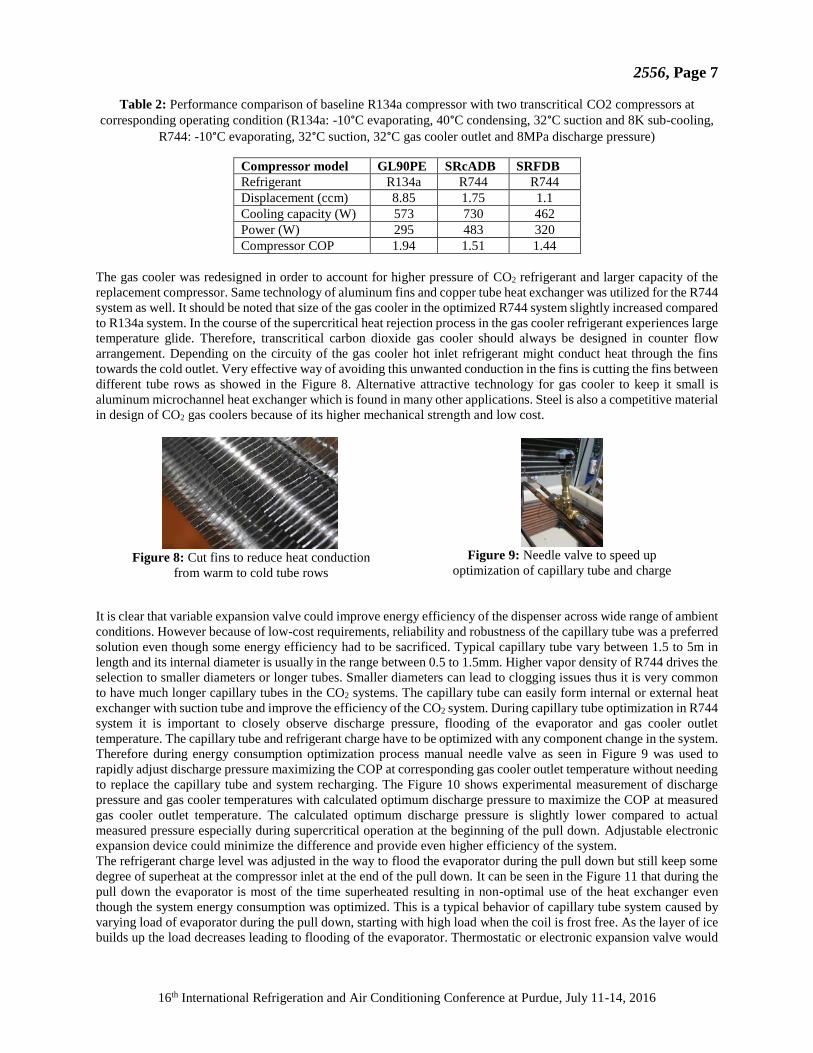
baseline burst capacity testing is reported in the Figure 7. The burst capacity met the machine’s specification of 145
drinks at 24°C ambient and it is gradually decreasing at higher ambient temperatures as it was expected.
Figure 7: Burst capacity results of baseline R134 dispenser at 24°C, 32°C and 38°C ambient temperatures
4. BEVERAGE DISPENSER CONVERSION TO R744
The baseline dispenser’s R134a compressor GL90PE had cooling capacity of 573W at -10°C evaporating, 40°C
condensing, 8K sub-cooling and 32°C suction temperature. There are only limited number of transcritical CO2
compressors available on the market in this capacity range. The cooling capacity steps between the CO2 models are
also significantly larger compared to R134a compressors. The Table 2 compares the baseline R134a compressor with
two carbon dioxide compressors with closest higher and lower refrigeration capacity. The CO2 compressor
performance is evaluated at the -10°C evaporating and 32°C suction temperature. The gas cooler outlet temperature
was chosen 32°C to correspond with liquid temperature at the outlet of the R134a condenser. The discharge pressure
(around 8MPa) maximizes the COP at the given gas cooler outlet temperature. The larger SRcADB CO2 compressor
model was used further in the conversion process of the dispenser. It has 30% higher cooling capacity compared to
baseline R134a model and was expected to shorten the pull down time by 20%. Slightly improved burst capacity of
the system was also anticipated because of cooling capacity increase during the dispensing test when compressor is
running. The COP of SRcADB compressor is 20% lower compared to its R134a counterpart and this can have negative
effect on the system energy consumption.
Ambient 23.9°C
Ambient 32.2°C
Ambient 37.8°C
Drinks in range: 113
2556, Page 7
16th International Refrigeration and Air Conditioning Conference at Purdue, July 11-14, 2016
Table 2: Performance comparison of baseline R134a compressor with two transcritical CO2 compressors at
corresponding operating condition (R134a: -10°C evaporating, 40°C condensing, 32°C suction and 8K sub-cooling,
R744: -10°C evaporating, 32°C suction, 32°C gas cooler outlet and 8MPa discharge pressure)
Compressor model GL90PE SRcADB SRFDB
Refrigerant R134a R744 R744
Displacement (ccm) 8.85 1.75 1.1
Cooling capacity (W) 573 730 462
Power (W) 295 483 320
Compressor COP 1.94 1.51 1.44
The gas cooler was redesigned in order to account for higher pressure of CO2 refrigerant and larger capacity of the
replacement compressor. Same technology of aluminum fins and copper tube heat exchanger was utilized for the R744
system as well. It should be noted that size of the gas cooler in the optimized R744 system slightly increased compared
to R134a system. In the course of the supercritical heat rejection process in the gas cooler refrigerant experiences large
temperature glide. Therefore, transcritical carbon dioxide gas cooler should always be designed in counter flow
arrangement. Depending on the circuity of the gas cooler hot inlet refrigerant might conduct heat through the fins
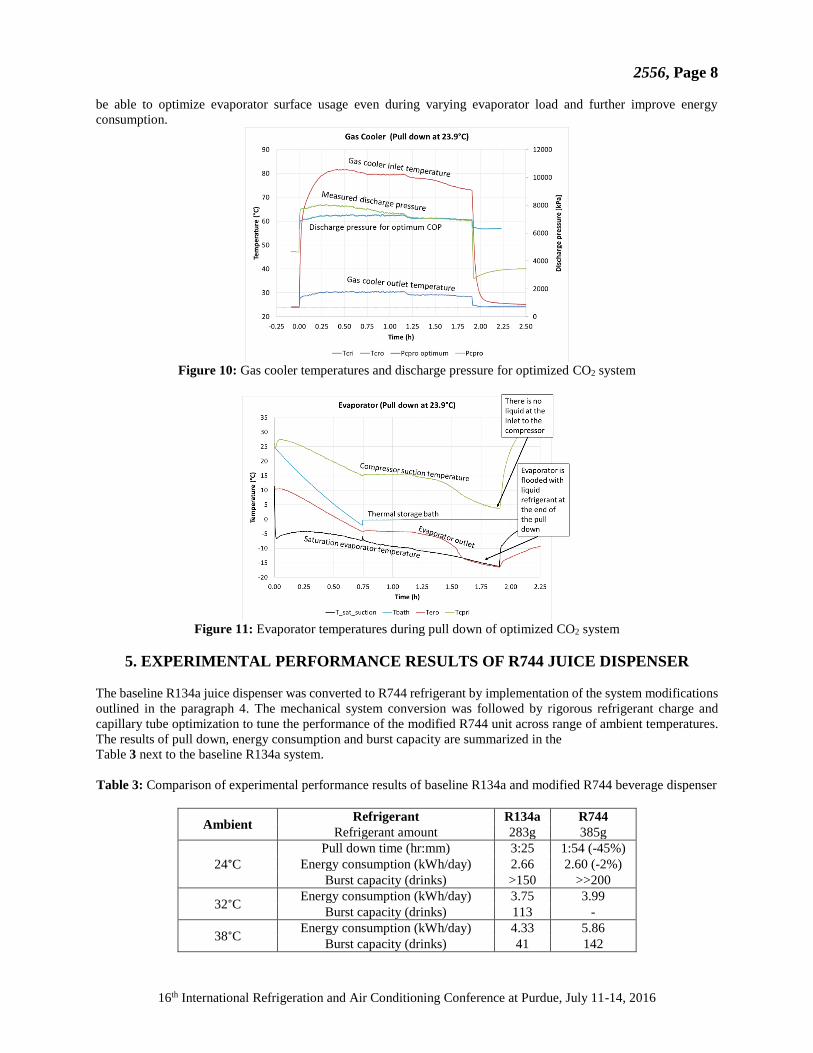
towards the cold outlet. Very effective way of avoiding this unwanted conduction in the fins is cutting the fins between
different tube rows as showed in the Figure 8. Alternative attractive technology for gas cooler to keep it small is
aluminum microchannel heat exchanger which is found in many other applications. Steel is also a competitive material
in design of CO2 gas coolers because of its higher mechanical strength and low cost.
Figure 8: Cut fins to reduce heat conduction
from warm to cold tube rows
Figure 9: Needle valve to speed up
optimization of capillary tube and charge
It is clear that variable expansion valve could improve energy efficiency of the dispenser across wide range of ambient
conditions. However because of low-cost requirements, reliability and robustness of the capillary tube was a preferred
solution even though some energy efficiency had to be sacrificed. Typical capillary tube vary between 1.5 to 5m in
length and its internal diameter is usually in the range between 0.5 to 1.5mm. Higher vapor density of R744 drives the
selection to smaller diameters or longer tubes. Smaller diameters can lead to clogging issues thus it is very common
to have much longer capillary tubes in the CO2 systems. The capillary tube can easily form internal or external heat
exchanger with suction tube and improve the efficiency of the CO2 system. During capillary tube optimization in R744
system it is important to closely observe discharge pressure, flooding of the evaporator and gas cooler outlet
temperature. The capillary tube and refrigerant charge have to be optimized with any component change in the system.
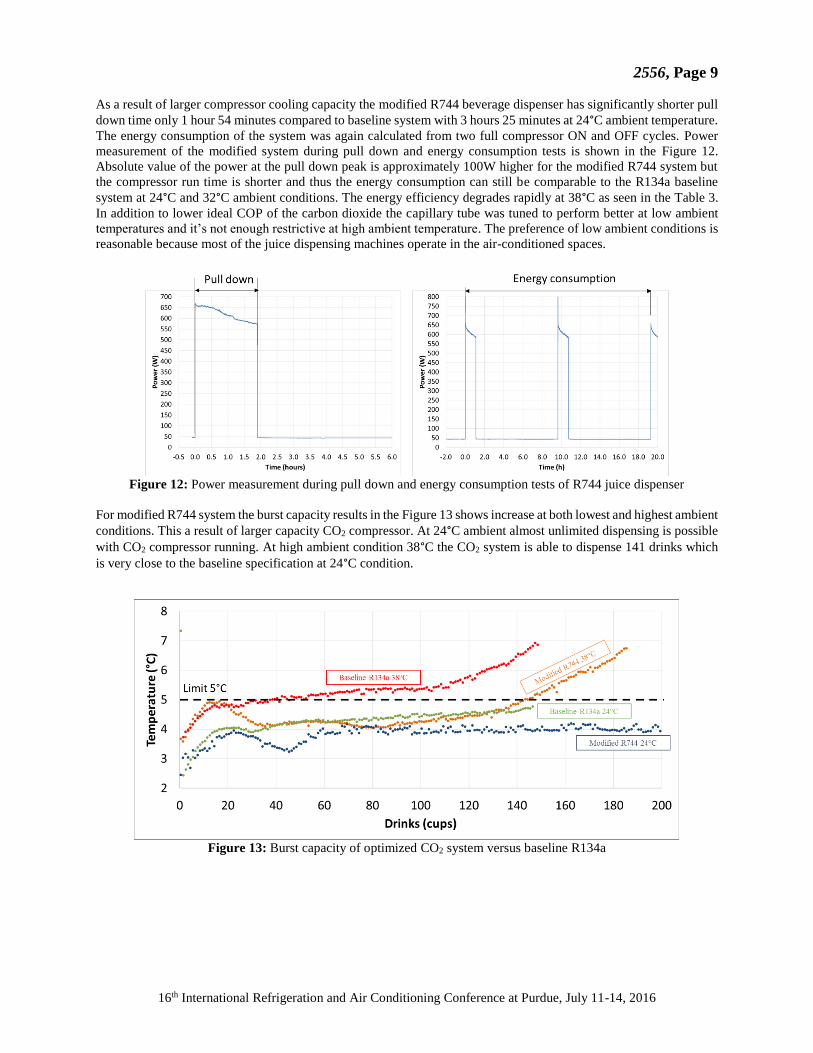
Therefore during energy consumption optimization process manual needle valve as seen in Figure 9 was used to
rapidly adjust discharge pressure maximizing the COP at corresponding gas cooler outlet temperature without needing
to replace the capillary tube and system recharging. The Figure 10 shows experimental measurement of discharge
pressure and gas cooler temperatures with calculated optimum discharge pressure to maximize the COP at measured
gas cooler outlet temperature. The calculated optimum discharge pressure is slightly lower compared to actual
measured pressure especially during supercritical operation at the beginning of the pull down. Adjustable electronic
expansion device could minimize the difference and provide even higher efficiency of the system.
The refrigerant charge level was adjusted in the way to flood the evaporator during the pull down but still keep some
degree of superheat at the compressor inlet at the end of the pull down. It can be seen in the Figure 11 that during the
pull down the evaporator is most of the time superheated resulting in non-optimal use of the heat exchanger even
though the system energy consumption was optimized. This is a typical behavior of capillary tube system caused by
varying load of evaporator during the pull down, starting with high load when the coil is frost free. As the layer of ice
builds up the load decreases leading to flooding of the evaporator. Thermostatic or electronic expansion valve would
2556, Page 8
16th International Refrigeration and Air Conditioning Conference at Purdue, July 11-14, 2016
be able to optimize evaporator surface usage even during varying evaporator load and further improve energy
consumption.
Figure 10: Gas cooler temperatures and discharge pressure for optimized CO2 system
Figure 11: Evaporator temperatures during pull down of optimized CO2 system
5. EXPERIMENTAL PERFORMANCE RESULTS OF R744 JUICE DISPENSER
The baseline R134a juice dispenser was converted to R744 refrigerant by implementation of the system modifications
outlined in the paragraph 4. The mechanical system conversion was followed by rigorous refrigerant charge and
capillary tube optimization to tune the performance of the modified R744 unit across range of ambient temperatures.
The results of pull down, energy consumption and burst capacity are summarized in the
Table 3 next to the baseline R134a system.
Table 3: Comparison of experimental performance results of baseline R134a and modified R744 beverage dispenser
Ambient Refrigerant R134a R744
Refrigerant amount 283g 385g
24°C
Pull down time (hr:mm) 3:25 1:54 (-45%)
Energy consumption (kWh/day) 2.66 2.60 (-2%)
Burst capacity (drinks) >150 >>200
32°C Energy consumption (kWh/day) 3.75 3.99
Burst capacity (drinks) 113 -
38°C Energy consumption (kWh/day) 4.33 5.86
Burst capacity (drinks) 41 142
2556, Page 9
16th International Refrigeration and Air Conditioning Conference at Purdue, July 11-14, 2016
As a result of larger compressor cooling capacity the modified R744 beverage dispenser has significantly shorter pull
down time only 1 hour 54 minutes compared to baseline system with 3 hours 25 minutes at 24°C ambient temperature.
The energy consumption of the system was again calculated from two full compressor ON and OFF cycles. Power
measurement of the modified system during pull down and energy consumption tests is shown in the Figure 12.
Absolute value of the power at the pull down peak is approximately 100W higher for the modified R744 system but
the compressor run time is shorter and thus the energy consumption can still be comparable to the R134a baseline
system at 24°C and 32°C ambient conditions. The energy efficiency degrades rapidly at 38°C as seen in the Table 3.
In addition to lower ideal COP of the carbon dioxide the capillary tube was tuned to perform better at low ambient
temperatures and it’s not enough restrictive at high ambient temperature. The preference of low ambient conditions is
reasonable because most of the juice dispensing machines operate in the air-conditioned spaces.
Figure 12: Power measurement during pull down and energy consumption tests of R744 juice dispenser
For modified R744 system the burst capacity results in the Figure 13 shows increase at both lowest and highest ambient
conditions. This a result of larger capacity CO2 compressor. At 24°C ambient almost unlimited dispensing is possible
with CO2 compressor running. At high ambient condition 38°C the CO2 system is able to dispense 141 drinks which
is very close to the baseline specification at 24°C condition.
Figure 13: Burst capacity of optimized CO2 system versus baseline R134a
2556, Page 10
16th International Refrigeration and Air Conditioning Conference at Purdue, July 11-14, 2016
5. CONCLUSIONS
During the conversion of juice dispenser’s refrigeration system from HFC to transcritical R744 refrigerant it was
necessary to modify following components of the system:
1. Compressor
2. Condenser – gas cooler including shroud and fan
3. Capillary tube
4. Refrigerant charge amount
5. Suction line accumulator
Because of high volumetric capacity of carbon dioxide, the compressor displacement needs to be small to provide
same refrigeration capacity. Design of refrigeration lines and heat exchangers have to be adjusted to withstand
considerably higher pressures. Capillary tube together with refrigerant charge amount have to be very well tuned to
the required ambient conditions in order to reach comparable performance results with R134a. If the modifications
are done thoughtfully it is possible to convert the beverage juice dispenser successfully to R744 with shorter pull down
time, higher burst capacity and comparable energy efficiency with R134a system at lower ambient conditions (24°C
and 32°C) with only a small increase in the system cost. At higher ambient temperature (38°C) the energy consumption
quickly degrades for the CO2 system but the burst capacity is still higher compared to baseline R134a dispenser.
NOMENCLATURE
CO2 carbon dioxide
COP coefficient of performance (-)
DC direct current
GWP global warming potential
HC hydrocarbon
HFC hydrofluorocarbon
HC hydrocarbon
REFERENCES
Boccardi G., Calabrese N., Celata G.P., Masturullo R., Mauro A.W, Perrone A., Trichieri R., (2013). Experimental
evaluation for a carbon dioxide light commercial cooling application under transcritical and subcritical conditions.
Applied Thermal Engineering, 528-535.
BUNN-O-MATIC Corporation (2012). Installation and operating guide (44744.0002). Retrieved from
http://www.bunn.com/product-manuals as of April 27, 2016.
DeAngelis, J.M., Hrnjak, P.S., (2005). Experimental study of system performance improvements in transcritical R744
systems with applications to bottle coolers. University of Illinois at Urbana-Champaign, Air Conditioning and
Refrigeration Center (ACRC), Contract Report 57.
Fuentes, Y.P., Elbel, S., Hrnjak. P., (2014). Proceedings from 15th International Refrigeration and Air Conditioning
Conference at Purdue, July 14-17, 2014: Extremely Low Refrigerant Charge Beverage Display Cooler Technology
Using Propane. West Lafayette IN USA.
Fuentes P.Y., Hrnjak P., Elbel S., (2015). High-efficiency, low-cost glass door merchandisers using transcritical
carbon dioxide. 24th IIR International Congress of Refrigeration, Yokohama, Japan, August 16-22, Paper 305.
Kim, M.-H., Pettersen, J., Bullard, C.W., (2004). Fundamental process and system design issues in CO2 vapor
compression systems. Progress in Energy and Combustion Science, vol. 30, no. 2: p. 119-174.
The Coca-Cola Company, (2016). 2014/2015 Sustainability Report. Retrieved from:
http://www.coca-colacompany.com/content/dam/journey/us/en/private/fileassets/pdf/2015/09/2014-2015-
sustainability-report.pdf.