Embed Size (px)
Citation preview
Tracking RPE TransplantsLabeled by Retroviral GeneTransfer with Green FluorescentProtein
Chi-Chun Lai,1 Peter Gouras,1 Ken Doi,1
Fang Lu,1 Hild Kjeldbye,1 Steven P. Goff,2
Robert Pawliuk,4 Philippe Leboulch,3 andStephen H. Tsang2,5
PURPOSE. To determine whether human retinal pigmentepithelium (RPE) can be modified by retroviral-mediatedgene transfer and to monitor the human RPE cells in thesubretinal space of living rabbits with scanning laser oph-thalmoscopy (SLO).
METHODS. Cultured human fetal retinal pigment epithe-lium (HFRPE) was exposed to green fluorescent protein(GFP)-transducing retroviral vectors, Moloney murineleukemia virus, and lentivirus. The cultured cells werefollowed by fluorescence microscopy. Suspensions ofGFP-expressing HFRPE were transplanted into the sub-retinal space of pigmented rabbits, and the transplantsites were examined by SLO for fluorescence, includ-ing fluorescein and indocyanine green angiography.The rabbits were euthanatized at different times aftertransplantation, and the retinas were studied histologi-cally.
RESULTS. Retroviral gene transfer can introduce a foreigngene such as GFP into cultured HFRPE. Gene expression ismaintained in cultured RPE for at least 3 months. Thelentiviral vector traduced both nondividing and dividingcells; the Moloney vector only transduced the latter. GFP-expressing cells can be followed in the living retina. Theirchanges reflect the rejection response followed histologi-cally.
CONCLUSIONS. Cultured HFRPE could be transduced to ex-press GFP for long periods of time by retroviral genetransfer. GFP allowed retinal transplants and gene expres-
sion to be monitored in vivo. These results provide amodel for potential ex vivo gene therapy in the subretinalspace. (Invest Ophthalmol Vis Sci. 1999;40:2141–2146)
The green fluorescent protein (GFP) gene has been derivedfrom the bioluminescent jelly fish, Aequorin victoria. This
protein fluoresces green light when excited by blue or ultravi-olet light. The cloning of this gene and the demonstration thatit can be expressed in other organisms provides a useful way toselect and follow cells exhibiting specific gene expression,1–3
especially in a transparent structure such as the eye.4
We have used replication-deficient retroviruses to trans-duce cultured human fetal retinal pigment epithelium (HFRPE)with the gene encoding GFP. We followed the expression ofthis protein in vitro by fluorescence microscopy and in vivoafter transplantation to the subretinal space of rabbits by scan-ning laser ophthalmoscopy (SLO). We demonstrated that ret-roviral transduction is effective, stable, and long-lasting in vitro.It allows transplanted RPE to be monitored in the subretinalspace and provides a noninvasive indicator of the time courseof rejection. An abstract on some of this research has beenpublished.5
METHODS
Culturing of RPE
Donor tissue was obtained from human fetal eyes, 16 to 20weeks of gestational age. Informed consent was obtained forthe use of this tissue before abortion and institutional approvalwas granted through an agreement between Albert EinsteinCollege of Medicine, the source of the tissue, and ColumbiaUniversity. The eye bulbs were washed externally with 70%alcohol and then with phosphate-buffered saline (PBS). Theeyes were put into our standard RPE culture medium, Dulbec-co’s modified Eagle’s medium with 4.5 g/l glucose supple-mented with 20% fetal calf serum (Hyclone, Logan, Utah), 2mM L-glutamine and penicillin (50 unit/ml)/streptomycin (50mg/ml) (Gibco, Grand Island, NY). The anterior segment withlens, vitreous, and neural retina was removed. The posteriorsegment was sliced into quadrants, and RPE patches wereseparated gently from Bruch’s membrane and choroid, usingfine forceps and microscopic viewing. A distinct cleavageplane is identifiable between the taut monolayer patch of RPEand the adjacent choroid so that an isolated sheet of RPE can bepulled off. Each sheet was placed in a separate culture plate.The edges of the sheet were pressed onto the surface of theplate with the tip of a 26-gauge needle. The cultures weremaintained at 37°C in an incubator with a humidified atmo-sphere of 95% air/5% CO2, fed every 3 to 4 days, and examinedalmost daily. To obtain cell suspensions, we washed the cellswith PBS three times and exposed them to 2.5% trypsin inHank’s solution with EDTA without Ca and Mg (Gibco) for 10minutes at 37°C. The monolayer was triturated into single cellsor clusters of cells by repeated pipetting. The concentration ofcells in a suspension was determined with a hemocytometer.The cells were either used for transplantation or subcultured.
From the 1Departments of Ophthalmology and 2Biochemistry, andMolecular Biophysics, Columbia University, Howard Hughes MedicalInstitute, New York, New York; 3Harvard Medical School; Massachu-setts Institute of Technology; 4Genetix Pharmaceuticals, Inc., Cam-bridge, Massachusetts; and 5The Jules Stein Eye Institute, UCLA, LosAngeles, California.
Supported by The Foundation Fighting Blindness, a National In-stitutes of Health Grants EY RO1-EY03854 (PG) and %32 EY07105(SHT), and by a fellowship (KD) from the International Human FrontierScience Program, and Fight for Sight, Research Division of PreventBlindness (SHT). S. P. Goff is an investigator of the Howard HughesMedical Institute.
Submitted for publication October 8, 1998; revised March 8, 1999;accepted April 8, 1999.
Proprietary interest category: P.Reprint requests: Peter Gouras, Columbia University, Department
of Ophthalmology, 630 West 168th Street, New York, NY 10032.
Investigative Ophthalmology & Visual Science, August 1999, Vol. 40, No. 9Copyright © Association for Research in Vision and Ophthalmology 2141
R E P O R T S
Downloaded From: http://jov.arvojournals.org/pdfaccess.ashx?url=/data/journals/iovs/932897/ on 03/26/2018
Preparation of Virus Stocks
For the Moloney vector a DNA construct was generated con-sisting of the humanized red-shifted GFP (EGFP) under thetranslational control of an Internal Ribosome Entry Site fromthe encephalomyocarditis virus (EMCV-IRES), flanked by longterminal repeat (LTR) of Moloney murine leukemia virus(MoMLV). These viral sequences include the two LTRs, and thetwo sites for initiation of viral DNA synthesis (the primerbinding site for initiation of minus-strand DNA synthesis andthe polypurine tract for initiation of plus-strand synthesis).They also include the RNA packaging signal, termed the Psiregion, near the 59 end of the genome.
The construct was then introduced into AM 12 packagingcells that express the viral proteins required for the assembly ofa virion particle. The viral RNA was transcribed from a trans-fected plasmid and selectively packaged into viral particlesproduced by the packaging cells. The virions were collectedfrom the culture medium, purified, and concentrated asneeded. To transduce the gene to RPE, the virus was applieddirectly to the target cells. Typical titers were 105 to 106
infectious units/ml.For the lentiviral vector, human immunodeficiency virus
(HIV)-based preparations were generated by cotransfection ofhuman kidney–derived 293T cells by three plasmids using theCaPO4 method.6 The packaging construct contained the cyto-megalovirus promoter and the insulin polyadenylation signal toexpress all the viral proteins in trans, except the envelope andVpu.6 The second plasmid provided a vector with all thecis-acting elements that allow transfer and integration into thetarget cell. In this transducing vector, an expression cassettewith the Rev responsive element (RRE) and the cytomegalovi-rus promoter are used to direct the expression of GFP.6 Thethird plasmid provides the envelope protein from the vesicularstomatitis virus glycoprotein to enhance the viral stability andthe range of possible target cells.6 The titer of the HIV vectorwas determined by a fluorescent activated cell sorter (FACStarplus; Becton Dickinson, Mountain View, CA) scanning GFP-transduced cells. The lentiviral titers were determined by in-fection of 293 cells seeded in 6-well plates at 1 3 105 cells perwell the day before infection with serial dilution of concen-trated viral stock in the presence of 8 mg/ml of polybrene(Aldrich, Milwaukee, WI). After overnight incubation, the cellculture medium was changed, and the cells were incubatedfurther for 2 days. GFP fluorescent cells were identified byfluorescent microscopy and/or the FACS. Typical titers were108 to 109 infectious units/ml.
In Vitro Transfection
For viral transduction, primary cultures were dissociated intocell suspensions and subcultured in 6-well plates containingapproximately 105 cells/well. This promotes cell division andaugments the total number of cells available. After 24 hours instandard RPE culture medium, the medium was replaced withthe viral solution, consisting of Hepes buffer with 20% fetal calfserum, 2 mM L-glutamine, 8 mg/ml polybrene, and a viral titerof 105 to 107 infectious units/ml before concentration. Thissolution was replaced with fresh viral solution every 6 hoursfor 48 hours. After 48 hours, this solution was replaced withstandard RPE medium, and the cultures were allowed to reachconfluency, examined by fluorescence microscopy, and usedfor transplantation.
For comparing viral transduction of stationary versus di-viding cells, the virus was introduced directly into the primaryculture containing the original patch of heavily pigmentedcells, surrounded by an expanding population of dividing cells,the size of which depended on the age of the culture. Todetermine the fraction of cells expressing GFP, the number ofGFP fluorescent cells and the total number of cells werecounted within defined areas, 0.4 3 0.8 mm, in the cultureplate. All cells that showed green fluorescence were consid-ered to be expressing GFP. We examined cells in the sameareas in three different parts of each culture plate, the patchthat contained stationary pigmented cells only, the edge of thepatch where cells were migrating and entering into cell divi-sion, and the growing margin of the culture, which containedmany fewer pigmented, dividing cells. We measured thesesame areas repeatedly in 15 different cultures, weekly for 3weeks; 5 cultures were measured for 6 weeks, and 1 culture for3 months. In one case, we dissociated a primary culture thatwe had examined for 3 months and replated the cells to followGFP fluorescence after repeated cell division.
Transplantation
Thirty adult pigmented rabbits received subretinal trans-plants placed within small bleb detachments just below themyelinated region of the optic nerve. Bleb detachments alsowere formed in two rabbits with saline alone. Each animalwas anesthetized with sodium pentobarbital (25 mg/kg,intramuscularly) and xylazine (10 mg/kg, intramuscularly).The pupil was dilated with 2% cyclopentolate and 2.5%neosynephrine. A lid speculum was used to keep the eyeopen and occasionally a canthotomy also was performed. Aconjunctival flap was formed at the limbal region, and asclerotomy made approximately 3 mm behind the limbus. Aglass pipette with a tip diameter of 80 to 100 mm, connectedto a 1-ml syringe and filled with balanced salt solution (BSS)was introduced into the vitreal cavity. Using a corneal con-tact lens and a surgical microscope the pipette was directedto the retinal surface. At the surface of the retina a jet streamof BSS was slowly injected through the neural retina toproduce a small bleb detachment. A second similar pipettewas used to suck up a pellet of a concentrated solution ofGFP-expressing HFRPE cells from the bottom of an Eppen-dorf tube. The cell suspension was obtained by rinsing aculture three times with PBS and then dissociating the cellswith 0.05% trypsin for 5 minutes at 37°C. The cells werewashed with PBS and centrifuged. The pellet was resus-pended in 0.5 ml BSS, put into an Eppendorf tube, centri-fuged at 1000 rpm for 2 minutes, and stored at 4°C. The cellswere used within 2 hours of preparation. Approximately 10ml of cell suspension containing approximately 105 cells wasintroduced into the bleb detachment, either through thesame retinotomy or through a second one; the latter methodwas preferable because it minimized any reflux of transplantcells into the vitreous. A small air bubble separated thesuspension from the BSS solution in the pipette. The bubblealso was introduced into the bleb detachment to preventefflux of the transplant cells into the vitreous. The air bubbledisappeared in 24 hours. After the pipette was removed, thesclera and conjunctiva were sutured with 9-0 nylon.
2142 Reports IOVS, August 1999, Vol. 40, No. 9
Downloaded From: http://jov.arvojournals.org/pdfaccess.ashx?url=/data/journals/iovs/932897/ on 03/26/2018
Retinal Examination
Rabbits were examined 1 day after surgery, weekly for 8weeks, and monthly thereafter by indirect ophthalmoscopy,SLO (Rodenstock, Munich, Germany) and sometimes by con-tact lens biomicroscopy. The SLO provided infrared (780nmoles), He-Neon red (633 nmoles), argon green (514nmoles), and blue (488 nmoles) illumination. We examined
retinal fluorescence with argon blue illumination and a fluores-cein barrier filter. We graded the fluorescence using a scale of0 to 4 (0, no fluorescence,; 1, just detectable; 2, distinct; 3,strong; 4, very strong). Fluorescein and indocyanine green(ICG) angiography were performed simultaneously with anSLO double-detection system that was able to detect fluores-cein and ICG simultaneously. Angiography was performed
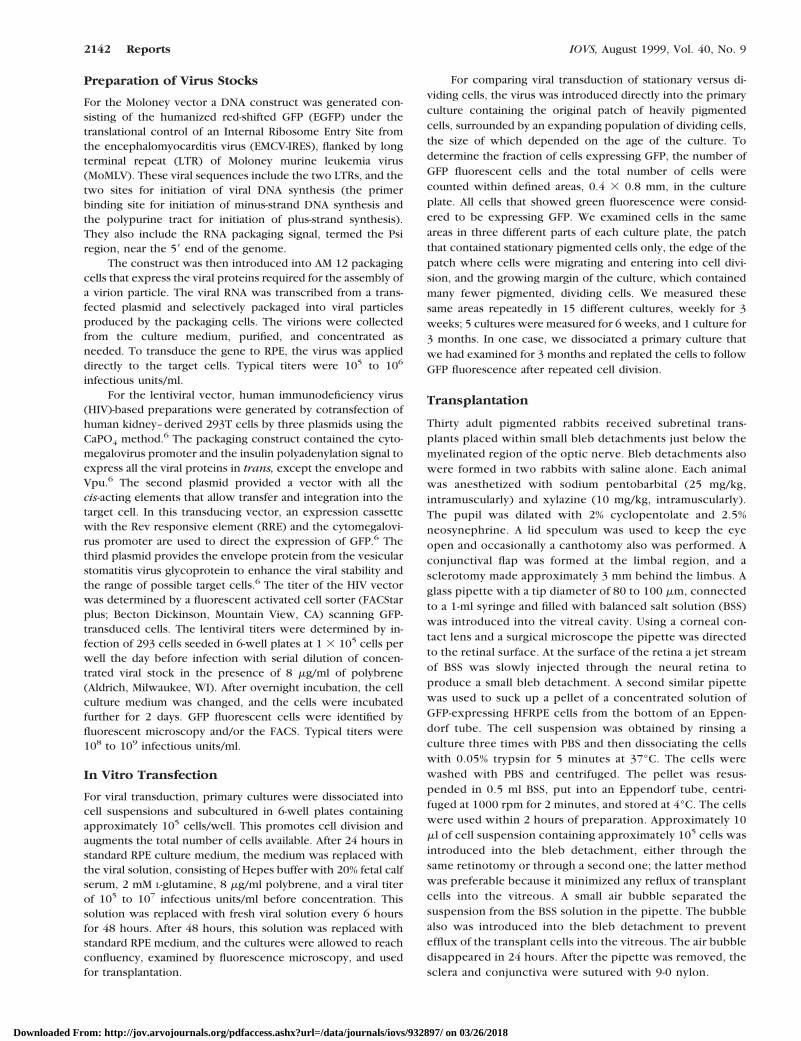
FIGURE 1. Color photographs of cultured HFRPE transfected with the GFP gene by Lentivirus 6 weeks previously. (A) An HFRPE patch culture(on the left) spreading out across the culture plate (on the right) photographed by both fluorescent and transmitted white light. Strong greenfluorescence is visible on the left. (B) The same area as (A), photographed by fluorescence only. Both stationary (left) and dividing (right) cells showGFP fluorescence. (C) A HFRPE patch culture that shows no fluorescence (upper left) except along its border with cells migrating from its edge.(D) The same area as (C), photographed by fluorescence only. There is no fluorescence in the upper left, which appears identical with controlcultures never exposed to the virus. GFP fluorescence is seen only along the edge of this patch and in the dividing cells (right). (E) GFP fluorescentHFRPE transplanted to the subretinal space of rabbit 1 week earlier. (F) Histologic section, stained with toluidine blue, showing cellularinflammation in a transplant site at 9 days after surgery. Asterisks, RPE cells with melanin; curved arrows, monocytes; straight arrows, rarechoriocapillary.
IOVS, August 1999, Vol. 40, No. 9 Reports 2143
Downloaded From: http://jov.arvojournals.org/pdfaccess.ashx?url=/data/journals/iovs/932897/ on 03/26/2018
weekly for 2 to 3 weeks and monthly thereafter. The dyes wereinjected into an ear vein in one bolus containing 0.2 ml fluo-rescein (100 mg/ml) and 0.7 ml ICG (4.2 mg/ml).
Histology
After the rabbit was euthanatized, the eyes were enucleated,punctured with a 20 gauge needle at several places near thelimbus to facilitate diffusion, and immersed in a solution ofeither 3% glutaraldehyde or 4% paraformaldehyde in PBS at pH7.2 for 24 to 48 hours at 4°C. The eyes then were washed withPBS and dissected with the aid of a microscope. The transplantsite was located, examined, and cut out with its orientationmarked so that the site could be reached with minimal section-ing. For Epon embedding, glutaraldehyde-fixed segments werepostfixed with 1% osmic acid and dehydrated with ethanol.Sections were cut semi-serially and examined by light micros-copy; selected areas were examined by electron microscopy.For cryosectioning paraformaldehyde-fixed segments were im-mersed in OCT compound (Miles, Elkhart, IN) and frozen bydry ice. Cryosectioning was performed on a Leica 1850 cryo-tome (Leica Instruments, Nusslach, Germany). Sections weremounted on gelatinized glass slides with fluoromount-G. GFPpolyclonal antibody (diluted 1:100; Clontech Laboratories, PaloAlto, CA) was used for immunocytochemistry. Cultured RPEcells not exposed to the virus were used as a negative control.
RESULTS
GFP fluorescence was detectable in cultured HFRPE within 5days after being exposed to the retrovirus. The MoMLV onlytransduced dividing cells that occurred along the edge of patch
cultures spreading out centrifugally over the culture plate.7
The lentivirus transduced both stationary and dividing cells.Figure 1 shows heavily pigmented stationary cells within apatch culture and more lightly pigmented dividing cells spread-ing our from this patch, viewed by both fluorescent and trans-mitted white light, 6 weeks after exposure to Lentivirus. Figure1B shows only the fluorescence of the same area. Green fluo-rescence can be seen in both the stationary and dividing cells.Figure 1C shows a heavily pigmented patch of stationary cells,which do not show any fluorescence (upper left). These cellsappear identical with controls that have not been exposed to
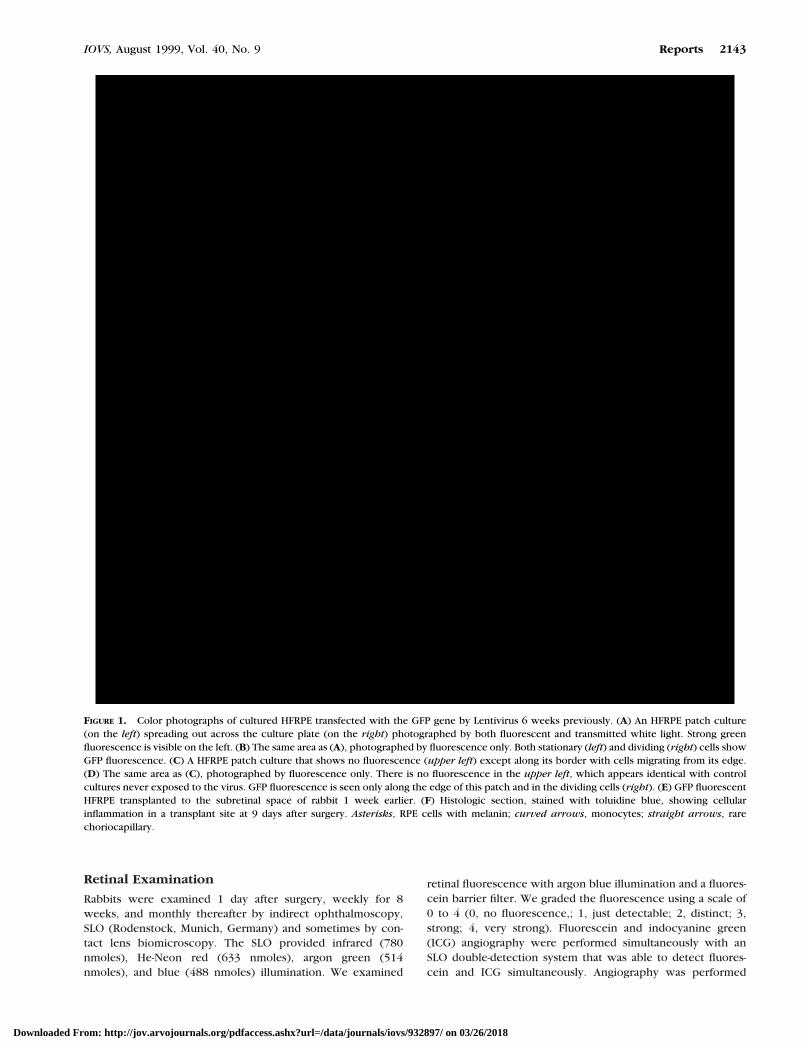
FIGURE 2. The relationship between the fraction of cultured HFRPE-expressing GFP fluorescence at different times after transduction withLentivirus. Each data point is the average of measurements made inthree different areas of 10 separate cultures; the vertical lines show thestandard errors of the mean.
FIGURE 3. A transplant site in rabbit retina seen by SLO one week aftersurgery. The transplant site is the oval-like structure on the left with itsupper edge just under the myelinated optic nerve fibers (seen best inA). (A) Red light image shows the transplant mainly by a light borderthat surrounds it. (B) Infrared image shows the transplant as a darkergranular structure that stands out in the lighter normal retina. (C)Fluorescence image that reveals the GFP-positive cells in the trans-plant.
2144 Reports IOVS, August 1999, Vol. 40, No. 9
Downloaded From: http://jov.arvojournals.org/pdfaccess.ashx?url=/data/journals/iovs/932897/ on 03/26/2018
the virus. The fluorescence seen in this culture (Fig. 1D) occursonly at the edge of the patch and in the lightly pigmented cellsmigrating away from the patch. Subcultured cells continue toexpress GFP. The overall level of expression remained rela-tively stable for a 3-month period of observation. Immunohis-tochemistry confirmed the presence of GFP protein in thecultured RPE. Figure 2 shows the fraction of HFRPE cellsexpression detectable GFP fluorescence in vitro for 2 months.Approximately 30% of the cultured cells showed expression ofhigh level of GFP fluorescence within the first week afterexposure to the virus. This fraction slowly increased during thefirst month to reach approximately 45%.
Figure 3 shows an HFRPE transplant in the subretinalspace of pigmented rabbit retina at 1 week after surgery byvisible (red) (A) and infrared (B) illumination and fluorescenceSLO (C). The transplant was better seen as a dark subretinalstructure by infrared than by visible illumination; even itsoverall thickness can be estimated by its absorption of infraredlight. Fluorescence revealed the GFP-expressing cells withinthe transplant. The dimensions of these bright structures withrelatively sharp outlines approximated those of either singlecells or small groups of cells. The fluorescent cells are congru-ent with the dark subretinal transplant seen by infrared illumi-nation. The transplanted cells fill the area of the original blebdetachment visible by a dim demarcation line seen better byvisible than infrared illumination.
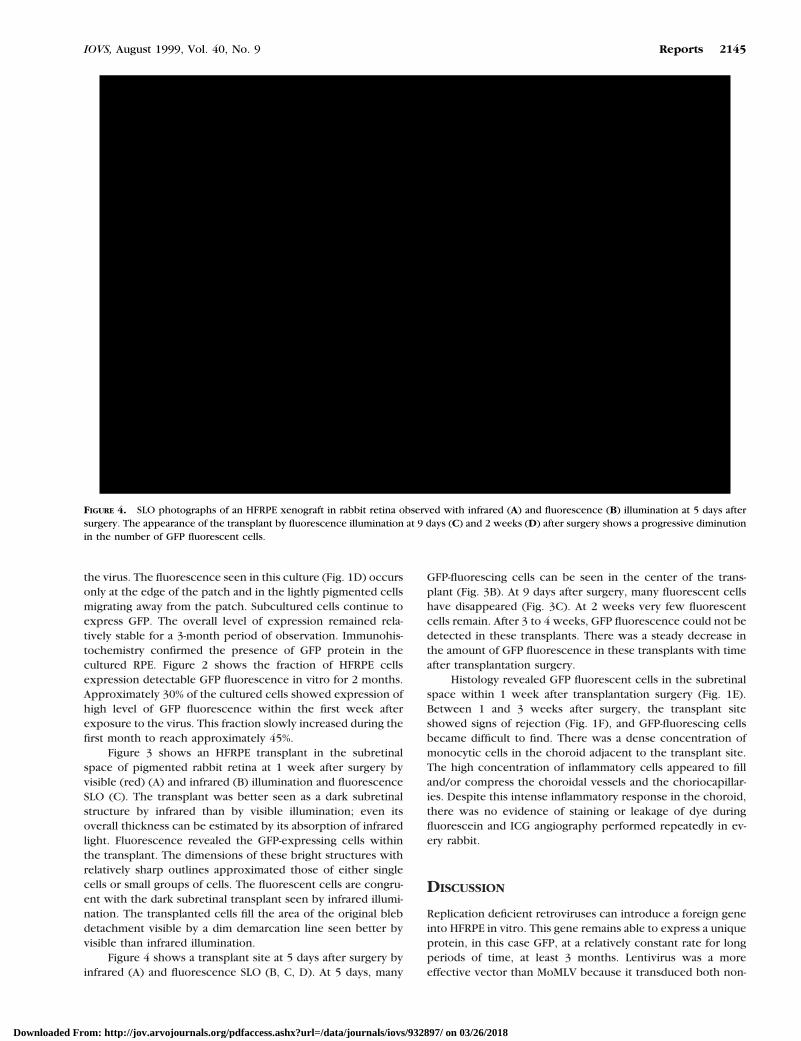
Figure 4 shows a transplant site at 5 days after surgery byinfrared (A) and fluorescence SLO (B, C, D). At 5 days, many
GFP-fluorescing cells can be seen in the center of the trans-plant (Fig. 3B). At 9 days after surgery, many fluorescent cellshave disappeared (Fig. 3C). At 2 weeks very few fluorescentcells remain. After 3 to 4 weeks, GFP fluorescence could not bedetected in these transplants. There was a steady decrease inthe amount of GFP fluorescence in these transplants with timeafter transplantation surgery.
Histology revealed GFP fluorescent cells in the subretinalspace within 1 week after transplantation surgery (Fig. 1E).Between 1 and 3 weeks after surgery, the transplant siteshowed signs of rejection (Fig. 1F), and GFP-fluorescing cellsbecame difficult to find. There was a dense concentration ofmonocytic cells in the choroid adjacent to the transplant site.The high concentration of inflammatory cells appeared to filland/or compress the choroidal vessels and the choriocapillar-ies. Despite this intense inflammatory response in the choroid,there was no evidence of staining or leakage of dye duringfluorescein and ICG angiography performed repeatedly in ev-ery rabbit.
DISCUSSION
Replication deficient retroviruses can introduce a foreign geneinto HFRPE in vitro. This gene remains able to express a uniqueprotein, in this case GFP, at a relatively constant rate for longperiods of time, at least 3 months. Lentivirus was a moreeffective vector than MoMLV because it transduced both non-
FIGURE 4. SLO photographs of an HFRPE xenograft in rabbit retina observed with infrared (A) and fluorescence (B) illumination at 5 days aftersurgery. The appearance of the transplant by fluorescence illumination at 9 days (C) and 2 weeks (D) after surgery shows a progressive diminutionin the number of GFP fluorescent cells.
IOVS, August 1999, Vol. 40, No. 9 Reports 2145
Downloaded From: http://jov.arvojournals.org/pdfaccess.ashx?url=/data/journals/iovs/932897/ on 03/26/2018
dividing as well as dividing cells. MoMLV only transduced thelatter. RPE patch cultures provide an easily identifiable anddiscrete group of cells that show no evidence of division. Cellswithin such patches retain the same appearance and pigmen-tation and do not increase in number for months. Dividing cellsare easy to identify by their progressive loss of pigmentation,their continuous migration away from the edge of the patch,and their increase in numbers.7 Therefore, human fetal RPEprovides a good system to examine the transduction of divid-ing versus stationary, presumably nondividing, cells in vitro.
The variation in GFP fluorescence among the cells maybe due to different sites of chromosomal integration, assum-ing this occurs. It also may be due to multiple integrationand/or expression sites within the same cell. The fact thatGFP expression is continuously maintained after subcultur-ing and repeated cell division suggests that chromosomalintegration has occurred. This can be better tested by South-ern blot analysis or polymerase chain reaction of the GFPgene in genomic DNA.
GFP exhibits a strong, nonquenchable fluorescence that iseasy to monitor by SLO viewing. Single transplanted cells orsmall groups of cells can be distinguished and followed non-invasively and long term. In our experiments, GFP-expressingHFRPE was transplanted into the subretinal space of rabbits,therefore, as xenografts. This led to rejection usually within 1to 3 weeks after transplantation surgery. GFP-fluorescent cellswere identifiable within the subretinal space in relatively largenumbers within the first week after transplantation, but theirnumbers began to diminish as rejection progressed. Thechanges in GFP fluorescence followed the time course of therejection process observed histologically. Therefore, GFP ex-pression provided an in vivo monitor of the viability and geneexpression of transplanted RPE.
The fact that a substantial number of cells do not showfluorescence reduces the sensitivity of the technique. This canbe improved by FACS just before transplantation. On the otherhand, GFP fluorescence appears to be specific for the trans-planted cells because all trace of its fluorescence disappearsafter the transplant is rejected. Host rejection has preventedtesting the long-term expression of these cells in vivo. This canbe done by using allografts or homografts rather than xeno-grafts in the future.
We found that GFP is an excellent monitor of not only theviability but also the function of the transplanted RPE, asmanifest by gene expression and protein synthesis. By usingthis marker, one can track the presence of cells placed in the
subretinal space and also monitor whether they are expressinga potentially therapeutic gene linked in tandem to the expres-sion of GFP. The fact that RPE can be cultured easily providesa way to optimize the expression of a particular gene in vitrobefore it is introduced into the subretinal space. The questionof rejection could of course be eliminated by using autograftssuch as cultured iris pigment epithelium from the same subjectwho is the target of such ex vivo form of gene therapy. Futureengineering of RPE cells by retroviral vectors will undoubtedlyaugment their use in transplantation. In addition a marker thatcan be used to identify transplanted cells in the retina ophthal-moscopically will facilitate determining whether certain RPEallografts can survive in the subretinal space of human subjectswithout immunosuppression.8
Acknowledgments
The authors thank Inder M. Verma of the Salk Institute, La Jolla,California, for his generous contribution of the plasmids for establish-ing the Lentivirus vector, and Dorothy Warburton and Karen Weiden-heim for their assistance.
References
1. Shimomura O, Johnson FH, Saiga Y. Extraction, purification andproperties of aequorin, a bioluminescent protein from the lumi-nous hydromedusan, Aequorea. J. Cell Comp Physiol. 1962;59:223–227.
2. Prasher DC, Eckenrode VK, Ward WW, Prendergast FG, CormierMJ. Primary structure of the Aequorea victoria green fluorescentprotein. Gene. 1992;111:229–233.
3. Chalfie M, Tu Y, Euskirchen G, Ward WW, Prasher DC. Greenfluorescent protein as a marker for gene expression. Science.1994;263:802–805.
4. Bennett J, Duan D, Engelhardt JF, Maguire AM. Real-time, nonin-vasive in vivo assessment of Adeno-asoociated virus-mediated ret-inal transduction. Invest Ophthalmol Vis Sci. 1997;38:2857–2863.
5. Lai C, Pawliuk R, Gouras P, Tsang S, Lu F, Doi K, et al. Geneticallyengineered human RPE transplants express green fluorescent pro-tein in the subretinal space[ARVO Abstract]. Invest OphthalmolVis Sci. 1998;39(4):S19. Abstract nr 73.
6. Naldini L, Blomer U, Gallay P, et al. In vivo gene delivery and stabletransduction of nondividing cells by a Lentiviral vector. Science.1996;272:263–267.
7. Gouras P, Cao H, Sheng, Y, Tanabe T, Efremova Y, Kjeldbye H.Patch culturing and transfer of human fetal retinal epithelium.Graefes Arch Clin Exp Ophthalmol. 1994;232:599–607.
8. Algvere P, Berglin L, Gouras P, Sheng Y, Dafgard Kopp E. Trans-plantation of RPE in age-related macular degeneration: observa-tions in disciform lesions and dry RPE atrophy. Graefes Arch ClinExp Ophthalmol. 1997;235:149–158.
2146 Reports IOVS, August 1999, Vol. 40, No. 9
Downloaded From: http://jov.arvojournals.org/pdfaccess.ashx?url=/data/journals/iovs/932897/ on 03/26/2018
Corneal Epithelial–SpecificCytokeratin 3 is an Autoantigenin Wegener’s Granulomatosis–Associated Peripheral UlcerativeKeratitisIrena Reynolds,1 Andrew B. Tullo,2
Sally L. John,3 P. J. Lennox Holt,1 andM. Chantal Hillarby1
PURPOSE. In a previous investigation it was demonstratedthat circulating antibodies to a 66-kDa corneal epithelialantigen (BCEA-A) are associated with peripheral ulcerativekeratitis (PUK) in patients with Wegener’s granulomatosis(WG). The aim of this study was to identify BCEA-A.
METHODS. The 66-kDa antigen was purified from a bovinecorneal epithelial protein extract, using DE52 ion ex-change chromatography. Purified protein was used toraise rabbit polyclonal antibodies. These antibodies wereused to screen a bovine corneal epithelial cDNA expres-sion library. Positive clones were purified and sequenced.Clones were identified by DNA sequence homologysearches of the GenBank DNA database.
RESULTS. A cDNA clone that demonstrated strong bindingto both the rabbit polyclonal antibody and patient sera,showed 85% homology to rabbit cytokeratin 3 (K3). K3 isa basic cytokeratin specific to corneal epithelium. Nobovine DNA sequence for K3 is available. However, bo-vine K3 is larger than rabbit K3, with a molecular weightof 66 kDa. Immunofluorescence using both patient seraand the rabbit antibody demonstrated a cytoplasmic bind-ing pattern on human corneal epithelium.
CONCLUSIONS. This evidence suggests that the 66-kDa au-toantigen (BCEA-A) associated with PUK in WG is cyto-keratin 3, and this may form the basis of a diagnostic/prognostic test. (Invest Ophthalmol Vis Sci. 1999;40:2147–2151)
Wegener’s granulomatosis (WG) is a rare inflammatorydisease of unknown etiology that is characterized by
vasculitis of the upper and lower respiratory tract, often incombination with glomerulonephritis. WG also can affect anyother organ system, including the skin, eye, heart, nervoussystem, and gastrointestinal tract.1 Early diagnosis of WG isdifficult, but if diagnosed and treated promptly with immuno-suppressive therapy and corticosteroids, the prognosis is much
improved. Up to 90% of patients have circulating anti-neutro-phil cytoplasmic antibodies.2 The presence of these antibodiesis commonly used as a diagnostic marker for this condition.3
Ophthalmic involvement may be present in up to 58% ofWG cases. Moreover, in some cases ocular manifestations maybe the major symptom or presenting feature of the disease.Although circulating anti-neutrophil cytoplasmic antibodies(usually anti–proteinase 3 antibodies) are a sensitive and spe-cific marker for WG-associated scleritis4 and are used in theearly evaluation of patients, not all WG patients carry anti–proteinase 3 antibodies, particularly in early stages or limitedpresentation of the disease. In such cases, correct diagnosisand treatment may be delayed. Additional disease markerswould, therefore, be a useful in the diagnostic procedure,helping to differentiate between ophthalmic manifestations ofWG and other corneal inflammatory conditions with an auto-immune background.
We have previously demonstrated the presence of auto-antibodies to a corneal protein of 66 kDa (BCEA-A) in WG withand without peripheral ulcerative keratitis (PUK).5 In thisstudy, we have purified BCEA-A and used molecular techniquesto identify it as cytokeratin 3.
METHODS
Methods of securing human and animal tissues complied withthe National Institutes of Health Guidelines on the Care andUse of Animals in Research, the Declaration of Helsinki, andthe ARVO Statement for the Use of Animals in Ophthalmic andVision Research.
DE-52 Purification of BCEA-A
Corneal epithelium was scraped from the central region ofbovine corneas. Three hundred milligrams of tissue collectedfrom 20 eyes was homogenized in 5 ml of 1 M NaCl, 40 mMTris/HCl, pH 7.8, containing 1 ml 10 mM phenylmethylsulfonylfluoride. The homogenized extract then was centrifuged at20,000g for 30 minutes. The supernatant was dialyzed againstdistilled water, followed by 20 mM Tris/HCl, pH 8.0, for 48hours. The concentration of the protein was estimated byspectrophotometer at a wavelength of 280 nm. The integrity ofthe corneal extract was assessed by sodium dodecyl sulfate–polyacrylamide gel electrophoresis (SDS-PAGE) and CoomassieBlue staining to ensure that the proteins were not degraded.The soluble corneal extract was dialyzed into 0.05 M NaCl, 20mM Tris/HCl, pH 7.8, and diluted to a protein concentration of29 mg/ml in the same buffer. Five milliliters of the extract wasloaded on to a DE-52 column. Unbound proteins were elutedfrom the column with 0.05 M NaCl, 20 mM Tris/HCl, pH 7.8.The resulting fraction was dialyzed into 20 mM Tris/HCl, pH7.8, analyzed by SDS-PAGE, and immunoblotted with patientsera containing antibodies to BCEA-A.
SDS-PAGE and Immunoblotting
Protein from tissue extracts or antigen-enriched protein prep-arations were separated by SDS-PAGE and immunoblotted bystandard techniques.5
Production of Rabbit Polyclonal Antibodies toBCEA-A
A BCEA-A–enriched extract was separated by SDS-PAGE andelectroblotted onto a pure nitrocellulose membrane. The mem-
From the 1Musculoskeletal Research Group, 2University Depart-ment of Ophthalmology, and 3ARC ERU, University of Manchester, andCentral Manchester Health Care NHS Trust, Manchester, United King-dom.
Supported by The Arthritis and Rheumatism Council.Submitted for publication November 24, 1998; revised March 1,
1999; accepted March 23, 1999.Proprietary interest category: N.Reprint requests: M. Chantal Hillarby, Department of Rheumatol-
ogy, Stopford Building, University of Manchester, Oxford Road,Manchester M13 9PT, UK.
IOVS, August 1999, Vol. 40, No. 9 Reports 2147
Downloaded From: http://jov.arvojournals.org/pdfaccess.ashx?url=/data/journals/iovs/932897/ on 03/26/2018
brane was stained with Ponceau S to identify the relevant band.The identified protein band was excised from the membraneand used to raise polyclonal antibodies as described pre-viously.5
RNA Extraction
Bovine corneal epithelium was powdered in liquid nitrogenand taken up in RNAzolB (Biogenesis, Poole, UK). Total RNAwas purified according to the manufacturer’s instructions.
cDNA Library Preparation and Screening
A cDNA expression library was made from bovine cornealepithelial mRNA in the Uni-ZAP-XR lambda vector (Stratagene,Amsterdam, The Netherlands) according to the manufacturersinstructions. Briefly, cDNA was synthesized by reverse tran-scription using a polyT primer containing a XhoI restrictionsite at the 39 end. EcoRI adapters were ligated to the two blunttermini, followed by a double digestion with XhoI/EcoRI. Theresulting product was directionally cloned into the EcoRI/XhoIsite of Uni-ZAP-XR vector. The resulting library contained 2 3108 recombinant clones. The library was transfected into 200ml of Escherichia coli XL-1 MRF9 cells, and 5 NZY agar plates,each containing 50,000 clones, were prepared for immuno-screening with the rabbit polyclonal BCEA-A antibodies. Theantisera was diluted 1:2000 and preincubated with 12 mg/ml E.coli lysate prior to the library screening. Immunoscreening wascarried out according to the Stratagene protocol. Positiveclones were purified by secondary and tertiary screening.
DNA Sequencing
Pure clones were grown up, and phage DNA was extractedusing phage DNA extraction columns according to the manu-facturer’s instructions (Qiagen, Crawley, UK). The size of in-serts was measured on agarose gels after polymerase chainreaction amplification, using primers specific to the T3 (59AATTAA CCC TCA CTA AAG GG39) and T7 (59GTA ATA CGA CTCACT ATA GGG C39) binding sites. Samples were amplified for40 cycles of 45 seconds at 94°C, 45 seconds at 60°C, and 80seconds at 72°C. PCR products were cloned into the TA clon-ing vector (Invitrogen, Groningen, The Netherlands) accordingto manufacturer instructions. Plasmids containing inserts of thecorrect size were purified using Qiagen columns. Inserts weresequenced directly by cycle sequencing (BIG dye primer kit;Perkin Elmer, Warrington, UK) using M13 forward (59GTA AAACGA CGG CCA G39) and M13 reverse (59CAG GAA ACA GCTATG AC39) primers. Sequenced samples were run on a PerkinElmer 377 automated DNA sequencer. Sequences obtainedwere used in DNA homology searches of the GenBank DNAdatabases using FastA.
Tissue Localization of BCEA-A byImmunofluorescence
Fresh human eyes that were unsuitable for corneal transplantwere obtained from the Manchester Eye Bank and stored in amoist chamber with a balanced salt solution until the samplewas processed. A corneoscleral disc was removed, using atrephine and scissors. The disc was then cut into blocks ofapproximately 2 3 10 mm, ensuring that the limbus wasincluded. Other human tissues including esophagus, oral mu-cosa, liver, skin, lungs, and kidney were obtained postmortem,frozen, and cut into 5-mm sections. The tissue was snap frozen
in liquid nitrogen–cooled isopentane and mounted in OCTcompound. BCEA-A expression was localized in these tissues asdescribed previously.5
RESULTS
Tissue Localization of BCEA-A
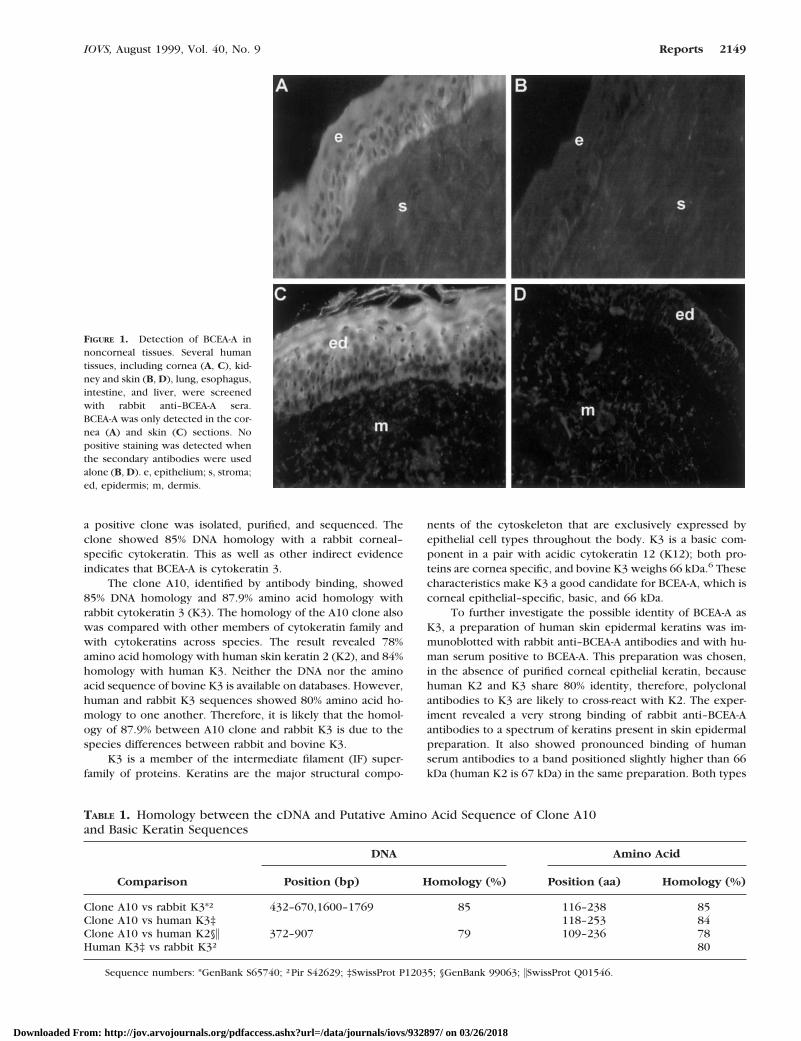
Frozen sections of normal human corneas were used as thesubstrate in indirect immunofluorescence. The rabbit anti–BCEA-A antibodies detected antigen in human corneal epithe-lium showing a cytoplasmic binding pattern (Fig. 1). There wasno binding to the underlying sections of cornea, i.e., Bowman’smembrane, stroma, Descemet’s membrane, or endothelium.
Frozen sections of normal human tissues also were used asa substrate for rabbit anti–BCEA-A antibody binding. The se-lected tissues included kidney, lung, liver, and skin, which areoften involved in WG. The other tissues, intestine and esoph-agus, have a squamous epithelial layer similar to the epitheliallayer of the eye. The anti–BCEA-A antibody bound only theepidermal layer of the skin, showing a cytoplasmic bindingpattern, similar to the binding seen in the corneal epithelium(Fig. 1).
Identification of BCEA-A
A bovine corneal epithelial Uni-ZAP-XR lambda expressionlibrary was produced and 1 3 105 recombinant clones werescreened with rabbit anti–BCEA-A antibodies. One clone (A10)was identified as positive. The rabbit antibodies were notpurified for their antigen specificity; therefore, it was possiblethat the antibodies, which recognized clone A10, were differ-ent from those that recognize BCEA-A. Antibodies bound toA10 were eluted from the tertiary screening filter and used toprobe a western blot of BCEA-A–enriched protein extract. Theeluted antibodies bound to a 66-kDa band.
The 550-bp insert in clone A10 was sequenced, and a DNAhomology search revealed strong homology with rabbit cyto-keratin 3 and human keratin 2 (Table 1). The DNA sequence ofA10 was translated into a putative amino acid sequence, andprotein homology searches were performed. The results fromthese searches confirmed the strong homology between cloneA10 and basic cytokeratins 3 and 2 (Table 1, Fig. 2).
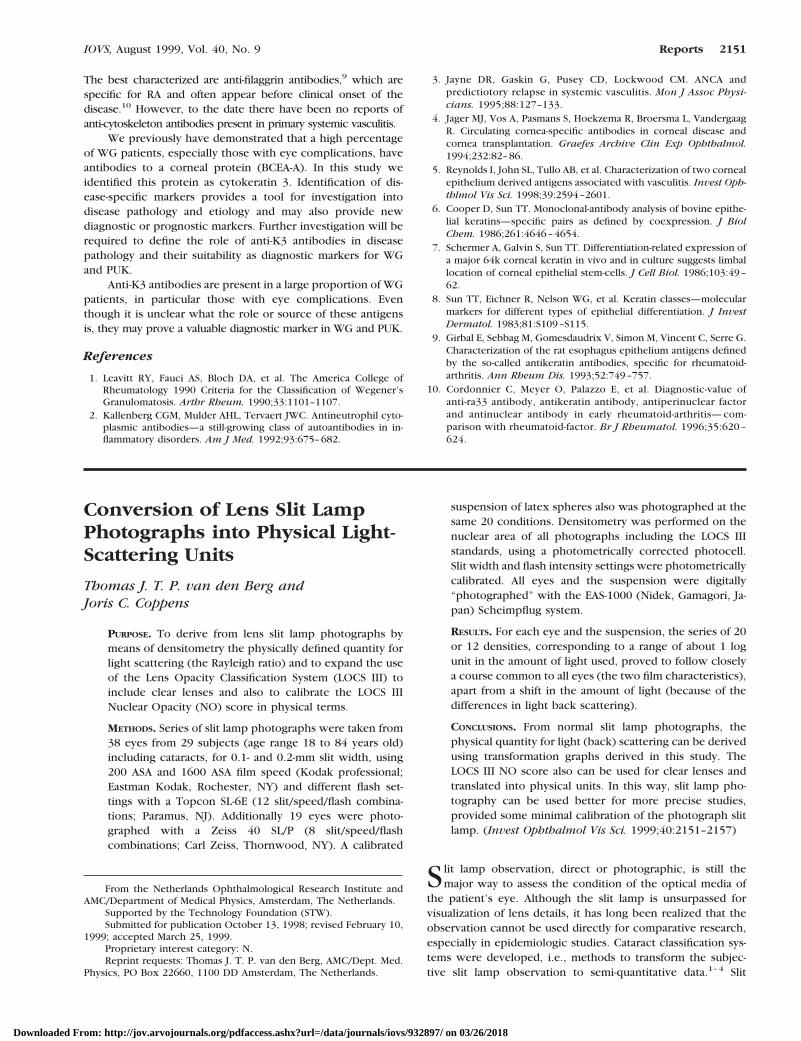
To confirm the identity of BCEA-A as keratin, a humanepidermal keratin extract (ICN) containing both basic andacidic keratins was probed with both human sera and rabbitanti–BCEA-A antibodies. The keratin preparation was resolvedby SDS-PAGE along with a BCEA-A–enriched protein extract.Immunoblotting with rabbit anti–BCEA-A antibodies and hu-man serum known to carry anti–BCEA-A antibodies revealedbinding to a band slightly above 66 kDa (Fig. 3).
DISCUSSION
We previously reported the association of antibodies to a basic66-kDa corneal epithelial–derived antigen (BCEA-A) and PUK-associated WG.5 To further characterize this antigen, rabbitpolyclonal antibodies were raised and used to localize CEA-Aby indirect immunofluorescence, which demonstrated thatBCEA-A is expressed in the epithelium of human cornea and inhuman skin epidermis. A bovine corneal epithelial cDNA li-brary was screened with the rabbit anti–BCEA-A antibodies and
2148 Reports IOVS, August 1999, Vol. 40, No. 9
Downloaded From: http://jov.arvojournals.org/pdfaccess.ashx?url=/data/journals/iovs/932897/ on 03/26/2018
a positive clone was isolated, purified, and sequenced. Theclone showed 85% DNA homology with a rabbit corneal–specific cytokeratin. This as well as other indirect evidenceindicates that BCEA-A is cytokeratin 3.
The clone A10, identified by antibody binding, showed85% DNA homology and 87.9% amino acid homology withrabbit cytokeratin 3 (K3). The homology of the A10 clone alsowas compared with other members of cytokeratin family andwith cytokeratins across species. The result revealed 78%amino acid homology with human skin keratin 2 (K2), and 84%homology with human K3. Neither the DNA nor the aminoacid sequence of bovine K3 is available on databases. However,human and rabbit K3 sequences showed 80% amino acid ho-mology to one another. Therefore, it is likely that the homol-ogy of 87.9% between A10 clone and rabbit K3 is due to thespecies differences between rabbit and bovine K3.
K3 is a member of the intermediate filament (IF) super-family of proteins. Keratins are the major structural compo-
nents of the cytoskeleton that are exclusively expressed byepithelial cell types throughout the body. K3 is a basic com-ponent in a pair with acidic cytokeratin 12 (K12); both pro-teins are cornea specific, and bovine K3 weighs 66 kDa.6 Thesecharacteristics make K3 a good candidate for BCEA-A, which iscorneal epithelial–specific, basic, and 66 kDa.
To further investigate the possible identity of BCEA-A asK3, a preparation of human skin epidermal keratins was im-munoblotted with rabbit anti–BCEA-A antibodies and with hu-man serum positive to BCEA-A. This preparation was chosen,in the absence of purified corneal epithelial keratin, becausehuman K2 and K3 share 80% identity, therefore, polyclonalantibodies to K3 are likely to cross-react with K2. The exper-iment revealed a very strong binding of rabbit anti–BCEA-Aantibodies to a spectrum of keratins present in skin epidermalpreparation. It also showed pronounced binding of humanserum antibodies to a band positioned slightly higher than 66kDa (human K2 is 67 kDa) in the same preparation. Both types
FIGURE 1. Detection of BCEA-A innoncorneal tissues. Several humantissues, including cornea (A, C), kid-ney and skin (B, D), lung, esophagus,intestine, and liver, were screenedwith rabbit anti–BCEA-A sera.BCEA-A was only detected in the cor-nea (A) and skin (C) sections. Nopositive staining was detected whenthe secondary antibodies were usedalone (B, D). e, epithelium; s, stroma;ed, epidermis; m, dermis.
TABLE 1. Homology between the cDNA and Putative Amino Acid Sequence of Clone A10and Basic Keratin Sequences
Comparison
DNA Amino Acid
Position (bp) Homology (%) Position (aa) Homology (%)
Clone A10 vs rabbit K3*† 432–670,1600–1769 85 116–238 85Clone A10 vs human K3‡ 118–253 84Clone A10 vs human K2§\ 372–907 79 109–236 78Human K3‡ vs rabbit K3† 80
Sequence numbers: *GenBank S65740; †Pir S42629; ‡SwissProt P12035; §GenBank 99063; \SwissProt Q01546.
IOVS, August 1999, Vol. 40, No. 9 Reports 2149
Downloaded From: http://jov.arvojournals.org/pdfaccess.ashx?url=/data/journals/iovs/932897/ on 03/26/2018
of antibody also recognized a 66-kDa band in both nonpurifiedextract and BCEA-A–enriched extract. This result strongly sug-gests that the original antigen against which anti–BCEA-A anti-bodies were raised is K3.
To further confirm the identity of BCEA-A as K3, immu-nohistochemistry was used to localize the antigen within hu-man skin and cornea. In a study of K3 expression in rabbitcornea, using the highly specific monoclonal antibody AE5, ithas been demonstrated that K3 is localized to corneal epithe-lium and the suprabasal layer of the limbus.7 The localization ofBCEA-A using indirect immunofluorescence on frozen cornealsections showed that rabbit and human antibodies recognizean antigen in both the corneal and limbal part of the epithe-lium, in keeping with the expected pattern for K3. The cross-reactivity of anti BCEA-A antibodies with skin epidermal kera-tins has been confirmed by indirect immunofluorescence (IIF)
on frozen human skin sections. The antibody binding on thesesections was limited to the epidermal layer above the basallayer of the human skin, where K2 (the skin equivalent of K3)is localized.8 Moreover, the homology search demonstratedthat K2 has the highest amino acid and DNA homology to K3and clone A10, in comparison with other human keratins. Thisimplies that K2 is a likely target for cross-reacting anti–BCEA-Aantibodies, which may explain the lack of binding of anti–BCEA-A antibodies to other tissues, such as intestine and esoph-agus, with different type of epithelium containing basic typekeratins of much lower homology to K3, e.g., K4 (esophagealequivalent of K3), which shows only 68% homology with cloneA10 and K3. The above results strongly suggest that the targetantigen for anti–BCEA-A antibodies in the cornea is K3.
Autoantibodies against constituents of the cytoskeletonhave been reported and investigated by a number of groups.
FIGURE 3. Binding of rabbit and hu-man anti-BCEA-A antibodies to humanskin epidermal keratin. BCEA-A en-riched protein extract (1) and humanepidermal keratins (ICN) (2) were sep-arated by SDS-PAGE, blotted, andprobed with rabbit anti–BCEA-A anti-bodies (a) and patient sera (b). m, mol-eculer weight markers.
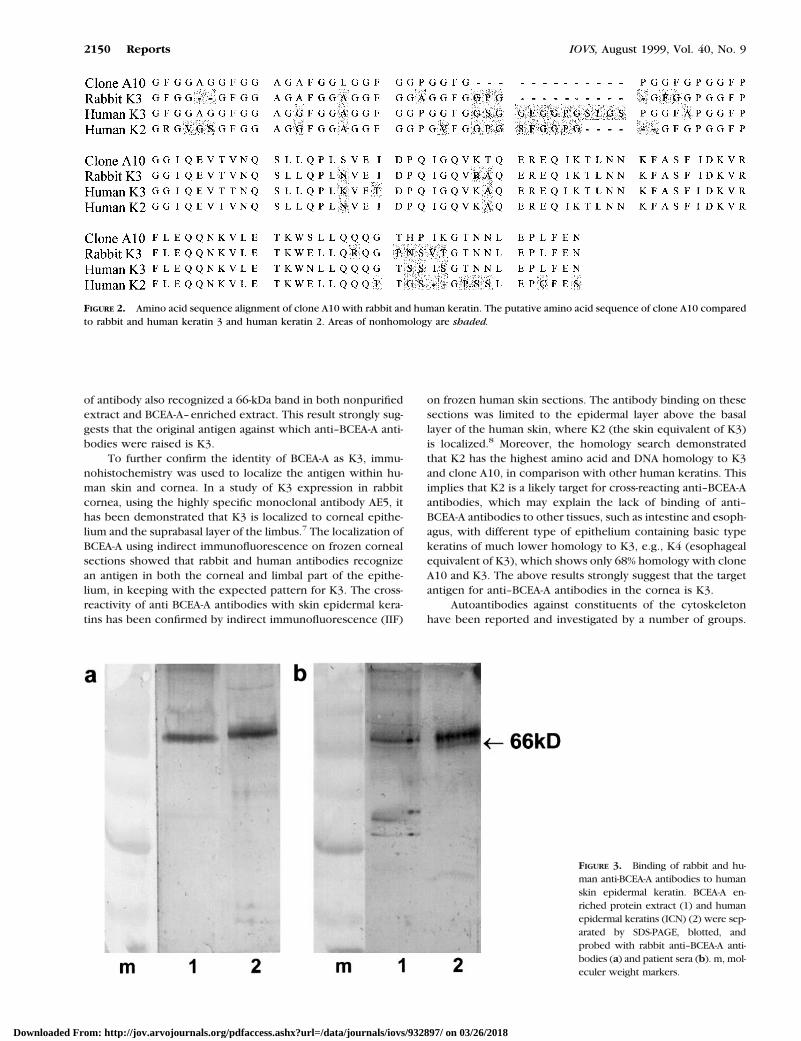
FIGURE 2. Amino acid sequence alignment of clone A10 with rabbit and human keratin. The putative amino acid sequence of clone A10 comparedto rabbit and human keratin 3 and human keratin 2. Areas of nonhomology are shaded.
2150 Reports IOVS, August 1999, Vol. 40, No. 9
Downloaded From: http://jov.arvojournals.org/pdfaccess.ashx?url=/data/journals/iovs/932897/ on 03/26/2018
The best characterized are anti-filaggrin antibodies,9 which arespecific for RA and often appear before clinical onset of thedisease.10 However, to the date there have been no reports ofanti-cytoskeleton antibodies present in primary systemic vasculitis.
We previously have demonstrated that a high percentageof WG patients, especially those with eye complications, haveantibodies to a corneal protein (BCEA-A). In this study weidentified this protein as cytokeratin 3. Identification of dis-ease-specific markers provides a tool for investigation intodisease pathology and etiology and may also provide newdiagnostic or prognostic markers. Further investigation will berequired to define the role of anti-K3 antibodies in diseasepathology and their suitability as diagnostic markers for WGand PUK.
Anti-K3 antibodies are present in a large proportion of WGpatients, in particular those with eye complications. Eventhough it is unclear what the role or source of these antigensis, they may prove a valuable diagnostic marker in WG and PUK.
References
1. Leavitt RY, Fauci AS, Bloch DA, et al. The America College ofRheumatology 1990 Criteria for the Classification of Wegener’sGranulomatosis. Arthr Rheum. 1990;33:1101–1107.
2. Kallenberg CGM, Mulder AHL, Tervaert JWC. Antineutrophil cyto-plasmic antibodies—a still-growing class of autoantibodies in in-flammatory disorders. Am J Med. 1992;93:675–682.
3. Jayne DR, Gaskin G, Pusey CD, Lockwood CM. ANCA andpredictiotory relapse in systemic vasculitis. Mon J Assoc Physi-cians. 1995;88:127–133.
4. Jager MJ, Vos A, Pasmans S, Hoekzema R, Broersma L, VandergaagR. Circulating cornea-specific antibodies in corneal disease andcornea transplantation. Graefes Archive Clin Exp Ophthalmol.1994;232:82–86.
5. Reynolds I, John SL, Tullo AB, et al. Characterization of two cornealepithelium derived antigens associated with vasculitis. Invest Oph-thlmol Vis Sci. 1998;39:2594–2601.
6. Cooper D, Sun TT. Monoclonal-antibody analysis of bovine epithe-lial keratins—specific pairs as defined by coexpression. J BiolChem. 1986;261:4646–4654.
7. Schermer A, Galvin S, Sun TT. Differentiation-related expression ofa major 64k corneal keratin in vivo and in culture suggests limballocation of corneal epithelial stem-cells. J Cell Biol. 1986;103:49–62.
8. Sun TT, Eichner R, Nelson WG, et al. Keratin classes—molecularmarkers for different types of epithelial differentiation. J InvestDermatol. 1983;81:S109–S115.
9. Girbal E, Sebbag M, Gomesdaudrix V, Simon M, Vincent C, Serre G.Characterization of the rat esophagus epithelium antigens definedby the so-called antikeratin antibodies, specific for rheumatoid-arthritis. Ann Rheum Dis. 1993;52:749–757.
10. Cordonnier C, Meyer O, Palazzo E, et al. Diagnostic-value ofanti-ra33 antibody, antikeratin antibody, antiperinuclear factorand antinuclear antibody in early rheumatoid-arthritis— com-parison with rheumatoid-factor. Br J Rheumatol. 1996;35:620 –624.
Conversion of Lens Slit LampPhotographs into Physical Light-Scattering Units
Thomas J. T. P. van den Berg andJoris C. Coppens
PURPOSE. To derive from lens slit lamp photographs bymeans of densitometry the physically defined quantity forlight scattering (the Rayleigh ratio) and to expand the useof the Lens Opacity Classification System (LOCS III) toinclude clear lenses and also to calibrate the LOCS IIINuclear Opacity (NO) score in physical terms.
METHODS. Series of slit lamp photographs were taken from38 eyes from 29 subjects (age range 18 to 84 years old)including cataracts, for 0.1- and 0.2-mm slit width, using200 ASA and 1600 ASA film speed (Kodak professional;Eastman Kodak, Rochester, NY) and different flash set-tings with a Topcon SL-6E (12 slit/speed/flash combina-tions; Paramus, NJ). Additionally 19 eyes were photo-graphed with a Zeiss 40 SL/P (8 slit/speed/flashcombinations; Carl Zeiss, Thornwood, NY). A calibrated
suspension of latex spheres also was photographed at thesame 20 conditions. Densitometry was performed on thenuclear area of all photographs including the LOCS IIIstandards, using a photometrically corrected photocell.Slit width and flash intensity settings were photometricallycalibrated. All eyes and the suspension were digitally“photographed” with the EAS-1000 (Nidek, Gamagori, Ja-pan) Scheimpflug system.
RESULTS. For each eye and the suspension, the series of 20or 12 densities, corresponding to a range of about 1 logunit in the amount of light used, proved to follow closelya course common to all eyes (the two film characteristics),apart from a shift in the amount of light (because of thedifferences in light back scattering).
CONCLUSIONS. From normal slit lamp photographs, thephysical quantity for light (back) scattering can be derivedusing transformation graphs derived in this study. TheLOCS III NO score also can be used for clear lenses andtranslated into physical units. In this way, slit lamp pho-tography can be used better for more precise studies,provided some minimal calibration of the photograph slitlamp. (Invest Ophthalmol Vis Sci. 1999;40:2151–2157)
Slit lamp observation, direct or photographic, is still themajor way to assess the condition of the optical media of
the patient’s eye. Although the slit lamp is unsurpassed forvisualization of lens details, it has long been realized that theobservation cannot be used directly for comparative research,especially in epidemiologic studies. Cataract classification sys-tems were developed, i.e., methods to transform the subjec-tive slit lamp observation to semi-quantitative data.1–4 Slit
From the Netherlands Ophthalmological Research Institute andAMC/Department of Medical Physics, Amsterdam, The Netherlands.
Supported by the Technology Foundation (STW).Submitted for publication October 13, 1998; revised February 10,
1999; accepted March 25, 1999.Proprietary interest category: N.Reprint requests: Thomas J. T. P. van den Berg, AMC/Dept. Med.
Physics, PO Box 22660, 1100 DD Amsterdam, The Netherlands.
IOVS, August 1999, Vol. 40, No. 9 Reports 2151
Downloaded From: http://jov.arvojournals.org/pdfaccess.ashx?url=/data/journals/iovs/932897/ on 03/26/2018
lamp observation rests on light that is scattered (or reflected)backwards. This backscattered light can also be measuredwith photosensitive devices giving objective and quantitativedata.5–12 However, these instruments have not (yet) pushedaside the slit lamp biomicroscope.
All the above methods use the backscattered light, butresults are presented in more or less arbitrary units, differentbetween the different methods. A physical definition of lightscattering is given by the so-called Rayleigh ratio R. It would bevaluable if such a well-defined and generally applicable unitcould be used easily in lens research. This would aid, e.g., inthe comparison between epidemiologic studies or for in vivoversus in vitro studies. Because of the dominance of the normalslit lamp, we studied whether this instrument can be used toestimate R in a simple way.
Two approaches were evaluated, photographic and directobservation at the slit lamp. Photographic information can betransformed to quantitative data by densitometry. With carefulcalibration of the photographic procedure and the use of abackscattering standard, a direct relationship can be estab-lished between photograph density and R. However, to even-tually avoid the need for densitometry, a transformation fromsubjective cataract score to R also was developed. As thescoring system, LOCS III for nuclear opacity (NO) was used.4 Inthis system, a direct slit lamp picture or a photograph iscompared by eye to five standard photographs with differentgrades of nuclear opacity, numbered 1 to 5. The densities ofthese five photographs also were measured and transformed toR. The NO score of a patient’s lens, e.g., 3.6 (one decimal placeby visual interpolation), can then be transformed to R. Bothtransformation techniques, densitometry-based as well as LOCSIII–based, were tested against independent assessments of Ron the same lenses.
METHODS
Series of slit lamp photographs were taken in two groups: (1)from 19 eyes from 19 subjects (age range 18 to 64 years old),each photograph once repeated, and (2) from 19 eyes from 10subjects (age range 55 to 84 years old, from a cataract clinic,some with nuclear cataract), without repetitions. For all eyes,12 photographs were made with 0.1- and 0.2-mm slit width,using 200 ASA and 1600 ASA film speed (Kodak professional;Eastman Kodak, Rochester, NY), and different flash settings(see Table 1) with a Topcon SL-6E (12 slit/speed/flash combi-nations; Topcon, Paramus, NJ). Additionally, the first group of
19 eyes was photographed with a Zeiss 40 SL/P, also with 0.1-and 0.2-mm slit width, using 200 ASA and 1600 ASA film speed(8 slit/speed/flash combinations; Carl Zeiss, Thornwood, NY;see Table 1). The light sources were the standard xenon-filledflash tubes, used in these instruments, with no color filtersinterposed. A calibrated suspension of latex spheres was pho-tographed at the same 20 conditions. The suspension wascontained in an artificial eye, the “cornea” consisting of azero-diopter, 8-mm-radius contact lens. Readings were taken at2 mm behind the “cornea.” Photographic magnification was2.2 for the Topcon and 1.8 for the Zeiss camera. This differ-ence causes in itself a difference in film exposure of a factor(2.2/1.8)2 5 1.5 (0.17 log units) higher exposure, correspond-ing to lower magnification (the Zeiss camera). The films weredeveloped by a certified professional photograph laboratory(Q-laboratory). Standard procedures in such a laboratory in-clude developing a trial film every morning and evening andchecking it densitometrically, and once a week Kodak checksthe film. The photographic procedures were according to andincluding the set of conditions of the LOCS system (200 ASA,0.2 mm, etc.).
Densitometry on the nuclear area of all photographs in-cluding the LOCS III standards (positive color transparencies ofthe standard 2.4 3 3.6-cm size) was performed using a photo-metrically corrected photocell. A circular diaphragm in front ofthe photocell was adjusted to cover the full depth of thenucleus, defined according to other densitometric studies.4,13
Slit width and flash intensity settings were calibrated with thehelp of a photometrically corrected photocell, placed at thesame position as the patient’s eye, which was large enough tocollect all light. All eyes and the suspension also were digitally“photographed” with the EAS-1000 Scheimpflug system(Nidek, Gamagori, Japan).
As physical unit for the light-scattering property of scat-tering materials, the so-called Rayleigh ratio is used:
Rayleigh ratio 5 R~u! 5 I~u! 4 EpV, or I~u! 5 R~u!pEpV,
with I(u) the amount of light scattered per unit solid angle inW/steradian by a volume of scatterer V in m3 illuminated byincident light E in W/m2. In the present study, I(u), where u 5135°, is proportional to the amount of light collected by thereception aperture of the slit lamp microscope, part of whichis projected on the photographic film. The resulting lightdensity on the film is proportional to 1/magnification.2 I(u) isproportional on the other hand to E, which is controlled by the
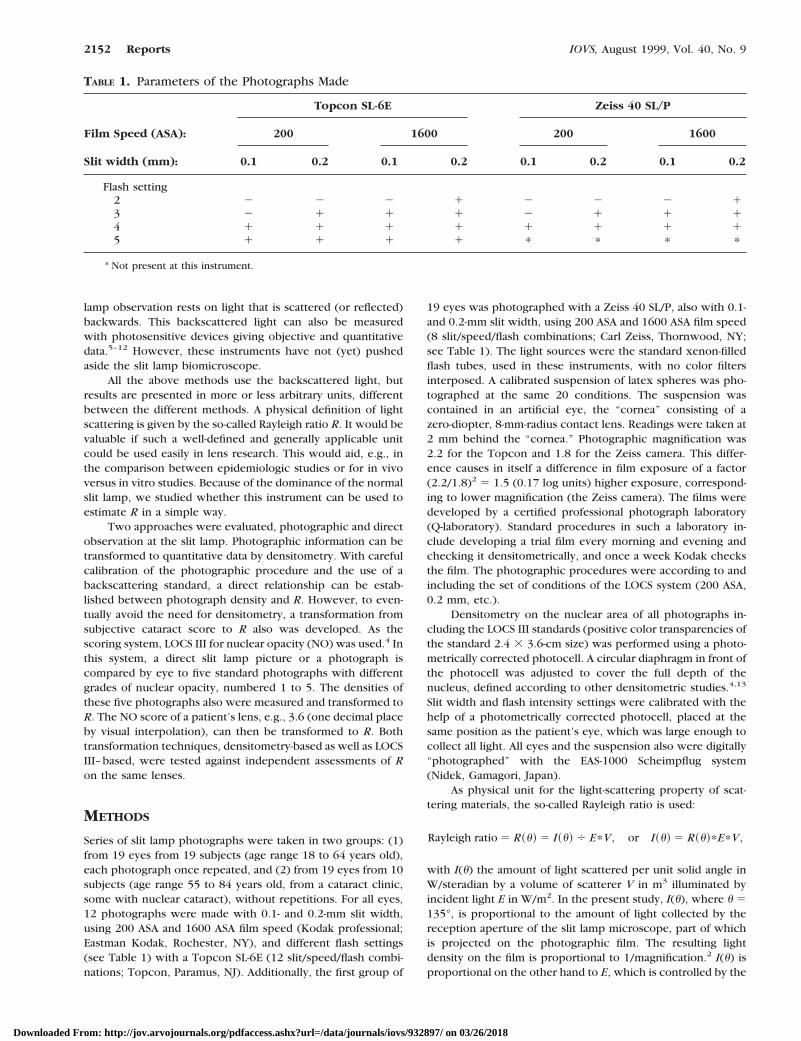
TABLE 1. Parameters of the Photographs Made
Film Speed (ASA):
Topcon SL-6E Zeiss 40 SL/P
200 1600 200 1600
Slit width (mm): 0.1 0.2 0.1 0.2 0.1 0.2 0.1 0.2
Flash setting2 2 2 2 1 2 2 2 13 2 1 1 1 2 1 1 14 1 1 1 1 1 1 1 15 1 1 1 1 p p p p
* Not present at this instrument.
2152 Reports IOVS, August 1999, Vol. 40, No. 9
Downloaded From: http://jov.arvojournals.org/pdfaccess.ashx?url=/data/journals/iovs/932897/ on 03/26/2018
flash setting on the slit lamp. In fact, instead of I(u) and E, theirintegrals over the full flash duration determine film exposure.I(u) and film exposure depend moreover on slit width, becauseV does. In fact, because of limited depth of focus of the slitprojection system, E is not constant over lens depth. However,because slit width is small, only the total E over slit width (inthe focal plane E 3 slit width), in combination with the surfaceof the illuminated cross section instead of V, need be consid-ered. The maximal flash was larger with the Zeiss instrument,but the reception aperture was smaller (larger depth of focus),resulting in about equal film exposure, apart from the magni-fication effect (factor 1.5).
For the suspension of latex spheres in water, at a con-centration of 5 3 1025 weight fraction and a sphere radius
of 98 nm, the Rayleigh ratio for unpolarized light at 135°R(135) 5 1.0 m21 Sr21, more or less constant between 450and 650 nm. This was measured separately using a radiomet-ric setup described earlier.14 –16 On the basis of the men-tioned parameter values and a refractive index of about 1.58,slightly depending on wavelength, the experimental resultwas found to be in keeping with well-established theory,using the so called Rayleigh–Gans approximation.17 It mustbe noted that these spheres are intermediary between thewell-known small particle Rayleigh domain (scattering pro-portional to wavelength24) and the large particle domainwith deep local minima in scattering as a function of angle,first appearing on the small wavelength side. For the presentsuspension, e.g., at precisely 500 nm R(135) 5 0.97 and at
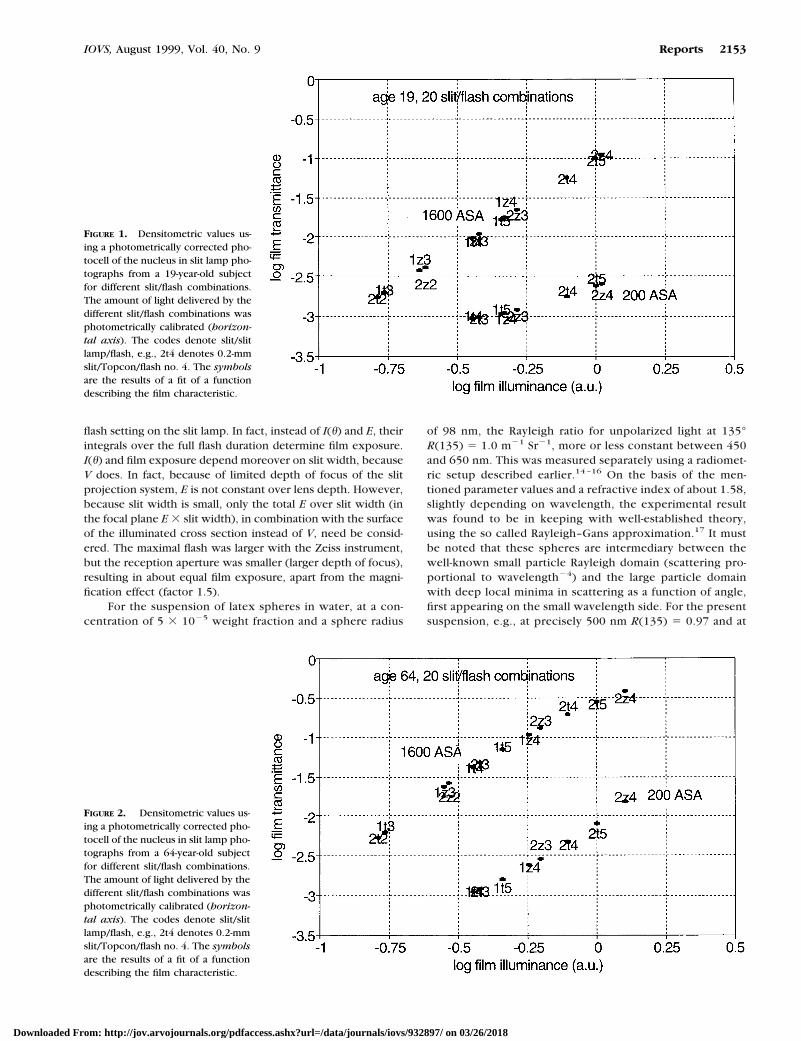
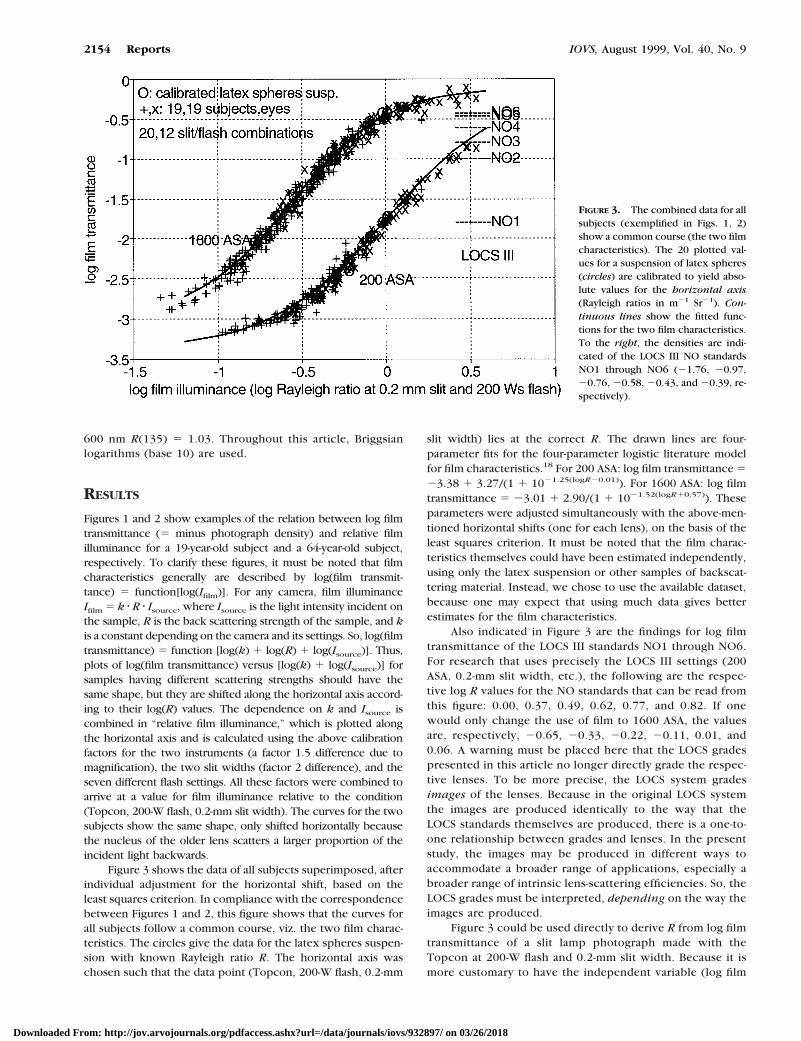
FIGURE 1. Densitometric values us-ing a photometrically corrected pho-tocell of the nucleus in slit lamp pho-tographs from a 19-year-old subjectfor different slit/flash combinations.The amount of light delivered by thedifferent slit/flash combinations wasphotometrically calibrated (horizon-tal axis). The codes denote slit/slitlamp/flash, e.g., 2t4 denotes 0.2-mmslit/Topcon/flash no. 4. The symbolsare the results of a fit of a functiondescribing the film characteristic.
FIGURE 2. Densitometric values us-ing a photometrically corrected pho-tocell of the nucleus in slit lamp pho-tographs from a 64-year-old subjectfor different slit/flash combinations.The amount of light delivered by thedifferent slit/flash combinations wasphotometrically calibrated (horizon-tal axis). The codes denote slit/slitlamp/flash, e.g., 2t4 denotes 0.2-mmslit/Topcon/flash no. 4. The symbolsare the results of a fit of a functiondescribing the film characteristic.
IOVS, August 1999, Vol. 40, No. 9 Reports 2153
Downloaded From: http://jov.arvojournals.org/pdfaccess.ashx?url=/data/journals/iovs/932897/ on 03/26/2018
600 nm R(135) 5 1.03. Throughout this article, Briggsianlogarithms (base 10) are used.
RESULTS
Figures 1 and 2 show examples of the relation between log filmtransmittance (5 minus photograph density) and relative filmilluminance for a 19-year-old subject and a 64-year-old subject,respectively. To clarify these figures, it must be noted that filmcharacteristics generally are described by log(film transmit-tance) 5 function[log(Ifilm)]. For any camera, film illuminanceIfilm 5 k z R z Isource, where Isource is the light intensity incident onthe sample, R is the back scattering strength of the sample, and kis a constant depending on the camera and its settings. So, log(filmtransmittance) 5 function [log(k) 1 log(R) 1 log(Isource)]. Thus,plots of log(film transmittance) versus [log(k) 1 log(Isource)] forsamples having different scattering strengths should have thesame shape, but they are shifted along the horizontal axis accord-ing to their log(R) values. The dependence on k and Isource iscombined in “relative film illuminance,” which is plotted alongthe horizontal axis and is calculated using the above calibrationfactors for the two instruments (a factor 1.5 difference due tomagnification), the two slit widths (factor 2 difference), and theseven different flash settings. All these factors were combined toarrive at a value for film illuminance relative to the condition(Topcon, 200-W flash, 0.2-mm slit width). The curves for the twosubjects show the same shape, only shifted horizontally becausethe nucleus of the older lens scatters a larger proportion of theincident light backwards.
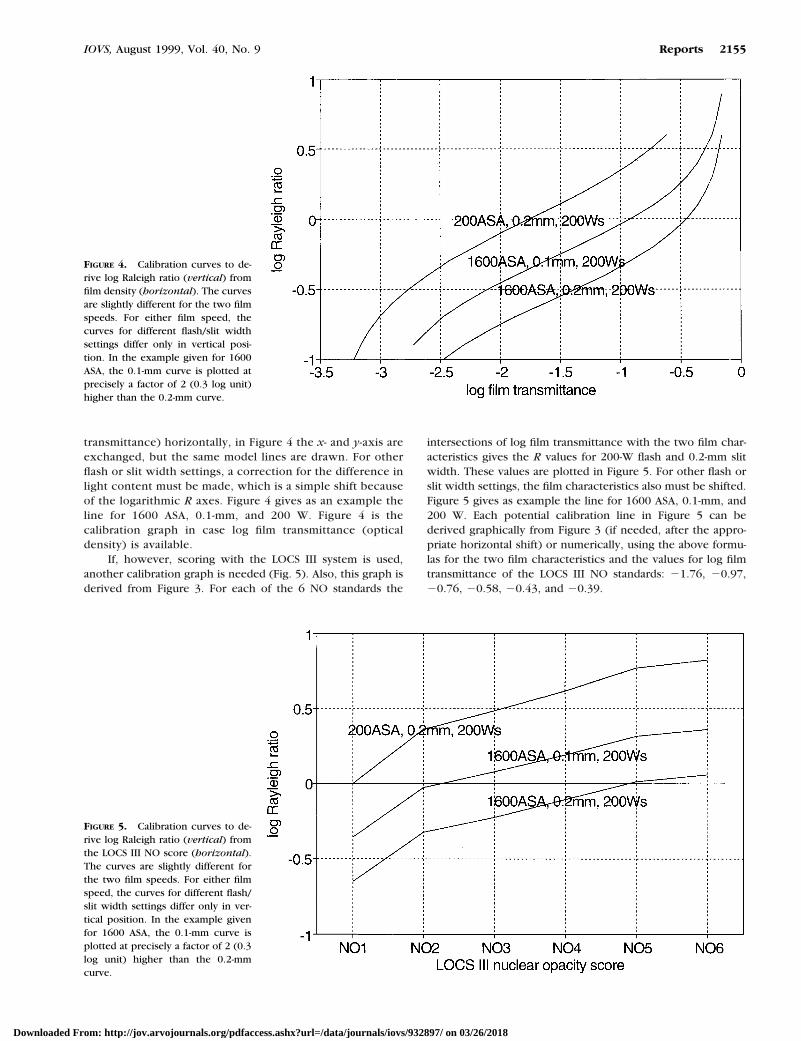
Figure 3 shows the data of all subjects superimposed, afterindividual adjustment for the horizontal shift, based on theleast squares criterion. In compliance with the correspondencebetween Figures 1 and 2, this figure shows that the curves forall subjects follow a common course, viz. the two film charac-teristics. The circles give the data for the latex spheres suspen-sion with known Rayleigh ratio R. The horizontal axis waschosen such that the data point (Topcon, 200-W flash, 0.2-mm
slit width) lies at the correct R. The drawn lines are four-parameter fits for the four-parameter logistic literature modelfor film characteristics.18 For 200 ASA: log film transmittance 523.38 1 3.27/(1 1 1021.25(logR20.01)). For 1600 ASA: log filmtransmittance 5 23.01 1 2.90/(1 1 1021.52(logR10.57)). Theseparameters were adjusted simultaneously with the above-men-tioned horizontal shifts (one for each lens), on the basis of theleast squares criterion. It must be noted that the film charac-teristics themselves could have been estimated independently,using only the latex suspension or other samples of backscat-tering material. Instead, we chose to use the available dataset,because one may expect that using much data gives betterestimates for the film characteristics.
Also indicated in Figure 3 are the findings for log filmtransmittance of the LOCS III standards NO1 through NO6.For research that uses precisely the LOCS III settings (200ASA, 0.2-mm slit width, etc.), the following are the respec-tive log R values for the NO standards that can be read fromthis figure: 0.00, 0.37, 0.49, 0.62, 0.77, and 0.82. If onewould only change the use of film to 1600 ASA, the valuesare, respectively, 20.65, 20.33, 20.22, 20.11, 0.01, and0.06. A warning must be placed here that the LOCS gradespresented in this article no longer directly grade the respec-tive lenses. To be more precise, the LOCS system gradesimages of the lenses. Because in the original LOCS systemthe images are produced identically to the way that theLOCS standards themselves are produced, there is a one-to-one relationship between grades and lenses. In the presentstudy, the images may be produced in different ways toaccommodate a broader range of applications, especially abroader range of intrinsic lens-scattering efficiencies. So, theLOCS grades must be interpreted, depending on the way theimages are produced.
Figure 3 could be used directly to derive R from log filmtransmittance of a slit lamp photograph made with theTopcon at 200-W flash and 0.2-mm slit width. Because it ismore customary to have the independent variable (log film
FIGURE 3. The combined data for allsubjects (exemplified in Figs. 1, 2)show a common course (the two filmcharacteristics). The 20 plotted val-ues for a suspension of latex spheres(circles) are calibrated to yield abso-lute values for the horizontal axis(Rayleigh ratios in m21 Sr21). Con-tinuous lines show the fitted func-tions for the two film characteristics.To the right, the densities are indi-cated of the LOCS III NO standardsNO1 through NO6 (21.76, 20.97,20.76, 20.58, 20.43, and 20.39, re-spectively).
2154 Reports IOVS, August 1999, Vol. 40, No. 9
Downloaded From: http://jov.arvojournals.org/pdfaccess.ashx?url=/data/journals/iovs/932897/ on 03/26/2018
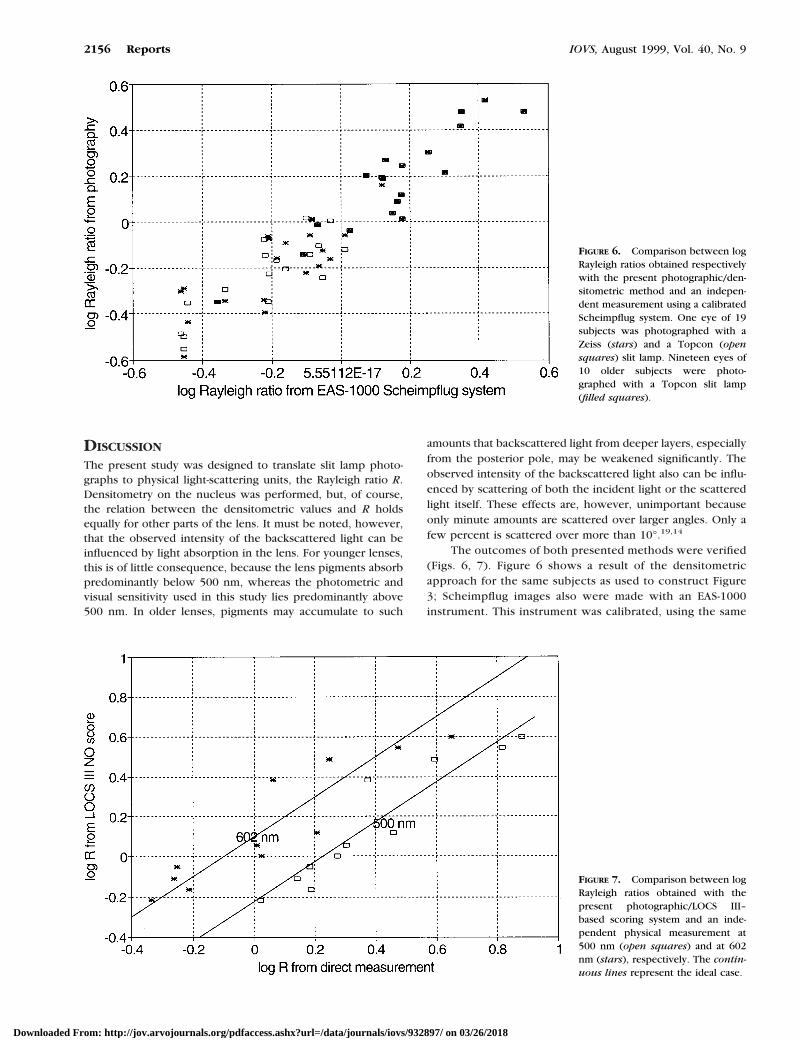
transmittance) horizontally, in Figure 4 the x- and y-axis areexchanged, but the same model lines are drawn. For otherflash or slit width settings, a correction for the difference inlight content must be made, which is a simple shift becauseof the logarithmic R axes. Figure 4 gives as an example theline for 1600 ASA, 0.1-mm, and 200 W. Figure 4 is thecalibration graph in case log film transmittance (opticaldensity) is available.
If, however, scoring with the LOCS III system is used,another calibration graph is needed (Fig. 5). Also, this graph isderived from Figure 3. For each of the 6 NO standards the
intersections of log film transmittance with the two film char-acteristics gives the R values for 200-W flash and 0.2-mm slitwidth. These values are plotted in Figure 5. For other flash orslit width settings, the film characteristics also must be shifted.Figure 5 gives as example the line for 1600 ASA, 0.1-mm, and200 W. Each potential calibration line in Figure 5 can bederived graphically from Figure 3 (if needed, after the appro-priate horizontal shift) or numerically, using the above formu-las for the two film characteristics and the values for log filmtransmittance of the LOCS III NO standards: 21.76, 20.97,20.76, 20.58, 20.43, and 20.39.
FIGURE 4. Calibration curves to de-rive log Raleigh ratio (vertical) fromfilm density (horizontal). The curvesare slightly different for the two filmspeeds. For either film speed, thecurves for different flash/slit widthsettings differ only in vertical posi-tion. In the example given for 1600ASA, the 0.1-mm curve is plotted atprecisely a factor of 2 (0.3 log unit)higher than the 0.2-mm curve.
FIGURE 5. Calibration curves to de-rive log Raleigh ratio (vertical) fromthe LOCS III NO score (horizontal).The curves are slightly different forthe two film speeds. For either filmspeed, the curves for different flash/slit width settings differ only in ver-tical position. In the example givenfor 1600 ASA, the 0.1-mm curve isplotted at precisely a factor of 2 (0.3log unit) higher than the 0.2-mmcurve.
IOVS, August 1999, Vol. 40, No. 9 Reports 2155
Downloaded From: http://jov.arvojournals.org/pdfaccess.ashx?url=/data/journals/iovs/932897/ on 03/26/2018
DISCUSSION
The present study was designed to translate slit lamp photo-graphs to physical light-scattering units, the Rayleigh ratio R.Densitometry on the nucleus was performed, but, of course,the relation between the densitometric values and R holdsequally for other parts of the lens. It must be noted, however,that the observed intensity of the backscattered light can beinfluenced by light absorption in the lens. For younger lenses,this is of little consequence, because the lens pigments absorbpredominantly below 500 nm, whereas the photometric andvisual sensitivity used in this study lies predominantly above500 nm. In older lenses, pigments may accumulate to such
amounts that backscattered light from deeper layers, especiallyfrom the posterior pole, may be weakened significantly. Theobserved intensity of the backscattered light also can be influ-enced by scattering of both the incident light or the scatteredlight itself. These effects are, however, unimportant becauseonly minute amounts are scattered over larger angles. Only afew percent is scattered over more than 10°.19,14
The outcomes of both presented methods were verified(Figs. 6, 7). Figure 6 shows a result of the densitometricapproach for the same subjects as used to construct Figure3; Scheimpflug images also were made with an EAS-1000instrument. This instrument was calibrated, using the same
FIGURE 6. Comparison between logRayleigh ratios obtained respectivelywith the present photographic/den-sitometric method and an indepen-dent measurement using a calibratedScheimpflug system. One eye of 19subjects was photographed with aZeiss (stars) and a Topcon (opensquares) slit lamp. Nineteen eyes of10 older subjects were photo-graphed with a Topcon slit lamp(filled squares).
FIGURE 7. Comparison between logRayleigh ratios obtained with thepresent photographic/LOCS III–based scoring system and an inde-pendent physical measurement at500 nm (open squares) and at 602nm (stars), respectively. The contin-uous lines represent the ideal case.
2156 Reports IOVS, August 1999, Vol. 40, No. 9
Downloaded From: http://jov.arvojournals.org/pdfaccess.ashx?url=/data/journals/iovs/932897/ on 03/26/2018
suspension of latex spheres, in terms of Rayleigh ratio.Figure 6 shows that the correspondence is close, consider-ing that different planes are cut through the lens. TheScheimpflug instrument cuts the lens over its optical axis,and the slit lamp biomicroscope cuts the lens obliquely at45° from its optical axis.
Figure 7 shows verification of the approach using LOCS IIINO scoring. For this figure, data were used from a study on lightscattering by lenses extracted from donor eyes.14–16 Twelvelenses were photographed using 1600 ASA film speed, becausethese were age-normal lenses (except one lens with nuclearcataract), and scored using the LOCS III NO system. The mainissue was to measure and interpret the light-scattering propertiesin forward as well as backward directions at wavelengths 400,500, 602, and 700 nm. Figure 7 shows horizontally log Rayleighratio of the nucleus for 602 and 500 nm at 140° (40° backwards).Vertically log Rayleigh ratio is plotted as read from the presentFigure 5 using the NO scores given earlier.14 Note that the presentapproach involves implicitly averaging over the middle of thevisual spectrum, i.e., 555 6 50 nm. Indeed, Figure 7 shows thatthe values found are between those for 500 and 602 nm. The idealcorrespondence is represented by the two lines, which are posi-tioned according to the well-known wavelength24 dependenceof light scattering by small particles. It recently was found that thistype of scattering dominates in human lenses in the relevantangular domain (around 40° or 45° backward scattering), espe-cially in the nucleus.16 The variability in Figure 7 is larger than inFigure 6. This can be expected because the comparison of Figure7 involves not only different cuts through the lenses, as in Figure6, but also other differences. NO scoring involves a subjectivejudgment. Moreover, the data are from a completely independentstudy, performed on donor lenses. Important in this study wasthat direct measurements on wavelength-resolved Rayleigh ratioswere performed. In view of all the differences, the correspon-dence shown in Figure 7 seems satisfactory.
In conclusion, normal slit lamp observation and photog-raphy can be used to derive the physically defined measure forlight scattering, the Rayleigh ratio, making it more suitable forcomparative studies. With Figures 4 and 5 and eventually theformulas for the two film characteristics and the density valuesfor the LOCS III NO standards, the conversion can be madedirectly in case proper standard procedures are followed, suchas defined in the LOCS III standard. To include a wider range ofapplications, the LOCS III standard was extended to includeusing the 200-W flash tube, professional Kodak film of 200 or1600 ASA, well-defined slit widths (0.2 or 0.1 mm), and illumi-nation at 45° from the optical axis, along which photographyis performed. Some minimal calibration of the slit lamp ishighly advisable though. A good way to calibrate is to photo-graph with one’s standard settings the latex suspension definedin the Methods section. The densitometric value of the latexspheres’ photograph, using a photometric photocell, fixes theposition along the horizontal axis of the curves of Figure 3
(vertically in Fig. 4). In other aspects, these curves remain thesame. It would be most accurate if the photographs of thepatients also are measured densitometrically in the same way.Otherwise, one would proceed to derive one’s own curves ofFigure 5 and to use the normal LOCS III NO scores.
References
1. Chylack LT Jr, Lee MR, Tung WH, Cheng HM. Classification ofhuman senile cataractous change by the American CooperativeCataract Research Group (CCRG) Method I. Instrumentation andtechnique. Invest Ophthalmol Vis Sci. 1983;24:424–431.
2. Sparrow JM. Methods of clinical cataract grading: two systemscompared. Arch Ophthalmol. 1990;108:1209–1211.
3. Taylor HR, Lee JA, Wang F, Munoz B. A comparison of twophotographic systems for grading cataract. Invest Ophthalmol VisSci. 1991;32:529–532.
4. Chylack LT Jr, Wolfe JK, et al. The lens opacities classification system,version III (LOCS III). Arch Ophthalmol. 1993;111:831–836.
5. Wolf E, Gardiner JS. Studies on the scatter of light in the dioptric mediaof the eye as a basis of visual glare. Arch Ophthalmol. 1965;74:338–345.
6. Allen MJ, Vos JJ. Ocular scattered light and visual performance asa function of age. Am J Ophthalmol. 1967;44:717–727.
7. Sigelman J, Trokel SL, Spector A. Quantitative biomicroscopy oflens light backscatter. Arch Ophthalmol. 1974;92:437–442.
8. Brown NAP, Bron AJ, Ayliffe W, Sparrow J, Hill AR. The objectiveassessment of cataract. Eye. 1987;1:234–246.
9. Elliott DB, Hurst MA. Assessing the effect of cataract: a clinical eval-uation of the Opacity Lensmeter 701. Optom Vis Sci. 1989;66:257–263.
10. Hockwin O, Sasaki K, Lerman S. Evaluating cataract developmentwith the Scheimpflug camera. In: Masters BM, ed. NoninvasiveDiagnostic Techniques in Ophthalmology. New York: Springer–Verlag; 1990:281–318.
11. Yager D, Liu C–L, Kapoor N, Yuan R. Relations between three mea-sures of ocular forward light scatter and two measures of backwardlight scatter. In: Technical Digest on Noninvasive Assessment of theVisual System (O.S.A., Washington, DC) 1993;3:174–177.
12. Thurston GM, Hayden DL, Burrows P, et al. Quasielastic lightscattering study of the living human lens as a function of age. CurrEye Res. 1997;16:197–207.
13. Chylack LT Jr, Rosner B, Cheng H–M, McCarthy D, Pennett M.Sources of variance in the objective documentation of humancataractous change with Topcon SL-45 and Neitz-CTR retroillumi-nation photography and computerized image analysis. Curr EyeRes. 1987;6:1381–1390.
14. van den Berg TJTP. Depth dependent forward light scattering bydonor lenses. Invest Ophthalmol Vis Sci. 1996;37:1157–1166.
15. van den Berg TJTP. Light scattering by donor lenses as function ofdepth and wavelength. Invest Ophthalmol Vis Sc. 1997;38:1321–1332.
16. van den Berg TJTP, Spekreijse H. Light scattering model for donorlenses as function of depth. Vision Res. 1999;39:1437–1445.
17. van de Hulst HC. Light Scattering by Small Particles. New York:Dover Publications; 1981.
18. Willis CE, Bencomo JA. Logistic representation of the sensitomet-ric response of screen-film systems: empirical validation. MedPhys. 1990;17:676–679.
19. van den Berg TJTP. Analysis of intraocular straylight, especially inrelation to age. Optom Vision Sci. 1995;72:52–59.
IOVS, August 1999, Vol. 40, No. 9 Reports 2157
Downloaded From: http://jov.arvojournals.org/pdfaccess.ashx?url=/data/journals/iovs/932897/ on 03/26/2018
Inhibition of Intraocular TumorGrowth by Topical Applicationof the Angiostatic SteroidAnecortave AcetateAbbot F. Clark,1 Jessamee Mellon,2
Xiao–Yan Li,2 Ding Ma,2 Henry Leher,2
Rajendra Apte,2 Hassan Alizadeh,2
Sushma Hegde,2 Amanda McLenaghan,2
Elizabeth Mayhew,2 Thomas J. D’Orazio,2 andJerry Y. Niederkorn2
PURPOSE. This study examined the effect of an angiostaticagent on the growth of a highly vascularized intraoculartumor.
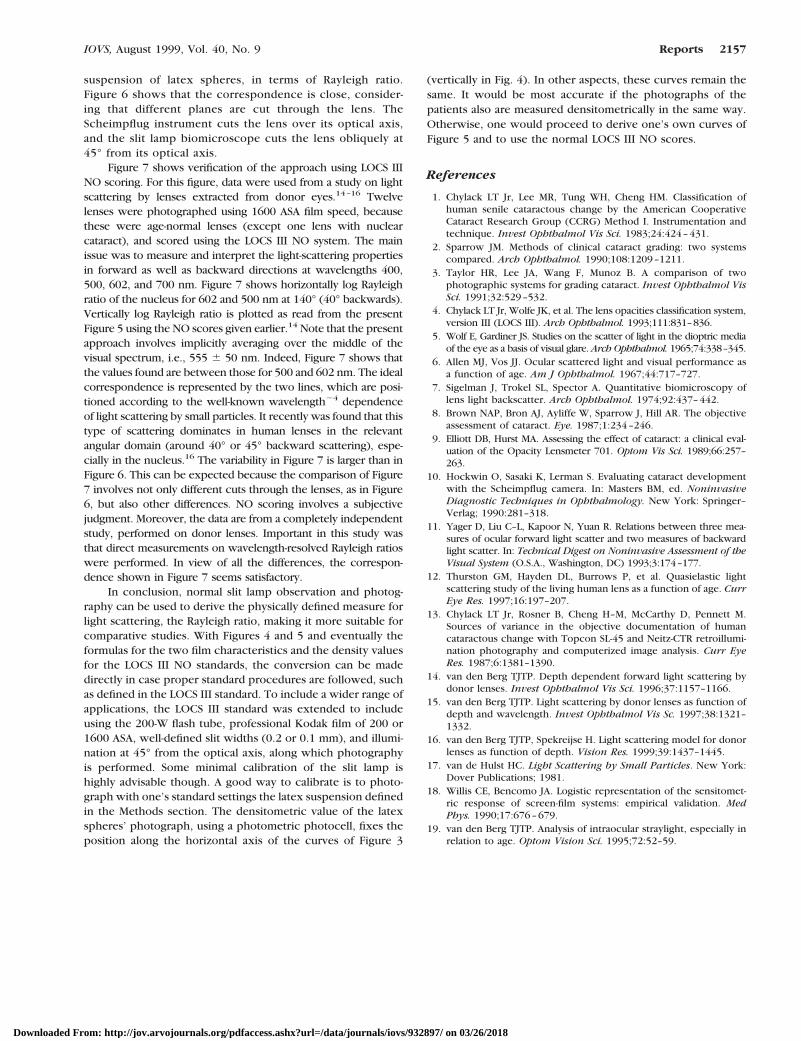
METHODS. A murine uveal melanoma cell line (99E1) wastransplanted intracamerally into athymic nude BALB/cmice. Mice were treated topically three times per daybeginning on the day of tumor transplantation and con-tinuing through day 28. Groups included (a) 1% anecor-tave acetate, (b) vehicle control, or (c) no treatment.Tumor growth was scored clinically according to the vol-ume of anterior chamber occupied by tumor. Intraoculartumor weights were determined on days 10, 14, 21, and28. The effect of the test agents on tumor cell proliferationwas examined in vitro by [3H]thymidine incorporation.
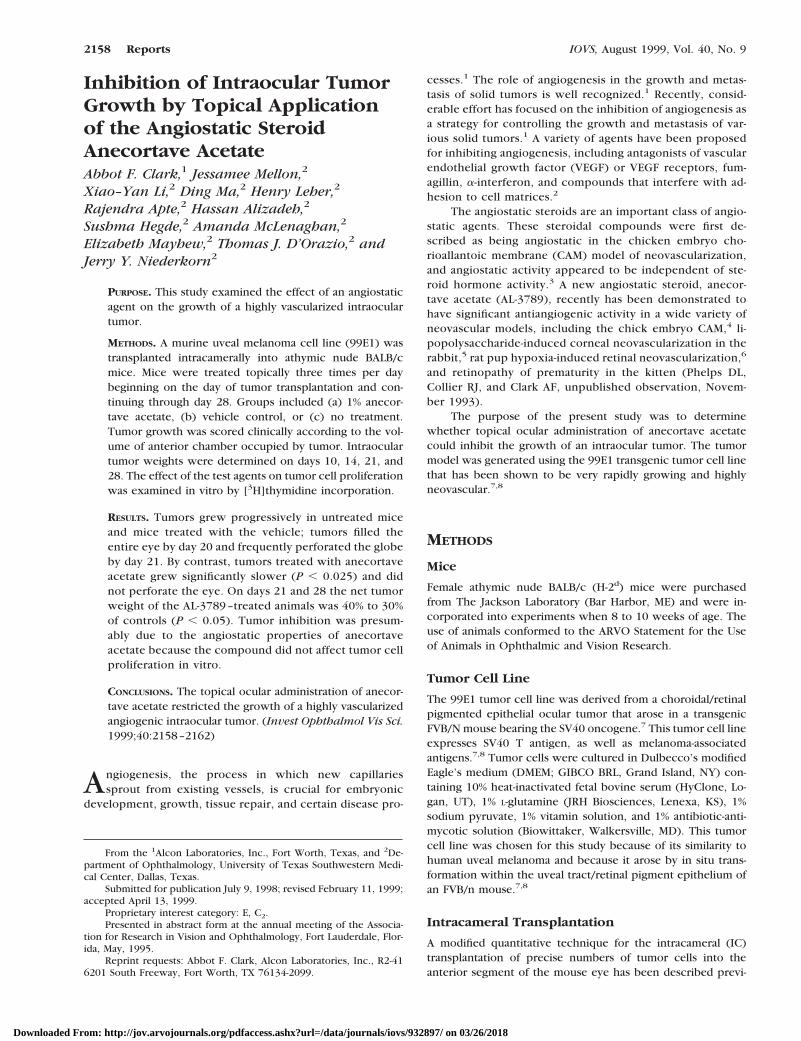
RESULTS. Tumors grew progressively in untreated miceand mice treated with the vehicle; tumors filled theentire eye by day 20 and frequently perforated the globeby day 21. By contrast, tumors treated with anecortaveacetate grew significantly slower (P , 0.025) and didnot perforate the eye. On days 21 and 28 the net tumorweight of the AL-3789 –treated animals was 40% to 30%of controls (P , 0.05). Tumor inhibition was presum-ably due to the angiostatic properties of anecortaveacetate because the compound did not affect tumor cellproliferation in vitro.
CONCLUSIONS. The topical ocular administration of anecor-tave acetate restricted the growth of a highly vascularizedangiogenic intraocular tumor. (Invest Ophthalmol Vis Sci.1999;40:2158–2162)
Angiogenesis, the process in which new capillariessprout from existing vessels, is crucial for embryonic
development, growth, tissue repair, and certain disease pro-
cesses.1 The role of angiogenesis in the growth and metas-tasis of solid tumors is well recognized.1 Recently, consid-erable effort has focused on the inhibition of angiogenesis asa strategy for controlling the growth and metastasis of var-ious solid tumors.1 A variety of agents have been proposedfor inhibiting angiogenesis, including antagonists of vascularendothelial growth factor (VEGF) or VEGF receptors, fum-agillin, a-interferon, and compounds that interfere with ad-hesion to cell matrices.2
The angiostatic steroids are an important class of angio-static agents. These steroidal compounds were first de-scribed as being angiostatic in the chicken embryo cho-rioallantoic membrane (CAM) model of neovascularization,and angiostatic activity appeared to be independent of ste-roid hormone activity.3 A new angiostatic steroid, anecor-tave acetate (AL-3789), recently has been demonstrated tohave significant antiangiogenic activity in a wide variety ofneovascular models, including the chick embryo CAM,4 li-popolysaccharide-induced corneal neovascularization in therabbit,5 rat pup hypoxia-induced retinal neovascularization,6
and retinopathy of prematurity in the kitten (Phelps DL,Collier RJ, and Clark AF, unpublished observation, Novem-ber 1993).
The purpose of the present study was to determinewhether topical ocular administration of anecortave acetatecould inhibit the growth of an intraocular tumor. The tumormodel was generated using the 99E1 transgenic tumor cell linethat has been shown to be very rapidly growing and highlyneovascular.7,8
METHODS
Mice
Female athymic nude BALB/c (H-2d) mice were purchasedfrom The Jackson Laboratory (Bar Harbor, ME) and were in-corporated into experiments when 8 to 10 weeks of age. Theuse of animals conformed to the ARVO Statement for the Useof Animals in Ophthalmic and Vision Research.
Tumor Cell Line
The 99E1 tumor cell line was derived from a choroidal/retinalpigmented epithelial ocular tumor that arose in a transgenicFVB/N mouse bearing the SV40 oncogene.7 This tumor cell lineexpresses SV40 T antigen, as well as melanoma-associatedantigens.7,8 Tumor cells were cultured in Dulbecco’s modifiedEagle’s medium (DMEM; GIBCO BRL, Grand Island, NY) con-taining 10% heat-inactivated fetal bovine serum (HyClone, Lo-gan, UT), 1% L-glutamine (JRH Biosciences, Lenexa, KS), 1%sodium pyruvate, 1% vitamin solution, and 1% antibiotic-anti-mycotic solution (Biowittaker, Walkersville, MD). This tumorcell line was chosen for this study because of its similarity tohuman uveal melanoma and because it arose by in situ trans-formation within the uveal tract/retinal pigment epithelium ofan FVB/n mouse.7,8
Intracameral Transplantation
A modified quantitative technique for the intracameral (IC)transplantation of precise numbers of tumor cells into theanterior segment of the mouse eye has been described previ-
From the 1Alcon Laboratories, Inc., Fort Worth, Texas, and 2De-partment of Ophthalmology, University of Texas Southwestern Medi-cal Center, Dallas, Texas.
Submitted for publication July 9, 1998; revised February 11, 1999;accepted April 13, 1999.
Proprietary interest category: E, C2.Presented in abstract form at the annual meeting of the Associa-
tion for Research in Vision and Ophthalmology, Fort Lauderdale, Flor-ida, May, 1995.
Reprint requests: Abbot F. Clark, Alcon Laboratories, Inc., R2-416201 South Freeway, Fort Worth, TX 76134-2099.
2158 Reports IOVS, August 1999, Vol. 40, No. 9
Downloaded From: http://jov.arvojournals.org/pdfaccess.ashx?url=/data/journals/iovs/932897/ on 03/26/2018
ously.8 Mice were deeply anesthetized with 0.66 mg ketaminehydrochloride (Vetalar; Parke, Davis, and Co., Detroit, MI)given intramuscularly. Tumor cells (105/5 ml) were inoculatedinto the anterior chamber, using a 1.0-ml Hamilton syringefitted with a 35-gauge glass needle.
Preparation and Topical Administration ofAnecortave Acetate
Anecortave acetate (AL-3789) [4,9(11)-pregnadien-11b,17a,21-triol-3,20-dione-21-acetate] was prepared as a proprietary 1%nonsettling suspension. Control animals received the samevehicle. Groups of animals (n 5 5 to 10 mice/group) weretreated three times a day with 4 ml of 1% anecortave acetate orwith vehicle while a third group remained untreated.
Assessment of Tumor Mass
Eyes were examined two to three times per week using anoperating microscope and the tumor growth scored based onthe relative tumor mass that occupied the anterior chamber.8
Tumor-containing eyes and the contralateral, normal eyes wereenucleated at necropsy and weighed. The difference betweenthe weight of the tumor-containing eye and the contralateralnormal eye was considered to be an approximation of thetumor mass for each mouse.
Assay for In Vitro Tumor Cell deacetylated
The effect of anecortave acetate and its deacetylated metab-olite on 99E1 tumor cell proliferation was assessed in vitro.
99E1 cells were suspended in complete DMEM (105 cells/ml), and 100 ml was added to each well in 96-well microtiterplates. One hundred microliters of DMEM containinganecortave acetate or its deacetylated metabolite (AL-4940)at 1026 M or 1027 M concentrations were added to eachwell. Cultures were incubated at 37°C for 24, 48, and 72hours. During the final 18 hours of incubation, 1 mCi of[3H]thymidine (Amersham Co., Arlington Heights, IL) wasadded to each well. Cells were harvested onto filter papers,using a MASH II cell harvester (MA Bioproducts, Walkers-ville, MD), and the incorporation of [3H]thymidine wasdetermined by liquid scintillation counting on a Beckmanscintillation counter (Beckman Instruments, Inc., Irvine,CA).
Statistics
Longitudinal growth models were fit to the clinical score dataplotted as the mean clinical score versus time. The slopes ofthe lines were compared by linear regression analysis. Statisti-cal significance in tumor weights between experimental andcontrol groups was determined by Student’s t-test. Significancewas assumed when P , 0.05.
RESULTS
As in previous studies,8 99E1 melanomas grew rapidly after ICtransplantation. Intraocular tumors grew in all mice, although
FIGURE 1. Clinical appearance of a typical intraocular 99E1 tumor treated topically with either anecortave acetate (A, C) or vehicle (B, D) on day10 (A, B) or day 28 (C, D) after intracameral transplantation of 99E1 uveal melanoma cells.
IOVS, August 1999, Vol. 40, No. 9 Reports 2159
Downloaded From: http://jov.arvojournals.org/pdfaccess.ashx?url=/data/journals/iovs/932897/ on 03/26/2018
the extent of tumor growth varied between the treated anduntreated groups. Tumor growth patterns in mice treated withthe vehicle did not differ significantly from the untreated con-trol group. Tumors perforated the globe of the eyes betweendays 21 to 28 in approximately one half (4/9) of the mice in theuntreated and vehicle groups. However, topical application ofanecortave acetate resulted in a marked inhibition of clinicallyassessed tumor growth (Figs. 1, 2). The growth rate of tumorsin the control (vehicle and untreated) animals was significantlygreater that the tumor growth rate in the anecortave acetate–treated group (P , 0.025). Tumors did not perforate the globein any of the treated mice. These clinical observations wereconfirmed by weighing the tumor-containing eyes. Anecortaveacetate treatment produced 44%, 40%, 61%, and 70% reduc-tions in the tumor weights of the tumor-containing eyes ondays 10, 14, 21, and 28 compared to their respective controlgroups (P , 0.05 for days 10, 21, and 28) (Fig. 3). Tumorweights (mean 6 SEM in milligrams) for the control groupwere 6.26 6 1.07 (n 5 10) for day 10, 9.04 6 2.55 (n 5 10)for day 14, 43.03 6 8.67 (n 5 11) for day 21, and 110.7 6 29.6(n 5 9) for day 21. Tumor weights in the anecortave acetategroup were 3.49 6 1.11 (n 5 10) for day 10, 5.46 6 3.20 (n 55) for day 14, 16.72 6 6.30 (n 5 5) for day 21, and 32.62 613.66 (n 5 5) for day 28. The clinical scores appeared tounderestimate the efficacy of anecortave acetate compared tothe tumor weights most likely because the clinical scores were
based on visual inspection of tumor size in the anterior seg-ment and did not account for tumor growth in the posteriorsegment.
The inhibition of intraocular tumor growth was presum-ably due to the potent angiostatic properties of anecortaveacetate although it was theoretically possible that this com-pound was either directly cytotoxic to tumor cells or inhibitedtumor cell proliferation. However, the results from in vitroassays indicated that neither the active nor the deacetylatedform of anecortave acetate affected the viability or the prolif-eration of 99E1 tumor cells over a 72-hour period (Fig. 4).
DISCUSSION
The growth of solid tumors is limited by the tumor’s ability toobtain a nutritive source via stimulation of new blood vesselgrowth. Injection of 99E1 tumor cells into the anterior chamber ofnude mice leads to a rapidly proliferating and highly neovasculartumor. Topical ocular administration of the angiostatic steroidanecortave acetate beginning at the time of injection of tumorcells led to a significant decrease (40%–70% inhibition) in tumorgrowth rate over the 4-week period of treatment. Neither anecor-tave acetate nor AL-4940 (the deacetylated metabolite) affectedtumor cell proliferation in vitro, suggesting that this agent inhib-ited tumor growth by its angiostatic action.
FIGURE 2. Clinical assessment (mean 6 SEM) of the effect of topically applied anecortave acetate and vehicle on the intraocular growth of 99E1tumors in BALB/c nude mice. Tumor growth rate in the anecortave acetate treated group was statistically slower than the growth rate in the controlgroup (P , 0.025). n 5 9 to 30 for the control group and n 5 5 to 25 for the anecortave acetate treated group.
2160 Reports IOVS, August 1999, Vol. 40, No. 9
Downloaded From: http://jov.arvojournals.org/pdfaccess.ashx?url=/data/journals/iovs/932897/ on 03/26/2018
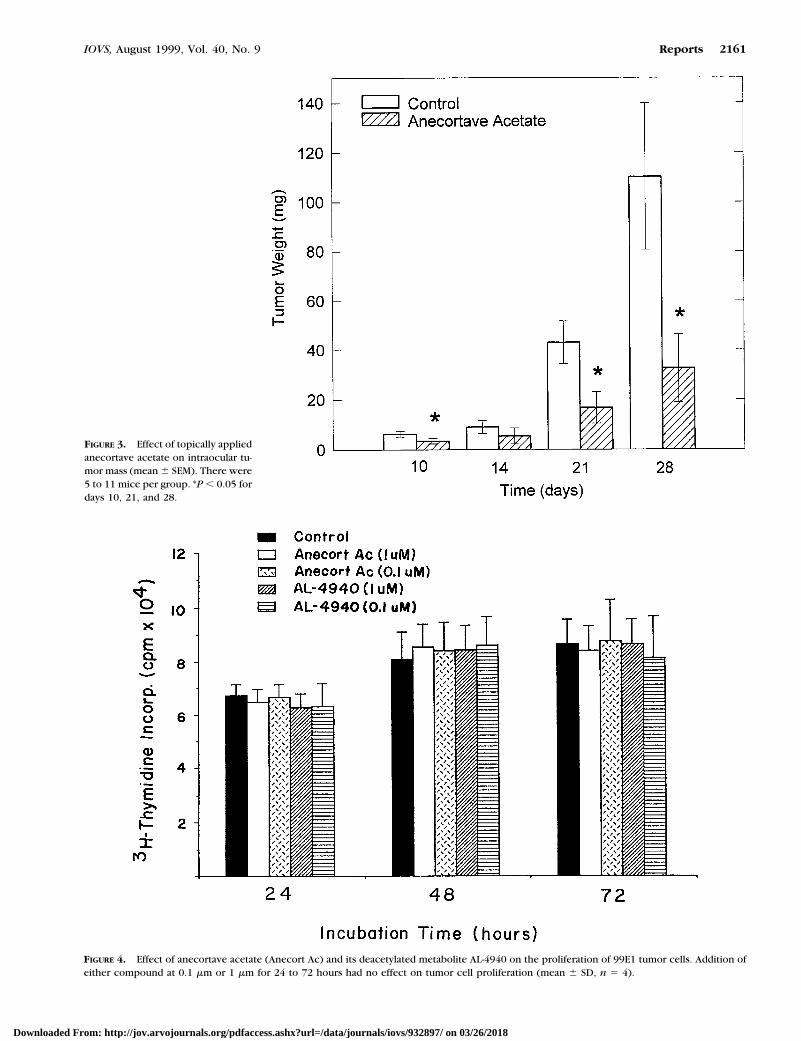
FIGURE 3. Effect of topically appliedanecortave acetate on intraocular tu-mor mass (mean 6 SEM). There were5 to 11 mice per group. *P , 0.05 fordays 10, 21, and 28.
FIGURE 4. Effect of anecortave acetate (Anecort Ac) and its deacetylated metabolite AL-4940 on the proliferation of 99E1 tumor cells. Addition ofeither compound at 0.1 mm or 1 mm for 24 to 72 hours had no effect on tumor cell proliferation (mean 6 SD, n 5 4).
IOVS, August 1999, Vol. 40, No. 9 Reports 2161
Downloaded From: http://jov.arvojournals.org/pdfaccess.ashx?url=/data/journals/iovs/932897/ on 03/26/2018
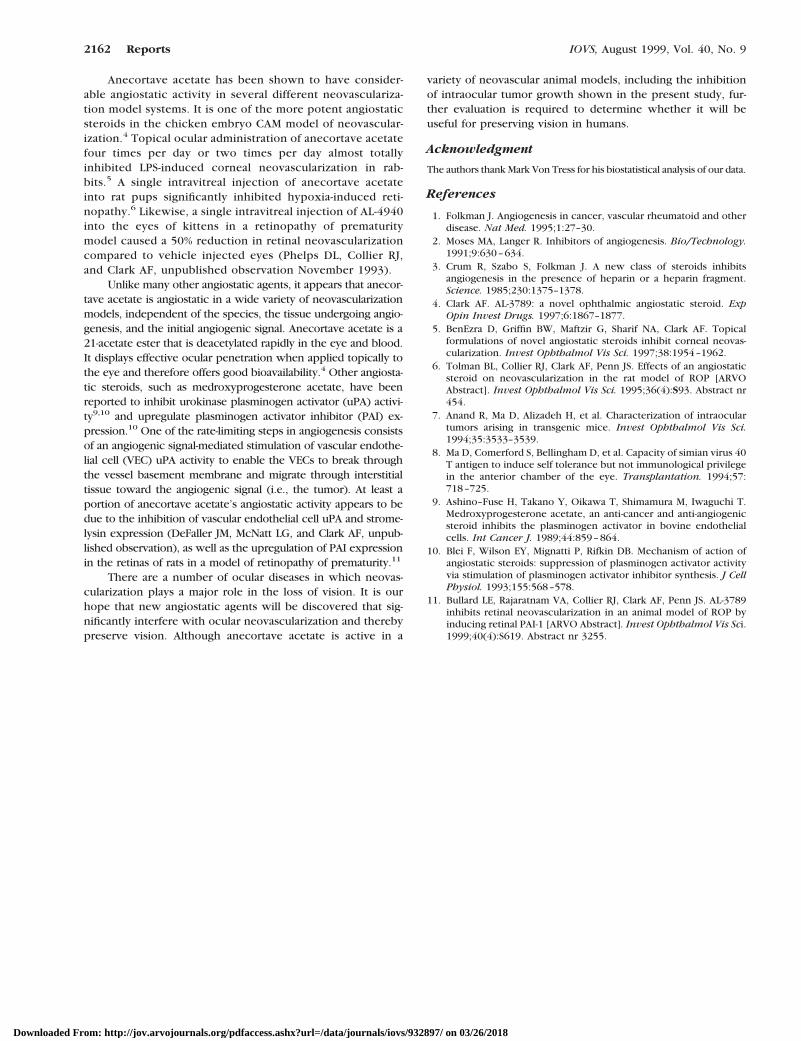
Anecortave acetate has been shown to have consider-able angiostatic activity in several different neovasculariza-tion model systems. It is one of the more potent angiostaticsteroids in the chicken embryo CAM model of neovascular-ization.4 Topical ocular administration of anecortave acetatefour times per day or two times per day almost totallyinhibited LPS-induced corneal neovascularization in rab-bits.5 A single intravitreal injection of anecortave acetateinto rat pups significantly inhibited hypoxia-induced reti-nopathy.6 Likewise, a single intravitreal injection of AL-4940into the eyes of kittens in a retinopathy of prematuritymodel caused a 50% reduction in retinal neovascularizationcompared to vehicle injected eyes (Phelps DL, Collier RJ,and Clark AF, unpublished observation November 1993).
Unlike many other angiostatic agents, it appears that anecor-tave acetate is angiostatic in a wide variety of neovascularizationmodels, independent of the species, the tissue undergoing angio-genesis, and the initial angiogenic signal. Anecortave acetate is a21-acetate ester that is deacetylated rapidly in the eye and blood.It displays effective ocular penetration when applied topically tothe eye and therefore offers good bioavailability.4 Other angiosta-tic steroids, such as medroxyprogesterone acetate, have beenreported to inhibit urokinase plasminogen activator (uPA) activi-ty9,10 and upregulate plasminogen activator inhibitor (PAI) ex-pression.10 One of the rate-limiting steps in angiogenesis consistsof an angiogenic signal-mediated stimulation of vascular endothe-lial cell (VEC) uPA activity to enable the VECs to break throughthe vessel basement membrane and migrate through interstitialtissue toward the angiogenic signal (i.e., the tumor). At least aportion of anecortave acetate’s angiostatic activity appears to bedue to the inhibition of vascular endothelial cell uPA and strome-lysin expression (DeFaller JM, McNatt LG, and Clark AF, unpub-lished observation), as well as the upregulation of PAI expressionin the retinas of rats in a model of retinopathy of prematurity.11
There are a number of ocular diseases in which neovas-cularization plays a major role in the loss of vision. It is ourhope that new angiostatic agents will be discovered that sig-nificantly interfere with ocular neovascularization and therebypreserve vision. Although anecortave acetate is active in a
variety of neovascular animal models, including the inhibitionof intraocular tumor growth shown in the present study, fur-ther evaluation is required to determine whether it will beuseful for preserving vision in humans.
Acknowledgment
The authors thank Mark Von Tress for his biostatistical analysis of our data.
References
1. Folkman J. Angiogenesis in cancer, vascular rheumatoid and otherdisease. Nat Med. 1995;1:27–30.
2. Moses MA, Langer R. Inhibitors of angiogenesis. Bio/Technology.1991;9:630–634.
3. Crum R, Szabo S, Folkman J. A new class of steroids inhibitsangiogenesis in the presence of heparin or a heparin fragment.Science. 1985;230:1375–1378.
4. Clark AF. AL-3789: a novel ophthalmic angiostatic steroid. ExpOpin Invest Drugs. 1997;6:1867–1877.
5. BenEzra D, Griffin BW, Maftzir G, Sharif NA, Clark AF. Topicalformulations of novel angiostatic steroids inhibit corneal neovas-cularization. Invest Ophthalmol Vis Sci. 1997;38:1954–1962.
6. Tolman BL, Collier RJ, Clark AF, Penn JS. Effects of an angiostaticsteroid on neovascularization in the rat model of ROP [ARVOAbstract]. Invest Ophthalmol Vis Sci. 1995;36(4):S93. Abstract nr454.
7. Anand R, Ma D, Alizadeh H, et al. Characterization of intraoculartumors arising in transgenic mice. Invest Ophthalmol Vis Sci.1994;35:3533–3539.
8. Ma D, Comerford S, Bellingham D, et al. Capacity of simian virus 40T antigen to induce self tolerance but not immunological privilegein the anterior chamber of the eye. Transplantation. 1994;57:718–725.
9. Ashino–Fuse H, Takano Y, Oikawa T, Shimamura M, Iwaguchi T.Medroxyprogesterone acetate, an anti-cancer and anti-angiogenicsteroid inhibits the plasminogen activator in bovine endothelialcells. Int Cancer J. 1989;44:859–864.
10. Blei F, Wilson EY, Mignatti P, Rifkin DB. Mechanism of action ofangiostatic steroids: suppression of plasminogen activator activityvia stimulation of plasminogen activator inhibitor synthesis. J CellPhysiol. 1993;155:568–578.
11. Bullard LE, Rajaratnam VA, Collier RJ, Clark AF, Penn JS. AL-3789inhibits retinal neovascularization in an animal model of ROP byinducing retinal PAI-1 [ARVO Abstract]. Invest Ophthalmol Vis Sci.1999;40(4):S619. Abstract nr 3255.
2162 Reports IOVS, August 1999, Vol. 40, No. 9
Downloaded From: http://jov.arvojournals.org/pdfaccess.ashx?url=/data/journals/iovs/932897/ on 03/26/2018