Embed Size (px)
Citation preview

Convolutional Neural Networks for the Detectionof Diseased Hearts Using CT Images and LeftAtrium PatchesJames D. Dormer, Emory UniversityMartin Halicek, Emory UniversityLing Ma, Emory UniversityCarolyn Reilly, Emory UniversityEduard Schreibmann, Emory UniversityBaowei Fei, Emory University
Journal Title: Proceedings of SPIEVolume: Volume 10575Publisher: Society of Photo-optical Instrumentation Engineers (SPIE) |2018-01-01Type of Work: Article | Post-print: After Peer ReviewPublisher DOI: 10.1117/12.2293548Permanent URL: https://pid.emory.edu/ark:/25593/txpnc
Final published version: http://dx.doi.org/10.1117/12.2293548
Copyright information:© 2018 SPIE.
Accessed November 22, 2021 12:13 AM EST
Convolutional Neural Networks for the Detection of Diseased Hearts Using CT Images and Left Atrium Patches
James D. Dormer1, Martin Halicek2,3, Ling Ma1, Carolyn M. Reilly4,5, Eduard Schreibmann6, and Baowei Fei1,2,5,*
1Department of Radiology and Imaging Sciences, Emory University, Atlanta, GA
2Department of Biomedical Engineering, Emory University and Georgia Institute of Technology, Atlanta, GA
3Medical College of Georgia, Augusta, GA
4Nell Hodgson Woodruff School of Nursing, Emory University, Atlanta, GA
5Winship Cancer Institute of Emory University, Atlanta, GA
6Department of Radiation Oncology, Emory University, Atlanta, GA
Abstract
Cardiovascular disease is a leading cause of death in the United States. The identification of
cardiac diseases on conventional three-dimensional (3D) CT can have many clinical applications.
An automated method that can distinguish between healthy and diseased hearts could improve
diagnostic speed and accuracy when the only modality available is conventional 3D CT. In this
work, we proposed and implemented convolutional neural networks (CNNs) to identify diseased
hears on CT images. Six patients with healthy hearts and six with previous cardiovascular disease
events received chest CT. After the left atrium for each heart was segmented, 2D and 3D patches
were created. A subset of the patches were then used to train separate convolutional neural
networks using leave-one-out cross-validation of patient pairs. The results of the two neural
networks were compared, with 3D patches producing the higher testing accuracy. The full list of
3D patches from the left atrium was then classified using the optimal 3D CNN model, and the
receiver operating curves (ROCs) were produced. The final average area under the curve (AUC)
from the ROC curves was 0.840 ± 0.065 and the average accuracy was 78.9% ± 5.9%. This
demonstrates that the CNN-based method is capable of distinguishing healthy hearts from those
with previous cardiovascular disease.
Keywords
Computer-aided diagnosis; Heart disease; Convolutional neural networks; Deep learning; 3D Computed tomography; Cardiovascular disease (CVD); Classification
* [email protected]; Web: https://fei-lab.org.
HHS Public AccessAuthor manuscriptProc SPIE Int Soc Opt Eng. Author manuscript; available in PMC 2018 September 05.
Published in final edited form as:Proc SPIE Int Soc Opt Eng. 2018 February ; 10575: . doi:10.1117/12.2293548.
Author M
anuscriptA
uthor Manuscript
Author M
anuscriptA
uthor Manuscript

1. INTRODUCTION
Despite the decline in deaths related to heart disease in the 20th century, cardiovascular
disease (CVD) continues to be a leading cause of deaths in the United States 1-3. Early
detection is key to further reduce the mortality rate, as it increases the number of treatment
options for patients and can prevent later stages of the disease4. Unfortunately, CVD is
commonly diagnosed after a patient presents with symptoms, such as muscle weakness,
fatigue, chest pain, or breathlessness. Once symptomatic, the heart is often imaged with
coronary angiography, magnetic resonance imaging (MRI), single-photon emission
computed tomography (SPECT), or ultrasound in order to gain more information about the
condition 5, 6. CT has been used to diagnose certain cardiovascular diseases. Some addition
functional information can be gained using four-dimensional (4D) CT, at the cost of
increased radiation exposure, more imaging time, and an increased susceptibility to motion
artifacts due to the increased acquisition time when compared to 3D CT. An automated
method that can identify hearts with cardiovascular disease could enable cardiologists to
quickly identify the patients at the risk of cardiovascular disease using a single 3D CT exam.
One promising option is using a convolutional neural network (CNN), which have
previously been applied to differentiate diseased and cancer tissues 7-9. CNN, which is
highly user-independent, once properly trained and validated, allows automated disease
classification. In this study, we investigate the feasibility of using CNN and CT data to
identify patients with previous cardiovascular disease from normal patients with the goal of
early detection of CVD in the future.
2. METHODS
2.1 Data Acquisition and Processing
Twelve patients received baseline chest CT prior to radiotherapy treatment planning for a
thoracic cancer. Six of those patients (No. 1-6) had no history of cardiovascular disease and
did not develop any CVD following treatment. The other six patients (No. 7-12) had a CVD
event prior to receiving a CT and were later treated for another acute CVD event following
treatment.
The left atrium for each patient was segmented using a point-to-point mapping between an
atlas and the patient CT to segment the heart, after which the segmented volume is verified.
Patches centered on pixels in the left atrium were created in MATLAB (MathWorks, Inc.,
Natick, MA, USA) for both 2D and 3D (Figure 1), with a patch created for every pixel. The
patches were allowed to overlap one another. Where necessary, zero-padding was used on
the 3D patches. From each patient, 2500 2D patches and 500 3D patches were randomly
selected for leave-one-out cross-validation model training in TensorFlow 10. The complete
list of patches from each patient would be used for later evaluation of the final models.
2.2 Training of Convolutional Neural Network
Patches from healthy and diseased patients were paired for the leave-one-out cross-
validation training, with Patient 1 & 7 used to validate the first model, 2 & 8 the second, and
so on. In total, 25,000 2D patches were used to train the 2D CNN and 5,000 3D patches
Dormer et al. Page 2
Proc SPIE Int Soc Opt Eng. Author manuscript; available in PMC 2018 September 05.
Author M
anuscriptA
uthor Manuscript
Author M
anuscriptA
uthor Manuscript
were used to train the 3D CNN for each model, with half of the patches representing CVD
tissue and the other half healthy tissue. This ensured balance between classes to reduce any
training bias.
The neural network constructed in TensorFlow is depicted in Figure 2, using the AdaDelta11
optimizer to minimize loss. Most parameters for the 2D and 3D CNNs were each optimized
separately. Both CNNs consisted of four convolution layers with a max pooling layer
between the first and second convolution layers, all using the ‘VALID’ specification, as
described in the TensorFlow documentation. These layers were followed by a pair of fully
connected layers, after which a model was generated to classify each patch as either ‘CVD’
or ‘healthy’. Various filter sizes and neurons were tested for the convolution layers and fully
connected layers, respectively. The max pool layer for the 2D CNN had a stride and kernel
size of 2 × 2, while for the 3D CNN they were 2 × 2 × 2. Other parameters which were
optimized include the drop out value, AdaDelta parameter ρ, AdaDelta parameter ε, kernel
size, bias initialization constant, and learning rate. Patch sizes of 101 × 101 for 2D and 51 ×
51 × 31 for 3D were chosen in order to provide as much information to the CNN as possible.
This also allows the method to be more easily extended to full-volume images in the future.
Each CNN was allowed to train for 60 epochs per patient pair, producing a model after each
epoch for validation.
2.3 Validation
Validation was separated into two parts: CNN model verification and result verification.
First, patch classification accuracy was used to evaluate the models during optimization
using a subset of patches from each patient. Classification accuracy was calculated as the
number of patches correctly classified over the total number of patches for the patient, with
the predictor threshold equal to 0.5. The optimal accuracy for each patient pair was averaged
with that of the other patient pairs to validate the performed of the parameters used.
Secondly, result verification was performed using the CNN models created with the optimal
parameters in three steps. In the first step, all the CNN models produced using the optimal
parameters are selected. Next, ROC curves are produced using all of the patches from each
pair of hearts with the corresponding models. Finally, AUCs are calculated, and the
threshold for each ROC was used to determine the accuracy, sensitivity, and specificity for
each patient pair. A summary of the presented method is shown in Figure 3.
3. RESULTS
3.1 Optimal 2D CNN Parameters
Kernel sizes of 3 × 3, 5 × 5, 7 × 7, and 9 × 9 were tested for the 2D CNN, with the 9 × 9
kernel the only one that produced training results. The optimal drop-out value for 2D
patches was 1.00, with convolutional layer filter sizes of 25, 25, 100, and 100. The optimal
number of neurons for each fully connected layer was 128 and 64. The optimal value for ρ was 0.95, and for ε 1.0 × 10⁻⁹. Learning rate optimization produced a value of 0.01, and
0.10 for the bias initialization constant. Using the optimized parameters, the average
accuracy for the validation data was 65.4% ± 13.7%.
Dormer et al. Page 3
Proc SPIE Int Soc Opt Eng. Author manuscript; available in PMC 2018 September 05.
Author M
anuscriptA
uthor Manuscript
Author M
anuscriptA
uthor Manuscript
3.2 Optimal 3D CNN Parameters
3D CNN kernel sizes were 3 × 3 × 3, 3 × 3 × 5, 5 × 5 × 3, and 5 × 5 × 5, with the 5 × 5 × 3
kernel producing the optimal results. Adjusting the learning rate gave an optimal value of
0.001. Filter sizes were set to 25 for all convolution layers, as larger sizes were found to
reduce the classification accuracy. Fully connected layer neuron counts were 256 and 128,
and AdaDelta parameters ε and ρ were 0.0001 and 0.89, respectively. Lower drop-out values
increased the classification accuracy, with a maximum occurring at 0.70. Likewise, a bias
initialization constant of 0.05 performed better than one of 0.10. Using these parameter
values, the optimal classification accuracy on the test data was 77.6% ± 7.2%.
3.3 Final Heart Classification
The 3D CNN and associated optimal parameters were chosen for the final heart
classification using all the 3D patches from the left atrium. The final ROC plots, using the
optimal calculated AUC value for each patient, are shown in Figure 4. AUC, accuracy,
sensitivity, specificity, and optimal threshold used are shown in Table I. The overall average
AUC was 0.840 ± 0.065, with individual values ranging from 0.754 to 0.956. The average
accuracy was 78.9% ± 5.9%, with a range of 70.4% to 89.2%. The average sensitivity and
specificity were 80.0% ± 7.7% and 78.6% ± 6.4%, respectively.
4. DISCUSSION
Patch size was an important consideration when preparing the data for the classification.
Depending on the type of cardiovascular disease, only certain areas of the heart might be
affected. Therefore, even if a patch is from a diseased heart, the particular area covered by
the patch may not be diseased. Therefore, multiple large patches should be used, even if the
computational cost is increased. The final classification of the heart as healthy or CVD
would then depend on the average classification of patches from that heart. Eventually, using
the entire heart as a single volume for classification would be clinically advantageous.
However, this would require additional preprocessing to ensure input volumes have a
uniform shape, and a large training dataset for the model would be needed to account for the
normal variations between patient hearts.
In this study, the validation results for the 3D patches outperformed those of the 2D patches
by more than 10%. This suggests the need to include a collection of slices to identify the
optimal features to identify CVD. The low convolutional filter sizes required for the 3D
patches also indicate that the number of useful features separating CVD and healthy hearts
could be small. However, this could also be a product of having a small sample size. Finally,
only using a small subset of patches to train the models did not seem to limit the model.
The ROC curves for the patient pairs in Figure 4 all quickly approach the top left corner,
with the pairing of Patients 4 and 10 showing the best performance. This is represented by
the classification accuracy of 89.2% for that pair, the highest among all the patients.
Threshold values varied greatly between the ROC curves, from 0.0036 to nearly 1.0. This
made choosing a single threshold value to use for all patients impractical. Therefore, each
patient was evaluated at their individual optimal threshold values.
Dormer et al. Page 4
Proc SPIE Int Soc Opt Eng. Author manuscript; available in PMC 2018 September 05.
Author M
anuscriptA
uthor Manuscript
Author M
anuscriptA
uthor Manuscript
As indicated early, a limitation of the study was the small sample size of patients available.
Since the training datasets consisted of patches from five healthy and five diseased hearts,
even small variations between hearts can have large impacts on the result. Therefore, a
greater number of subjects are needed to make a truly generalized CNN model. In addition,
only 500 3D patches and 2500 2D from each patient were used to train and validate the
models. The impact of this limitation was most likely mitigated by the large size of each
patch, especially in the case of the 3D patches. This can be seen by comparing the average
accuracy when classifying all of the left atrium 3D patches to that of the sub-sample used to
test the CNN model (78.9% vs. 77.6%).
5. CONCLUSION
In this work we tested whether it was feasible to classify healthy and diseased hearts using
2D or 3D patches and a convolutional neural network. This deep learning approach can be
useful for rapidly screening patients at the risk of cardiovascular disease using CT images.
Future work will explore using a single volume containing the entire heart for classification.
Furthermore, classification of patients who later had a CVD event will be compared to
healthy patients in an effort to identify patients at risk of serious cardiovascular
complications. A final possible extension of the work would be identifying and monitoring
early stages of congenital heart conditions of pediatric patients.
ACKNOWLEDGMENTS
This research is supported in part by NIH grants (CA176684, CA156775, and CA204254) and by the National Cancer Institute (NCI) via NRG Oncology, a member of the NCI National Clinical Trials Network with Federal funds from the Department of Health and Human Services under Grant Number U10 CA37422. The contents of this publication do not necessarily reflect the views or policies of the Department of Health and Human Services, nor does it imply endorsement by the U.S. Government.
REFERENCES
[1]. CDC, Decline in deaths from heart disease and stroke--United States, 1900–1999 (1999).
[2]. Heidenreich PA, Trogdon JG, Khavjou OA, Butler J, Dracup K, Ezekowitz MD, Finkelstein EA, Hong Y, Johnston SC, Khera A, Lloyd-Jones DM, Nelson SA, Nichol G, Orenstein D, Wilson PWF, and Woo YJ, “Forecasting the Future of Cardiovascular Disease in the United States,” Circulation, 123(8), 933 (2011). [PubMed: 21262990]
[3]. Benjamin EJ, Blaha MJ, Chiuve SE, Cushman M, Das SR, Deo R, de Ferranti SD, Floyd J, Fornage M, Gillespie C, Isasi CR, Jimenez MC, Jordan LC, Judd SE, Lackland D, Lichtman JH, Lisabeth L, Liu S, Longenecker CT, Mackey RH, Matsushita K, Mozaffarian D, Mussolino ME, Nasir K, Neumar RW, Palaniappan L, Pandey DK, Thiagarajan RR, Reeves MJ, Ritchey M, Rodriguez CJ, Roth GA, Rosamond WD, Sasson C, Towfighi A, Tsao CW, Turner MB, Virani SS, Voeks JH, Willey JZ, Wilkins JT, Wu JHY, Alger HM, Wong SS, and Muntner P, “Heart Disease and Stroke Statistics—2017 Update: A Report From the American Heart Association,” Circulation, 135(10), e146 (2017). [PubMed: 28122885]
[4]. Rosiek A, and Leksowski K, “The risk factors and prevention of cardiovascular disease: the importance of electrocardiogram in the diagnosis and treatment of acute coronary syndrome,” Therapeutics and Clinical Risk Management, 12, 1223–1229 (2016). [PubMed: 27540297]
[5]. Dickstein K, Cohen - Solal A, Filippatos G, McMurray JJ, Ponikowski P, Poole - Wilson PA, Strömberg A, Veldhuisen DJ, Atar D, and Hoes AW, “ESC guidelines for the diagnosis and treatment of acute and chronic heart failure 2008,” European journal of heart failure, 10(10), 933–989 (2008). [PubMed: 18826876]
Dormer et al. Page 5
Proc SPIE Int Soc Opt Eng. Author manuscript; available in PMC 2018 September 05.
Author M
anuscriptA
uthor Manuscript
Author M
anuscriptA
uthor Manuscript
[6]. McMurray JJV, Adamopoulos S, Anker SD, Auricchio A, Böhm M, Dickstein K, Falk V, Filippatos G, Fonseca C, Gomez-Sanchez MA, Jaarsma T, Køber L, Lip GYH, Maggioni AP, Parkhomenko A, Pieske BM, Popescu BA, Rønnevik PK, Rutten FH, Schwitter J, Seferovic P, Stepinska J, Trindade PT, Voors AA, Zannad F, Zeiher A, Guidelines E. S. C. C. f. P., Bax JJ, Baumgartner H, Ceconi C, Dean V, Deaton C, Fagard R, Funck-Brentano C, Hasdai D, Hoes A, Kirchhof P, Knuuti J, Kolh P, McDonagh T, Moulin C, Popescu BA, Reiner Ž, Sechtem U, Sirnes PA, Tendera M, Torbicki A, Vahanian A, Windecker S, Document R, McDonagh T, Sechtem U, Bonet LA, Avraamides P, Ben Lamin HA, Brignole M, Coca A, Cowburn P, Dargie H, Elliott P, Flachskampf FA, Guida GF, Hardman S, Iung B, Merkely B, Mueller C, Nanas JN, Nielsen OW, Ørn S, Parissis JT, and Ponikowski P, “ESC Guidelines for the diagnosis and treatment of acute and chronic heart failure 2012,” European Journal of Heart Failure, 14(8), 803–869 (2012). [PubMed: 22828712]
[7]. Übeyli ED, “Combined neural networks for diagnosis of erythemato-squamous diseases,” Expert Systems with Applications, 36(3, Part 1), 5107–5112 (2009).
[8]. Sun W, Zheng B, and Qian W, "Computer aided lung cancer diagnosis with deep learning algorithms." 9785, 8.
[9]. Halicek M, Lu G, Little JV, Wang X, Patel M, Griffith CC, El-Deiry MW, Chen AY, and Fei B, “Deep convolutional neural networks for classifying head and neck cancer using hyperspectral imaging,” Journal of Biomedical Optics, 22(6), 060503–060503 (2017).
[10]. Abadi M, Agarwal A, Barham P, Brevdo E, Chen Z, Citro C, Corrado GS, Davis A, Dean J, Devin M, Ghemawat S, Goodfellow I, Harp A, Irving G, Isard M, Jia Y, Jozefowicz R, Kaiser L, Kudlur M, Levenberg J, Mane D, Monga R, Moore S, Murray D, Olah C, Schuster M, Shlens J, Steiner B, Sutskever I, Talwar K, Tucker P, Vanhoucke V, Vasudevan V, Viegas F, Vinyals O, Warden P, Wattenberg M, Wicke M, Yu Y, and Zheng X, “Tensorflow: Large-scale machine learning on heterogeneous distributed systems,” arXiv preprint arXiv:1603.04467, (2015).
[11]. Zeiler MD, “ADADELTA: an adaptive learning rate method,” arXiv preprint arXiv:1212.5701, (2012).
Dormer et al. Page 6
Proc SPIE Int Soc Opt Eng. Author manuscript; available in PMC 2018 September 05.
Author M
anuscriptA
uthor Manuscript
Author M
anuscriptA
uthor Manuscript
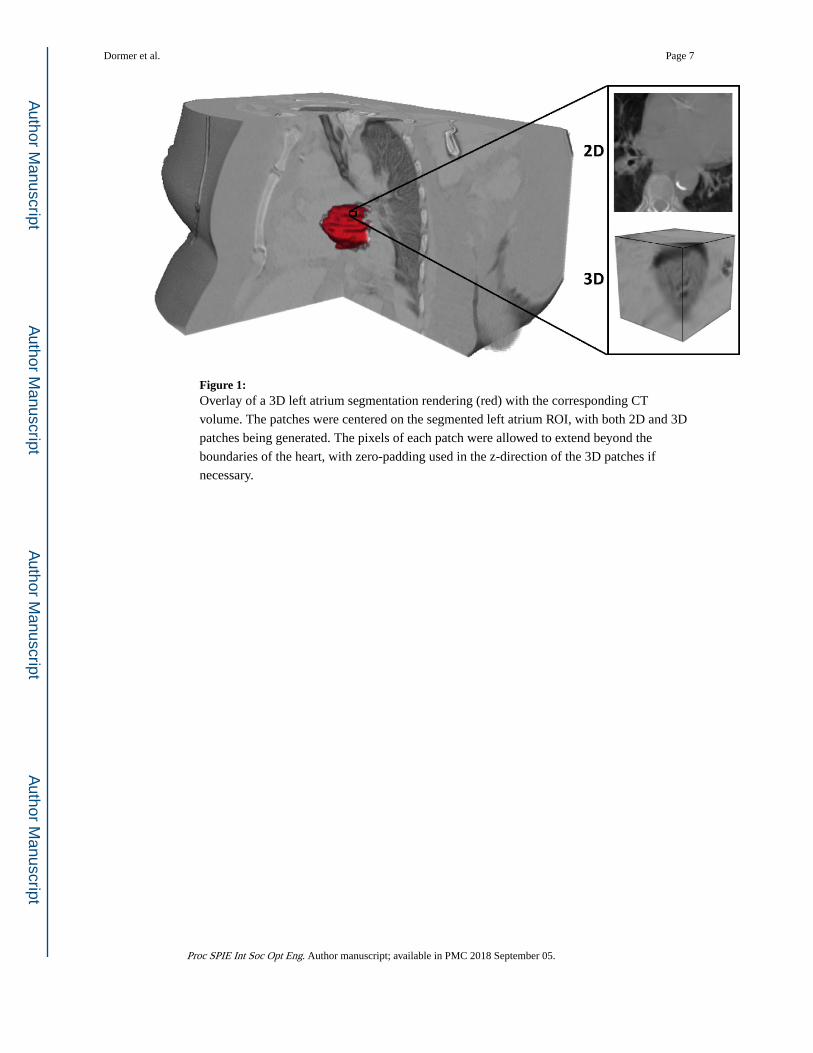
Figure 1: Overlay of a 3D left atrium segmentation rendering (red) with the corresponding CT
volume. The patches were centered on the segmented left atrium ROI, with both 2D and 3D
patches being generated. The pixels of each patch were allowed to extend beyond the
boundaries of the heart, with zero-padding used in the z-direction of the 3D patches if
necessary.
Dormer et al. Page 7
Proc SPIE Int Soc Opt Eng. Author manuscript; available in PMC 2018 September 05.
Author M
anuscriptA
uthor Manuscript
Author M
anuscriptA
uthor Manuscript

Figure 2: Diagram of the convolutional neural network used for the classification. The input data was
in the form of either 2D or 3D patches and fed into four convolutional layers followed by
two fully connected layers. After the fully connected layers, a soft-max layer produced
probabilities to assign a classification label to the left atrium patch.
Dormer et al. Page 8
Proc SPIE Int Soc Opt Eng. Author manuscript; available in PMC 2018 September 05.
Author M
anuscriptA
uthor Manuscript
Author M
anuscriptA
uthor Manuscript
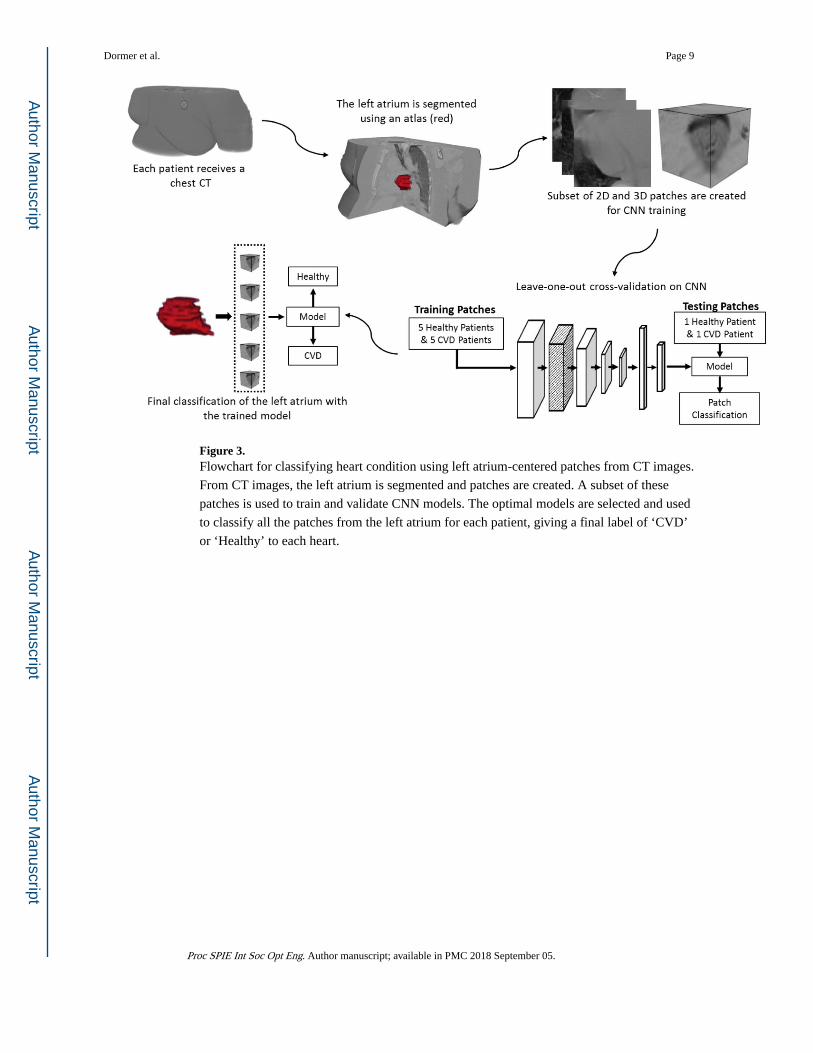
Figure 3. Flowchart for classifying heart condition using left atrium-centered patches from CT images.
From CT images, the left atrium is segmented and patches are created. A subset of these
patches is used to train and validate CNN models. The optimal models are selected and used
to classify all the patches from the left atrium for each patient, giving a final label of ‘CVD’
or ‘Healthy’ to each heart.
Dormer et al. Page 9
Proc SPIE Int Soc Opt Eng. Author manuscript; available in PMC 2018 September 05.
Author M
anuscriptA
uthor Manuscript
Author M
anuscriptA
uthor Manuscript

Figure 4: ROC curves when classifying all 3D patches from the left atrium for each patient pair. The
AUC was calculated from each of these curves, with an average value of 0.840 ± 0.065.
Each curve was produced using the optimal model for each patient pair. Values are shown in
Table I. The dashed red line indicates what the result would be if random guessing was used
to assign a class.
Dormer et al. Page 10
Proc SPIE Int Soc Opt Eng. Author manuscript; available in PMC 2018 September 05.
Author M
anuscriptA
uthor Manuscript
Author M
anuscriptA
uthor Manuscript
Author M
anuscriptA
uthor Manuscript
Author M
anuscriptA
uthor Manuscript
Dormer et al. Page 11
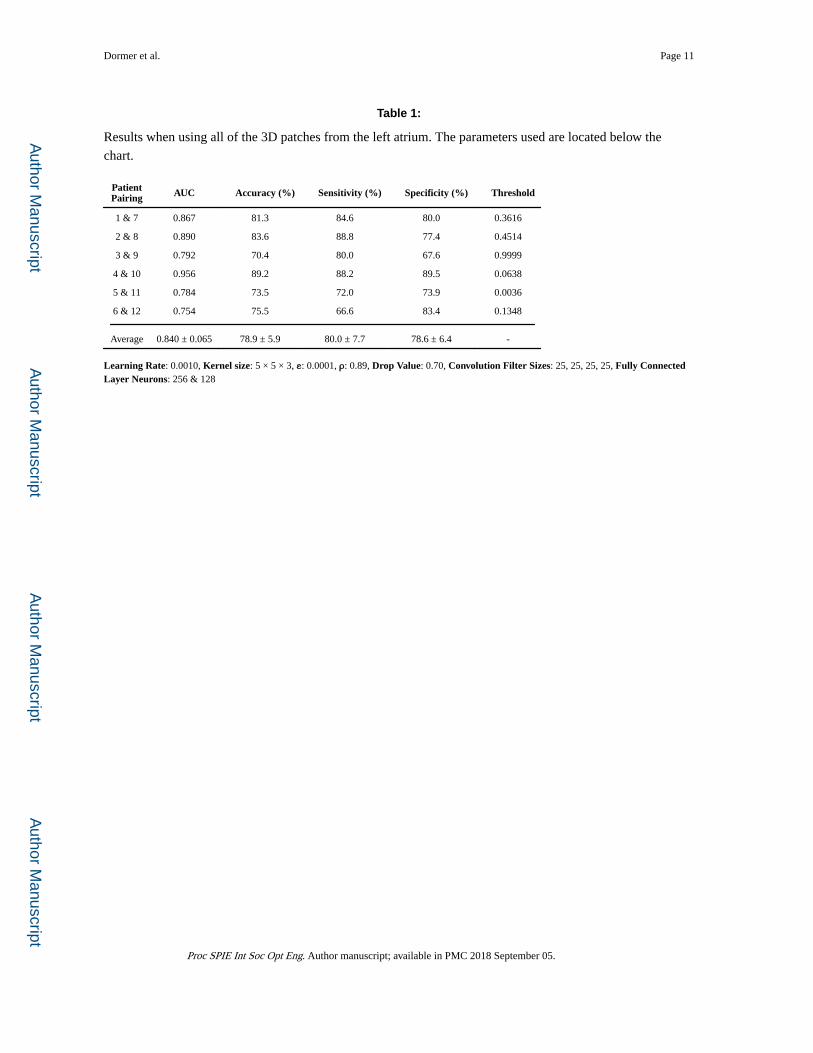
Table 1:
Results when using all of the 3D patches from the left atrium. The parameters used are located below the
chart.
PatientPairing AUC Accuracy (%) Sensitivity (%) Specificity (%) Threshold
1 & 7 0.867 81.3 84.6 80.0 0.3616
2 & 8 0.890 83.6 88.8 77.4 0.4514
3 & 9 0.792 70.4 80.0 67.6 0.9999
4 & 10 0.956 89.2 88.2 89.5 0.0638
5 & 11 0.784 73.5 72.0 73.9 0.0036
6 & 12 0.754 75.5 66.6 83.4 0.1348
Average 0.840 ± 0.065 78.9 ± 5.9 80.0 ± 7.7 78.6 ± 6.4 -
Learning Rate: 0.0010, Kernel size: 5 × 5 × 3, ε: 0.0001, ρ: 0.89, Drop Value: 0.70, Convolution Filter Sizes: 25, 25, 25, 25, Fully Connected Layer Neurons: 256 & 128
Proc SPIE Int Soc Opt Eng. Author manuscript; available in PMC 2018 September 05.