Embed Size (px)
Citation preview
arX
iv:a
stro
-ph/
0503
601
v1
28 M
ar 2
005
Cool White Dwarfs in the Sloan Digital Sky Survey1,2
Mukremin Kilic3,7, Jeffrey A. Munn4, Hugh C. Harris4, James Liebert5, Ted von Hippel3,
Kurtis A. Williams5, Travis S. Metcalfe6, D. E. Winget3, and Stephen E. Levine4
ABSTRACT
A reduced proper motion diagram utilizing Sloan Digital Sky Survey (SDSS)
photometry and astrometry and USNO-B plate astrometry is used to separate
cool white dwarf candidates from metal-weak, high-velocity main sequence Pop-
ulation II stars (subdwarfs) in the SDSS Data Release 2 imaging area. Follow-up
spectroscopy using the Hobby-Eberly Telescope, the MMT, and the McDonald
2.7m Telescope is used to demonstrate that the white dwarf and subdwarf loci
separate cleanly in the reduced proper motion diagram, and that the contami-
nation by subdwarfs is small near the cool white dwarf locus. This enables large
statistically complete samples of white dwarfs, particularly the poorly understood
cool white dwarfs, to be created from the SDSS imaging survey, with important
implications for white dwarf luminosity function studies. SDSS photometry for
our sample of cool white dwarfs is compared to current white dwarf models.
Subject headings: stars: atmospheres—stars: evolution—white dwarfs
1Based on observations obtained with the Hobby-Eberly Telescope, which is a joint project of the Uni-
versity of Texas at Austin, the Pennsylvania State University, Stanford University, Ludwig-Maximilians-
Universitat Munchen, and Georg-August-Universitat Gottingen.
2Observations reported here were obtained at the MMT Observatory, a joint facility of the Smithsonian
Institution and the University of Arizona.
3The University of Texas at Austin, Department of Astronomy, 1 University Station C1400, Austin, TX
78712
4US Naval Observatory, P.O. Box 1149, Flagstaff, AZ 86002
5Steward Observatory, University of Arizona, 933 North Cherry Avenue, Tucson, AZ 85721
6Harvard-Smithsonian Center for Astrophysics, Mail Stop 16, 60 Garden Street, Cambridge, MA 02138
– 2 –
1. Introduction
The white dwarf luminosity function of the Galactic disk has traditionally been used
as one tool to estimate the star formation history and age of this population (Liebert 1979;
Winget et al. 1987; Liebert, Dahn & Monet 1988). The largest samples to date used to
determine the white dwarf luminosity function are those of Fleming et al. (1986; see Liebert,
Bergeron & Holberg 2004 for an updated version) on the hot end and Oswalt et al. (1996,
using white dwarfs in common proper motion binaries) on the cool end. The most commonly
used luminosity function for cool white dwarfs (Liebert, Dahn, & Monet 1988) was based on
a sample of only 43 stars selected on the basis of large proper motion from the Luyten Half
Second Proper Motion Survey (Luyten 1979). Questions about completeness and kinematic
selection bias have been raised over the years, and the need to construct a larger, deeper
and more complete sample has been obvious. Of even greater interest is the possibility of
delineating a useful sample of white dwarfs from the local halo, which may be drawn largely
from a single burst of star formation at a greater age than the disk. Oppenheimer et al.
(2001) claimed to have found a significant population of halo white dwarfs from kinematic
surveys, though these claims were later disputed by several investigators (Reid et al. 2001;
Reyle et al. 2001; Silvestri, Oswalt, & Hawley 2002; Bergeron 2003; Spagna et al. 2004).
The Sloan Digital Sky Survey (SDSS, York et al. 2000) offers a valuable new resource
which may be used to identify a significantly larger white dwarf sample. Imaging is performed
in five broad optical bands (u, g, r, i, and z) down to ∼ 22 magnitude in u, g, and r with 95%
completeness for point sources. Hot white dwarfs can be identified efficiently due to their blue
colors (Fan 1999; Kleinman et al. 2004), but white dwarfs near or below the temperatures of
Population II main sequence turnoff stars are buried in the stellar locus. Methods such as the
use of an intermediate-band filter to find stars with no MgH absorption feature (Claver 1995)
turned out to be less efficient than expected (Kilic et al. 2004). However, the reduced proper
motion technique (Luyten 1918) offers an efficient means to identify cooler white dwarfs, as
well as halo white dwarfs, by their underluminosity in comparison to main sequence stars
with similar colors, and their high space motions.
An improved proper-motion catalog combining the USNO-B (Monet et al. 2003; 5
epochs) and SDSS catalogs in the area of sky covered by SDSS Data Release 1 (DR1;
Abazajian et al. 2003) is presented by Munn et al. (2004). They used SDSS astrometry
to recalibrate the USNO-B plate astrometry, reducing both the statistical and systematic
errors significantly. In addition, SDSS positions were used to eliminate the large number of
false high proper motion objects in the USNO-B catalog.
The combination of accurate SDSS photometry and SDSS+USNO-B astrometry enables
us to construct a reduced proper motion diagram and select cool white dwarf candidates
– 3 –
from the disk and halo. This paper presents results from the first year of our spectroscopic
campaign. In §2 we present the reduced proper motion diagram from SDSS Data Release
2 and review our target selection criteria for follow-up spectroscopy. Our spectroscopic
observations are described in §3, while an analysis of the observational material and results
from this analysis is presented in §4. Various implications of these results are then discussed
in §5.
2. Target Selection
The reduced proper motion, defined as H = m + 5 logµ + 5, where m is the apparent
magnitude and µ is the proper motion in arcseconds per year, has long been used as a
proxy for the absolute magnitude of a star, for a sample with similar kinematics. Munn et
al. (2004) presented a reduced proper motion diagram for a portion of SDSS DR1 in their
Figure 12. Their SDSS+USNO-B catalog is 90% complete to g = 19.7, with proper motion
errors ∼ 3.5 mas yr−1 in right ascension and declination. Four populations are delineated as
roughly parallel diagonal distributions in their diagram. The old Population I main sequence
is seen in the top right, and the Population II main sequence separates fairly cleanly to the
left and extends down past Hg = 21 near g − i = 2. The white dwarf sequence appears to
separate to the left of the Population II subdwarfs, and an unconfirmed extension of this
appears as a sequence of objects to higher Hg and redder color.
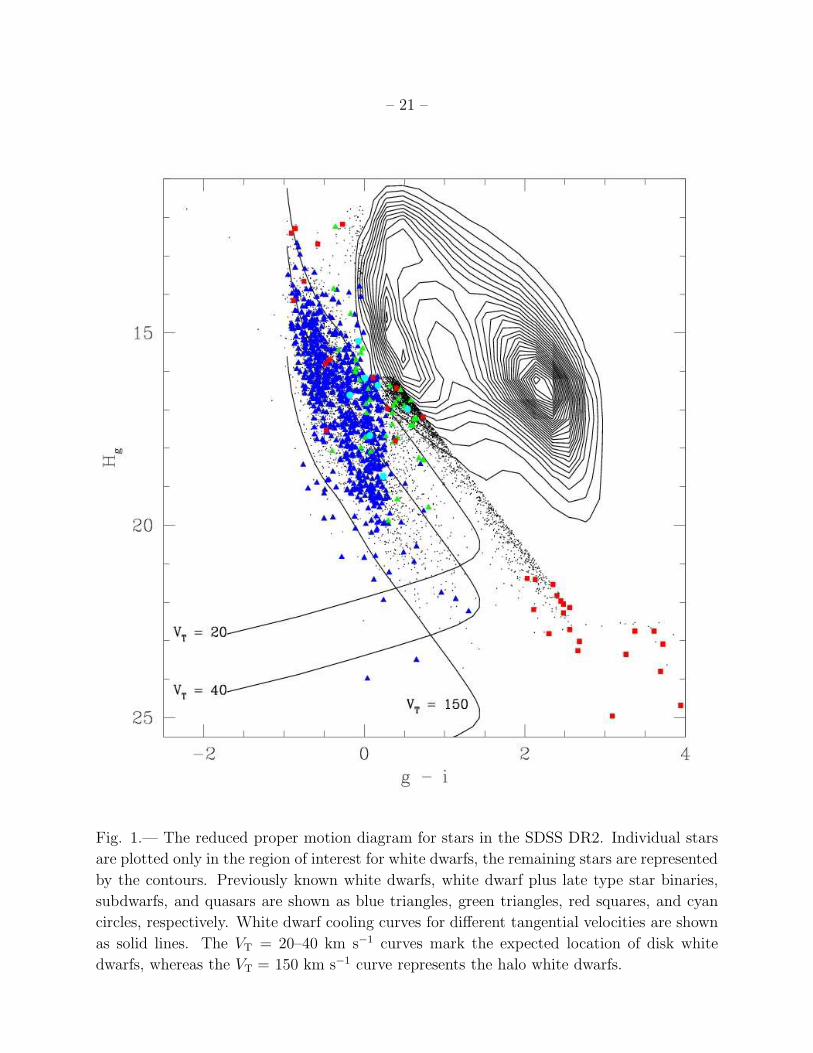
Figure 1 presents the reduced proper motion diagram for all stars in SDSS Data Release
2 (DR2; Abazajian et al. 2004) with 15 < g < 20 and with reliably measured proper
motions greater than 20 mas yr−1. Individual stars are plotted only if they are bluer than
g − i = 0 or if Hg > 15.136 + 2.727(g − i), a cut which should include all white dwarfs; the
remaining vast majority of stars are represented by the contours, as there are too many stars
to plot individually. Spectroscopically confirmed white dwarfs, white dwarf plus M dwarf
binaries, subdwarfs, and QSOs are plotted as blue triangles, green triangles, red squares,
and cyan circles, respectively. The spectroscopic identifications are drawn from the SDSS
Data Release 1 white dwarf catalog (Kleinmann et al. 2004) and QSO catalog (Schneider et
al. 2003), and the McCook & Sion (2003) catalog. We also classified all currently available
SDSS spectra for stars in the diagram with g − i > 0 or Hg > 19, and which had not
previously been classified (190 objects total). The expected sequences of white dwarfs (pure
H atmosphere, log g = 8) for specific tangential velocities (VT) are shown as solid lines, where
colors and absolute magnitudes are predicted using model atmospheres from P. Bergeron
(private communication). The VT = 20–40 km s−1 curves mark the expected location of disk
white dwarfs, whereas the VT = 150 km s−1 curve represents the halo white dwarfs. The
– 4 –
white dwarf cooling curves pass through the locus of hotter white dwarfs, then make a sharp
turn due to the onset of collision-induced absorption (CIA) due to molecular hydrogen for
the coolest stars with pure H atmospheres (Hansen 1998; Saumon & Jacobson 1999); this
opacity depresses the i band, making the colors turn bluer.
Defining a “reliable” proper motion is important, as even a small fraction of stars with
falsely measured large proper motions will scatter stars from the very densely populated
subdwarf turnoff region of the reduced proper motion diagram into the sparsely populated
region expected to contain the cool white dwarfs. We adopt a prescription for a reliably
measured proper motion similar to that delineated by Munn et al. (2004) for their catalog:
(1) the SDSS detection in both the g and i band must match the “clean” criteria as described
in the DR1 documentation, (2) there must be a one-to-one match between the SDSS and
USNO-B objects, and (3) the proper motion fit must have an rms residual of less than 525
mas in each coordinate. We further require the star to have been detected in all 5 epochs in
USNO-B, and for the distance to the nearest neighbor with g < 22 to exceed 7 arcsec. The
final two requirements are based on inspection of all the plate images used in the USNO-B
catalog for a subsample of 562 stars in the portion of the reduced proper motion diagram
expected to be populated by halo and cool disk white dwarfs (−1 < g < 1.5 and Hg > 18),
and with proper motions greater than 100 mas yr −1 (the reality of measured proper motions
smaller than that were too difficult to judge using the quick by-eye inspections we employed).
Of the 201 inspected stars that were detected in all 5 USNO-B epochs, and whose nearest
neighbor (brighter than g = 22) is greater than 7 arcsec away, only 3 were judged to have
a falsely measured large proper motion, for a 1.5% contamination rate. On the other hand,
of the 20 inspected stars that were detected in all 5 USNO-B epochs but had a neighbor
closer than 7 arcsec, 7 were judged to have an incorrectly measured proper motion, for a
contamination rate of 35%. Objects separated by less than 7 arcsec tend to be blended on
the Schmidt plates, leading to incorrectly measured proper motions. All of the 208 inspected
stars which were not detected in one or two of the USNO-B epochs and which have a nearest
neighbor closer than 7 arcsec had incorrectly measured proper motions. Even if the nearest
neighbor is greater than 7 arcsec away, the contamination rate of falsely measured large
proper motions increases for stars not detected in all 5 USNO-B epochs. For such stars, 20
of 39 inspected stars not detected in one of the USNO-B epochs had incorrectly measured
proper motions, for a contamination rate of 51%, while 81 of 91 not detected in two of the
USNO-B epochs had incorrectly measured proper motions, for a contamination rate of 89%.
In Figure 1, it is clear that the hot white dwarfs previously targetted spectroscopically
by SDSS are well separated from main sequence and subdwarf stars (represented by the
contours) and are located where expected from the models. It is also clear that the white
dwarf locus extends redder and to larger reduced proper motion, well separated from the
– 5 –
subdwarf locus (the diagonal cut where we start to plot individual stars), and that SDSS has
not spectroscopically observed these cooler white dwarf candidates. This drove our target
selection. Our goal was to obtain spectroscopic identifications for a large sample of cool
white dwarf candidates so as to understand the efficiency of using reduced proper motions
to select cool white dwarfs as well as the contamination due to subdwarfs. Thus we selected
most of our targets from the region with g−i > 0 and to the left of the VT = 20 km s−1 curve,
though we also selected some to the right of the curve to better understand how cleanly the
white dwarf and subdwarf loci separate.
3. Observations
Follow-up spectroscopy of the cool white dwarf candidates were obtained at the HET,
the MMT, and the McDonald 2.7m Harlan Smith Telescope between September 2003 and
October 2004 (an additional observing run with the Kitt Peak 4m Telescope was completely
lost to weather). We used the HET equipped with the Marcario Low Resolution Spectrograph
(LRS) to obtain low resolution spectroscopy of 22 cool white dwarf candidates. Grism
2 with a 1.5′′ slit produced spectra with a resolution of 6 A over the range 4280 – 7340
A. Spectroscopy for 56 additional stars was obtained at the MMT with the Blue Channel
Spectrograph and the 500 l/mm grating, which produced spectra with a resolution of 3.6
A over the range 3640 – 6800 A. In addition, we obtained spectroscopy for 89 stars at the
McDonald 2.7m Telescope with the Large Cassegrain Spectrograph (LCS) and TI1 camera
using grating No. 43 (600 l/mm), which produced spectra with a resolution of 5.2 A over the
range 3870 – 5260 A. In each case, a spectrophotometric standard star was observed each
night for flux calibration. Ne–Cd, He–Ar–Ne, and Ar calibration lamp exposures were taken
after each observation with the HET, the MMT, and the McDonald 2.7m, respectively. The
data were reduced using standard IRAF1 routines.
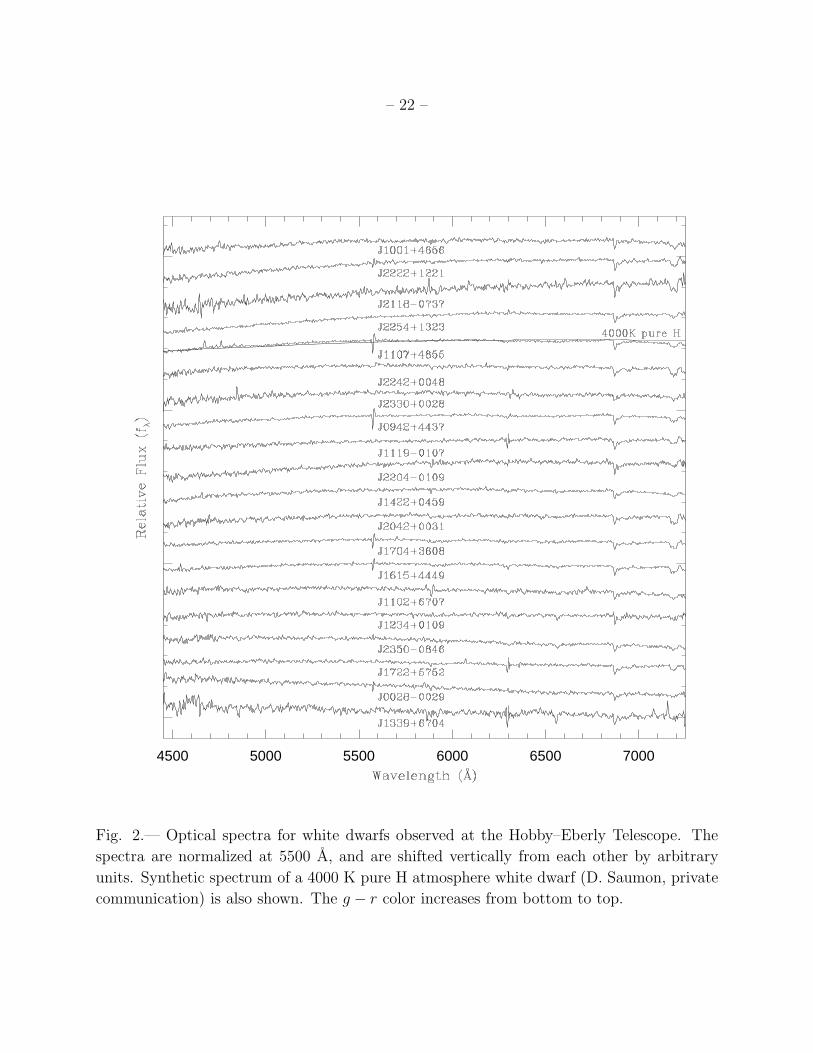
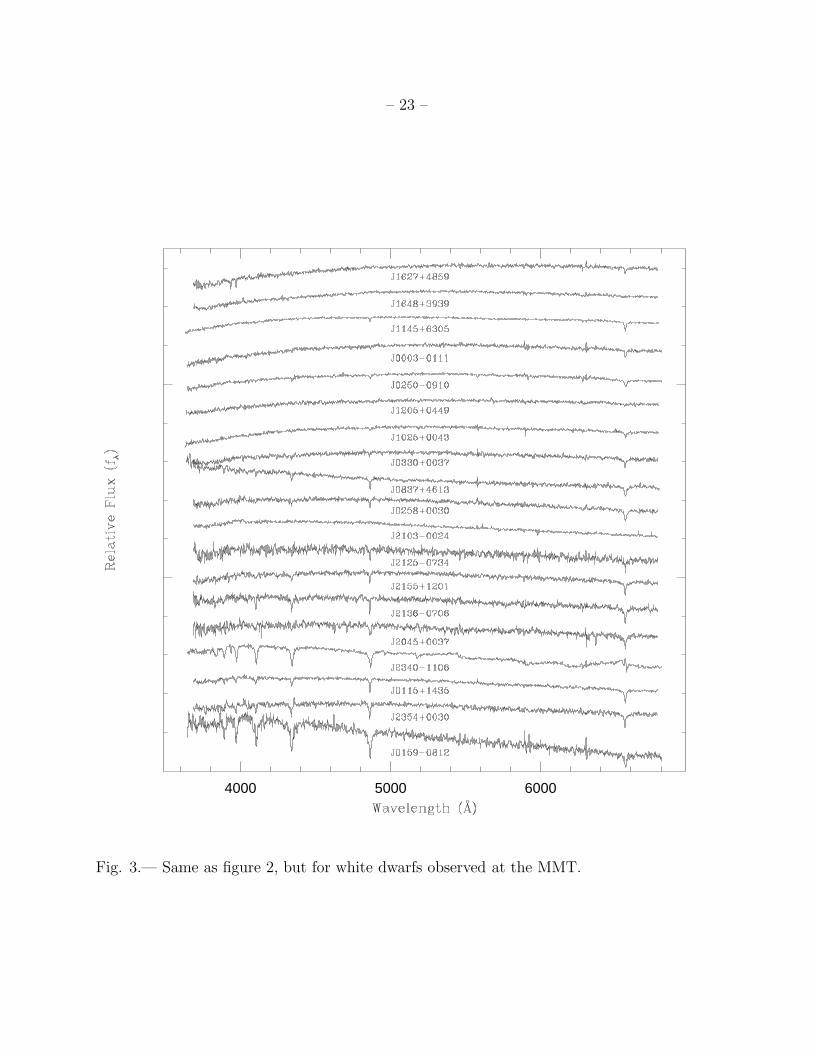
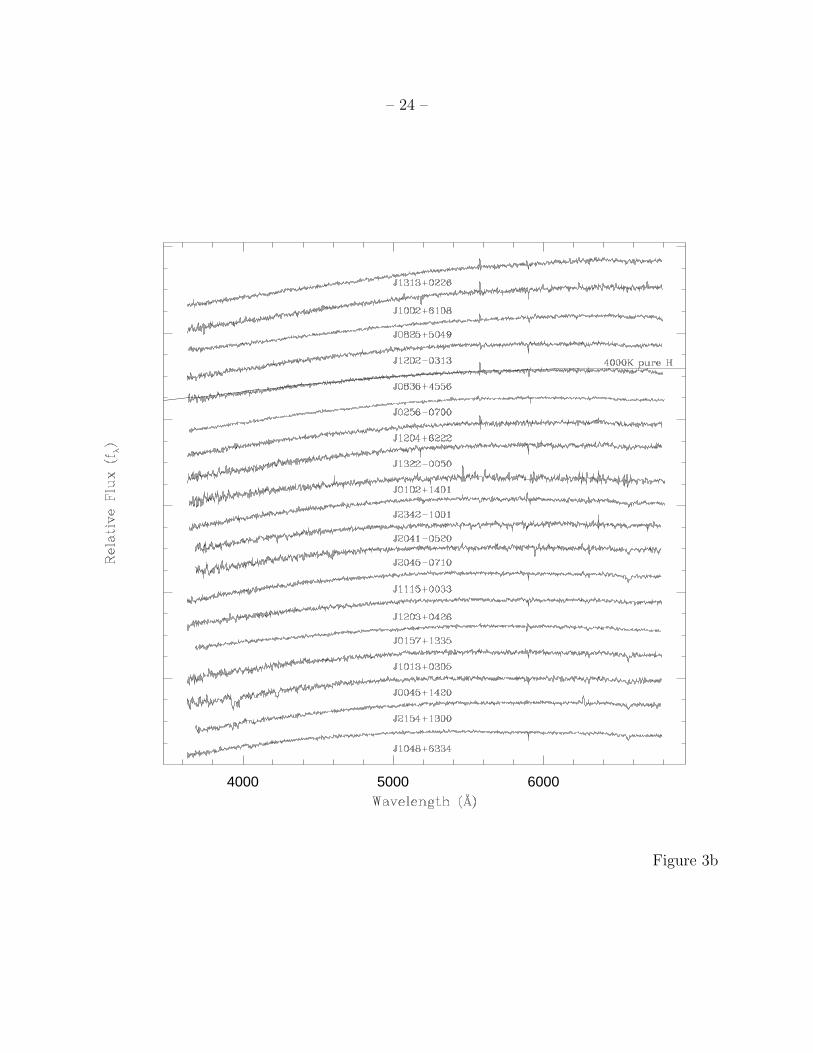
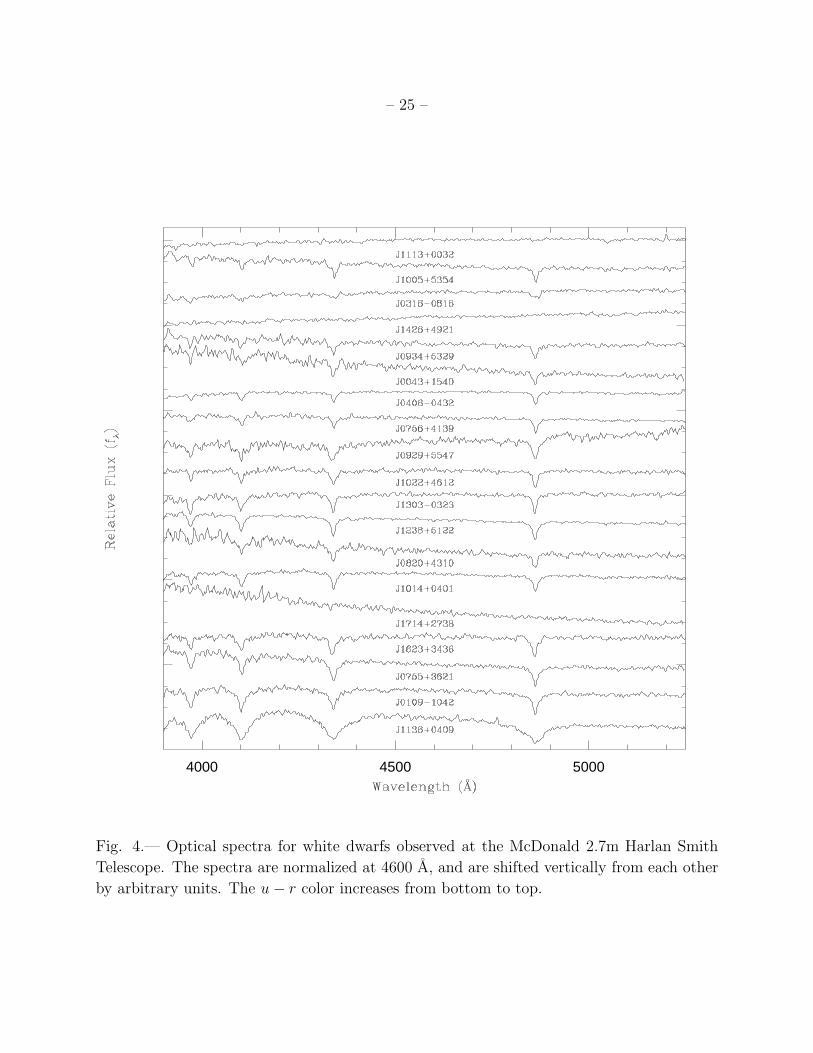
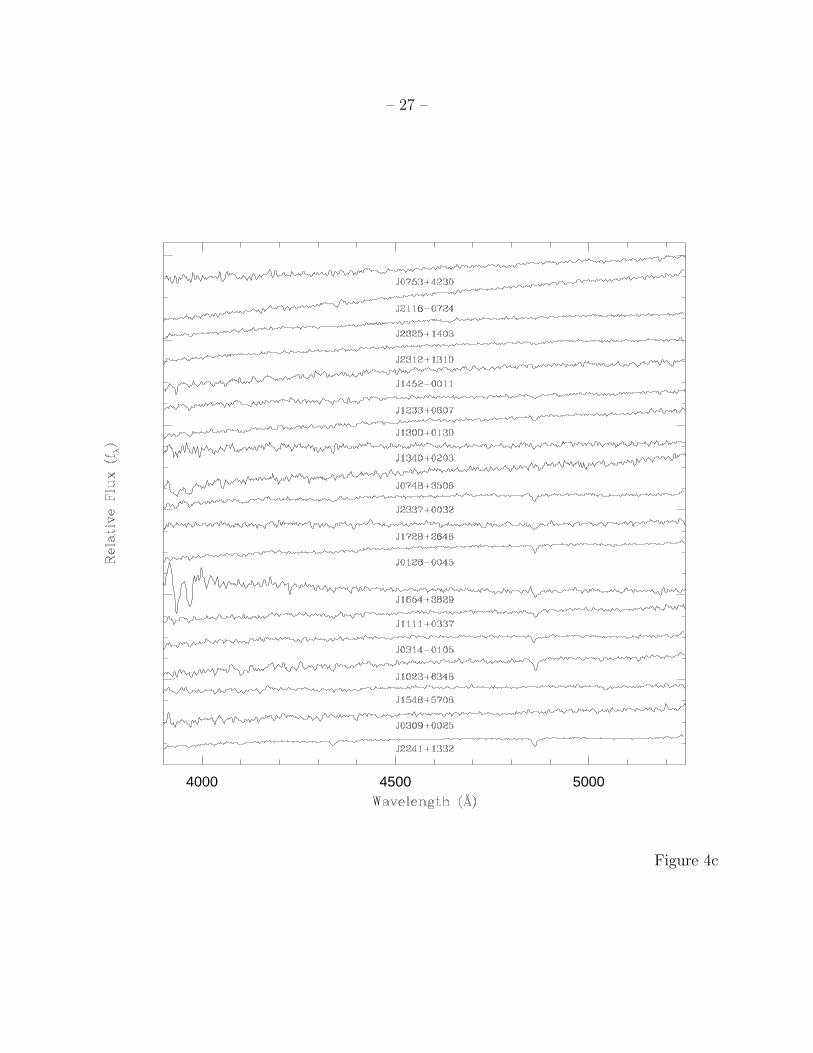
The spectra for all of the observed white dwarfs at the HET, the MMT, and the Mc-
Donald 2.7m are shown in Figures 2, 3, and 4, respectively. The spectra are ordered in
decreasing g − r color for Figures 2 and 3, and decreasing u − r color for Figure 4. The
majority of the objects observed at the HET and the MMT are featureless cool DC white
dwarfs. The only features seen in these spectra are due to sky subtraction problems at 5577,
5890/5896, 6300, and the atmospheric B band at 6890 A. Several white dwarfs show only a
1IRAF is distributed by the National Optical Astronomy Observatory, which is operated by the Associa-
tion of Universities for Research in Astronomy (AURA), Inc., under cooperative agreement with the National
Science Foundation.
– 6 –
weak Hα line and are DA white dwarfs with probable cool, H-rich atmospheres. Most of the
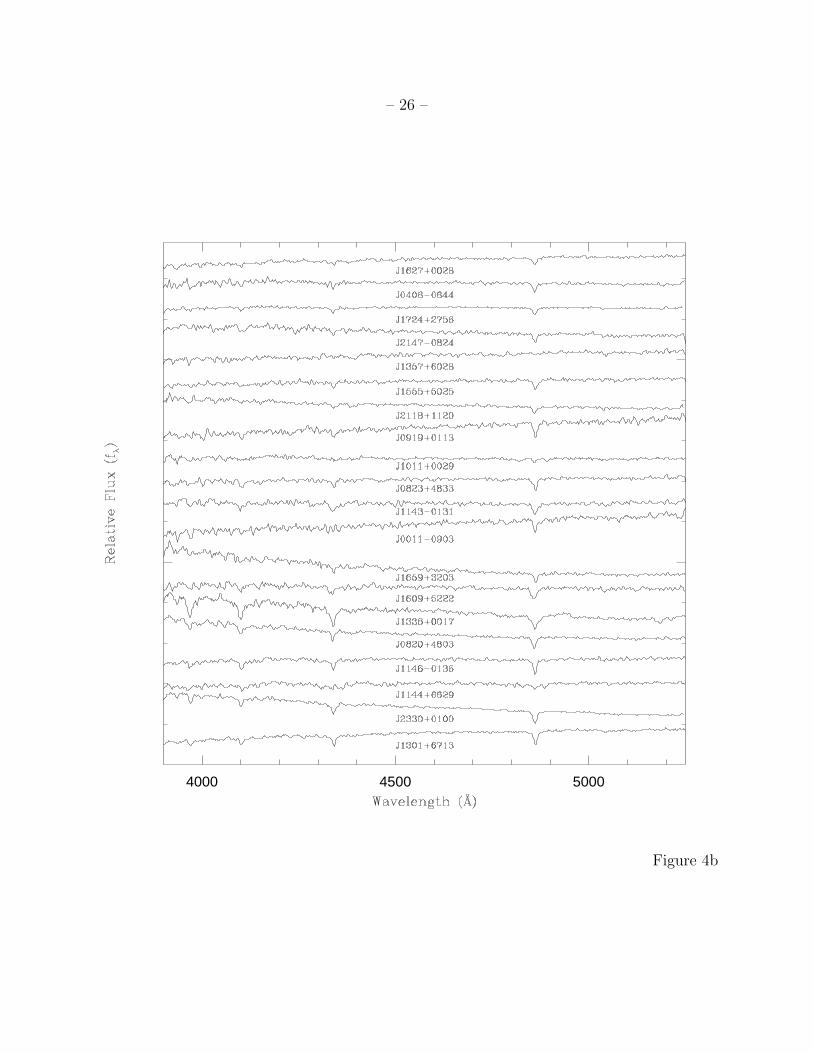
brighter objects observed at the McDonald 2.7m are DA white dwarfs. Three objects clearly
show additonal features due to late type star companions (J0929+5547, J1336+0017, J2340-
1106). Two objects observed at the 2.7m are magnetic DAs (J1011+0029, J1144+6629),
while two other objects observed at the 2.7m and an additional three objects observed at
the MMT are DZAs with detectable Ca II H and K lines and Balmer lines (J0045+1420,
J0748+3506, J1627+4859, J1654+3829, J2154+1300). We also note that four previously
known white dwarfs, namely SDSS J0109-1042 (LP707-8), J0755+3621 (WD0752+365),
J1025+0043 (LHS 282), and J1145+6305 (WD1143+633) were observed at the MMT and
the McDonald 2.7m, and are included in Figures 3 and 4.
The biggest difficulty in classifying the spectra is to distinguish DZ, DZA and DAZ
white dwarfs2 with refractory heavy elements from nondegenerate probable-main sequence
stars (subdwarf F, G, and K types) with low, scaled-solar heavy elements. Ca appears most
frequently in DZ, DAZ and DZA stars, followed by Mg, Fe and occasionally Na. The white
dwarfs apparently never show the CH band (4300 A) which is detected for sdG and cooler
stars (g− i > 0.4), and do not show MgH and CaH which appear in progressively-cooler sdK
stars.
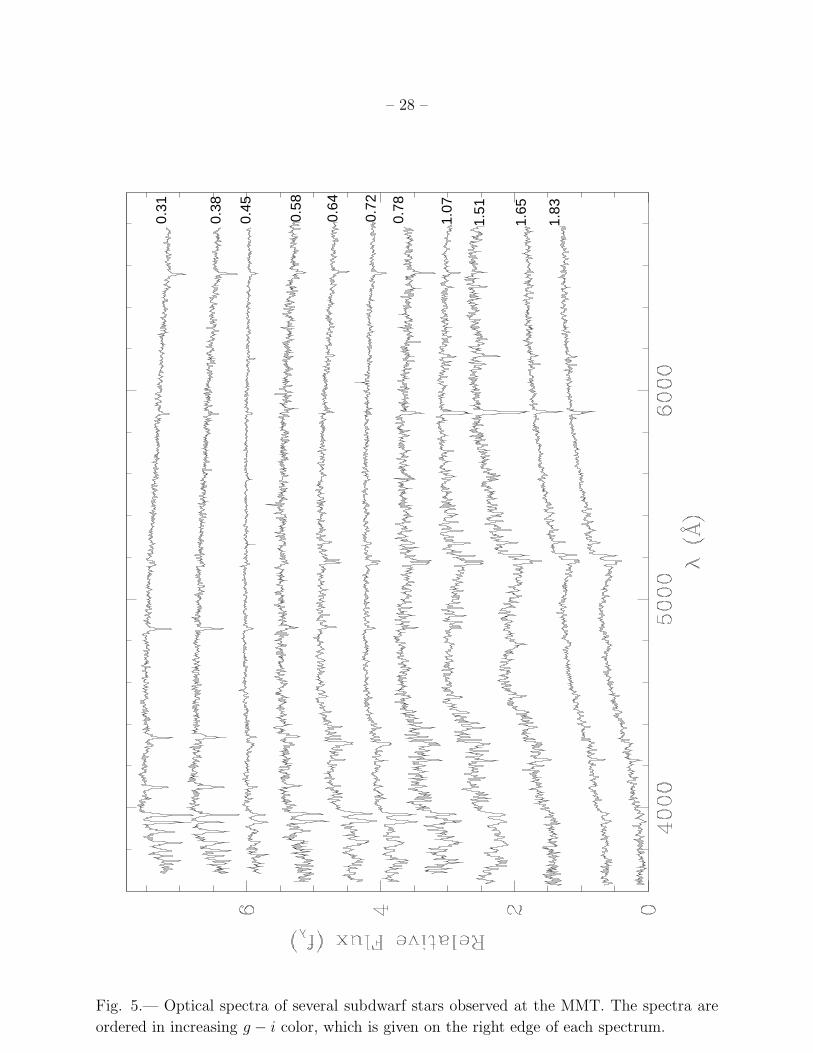
Figure 5 shows the spectra for several subdwarfs observed at the MMT. The spectra are
plotted in order of decreasing Teff , represented by increasing g − i color. This figure demon-
strates that subdwarfs have Ca II (hence need MMT and McDonald 2.7m blue coverage),
and usually many other metal features plus the CH molecular band. Additional MgH and
CaH bands can be seen among cooler subdwarfs (without enough blue coverage, HET was
mostly used to observe cool white dwarf candidates with similar colors to G and K type
subdwarfs). We paid close attention to the u − g and g − r colors of each star, comparing
colors of each candidate with white dwarf model colors to see if they were consistent with
the strengths of the H lines, and the degree to which cool DA Balmer decrements steepen
until for the coolest DA’s only Hα is seen.
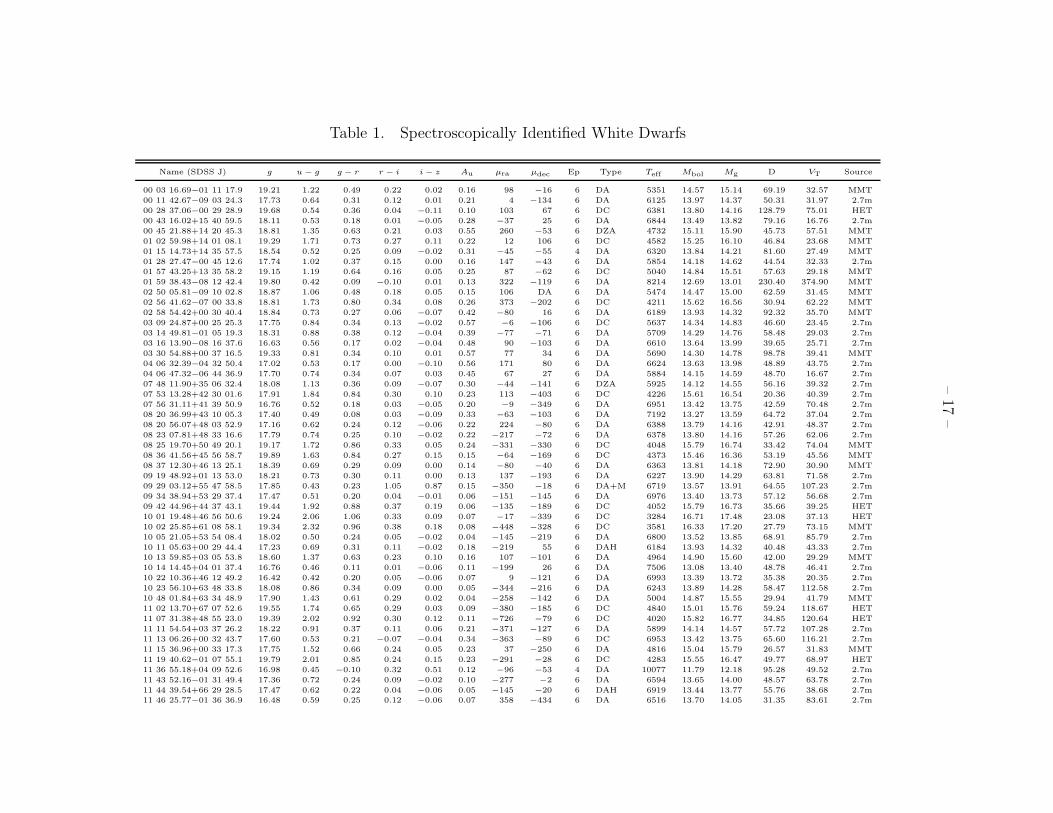
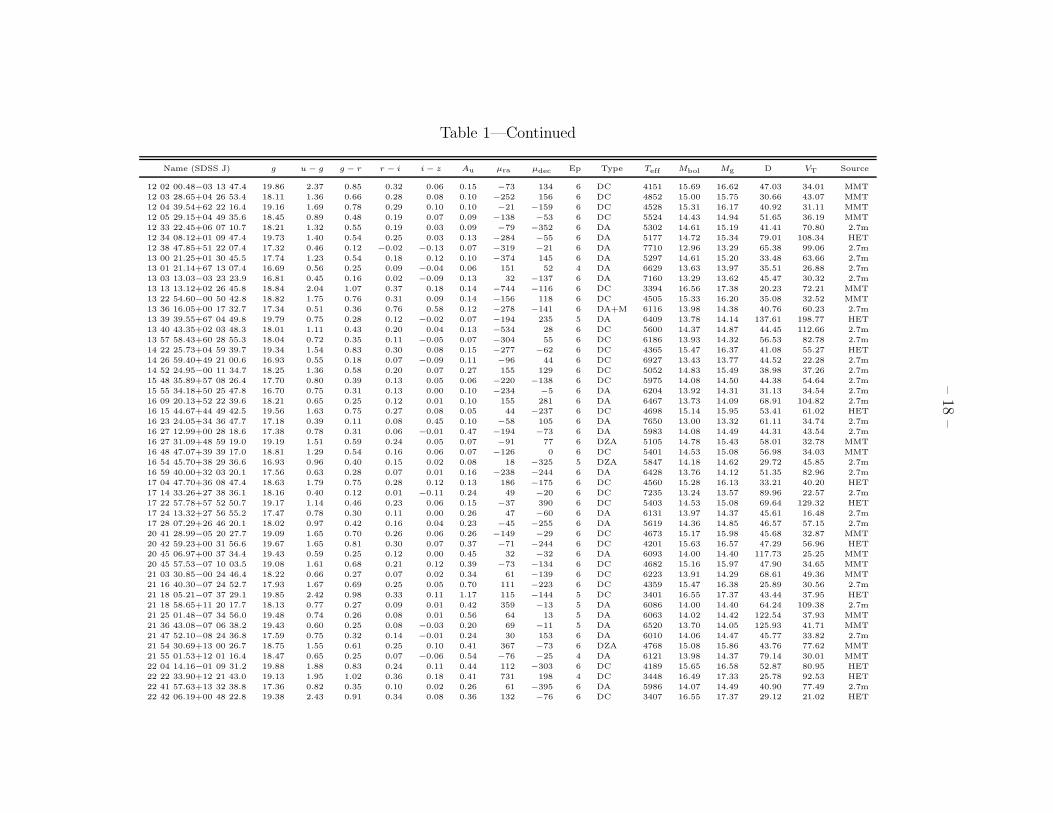
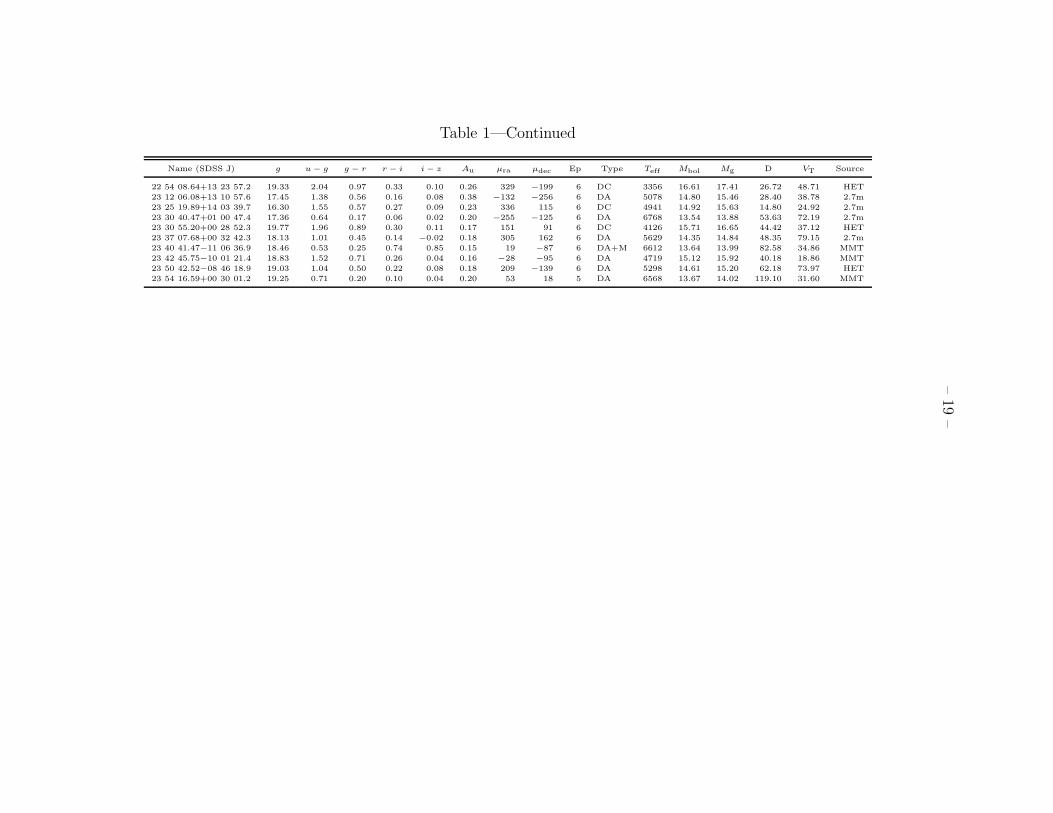
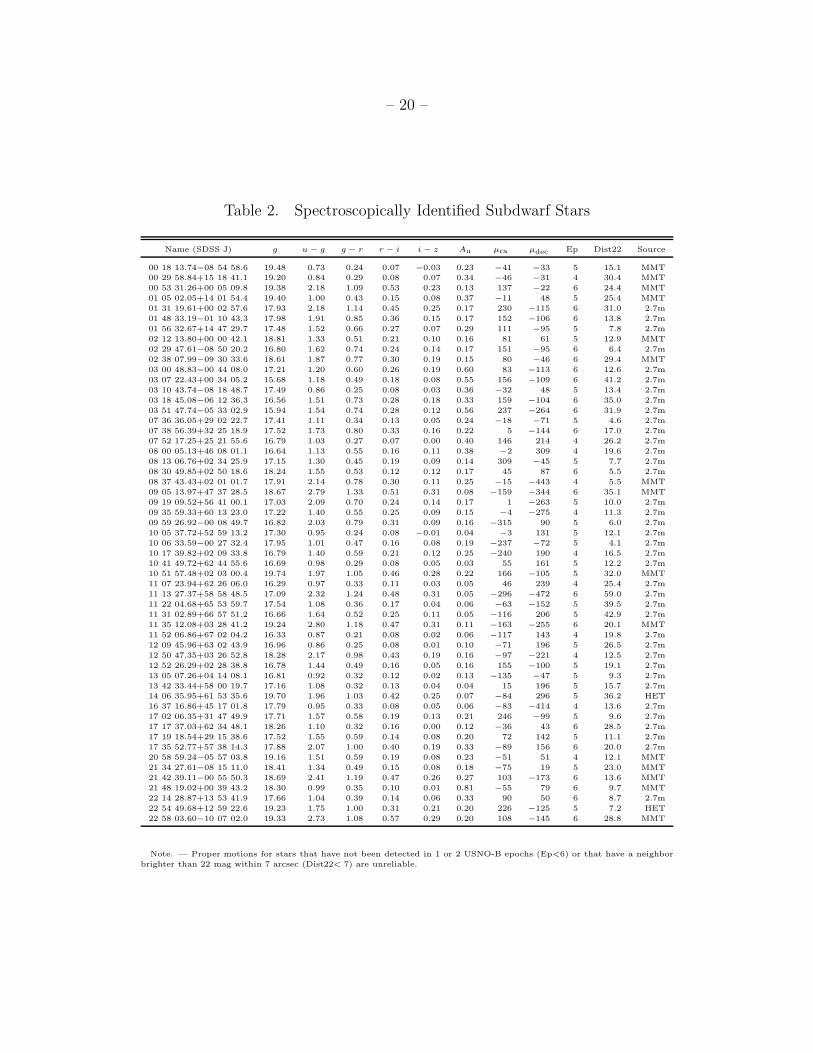
Our classifications and additional data for the 112 spectroscopically-confirmed white
dwarfs and 55 subdwarfs from this study are given in Tables 1 and 2, respectively. Positions
are those from the SDSS Astrometric pipeline (Pier et al. 2003). The photometric calibration
is based on the SDSS standard star system (Smith et al. 2002) tied to the survey data with
the Photometric Telescope (Hogg et al. 2001). Interstellar absorption Au from Schlegel,
Finkbeiner & Davis (1998), and fully dereddened magnitudes and colors are given for each
2Note that the difference between DAZ and DZA stars is whether the dominant atmospheric constituent
is hydrogen or helium, respectively. DZA stars show steep Balmer decrements at higher Teff than DAZ stars.
– 7 –
object. Tables 1 and 2 also give the proper motions in each component and the number of
epochs in which an object is detected. In addition, the effective temperatures, photometric
distances and the tangential velocities for the newly discovered cool white dwarfs (see §4.4)
are also given in Table 1.
A few stars in Table 1 were previously known as likely white dwarfs. The most certain
case is SDSS J131313.12+022645.8 (LHS2696) which has a (preliminary) parallax in Dahn
et al. (1989). There are 13 additional stars discovered in the NLTT catalog, (Luyten 1979),
most with Luyten color class a, f, or g, that would have been considered to be nearly certain
white dwarfs on the basis of the NLTT data alone; the spectra in this paper now confirm
these classifications. The one very cool white dwarf in Table 1 that is also in the NLTT
catalog is SDSS J075313.28+423001.6 (LP207-50). It has color class m in the NLTT, so
would not be considered as a white dwarf from the NLTT data alone. In addition, three
stars in Table 1 were identified from their proper motion by Lepine et al. (2003): SDSS
J100225.85+610858.1 (LSR 1002+6108), SDSS J110731.38+485523.0 (LSR 1107+4855), and
SDSS J222233.90+122143.0 (LSR 2222+1221). The first two were classified as probably
white dwarfs and the third as probably a subdwarf on the basis of their reduced proper
motion and photographic colors.
4. Results
4.1. Reduced Proper Motion Diagram
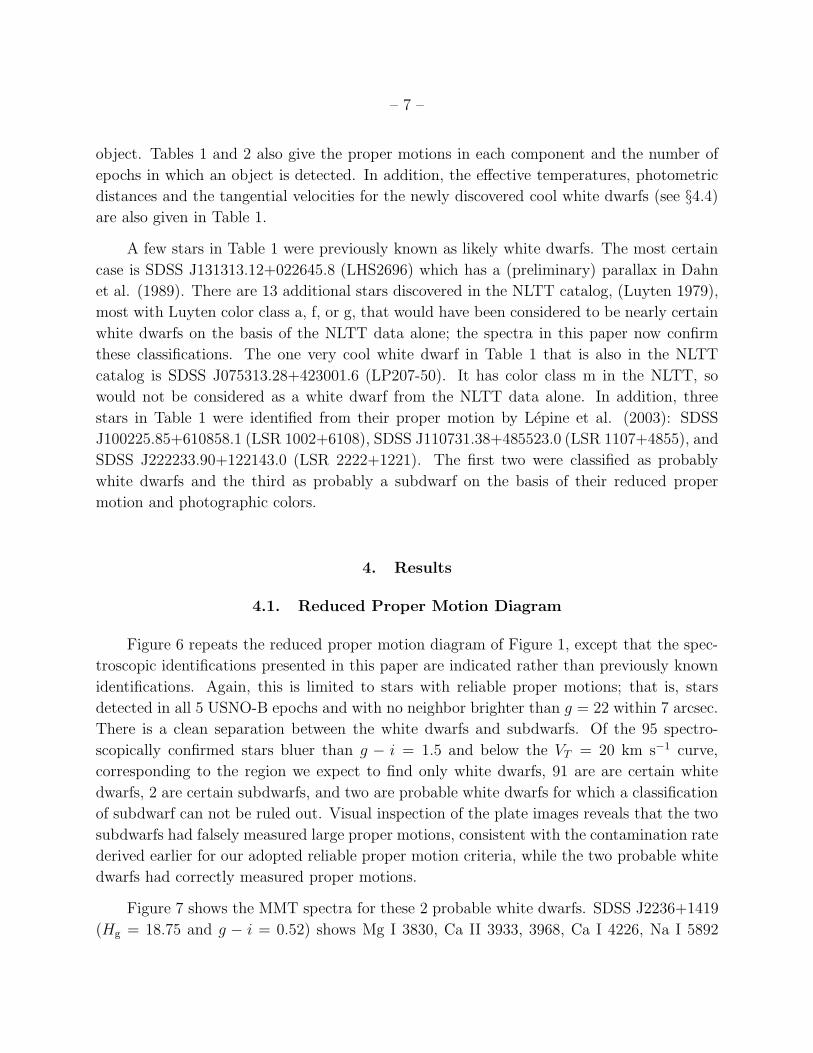
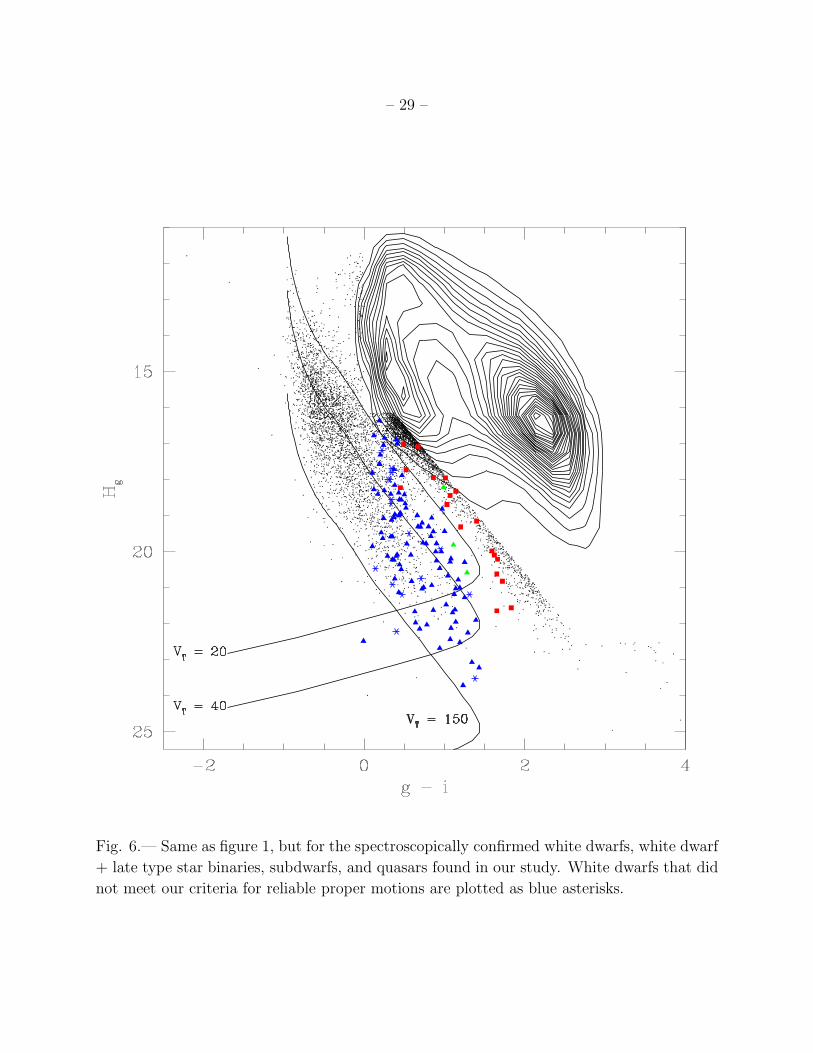
Figure 6 repeats the reduced proper motion diagram of Figure 1, except that the spec-
troscopic identifications presented in this paper are indicated rather than previously known
identifications. Again, this is limited to stars with reliable proper motions; that is, stars
detected in all 5 USNO-B epochs and with no neighbor brighter than g = 22 within 7 arcsec.
There is a clean separation between the white dwarfs and subdwarfs. Of the 95 spectro-
scopically confirmed stars bluer than g − i = 1.5 and below the VT = 20 km s−1 curve,
corresponding to the region we expect to find only white dwarfs, 91 are are certain white
dwarfs, 2 are certain subdwarfs, and two are probable white dwarfs for which a classification
of subdwarf can not be ruled out. Visual inspection of the plate images reveals that the two
subdwarfs had falsely measured large proper motions, consistent with the contamination rate
derived earlier for our adopted reliable proper motion criteria, while the two probable white
dwarfs had correctly measured proper motions.
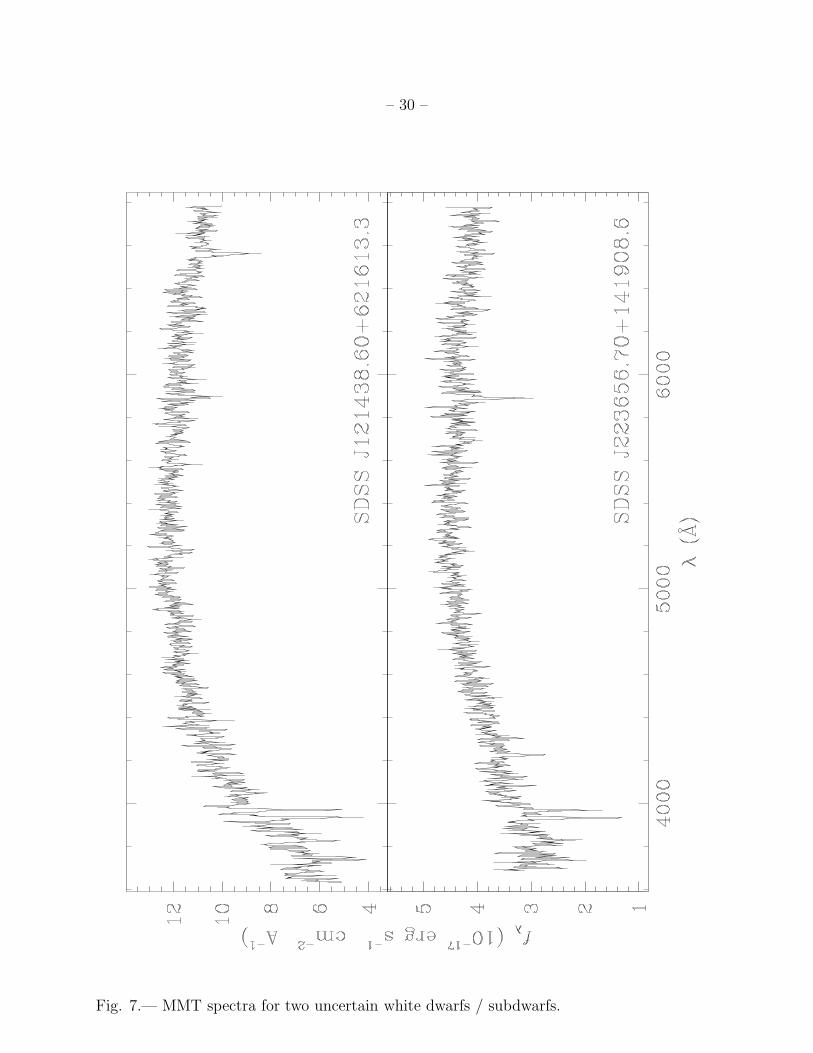
Figure 7 shows the MMT spectra for these 2 probable white dwarfs. SDSS J2236+1419
(Hg = 18.75 and g − i = 0.52) shows Mg I 3830, Ca II 3933, 3968, Ca I 4226, Na I 5892
– 8 –
and probable Mg I 5175 with no detectable Hα, Hβ, and CH band. The absent H and CH
features suggest a very non-Population II (scaled solar) metallicity DZ white dwarf. SDSS
J1214+6216 (Hg = 21.97 and g − i = 0.64) shows Mg I 3830, Ca II, no Ca I, no CH,
weak H-beta, possible Na I 5892, and rather strong H-alpha. The steep H decrement is
consistent with a cool white dwarf with pressure-broadening, quenching the higher Balmer
levels. Again, the absent CH is probably inconsistent with an sdG. We classify this object
as a probable DZA white dwarf, pending detailed analysis. Assuming that these two objects
are white dwarfs, we find no contamination from subdwarfs with correctly measured proper
motions. On the other hand, if we assume that these objects are in fact subdwarfs, they
would represent subdwarfs that truly have scattered into the cool white dwarf region of the
reduced proper motion diagram; there is still potential for some genuine contamination from
subdwarfs.
We also observed stars that did not meet our criteria for a reliable proper motion, having
either not been detected in 1 or 2 USNO-B epochs or having a neighbor within 7 arcsec.
Of these, 16 were white dwarfs (plotted as blue asterisks in Figure 6), all located within
the white dwarf region of the reduced proper motion diagram; upon visual inspection of the
plates used in USNO-B, all of the measured proper motions were correct. Another 37 were
subdwarfs (see Table 2), located both in the white dwarf and subdwarf regions of the reduced
proper motion diagram; visual inspection shows all but three of these to have incorrectly
measured proper motions, and the proper motions of the remaining three were too small to
determine their validity by eye.
The reduced proper motion diagram, using our conservative criteria for a reliable proper
motion, can thus be used to define a statistically complete sample of white dwarfs, including
the coolest white dwarfs which are difficult to efficiently select using other techniques. There
is a roughly 1.5% contamination rate of incorrectly measured proper motions. There is
likely no contamination due to subdwarfs with correctly measured proper motions, though
contamination of a few percent is still possible. True white dwarfs that fail to meet the proper
motion criteria must be accounted for, either statistically or by using visual inspection to
verify proper motions for all candidates. This result is used in Harris et al. (2005) to
construct the white dwarf luminosity function using the SDSS Data Release 3 imaging and
USNO-B astrometry.
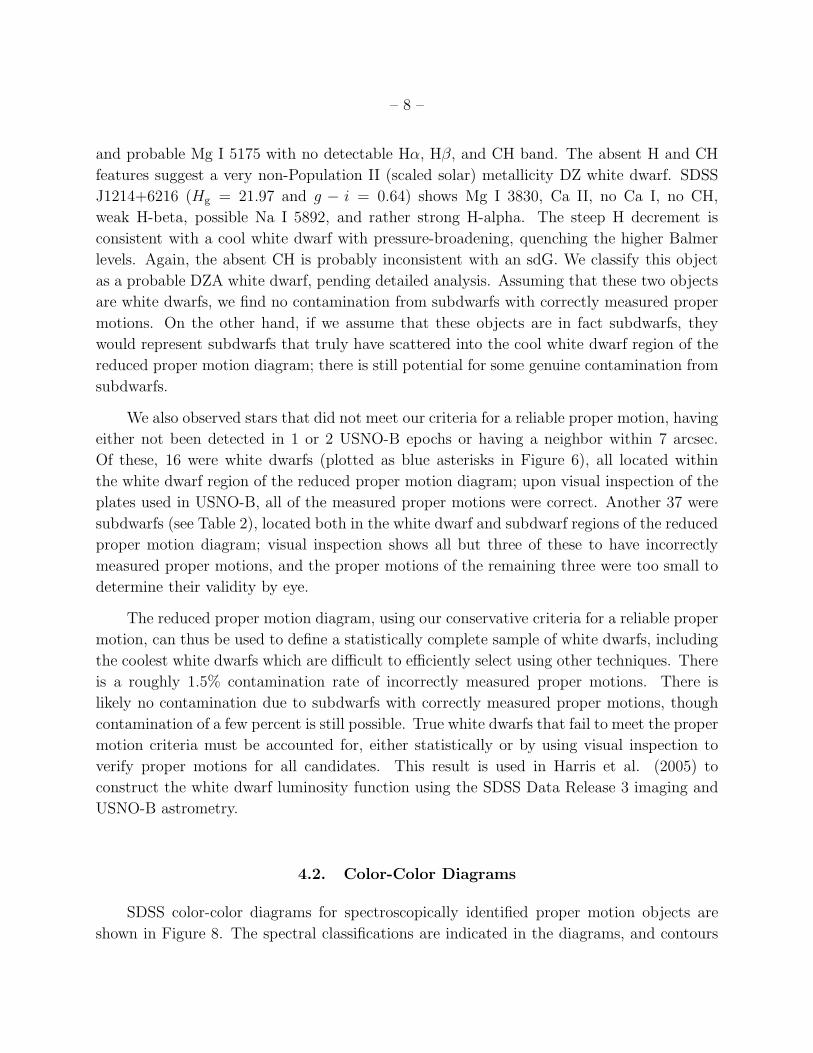
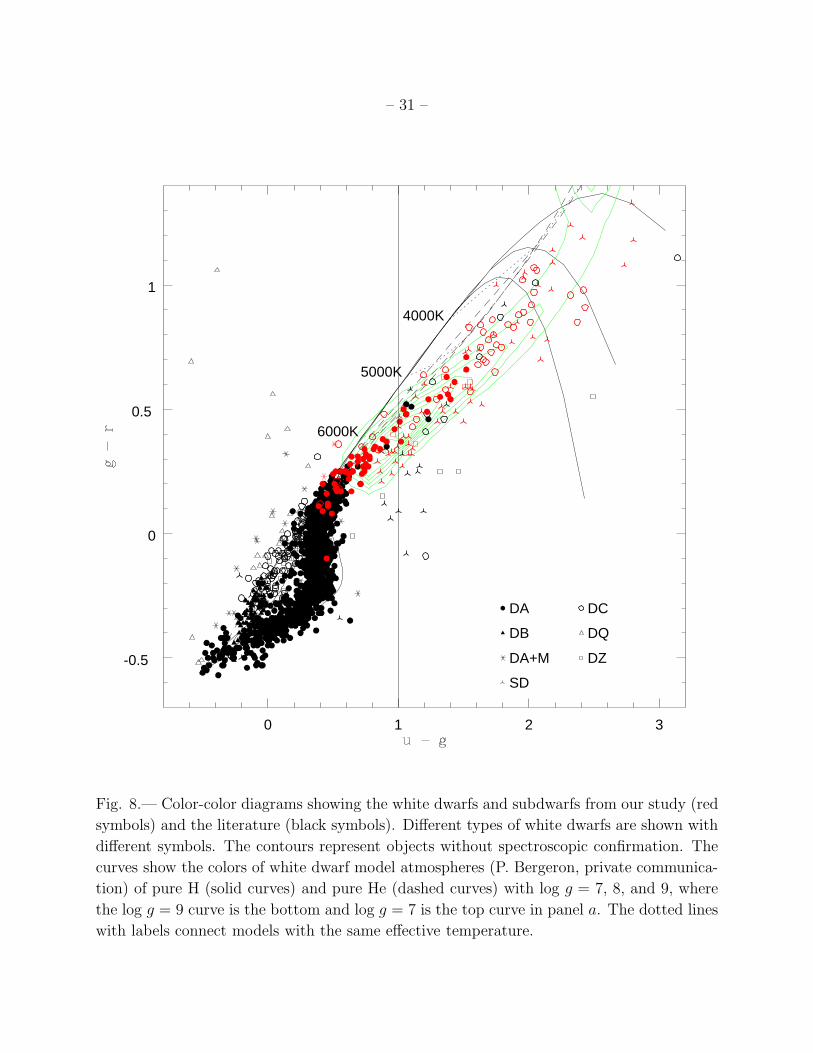
4.2. Color-Color Diagrams
SDSS color-color diagrams for spectroscopically identified proper motion objects are
shown in Figure 8. The spectral classifications are indicated in the diagrams, and contours
– 9 –
that show the colors of nondegenerate stars in the SDSS are included for comparison. The
curves show the colors of white dwarf model atmospheres of pure H (solid curves) and pure
He (dashed curves) composition with log g = 7, 8, and 9, kindly made available to us by P.
Bergeron.
Harris et al. (2003) showed that the sequence of white dwarfs hotter than 12,000 K is
contaminated only by hot subdwarfs. Our u− g vs. g − r color-color diagram demonstrates
that white dwarfs and subdwarfs selected from the reduced proper motion diagram separate
from each other for u − g ≤ 1.0, though this result depends on a handful of white dwarfs
observed between the range 0.6 ≤ u−g ≤ 1.0 and further observations are needed to confirm
this result.
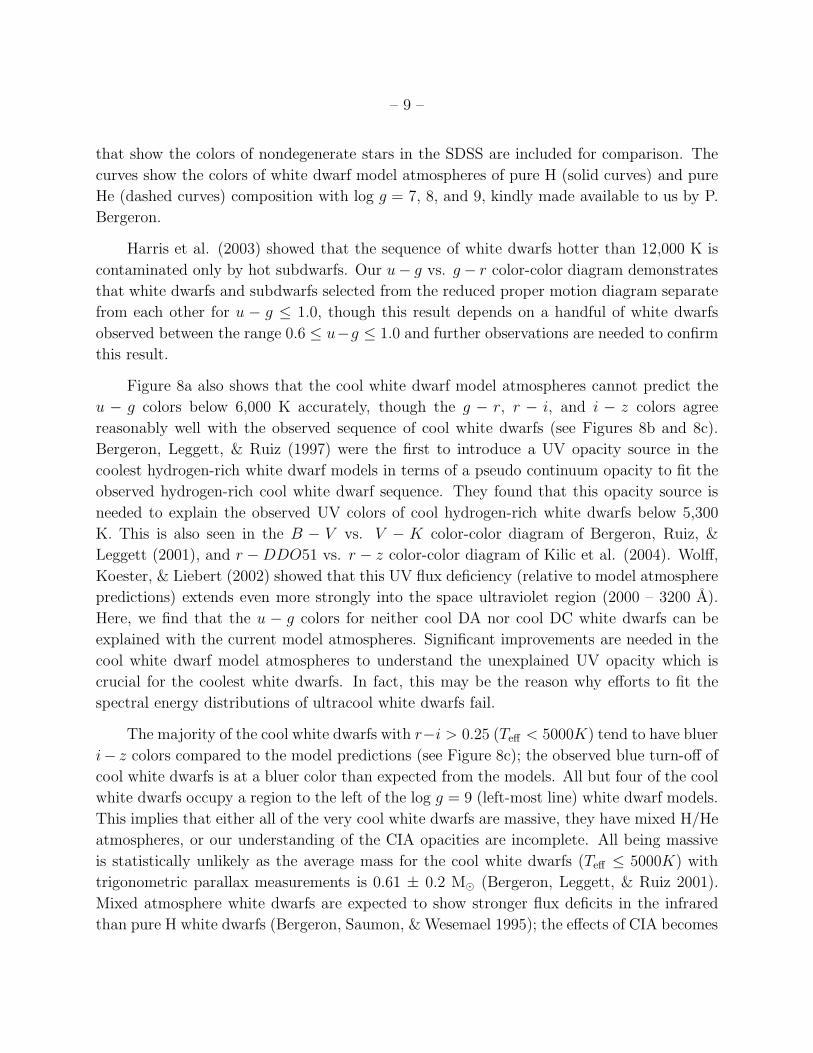
Figure 8a also shows that the cool white dwarf model atmospheres cannot predict the
u − g colors below 6,000 K accurately, though the g − r, r − i, and i − z colors agree
reasonably well with the observed sequence of cool white dwarfs (see Figures 8b and 8c).
Bergeron, Leggett, & Ruiz (1997) were the first to introduce a UV opacity source in the
coolest hydrogen-rich white dwarf models in terms of a pseudo continuum opacity to fit the
observed hydrogen-rich cool white dwarf sequence. They found that this opacity source is
needed to explain the observed UV colors of cool hydrogen-rich white dwarfs below 5,300
K. This is also seen in the B − V vs. V − K color-color diagram of Bergeron, Ruiz, &
Leggett (2001), and r − DDO51 vs. r − z color-color diagram of Kilic et al. (2004). Wolff,
Koester, & Liebert (2002) showed that this UV flux deficiency (relative to model atmosphere
predictions) extends even more strongly into the space ultraviolet region (2000 – 3200 A).
Here, we find that the u − g colors for neither cool DA nor cool DC white dwarfs can be
explained with the current model atmospheres. Significant improvements are needed in the
cool white dwarf model atmospheres to understand the unexplained UV opacity which is
crucial for the coolest white dwarfs. In fact, this may be the reason why efforts to fit the
spectral energy distributions of ultracool white dwarfs fail.
The majority of the cool white dwarfs with r−i > 0.25 (Teff < 5000K) tend to have bluer
i− z colors compared to the model predictions (see Figure 8c); the observed blue turn-off of
cool white dwarfs is at a bluer color than expected from the models. All but four of the cool
white dwarfs occupy a region to the left of the log g = 9 (left-most line) white dwarf models.
This implies that either all of the very cool white dwarfs are massive, they have mixed H/He
atmospheres, or our understanding of the CIA opacities are incomplete. All being massive
is statistically unlikely as the average mass for the cool white dwarfs (Teff ≤ 5000K) with
trigonometric parallax measurements is 0.61 ± 0.2 M⊙ (Bergeron, Leggett, & Ruiz 2001).
Mixed atmosphere white dwarfs are expected to show stronger flux deficits in the infrared
than pure H white dwarfs (Bergeron, Saumon, & Wesemael 1995); the effects of CIA becomes
– 10 –
significant at warmer temperatures, which could explain the observed blue turn-off of cool
white dwarfs in Figure 8c. Bergeron & Leggett (2002) argued that all white dwarfs cooler
than 4000 K have mixed H/He atmospheres. In addition, Kilic et al. (2004) suggested that
all white dwarfs cooler than 5000 K may have mixed atmospheres. Therefore, this figure
presents further evidence that the coolest white dwarfs indeed have helium rich atmospheres.
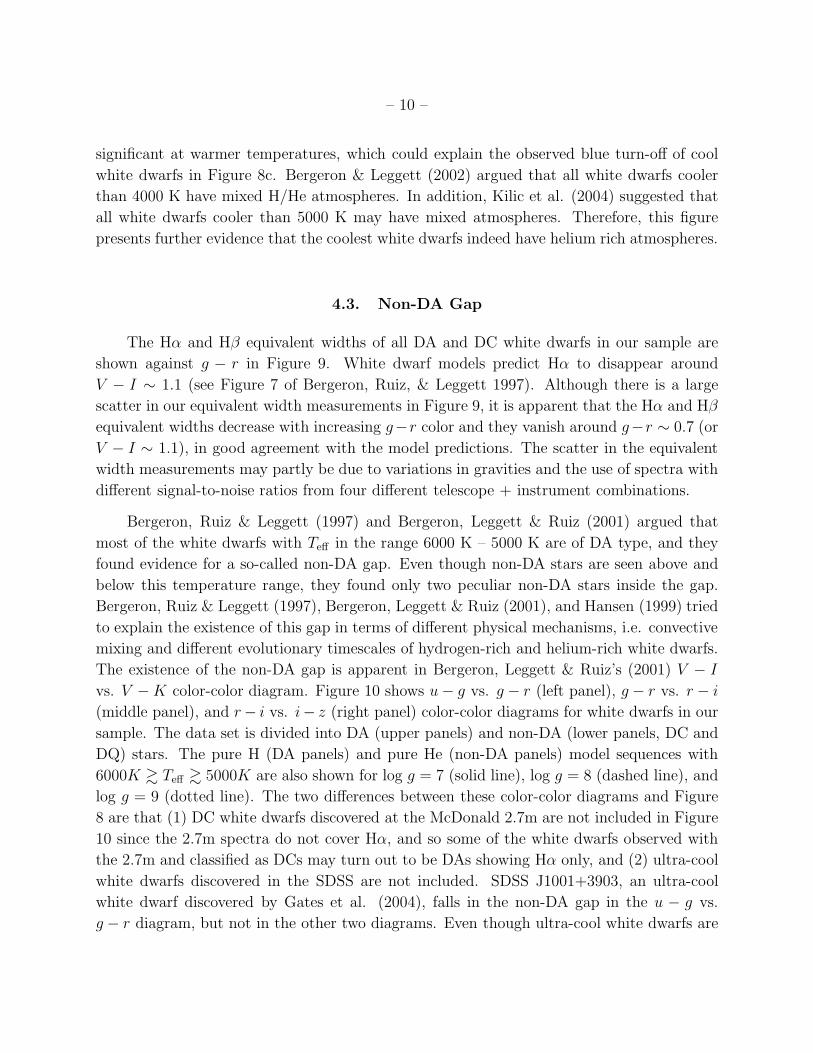
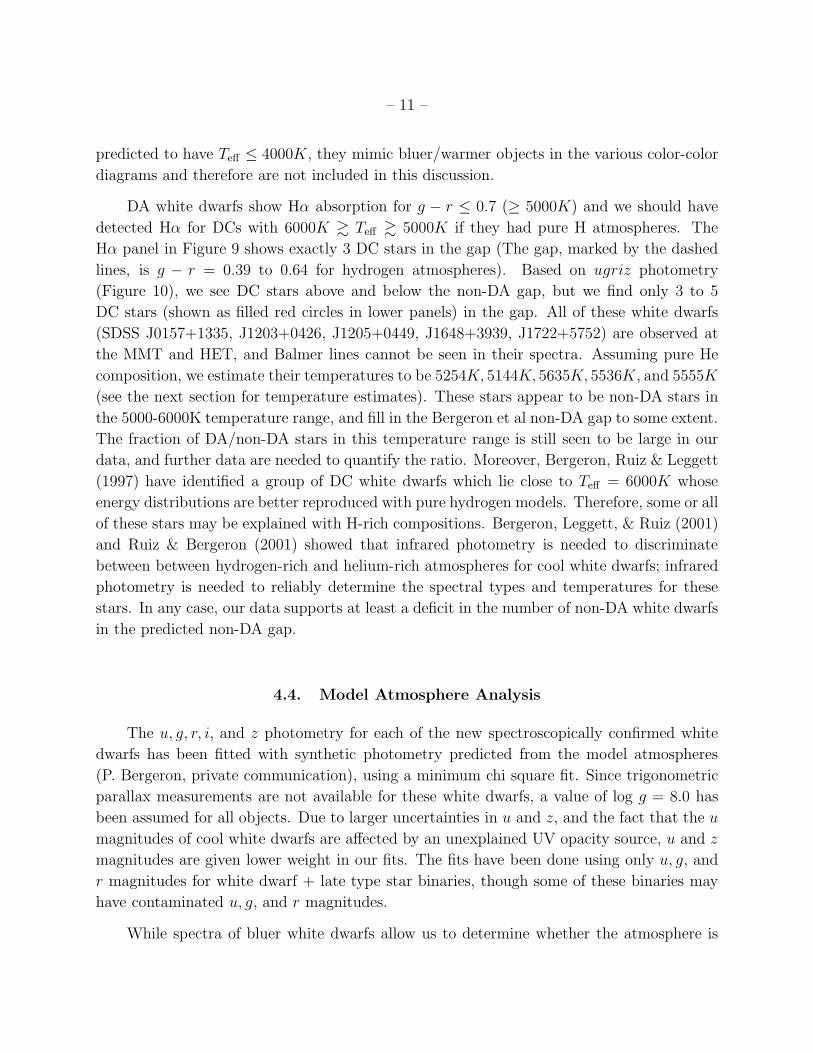
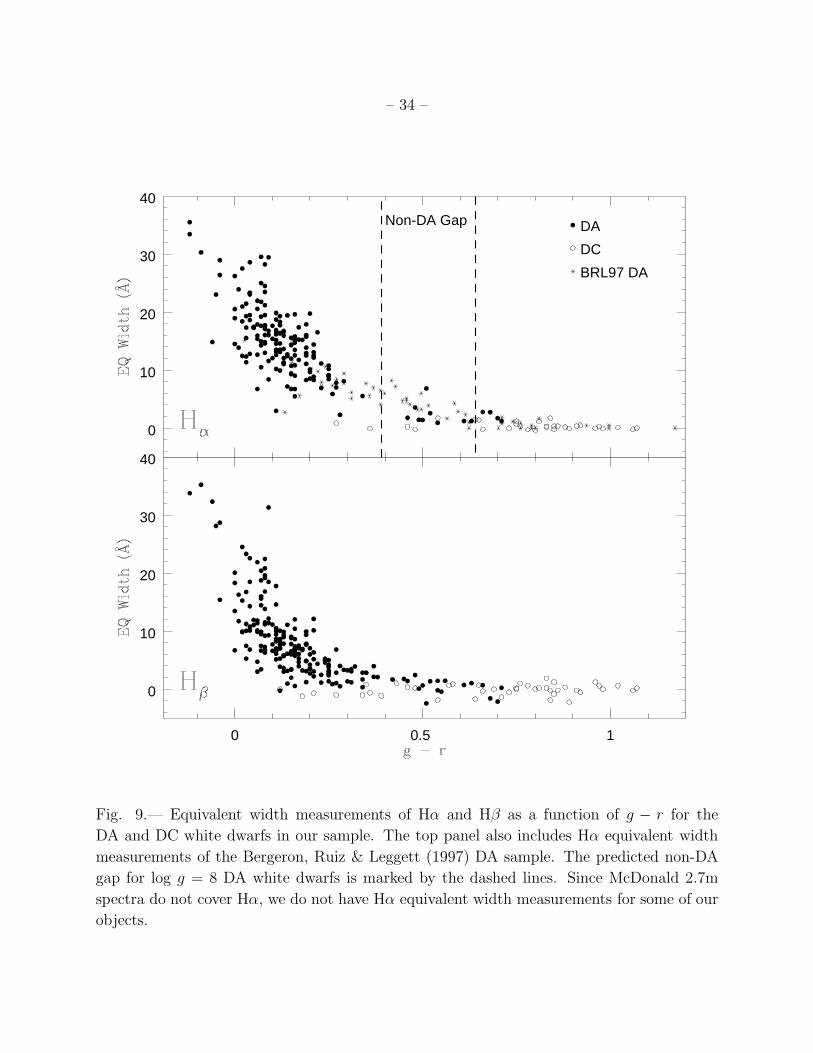
4.3. Non-DA Gap
The Hα and Hβ equivalent widths of all DA and DC white dwarfs in our sample are
shown against g − r in Figure 9. White dwarf models predict Hα to disappear around
V − I ∼ 1.1 (see Figure 7 of Bergeron, Ruiz, & Leggett 1997). Although there is a large
scatter in our equivalent width measurements in Figure 9, it is apparent that the Hα and Hβ
equivalent widths decrease with increasing g−r color and they vanish around g−r ∼ 0.7 (or
V − I ∼ 1.1), in good agreement with the model predictions. The scatter in the equivalent
width measurements may partly be due to variations in gravities and the use of spectra with
different signal-to-noise ratios from four different telescope + instrument combinations.
Bergeron, Ruiz & Leggett (1997) and Bergeron, Leggett & Ruiz (2001) argued that
most of the white dwarfs with Teff in the range 6000 K – 5000 K are of DA type, and they
found evidence for a so-called non-DA gap. Even though non-DA stars are seen above and
below this temperature range, they found only two peculiar non-DA stars inside the gap.
Bergeron, Ruiz & Leggett (1997), Bergeron, Leggett & Ruiz (2001), and Hansen (1999) tried
to explain the existence of this gap in terms of different physical mechanisms, i.e. convective
mixing and different evolutionary timescales of hydrogen-rich and helium-rich white dwarfs.
The existence of the non-DA gap is apparent in Bergeron, Leggett & Ruiz’s (2001) V − I
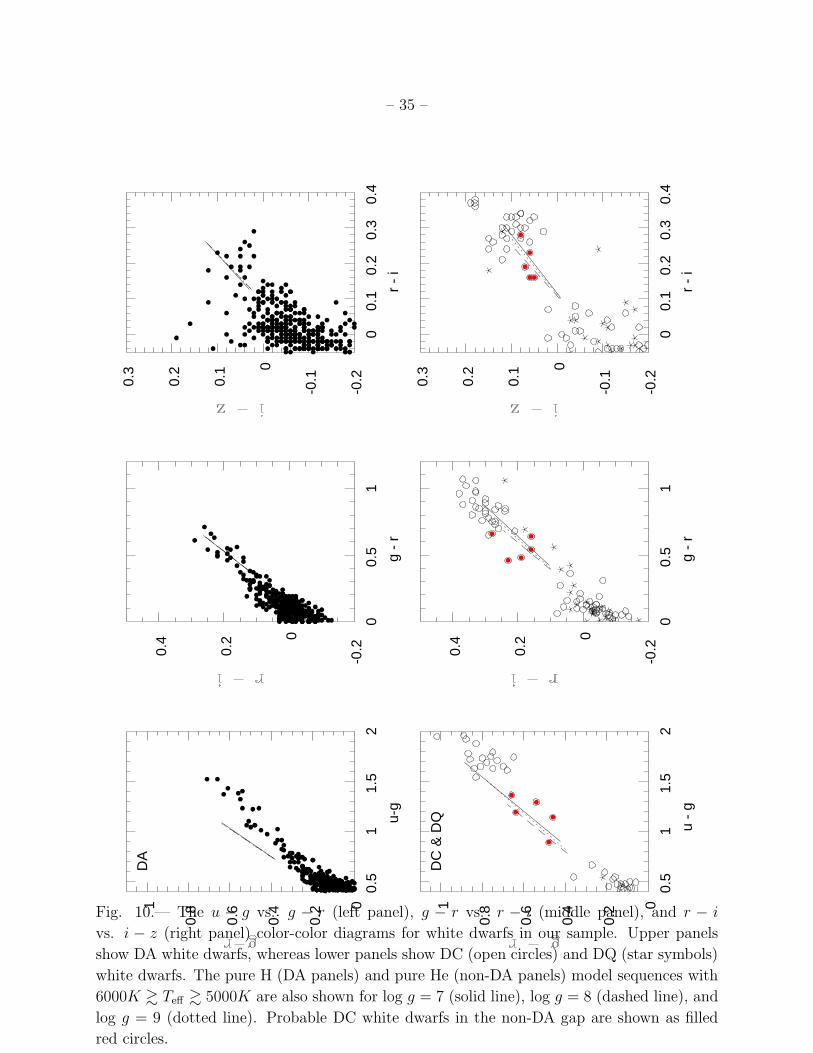
vs. V − K color-color diagram. Figure 10 shows u − g vs. g − r (left panel), g − r vs. r − i
(middle panel), and r− i vs. i− z (right panel) color-color diagrams for white dwarfs in our
sample. The data set is divided into DA (upper panels) and non-DA (lower panels, DC and
DQ) stars. The pure H (DA panels) and pure He (non-DA panels) model sequences with
6000K & Teff & 5000K are also shown for log g = 7 (solid line), log g = 8 (dashed line), and
log g = 9 (dotted line). The two differences between these color-color diagrams and Figure
8 are that (1) DC white dwarfs discovered at the McDonald 2.7m are not included in Figure
10 since the 2.7m spectra do not cover Hα, and so some of the white dwarfs observed with
the 2.7m and classified as DCs may turn out to be DAs showing Hα only, and (2) ultra-cool
white dwarfs discovered in the SDSS are not included. SDSS J1001+3903, an ultra-cool
white dwarf discovered by Gates et al. (2004), falls in the non-DA gap in the u − g vs.
g − r diagram, but not in the other two diagrams. Even though ultra-cool white dwarfs are
– 11 –
predicted to have Teff ≤ 4000K, they mimic bluer/warmer objects in the various color-color
diagrams and therefore are not included in this discussion.
DA white dwarfs show Hα absorption for g − r ≤ 0.7 (≥ 5000K) and we should have
detected Hα for DCs with 6000K & Teff & 5000K if they had pure H atmospheres. The
Hα panel in Figure 9 shows exactly 3 DC stars in the gap (The gap, marked by the dashed
lines, is g − r = 0.39 to 0.64 for hydrogen atmospheres). Based on ugriz photometry
(Figure 10), we see DC stars above and below the non-DA gap, but we find only 3 to 5
DC stars (shown as filled red circles in lower panels) in the gap. All of these white dwarfs
(SDSS J0157+1335, J1203+0426, J1205+0449, J1648+3939, J1722+5752) are observed at
the MMT and HET, and Balmer lines cannot be seen in their spectra. Assuming pure He
composition, we estimate their temperatures to be 5254K, 5144K, 5635K, 5536K, and 5555K
(see the next section for temperature estimates). These stars appear to be non-DA stars in
the 5000-6000K temperature range, and fill in the Bergeron et al non-DA gap to some extent.
The fraction of DA/non-DA stars in this temperature range is still seen to be large in our
data, and further data are needed to quantify the ratio. Moreover, Bergeron, Ruiz & Leggett
(1997) have identified a group of DC white dwarfs which lie close to Teff = 6000K whose
energy distributions are better reproduced with pure hydrogen models. Therefore, some or all
of these stars may be explained with H-rich compositions. Bergeron, Leggett, & Ruiz (2001)
and Ruiz & Bergeron (2001) showed that infrared photometry is needed to discriminate
between between hydrogen-rich and helium-rich atmospheres for cool white dwarfs; infrared
photometry is needed to reliably determine the spectral types and temperatures for these
stars. In any case, our data supports at least a deficit in the number of non-DA white dwarfs
in the predicted non-DA gap.
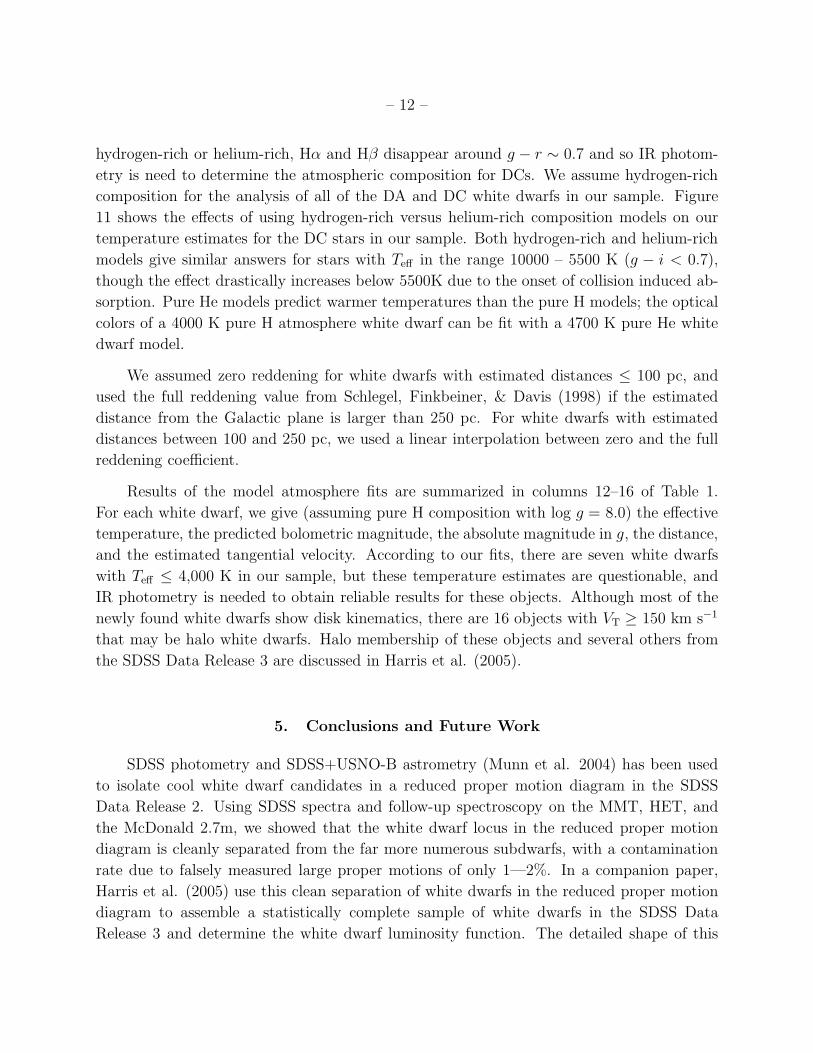
4.4. Model Atmosphere Analysis
The u, g, r, i, and z photometry for each of the new spectroscopically confirmed white
dwarfs has been fitted with synthetic photometry predicted from the model atmospheres
(P. Bergeron, private communication), using a minimum chi square fit. Since trigonometric
parallax measurements are not available for these white dwarfs, a value of log g = 8.0 has
been assumed for all objects. Due to larger uncertainties in u and z, and the fact that the u
magnitudes of cool white dwarfs are affected by an unexplained UV opacity source, u and z
magnitudes are given lower weight in our fits. The fits have been done using only u, g, and
r magnitudes for white dwarf + late type star binaries, though some of these binaries may
have contaminated u, g, and r magnitudes.
While spectra of bluer white dwarfs allow us to determine whether the atmosphere is
– 12 –
hydrogen-rich or helium-rich, Hα and Hβ disappear around g − r ∼ 0.7 and so IR photom-
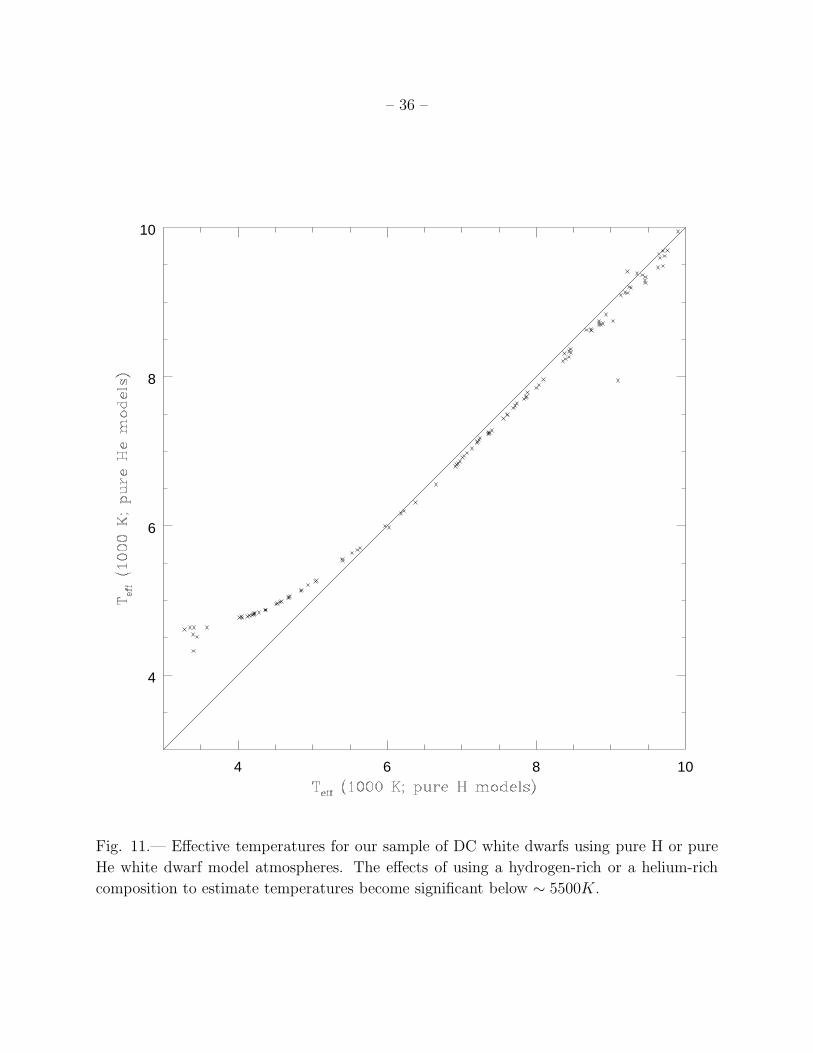
etry is need to determine the atmospheric composition for DCs. We assume hydrogen-rich
composition for the analysis of all of the DA and DC white dwarfs in our sample. Figure
11 shows the effects of using hydrogen-rich versus helium-rich composition models on our
temperature estimates for the DC stars in our sample. Both hydrogen-rich and helium-rich
models give similar answers for stars with Teff in the range 10000 – 5500 K (g − i < 0.7),
though the effect drastically increases below 5500K due to the onset of collision induced ab-
sorption. Pure He models predict warmer temperatures than the pure H models; the optical
colors of a 4000 K pure H atmosphere white dwarf can be fit with a 4700 K pure He white
dwarf model.
We assumed zero reddening for white dwarfs with estimated distances ≤ 100 pc, and
used the full reddening value from Schlegel, Finkbeiner, & Davis (1998) if the estimated
distance from the Galactic plane is larger than 250 pc. For white dwarfs with estimated
distances between 100 and 250 pc, we used a linear interpolation between zero and the full
reddening coefficient.
Results of the model atmosphere fits are summarized in columns 12–16 of Table 1.
For each white dwarf, we give (assuming pure H composition with log g = 8.0) the effective
temperature, the predicted bolometric magnitude, the absolute magnitude in g, the distance,
and the estimated tangential velocity. According to our fits, there are seven white dwarfs
with Teff ≤ 4,000 K in our sample, but these temperature estimates are questionable, and
IR photometry is needed to obtain reliable results for these objects. Although most of the
newly found white dwarfs show disk kinematics, there are 16 objects with VT ≥ 150 km s−1
that may be halo white dwarfs. Halo membership of these objects and several others from
the SDSS Data Release 3 are discussed in Harris et al. (2005).
5. Conclusions and Future Work
SDSS photometry and SDSS+USNO-B astrometry (Munn et al. 2004) has been used
to isolate cool white dwarf candidates in a reduced proper motion diagram in the SDSS
Data Release 2. Using SDSS spectra and follow-up spectroscopy on the MMT, HET, and
the McDonald 2.7m, we showed that the white dwarf locus in the reduced proper motion
diagram is cleanly separated from the far more numerous subdwarfs, with a contamination
rate due to falsely measured large proper motions of only 1—2%. In a companion paper,
Harris et al. (2005) use this clean separation of white dwarfs in the reduced proper motion
diagram to assemble a statistically complete sample of white dwarfs in the SDSS Data
Release 3 and determine the white dwarf luminosity function. The detailed shape of this
– 13 –
new luminosity function will eventually make it possible to study the cooling physics of white
dwarfs in detail, e.g. neutrino cooling, crystallization, and phase separation. These effects
produce overlapping signatures (bumps) in the white dwarf luminosity function which can
be used to calibrate their significance. The details of these constituent input physics can
affect the implied ages of cool white dwarfs below log (L/L⊙)∼ −4.2 by as much as 2-3 Gyr
(Hawkins & Hambly 1999; Montgomery et al. 1999; Salaris et al. 2000).
All of the ultracool white dwarfs discovered in SDSS (Harris et al. 2001; Gates et
al. 2004) show significant proper motion, hence they would be discovered in our proper
motion survey if not targeted by SDSS fiber spectroscopy. We have discovered seven new
cool white dwarfs with estimated temperatures below 4000 K. Nevertheless, these objects
may have temperatures above 4000 K if they have pure He atmospheres (see Figure 11).
Our spectroscopy at the HET and the MMT do not go red enough to detect the CIA in the
near IR, though all of these objects and several others should show infrared flux deficiency
due to CIA if they have pure H or mixed H/He atmospheres. Our SDSS DR2 proper motion
catalog does not reveal any other ultracool white dwarf candidate exhibiting strong CIA
absorption. Therefore, SDSS1337+00, LHS3250 and SDSSJ0947+44 are the only ultracool
white dwarfs (within our magnitude limit) showing strong CIA absorption in the SDSS DR2
imaging area (3324 square degrees). Further progress in understanding the ultracool white
dwarfs and estimating reliable temperatures for our cool white dwarf sample can be achieved
with the help of JHK infrared photometric observations. We have begun such a program at
the NASA Infrared Telescope Facility. Trigonometric parallax measurements for these white
dwarfs will also be necessary to measure their masses.
Even though our survey has a fainter magnitude limit and a lower proper motion cut off
than the LHS survey, the faint end of the white dwarf luminosity function where most of the
age sensitivity resides is still poorly populated. The magnitude limit of the SDSS+USNO-B
proper motion catalog is set by the photographic POSS I and POSS II plates. Although
SDSS imaging is 95% complete down to g = 22, the SDSS+USNO-B proper motion catalog
is only 90% complete down to g =19.7. A second epoch CCD imaging survey in r or i to 22
mag may be necessary to find the coolest white dwarfs in the disk and possible halo white
dwarfs (von Hippel et al. 2004). Also, we may be missing slowly moving cool white dwarfs; a
kinematically unbiased control sample, e.g. DDO51 photometry + multi object spectroscopy
(Kilic et al. 2004), would be useful to check the completeness of our survey.
This material is based upon work supported by the National Science Foundation under
Grants AST–0307315 (to TvH, DEW, and MK) and AST–0307321 (to JL and KAW). We
thank Pierre Bergeron and Didier Saumon for making their model atmospheres available to
us. We also thank Harry Shipman for careful reading of this manuscript. The Hobby-Eberly
– 14 –
Telescope (HET) is a joint project of the University of Texas at Austin, the Pennsylvania
State University, Stanford University, Ludwig-Maximilians-Universitat Munchen, and Georg-
August-Universitat Gottingen. The HET is named in honor of its principal benefactors,
William P. Hobby and Robert E. Eberly. The Marcario Low Resolution Spectrograph is
named for Mike Marcario of High Lonesome Optics who fabricated several optics for the
instrument but died before its completion. The LRS is a joint project of the Hobby-Eberly
Telescope partnership and the Instituto de Astronoma de la Universidad Nacional Autonoma
de Mexico.
Funding for the Sloan Digital Sky Survey (SDSS) has been provided by the Alfred P.
Sloan Foundation, the Participating Institutions, the National Aeronautics and Space Ad-
ministration, the National Science Foundation, the U.S. Department of Energy, the Japanese
Monbukagakusho, and the Max Planck Society. The SDSS Web site is http://www.sdss.org/.
The SDSS is managed by the Astrophysical Research Consortium (ARC) for the Par-
ticipating Institutions. The Participating Institutions are The University of Chicago, Fermi-
lab, the Institute for Advanced Study, the Japan Participation Group, The Johns Hopkins
University, the Korean Scientist Group, Los Alamos National Laboratory, the Max-Planck-
Institute for Astronomy (MPIA), the Max-Planck-Institute for Astrophysics (MPA), New
Mexico State University, University of Pittsburgh, Princeton University, the United States
Naval Observatory, and the University of Washington.
REFERENCES
Abazajian, K. et al. 2004, AJ, 128, 502
Abazajian, K. et al. 2003, AJ, 126, 2081
Bergeron, P., Saumon, D., & Wesemael, F. 1995, ApJ, 443, 764
Bergeron, P., Ruiz, M. T. & Leggett, S. K. 1997, ApJS, 108, 339
Bergeron, P., Leggett, S. K. & Ruiz, M. T. 2001, ApJS, 133, 413
Bergeron, P. 2003, ApJ, 586, 201
Claver, C. F. 1995, Ph.D. Thesis, University of Texas
Dahn, C.C., Monet, D.G., & Harris, H.C. 1989, in IAU Colloq. 114, White Dwarfs, ed. G.
Wegner (Berlin, Springer), 24
Davies, M. B., King, A., & Ritter, H. 2002, MNRAS, 333, 463
– 15 –
Fan, X. 1999, AJ, 117, 2528
Gates, E. et al. 2004, ApJ, 612, 129
Hansen, B. M. S. 1998, Nature, 394, 860
Hansen, B. M. S. 2003, ApJ, 582, 915
Harris, H. C. et al. 2001, ApJ, 549, 109
Harris, H. C. et al. 2003, AJ, 126, 1023
Harris, H. C. et al. 2005, AJ, submitted
Hogg, D. W. 2001, AJ, 122, 2129
Kilic, M., Winget, D.E., von Hippel, T., & Claver, C.F. 2004, AJ, 128, 1825
Kleinman, S. J. et al. 2004, ApJ, 607, 426
Lepine, S., Shara, M.M., & Rich, R.M. 2003, AJ, 126, 921
Liebert, J. 1979, In IAU Colloquium 53: White Dwarfs and Variable Degenerate Stars, p.
146
Liebert, J., Dahn, C. C., & Monet, D. G. 1988, ApJ, 332, 891
Liebert, J., Bergeron, P., & Holberg, J. 2005, ApJS, in press
Luyten, W. J. 1979, LHS Catalogue. A Catalogue of Stars with Proper Motions Exceeding
0.5” Annually (Minneapolis: Univ. Minnesota)
Luyten, W.J. 1979, NLTT Catalogue (Minneapolis: Univ. Minnesota Press) (NLTT)
Luyten, W.J. 1918, Lick Observatory Bulletin, 10, 135
McCook, G. P. & Sion, E. M. 2003, VizieR On-line Data Catalog: III/235
Monet, D. G., et al. 2003, AJ, 125, 984
Monet, D. B. A. et al. 1998, VizieR Online Data Catalog, October, 1252
Montgomery, M. H., Klumpe, E. W, Winget, D. E., & Wood, M. A. 1999, ApJ, 525, 482
Munn, J. A. et al. 2004, AJ, 127, 3034
– 16 –
Oppenheimer, B. R. Hambly, N. C. Digby, A. P. Hodgkin, S. T. & Saumon, D. 2001, Science,
292, 698
Oswalt, T. D., Smith, J. A., Wood, M. A., & Hintzen, P. 1996, Nature, 382, 692
Pier, J. R. et al. 2003, AJ, 125, 1559
Reid, I. N., Sahu, K.C., & Hawley, S.L. 2001, ApJ, 559, 942
Reyle, C., Robin, A. C., & Creze, M. 2001, A&A, 378, 53
Ruiz, M. T. & Bergeron, P. 2001, ApJ, 558, 761
Salaris, M., Garcia-Berro, E., Hernanz, M., Isern, J., & Saumon, D. 2000, ApJ, 544, 1036
Saumon, D. & Jacobson, S. B. 1999, ApJ, 511, 107
Schlegel, D. J., Finkbeiner, D. P., & Davis, M. 1998, ApJ, 500, 525
Schmidt, G. D. 2003, ApJ, 595, 1101
Schneider, D. P. et al. 2003, AJ, 126, 2579
Silvestri, N. M., Oswalt, T. D., & Hawley, S. L. 2002, AJ, 124, 1118
Smith, J. A. et al. 2002, AJ, 123, 2121
Spagna, A., Carollo, D., Lattanzi, M. G., & Bucciarelli, B. 2004, A&A, 428, 451
Stoughton, C. et al. 2002, AJ, 123, 485
von Hippel, T. et al. 2004, in The XIV European Workshop on White Dwarfs, ed. D. Koester
& S. Moehler, in press
Winget, D. E., Hansen, C. J., Liebert, J., Van Horn, H. M., Fontaine, G., Nather , R. E.,
Kepler, S. O., & Lamb, D. Q. 1987, ApJ, 315, L77
Wolff, B., Koester, D., & Liebert, J. 2002, A&A, 385, 995
York, D. G. et al. 2000, AJ, 120, 1579
This preprint was prepared with the AAS LATEX macros v5.2.
–17
–
Table 1. Spectroscopically Identified White Dwarfs
Name (SDSS J) g u − g g − r r − i i − z Au µra µdec Ep Type Teff Mbol Mg D VT Source
00 03 16.69−01 11 17.9 19.21 1.22 0.49 0.22 0.02 0.16 98 −16 6 DA 5351 14.57 15.14 69.19 32.57 MMT
00 11 42.67−09 03 24.3 17.73 0.64 0.31 0.12 0.01 0.21 4 −134 6 DA 6125 13.97 14.37 50.31 31.97 2.7m
00 28 37.06−00 29 28.9 19.68 0.54 0.36 0.04 −0.11 0.10 103 67 6 DC 6381 13.80 14.16 128.79 75.01 HET
00 43 16.02+15 40 59.5 18.11 0.53 0.18 0.01 −0.05 0.28 −37 25 6 DA 6844 13.49 13.82 79.16 16.76 2.7m
00 45 21.88+14 20 45.3 18.81 1.35 0.63 0.21 0.03 0.55 260 −53 6 DZA 4732 15.11 15.90 45.73 57.51 MMT
01 02 59.98+14 01 08.1 19.29 1.71 0.73 0.27 0.11 0.22 12 106 6 DC 4582 15.25 16.10 46.84 23.68 MMT
01 15 14.73+14 35 57.5 18.54 0.52 0.25 0.09 −0.02 0.31 −45 −55 4 DA 6320 13.84 14.21 81.60 27.49 MMT
01 28 27.47−00 45 12.6 17.74 1.02 0.37 0.15 0.00 0.16 147 −43 6 DA 5854 14.18 14.62 44.54 32.33 2.7m
01 57 43.25+13 35 58.2 19.15 1.19 0.64 0.16 0.05 0.25 87 −62 6 DC 5040 14.84 15.51 57.63 29.18 MMT
01 59 38.43−08 12 42.4 19.80 0.42 0.09 −0.10 0.01 0.13 322 −119 6 DA 8214 12.69 13.01 230.40 374.90 MMT
02 50 05.81−09 10 02.8 18.87 1.06 0.48 0.18 0.05 0.15 106 DA 6 DA 5474 14.47 15.00 62.59 31.45 MMT
02 56 41.62−07 00 33.8 18.81 1.73 0.80 0.34 0.08 0.26 373 −202 6 DC 4211 15.62 16.56 30.94 62.22 MMT
02 58 54.42+00 30 40.4 18.84 0.73 0.27 0.06 −0.07 0.42 −80 16 6 DA 6189 13.93 14.32 92.32 35.70 MMT
03 09 24.87+00 25 25.3 17.75 0.84 0.34 0.13 −0.02 0.57 −6 −106 6 DC 5637 14.34 14.83 46.60 23.45 2.7m
03 14 49.81−01 05 19.3 18.31 0.88 0.38 0.12 −0.04 0.39 −77 −71 6 DA 5709 14.29 14.76 58.48 29.03 2.7m
03 16 13.90−08 16 37.6 16.63 0.56 0.17 0.02 −0.04 0.48 90 −103 6 DA 6610 13.64 13.99 39.65 25.71 2.7m
03 30 54.88+00 37 16.5 19.33 0.81 0.34 0.10 0.01 0.57 77 34 6 DA 5690 14.30 14.78 98.78 39.41 MMT
04 06 32.39−04 32 50.4 17.02 0.53 0.17 0.00 −0.10 0.56 171 80 6 DA 6624 13.63 13.98 48.89 43.75 2.7m
04 06 47.32−06 44 36.9 17.70 0.74 0.34 0.07 0.03 0.45 67 27 6 DA 5884 14.15 14.59 48.70 16.67 2.7m
07 48 11.90+35 06 32.4 18.08 1.13 0.36 0.09 −0.07 0.30 −44 −141 6 DZA 5925 14.12 14.55 56.16 39.32 2.7m
07 53 13.28+42 30 01.6 17.91 1.84 0.84 0.30 0.10 0.23 113 −403 6 DC 4226 15.61 16.54 20.36 40.39 2.7m
07 56 31.11+41 39 50.9 16.76 0.52 0.18 0.03 −0.05 0.20 −9 −349 6 DA 6951 13.42 13.75 42.59 70.48 2.7m
08 20 36.99+43 10 05.3 17.40 0.49 0.08 0.03 −0.09 0.33 −63 −103 6 DA 7192 13.27 13.59 64.72 37.04 2.7m
08 20 56.07+48 03 52.9 17.16 0.62 0.24 0.12 −0.06 0.22 224 −80 6 DA 6388 13.79 14.16 42.91 48.37 2.7m
08 23 07.81+48 33 16.6 17.79 0.74 0.25 0.10 −0.02 0.22 −217 −72 6 DA 6378 13.80 14.16 57.26 62.06 2.7m
08 25 19.70+50 49 20.1 19.17 1.72 0.86 0.33 0.05 0.24 −331 −330 6 DC 4048 15.79 16.74 33.42 74.04 MMT
08 36 41.56+45 56 58.7 19.89 1.63 0.84 0.27 0.15 0.15 −64 −169 6 DC 4373 15.46 16.36 53.19 45.56 MMT
08 37 12.30+46 13 25.1 18.39 0.69 0.29 0.09 0.00 0.14 −80 −40 6 DA 6363 13.81 14.18 72.90 30.90 MMT
09 19 48.92+01 13 53.0 18.21 0.73 0.30 0.11 0.00 0.13 137 −193 6 DA 6227 13.90 14.29 63.81 71.58 2.7m
09 29 03.12+55 47 58.5 17.85 0.43 0.23 1.05 0.87 0.15 −350 −18 6 DA+M 6719 13.57 13.91 64.55 107.23 2.7m
09 34 38.94+53 29 37.4 17.47 0.51 0.20 0.04 −0.01 0.06 −151 −145 6 DA 6976 13.40 13.73 57.12 56.68 2.7m
09 42 44.96+44 37 43.1 19.44 1.92 0.88 0.37 0.19 0.06 −135 −189 6 DC 4052 15.79 16.73 35.66 39.25 HET
10 01 19.48+46 56 50.6 19.24 2.06 1.06 0.33 0.09 0.07 −17 −339 6 DC 3284 16.71 17.48 23.08 37.13 HET
10 02 25.85+61 08 58.1 19.34 2.32 0.96 0.38 0.18 0.08 −448 −328 6 DC 3581 16.33 17.20 27.79 73.15 MMT
10 05 21.05+53 54 08.4 18.02 0.50 0.24 0.05 −0.02 0.04 −145 −219 6 DA 6800 13.52 13.85 68.91 85.79 2.7m
10 11 05.63+00 29 44.4 17.23 0.69 0.31 0.11 −0.02 0.18 −219 55 6 DAH 6184 13.93 14.32 40.48 43.33 2.7m
10 13 59.85+03 05 53.8 18.60 1.37 0.63 0.23 0.10 0.16 107 −101 6 DA 4964 14.90 15.60 42.00 29.29 MMT
10 14 14.45+04 01 37.4 16.76 0.46 0.11 0.01 −0.06 0.11 −199 26 6 DA 7506 13.08 13.40 48.78 46.41 2.7m
10 22 10.36+46 12 49.2 16.42 0.42 0.20 0.05 −0.06 0.07 9 −121 6 DA 6993 13.39 13.72 35.38 20.35 2.7m
10 23 56.10+63 48 33.8 18.08 0.86 0.34 0.09 0.00 0.05 −344 −216 6 DA 6243 13.89 14.28 58.47 112.58 2.7m
10 48 01.84+63 34 48.9 17.90 1.43 0.61 0.29 0.02 0.04 −258 −142 6 DA 5004 14.87 15.55 29.94 41.79 MMT
11 02 13.70+67 07 52.6 19.55 1.74 0.65 0.29 0.03 0.09 −380 −185 6 DC 4840 15.01 15.76 59.24 118.67 HET
11 07 31.38+48 55 23.0 19.39 2.02 0.92 0.30 0.12 0.11 −726 −79 6 DC 4020 15.82 16.77 34.85 120.64 HET
11 11 54.54+03 37 26.2 18.22 0.91 0.37 0.11 0.06 0.21 −371 −127 6 DA 5899 14.14 14.57 57.72 107.28 2.7m
11 13 06.26+00 32 43.7 17.60 0.53 0.21 −0.07 −0.04 0.34 −363 −89 6 DC 6953 13.42 13.75 65.60 116.21 2.7m
11 15 36.96+00 33 17.3 17.75 1.52 0.66 0.24 0.05 0.23 37 −250 6 DA 4816 15.04 15.79 26.57 31.83 MMT
11 19 40.62−01 07 55.1 19.79 2.01 0.85 0.24 0.15 0.23 −291 −28 6 DC 4283 15.55 16.47 49.77 68.97 HET
11 36 55.18+04 09 52.6 16.98 0.45 −0.10 0.32 0.51 0.12 −96 −53 4 DA 10077 11.79 12.18 95.28 49.52 2.7m
11 43 52.16−01 31 49.4 17.36 0.72 0.24 0.09 −0.02 0.10 −277 −2 6 DA 6594 13.65 14.00 48.57 63.78 2.7m
11 44 39.54+66 29 28.5 17.47 0.62 0.22 0.04 −0.06 0.05 −145 −20 6 DAH 6919 13.44 13.77 55.76 38.68 2.7m
11 46 25.77−01 36 36.9 16.48 0.59 0.25 0.12 −0.06 0.07 358 −434 6 DA 6516 13.70 14.05 31.35 83.61 2.7m
–18
–
Table 1—Continued
Name (SDSS J) g u − g g − r r − i i − z Au µra µdec Ep Type Teff Mbol Mg D VT Source
12 02 00.48−03 13 47.4 19.86 2.37 0.85 0.32 0.06 0.15 −73 134 6 DC 4151 15.69 16.62 47.03 34.01 MMT
12 03 28.65+04 26 53.4 18.11 1.36 0.66 0.28 0.08 0.10 −252 156 6 DC 4852 15.00 15.75 30.66 43.07 MMT
12 04 39.54+62 22 16.4 19.16 1.69 0.78 0.29 0.10 0.10 −21 −159 6 DC 4528 15.31 16.17 40.92 31.11 MMT
12 05 29.15+04 49 35.6 18.45 0.89 0.48 0.19 0.07 0.09 −138 −53 6 DC 5524 14.43 14.94 51.65 36.19 MMT
12 33 22.45+06 07 10.7 18.21 1.32 0.55 0.19 0.03 0.09 −79 −352 6 DA 5302 14.61 15.19 41.41 70.80 2.7m
12 34 08.12+01 09 47.4 19.73 1.40 0.54 0.25 0.03 0.13 −284 −55 6 DA 5177 14.72 15.34 79.01 108.34 HET
12 38 47.85+51 22 07.4 17.32 0.46 0.12 −0.02 −0.13 0.07 −319 −21 6 DA 7710 12.96 13.29 65.38 99.06 2.7m
13 00 21.25+01 30 45.5 17.74 1.23 0.54 0.18 0.12 0.10 −374 145 6 DA 5297 14.61 15.20 33.48 63.66 2.7m
13 01 21.14+67 13 07.4 16.69 0.56 0.25 0.09 −0.04 0.06 151 52 4 DA 6629 13.63 13.97 35.51 26.88 2.7m
13 03 13.03−03 23 23.9 16.81 0.45 0.16 0.02 −0.09 0.13 32 −137 6 DA 7160 13.29 13.62 45.47 30.32 2.7m
13 13 13.12+02 26 45.8 18.84 2.04 1.07 0.37 0.18 0.14 −744 −116 6 DC 3394 16.56 17.38 20.23 72.21 MMT
13 22 54.60−00 50 42.8 18.82 1.75 0.76 0.31 0.09 0.14 −156 118 6 DC 4505 15.33 16.20 35.08 32.52 MMT
13 36 16.05+00 17 32.7 17.34 0.51 0.36 0.76 0.58 0.12 −278 −141 6 DA+M 6116 13.98 14.38 40.76 60.23 2.7m
13 39 39.55+67 04 49.8 19.79 0.75 0.28 0.12 −0.02 0.07 −194 235 5 DA 6409 13.78 14.14 137.61 198.77 HET
13 40 43.35+02 03 48.3 18.01 1.11 0.43 0.20 0.04 0.13 −534 28 6 DC 5600 14.37 14.87 44.45 112.66 2.7m
13 57 58.43+60 28 55.3 18.04 0.72 0.35 0.11 −0.05 0.07 −304 55 6 DC 6186 13.93 14.32 56.53 82.78 2.7m
14 22 25.73+04 59 39.7 19.34 1.54 0.83 0.30 0.08 0.15 −277 −62 6 DC 4365 15.47 16.37 41.08 55.27 HET
14 26 59.40+49 21 00.6 16.93 0.55 0.18 0.07 −0.09 0.11 −96 44 6 DC 6927 13.43 13.77 44.52 22.28 2.7m
14 52 24.95−00 11 34.7 18.25 1.36 0.58 0.20 0.07 0.27 155 129 6 DC 5052 14.83 15.49 38.98 37.26 2.7m
15 48 35.89+57 08 26.4 17.70 0.80 0.39 0.13 0.05 0.06 −220 −138 6 DC 5975 14.08 14.50 44.38 54.64 2.7m
15 55 34.18+50 25 47.8 16.70 0.75 0.31 0.13 0.00 0.10 −234 −5 6 DA 6204 13.92 14.31 31.13 34.54 2.7m
16 09 20.13+52 22 39.6 18.21 0.65 0.25 0.12 0.01 0.10 155 281 6 DA 6467 13.73 14.09 68.91 104.82 2.7m
16 15 44.67+44 49 42.5 19.56 1.63 0.75 0.27 0.08 0.05 44 −237 6 DC 4698 15.14 15.95 53.41 61.02 HET
16 23 24.05+34 36 47.7 17.18 0.39 0.11 0.08 0.45 0.10 −58 105 6 DA 7650 13.00 13.32 61.11 34.74 2.7m
16 27 12.99+00 28 18.6 17.38 0.78 0.31 0.06 −0.01 0.47 −194 −73 6 DA 5983 14.08 14.49 44.31 43.54 2.7m
16 27 31.09+48 59 19.0 19.19 1.51 0.59 0.24 0.05 0.07 −91 77 6 DZA 5105 14.78 15.43 58.01 32.78 MMT
16 48 47.07+39 39 17.0 18.81 1.29 0.54 0.16 0.06 0.07 −126 0 6 DC 5401 14.53 15.08 56.98 34.03 MMT
16 54 45.70+38 29 36.6 16.93 0.96 0.40 0.15 0.02 0.08 18 −325 5 DZA 5847 14.18 14.62 29.72 45.85 2.7m
16 59 40.00+32 03 20.1 17.56 0.63 0.28 0.07 0.01 0.16 −238 −244 6 DA 6428 13.76 14.12 51.35 82.96 2.7m
17 04 47.70+36 08 47.4 18.63 1.79 0.75 0.28 0.12 0.13 186 −175 6 DC 4560 15.28 16.13 33.21 40.20 HET
17 14 33.26+27 38 36.1 18.16 0.40 0.12 0.01 −0.11 0.24 49 −20 6 DC 7235 13.24 13.57 89.96 22.57 2.7m
17 22 57.78+57 52 50.7 19.17 1.14 0.46 0.23 0.06 0.15 −37 390 6 DC 5403 14.53 15.08 69.64 129.32 HET
17 24 13.32+27 56 55.2 17.47 0.78 0.30 0.11 0.00 0.26 47 −60 6 DA 6131 13.97 14.37 45.61 16.48 2.7m
17 28 07.29+26 46 20.1 18.02 0.97 0.42 0.16 0.04 0.23 −45 −255 6 DA 5619 14.36 14.85 46.57 57.15 2.7m
20 41 28.99−05 20 27.7 19.09 1.65 0.70 0.26 0.06 0.26 −149 −29 6 DC 4673 15.17 15.98 45.68 32.87 MMT
20 42 59.23+00 31 56.6 19.67 1.65 0.81 0.30 0.07 0.37 −71 −244 6 DC 4201 15.63 16.57 47.29 56.96 HET
20 45 06.97+00 37 34.4 19.43 0.59 0.25 0.12 0.00 0.45 32 −32 6 DA 6093 14.00 14.40 117.73 25.25 MMT
20 45 57.53−07 10 03.5 19.08 1.61 0.68 0.21 0.12 0.39 −73 −134 6 DC 4682 15.16 15.97 47.90 34.65 MMT
21 03 30.85−00 24 46.4 18.22 0.66 0.27 0.07 0.02 0.34 61 −139 6 DC 6223 13.91 14.29 68.61 49.36 MMT
21 16 40.30−07 24 52.7 17.93 1.67 0.69 0.25 0.05 0.70 111 −223 6 DC 4359 15.47 16.38 25.89 30.56 2.7m
21 18 05.21−07 37 29.1 19.85 2.42 0.98 0.33 0.11 1.17 115 −144 5 DC 3401 16.55 17.37 43.44 37.95 HET
21 18 58.65+11 20 17.7 18.13 0.77 0.27 0.09 0.01 0.42 359 −13 5 DA 6086 14.00 14.40 64.24 109.38 2.7m
21 25 01.48−07 34 56.0 19.48 0.74 0.26 0.08 0.01 0.56 64 13 5 DA 6063 14.02 14.42 122.54 37.93 MMT
21 36 43.08−07 06 38.2 19.43 0.60 0.25 0.08 −0.03 0.20 69 −11 5 DA 6520 13.70 14.05 125.93 41.71 MMT
21 47 52.10−08 24 36.8 17.59 0.75 0.32 0.14 −0.01 0.24 30 153 6 DA 6010 14.06 14.47 45.77 33.82 2.7m
21 54 30.69+13 00 26.7 18.75 1.55 0.61 0.25 0.10 0.41 367 −73 6 DZA 4768 15.08 15.86 43.76 77.62 MMT
21 55 01.53+12 01 16.4 18.47 0.65 0.25 0.07 −0.06 0.54 −76 −25 4 DA 6121 13.98 14.37 79.14 30.01 MMT
22 04 14.16−01 09 31.2 19.88 1.88 0.83 0.24 0.11 0.44 112 −303 6 DC 4189 15.65 16.58 52.87 80.95 HET
22 22 33.90+12 21 43.0 19.13 1.95 1.02 0.36 0.18 0.41 731 198 4 DC 3448 16.49 17.33 25.78 92.53 HET
22 41 57.63+13 32 38.8 17.36 0.82 0.35 0.10 0.02 0.26 61 −395 6 DA 5986 14.07 14.49 40.90 77.49 2.7m
22 42 06.19+00 48 22.8 19.38 2.43 0.91 0.34 0.08 0.36 132 −76 6 DC 3407 16.55 17.37 29.12 21.02 HET
–19
–
Table 1—Continued
Name (SDSS J) g u − g g − r r − i i − z Au µra µdec Ep Type Teff Mbol Mg D VT Source
22 54 08.64+13 23 57.2 19.33 2.04 0.97 0.33 0.10 0.26 329 −199 6 DC 3356 16.61 17.41 26.72 48.71 HET
23 12 06.08+13 10 57.6 17.45 1.38 0.56 0.16 0.08 0.38 −132 −256 6 DA 5078 14.80 15.46 28.40 38.78 2.7m
23 25 19.89+14 03 39.7 16.30 1.55 0.57 0.27 0.09 0.23 336 115 6 DC 4941 14.92 15.63 14.80 24.92 2.7m
23 30 40.47+01 00 47.4 17.36 0.64 0.17 0.06 0.02 0.20 −255 −125 6 DA 6768 13.54 13.88 53.63 72.19 2.7m
23 30 55.20+00 28 52.3 19.77 1.96 0.89 0.30 0.11 0.17 151 91 6 DC 4126 15.71 16.65 44.42 37.12 HET
23 37 07.68+00 32 42.3 18.13 1.01 0.45 0.14 −0.02 0.18 305 162 6 DA 5629 14.35 14.84 48.35 79.15 2.7m
23 40 41.47−11 06 36.9 18.46 0.53 0.25 0.74 0.85 0.15 19 −87 6 DA+M 6612 13.64 13.99 82.58 34.86 MMT
23 42 45.75−10 01 21.4 18.83 1.52 0.71 0.26 0.04 0.16 −28 −95 6 DA 4719 15.12 15.92 40.18 18.86 MMT
23 50 42.52−08 46 18.9 19.03 1.04 0.50 0.22 0.08 0.18 209 −139 6 DA 5298 14.61 15.20 62.18 73.97 HET
23 54 16.59+00 30 01.2 19.25 0.71 0.20 0.10 0.04 0.20 53 18 5 DA 6568 13.67 14.02 119.10 31.60 MMT
– 20 –
Table 2. Spectroscopically Identified Subdwarf Stars
Name (SDSS J) g u − g g − r r − i i − z Au µra µdec Ep Dist22 Source
00 18 13.74−08 54 58.6 19.48 0.73 0.24 0.07 −0.03 0.23 −41 −33 5 15.1 MMT
00 29 58.84+15 18 41.1 19.20 0.84 0.29 0.08 0.07 0.34 −46 −31 4 30.4 MMT
00 53 31.26+00 05 09.8 19.38 2.18 1.09 0.53 0.23 0.13 137 −22 6 24.4 MMT
01 05 02.05+14 01 54.4 19.40 1.00 0.43 0.15 0.08 0.37 −11 48 5 25.4 MMT
01 31 19.61+00 02 57.6 17.93 2.18 1.14 0.45 0.25 0.17 230 −115 6 31.0 2.7m
01 48 33.19−01 10 43.3 17.98 1.91 0.85 0.36 0.15 0.17 152 −106 6 13.8 2.7m
01 56 32.67+14 47 29.7 17.48 1.52 0.66 0.27 0.07 0.29 111 −95 5 7.8 2.7m
02 12 13.80+00 00 42.1 18.81 1.33 0.51 0.21 0.10 0.16 81 61 5 12.9 MMT
02 29 47.61−08 50 20.2 16.80 1.62 0.74 0.24 0.14 0.17 151 −95 6 6.4 2.7m
02 38 07.99−09 30 33.6 18.61 1.87 0.77 0.30 0.19 0.15 80 −46 6 29.4 MMT
03 00 48.83−00 44 08.0 17.21 1.20 0.60 0.26 0.19 0.60 83 −113 6 12.6 2.7m
03 07 22.43+00 34 05.2 15.68 1.18 0.49 0.18 0.08 0.55 156 −109 6 41.2 2.7m
03 10 43.74−08 18 48.7 17.49 0.86 0.25 0.08 0.03 0.36 −32 48 5 13.4 2.7m
03 18 45.08−06 12 36.3 16.56 1.51 0.73 0.28 0.18 0.33 159 −104 6 35.0 2.7m
03 51 47.74−05 33 02.9 15.94 1.54 0.74 0.28 0.12 0.56 237 −264 6 31.9 2.7m
07 36 36.05+29 02 22.7 17.41 1.11 0.34 0.13 0.05 0.24 −18 −71 5 4.6 2.7m
07 38 56.39+32 25 18.9 17.52 1.73 0.80 0.33 0.16 0.22 5 −144 6 17.0 2.7m
07 52 17.25+25 21 55.6 16.79 1.03 0.27 0.07 0.00 0.40 146 214 4 26.2 2.7m
08 00 05.13+46 08 01.1 16.64 1.13 0.55 0.16 0.11 0.38 −2 309 4 19.6 2.7m
08 13 06.76+02 34 25.9 17.15 1.30 0.45 0.19 0.09 0.14 309 −45 5 7.7 2.7m
08 30 49.85+02 50 18.6 18.24 1.55 0.53 0.12 0.12 0.17 45 87 6 5.5 2.7m
08 37 43.43+02 01 01.7 17.91 2.14 0.78 0.30 0.11 0.25 −15 −443 4 5.5 MMT
09 05 13.97+47 37 28.5 18.67 2.79 1.33 0.51 0.31 0.08 −159 −344 6 35.1 MMT
09 19 09.52+56 41 00.1 17.03 2.09 0.70 0.24 0.14 0.17 1 −263 5 10.0 2.7m
09 35 59.33+60 13 23.0 17.22 1.40 0.55 0.25 0.09 0.15 −4 −275 4 11.3 2.7m
09 59 26.92−00 08 49.7 16.82 2.03 0.79 0.31 0.09 0.16 −315 90 5 6.0 2.7m
10 05 37.72+52 59 13.2 17.30 0.95 0.24 0.08 −0.01 0.04 −3 131 5 12.1 2.7m
10 06 33.59−00 27 32.4 17.95 1.01 0.47 0.16 0.08 0.19 −237 −72 5 4.1 2.7m
10 17 39.82+02 09 33.8 16.79 1.40 0.59 0.21 0.12 0.25 −240 190 4 16.5 2.7m
10 41 49.72+62 44 55.6 16.69 0.98 0.29 0.08 0.05 0.03 55 161 5 12.2 2.7m
10 51 57.48+02 03 00.4 19.74 1.97 1.05 0.46 0.28 0.22 166 −105 5 32.0 MMT
11 07 23.94+62 26 06.0 16.29 0.97 0.33 0.11 0.03 0.05 46 239 4 25.4 2.7m
11 13 27.37+58 58 48.5 17.09 2.32 1.24 0.48 0.31 0.05 −296 −472 6 59.0 2.7m
11 22 04.68+65 53 59.7 17.54 1.08 0.36 0.17 0.04 0.06 −63 −152 5 39.5 2.7m
11 31 02.89+66 57 51.2 16.66 1.64 0.52 0.25 0.11 0.05 −116 206 5 42.9 2.7m
11 35 12.08+03 28 41.2 19.24 2.80 1.18 0.47 0.31 0.11 −163 −255 6 20.1 MMT
11 52 06.86+67 02 04.2 16.33 0.87 0.21 0.08 0.02 0.06 −117 143 4 19.8 2.7m
12 09 45.96+63 02 43.9 16.96 0.86 0.25 0.08 0.01 0.10 −71 196 5 26.5 2.7m
12 50 47.35+03 26 52.8 18.28 2.17 0.98 0.43 0.19 0.16 −97 −221 4 12.5 2.7m
12 52 26.29+02 28 38.8 16.78 1.44 0.49 0.16 0.05 0.16 155 −100 5 19.1 2.7m
13 05 07.26+04 14 08.1 16.81 0.92 0.32 0.12 0.02 0.13 −135 −47 5 9.3 2.7m
13 42 33.44+58 00 19.7 17.16 1.08 0.32 0.13 0.04 0.04 15 196 5 15.7 2.7m
14 06 35.95+61 53 35.6 19.70 1.96 1.03 0.42 0.25 0.07 −84 296 5 36.2 HET
16 37 16.86+45 17 01.8 17.79 0.95 0.33 0.08 0.05 0.06 −83 −414 4 13.6 2.7m
17 02 06.35+31 47 49.9 17.71 1.57 0.58 0.19 0.13 0.21 246 −99 5 9.6 2.7m
17 17 37.03+62 34 48.1 18.26 1.10 0.32 0.16 0.00 0.12 −36 43 6 28.5 2.7m
17 19 18.54+29 15 38.6 17.52 1.55 0.59 0.14 0.08 0.20 72 142 5 11.1 2.7m
17 35 52.77+57 38 14.3 17.88 2.07 1.00 0.40 0.19 0.33 −89 156 6 20.0 2.7m
20 58 59.24−05 57 03.8 19.16 1.51 0.59 0.19 0.08 0.23 −51 51 4 12.1 MMT
21 34 27.61−08 15 11.0 18.41 1.34 0.49 0.15 0.08 0.18 −75 19 5 23.0 MMT
21 42 39.11−00 55 50.3 18.69 2.41 1.19 0.47 0.26 0.27 103 −173 6 13.6 MMT
21 48 19.02+00 39 43.2 18.30 0.99 0.35 0.10 0.01 0.81 −55 79 6 9.7 MMT
22 14 28.87+13 53 41.9 17.66 1.04 0.39 0.14 0.06 0.33 90 50 6 8.7 2.7m
22 54 49.68+12 59 22.6 19.23 1.75 1.00 0.31 0.21 0.20 226 −125 5 7.2 HET
22 58 03.60−10 07 02.0 19.33 2.73 1.08 0.57 0.29 0.20 108 −145 6 28.8 MMT
Note. — Proper motions for stars that have not been detected in 1 or 2 USNO-B epochs (Ep<6) or that have a neighbor
brighter than 22 mag within 7 arcsec (Dist22< 7) are unreliable.
– 21 –
Fig. 1.— The reduced proper motion diagram for stars in the SDSS DR2. Individual stars
are plotted only in the region of interest for white dwarfs, the remaining stars are represented
by the contours. Previously known white dwarfs, white dwarf plus late type star binaries,
subdwarfs, and quasars are shown as blue triangles, green triangles, red squares, and cyan
circles, respectively. White dwarf cooling curves for different tangential velocities are shown
as solid lines. The VT = 20–40 km s−1 curves mark the expected location of disk white
dwarfs, whereas the VT = 150 km s−1 curve represents the halo white dwarfs.
– 22 –
4500 5000 5500 6000 6500 7000
Fig. 2.— Optical spectra for white dwarfs observed at the Hobby–Eberly Telescope. The
spectra are normalized at 5500 A, and are shifted vertically from each other by arbitrary
units. Synthetic spectrum of a 4000 K pure H atmosphere white dwarf (D. Saumon, private
communication) is also shown. The g − r color increases from bottom to top.
– 23 –
4000 5000 6000
Fig. 3.— Same as figure 2, but for white dwarfs observed at the MMT.
– 24 –
4000 5000 6000
Figure 3b
– 25 –
4000 4500 5000
Fig. 4.— Optical spectra for white dwarfs observed at the McDonald 2.7m Harlan Smith
Telescope. The spectra are normalized at 4600 A, and are shifted vertically from each other
by arbitrary units. The u − r color increases from bottom to top.
– 26 –
4000 4500 5000
Figure 4b
– 27 –
4000 4500 5000
Figure 4c
– 28 –
1.83
1.65
1.51
1.07
0.7
8
0.72
0.64
0.58
0.4
5
0.3
8
0.3
1
Fig. 5.— Optical spectra of several subdwarf stars observed at the MMT. The spectra are
ordered in increasing g − i color, which is given on the right edge of each spectrum.
– 29 –
Fig. 6.— Same as figure 1, but for the spectroscopically confirmed white dwarfs, white dwarf
+ late type star binaries, subdwarfs, and quasars found in our study. White dwarfs that did
not meet our criteria for reliable proper motions are plotted as blue asterisks.
– 30 –
Fig. 7.— MMT spectra for two uncertain white dwarfs / subdwarfs.
– 31 –
0 1 2 3
-0.5
0
0.5
1
6000K
5000K
4000K
DA
DB
DA+M
SD
DC
DQ
DZ
Fig. 8.— Color-color diagrams showing the white dwarfs and subdwarfs from our study (red
symbols) and the literature (black symbols). Different types of white dwarfs are shown with
different symbols. The contours represent objects without spectroscopic confirmation. The
curves show the colors of white dwarf model atmospheres (P. Bergeron, private communica-
tion) of pure H (solid curves) and pure He (dashed curves) with log g = 7, 8, and 9, where
the log g = 9 curve is the bottom and log g = 7 is the top curve in panel a. The dotted lines
with labels connect models with the same effective temperature.
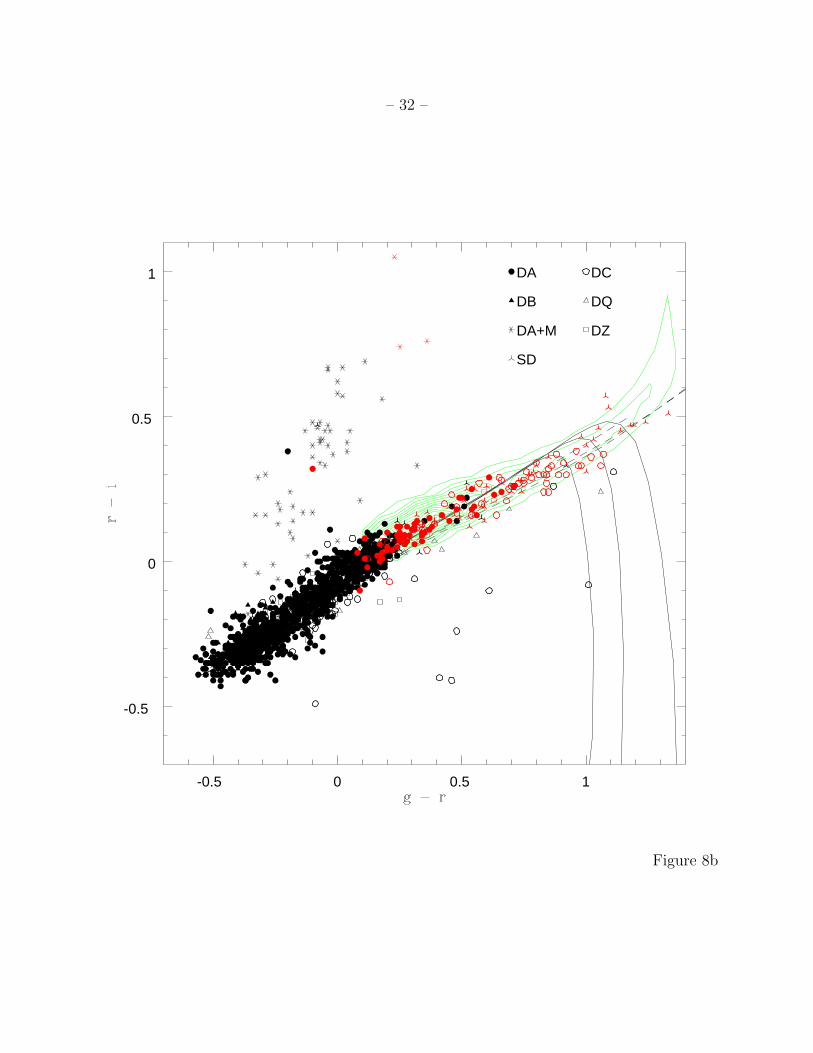
– 32 –
-0.5 0 0.5 1
-0.5
0
0.5
1 DA
DB
DA+M
SD
DC
DQ
DZ
Figure 8b
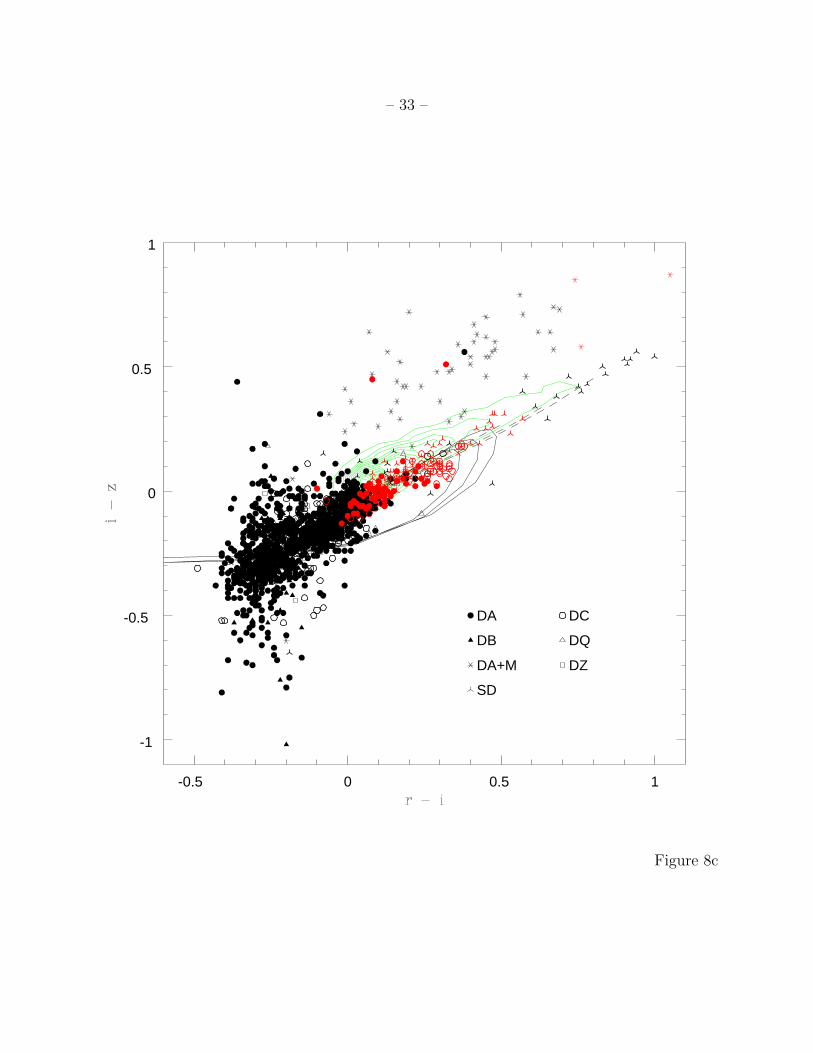
– 33 –
-0.5 0 0.5 1
-1
-0.5
0
0.5
1
DA
DB
DA+M
SD
DC
DQ
DZ
Figure 8c
– 34 –
0
10
20
30
40
Non-DA Gap DA
DC
BRL97 DA
0 0.5 1
0
10
20
30
40
Fig. 9.— Equivalent width measurements of Hα and Hβ as a function of g − r for the
DA and DC white dwarfs in our sample. The top panel also includes Hα equivalent width
measurements of the Bergeron, Ruiz & Leggett (1997) DA sample. The predicted non-DA
gap for log g = 8 DA white dwarfs is marked by the dashed lines. Since McDonald 2.7m
spectra do not cover Hα, we do not have Hα equivalent width measurements for some of our
objects.
– 35 –
0.5
11.
52
0
0.2
0.4
0.6
0.81
u-g
DA
0.5
11.
52
0
0.2
0.4
0.6
0.81
u -
g
DC
& D
Q
00.
51
-0.2
0
0.2
0.4
g -
r
00.
51
-0.2
0
0.2
0.4
g -
r
00.
10.
20.
30.
4-0
.2
-0.1
0
0.1
0.2
0.3
r -
i
00.
10.
20.
30.
4-0
.2
-0.1
0
0.1
0.2
0.3
r -
i
Fig. 10.— The u − g vs. g − r (left panel), g − r vs. r − i (middle panel), and r − i
vs. i − z (right panel) color-color diagrams for white dwarfs in our sample. Upper panels
show DA white dwarfs, whereas lower panels show DC (open circles) and DQ (star symbols)
white dwarfs. The pure H (DA panels) and pure He (non-DA panels) model sequences with
6000K & Teff & 5000K are also shown for log g = 7 (solid line), log g = 8 (dashed line), and
log g = 9 (dotted line). Probable DC white dwarfs in the non-DA gap are shown as filled
red circles.
– 36 –
4 6 8 10
4
6
8
10
Fig. 11.— Effective temperatures for our sample of DC white dwarfs using pure H or pure
He white dwarf model atmospheres. The effects of using a hydrogen-rich or a helium-rich
composition to estimate temperatures become significant below ∼ 5500K.