Embed Size (px)
DESCRIPTION
benchmarking
Citation preview

European Management Journal Vol. 16, No. 1, pp. 1–17, 1998 1998 Elsevier Science Ltd. All rights reservedPergamon
Printed in Great Britain0263-2373/98 $19.00 + 0.00PII: S0263-2373(97)00069-8
Benchmarking NewProduct Performance:Results of the BestPractices StudyROBERT COOPER, McMaster University, Ontario, Canada
Introducing new products into the marketplace isessential to a company’s competitive position andlong-term survival. Robert Cooper investigates thenew product performance of a large number ofNorth American and European business units andvarious best business practices that led to this per-formance. This novel benchmarking study ident-ifies three main driving factors or best practiceswhich will create winning new product effort. 1998 Elsevier Science Ltd. All rights reserved
Introduction
The long-term survival of a business enterprisehinges upon its ability to successfully introduce newproducts into the marketplace.1 Rapidly changingtechnologies, heightened competition, and dynamiccustomer needs and wants are rendering existingproducts obsolete at an ever increasing pace: productlife cycles are becoming shorter (Von Braun, 1997).The message to senior management is simple: eitherinnovate or die! The dilemma faced by managementsin moderate-to-high technology firms is that the needfor product development is stronger than ever, butthe tools and methods to bring new products to mar-ket have not changed dramatically in the last dec-ades.
What then are the secrets to a winning new producteffort, one that consistently delivers a steady streamof successful, profitable and significant new pro-ducts? This article reports the results of a bench-marking investigation that probes this vital question.The research looks at the new product performanceof a large number of business units,2 and also at thevarious practices that led to this performance. In so
European Management Journal Vol 16 No 1 February 1998 1
doing, the study pinpoints the drivers of perform-ance — the critical success factors — and hencebest practices.
The Quest for the Critical SuccessFactors
The quest for the drivers of new product success hasbeen a popular research topic for the last two dec-ades. Virtually all of this research has been the typicalsuccess/failure study which focuses on specific newproduct projects, and compares and contrasts thecharacteristics of winning versus losing projects; in sodoing, it uncovers those factors which discriminatebetween the two (see for example, Cooper, 1993,1994, 1995; Montoya-Weiss and Calantone, 1994).This type of research, while identifying myriad suc-cess factors, does have its limitations however. Per-haps the most fundamental flaw is the fact thatresearch done at the project level often fails to identifycompany practices which determine success. There arethree reasons.
1. First, success at the company or business unit levelmay be somewhat different than success at theproject level. For example, a business may have astring of ‘successful’ projects — measured byreturn-on-investment of each project; but overall,these projects have relatively little impact on thefirm, and so the business’ total new product effortmay be mediocre.
2. Next, often important practices — for example,having an innovative climate and culture — arenot readily apparent or measurable at the projectlevel. So they are missed in such success/failurestudies.

BENCHMARKING NEW PRODUCT PERFORMANCE: RESULTS OF THE BEST PRACTICES STUDY
3. A more subtle and final reason is the way theresearch is designed. When pairs of successes andfailures are selected from each firm, companycharacteristics which may have a strong impact onsuccess will be common to both projects. And sothese company characteristics do not emerge in ananalysis of factors that distinguish the successes.
In recent years, benchmarking versus other compa-nies has become popular, and has in part overcomesome of the deficiencies listed above. But bench-marking as practised by most companies also has itsproblems. First, it is very time consuming; secondthere is the problem of getting the cooperation ofother companies; third, there are methodologicalproblems: the fact that those in the company doingthe benchmarking may not be experienced at suchresearch, are not sure what to measure, talk to thewrong people, interpret the ‘data’ incorrectly, and soon… all the classic errors made by an inexperiencedinvestigator. Finally, relationships typically are notstudied: best practices are noted, but the link betweenpractices and improved performance remains largelyspeculative. Thus, there always remains the concernthat an observed practice did not really have muchimpact on performance.
The current study sought to overcome both sets ofproblems. First, by focusing on the business unit as theunit of analysis (rather than individual new productprojects), the study identifies a number of businesscharacteristics or practices often missed in traditionalresearch. Second, the research is rigorously designed,employs a large sample of businesses, and utilizessophisticated data analyses methods. Finally, the linkbetween practice and performance is investigated, so thatone can conclude that certain practices really do dis-tinguish the top performers from the rest.
The Investigation
A total of 161 business units in a variety of industriesin the US, Germany, Denmark and Canada agreedto participate in the benchmarking study. A detaileddiagnostic questionnaire was designed to charac-terize the businesses’ new product practices in eachof five major areas: process, organization, strategy, cul-ture and commitment. These five areas (Figure 1)were measured via 48 metrics, from which eightthemes or dimensions of businesses’ practices andcharacteristics were identified (Table 1). In addition,ten performance metrics captured how well the busi-ness unit’s total new product effort performed.Research details are provided in Figure 2 (see alsoCooper, 1993, 1994, 1995).
European Management Journal Vol 16 No 1 February 19982
A Framework for the StudyNumerous studies into new product success and failure, togetherwith case studies and popular books, have suggested myriadfactors which ought to drive new product performance. Fromthese, we developed a framework, which identified five majorblocks of characteristics for measurement:
1. Process: the business's new product development processand the specific activities within this process. Processes whichpromote a strong market orientation, doing the pre-developmentactivities well, having sharp, early product definition, andbuilding in rigorous Go/Kill decision points are purported toyield positive outcomes [1,7,12].
2. Organization: the way projects are organized. Investigationsreport that the use of a cross-functional team, interfaces betweendepartments, and an empowered leader yield much betterresults than a functionally-based new product effort[13,14,15,17,18,23].
3. Strategy: the business's total new product strategy. Havingan explicit new product strategy–which defines the role &goals of new product development in the business's overallstrategy; specifies product/market arenas as areas to focus on;and formalizes the necessary organizational structures forimplementation–results in more positive performance[1,2,13,16].
4. Culture: the business's internal culture and climate forinnovation. Facets of a positive climate include: encouragingintrapreneurship; providing support (rewards, risk tolerance,autonomy and treatment of failures); fostering the submissionof new product ideas; and providing free time & resources toundertake creative activities [1,16,17,21,22].
5. Commitment: senior management's involvement with andcommitment to new product development. Success factors hereinclude senior management commitment to risk-taking; clearmessages from senior management about the importance ofnew product development; and availability of funds andresources for product development [2,13,14,16,17,21].
Figure 1 A Framework for the Study
Results: the Cornerstones ofPerformance
There are three cornerstones of performance that dis-tinguish the top performing businesses. The top threedrivers of performance, in order, are shown in Fig-ure 4:
❖ having a high quality new product process;❖ selecting a sound new product strategy for the
business; and❖ making the necessary resource commitments.
More on each cornerstone below (see Table 1 and Fig-ure 5).
Because new product performance is a multi-facetedconcept, it was gauged via ten key metrics — see Fig-ure 3. Fortunately, these ten metrics were all inter-

BENCHMARKING NEW PRODUCT PERFORMANCE: RESULTS OF THE BEST PRACTICES STUDY
Table 1 Impact of Critical Success Factors: Correlations of Success Factors with Seven Performance Mea-sures
Met sales Met profit Per cent Impact on Impact on Profitability Overallobjectives objectives successful business’s business’s vs success
sales profits competition
1. High quality new product 0.48 0.41 0.30 0.39 0.43 0.27 0.34process
2. Sound new product 0.38 0.32 0.33 0.31 0.30strategy for the business
3. Resource commitment 0.33 0.32 0.32 0.25 0.29 0.344. Senior management 0.24 0.24 0.29 0.34 0.35 0.26 0.38
commitment to newproducts
5. Quality of project teams 0.27 0.30 0.25 0.26 0.266. Cross-functional teams 0.31 0.27 0.297. Innovative climate 0.26 0.26 0.268. Senior management 0.27
accountability
Correlations significant at the 0.05 level
linked, and hence they could be reduced to twounderlying performance dimensions:
Profitability: this captures how profitable the busi-ness’s total new product efforts are. It comprises:the profitability versus competitors and overallsuccess rating of the business’s total new producteffort; whether the total initiative meets profitobjectives; its profitability relative to spending;and the impact of the total effort on the businessunit’s profits.Impact: this second performance dimension hasless to do with profitability and more with theimpact that the total new product effort has on thebusiness. It comprises: percentage sales by newproducts achieved by the business; the impact ofnew products on both sales and profits of thebusiness; the success rate achieved; and the tech-nical success rating.
These two performance dimensions — profitabilityand impact — are used throughout the article as sum-mary performance metrics; Figure 5 shows the con-nections between various new product practices andthese two performance dimensions. Also, seven ofthe specific metrics in Figure 3 proved to be stronglyrelated to a number of practices, and these corre-lations are shown in Table 1.3
The No. 1 Cornerstone of Performance:a High Quality New Product Process
Does your business have a new product process orroad map to guide and speed new products fromidea through to launch? (This process, either explicitor implicit, includes those steps and activities in anew product project from idea to launch). A quality
European Management Journal Vol 16 No 1 February 1998 3
process is by far the no. 1 driver of performance: theprocess impacts positively and significantly on allseven performance metrics in Table 1, while the dra-matic effects of a quality process on performance areshown in the bar chart in Figure 6. Here, a high qual-ity new product process:
❖ increases success rates by 37.5 per cent;❖ improves the business’s ability to meet its sales
objectives from new products by 88 per cent; and❖ improves the meeting of profit objectives by
72 per cent;
versus businesses with a weak or poor quality newproduct process. Additionally, a high quality newproduct process is strongly linked to the business’snew product profitability (correlation of 0.416; seeFigure 5).
A high quality new product process is the strongestcommon denominator among high performancebusinesses … more powerful than having a new pro-duct strategy for the business, or even having theright resources in place (although the three criticalsuccess factors are intimately connected, and thesymbionic effect of all three acting together yields themost positive results — see Figure 4).
The topic of a new product process is particularly rel-evant, as corporate managements have turned to pro-cess re-engineering as a solution to what ails newproduct development in recent years. Often theresults of these re-engineering exercises are disap-pointing, largely because the ‘re-engineers’ did notunderstand the vital ingredients of a winning newproduct process; so they went about tweaking thecurrent process, merely documenting current prac-tices.

BENCHMARKING NEW PRODUCT PERFORMANCE: RESULTS OF THE BEST PRACTICES STUDY
How the Research Was DoneData collection was undertaken via a detailed, four page questionnaire. The questionnaire contained 48measures that captured new product practices (based on the five blocks, outlined in sidebar “A Frameworkfor the Study”). These 48 measures were gauged via 1-5 Likert-type scales with anchor phrases, and were usedto develop eight main themes or constructs (via adding sub-sets of the 48 variables together). Cronbach alphasand item-total correlations were used to check for internal consistency of these constructs. R&D spending (%of sales) and the proportion of R&D going to new products were also gauged. The questionnaire itself wasextensively pre-tested via personal interviews.
Ten performance metrics were also measured; eight of these were captured on 1-5 Likert type scales, againwith anchor phrases; two were directly measured as percentages (success rates & percentage sales by newproducts). These ten performance metrics were reduced to two underlying performance dimensions via factoranalysis (SPSSX routine; principle component analysis; varimax rotation). The drivers of performance orsuccess factors were identified by correlating the eight constructs (which captured new product practices),R&D spending versus seven of the more important performance metrics (Table 1); and also the eightconstructs (practices) and their ingredients, namely the 48 characteristics (mentioned above), versus the twoperformance dimensions (some correlations are shown in Figure 5).
Firms were selected from private lists of companies, compiled from data bases and directories of companiesknown to be active in new product development. A total of 161 business units from Europe (Germany andDenmark) and North America (US and Canada) participated in this study. Questionnaires were directed tocorporate executives responsible for their business unit’s new product development effort. All respondentshad more than three years involvement here; many had considerably more experience. Follow-up personalinterviews were conducted with particularly proficient firms to identify best practices and provided theanecdotal evidence and examples cited. For more details see [8,9,10].
The average annual sales revenue for the business units (or divisions) was US$ 562.8 MM, with no significantdifferences between North American and European firms in the sample. R&D spending as a percent of saleswas 7.5 percent of sales on average, with 71.8 percent of this going to product development. No significantdifferences emerged between North American and European firms in terms of these R&D spending patterns.The industry breakdown was: Percent Chemicals/materials 12.6 Communications products 11.9 Machinery/equipment 33.3 Electronics/electric products 1.5 Food 9.6 Automotive parts/components 3.0 Miscellaneous 8.1 Total 100.0%
Figure 2 How the Research Was Done
Consider now the ingredients of a high quality newproduct process, and the message to managers.
There is an emphasis on up-front homework — both mar-ket and technical assessments — before projects move intothe Development phase.
Too many projects progress from the idea stage rightinto Development with little or no assessment or up-front homework. Homework includes those manyactivities which occur before Development begins:initial screening; market, user and competitive stud-ies; technical and manufacturing appraisals; and fin-ancial analysis.
The results of this ‘ready, fire, aim’ approach are usu-ally disastrous. The study reveals that homework isa key ingredient in a high quality new product pro-cess, and is significantly and positively correlatedwith the two performance dimensions, namely
European Management Journal Vol 16 No 1 February 19984
profitability as well as impact of the business’s totalnew product efforts — see Figure 5.
Example: Exxon Chemical builds in two homeworkphases into their five-stage new product process. Thefirst homework stage, Preliminary Assessment, is a‘quick internal scoping of the idea … a fast study todetermine whether the project has merits for futureinvestment…’. Stage 2 is Detailed Assessment, whosespirit is ‘to develop a sound justification for talkingabout the project in the full Development stage …the chance to surface issues and important factsbefore the organization is committed to potentiallyexpensive development activities’.
A lack of homework seems to be the rule in productdevelopment, however. Indeed, the study gauged themean quality score on this ingredient to be a verymediocre 57.5 points out of 100. (Note: in the study,businesses rated their proficiencies on each of the

BENCHMARKING NEW PRODUCT PERFORMANCE: RESULTS OF THE BEST PRACTICES STUDY
Measures of New Product Performance
Success rate—the proportion of Development projects that became commercial successes.
Percentage of sales by new products— thepercentage of the business’s sales accounted for by
new products introduced within the last three years.
Profitability relative to spending—how profitable the business unit’s total new product efforts are, relative to the amount spent on them.
Technical success rating—how successful the total effort is from a technical/technological perspective.
Sales impact—how strong an impact the total new product effort has on the business unit’s sales revenues or turnover.
Profit impact—how strong an impact the effort has on the business unit’s annual profits.
Meeting sales objectives—the extent to which the total new product effort meets the business unit’s sales objectives for new products.
Meeting profit objectives—the extent to which it meets the business’s profit objectives.
Profitability versus competitors—how profitable the total new product effort is relative to competitors.
Overall success—all things considered, how successful the business unit’s total new product efforts are when compared to competitors.
Figure 3 Measures of New Product Performance
Figure 4 The New Product Performance Triangle and the Three Cornerstones of Performance
European Management Journal Vol 16 No 1 February 1998 5
performance drivers on a 0–100 point scale; here 100was ‘excellent’ and 0 meant ‘very poor’; see Figure 5for ratings).
Message. Build a detailed homework stage into yournew product process — a homework phase whichresults in a business case based on fact rather thanspeculation. Insist that solid up-front homework beundertaken, and ensure that no significant projectenters Development without this vital homework —see Figure 7 for an insight into what the top per-formers do.
A high quality new product process includes sharp, earlyproduct definition, before Development work begins.
A failure to define the product — its target market; theconcept, benefits and positioning; and its require-ments, features and specs — before Developmentbegins is a major cause of both new product failureand serious delays in time-to-market (Cooper, 1993,1994, 1995; Crawford, 1984). In spite of the fact thatearly product definition is consistently cited as a key tosuccess, firms continue to perform poorly here: thestudy reveals a modest mean score for the productdefinition step of 66.8 points out of 100 — hardly stel-lar performance (Figure 5). More importantly, sharp,early product definition is significantly correlatedwith both the profitability and the impact of the busi-ness’s total new product efforts. Some companies,such as Hewlett Packard, have placed a majoremphasis in their Phase-Review Process on gettingthe product definition pinned down before a formalDevelopment project is approved. This definition isbased on facts, rather than hearsay and speculation,hence the need for a solid up-front homework phase.

BENCHMARKING NEW PRODUCT PERFORMANCE: RESULTS OF THE BEST PRACTICES STUDY
Figure 5 Impact and Ratings of Major Success Factors and Ingredients: Correlations with Two PerformanceMeasures
Figure 6 Impact of High Quality New Product Process on Performance
Message. Sharp, early product definition follows fromsolid homework (above). This definition includes:
❖ the target market;❖ the product concept, benefits to be delivered, and
positioning strategy; and
European Management Journal Vol 16 No 1 February 19986
❖ the product’s requirements and high level specifi-cations.
Make it a rule: no project enters Development with-out a product definition, agreed to by the projectteam and signed off by senior management.

BENCHMARKING NEW PRODUCT PERFORMANCE: RESULTS OF THE BEST PRACTICES STUDY
Solid Up-Front HomeworkUp-front homework, an often-missing ingredient in new product projects, means building in a “firstcut” or preliminary investigation stage, involving:
1. A preliminary market assessment: a quick scoping of the marketplace to assess market existence,probable market size, and expected product definition; this is largely detective work: desk research;accessing available public and commercial databases, reports, articles, etc.; utilizing in-house informationand people; contacting a few lead users.
2. A preliminary technical assessment: a quick technical appraisal to propose a technical solution, mapout a probable route, and assess technical costs, times and risks; this work is a largely conceptualtechnical literature search; utilizing in-house technical expertise; brainstorming and creative problemsolving sessions; reviewing competitive product solutions; drawing on technical gurus outside the firm.
3. A preliminary business assessment: a quick financial assessment (eg, payback period) based on veryrough estimates of sales, costs and investment required; a cursory legal assessment; and a quick riskassessment.
For larger and more complex projects, many firms build in a second and more detailed homeworkphase, namely a detailed investigation stage, prior to Development. This second stage often includes:
1. Detailed market studies and market research, such as ..... user needs-and-wants studies: entails personal interviews with prospective customers and users to
determine customer needs, wants and preferences; product performance requirements; and a definition of the customer’s wish list. value-in-use studies: assessment of the customer’s economics–what economic value the product will
bring to the customer (this often involves an in-depth look at the customer’s use system, the current solution, and various cost drivers).competitive analysis: a detailed look at competitors’ products, pricing, bases of competing, and
performance (eg, share and profitability).concept tests: a testing of the proposed product (in concept or protocept form) to gauge interest, liking
and purchase intent (and an estimate of expected sales); also price sensitivity.
2.Detailed technical assessment: a more thorough technical activity to prove technical feasibility, identifythe likely technical solution, deal with technical risks, assess manufacturability (route, costs and probablecapital requirements), and deal with safety, health, legal and regulatory issues. This usually involvessome physical technical work, such as lab work, modelling,or the development of a crude working model or protocept.
3. Building the Business Case: this defines the business proposition and product, provides the justificationfor the project (the economic and business rationale for the new product), and maps out the action planthrough to Launch. Tasks here include detailed financial analysis and business risk assessment.
Figure 7 Solid Up-Front Homework
The new product process emphasizes a strong marketorientation, and builds in the voice of the customerthroughout.
Successful business units, and teams that drive win-ning new product projects pay special attention tothe voice of the customer. A process which emphas-izes the customer and marketplace via market stud-ies, market research, concept tests, competitive analy-sis, customer field trials etc., is significantlycorrelated with profitability of the business’s totalnew product efforts (Figure 5).
Example. Fluke Corporation is a major US manufac-turer of hand-held instruments. In their new productprocess, potential customers ‘see’ the instrumentbefore it even exists. The description and specifi-cations of the proposed product are developed, anda dummy brochure is produced — a brochure that isvery close to the final, four colors and all. The argu-ment is that it is much cheaper to develop a brochure
European Management Journal Vol 16 No 1 February 1998 7
than to develop a product! Prospective users areshown the proposed product (in concept form in thebrochure), asked to critique it, and then to indicatetheir liking and purchase intent. In this way, Fluketests the proposed product even before Develop-ment begins!
A market orientation and customer focus is notice-ably lacking in many businesses’ new product pro-jects. The marketing actions are among the mostweakly executed in the entire new product process,and are rated a mediocre 61 points out of 100 (Figure5). Message. Spare no effort in building the customeror user into your new product process. This meansright from the beginning of the process, namely ide-ation: focus on the customer to identify needs andwants and to solicit new product ideas. Next, the cus-tomer must be an input into product design, and notjust an after-the-fact check that the design is satisfac-tory. The customer is also an integral facet of the pro-ject during the Development phase: use multiple iter-

BENCHMARKING NEW PRODUCT PERFORMANCE: RESULTS OF THE BEST PRACTICES STUDY
ations of rapid-prototype-and-tests, so that by theend of Development, there are no surprises. Finally,as the project moves towards commercialization,ensure that rigorous customer tests (perhaps eventest markets or trial sells) are built into your process,along with a properly-resourced, well-plannedlaunch phase.
There are tough Go/Kill decision points in the process,where projects really do get killed.
Projects tend to get a life of their own! In too manycompanies investigated, projects moved too far downthe process without serious scrutiny: once a projectbegan, there was very little chance that it would everbe killed — the process was more like a tunnel ratherthan a funnel. It was only as the project approachedcommercialization that the hard truths were recog-nized … that the market was not quite as large asexpected; or that manufacturing costs were higherthan anticipated; and so on. The lack of toughGo/Kill decision points meant: too many productfailures; resources wasted on the wrong projects; anda lack of focus. The result was many marginal pro-jects underway, while the truly meritorious projectswere starved.
A new product process that features tough Go/Killdecisions is a critical but often missing successingredient. Having tough Go/Kill decisions isstrongly correlated with the profitabilities of busi-nesses’ new product efforts (Figure 5). Sadly, thisingredient — tough Go/Kill decision points — is theweakest ingredient of all process ingredients studied,with a very poor score of 49.0 points out of 100 acrossall businesses.
What progressive firms, such as Alcoa and Corningin the US have done, is to build tough Go/Killdecision points into their process — four or fivedecision nodes or ‘gates’ in the new product process,where projects are thoroughly reviewed against rig-orous business criteria, projects are prioritized, andsome projects actually do get killed!
Message. A gating mechanism, featuring a series ofrigorous Go/Kill decision points or ‘gates’ through-out the process, is essential. The goal is to move froma tunnelling process, where projects are rarely killed,to a funneling process, where mediocre projects areculled out at each gate and resources are focused onthe truly meritorious projects.
There is a focus on quality of execution, where activities innew product projects are carried out in a quality fashion.
Quality of execution of key tasks and activitiesthroughout the new product process is emphasizedin top performing businesses. This was one of themost important ingredients of a quality process, withstrong correlations to profitability of the businessunit’s total new product efforts, as well a significant
European Management Journal Vol 16 No 1 February 19988
correlation with impact (Figure 5). In spite of itsimportance, the mean score for quality of execution isa modest 64.5 out of 100 across all businesses studied.
Some companies, such as Northern Telecom, had re-engineered their product development processes inorder to improve the quality and efficiency of theirproduct development efforts. They have incorpor-ated in their processes tough reviews and decisionpoints, where the quality of work done in the pre-vious stage or phase is rigorously scrutinized. Projectteams and leaders know what rigor is expected ofthem, and hence set their own quality or action stan-dards higher. This emphasis on quality-of-executionin many firms came about after internal studiesrevealed that too many new product projects sufferedfrom weak, inconsistent work, some of the mostdeficient areas being the market-related tasks(Cooper, 1993, 1994, 1995; Peters, 1988).
Message. When overhauling your new product pro-cess, make every effort to build in best practices atevery stage; focus on quality of execution through-out; and set high standards at gate reviews, wheredeliverables are scrutinized, with gates becoming thequality control check points in the innovation pro-cess.
Some managements become concerned that emphas-izing quality of execution adds time to projects. Otherresearch shows this is not true: indeed, quality ofexecution is one of the key drivers of cycle timereduction (Cooper, 1993, 1994, 1995; Peters, 1988).Remember: no one is advocating postponingdecisions or leaving projects in a queue awaiting per-fect information; the message is that taking the timeto do a quality job saves time later. Make ‘doing itright the first time’ a rule in your new product pro-jects!
The new product process is complete or thorough, whereevery needed activity is carried out — no hasty corner-cut-ting.
This ingredient follows closely on the one above.Many companies have discovered that not only is thequality of work lacking, but in some cases, the workis lacking altogether. Here, the mean score is a verymediocre 54.3 points out of 100. That is, key tasks,such as market analysis, business assessment, andcustomer or user research, are simply not done (orleft until far too late in the process). A thorough andcomplete process is critical to success, however. Com-pleteness is correlated significantly with profitabilityof businesses’ new product efforts, as shown in Fig-ure 5.
The deficiency here has caused some companies toredesign their processes, building in these tasks at theappropriate location in the process. At Reckitt andColman, the UK consumer goods firm, deliverableshave been defined a priori for each decision-point or

BENCHMARKING NEW PRODUCT PERFORMANCE: RESULTS OF THE BEST PRACTICES STUDY
gate review: these deliverables specify what isrequired at a given point in the project, and hencedetermine what work or tasks must be undertakenwithin a given stage.
Message. When designing your new product process,error on the side of thoroughness. Flexibility andshort-cuts can be built in, especially for lower riskprojects and when the risks of omission are under-stood. But for significant and higher risk projects,adopt and adhere to a disciplined, thorough new pro-duct process.
The new product process is flexible — where stages anddecision points can be skipped or combined, as dictated bythe nature and risk of the project.
One pitfall some firms encounter when they do re-engineer their product development process is thefailure to build in flexibility. Instead of being a tem-plate or road-map, the ‘formal process’ becomes astraightjacket beset with bureaucracy (the studyreveals some problems here: a mean ‘flexibility score’of 63.0 points out of 100). Note that process flexibilityis significantly correlated with positive profits(Figure 5). By contrast, companies such as Procterand Gamble specify in their new product process thatflexibility is key: that certain steps and activities canbe omitted, and that the beginnings and ends of suc-ceeding phases overlapped ‘provided that we under-stand the risks involved and have agreed at the pre-vious decision checkpoint’.4
Message. When overhauling your new product pro-cess, be sure to provide for flexibility. Remember, thenew product process is a risk management model: it issimply a series of steps designed to gather infor-mation to reduce uncertainty, and thereby managerisk. Thus, strict adherence to every stage, step,activity and gate in the ‘formal process’ depends onthe risk level of the project.
In a flexible process, stages can be collapsed, gatescombined, and long lead-time activities movedahead. The point is that these decisions to streamlinethe process are made consciously, ahead of time, andat gate decision points, rather than on an ad hoc, spur-of-the-moment basis. And they are made for the rightreasons, where the risks of streamlining (e.g. omittinga stage or activity) are weighed against the costs.
A high quality new product process clearly pays off.Business units which boast proficient new productprocesses — ones that incorporate the seven ingredi-ents highlighted above — are rewarded withsuperior performance: they outscore the other busi-nesses on seven performance metrics, ranging fromsuccess rates to profitability of the total new producteffort. In particular, these businesses’ total new pro-duct efforts meet sales and profit objectives more so,and have a strong positive impact on business unitprofits.
European Management Journal Vol 16 No 1 February 1998 9
A word of caution here. The mere existence of a for-mal product development process has absolutely noeffect on performance, according to the study: there isno correlation at all between merely having a formalprocess and performance results. The message is this:those companies who mistakenly believe they can ‘gothrough the motions’ and re-engineer their new pro-duct processes (usually amounting to documentingwhat they are already doing!) are in for a big disap-pointment. Having a process does not seem to mat-ter; rather it is the quality and nature of that process —building in best practices — that really drives per-formance.
Cornerstone No. 2: a Clear and Well-Communicated New Product Strategyfor the Business
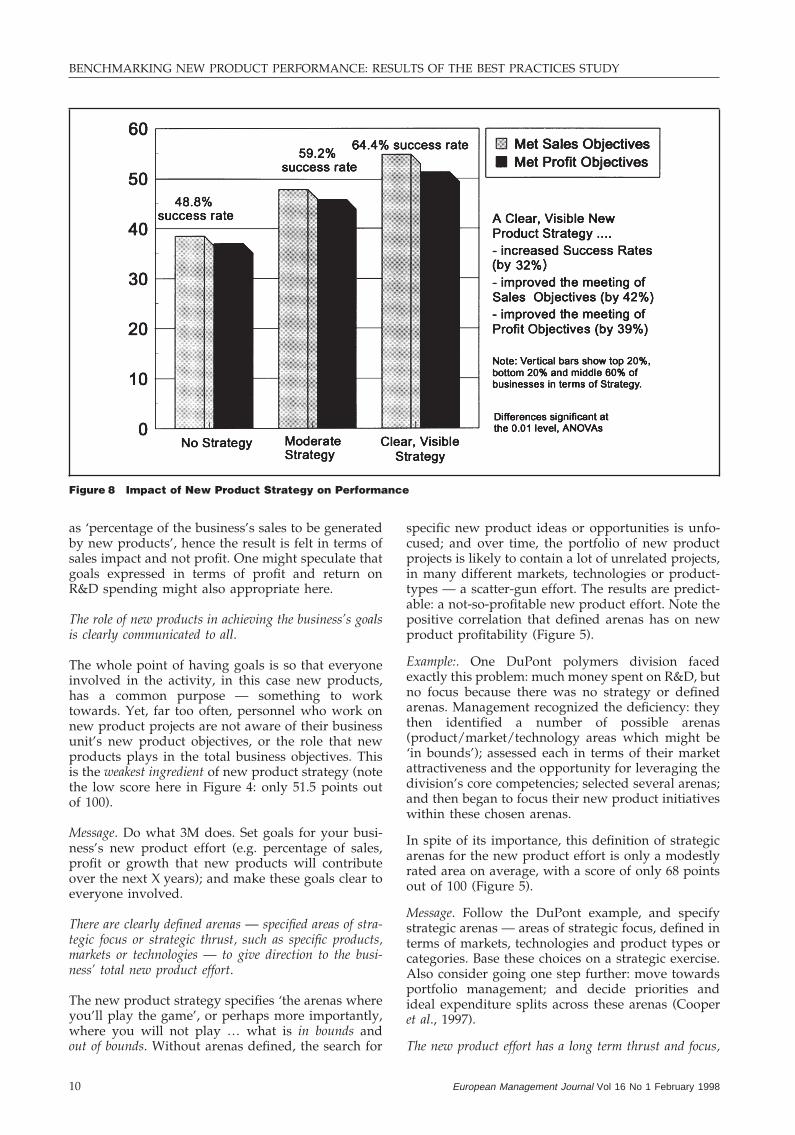
Do you have a clearly articulated new product strat-egy for your business? If so, you are in the minority;but businesses that boast such a strategy do better,according to the benchmarking results. Indeed, hav-ing a new product strategy — a clear and visibleone — is the no. 2 driver of a business’s new productperformance. Strategy is closely linked to five of theseven performance metrics (see Table 1), and in parti-cular, with meeting company sales objectives via newproducts. Businesses that have clear and visible newproduct strategies fare much better than those foundlacking here: 32 per cent higher new product successrates; meet sales objectives more so (42 per centbetter); and meet profit objectives more so (39 percent better) — see Figure 8 for detailed results. Hav-ing a solid new product strategy is also correlatedwith both the impact and profitability of the busi-ness’s total new product efforts (Figure 5).
The four main ingredients of a positive new productstrategy follow.
There are goals or objectives for the business’s total newproduct efforts; e.g. what sales, profits, etc. new productswill contribute to the business goal.
This ingredient of strategy — having clear goals —would seem to be fairly basic. What surprised us ishow many businesses lack clear, written goals fortheir overall new product efforts. Note the mediocremean scores in Figure 5: only 58.8 points out of 100here. By contrast, leading firms, such as 3M, makenew product goals such as ‘30% of our division’ssales or turnover will come from new products intro-duced over the next 3 years’ an explicit part of everydivision’s business goals.
Ironically having new product goals seemed to drivethe impact of the business’ new product effort, andnot so much its profitability. This is perhaps a reflec-tion of the fact that these goals are most often stated
BENCHMARKING NEW PRODUCT PERFORMANCE: RESULTS OF THE BEST PRACTICES STUDY
Figure 8 Impact of New Product Strategy on Performance
as ‘percentage of the business’s sales to be generatedby new products’, hence the result is felt in terms ofsales impact and not profit. One might speculate thatgoals expressed in terms of profit and return onR&D spending might also appropriate here.
The role of new products in achieving the business’s goalsis clearly communicated to all.
The whole point of having goals is so that everyoneinvolved in the activity, in this case new products,has a common purpose — something to worktowards. Yet, far too often, personnel who work onnew product projects are not aware of their businessunit’s new product objectives, or the role that newproducts plays in the total business objectives. Thisis the weakest ingredient of new product strategy (notethe low score here in Figure 4: only 51.5 points outof 100).
Message. Do what 3M does. Set goals for your busi-ness’s new product effort (e.g. percentage of sales,profit or growth that new products will contributeover the next X years); and make these goals clear toeveryone involved.
There are clearly defined arenas — specified areas of stra-tegic focus or strategic thrust, such as specific products,markets or technologies — to give direction to the busi-ness’ total new product effort.
The new product strategy specifies ‘the arenas whereyou’ll play the game’, or perhaps more importantly,where you will not play … what is in bounds andout of bounds. Without arenas defined, the search for
European Management Journal Vol 16 No 1 February 199810
specific new product ideas or opportunities is unfo-cused; and over time, the portfolio of new productprojects is likely to contain a lot of unrelated projects,in many different markets, technologies or product-types — a scatter-gun effort. The results are predict-able: a not-so-profitable new product effort. Note thepositive correlation that defined arenas has on newproduct profitability (Figure 5).
Example:. One DuPont polymers division facedexactly this problem: much money spent on R&D, butno focus because there was no strategy or definedarenas. Management recognized the deficiency: theythen identified a number of possible arenas(product/market/technology areas which might be‘in bounds’); assessed each in terms of their marketattractiveness and the opportunity for leveraging thedivision’s core competencies; selected several arenas;and then began to focus their new product initiativeswithin these chosen arenas.
In spite of its importance, this definition of strategicarenas for the new product effort is only a modestlyrated area on average, with a score of only 68 pointsout of 100 (Figure 5).
Message. Follow the DuPont example, and specifystrategic arenas — areas of strategic focus, defined interms of markets, technologies and product types orcategories. Base these choices on a strategic exercise.Also consider going one step further: move towardsportfolio management; and decide priorities andideal expenditure splits across these arenas (Cooperet al., 1997).
The new product effort has a long term thrust and focus,
BENCHMARKING NEW PRODUCT PERFORMANCE: RESULTS OF THE BEST PRACTICES STUDY
including some longer term projects (as opposed to justshort term, incremental projects).
This is a fairly weak ingredient of the four strategyingredients, with a score of only 56.5 out of 100 acrossall businesses. The short time horizon of businesses’new product efforts has been a criticism widelyvoiced. Ironically, this one ingredient is the mostimportant of the four strategy ingredients, and is sig-nificantly linked to four important performance met-rics: meeting sales and profit objectives, and theimpact of the program on both company sales andprofits, as well as to the two performance dimen-sions, new product profitability and impact.
Message. Consider your total portfolio of new productprojects, particularly in terms of long term versusshort term; high risk versus low risk; and projectmagnitude (platforms, new products, extensions andmodifications). Employ portfolio management toarrive at the appropriate balance of projects (Cooperet al., 1997).
Doing business without strategy is like a ship with-out a rudder. This benchmarking study’s results sup-ported this adage. Clearly those businesses that lackgoals for their total new product effort, where arenasor areas of strategic thrust have not been defined,where the strategy and projects are short term in nat-ure, and where the strategy is not well-communi-cated to all are at a decided performance disadvan-tage.
Cornerstone No. 3: ResourceCommitment
There is no free lunch in product innovation! Somecompanies in the study had cut product developmentefforts — R&D and marketing money and staff — tothe bone in an attempt to produce short term profits.The longer term effects are very negative however.Resource commitment is virtually tied for secondplace as a driver of superior performance, and is sig-nificantly linked to six of the seven performance met-rics in Table 1. The bar chart in Figure 9 reveals spe-cific impacts of resource commitment: here,businesses with strong resource commitment have a40 per cent higher new product success rate; andmeeting sales and profit objectives is 46 per cent bet-ter than those with weak resource commitment.Resource commitment is also significantly correlatedwith both the impact and the profitability of the busi-ness’s new product efforts (Figure 5).
There are three main ingredients in strong resourcecommitment as follows.
Senior management has devoted the necessary resources toachieve the business unit’s new product objectives.
European Management Journal Vol 16 No 1 February 1998 11
In too many cases we witnessed, management hadundertaken a strategic exercise, where new productgoals, strategy and process were defined. But thegoals, strategy and process were not backed up withneeded resources, and so the effort floundered. Notethat having the necessary resources in place is corre-lated with both the profitability and the impact of thebusiness’s total new product effort (Figure 5).
A lack of resources continues to plague new productprojects. Consider the low resource availability scoresin Figure 5 for all three ingredients of resource com-mitment (scores of between 50 and 60 points out of100). This deficiency was often the culprit underlyingpoor quality of execution: there simply were not thenecessary people in place, nor the time available todo a quality job. Therefore, corners were cut, activi-ties were done in haste, tasks were left out … andthe results were predicable.
Message. Resource commitment to new productsmust be aligned with the business’s new productobjectives.
R &D budgets are adequate to achieve the stated objectives.
This is just another facet of the resource question, butwith a specific focus on technical budgets. But R&Dbudgets are clearly inadequate, given the objectives,with an average rating of only 50.3 points out of 100(see Figure 5).
Example. One medium-sized firm in the study in theinstrument business had a clearly articulated goal ofbeing the ‘number one firm in our industry in termsof product leadership and innovation’. A closer lookat R&D spending revealed that the firm spent abouthalf the industry average on R&D as a percentage ofsales. There is a serious disconnect between statedgoals and spending levels! This type of wishful think-ing was far too prevalent among the businesses stud-ied.
R&D spending that went to product developmentwas also measured in the study (as a percentage ofthe business’s sales). The mean value was 5.66 percent.5 R&D spending as a percentage of turnover pro-ves to be the strongest determinant of the impact of thetotal new product effort on the business’s sales andprofits (correlation of 0.395 — see Figure 5).
Message. If more sales from new products is yourgoal, then the most obvious lever you should pull isyour R&D spending as a percentage of sales. Thereis not a one-to-one relationship between input andoutput here (between spending and sales results), butR&D spending is the strongest single driver of newproduct impact! But a word of caution: R&D spend-ing has no significant effect whatsoever on the profit-ability of the business’ new product efforts.
The necessary people are in place, and their time is freedup for new products.

BENCHMARKING NEW PRODUCT PERFORMANCE: RESULTS OF THE BEST PRACTICES STUDY
Figure 9 Impact of Resource Commitment on Performance
Projects are approved, and people are assigned tothem. The problem is: the assigned people are oftenexpected to work on another six projects; or in thecase of Marketing and Manufacturing people, to do‘their real job’ in addition to the new product project,and time is rarely freed-up to enable these people toparticipate in new product projects as fully as theyshould be. The resources are there in theory, but notin practice! This lack of people is highlighted by thepoor score achieved across all businesses — a mere50.3 points out of 100 — the worst of all resourceareas.
Examples. At Tele-Danmark, the Danish telephonesystem, when projects are approved at gates, so arethe resources. That is, not only is the project given aGo decision, but management commits the necessarypeople, including specific release times to key peopleto work on the project. Another Danish firm, Ferro-san (health care products) is emphasizing quality ofexecution throughout its stage-gate new product pro-cess. But management recognizes that the key here isto ensure that the right resources are in place — thatpeople are assigned to projects, and that this commit-ment is kept.
Having a solid new product process (cornerstone no.1) is only part of the answer. Unless the process isproperly resourced with people, time, money — andthe commitments kept — then do not expect stellarperformance. Note that in another facet of theresearch, senior management scored near top marksfor their stated or verbal commitment to new pro-ducts — 75.5 points out of 100 (results not shown).But, as witnessed by their resource commitment (the
European Management Journal Vol 16 No 1 February 199812
three ingredients listed above), senior managementclearly is not walking the talk!
The Connections between Process,Strategy and Resources
An obvious question is: are these three cornerstonesof new product performance — process, strategy andresources — themselves interconnected? The answeris yes, and in quite a strong way. Here are the corre-lations (all are significant at the 0.001 level):
❖ The strongest link is between strategy andresources (correlation of 0.474). That is, businessesthat have an articulated and visible new productstrategy also tend to have put in place the neces-sary product development resources.
❖ Equally as strong is the link between strategy andprocess (correlation of 0.472). Businesses that havea clear, articulated new product strategy also havein place a high quality new product process. Recallthat process is the number one success factor.
❖ Finally there is a fairly strong link between avail-ability of resources and process: that is, businessesthat have a quality new product process also haveadequate resources to support the process(correlation of 0.326). Or one might speculate thatbecause there are the needed resources in place,then the new product process works better!
One cannot draw conclusions here about what causeswhat: is it strategy that leads to a proficient process,

BENCHMARKING NEW PRODUCT PERFORMANCE: RESULTS OF THE BEST PRACTICES STUDY
or the other way around? The fact remains, however,that these three cornerstones of performance — ahigh quality new product process, adequateresources, and a new product strategy for the busi-ness — acting alone and in concert are the principaldrivers of new product performance.
Other Success Factors
A number of other success factors were also ident-ified in the study. These are less important than thethree cornerstones above, but nonetheless do have animpact and are indeed actionable.
Senior Management Commitment
Businesses with greater senior management commit-ment to new products boast a product innovationeffort that has a high impact on the business’s salesand profits; that meets the business unit’s sales andprofit objectives; and that is profitable and has highsuccess rates (Table 1).
What are the characteristics of these high commit-ment managements? These are businesses where:
❖ Senior management is strongly committed to newproducts and product development. Overall thisis a positively rated ingredient (score of 75.56 outof 100).
❖ Management has committed the necessary resourcesto achieve the business’s new product goals (aweaker average score here: 60.3 out of 100).
❖ Senior management is closely involved in the projectGo/Kill, new product spending and resource allo-cation decisions — they have a central role in thenew product project review process (positivescores on this ingredient: 76.0 out of 100).
Message. Start leading your business’s new producteffort. This means going beyond just making a verbalcommitment. It requires a firm commitment ofresources, and the active involvement of the leader-ship team of the business in the allocation ofresources to projects: project selection, prioritizationand portfolio management.
High Quality and Cross-FunctionalProject Teams
How projects are organized in your business has abearing on new product profitability and impact,according to the study (Table 1). The way projectsare organized boils down to two distinct factors: thefirst captures the quality of the project team; the
European Management Journal Vol 16 No 1 February 1998 13
second, whether the project team is a true cross-func-tional team or not.
Having a high quality project team means:
❖ The team leader is dedicated to one project at a time(as opposed to trying to lead many projects, orhaving myriad other assignments). This is a parti-cularly weak ingredient, scoring a dismal 34.8points out of 100. Simply stated, team leaders arespread too thinly across too many projects or havetoo many other duties to run projects effectively!
❖ High quality teams interact and communicate welland often, with frequent project up-date meetings,progress reviews, and problem resolution ses-sions. The best teams had short but weekly meet-ings to ensure that the entire team was up-to-speed. Teams receive mediocre ratings here, onaverage (57.3 points out of 100).
❖ Decisions made by outsider groups or people(outside the team) are handled quickly andefficiently. This is usually the result of proficientteam actions: for example, the team is able to dowhatever internal marketing, communication andpersuasion are necessary to get outsiders on-boardand to deliver quick, efficient decisions. Here themean team scores are also mediocre (52.3 pointsout of 100).
Business units that feature good quality projectteams, as defined above, have positive results in anumber of areas: higher new product success rates,a higher impact total new product effort, higherprofitability versus competitors, meet sales new pro-duct objectives, and are rated more successful over-all — see Table 1.
Employing true cross-functional teams means:
❖ All projects have an assigned team of players. That is,people are specifically assigned as team members.Here businesses fare modestly well, with a meanscore of 67.2 points out of 100. Many firms haveheeded the call for formally designating projectteam members; but in others, it was not clear justwho was on the project team, and who was not!
❖ These assigned players are a cross-functionalteam — from R&D, Marketing, Manufacturing,Engineering, etc. Businesses score quite positivelyhere (72.8 points out of 100).
❖ All significant projects have a defined and account-able team leader — a person who is responsible forprogressing the project. Businesses also do well onthis success ingredient, scoring a positive 75.5points out of 100.
❖ Project leaders are responsible for the project frombeginning to end (as opposed to being responsiblefor only one phase of a project; or having projectleadership change hands many times during aproject’s life). Here business units receive amediocre score on average: 55.3 points out of 100.
BENCHMARKING NEW PRODUCT PERFORMANCE: RESULTS OF THE BEST PRACTICES STUDY
Businesses that organize new product projects viatrue cross-functional teams, as defined above, also dobetter: the total new product effort meets the busi-ness’s sales objectives; it has a strong positive impacton the business’s profits; and the effort meets thebusiness’s profit objectives (Table 1).
Message. When rethinking your business’s approachto new products, do not forget the project team! Eventhe best designed process, the most enlightened strat-egy and deploying the best resources prove futile ifthere is no team and captain, or if they do not func-tion as a true team. Ensure that every significant pro-ject has a defined and accountable team leader,accountable from beginning of project to end; do notspread the leader too thin — make him/her a dedi-cated leader. Every team should have assigned play-ers from various essential functions, with agreedrelease times for the project. Also the team membersshould be in constant contact with each other — fre-quent (weekly) but short project up-dates.
An Innovative Culture and Climate
The climate for innovation within the business is asuccess factor, but perhaps not as strong as one mighthave expected (Table 1). Sadly, the average scoreshere are among the lowest of any success factors. Here,positive climates are ones where:
❖ There is a new product idea scheme within the busi-ness, which solicits ideas from all employees. Busi-nesses score very poorly here, with a mean scoreof only 34.5 out of 100.
❖ Technical people are given free time, scouting timeor time off to work on projects of their own choice.Typically this is between 10 and 20 per cent of thework week. Here there is some evidence that,while some firms make this option available totheir technical employees, relatively fewemployees take advantage of the offer. The meanscore here is a dismal 25.8 out of 100.
❖ Resources are made available to employees so thatthey can informally progress their own projects orundertake creative work of their own choice. Suchresources often include seed money for technicalresearch, bootstrapping accounts to fund unap-proved projects, etc. Scores here too are very low:34.3 out of 100.
❖ Skunk works or teams working on unofficial projectsare encouraged. The mean score here is surpris-ingly high at 61.8 out of 100. One might speculatethat this unexpectedly high score (relative to theother three ingredients which comprise culture)may be more a reflection of weak project evalu-ation and unenforced Go/Kill decisions than anyconscious attempt to foster a creative climate!
European Management Journal Vol 16 No 1 February 199814
Senior Management Accountability
This final success factor has relatively little impact onall but one performance measure, namely the factthat the total new product effort meets sales objec-tives (Table 1). Management accountability capturesthe degree to which new product performance ismeasured, and senior management is held account-able for the results. Scores are very low on all ingredi-ents of management accountability. Consider eachingredient in greater detail.
❖ New product performance is a part of senior man-agement’s personal performance objectives in thetypical business studied (a poor score of 43.5points out of 100).
❖ Senior management’s compensation or bonus schemeis firmly tied to the business’s new product per-formance. Here the lowest score is achieved of allpractices measured — only 20.5 out of 100 points.
❖ The performance results of the business’s total newproduct effort are actually measured (e.g. percent-age of annual sales generated by new products; orsuccess, failure and kill rate percentages). Eventhis ingredient was given a low score: only 39.3points out of 100.
The evidence suggests that not only is new productperformance not closely linked to senior manage-ment’s compensation scheme, or even an integralfacet of senior management’s annual and perform-ance objectives, but such new product performanceresults are likely not even measured at all for a greatmany firms.
Prescriptions for Management
Overhaul Your New Product Process
An overhaul of the product innovation process is onesolution to the deficiencies identified in this study.Facing increased pressure to reduce the cycle timeyet improve their new product success rates, manycompanies have re-designed their new product pro-cesses and are looking to Stage-GateTM methods tomanage, direct and control their product innovationefforts. That is, they have developed a systematicprocess — a blueprint or road-map — for moving anew product project through the various stages andsteps from idea to launch (Figure 10). But mostimportantly, they have built into their road-map themany lessons for new product success — including thekey points highlighted above.
Develop a New Product Strategy
What is surprising is how deficient an area thisproved to be in too many businesses. The new pro-

BENCHMARKING NEW PRODUCT PERFORMANCE: RESULTS OF THE BEST PRACTICES STUDY
Stage-GateTM Processes: A SynopsisA stage-gate process is a template or roadmap for driving newproduct projects from idea through to launch and beyond (see[3]). It breaks the product innovation process into stagestypically five or six. Each stage is made up of a set ofprescribed or mandated parallel, cross-functional activities, andbuilds in best practices. Between stages are Go/Kill decisionpoints or "gates": these gates open or close the door forprojects to move to the next stage, and weed out the mediocreprojects. A funnelling effect is the result.
Stage-GateTM processes build in the critical success factors:much more emphasis on the homework or pre-developmentactivities (Stages 1 & 2).a multidisciplinary and cross-functional process, builtaround empowered, true cross-functional teams.a strong market orientation, with marketing inputs at everystage of the process, but particularly in Stages 1 & 2.a product-definition step built into the process at Stage 2
before Development begins in Stage 3. more focus via tough Go/Kill decision points in the form of the five gates. a strong emphasis on quality of execution throughout. a flexible process designed for speed, but without loss of discipline.
Stage-GateTM processes are employed by many firms, includingExxon Chemicals, Reckitt & Colman, ICI, Corning, Courtalds,Polaroid, DuPont, Kodak, Procter & Gamble, NorthernTelecom, Lego, Danfoss, GTE, Nynex, Tele-Danmark,Carlsberg, Guinness, and Royal Bank of Canada.
Figure 10 Stage-GateTM Processes: A Synopsis
duct strategy and goals had not been defined; oftenthey were not communicated; and the strategy wastoo short term. The following points summarize whatis meant by developing a new product strategy.
❖ Your business’s new product effort should haveclear goals. For example, what percentage of yourbusiness’s sales or turnover will come from newproducts over the next 5 years? Or what percent-age or growth in sales and profits will be derivedfrom new products in the next decade? And howmany major and minor new product launchesdoes this translate into?
❖ The role of your business’s new product effort inachieving overall business unit goals should beclearly articulated. That is, the new product effortmust be clearly linked to the business strategyand goals.
❖ Arenas must be defined: that is, where do you want
European Management Journal Vol 16 No 1 February 1998 15
to play the game? This means defining the areasof strategic thrust — those product, market andtechnology areas that you want your new producteffort to focus on.
❖ Provide a longer term thrust to your product inno-vation effort. Make sure that at least some of theprojects in your portfolio are visionary and longerterm; and that not all are the ‘quick hits’ and‘short passes’.
Put the Resources in Place
The quest for short term profitability has drivenmany firms to cut back new product resources toofar. This ‘doing more with less’ philosophy is fine upto a point; but when potential new product winnersare starved for resources, and when the success ofsuch projects is jeopardized by insufficient fundingor people, the cut-backs become dysfunctional. Nobusiness ever shrank its way to greatness! Look atthe hard evidence: appropriate and adequateresources — R&D budgets, resources and people —are one of the top three drivers of new product per-formance at the business unit level.
The Leadership Team Must Lead
Senior management’s role is to set the stage for newproduct development. Developing strategy is onerole; committing the necessary resources is another.A third role is active participation in the new productdecision-making process. Specifically, managementmust be at the gates or Go/Kill decision points in thenew product process, actively reviewing projects andmaking timely resource commitments to these pro-jects. Portfolio management, resource allocation andproject prioritization is another but related manage-ment role. What management must guard against,however, is micro-managing projects. Rule: it issenior management’s job to decide what projectsreceive funding; but let the project team figure outhow to actually do the project.
Get the Project Teams Working Right
Emphasize a quality, cross-functional team approach inyour business. Most of the businesses studied alreadyseemed to be using cross-functional new productproject teams. But some ingredients of the best per-formers give clues regarding how to make these pro-ject teams even more effective.
❖ Ensure that every project has a clearly identifiedand accountable team leader.
❖ Do not keep changing leaders of projects. Ideallymaintain the one leader from beginning to end of

BENCHMARKING NEW PRODUCT PERFORMANCE: RESULTS OF THE BEST PRACTICES STUDY
the project (and not just a leader ‘on the field forone or a few plays’!).
❖ Strive for dedicated team leaders (where this projectis his/her full time and only job). As Tom Peterssuggested, there is no such thing as part-time pas-sion! (Peters, 1988).
❖ Make sure that team players are assigned to the pro-ject and team; that they are given release time forthis assignment; and that this assignment is com-municated to all.
❖ Encourage frequent communication among teammembers: for example, weekly up-date or statusmeetings, where the progress of the project isreviewed, and problems resolved.
Foster an Innovative Climate and Culture
There are many ways to do this, but some of theapproaches the study identified that are linked topositive performance include:
❖ introducing an idea solicitation scheme in thebusiness, where new product ideas can be submit-ted by any employee, complete with rewardsand recognition;
❖ providing free time or scouting time for technicalemployees — 10–20 per cent of their week — sothat they can work on creative projects of theirown choice;
❖ providing seed money or bootstrapping funds tohelp support creative work (this work was oftenundertaken by employees using their scoutingtime); and
❖ allowing the occasional project to be worked onunofficially by a small team of players.
Increase Senior Management Accountability
This last factor is almost non-existent among thebusinesses studied. And its low ratings — the factthat it is rarely practised — may be one reason whythe factor did not emerge as a strong success factor.Nonetheless, management accountability doesappear to impact positively in terms of meeting thebusiness’ new product sales objectives. Moreoveranecdotal evidence gathered during the study sug-gests that the few businesses where there was mana-gerial accountability were indeed witnessing positiveresults. The best example seen is that of 3M divisions.Management accountability means:
❖ new product results are measured (e.g. percentageof sales from new products);
❖ new product results are a part of senior manage-ment’s personal performance objectives; and
European Management Journal Vol 16 No 1 February 199816
❖ senior management’s compensation or bonusesare tied to these new product results.
Effective new product development, more than ever,determines corporate fortunes and prosperity. Anunderstanding of the factors that drive new productperformance at the business unit level is critical if weare to achieve the goal of increased performance. Byidentifying these driving factors and best practices —in particular, a high quality innovation process, adefined new product strategy, and adequateresources to support both strategy and process — thisbenchmarking study has provided hard and quant-ified evidence for management to take the stepstowards winning at new products.
Notes
1. Parts of this article are taken from others by the authorand co-authors (see Cooper and Kleinschmidt, 1995a, b,1996).
2. A ‘business unit’ is a self-contained business or operatingdivision of a larger company. It has its own managementteam, R&D, sales and marketing, operations, etc. In thecase of a smaller company, the ‘business unit’ may be theentire company.
3. Note that each practice is made up of ‘ingredients’ — the48 characteristics measured — and each ingredient wasalso correlated versus all seven performance metrics; butthere are too many such correlations to show here.
4. Source: Procter and Gamble’s Product Launch Roadmap.5. Note that this 5.66 per cent is only a portion of the total
R&D spending. That proportion going to product devel-opment was gauged here; but recognize that much ofR&D spending goes to other activities, such as processdevelopment or technology development.
6. Scores and correlations of these less important perform-ance drivers are not shown in Figure 5; only the majorsuccess factors are in this figure.
References
[1] Bobrow, E. E. (1991) Successful new products are the pro-duct of process. Marketing News 15 April, 27.
[2] Booz-Allen and Hamilton (1982) New Product Manage-ment for the 1980s. Booz-Allen and Hamilton Inc., NewYork.
[3] Cooper, R.G. (1993) Winning at New Products: Acceleratingthe Process from Idea to Launch. Addison-Wesley, Read-ing, MA.
[4] Cooper, R. G. (1994) Debunking the myths of new pro-duct development. Research and Technology Management37, 40–50.
[5] Cooper, R. G. (1995) Developing new products on time,in time. Research and Technology Management 38, 49–57.
[6] Cooper, R. G. (1996) Overhauling the new product pro-cess. Industrial Marketing Management 25, 465–482.
[7] Cooper, R. G. and Kleinschmidt, E. J. (1991) New productprocesses at leading industrial firms. Industrial MarketingManagement 20, 137–147.
[8] Cooper, R. G. and Kleinschmidt, E. J. (1995a) Bench-marking the firm’s critical success factors in new productdevelopment. Journal of Product Innovation Management12, 374–391.
[9] Cooper, R. G. and Kleinschmidt, E. J. (1995b) Bench-marking firms’ new product performance and practices.Engineering Management Review 23, 112–120.
[10] Cooper, R. G. and Kleinschmidt, E. J. (1996) Winning

BENCHMARKING NEW PRODUCT PERFORMANCE: RESULTS OF THE BEST PRACTICES STUDY
businesses in product development: Critical success fac-tors. Research-Technology Management 39, 18–29.
[11] Cooper, R.G., Edgett, S. and Kleinschmidt, E.J. (1997)Portfolio Management for New Products. McMaster Univer-sity, Hamilton, Ontario, Canada, 1997.
[12] Crawford, C. M. (1984) Protocol: New tool for productinnovation. Journal of Product Innovation Management 2,85–91.
[13] Dwyer, L. M. (1990) Factors affecting the proficient man-agement of product innovation. International Journal ofTechnology Management 5, 721–730.
[14] Gupta, A. K., Brockhoff, K. and Weisenfeld, U. (1992)Making trade-offs in the new product development pro-cess: A German/US comparison. Journal of Product Inno-vation Management 9, 11–18.
[15] Gupta, A. K. and Wilemon, D. (1990) Accelerating thedevelopment of technology-based new products. Califor-nia Management Review 32, 24–44.
[16] Hegarty, W. H. and Hoffman, R. C. (1990)Product/market innovations: A study of top manage-ment involvement among four cultures. Journal of ProductInnovation Management 7, 186–199.
[17] Johne, A. and Snelson, P. (1988) Auditing product inno-vation activities in manufacturing firms. R&D Manage-ment 18, 227–233.
[18] Larson, E. W. and Gobeli, D. H. (1988) Organizing forproduct development projects. Journal of Product Inno-vation Management 5, 180–190.
[19] Montoya-Weiss, M. M. and Calantone, R. J. (1994) Deter-minants of new product performance: A review andmeta analysis. Journal of Product Innovation Management11, 397–417.
[20] Peters, T.J. (1988) Thriving on Chaos. Harper & Row,New York.
[21] Shrivastava, P. and Souder, W. E. (1987) The strategicmanagement of technological innovation: A review anda model. Journal of Management Studies 24, 24–41.
[22] Simon, H. (1990) Hidden champions. Zeitschrift fur Betri-ebswirtschaft 60, 875–890.
European Management Journal Vol 16 No 1 February 1998 17
[23] Walsh, W. J. (1990) Get the whole organization behindnew product development. Research and Technology Man-agement Nov./Dec., 32–36.
[24] Von Braun, C.F. (1997) The Innovation War. Prentice-Hall,Englewood Cliffs, NJ.
ROBERT COOPER,Michael G. De GrooteSchool of Business,McMaster University,1280 Main Street West,Hamilton, Ontario, Can-ada L85 4M4.
Dr Robert G. Cooper isProfessor of Marketing atthe Michael De GrooteSchool of Business,McMaster University.
He is a leading researcher in the field of new pro-ducts, and has published over 75 articles and bookson the topic, including the NewProd series ofresearch studies into new product practices and hispopular book, Winning at New Products: Acce-lerating the Process from Idea to Launch. He isalso a lecturer and consultant to industry, and hasseen his methods, prescriptions and Stage-GateTM
new product process applied in leading corporationsin both North America and Europe.