Embed Size (px)
Citation preview
Shannon Shuman MartinRetail Leasing Advisors, LLC404.312.4305 (Direct) [email protected]
Major Tenant Announcement ComingSoon
Well-situated on Highway 78 with convenient and easy access to the cities of Snellville and Loganville
Highway 78 is a commuter highway with traffic signal at entrance
New Tenants include Wing Suite, Nawlins Pralines & Quality Beauty
675316
78
Visit Us At:www.retailleasingadvisors.net
Bre Wagner-ClagettRetail Leasing Advisors, LLC404.406.2774 (Direct)[email protected]
Cooper VillageGrayson, GA
HIGHLIGHTS
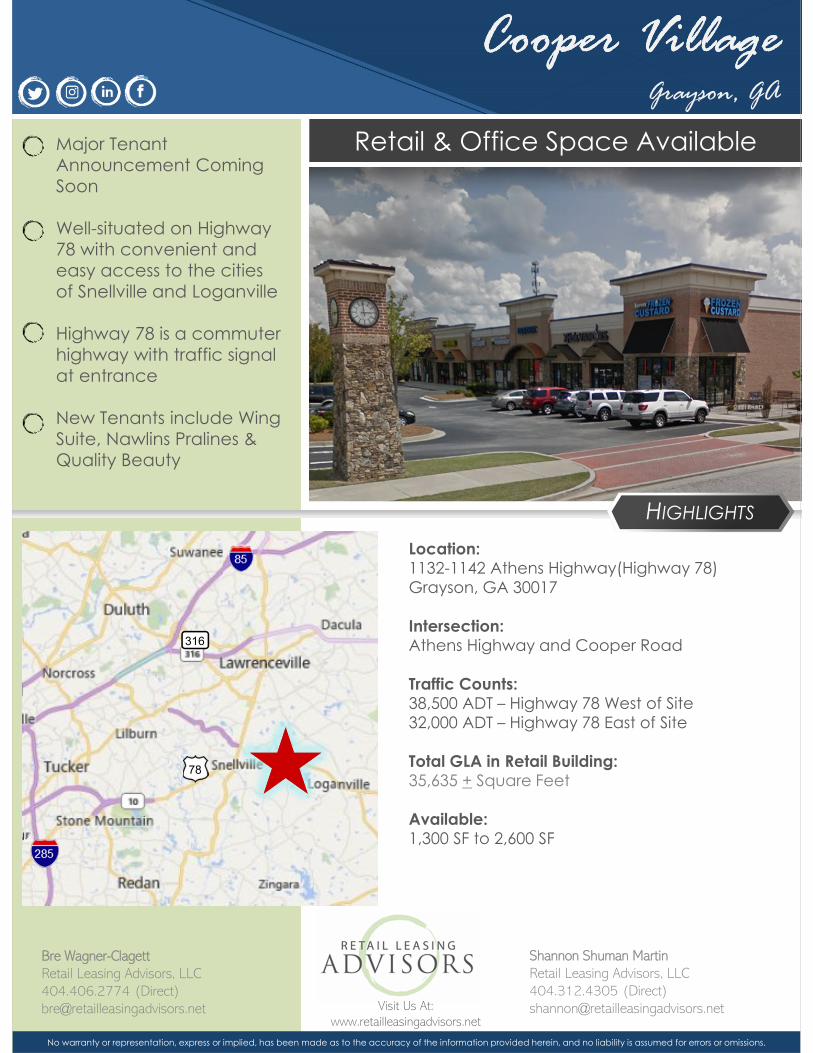
Location:1132-1142 Athens Highway(Highway 78)Grayson, GA 30017
Intersection:Athens Highway and Cooper Road
Traffic Counts:38,500 ADT – Highway 78 West of Site32,000 ADT – Highway 78 East of Site
Total GLA in Retail Building:35,635 + Square Feet
Available:1,300 SF to 2,600 SF
Retail & Office Space Available
Cooper Village
No warranty or representation, express or implied, has been made as to the accuracy of the information provided herein, and no liability is assumed for errors or omissions.

Site Plan & Tenant List
Suite Tenant SF
101 Ionies Island Kitchen 2,666
103 Diamond Nails 1,300
104 Mike’s Barbershop 1,300
105 Homebrew 1,300
106 B&B Hobby 3,900
109 Nawlin’s Pralines 1,300
110 AVAILABLE 1,300
111 Bloom with Jenna 1,300
112 Quality Beauty 2,600
113 AVAILABLE 1,300
78
Up to 122 FutureResidential Units
Coming Soon
Cooper Village
No warranty or representation, express or implied, has been made as to the accuracy of the information provided herein, and no liability is assumed for errors or omissions.
Suite Tenant SF
114 AVAILABLE 1,300
115 Main Street Restaurant 4,500
201 Beren’s Frozen Custard 1,200
202 AVAILABLE 1,300
203 Extreme Fireworks 2,600
205 Hair Salon 78 1,300
206 Wing Suite 1,300
207 Regional Medical 5,169

Aerial
Snellville Pavilion
Presidential Market
North Logan Commons
78Snellville
Loganville
124
Demographics: 1-3 Miles 3-5 Miles
Population 45,270 83,260
Households 12,113 22,842
Average HH Income $91,380 $97,064
Daytime Population 34,317 69,612
Drive Time 5– 10 Min 10-15Min
Population 69,458 124,563
Households 23,726 40,619
Average HH Income $90,203 $95,464
Daytime Population 59,236 102,397
20
No warranty or representation, express or implied, has been made as to the accuracy of the information provided herein, and no liability is assumed for errors or omissions.
Cooper VillageThe Shoppes at Webb Ginn
Grayson

Site Map1132 Athens Hwy, Grayson, Georgia, 30017 Prepared by EsriRing Bands: 0-1, 1-3, 3-5 mile radii Latitude: 33.86342
Longitude: -83.96390
August 07, 2019
©2019 Esri Page 1 of 1

Executive Summary1132 Athens Hwy, Grayson, Georgia, 30017 Prepared by EsriRing Bands: 0-1, 1-3, 3-5 mile radii Latitude: 33.86342
Longitude: -83.96390
0 - 1 mile 1 - 3 mile 3 - 5 milePopulation
2000 Population 2,827 24,384 48,5052010 Population 5,645 39,510 72,6272019 Population 7,214 45,270 83,2602024 Population 8,117 48,870 89,9192000-2010 Annual Rate 7.16% 4.94% 4.12%2010-2019 Annual Rate 2.69% 1.48% 1.49%2019-2024 Annual Rate 2.39% 1.54% 1.55%2019 Male Population 48.8% 47.8% 48.1%2019 Female Population 51.2% 52.2% 51.9%2019 Median Age 35.4 37.1 37.5
In the identified area, the current year population is 83,260. In 2010, the Census count in the area was 72,627. The rate of change since 2010 was 1.49% annually. The five-year projection for the population in the area is 89,919 representing a change of 1.55% annually from 2019 to 2024. Currently, the population is 48.1% male and 51.9% female.
Median Age
The median age in this area is 35.4, compared to U.S. median age of 38.5.Race and Ethnicity
2019 White Alone 43.7% 46.5% 50.0%2019 Black Alone 40.6% 41.2% 34.2%2019 American Indian/Alaska Native Alone 0.2% 0.2% 0.3%2019 Asian Alone 4.2% 4.6% 8.1%2019 Pacific Islander Alone 0.0% 0.0% 0.0%2019 Other Race 6.7% 3.7% 3.7%2019 Two or More Races 4.6% 3.7% 3.6%2019 Hispanic Origin (Any Race) 14.4% 9.9% 10.0%
Persons of Hispanic origin represent 10.0% of the population in the identified area compared to 18.6% of the U.S. population. Persons of Hispanic Origin may be of any race. The Diversity Index, which measures the probability that two people from the same area will be from different race/ethnic groups, is 69.3 in the identified area, compared to 64.8 for the U.S. as a whole.
Households2019 Wealth Index 87 101 1162000 Households 987 7,999 15,9822010 Households 1,955 13,088 24,2242019 Total Households 2,475 15,027 27,7892024 Total Households 2,782 16,197 29,9672000-2010 Annual Rate 7.07% 5.05% 4.25%2010-2019 Annual Rate 2.58% 1.50% 1.50%2019-2024 Annual Rate 2.37% 1.51% 1.52%2019 Average Household Size 2.91 3.00 2.99
The household count in this area has changed from 24,224 in 2010 to 27,789 in the current year, a change of 1.50% annually. The five-year projection of households is 29,967, a change of 1.52% annually from the current year total. Average household size is currently 2.99, compared to 2.99 in the year 2010. The number of families in the current year is 22,220 in the specified area.
Data Note: Income is expressed in current dollars. Housing Affordability Index and Percent of Income for Mortgage calculations are only available for areas with 50 or more owner-occupied housing units. Source: U.S. Census Bureau, Census 2010 Summary File 1. Esri forecasts for 2019 and 2024. Esri converted Census 2000 data into 2010 geography.
August 07, 2019
©2019 Esri Page 1 of 2

Executive Summary1132 Athens Hwy, Grayson, Georgia, 30017 Prepared by EsriRing Bands: 0-1, 1-3, 3-5 mile radii Latitude: 33.86342
Longitude: -83.96390
0 - 1 mile 1 - 3 mile 3 - 5 mileMortgage Income
2019 Percent of Income for Mortgage 13.3% 12.4% 13.2%Median Household Income
2019 Median Household Income $76,883 $76,855 $79,0942024 Median Household Income $84,920 $84,916 $85,8022019-2024 Annual Rate 2.01% 2.01% 1.64%
Average Household Income
2019 Average Household Income $85,907 $91,380 $97,0642024 Average Household Income $97,159 $103,005 $107,9362019-2024 Annual Rate 2.49% 2.42% 2.15%
Per Capita Income2019 Per Capita Income $28,185 $30,595 $32,3042024 Per Capita Income $31,826 $34,456 $35,8452019-2024 Annual Rate 2.46% 2.41% 2.10%
Households by IncomeCurrent median household income is $79,094 in the area, compared to $60,548 for all U.S. households. Median household income is projected to be $85,802 in five years, compared to $69,180 for all U.S. households
Current average household income is $97,064 in this area, compared to $87,398 for all U.S. households. Average household income is projected to be $107,936 in five years, compared to $99,638 for all U.S. households
Current per capita income is $32,304 in the area, compared to the U.S. per capita income of $33,028. The per capita income is projected to be $35,845 in five years, compared to $36,530 for all U.S. households Housing
2019 Housing Affordability Index 168 181 1712000 Total Housing Units 1,061 8,199 16,444
2000 Owner Occupied Housing Units 910 7,295 13,9592000 Renter Occupied Housing Units 77 703 2,0232000 Vacant Housing Units 74 201 462
2010 Total Housing Units 2,221 13,962 25,9662010 Owner Occupied Housing Units 1,716 11,151 20,3802010 Renter Occupied Housing Units 239 1,937 3,8442010 Vacant Housing Units 266 874 1,742
2019 Total Housing Units 2,601 15,680 28,8732019 Owner Occupied Housing Units 2,199 12,833 23,4462019 Renter Occupied Housing Units 276 2,194 4,3442019 Vacant Housing Units 126 653 1,084
2024 Total Housing Units 2,915 16,854 30,9992024 Owner Occupied Housing Units 2,490 13,962 25,4862024 Renter Occupied Housing Units 292 2,235 4,4802024 Vacant Housing Units 133 657 1,032
Currently, 81.2% of the 28,873 housing units in the area are owner occupied; 15.0%, renter occupied; and 3.8% are vacant. Currently, in the U.S., 56.4% of the housing units in the area are owner occupied; 32.4% are renter occupied; and 11.2% are vacant. In 2010, there were 25,966 housing units in the area - 78.5% owner occupied, 14.8% renter occupied, and 6.7% vacant. The annual rate of change in housing units since 2010 is 4.83%. Median home value in the area is $213,503, compared to a median home value of $234,154 for the U.S. In five years, median value is projected to change by 2.67% annually to $243,617.
Data Note: Income is expressed in current dollars. Housing Affordability Index and Percent of Income for Mortgage calculations are only available for areas with 50 or more owner-occupied housing units. Source: U.S. Census Bureau, Census 2010 Summary File 1. Esri forecasts for 2019 and 2024. Esri converted Census 2000 data into 2010 geography.
August 07, 2019
©2019 Esri Page 2 of 2