Embed Size (px)
Citation preview
Cooperative Education Program andPlacement Office
Graduate Survey - 2012
Institutional Research OfficeCooperative Education Program andPlacement Office

Sample• Population 221
• Sample 133
• Percent of participation 60%
2

Student Information
3
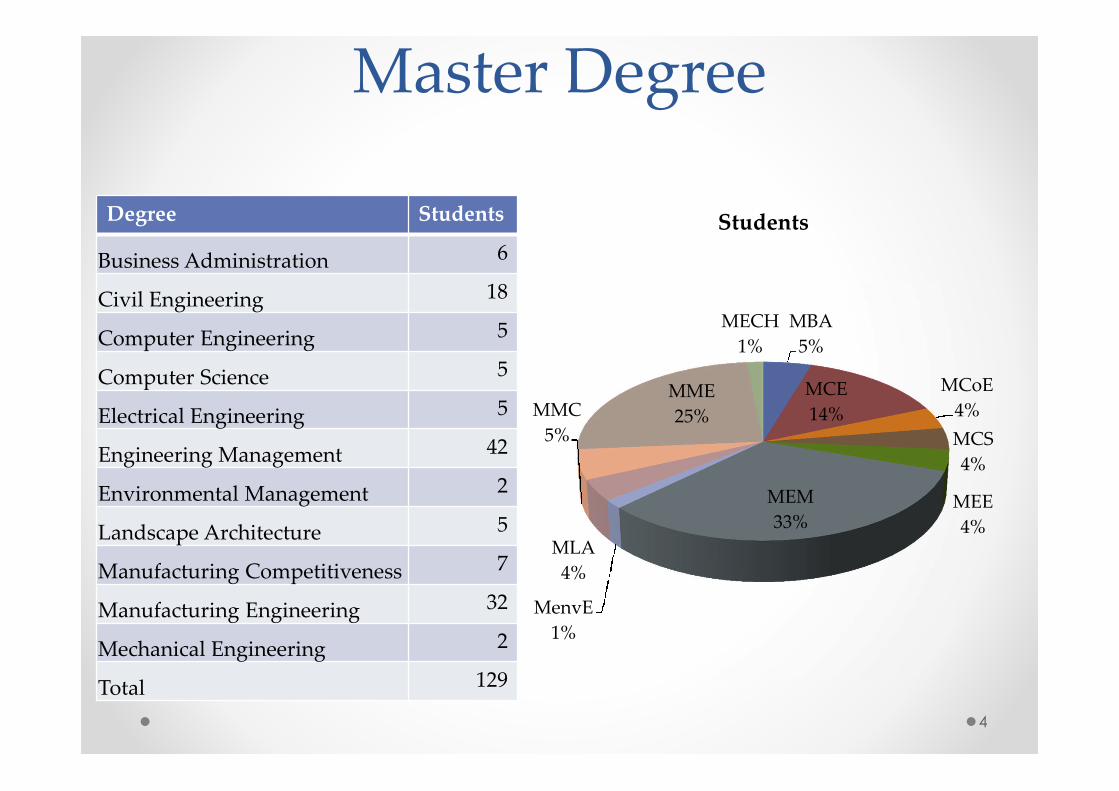
Master Degree
Degree Students
Business Administration 6
Civil Engineering 18
Computer Engineering 5
Computer Science 5
Electrical Engineering 5
Engineering Management 42
Environmental Management 2
Landscape Architecture 5
Manufacturing Competitiveness 7
Manufacturing Engineering 32
Mechanical Engineering 2
Total 129
4
MBA
5%
MCE
14%
MCoE
4%
MCS
4%
MEE
4%
MEM
33%
MenvE
1%
MLA
4%
MMC
5%
MME
25%
MECH
1%
Students
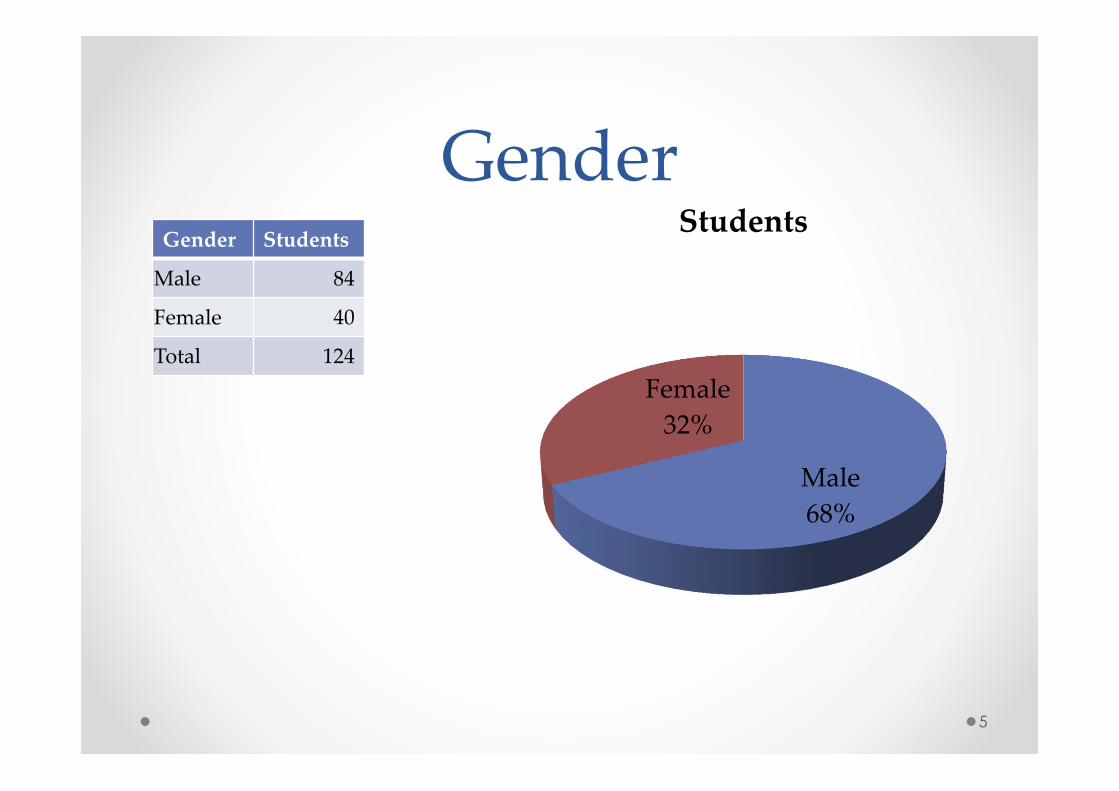
GenderGender Students
Male 84
Female 40
Total 124
5
Male
68%
Female
32%
Students
Employment
6
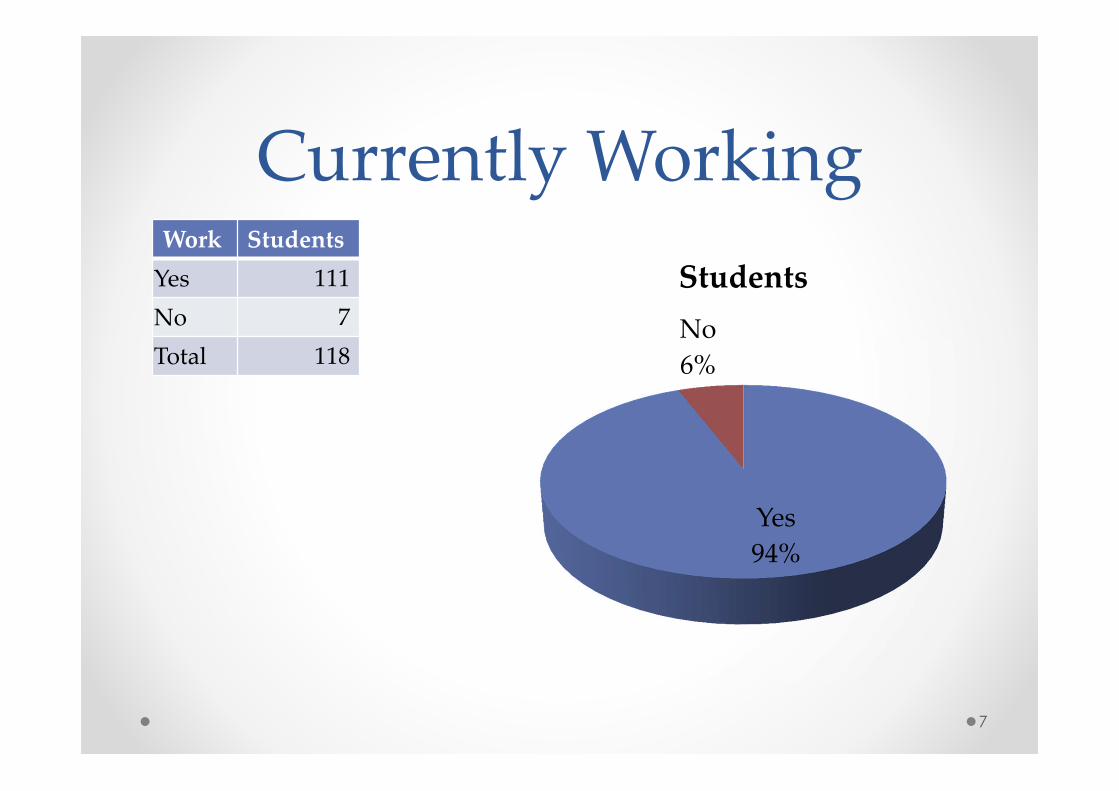
Currently WorkingWork Students
Yes 111
No 7
Total 118
7
Yes
94%
No
6%
Students
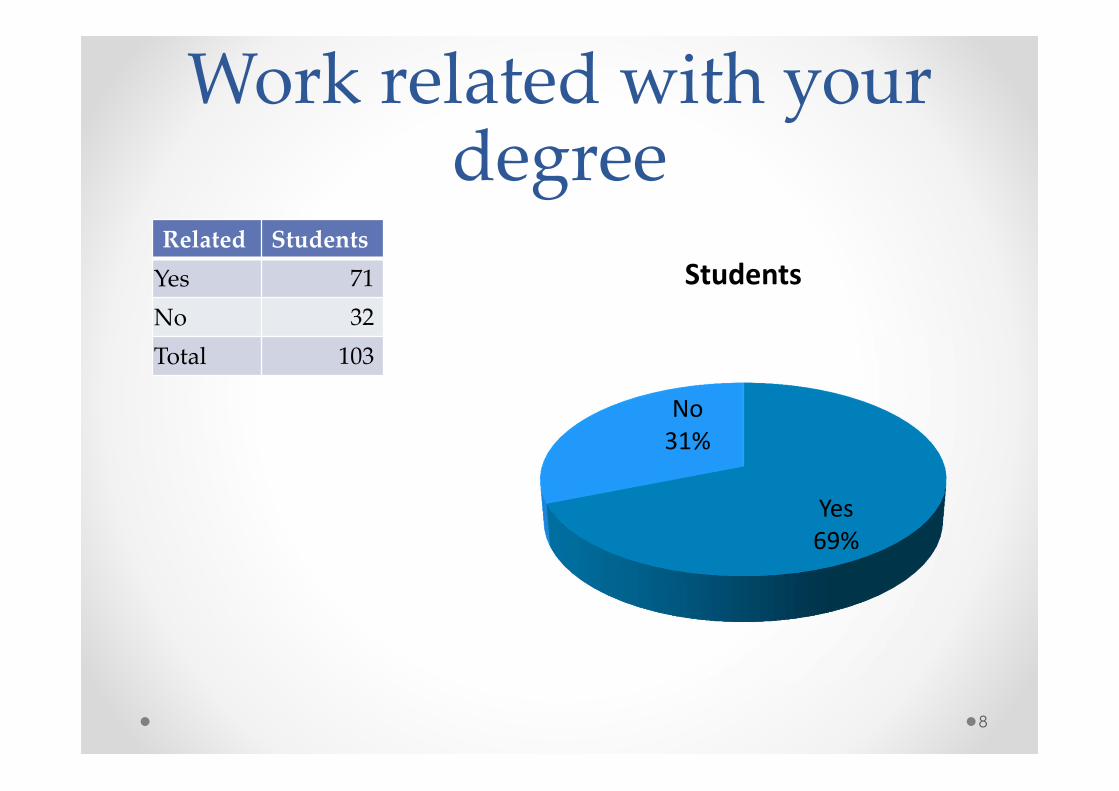
Work related with yourdegree
Related Students
Yes 71
No 32
Total 103
8
Yes69%
No31%
Students

Working LoadLoad Students
Full Time 105
Part Time 3
Total 108
9
Full Time97%
PartTime3%
Students

Currently job titleJob Title Frequency Percent
Account Manager 1 1%
Advance Quality Engineer 1 1%
Agronomist and Landscape Architect 1 1%
Assistant Engineer 1 1%
Black Belt 1 1%
Chemist 2 2%
Civil Engineer 1 1%
Computer Validation Engineer 1 1%
Consultor en entrenamiento 1 1%
Control Engineer 1 1%
Control System Engineer II 1 1%
CSS 1 1%
Customer Care Representative 1 1%
Account Manager 1 1% 10
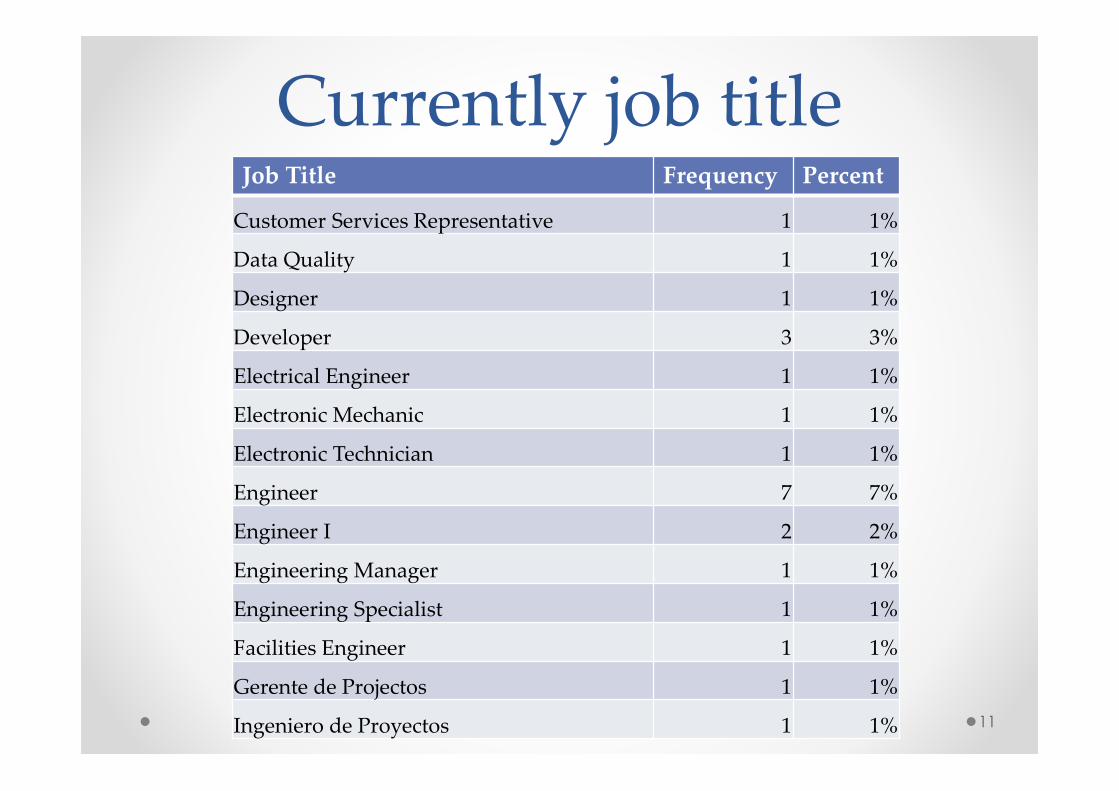
Currently job titleJob Title Frequency Percent
Customer Services Representative 1 1%
Data Quality 1 1%
Designer 1 1%
Developer 3 3%
Electrical Engineer 1 1%
Electronic Mechanic 1 1%
Electronic Technician 1 1%
Engineer 7 7%
Engineer I 2 2%
Engineering Manager 1 1%
Engineering Specialist 1 1%
Facilities Engineer 1 1%
Gerente de Projectos 1 1%
Ingeniero de Proyectos 1 1% 11
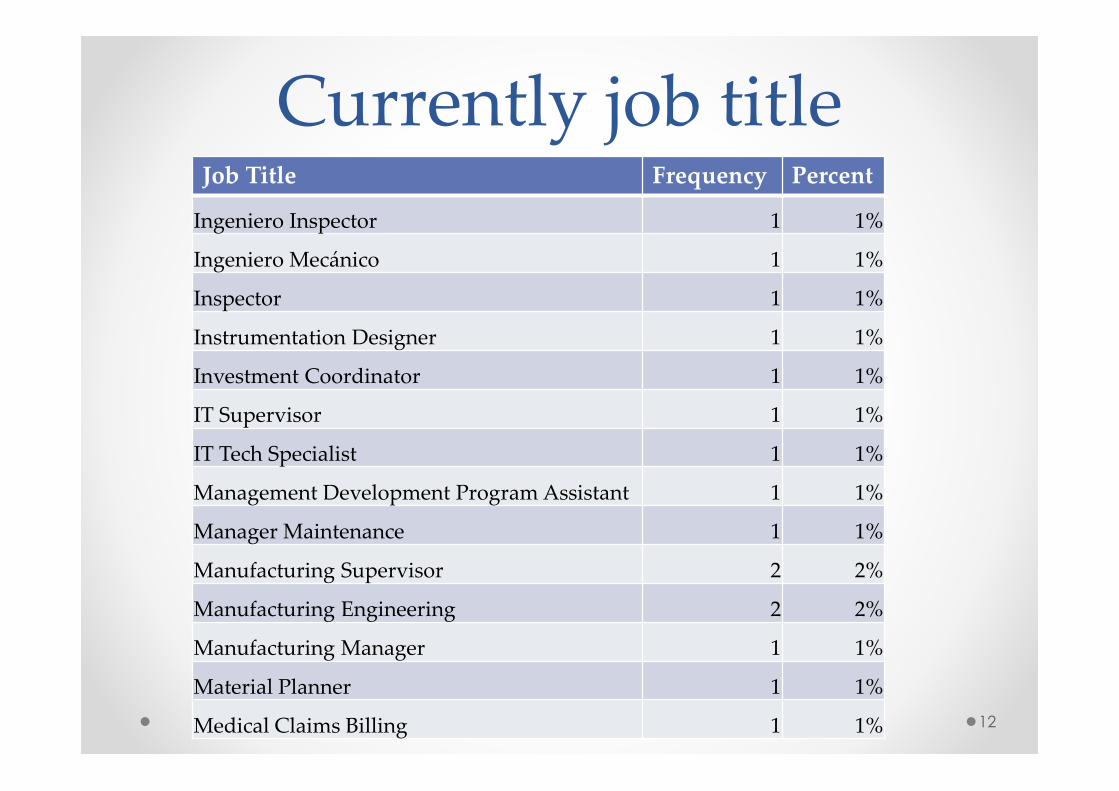
Currently job titleJob Title Frequency Percent
Ingeniero Inspector 1 1%
Ingeniero Mecánico 1 1%
Inspector 1 1%
Instrumentation Designer 1 1%
Investment Coordinator 1 1%
IT Supervisor 1 1%
IT Tech Specialist 1 1%
Management Development Program Assistant 1 1%
Manager Maintenance 1 1%
Manufacturing Supervisor 2 2%
Manufacturing Engineering 2 2%
Manufacturing Manager 1 1%
Material Planner 1 1%
Medical Claims Billing 1 1% 12
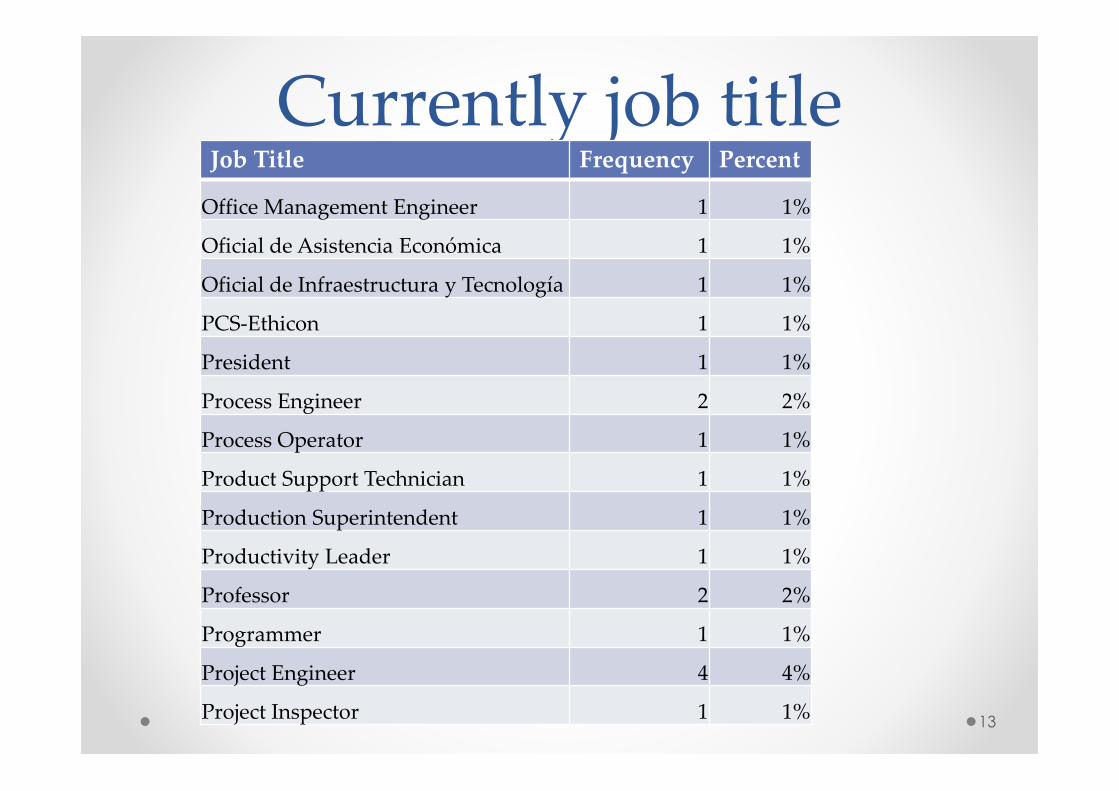
Currently job titleJob Title Frequency Percent
Office Management Engineer 1 1%
Oficial de Asistencia Económica 1 1%
Oficial de Infraestructura y Tecnología 1 1%
PCS-Ethicon 1 1%
President 1 1%
Process Engineer 2 2%
Process Operator 1 1%
Product Support Technician 1 1%
Production Superintendent 1 1%
Productivity Leader 1 1%
Professor 2 2%
Programmer 1 1%
Project Engineer 4 4%
Project Inspector 1 1%13
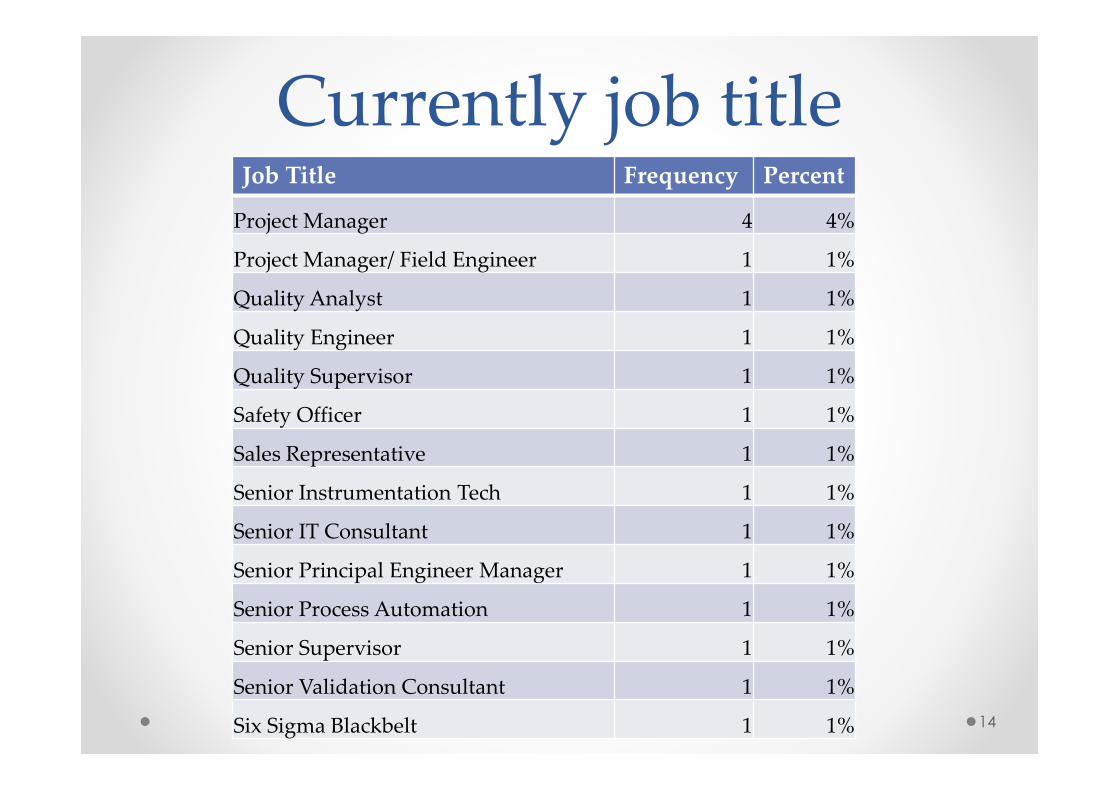
Currently job titleJob Title Frequency Percent
Project Manager 4 4%
Project Manager/ Field Engineer 1 1%
Quality Analyst 1 1%
Quality Engineer 1 1%
Quality Supervisor 1 1%
Safety Officer 1 1%
Sales Representative 1 1%
Senior Instrumentation Tech 1 1%
Senior IT Consultant 1 1%
Senior Principal Engineer Manager 1 1%
Senior Process Automation 1 1%
Senior Supervisor 1 1%
Senior Validation Consultant 1 1%
Six Sigma Blackbelt 1 1% 14
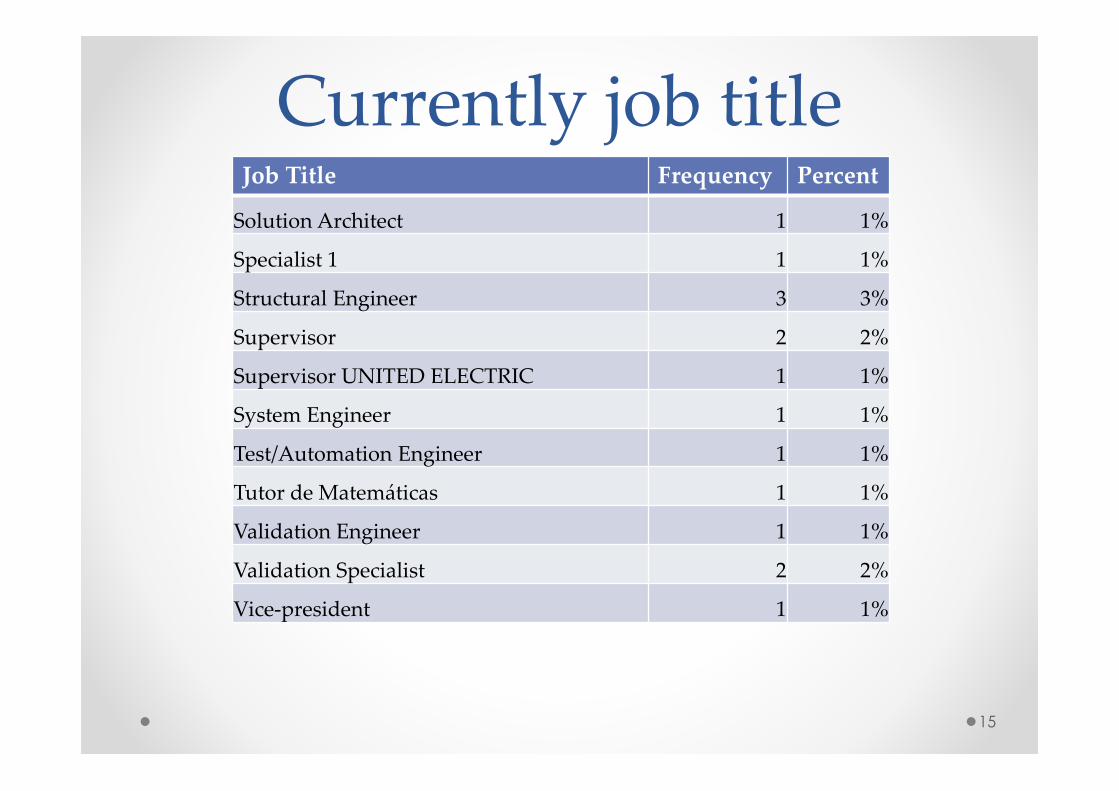
Currently job titleJob Title Frequency Percent
Solution Architect 1 1%
Specialist 1 1 1%
Structural Engineer 3 3%
Supervisor 2 2%
Supervisor UNITED ELECTRIC 1 1%
System Engineer 1 1%
Test/Automation Engineer 1 1%
Tutor de Matemáticas 1 1%
Validation Engineer 1 1%
Validation Specialist 2 2%
Vice-president 1 1%
15
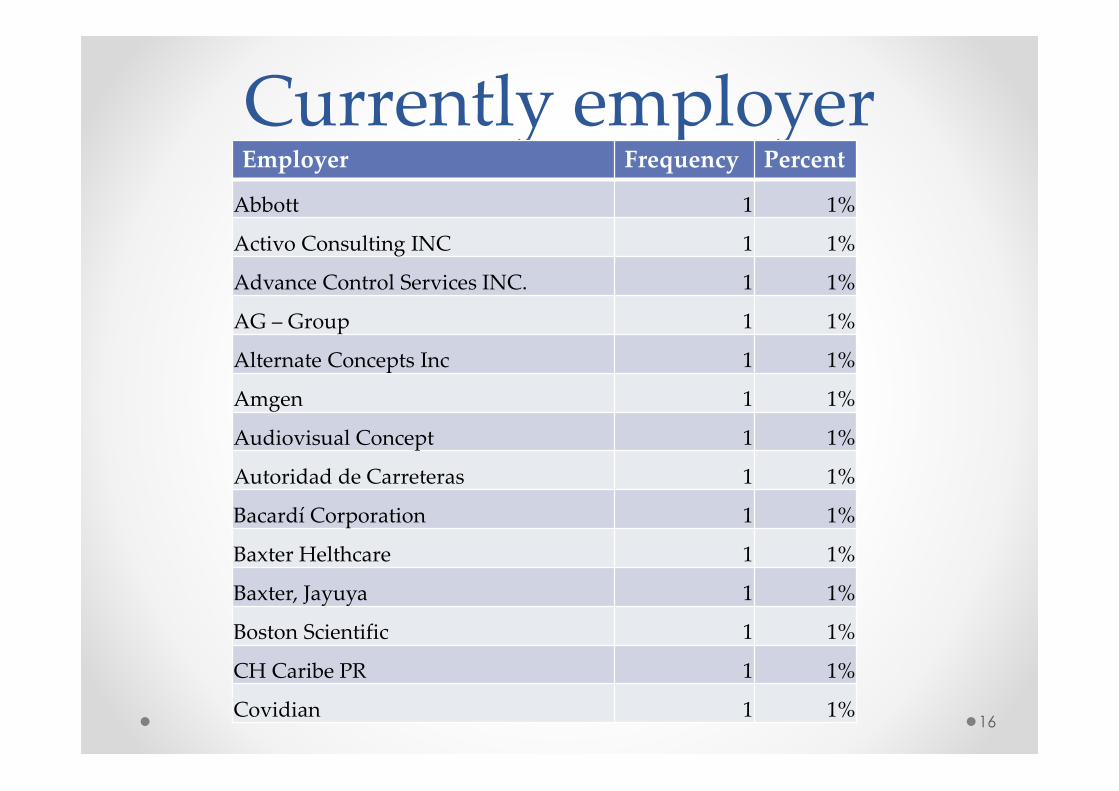
Currently employerEmployer Frequency Percent
Abbott 1 1%
Activo Consulting INC 1 1%
Advance Control Services INC. 1 1%
AG – Group 1 1%
Alternate Concepts Inc 1 1%
Amgen 1 1%
Audiovisual Concept 1 1%
Autoridad de Carreteras 1 1%
Bacardí Corporation 1 1%
Baxter Helthcare 1 1%
Baxter, Jayuya 1 1%
Boston Scientific 1 1%
CH Caribe PR 1 1%
Covidian 1 1%16
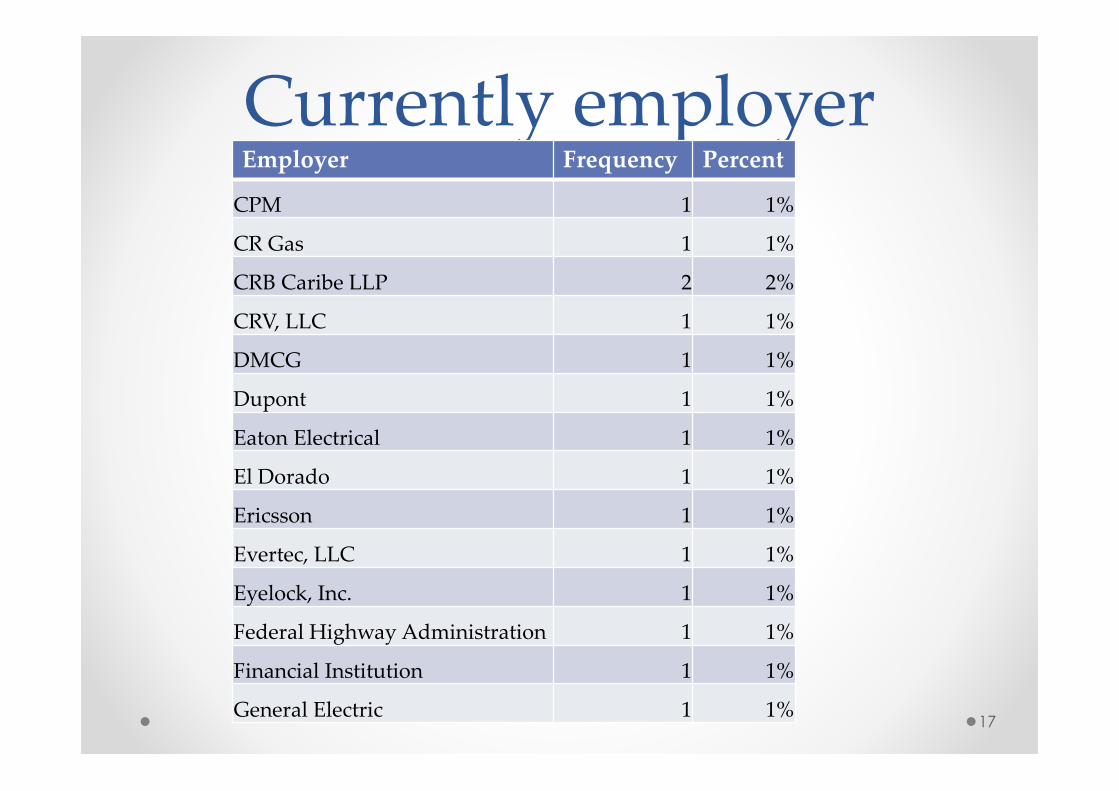
Currently employerEmployer Frequency Percent
CPM 1 1%
CR Gas 1 1%
CRB Caribe LLP 2 2%
CRV, LLC 1 1%
DMCG 1 1%
Dupont 1 1%
Eaton Electrical 1 1%
El Dorado 1 1%
Ericsson 1 1%
Evertec, LLC 1 1%
Eyelock, Inc. 1 1%
Federal Highway Administration 1 1%
Financial Institution 1 1%
General Electric 1 1%17
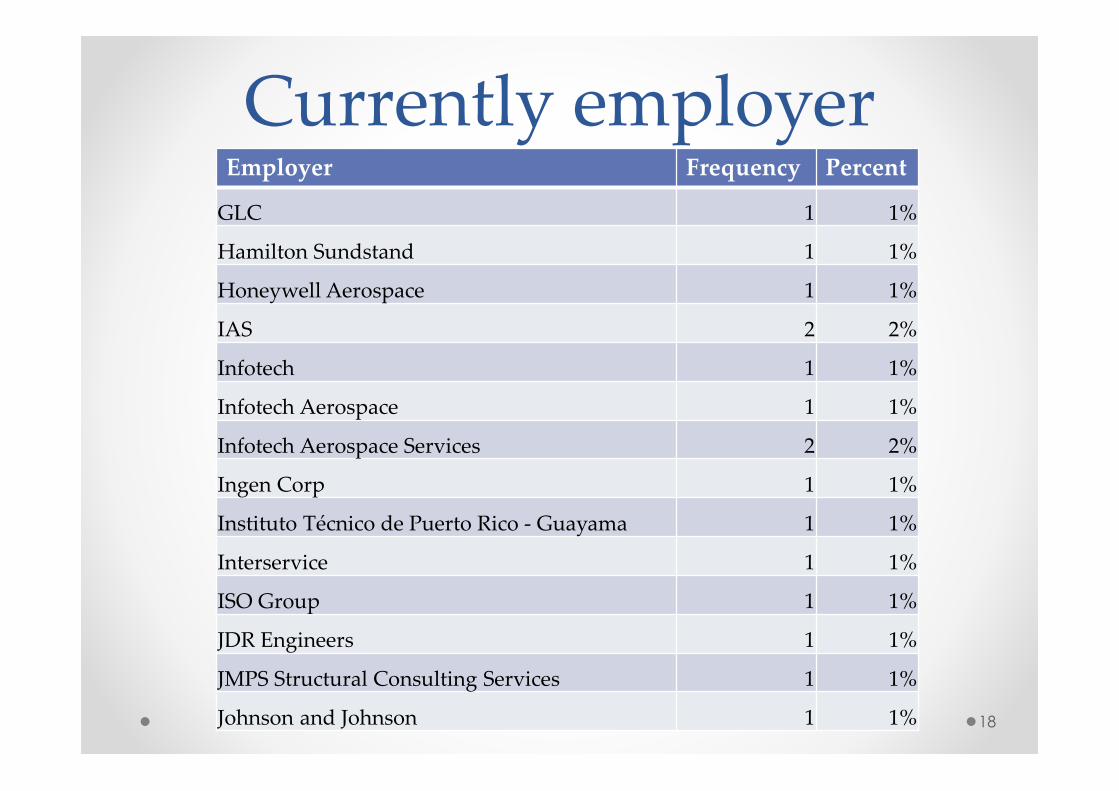
Currently employerEmployer Frequency Percent
GLC 1 1%
Hamilton Sundstand 1 1%
Honeywell Aerospace 1 1%
IAS 2 2%
Infotech 1 1%
Infotech Aerospace 1 1%
Infotech Aerospace Services 2 2%
Ingen Corp 1 1%
Instituto Técnico de Puerto Rico - Guayama 1 1%
Interservice 1 1%
ISO Group 1 1%
JDR Engineers 1 1%
JMPS Structural Consulting Services 1 1%
Johnson and Johnson 1 1% 18
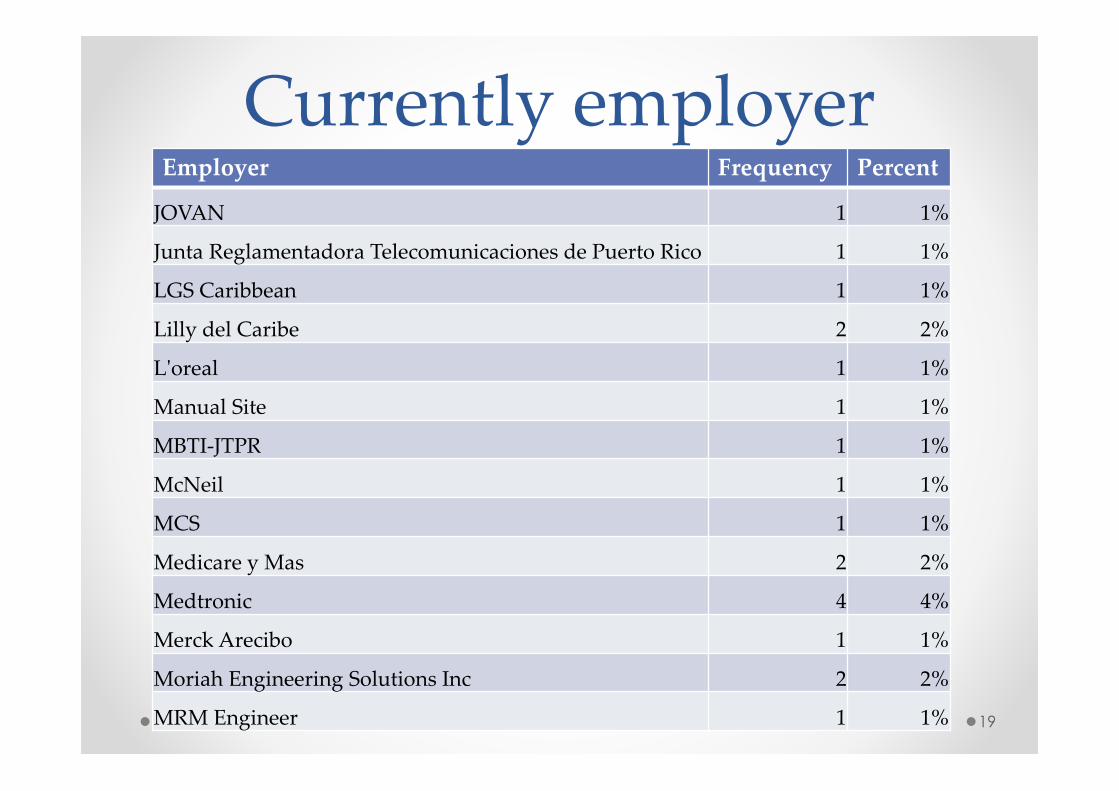
Currently employerEmployer Frequency Percent
JOVAN 1 1%
Junta Reglamentadora Telecomunicaciones de Puerto Rico 1 1%
LGS Caribbean 1 1%
Lilly del Caribe 2 2%
L'oreal 1 1%
Manual Site 1 1%
MBTI-JTPR 1 1%
McNeil 1 1%
MCS 1 1%
Medicare y Mas 2 2%
Medtronic 4 4%
Merck Arecibo 1 1%
Moriah Engineering Solutions Inc 2 2%
MRM Engineer 1 1% 19
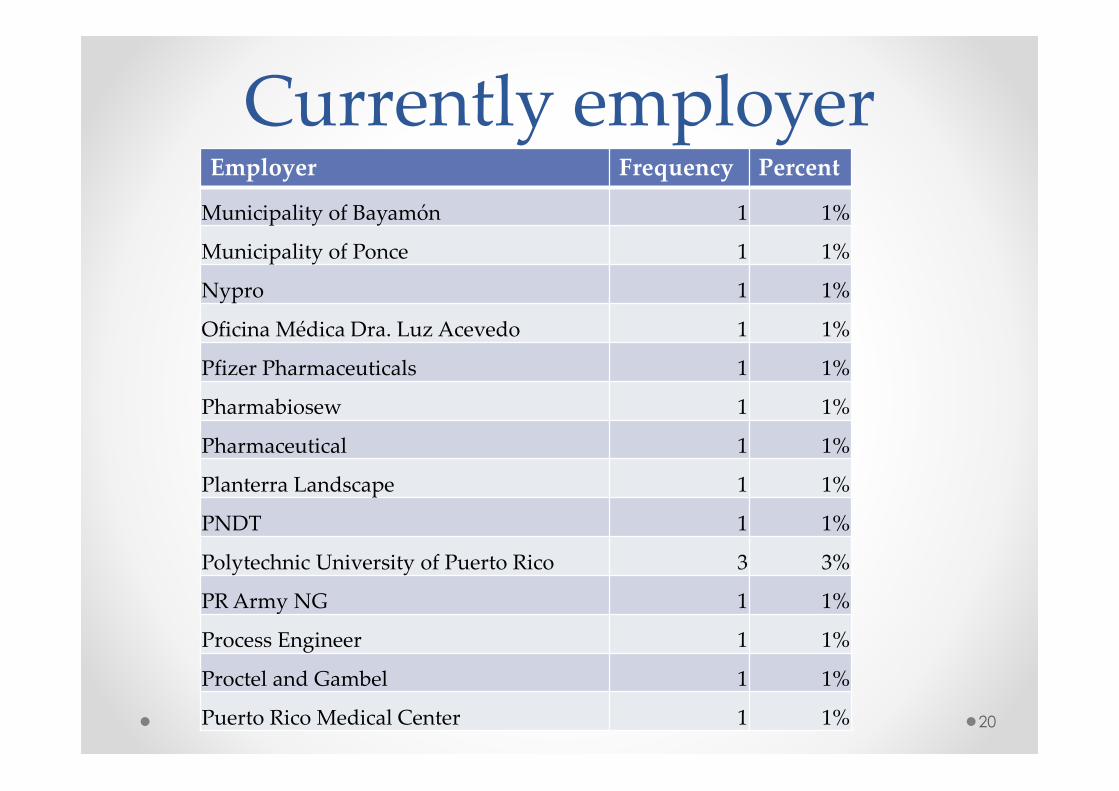
Currently employerEmployer Frequency Percent
Municipality of Bayamón 1 1%
Municipality of Ponce 1 1%
Nypro 1 1%
Oficina Médica Dra. Luz Acevedo 1 1%
Pfizer Pharmaceuticals 1 1%
Pharmabiosew 1 1%
Pharmaceutical 1 1%
Planterra Landscape 1 1%
PNDT 1 1%
Polytechnic University of Puerto Rico 3 3%
PR Army NG 1 1%
Process Engineer 1 1%
Proctel and Gambel 1 1%
Puerto Rico Medical Center 1 1% 20
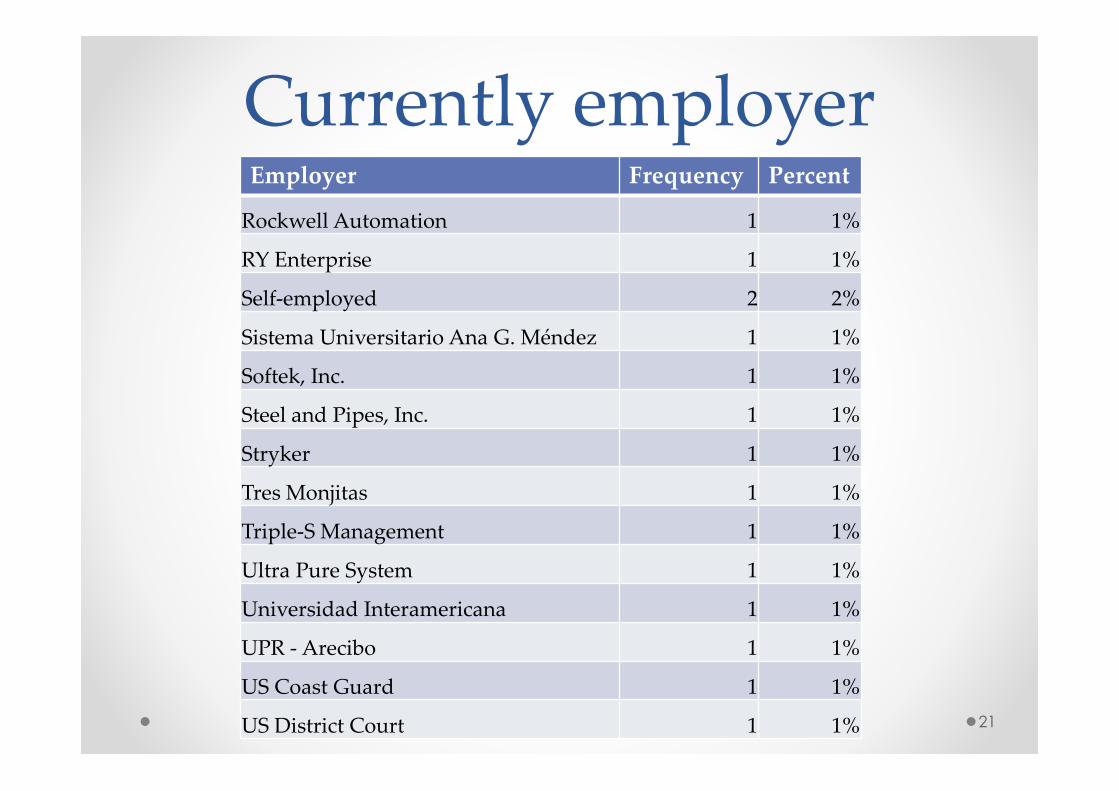
Currently employerEmployer Frequency Percent
Rockwell Automation 1 1%
RY Enterprise 1 1%
Self-employed 2 2%
Sistema Universitario Ana G. Méndez 1 1%
Softek, Inc. 1 1%
Steel and Pipes, Inc. 1 1%
Stryker 1 1%
Tres Monjitas 1 1%
Triple-S Management 1 1%
Ultra Pure System 1 1%
Universidad Interamericana 1 1%
UPR - Arecibo 1 1%
US Coast Guard 1 1%
US District Court 1 1% 21
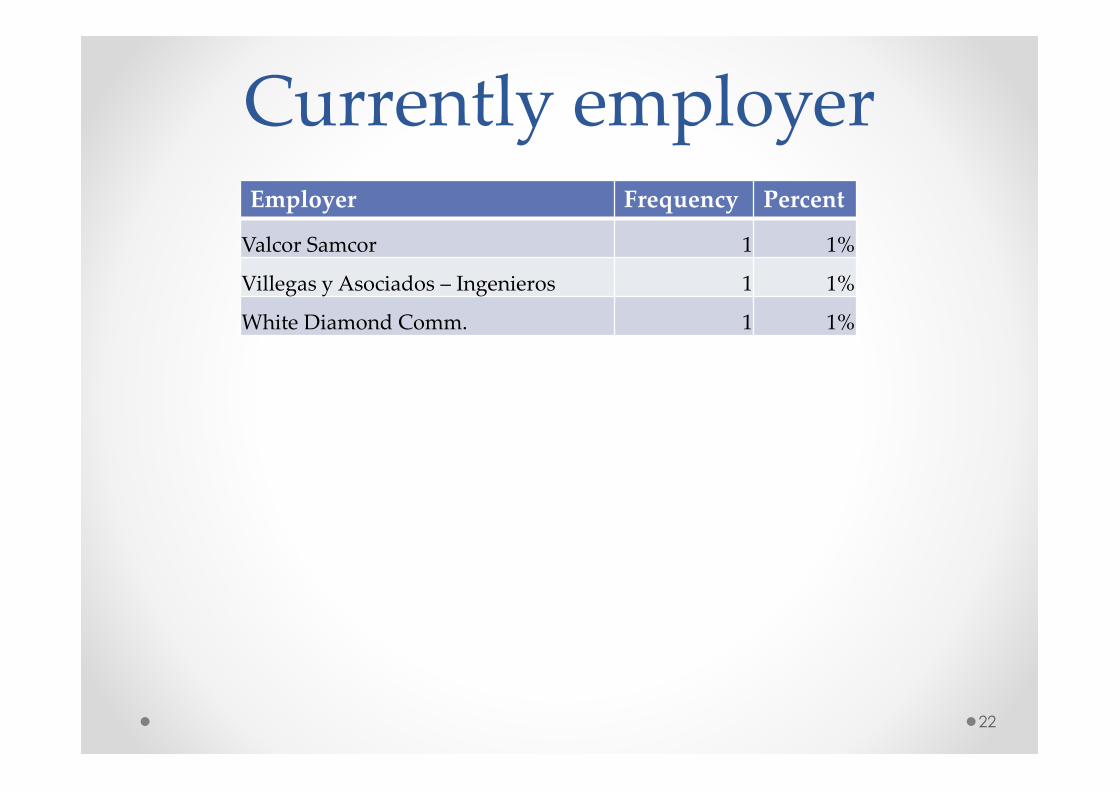
Currently employerEmployer Frequency Percent
Valcor Samcor 1 1%
Villegas y Asociados – Ingenieros 1 1%
White Diamond Comm. 1 1%
22
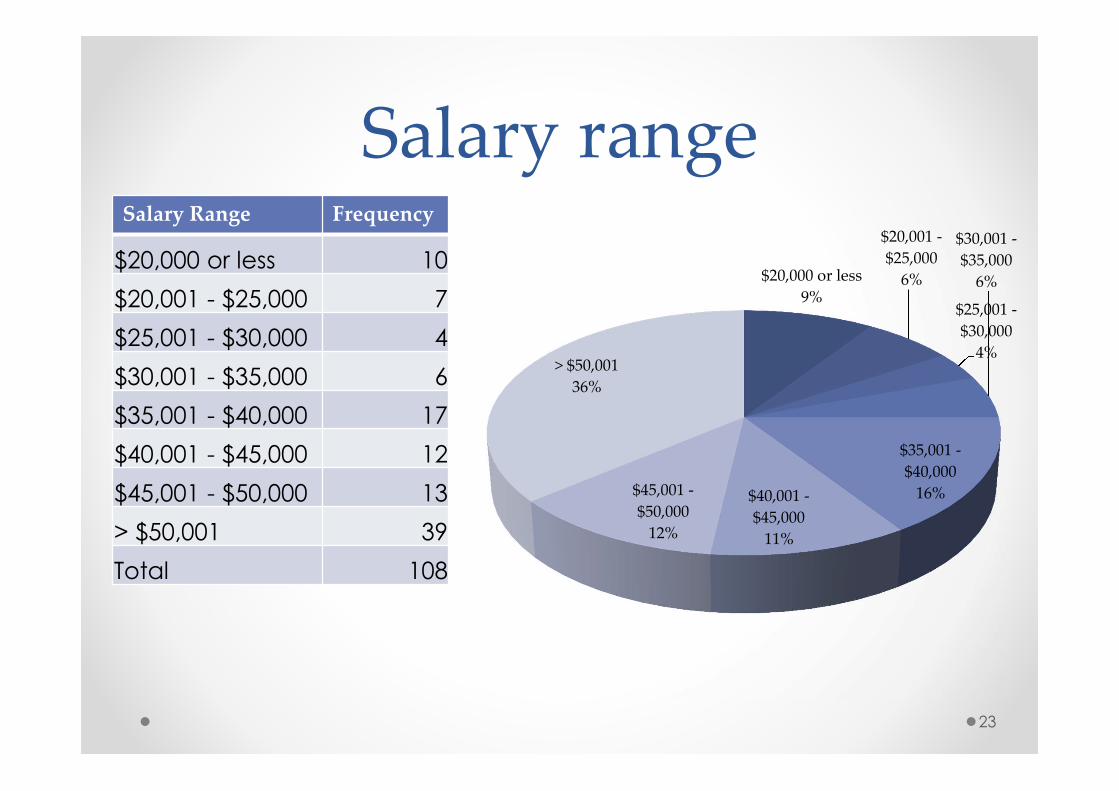
Salary rangeSalary Range Frequency
$20,000 or less 10
$20,001 - $25,000 7
$25,001 - $30,000 4
$30,001 - $35,000 6
$35,001 - $40,000 17
$40,001 - $45,000 12
$45,001 - $50,000 13
> $50,001 39
Total 108
23
$20,000 or less
9%
$20,001 -
$25,000
6%
$25,001 -
$30,000
4%
$30,001 -
$35,000
6%
$35,001 -
$40,000
16%$40,001 -
$45,000
11%
$45,001 -
$50,000
12%
> $50,001
36%
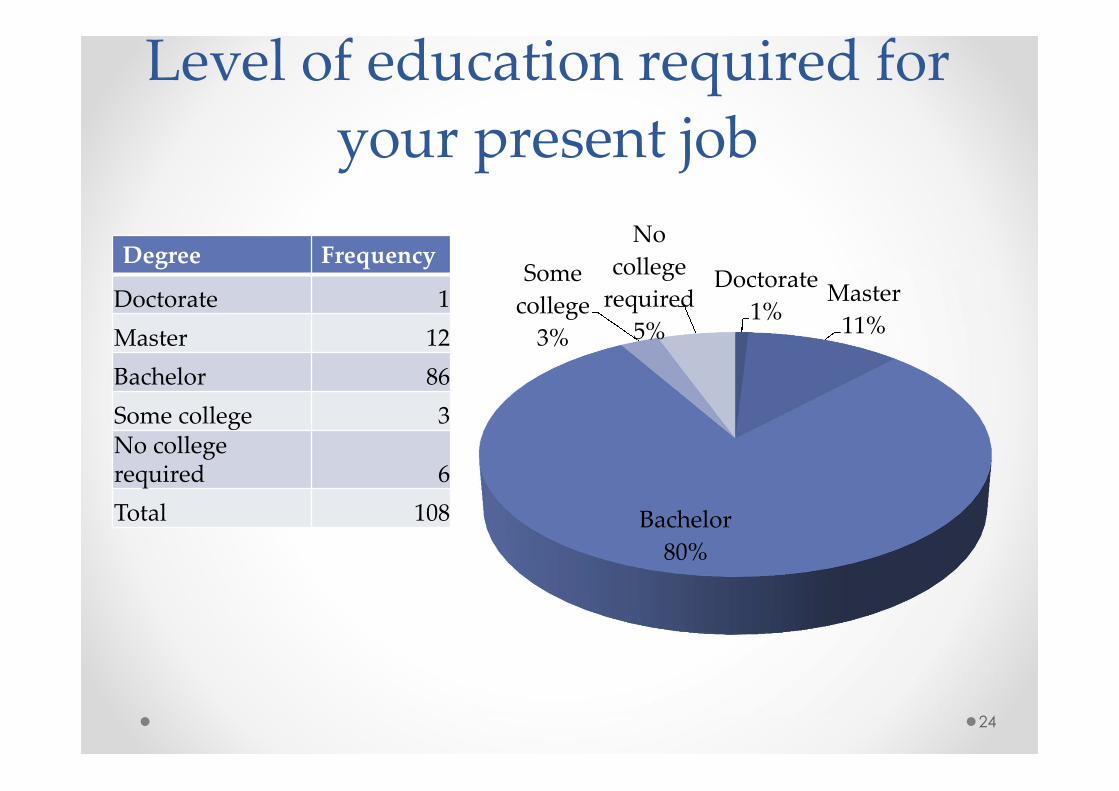
Level of education required for
your present job
Degree Frequency
Doctorate 1
Master 12
Bachelor 86
Some college 3No collegerequired 6
Total 108
24
Doctorate
1%Master
11%
Bachelor
80%
Some
college
3%
No
college
required
5%
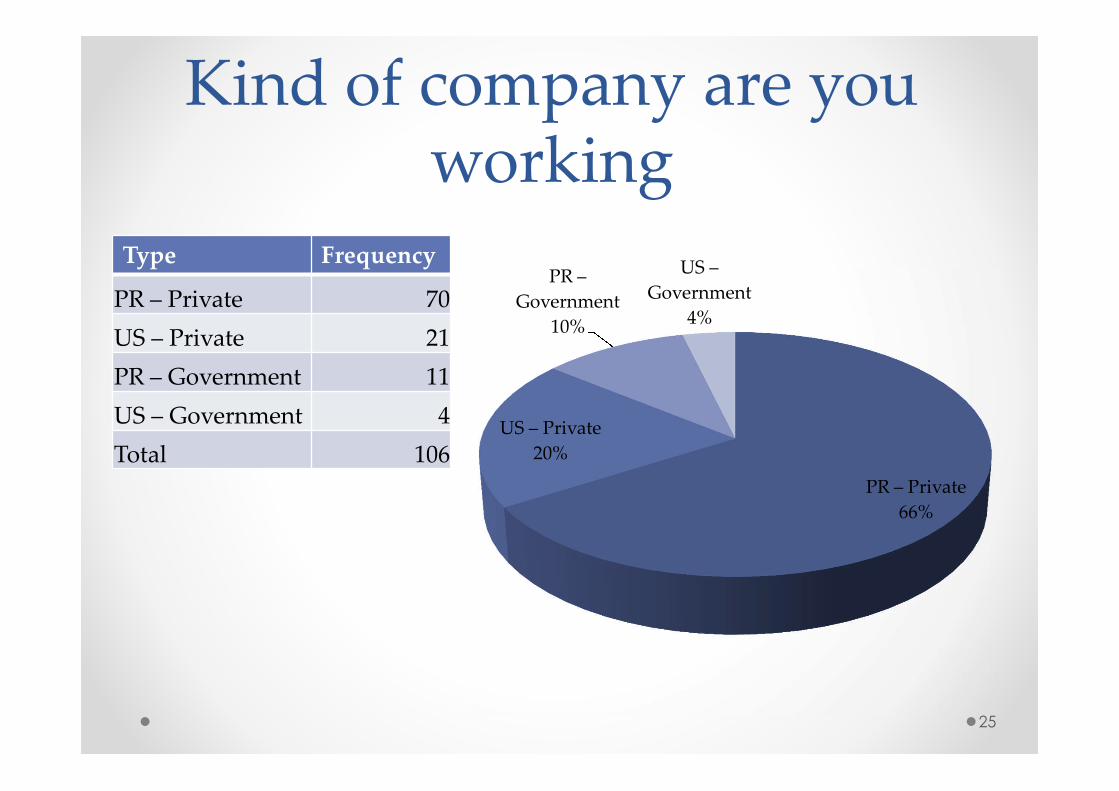
Kind of company are youworking
Type Frequency
PR – Private 70
US – Private 21
PR – Government 11
US – Government 4
Total 106
25
PR – Private
66%
US – Private
20%
PR –
Government
10%
US –
Government
4%
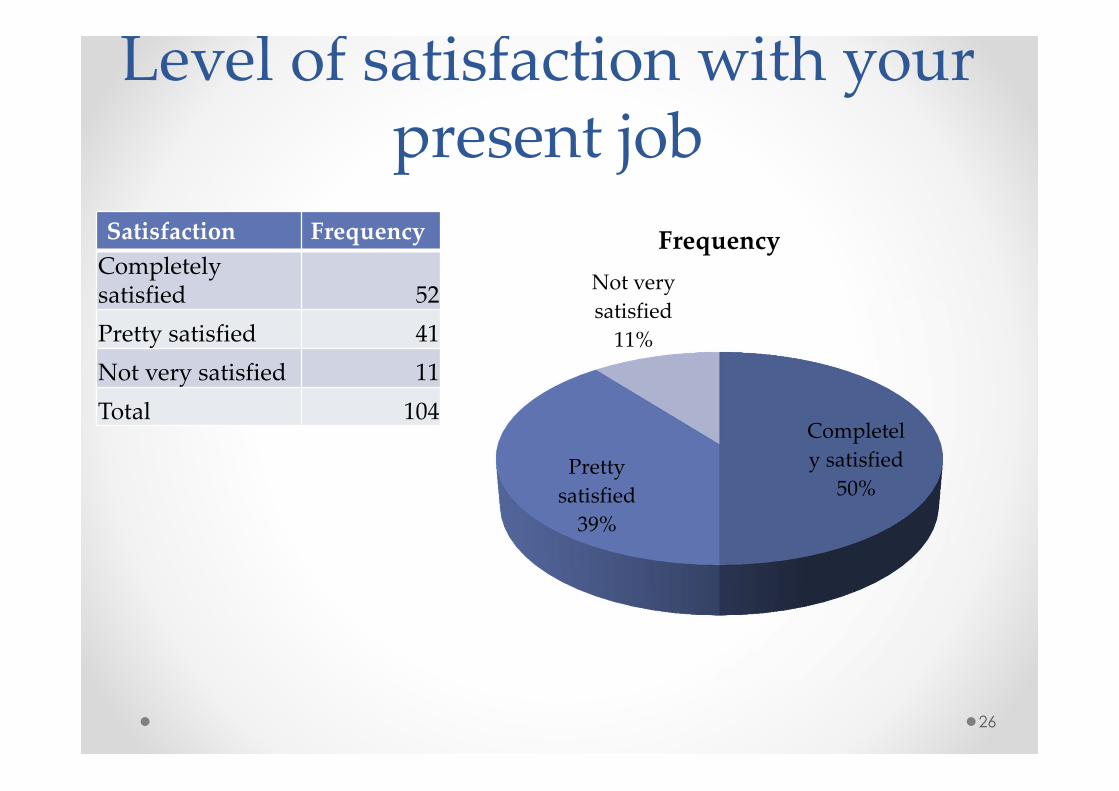
Level of satisfaction with yourpresent job
Satisfaction Frequency
Completelysatisfied 52
Pretty satisfied 41
Not very satisfied 11
Total 104
26
Completel
y satisfied
50%Pretty
satisfied
39%
Not very
satisfied
11%
Frequency
COOP and Placement Office
27
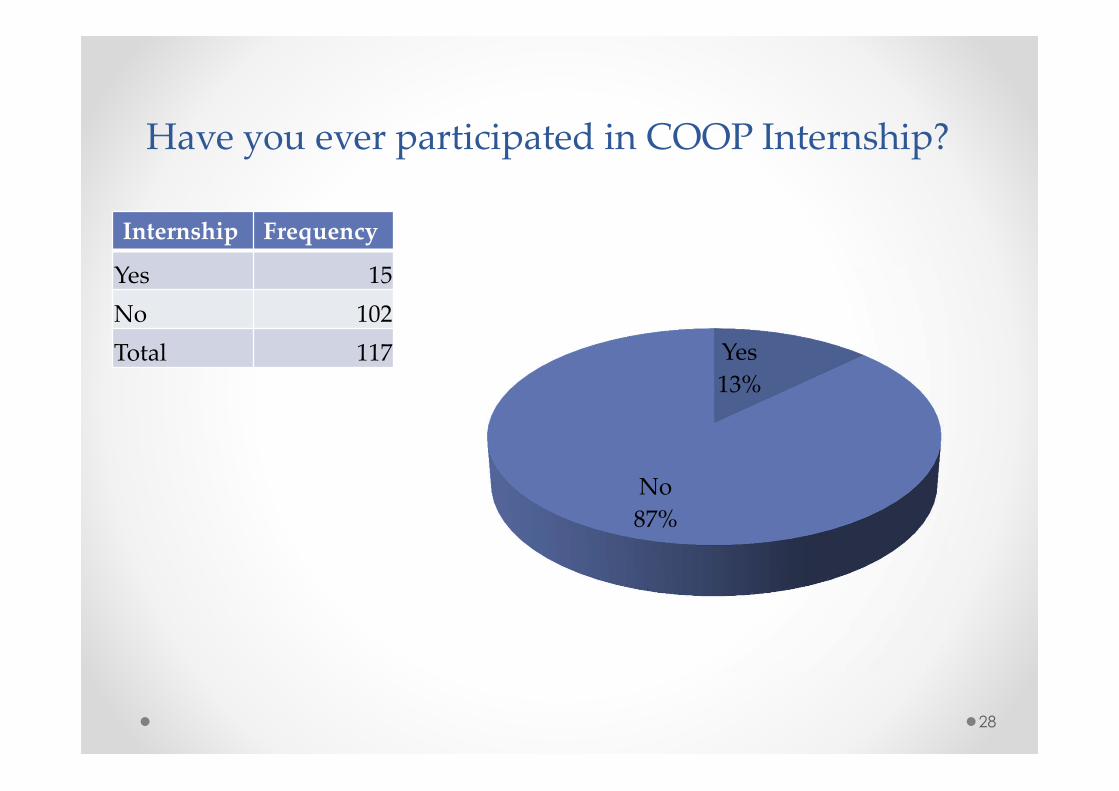
Have you ever participated in COOP Internship?
Internship Frequency
Yes 15
No 102
Total 117
28
Yes
13%
No
87%
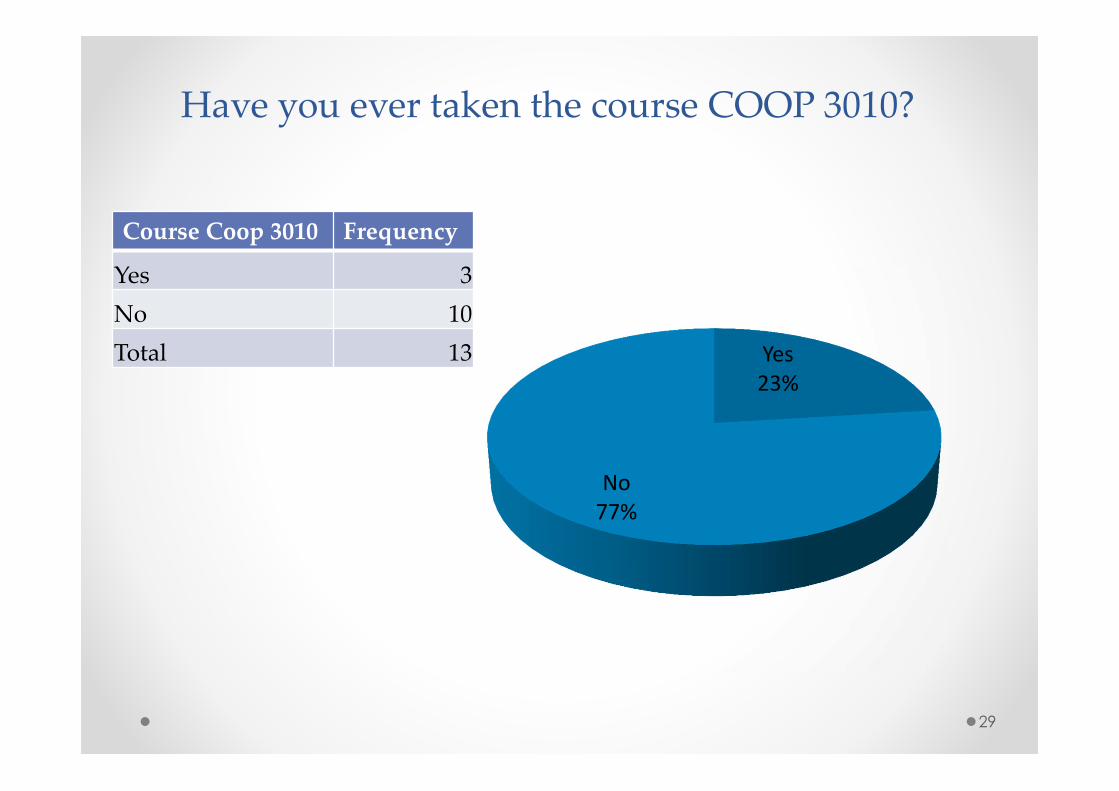
Have you ever taken the course COOP 3010?
Course Coop 3010 Frequency
Yes 3
No 10
Total 13
29
Yes23%
No77%
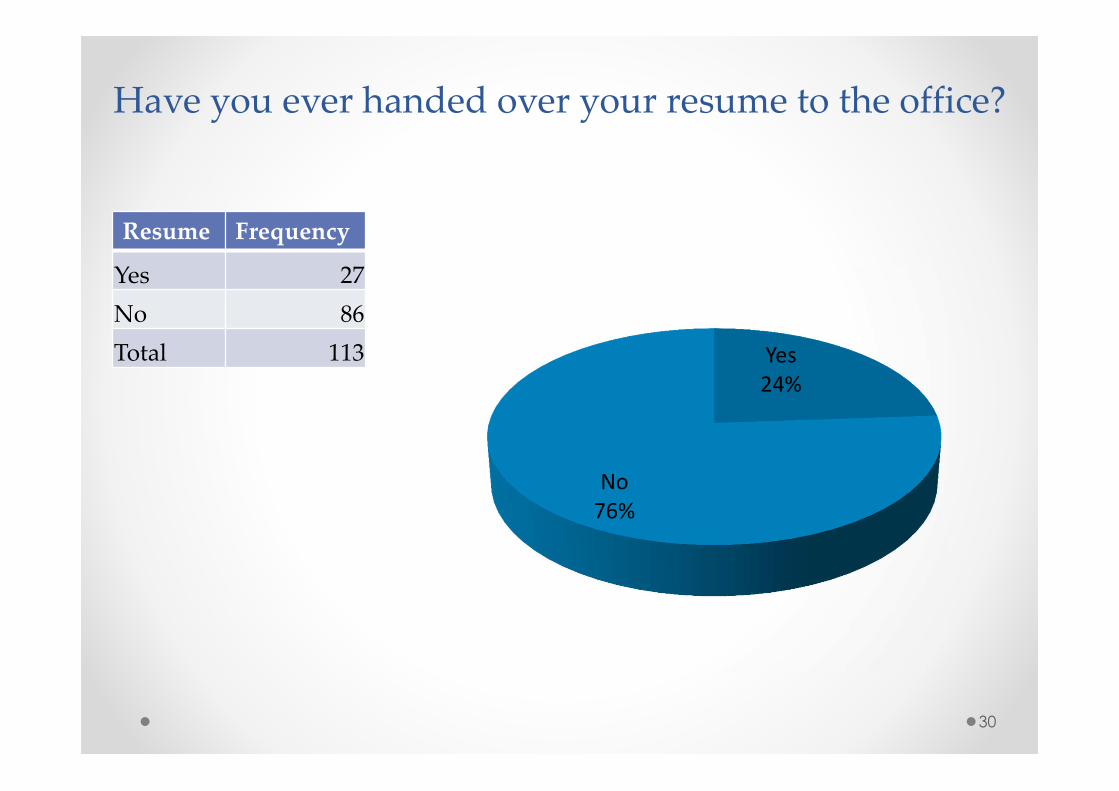
Have you ever handed over your resume to the office?
Resume Frequency
Yes 27
No 86
Total 113
30
Yes24%
No76%
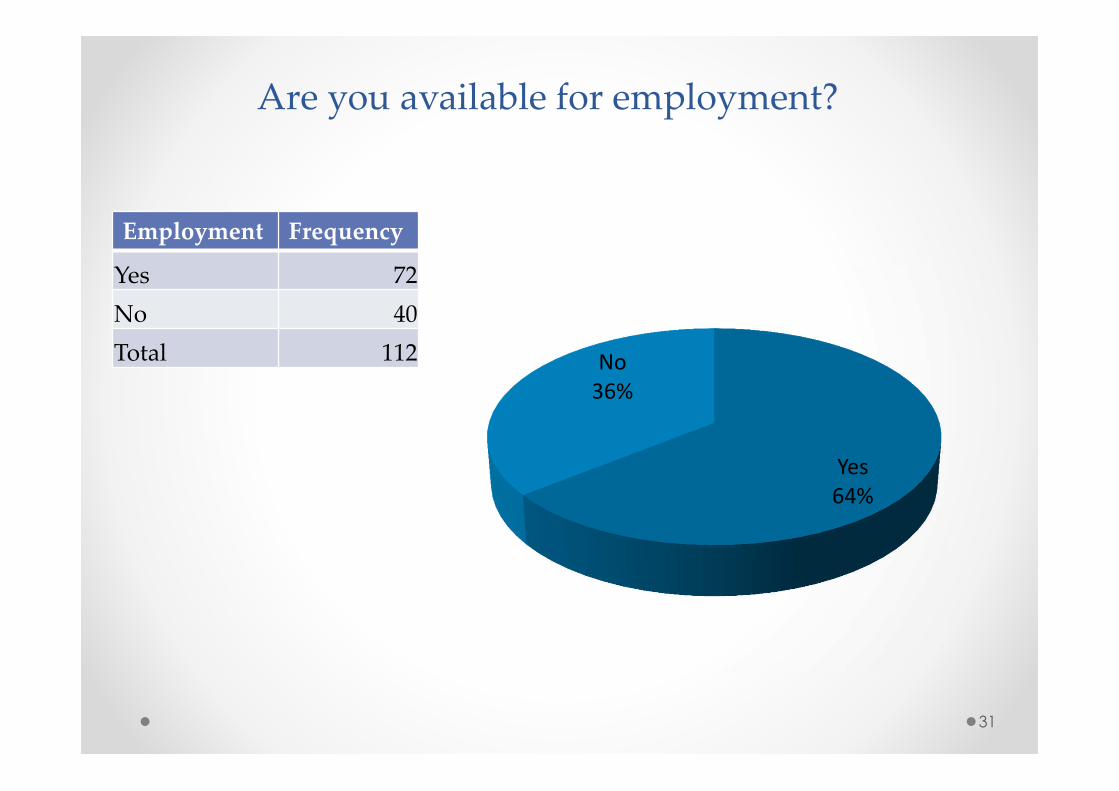
Are you available for employment?
Employment Frequency
Yes 72
No 40
Total 112
31
Yes64%
No36%
Professional Development
32

Are you currently enrolled or have you alreadycompleted doctorate program?
Doctorate program Frequency
Yes 1
No 110
Total 111
33
Yes2%
No98%

Fundamental of Engineering Examination (FEE)
FEE Frequency
Yes 46
No 39
Haven’t taken it 25
Total 110
34
Yes42%
No35%
Haven’ttaken it
23%
Level of Satisfaction*
35
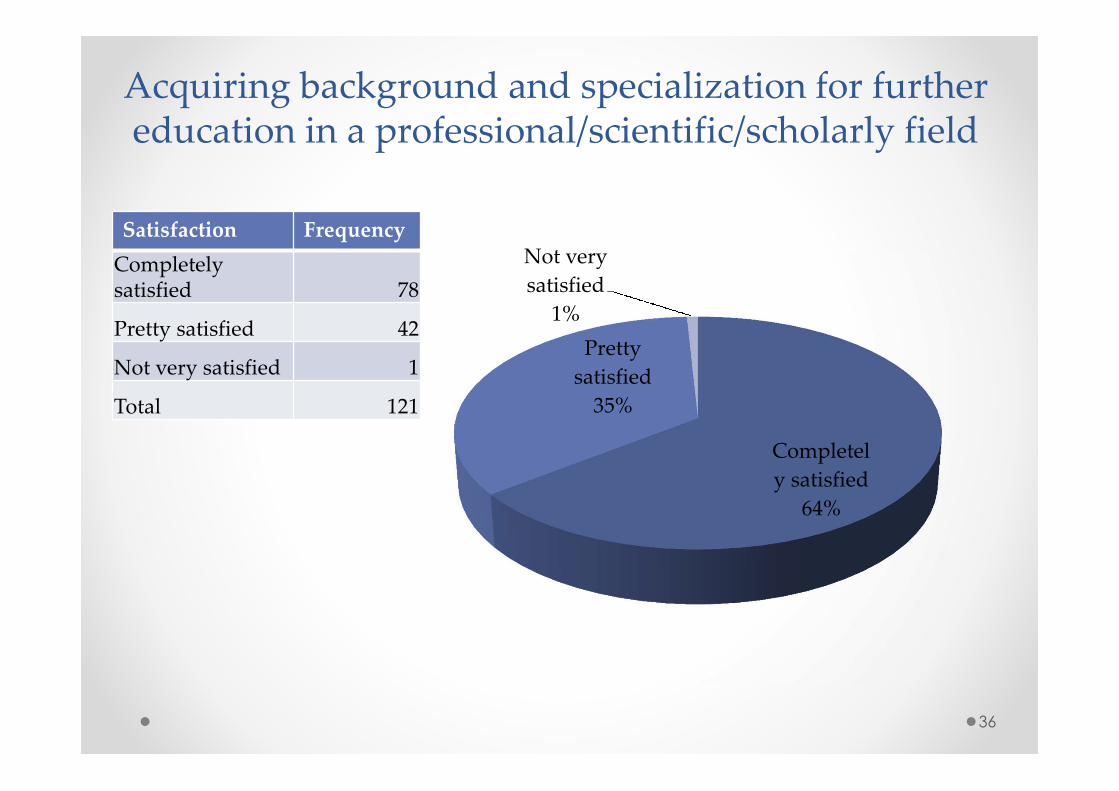
Acquiring background and specialization for furthereducation in a professional/scientific/scholarly field
Satisfaction Frequency
Completelysatisfied 78
Pretty satisfied 42
Not very satisfied 1
Total 121
36
Completel
y satisfied
64%
Pretty
satisfied
35%
Not very
satisfied
1%

Your ability to write clearly, correctly, and effectively
Satisfaction Frequency
Completelysatisfied 90
Pretty satisfied 30
Not very satisfied 0
Total 120
37
Completelysatisfied
75%
Prettysatisfied
25%
Not verysatisfied
0%
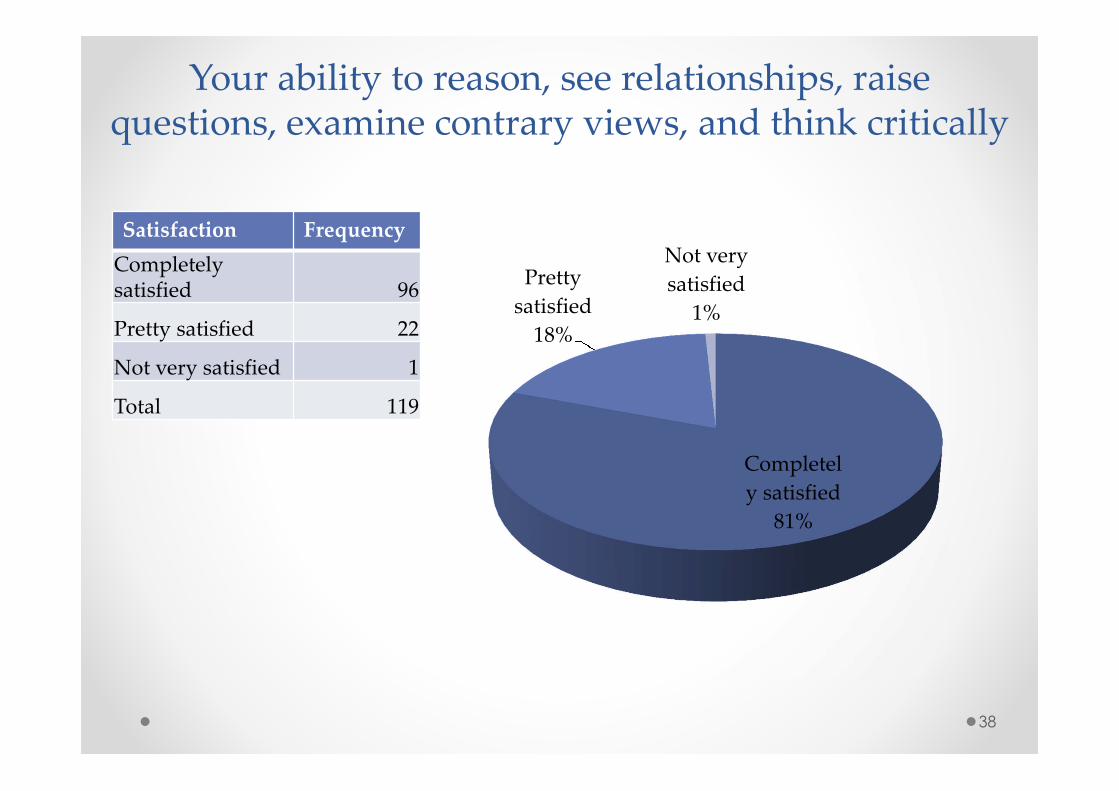
Your ability to reason, see relationships, raisequestions, examine contrary views, and think critically
Satisfaction Frequency
Completelysatisfied 96
Pretty satisfied 22
Not very satisfied 1
Total 119
38
Completel
y satisfied
81%
Pretty
satisfied
18%
Not very
satisfied
1%
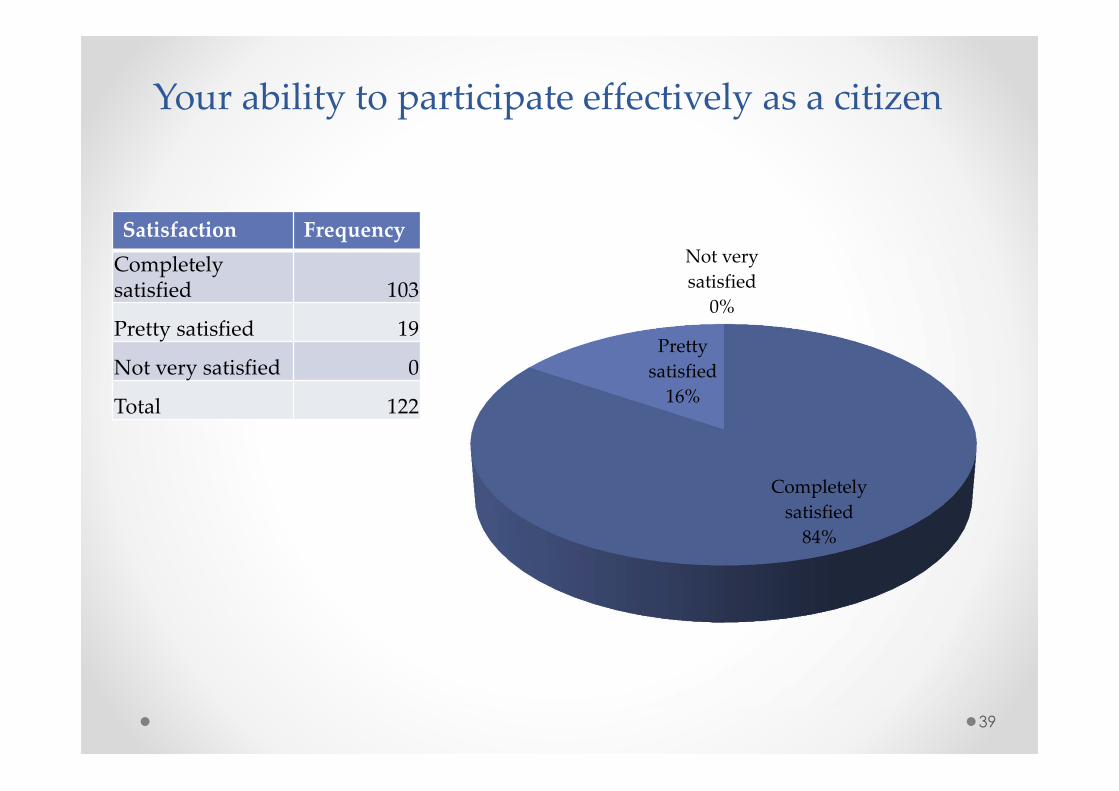
Your ability to participate effectively as a citizen
Satisfaction Frequency
Completelysatisfied 103
Pretty satisfied 19
Not very satisfied 0
Total 122
39
Completely
satisfied
84%
Pretty
satisfied
16%
Not very
satisfied
0%
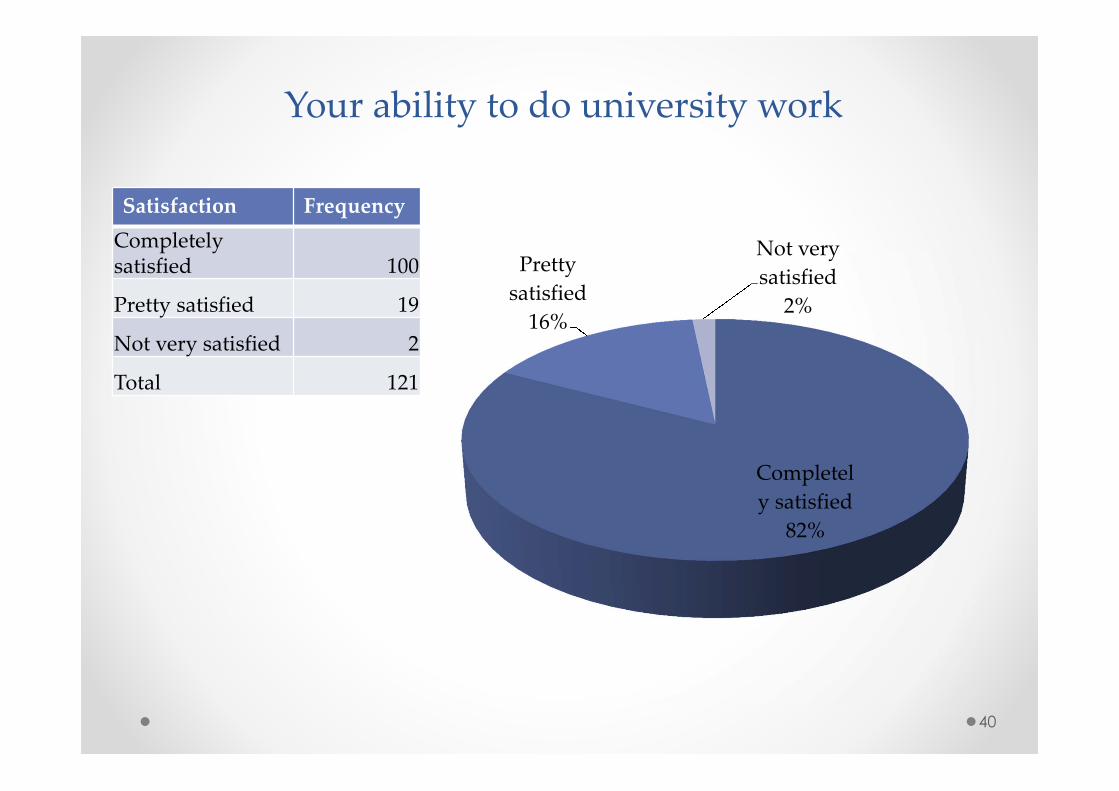
Your ability to do university work
Satisfaction Frequency
Completelysatisfied 100
Pretty satisfied 19
Not very satisfied 2
Total 121
40
Completel
y satisfied
82%
Pretty
satisfied
16%
Not very
satisfied
2%

The effort you put into your university education
Satisfaction Frequency
Completelysatisfied 102
Pretty satisfied 19
Not very satisfied 1
Total 122
41
Completel
y satisfied
84%
Pretty
satisfied
15%
Not very
satisfied
1%

Your involvement with faculty
Satisfaction Frequency
Completelysatisfied 75
Pretty satisfied 41
Not very satisfied 5
Total 121
42
Completel
y satisfied
62%
Pretty
satisfied
34%
Not very
satisfied
4%

Your access to faculty outside of the classroom
Satisfaction Frequency
Completelysatisfied 70
Pretty satisfied 44
Not very satisfied 3
Total 117
43
Completel
y satisfied
60%
Pretty
satisfied
38%
Not very
satisfied
2%
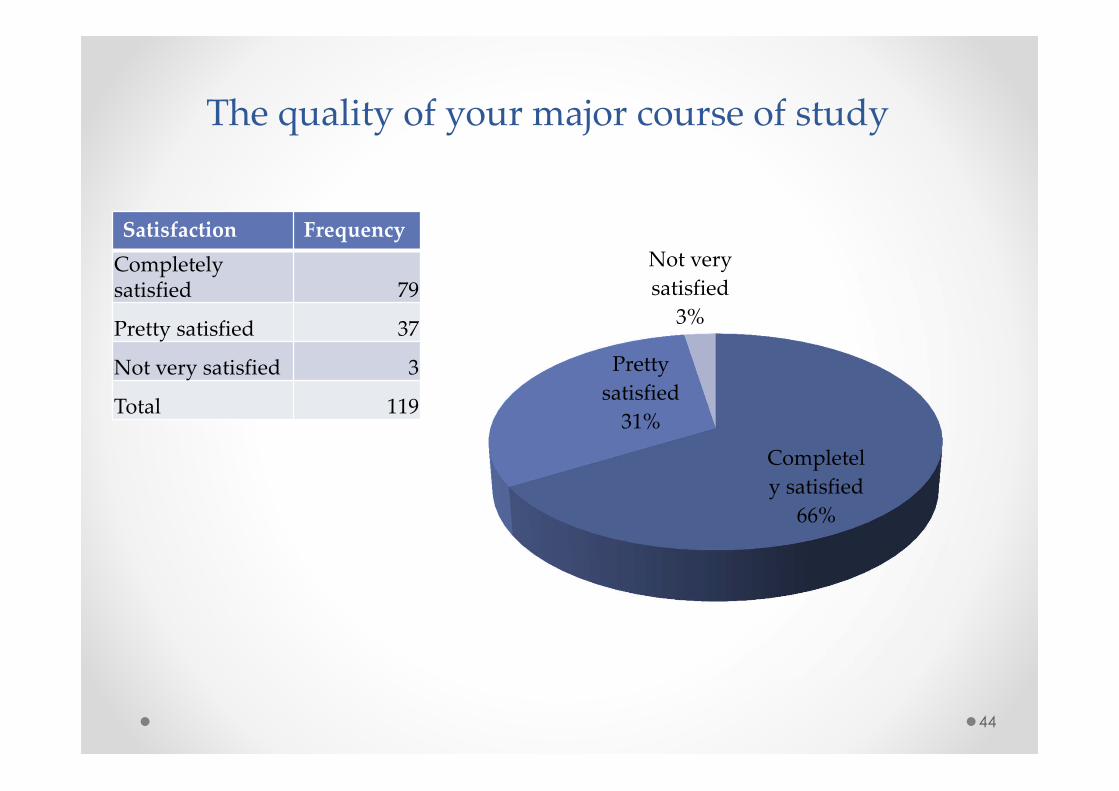
The quality of your major course of study
Satisfaction Frequency
Completelysatisfied 79
Pretty satisfied 37
Not very satisfied 3
Total 119
44
Completel
y satisfied
66%
Pretty
satisfied
31%
Not very
satisfied
3%
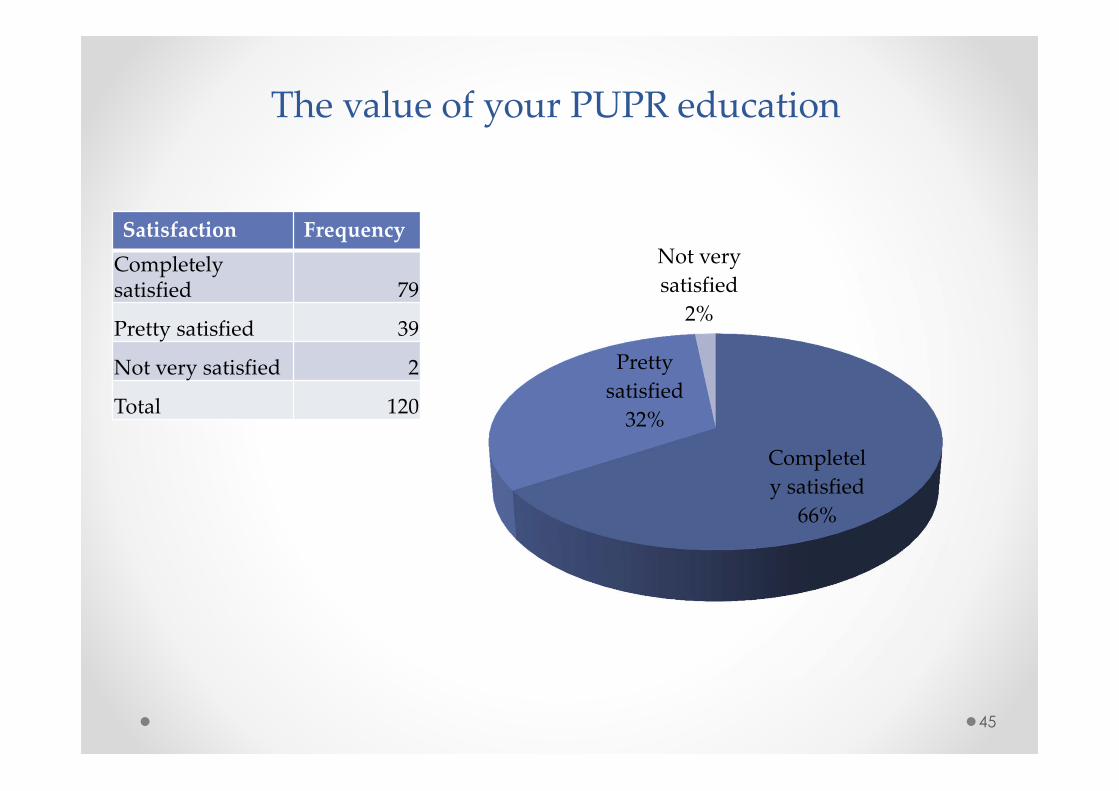
The value of your PUPR education
Satisfaction Frequency
Completelysatisfied 79
Pretty satisfied 39
Not very satisfied 2
Total 120
45
Completel
y satisfied
66%
Pretty
satisfied
32%
Not very
satisfied
2%
Reference* California State University, Chico (n.d.) Retrieved August 30,
2012, fromhttp://www.csuchico.edu/vpaa/wasc/docs/CPR_Standard_4
/CFR_4.5/Grad_Survey_Sp05.pdf