Embed Size (px)
DESCRIPTION
Coordinate Algebra Practice EOCT Answers Unit 3. #1. Unit 3. Two lines are graphed on this coordinate plane. Which point appears to be a solution of the equations of both lines?. A. (0, –2) B. (0, 4) C. (2, 0) D. (3, 1). . #2. Unit 3. - PowerPoint PPT Presentation
Citation preview
Coordinate AlgebraPractice
EOCT AnswersUnit 3
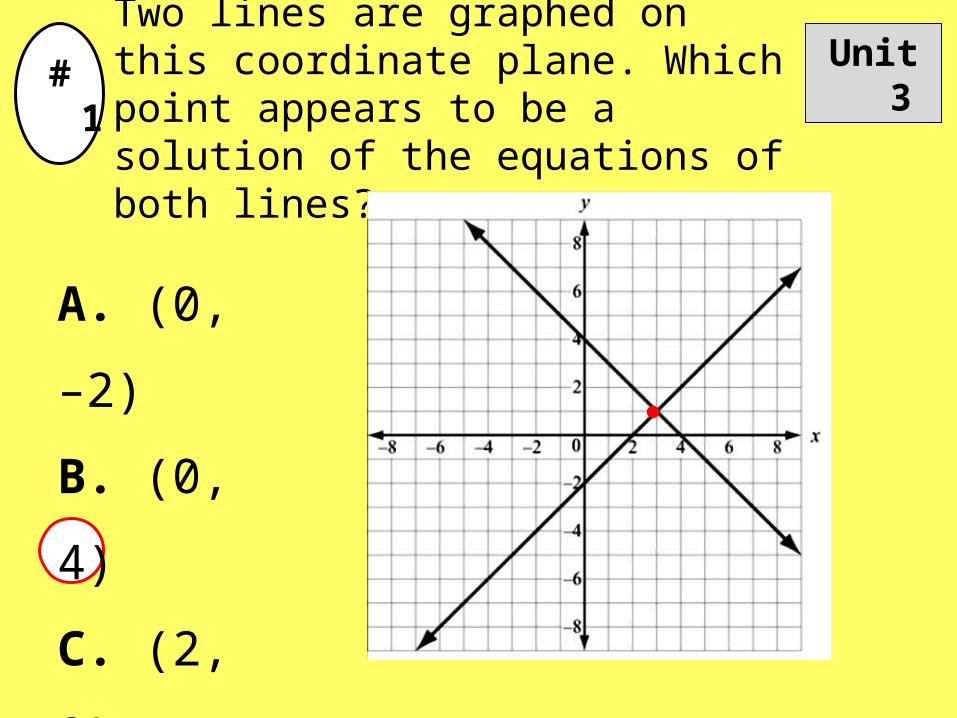
#1 Unit 3Two lines are graphed on this coordinate plane. Which point appears to be a solution of the equations of both lines?
A. (0, –2)
B. (0, 4)
C. (2, 0)
D. (3, 1)
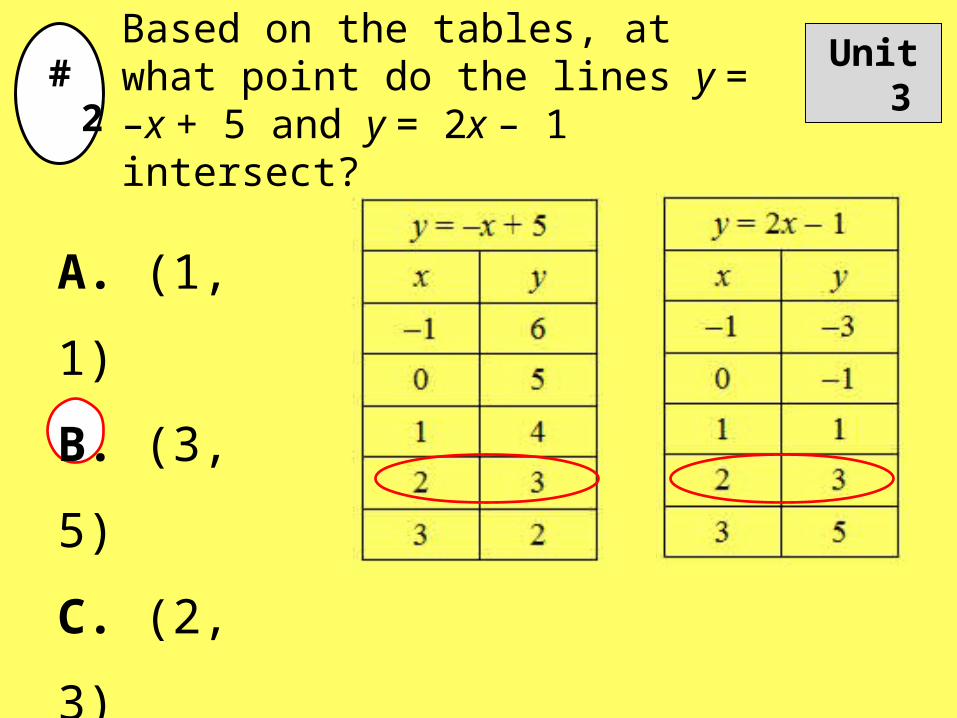
#2 Unit 3Based on the tables, at what point do the lines y = –x + 5 and y = 2x – 1 intersect?
A. (1, 1)
B. (3, 5)
C. (2, 3)
D. (3, 2)
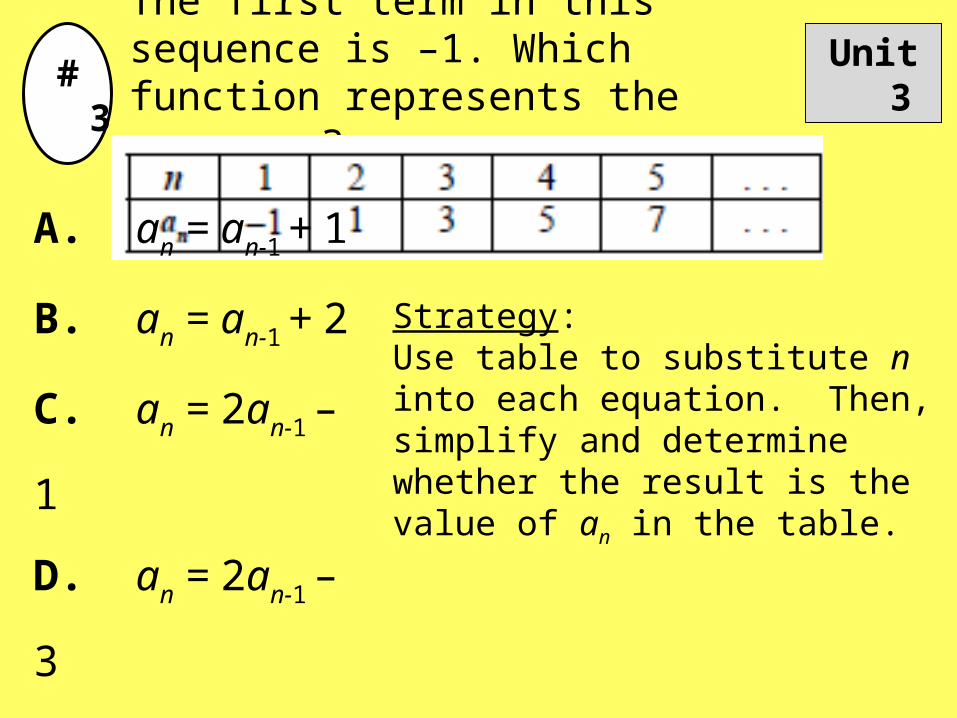
#3 Unit 3The first term in this sequence is –1. Which function represents the sequence?
A. an = an-1 + 1
B. an = an-1 + 2
C. an = 2an-1 – 1
D. an = 2an-1 – 3
Strategy: Use table to substitute n into each equation. Then, simplify and determine whether the result is the value of an in the table.
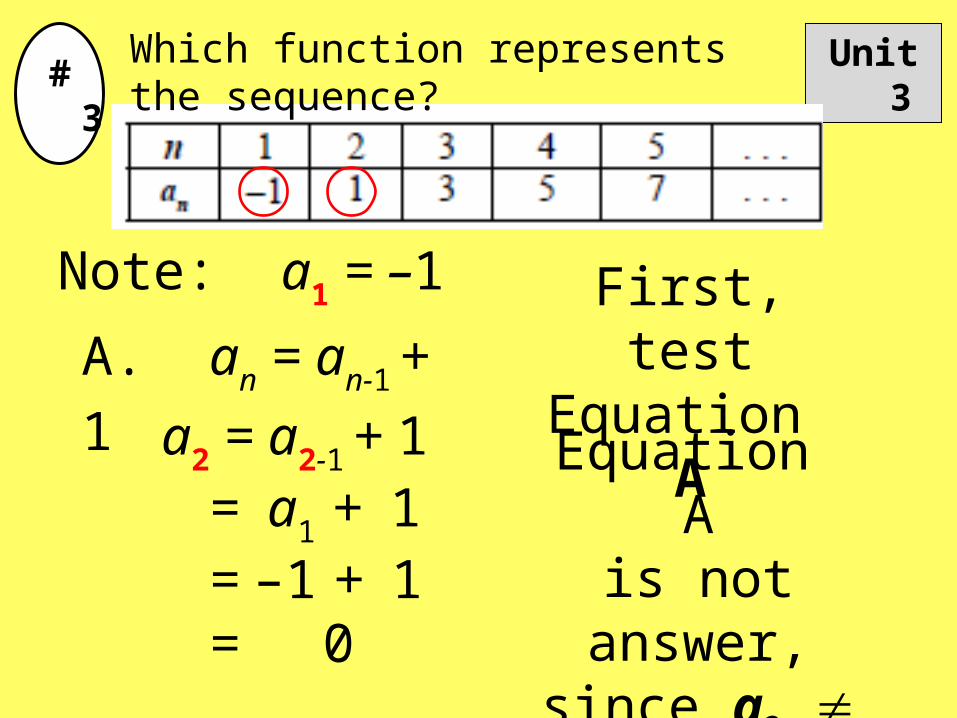
#3 Unit 3Which function represents the sequence?
A. an = an-1 + 1
Note: a1 = –1
a2 = a2-1 + 1= a1 + 1= –1 + 1= 0
Equation Ais not answer,since a2 1
First, testEquation A
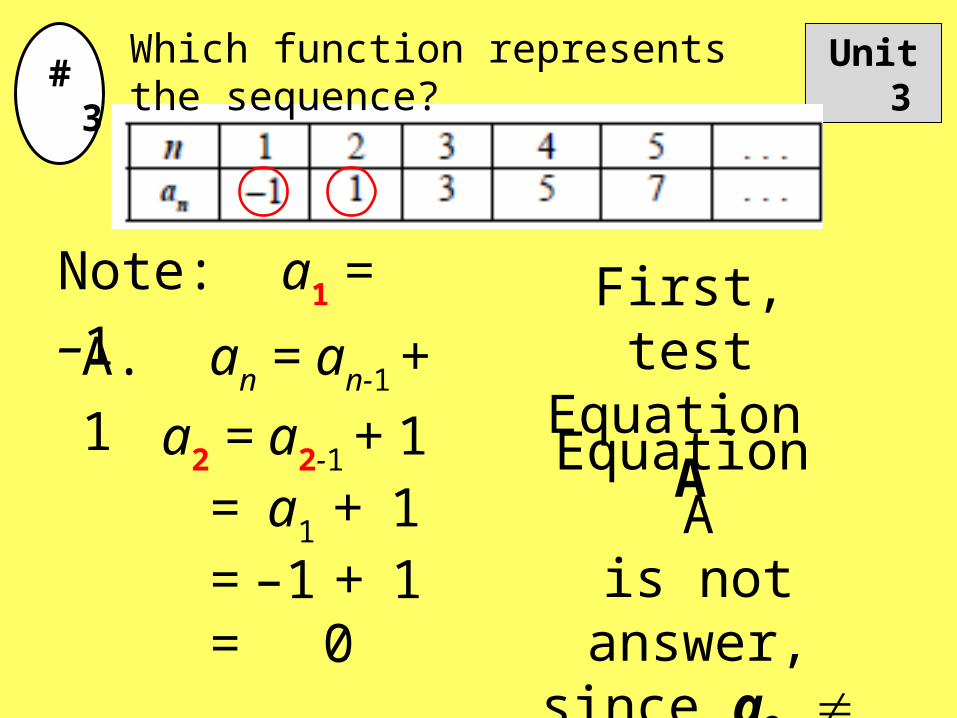
#3 Unit 3Which function represents the sequence?
A. an = an-1 + 1
Note: a1 = –1
a2 = a2-1 + 1= a1 + 1= –1 + 1= 0
Equation Ais not answer,since a2 1
First, testEquation A
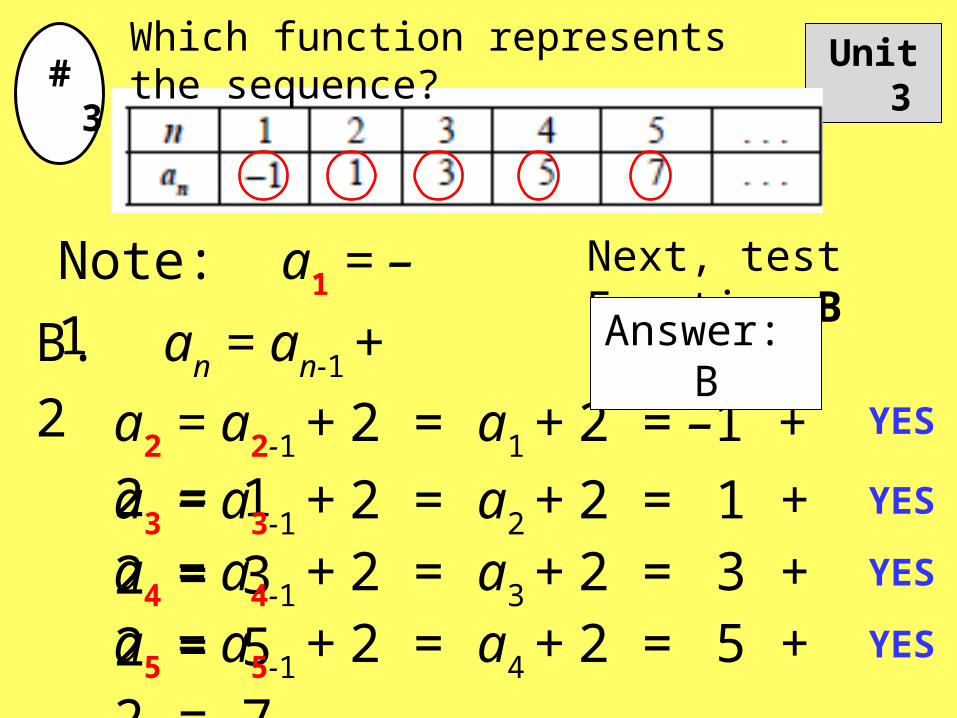
#3 Unit 3Which function represents the sequence?
B. an = an-1 + 2
Note: a1 = –1
a2 = a2-1 + 2 = a1 + 2 = –1 + 2 = 1
Next, test Equation B
a3 = a3-1 + 2 = a2 + 2 = 1 + 2 = 3a4 = a4-1 + 2 = a3 + 2 = 3 + 2 = 5a5 = a5-1 + 2 = a4 + 2 = 5 + 2 = 7
YES
YES
YES
YES
Answer: B
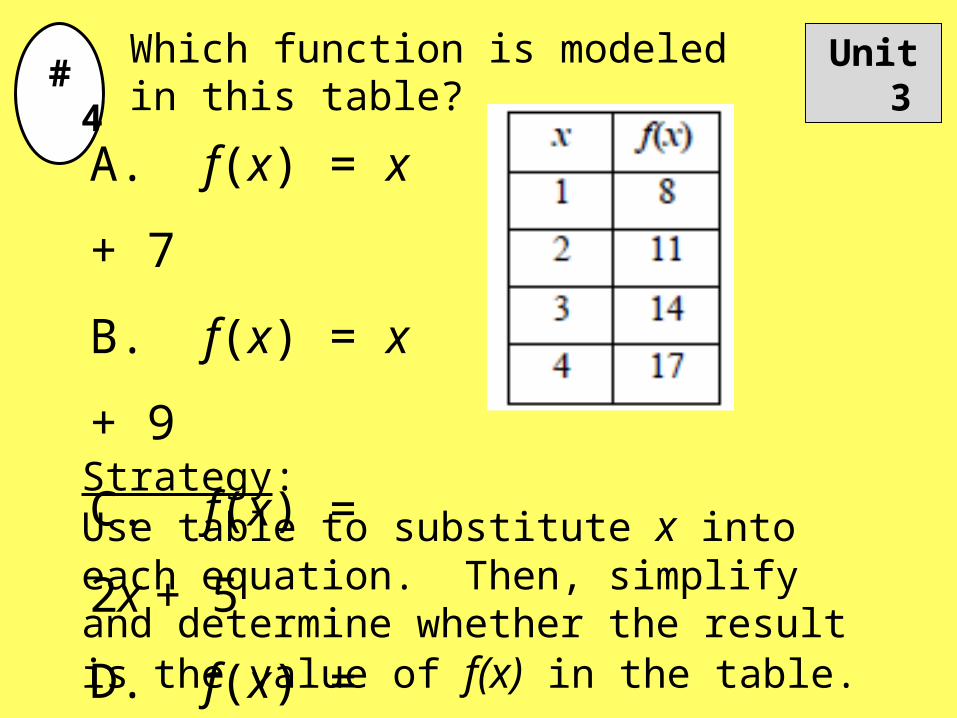
#4 Unit 3Which function is modeled in this table?
A. f(x) = x + 7
B. f(x) = x + 9
C. f(x) = 2x + 5
D. f(x) = 3x + 5
Strategy: Use table to substitute x into each equation. Then, simplify and determine whether the result is the value of f(x) in the table.
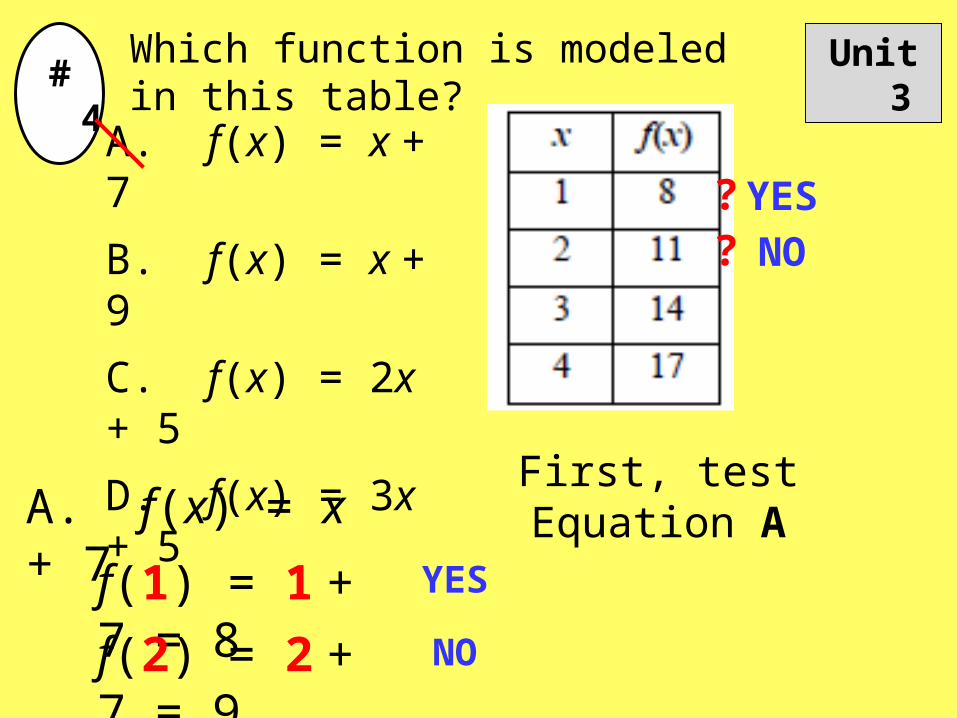
#4 Unit 3Which function is modeled in this table?
A. f(x) = x + 7
B. f(x) = x + 9
C. f(x) = 2x + 5
D. f(x) = 3x + 5
First, test Equation AA. f(x) = x + 7
f(1) = 1 + 7 = 8
f(2) = 2 + 7 = 9
?
YES
YES?
NO
NO
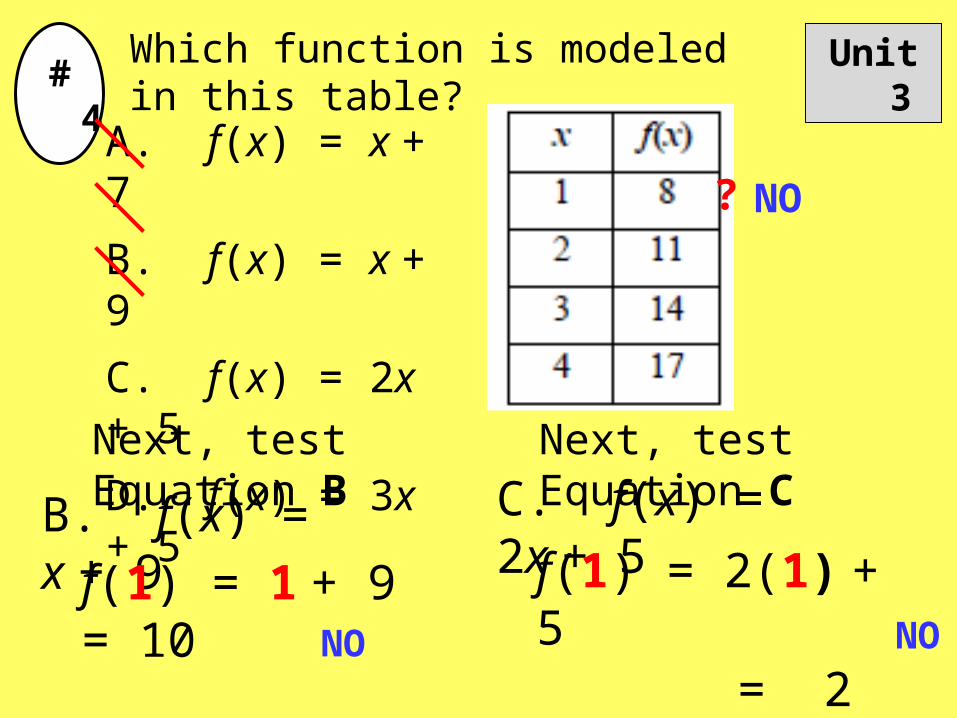
#4 Unit 3Which function is modeled in this table?
A. f(x) = x + 7
B. f(x) = x + 9
C. f(x) = 2x + 5
D. f(x) = 3x + 5
?
Next, test Equation B
B. f(x) = x + 9
f(1) = 1 + 9 = 10NO
NO
Next, test Equation C
C. f(x) = 2x + 5
f(1) = 2(1) + 5 = 2 + 5 = 7 NO
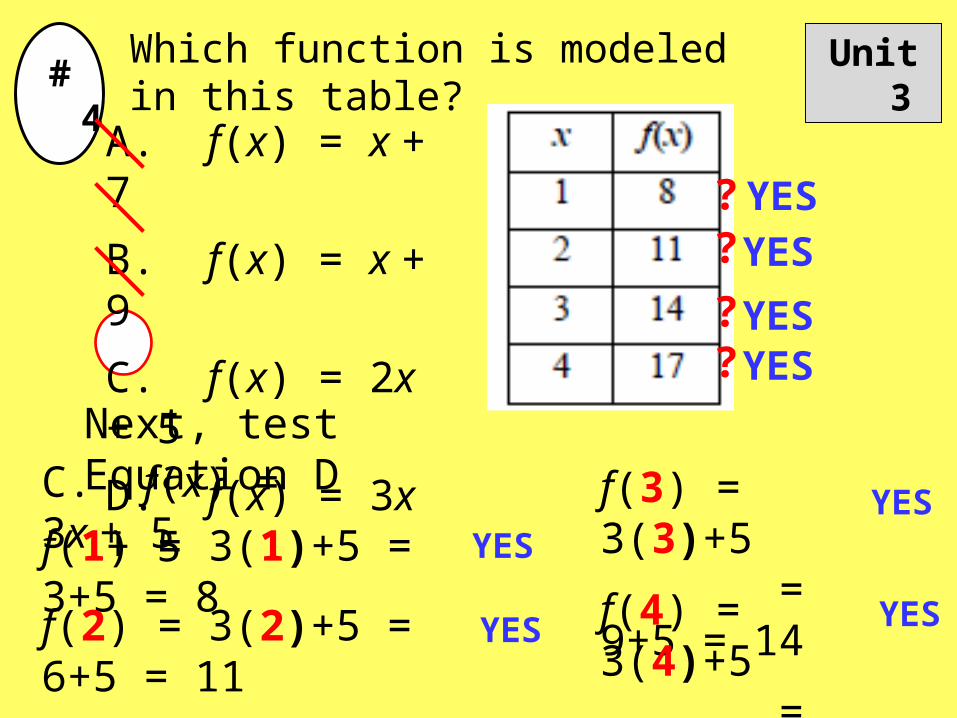
#4 Unit 3Which function is modeled in this table?
A. f(x) = x + 7
B. f(x) = x + 9
C. f(x) = 2x + 5
D. f(x) = 3x + 5
?YES
Next, test Equation DC. f(x) = 3x + 5
f(1) = 3(1)+5 = 3+5 = 8
f(2) = 3(2)+5 = 6+5 = 11
f(3) = 3(3)+5 = 9+5 = 14
f(4) = 3(4)+5 = 12+5 = 17
YES
?
YES
YES
?
YES
YES?
YES
YES
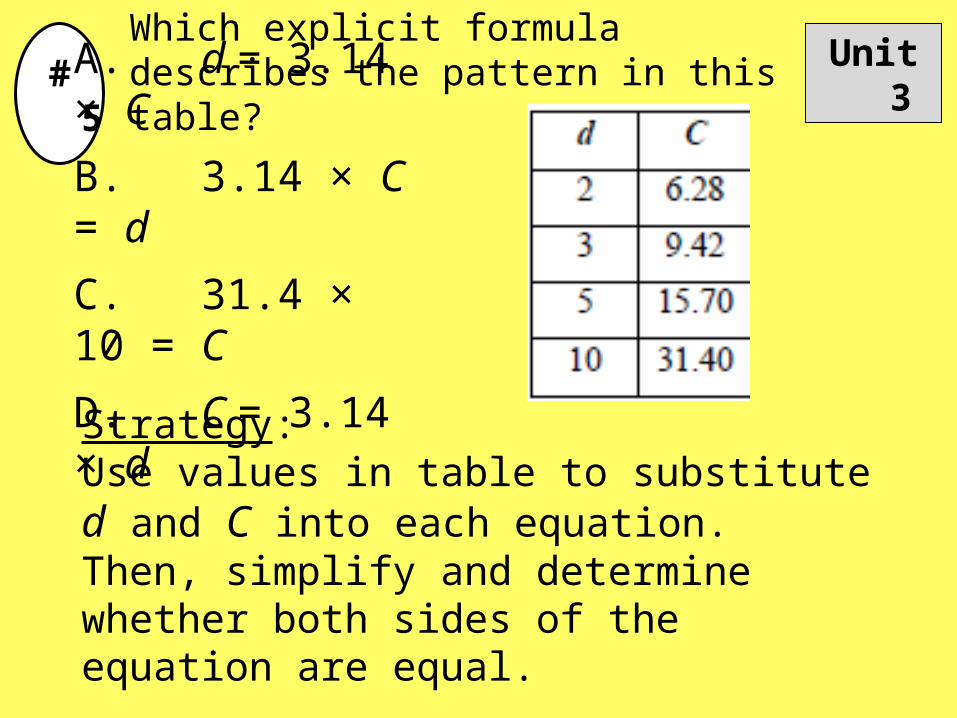
#5 Unit 3Which explicit formula describes the pattern in this table?
Strategy: Use values in table to substitute d and C into each equation. Then, simplify and determine whether both sides of the equation are equal.
A. d = 3.14 × C
B. 3.14 × C = d
C. 31.4 × 10 = C
D. C = 3.14 × d
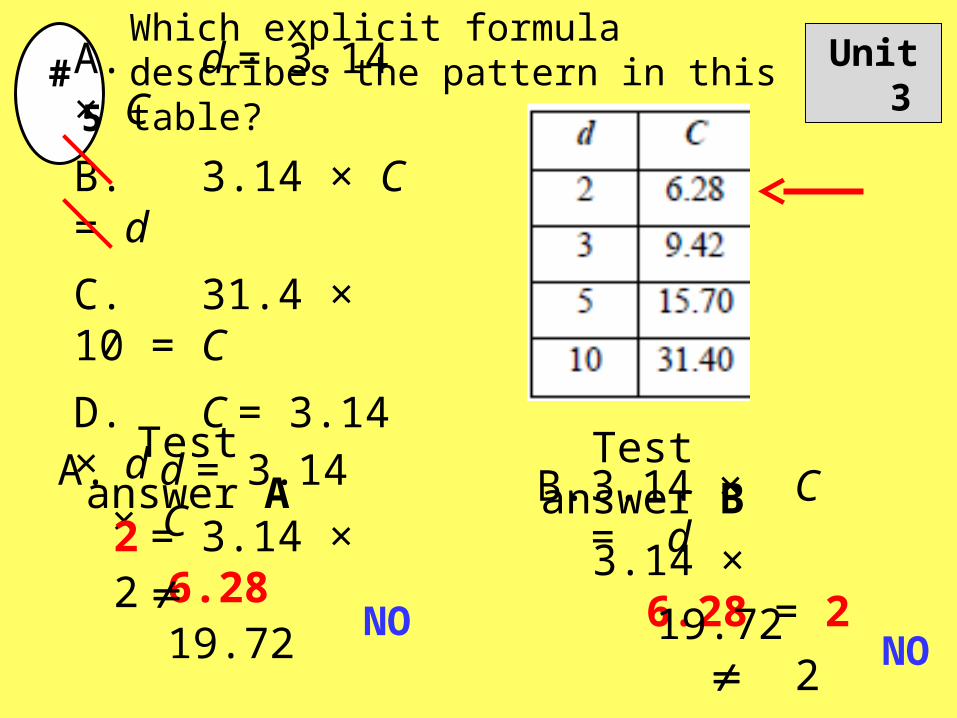
#5 Unit 3Which explicit formula describes the pattern in this table?
A. d = 3.14 × C
B. 3.14 × C = d
C. 31.4 × 10 = C
D. C = 3.14 × d
Test answer AA. d = 3.14 × C
2 = 3.14 × 6.282 19.72
Test answer B
NO3.14 × 6.28 = 2
19.72 2
B. 3.14 × C = d
NO
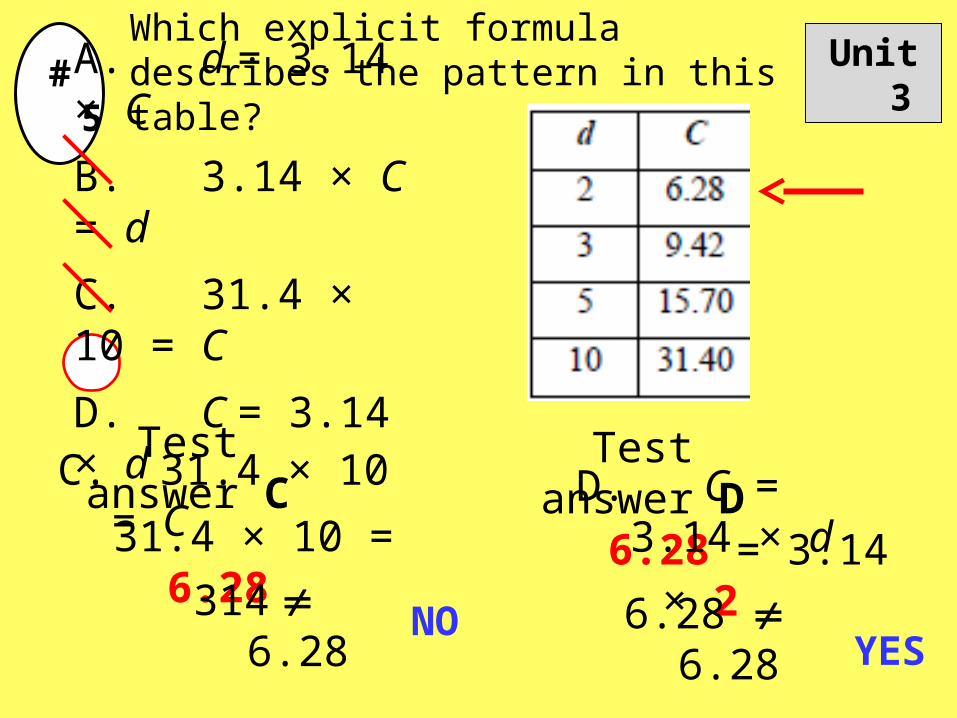
#5 Unit 3Which explicit formula describes the pattern in this table?
A. d = 3.14 × C
B. 3.14 × C = d
C. 31.4 × 10 = C
D. C = 3.14 × d
Test answer CC. 31.4 × 10 = C
31.4 × 10 = 6.28314
6.28
Test answer D
NO6.28 = 3.14 × 26.28
6.28
D. C = 3.14 × d
YES
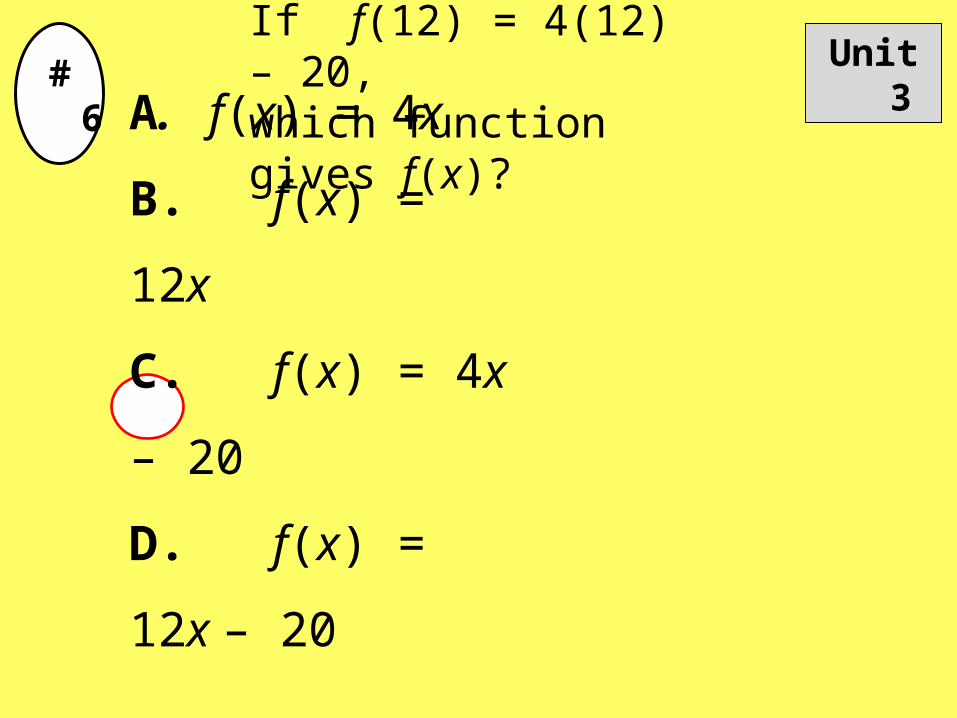
#6 Unit 3If f(12) = 4(12) – 20, which function gives f(x)?
A. f(x) = 4x
B. f(x) = 12x
C. f(x) = 4x – 20
D. f(x) = 12x – 20
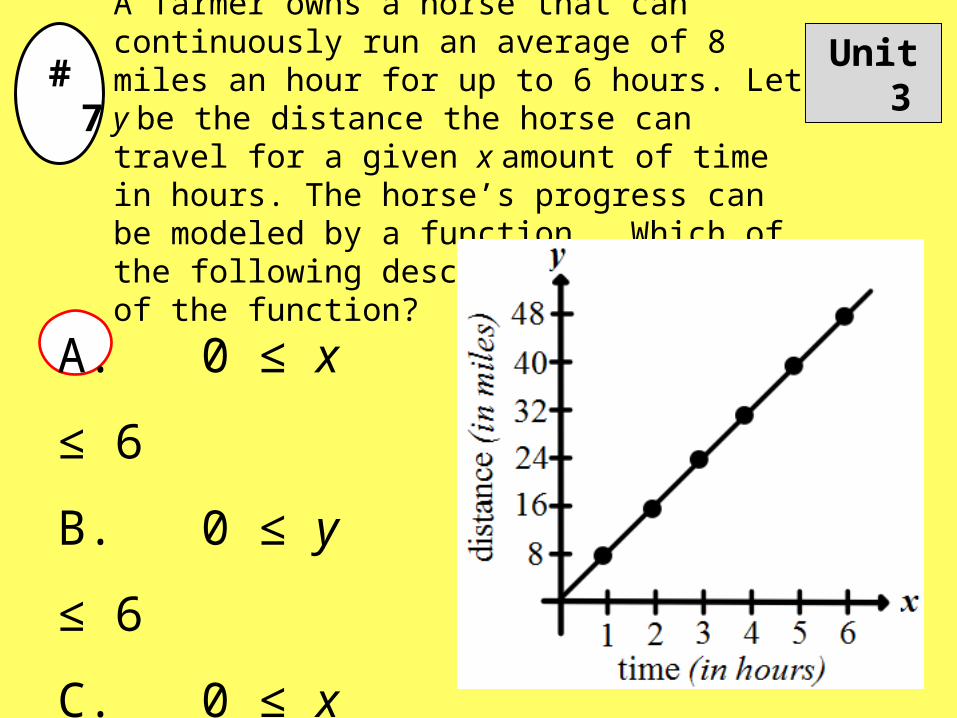
#7 Unit 3A farmer owns a horse that can continuously run an average of 8 miles an hour for up to 6 hours. Let y be the distance the horse can travel for a given x amount of time in hours. The horse’s progress can be modeled by a function. Which of the following describes the domain of the function?
A. 0 ≤ x ≤ 6
B. 0 ≤ y ≤ 6
C. 0 ≤ x ≤ 48
D. 0 ≤ y ≤ 48
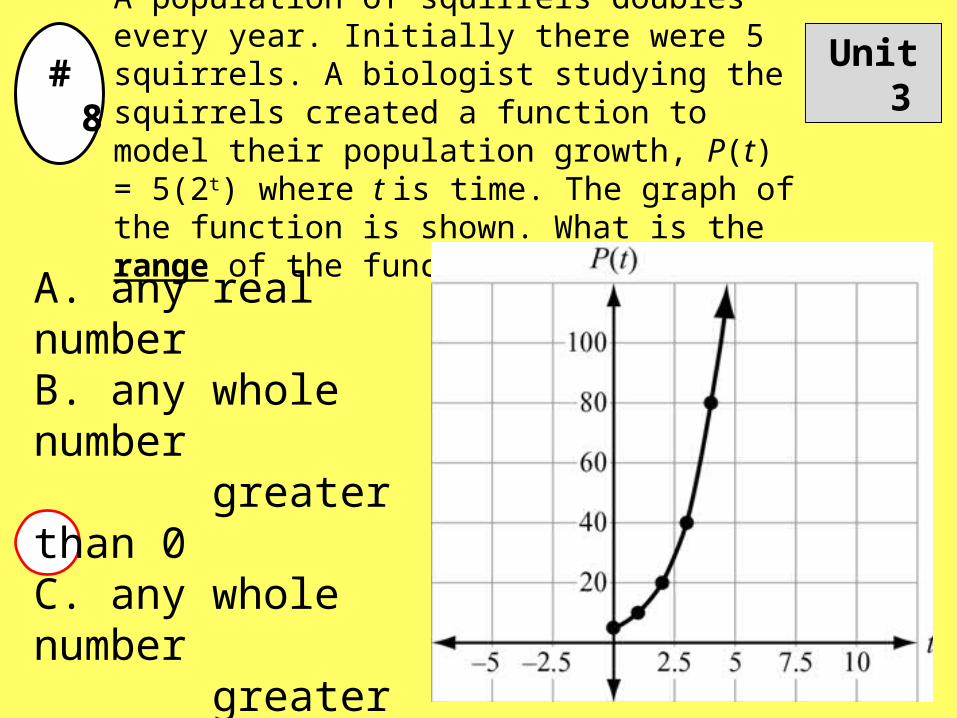
#8 Unit 3A population of squirrels doubles every year. Initially there were 5 squirrels. A biologist studying the squirrels created a function to model their population growth, P(t) = 5(2t) where t is time. The graph of the function is shown. What is the range of the function?
A. any real numberB. any whole number greater than 0C. any whole number greater than 5D. any whole number greater than or equal to 5
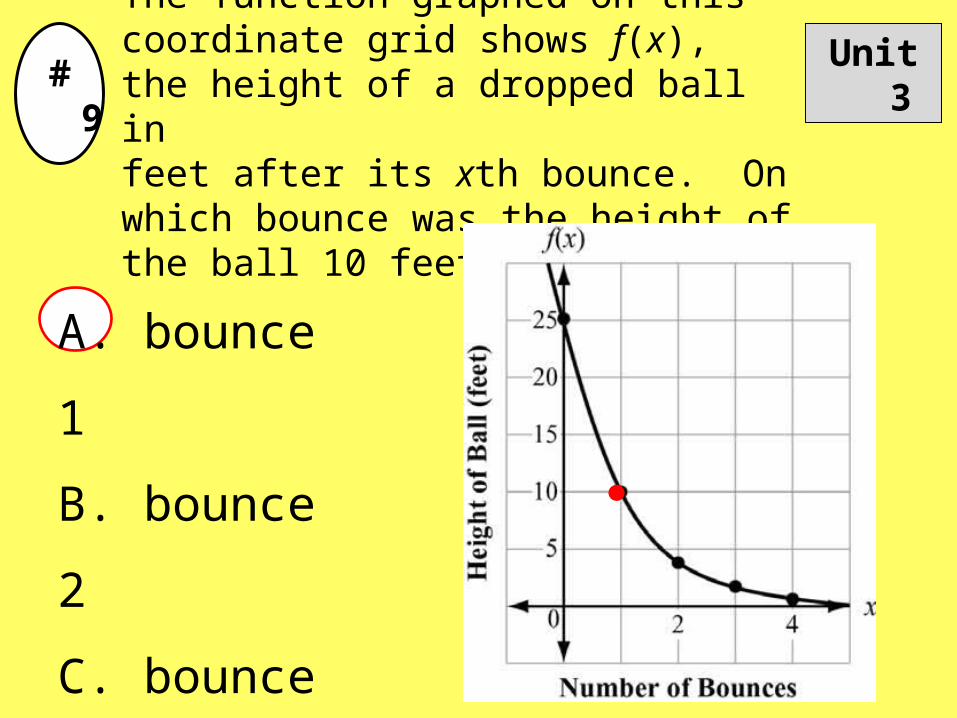
#9 Unit 3The function graphed on this coordinate grid shows f(x), the height of a dropped ball infeet after its xth bounce. On which bounce was the height of the ball 10 feet?
A. bounce 1
B. bounce 2
C. bounce 3
D. bounce 4
#10
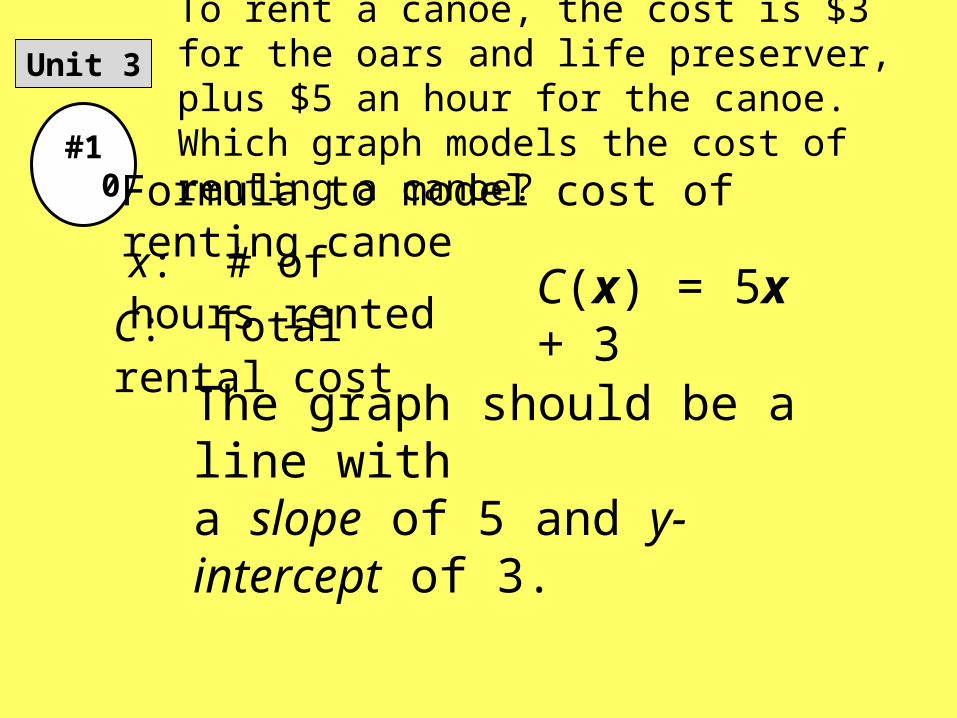
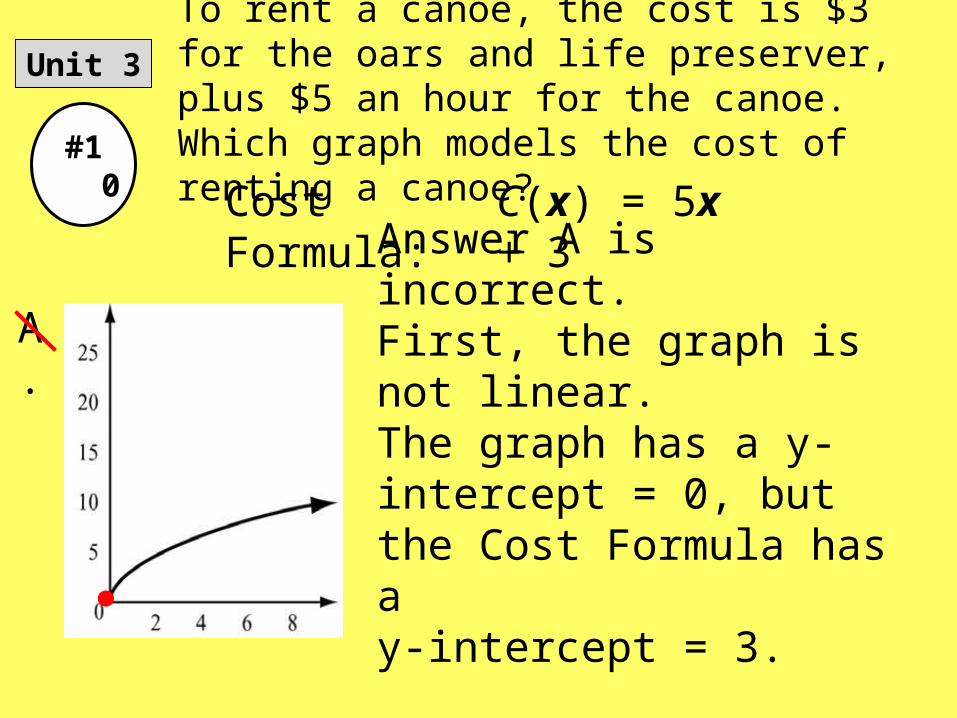
Unit 3 To rent a canoe, the cost is $3 for the oars and life preserver, plus $5 an hour for the canoe. Which graph models the cost of renting a canoe?
C(x) = 5x + 3
Formula to model cost of renting canoe
x: # of hours rented
C: Total rental cost
The graph should be a line witha slope of 5 and y-intercept of 3.
#10
Unit 3 To rent a canoe, the cost is $3 for the oars and life preserver, plus $5 an hour for the canoe. Which graph models the cost of renting a canoe?
A. Answer A is incorrect. First, the graph is not linear.The graph has a y-intercept = 0, but the Cost Formula has ay-intercept = 3.
C(x) = 5x + 3Cost Formula:
#10
Unit 3 To rent a canoe, the cost is $3 for the oars and life preserver, plus $5 an hour for the canoe. Which graph models the cost of renting a canoe?
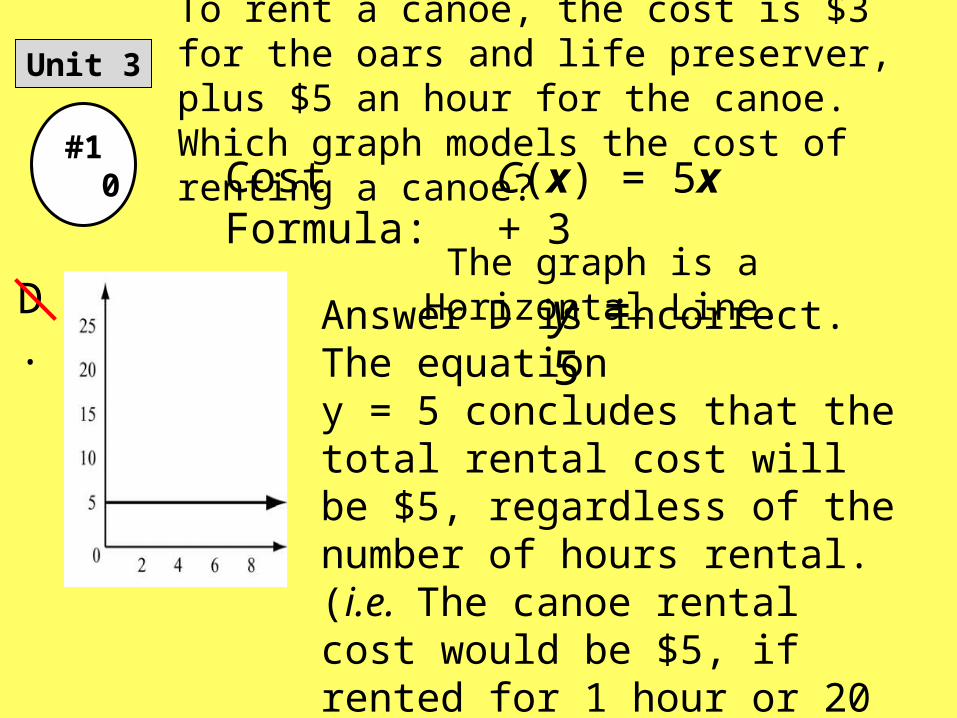
y = 5D. The graph is a Horizontal Line.
C(x) = 5x + 3Cost Formula:
Answer D is incorrect. The equation y = 5 concludes that the total rental cost will be $5, regardless of the number of hours rental. (i.e. The canoe rental cost would be $5, if rented for 1 hour or 20 hours.)
#10
Unit 3 To rent a canoe, the cost is $3 for the oars and life preserver, plus $5 an hour for the canoe. Which graph models the cost of renting a canoe?
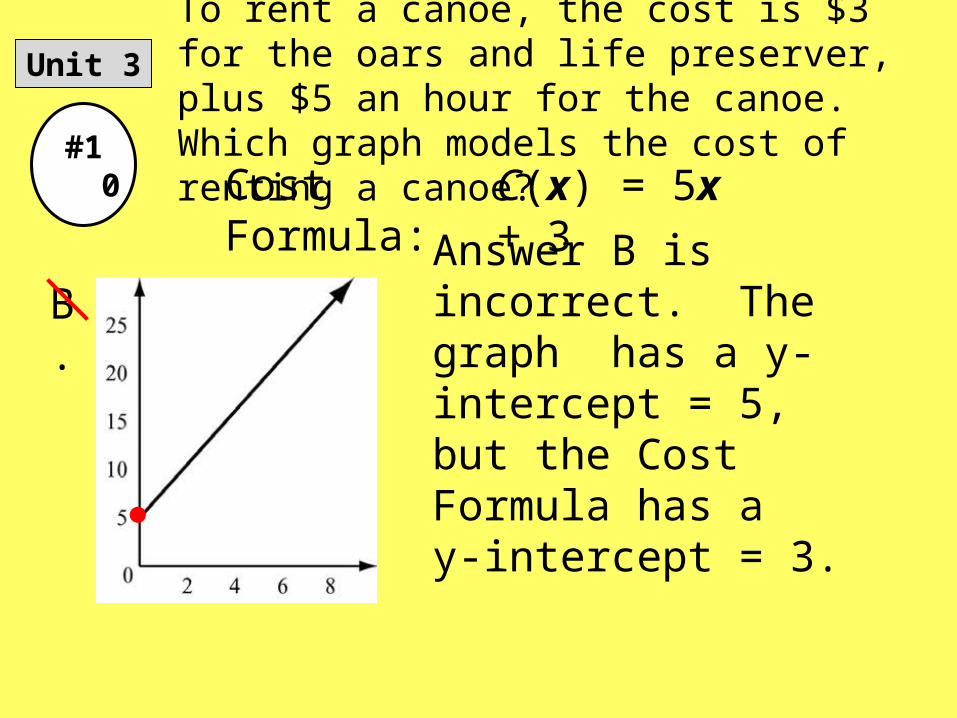
B.
C(x) = 5x + 3Cost Formula:
Answer B is incorrect. The graph has a y-intercept = 5,but the Cost Formula has a y-intercept = 3.
#10
Unit 3 To rent a canoe, the cost is $3 for the oars and life preserver, plus $5 an hour for the canoe. Which graph models the cost of renting a canoe?
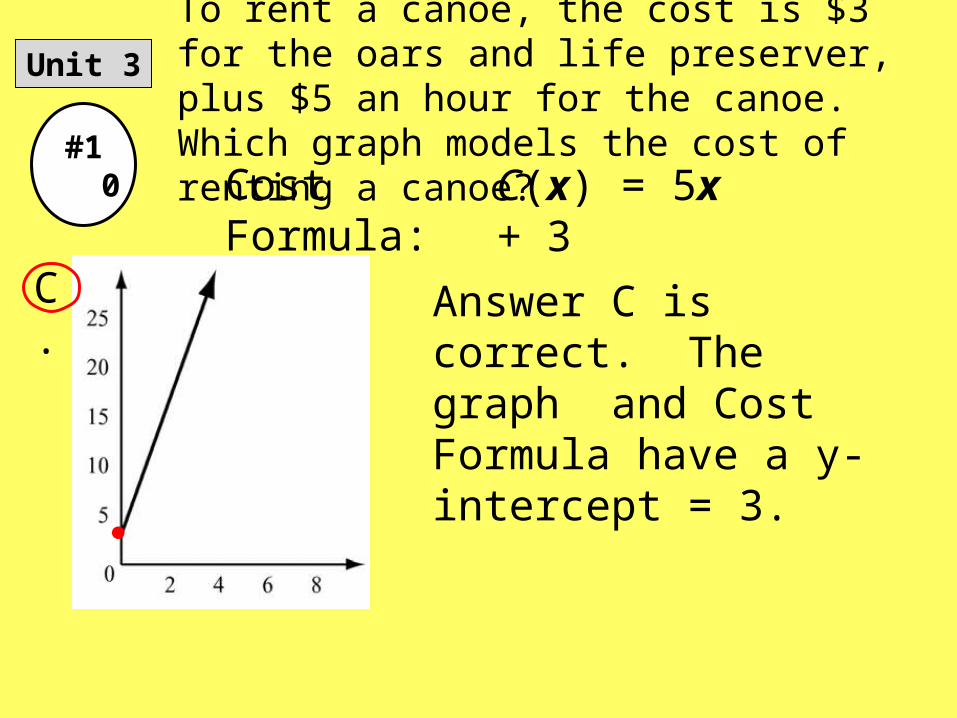
C.
C(x) = 5x + 3Cost Formula:
Answer C is correct. The graph and Cost Formula have a y-intercept = 3.
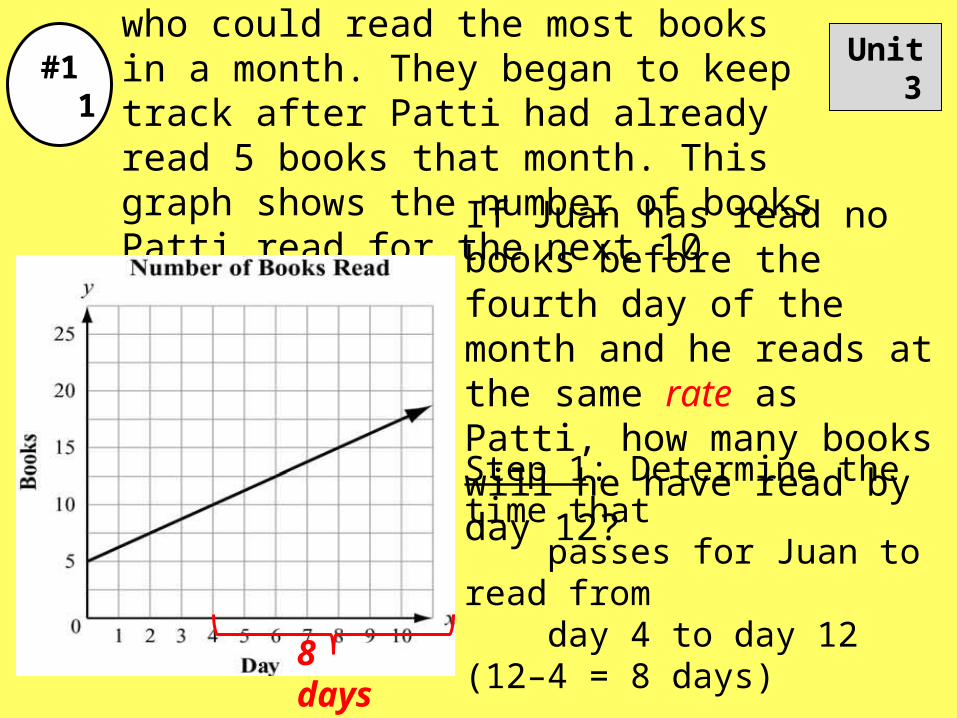
#11 Unit 3Juan and Patti decided to see who could read the most books in a month. They began to keep track after Patti had already read 5 books that month. This graph shows the number of books Patti read for the next 10 days.
If Juan has read no books before the fourth day of the month and he reads at the same rate as Patti, how many books will he have read by day 12?
Step 1: Determine the time that passes for Juan to read from day 4 to day 12 (12–4 = 8 days)
8 days
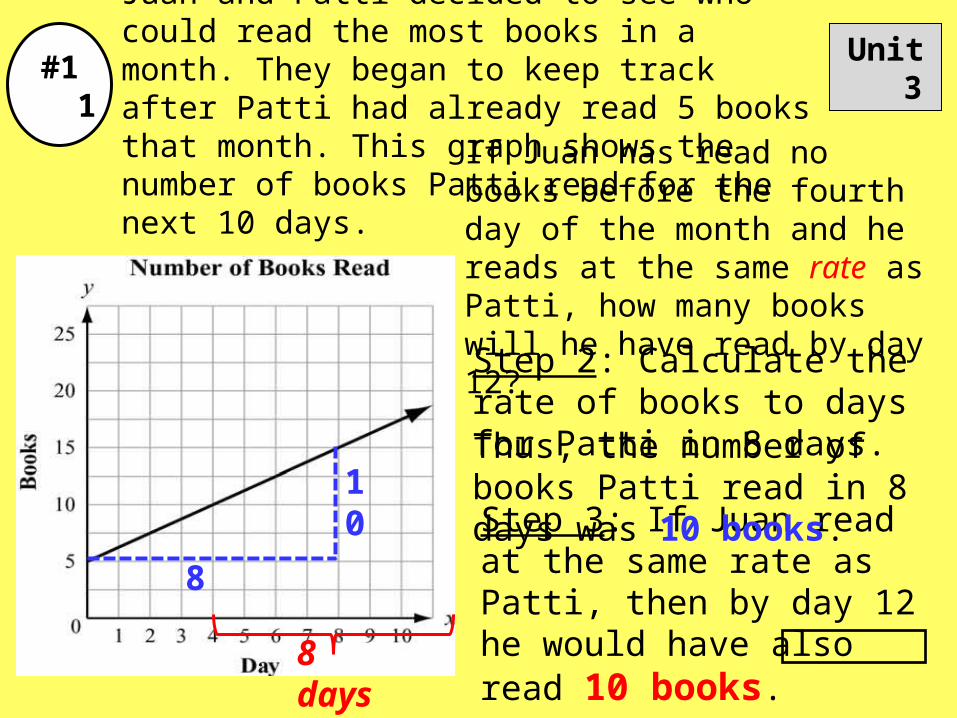
#11 Unit 3Juan and Patti decided to see who could read the most books in a month. They began to keep track after Patti had already read 5 books that month. This graph shows the number of books Patti read for the next 10 days.
If Juan has read no books before the fourth day of the month and he reads at the same rate as Patti, how many books will he have read by day 12?
Step 2: Calculate the rate of books to days for Patti in 8 days.
8 days
8
10
Step 3: If Juan read at the same rate as Patti, then by day 12 he would have also read 10 books.
Thus, the number of books Patti read in 8 days was 10 books.
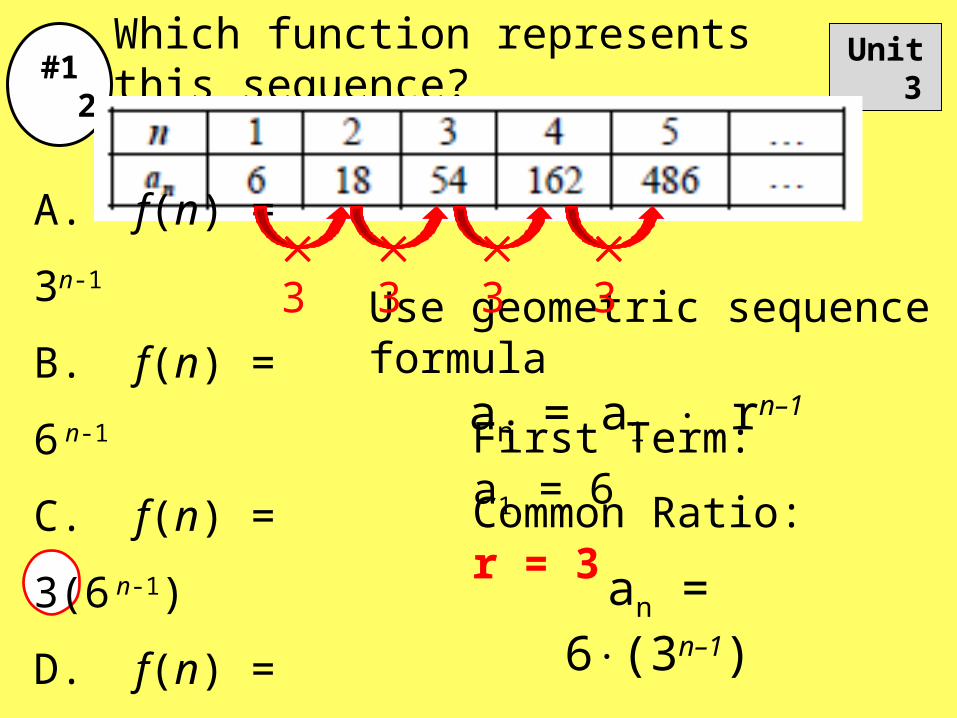
#12 Unit 3Which function represents this sequence?
Use geometric sequence formulaan = a1 rn–1 A. f(n) = 3n-1
B. f(n) = 6 n-1
C. f(n) = 3(6 n-1)
D. f(n) = 6(3 n-1)
First Term: a1 = 6
3
3
3
3
Common Ratio: r = 3
an = 6(3n–1)
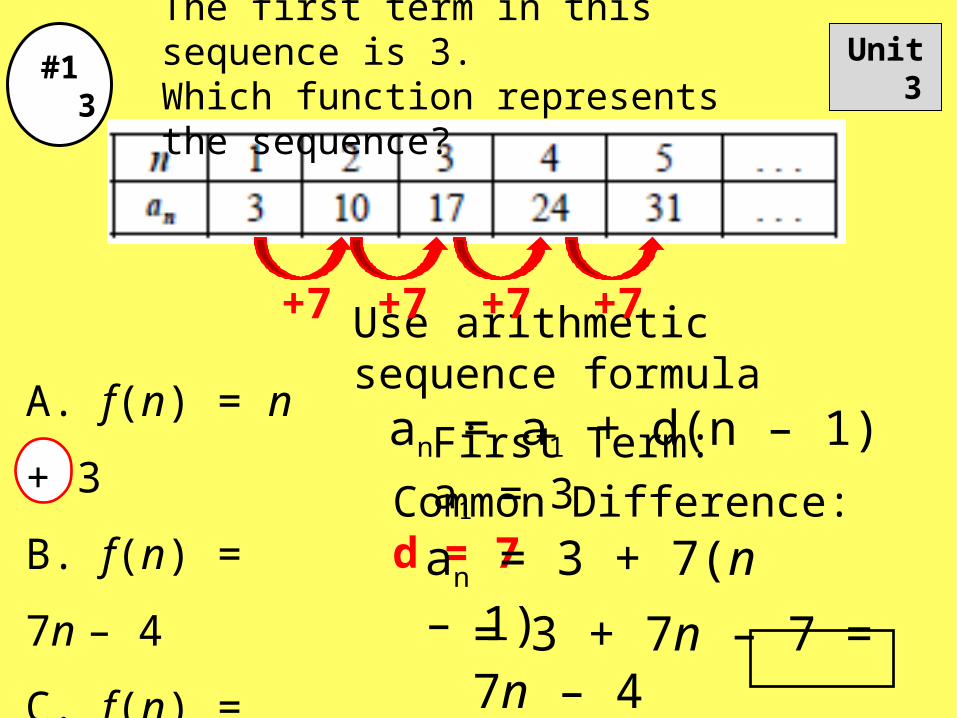
#13 Unit 3The first term in this sequence is 3. Which function represents the sequence?
Use arithmetic sequence formulaan = a1 + d(n – 1)
First Term: a1 = 3
+7 +7 +7 +7
Common Difference: d = 7
an = 3 + 7(n – 1)
A. f(n) = n + 3
B. f(n) = 7n – 4
C. f(n) = 3n + 7
D. f(n) = n + 7= 3 + 7n – 7 = 7n – 4
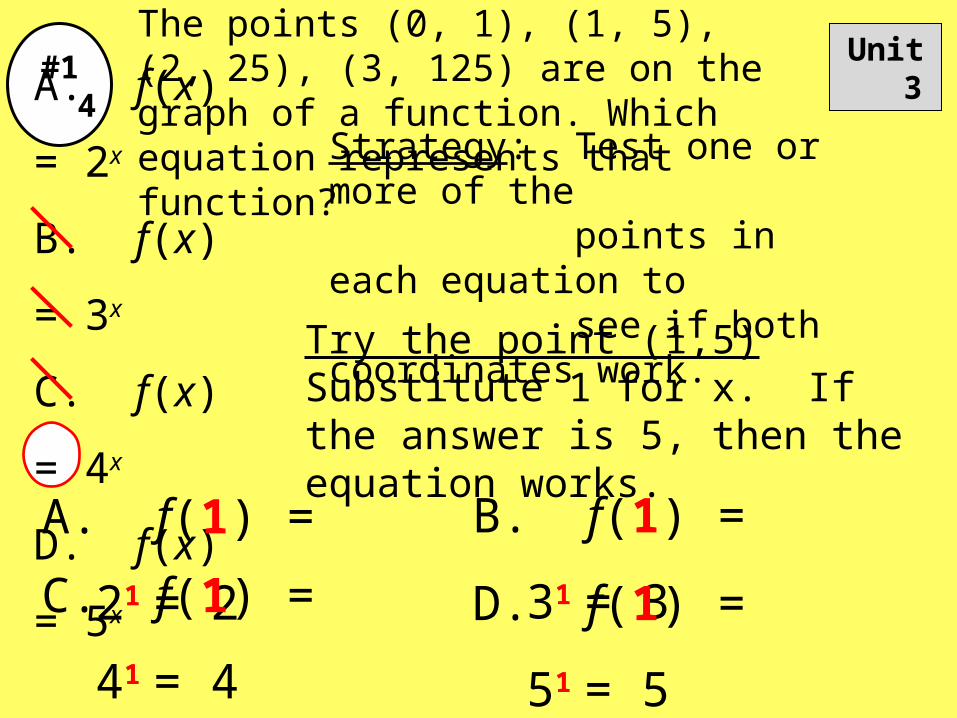
#14 Unit 3The points (0, 1), (1, 5), (2, 25), (3, 125) are on the graph of a function. Which equation represents that function?
A. f(x) = 2x
B. f(x) = 3x
C. f(x) = 4x
D. f(x) = 5x
Strategy: Test one or more of the points in each equation to see if both coordinates work.
Try the point (1,5)Substitute 1 for x. If the answer is 5, then the equation works.
A. f(1) = 21 = 2 B. f(1) = 31 = 3
C. f(1) = 41 = 4 D. f(1) = 51 = 5
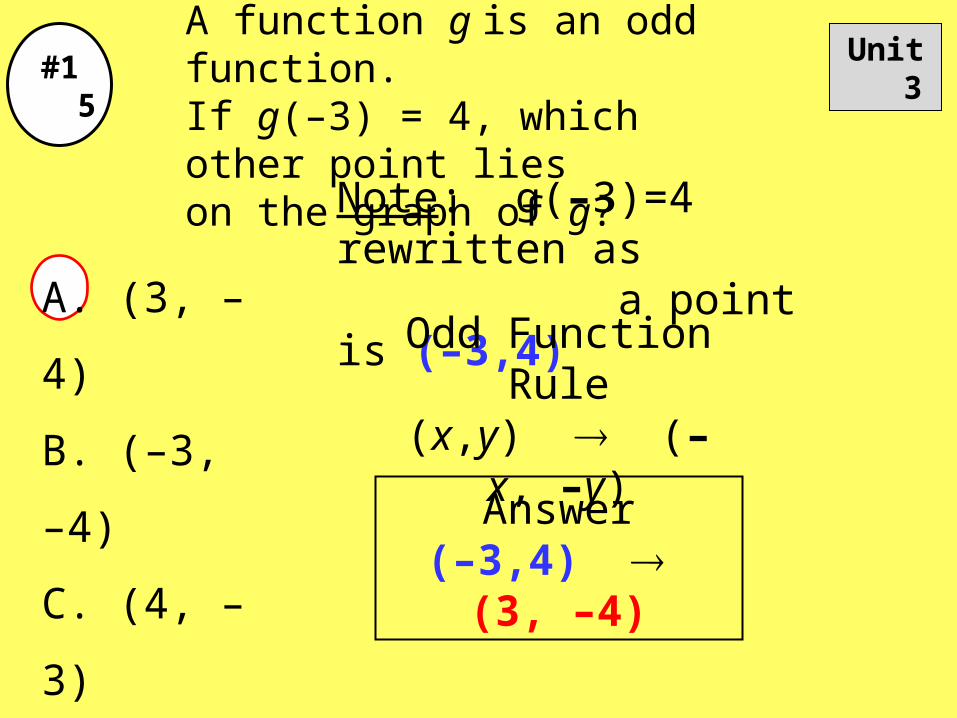
#15 Unit 3A function g is an odd function.If g(–3) = 4, which other point lieson the graph of g?
Note: g(–3)=4 rewritten as a point is (–3,4)A. (3, –4)
B. (–3, –4)
C. (4, –3)
D. (–4, 3)
Odd Function Rule(x,y) (–x, –y)
Answer(–3,4) (3, –4)
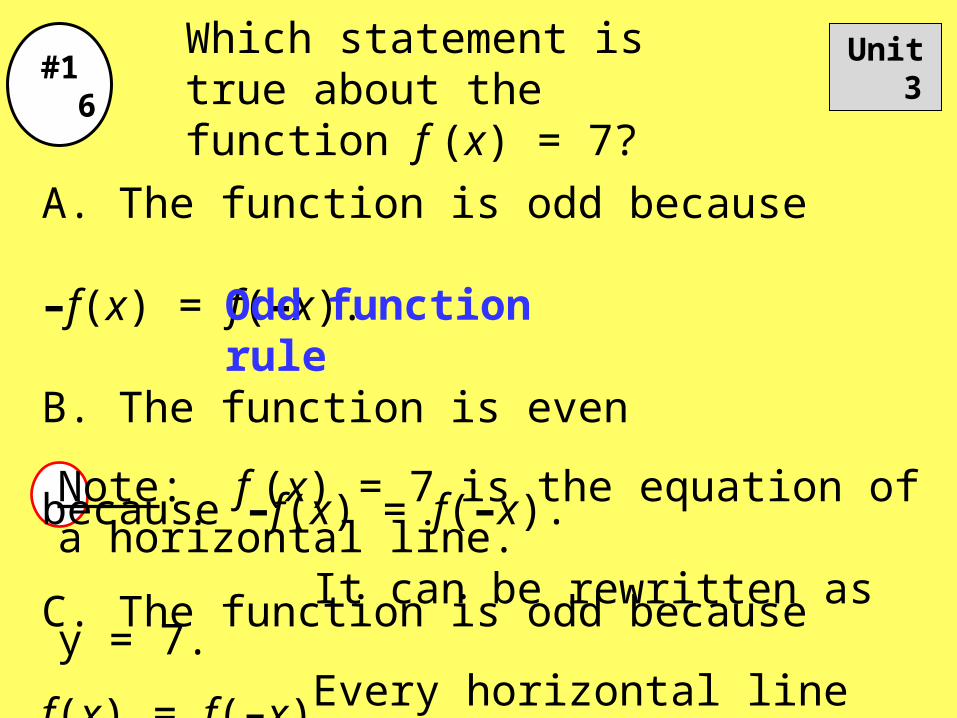
#16 Unit 3Which statement is true about the function f (x) = 7?
A. The function is odd because –f(x) = f(–x).
B. The function is even because –f(x) = f(–x).
C. The function is odd because f(x) = f(–x).
D. The function is even because f(x) = f(–x).Note: f (x) = 7 is the equation of a horizontal line. It can be rewritten as y = 7. Every horizontal line is an even function.
Odd function rule
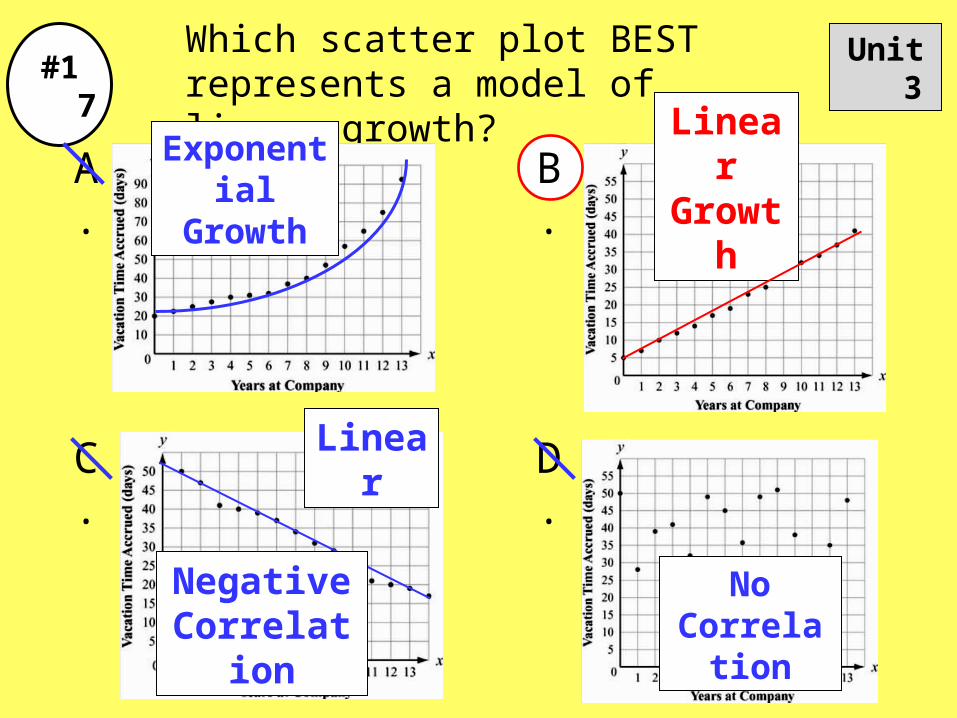
#17 Unit 3Which scatter plot BEST represents a model of linear growth?
A.
C.
B.
D.
LinearGrowth
Linear
Exponential
Growth
NoCorrelatio
n
NegativeCorrelation
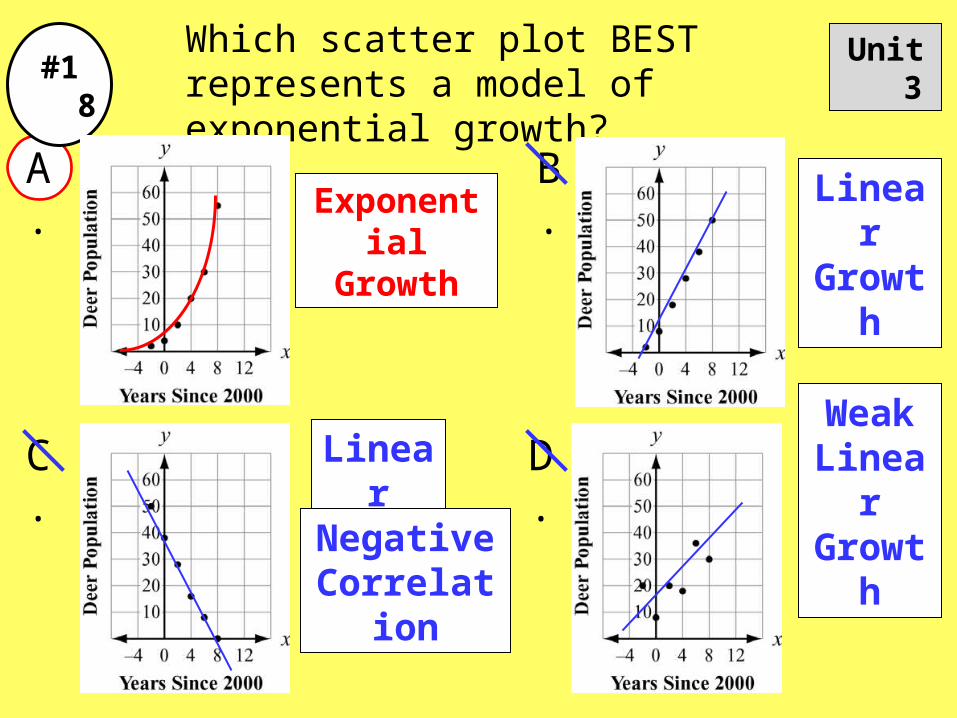
#18 Unit 3Which scatter plot BEST represents a model of exponential growth?
A. B.
C. D.
LinearGrowth
ExponentialGrowth
LinearDecay
WeakLinearGrowthNegative
Correlation
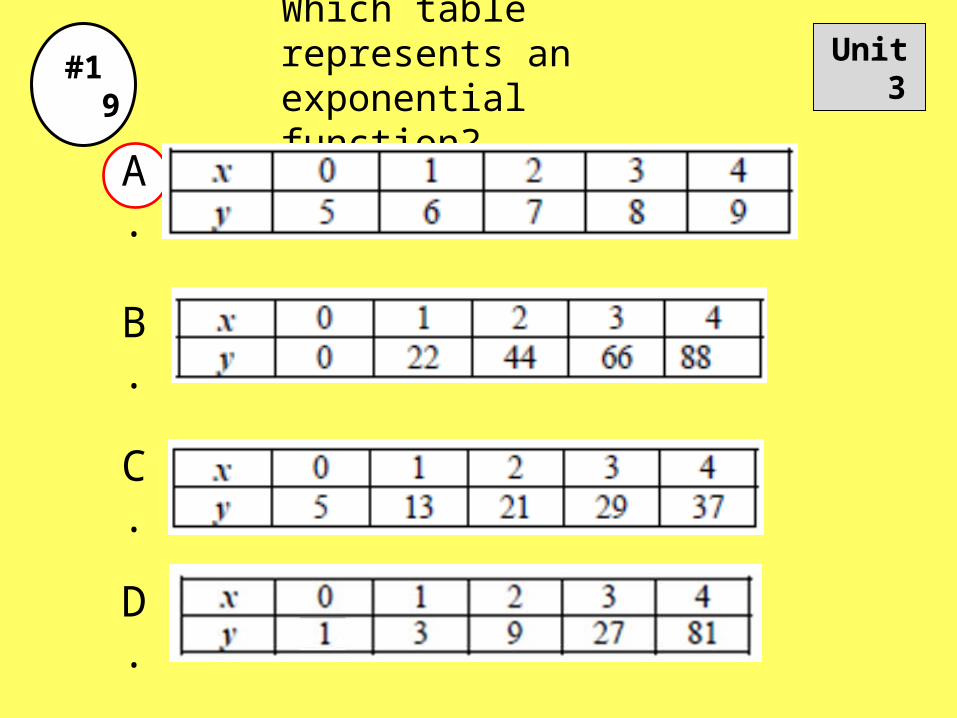
#19 Unit 3Which table represents an exponential function?
C.
A.
B.
D.
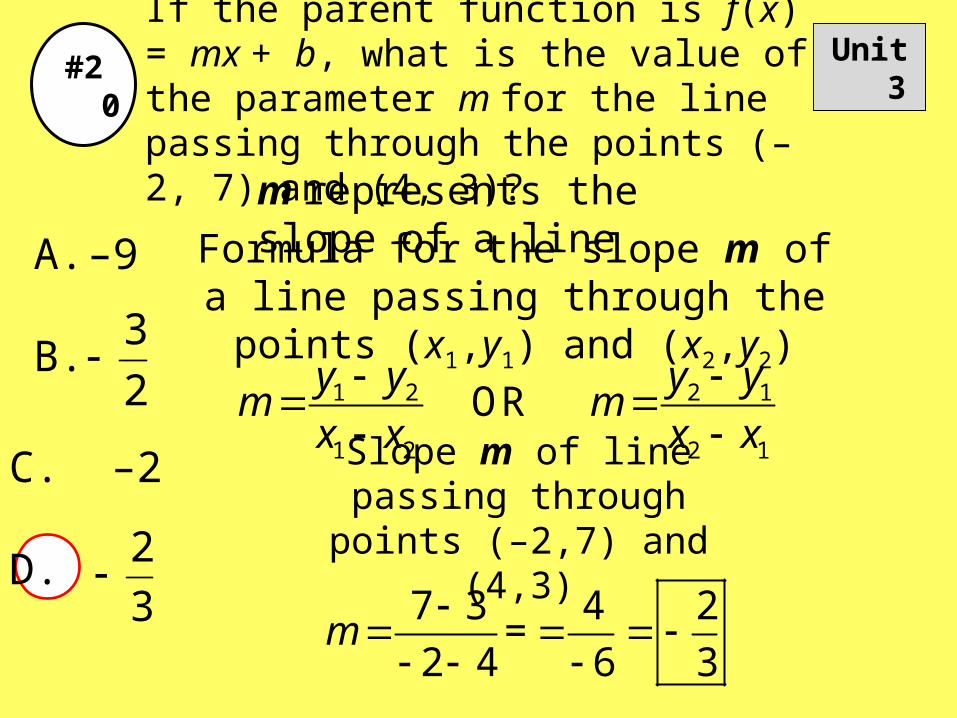
#20 Unit 3If the parent function is f(x) = mx + b, what is the value of the parameter m for the line passing through the points (–2, 7) and (4, 3)?
1 2 2 1
1 2 2 1
OR y y y y
m mx x x x
m represents the slope of a line
Formula for the slope m of a line passing through the points (x1,y1) and (x2,y2)
Slope m of line passing throughpoints (–2,7) and (4,3)
7 3 4 2=
2 4 6 3m
2
3
3
2
A. –9
B.
C. –2
D.