Embed Size (px)
Citation preview

Desenvolvimento de cenários de uso da terra considerando mudança de dietas alimentares
Coordinator Jean OmettoPosDoc felow Luciana SolerPhD student João Pompeu
Reunião Anual de Projetos do Programa FAPESP de Pesquisa em Mudanças Climáticas Globais, 20 Junho, 2017

Consortium
Brazilian TeamINPEJean P OmettoLuciana SolerJoão Pompeu Associate investigators:Ana Paula D. AguiarGustavo ArcoverdeEvandro AlbiachEráclito Souza NetoCamille Nolasco
UnBMercedes Bustamante;
UFALAlexandre Siqueira
UNESPDavid Lapola
International team
• Name: Affiliation• Nina Buckman ETH Zürich, Switzerland• Jonna Cohen• Anna Katarina Gilgen• Terry Dawson Un. of Dundee, UK• Charlotte Hall• John Rowan• James Gerber Un. of Minnesota, USA• Paul West• Pete Smith Un. of Aberdeen, UK• Nuala Fitton• Jennie Macdiarmid• Henri De Ruiter• Laura Philips• Jim Reilly• Mike Martin• Robin Matthews James Hutton Institute, UK• Deborah Roberts• Gary Pohill• Bob Scholes Wits University ,S. Africa• Catherine van den Hoof • Amaresh K Nayak ICAR-NRRI , India• Lijun Zuo CSIRO& MCT- China• Mario Herrero CSIRO, Australia• Sonja Vermeulen CCAFS/CGIAR• Jean F. Soussana INRA, France

DEVIL no Brasil (Fapesp 2014/50627-2):
Desenvolvimento de cenários LUCC utilizando projeções de produtividade global (WP1) e modelagem de segurança alimentar global FEEDME (WP2)
Modelagem LUCC no Brasil (LuccME) utilizando cenários ligados à mudança de dieta alimentarnacional e cenários de exportação para países chaves como a China (WP4, WP1)
Co-produção de conhecimento com stakeholders no Brasil para ajuste dos cenários (wokshops, divulgação científica) WP 6

• Representation of theSafe Space – i.e. anarbitrary limit within theboundaries maximumamount of food we cangrow to meet future demand and ensure foodnutrition equity andminimum impact onclimate change;
(Commission on Sustainable Agriculture and Climate Change, University of Minnesota Global Landscapes Initiative. CGIAR under CCAFS, 2012)https://www.youtube.com/channel/UC6KnRP9RNE3346W49oeceaA
How to reach world food sovereignty? The Safe Space
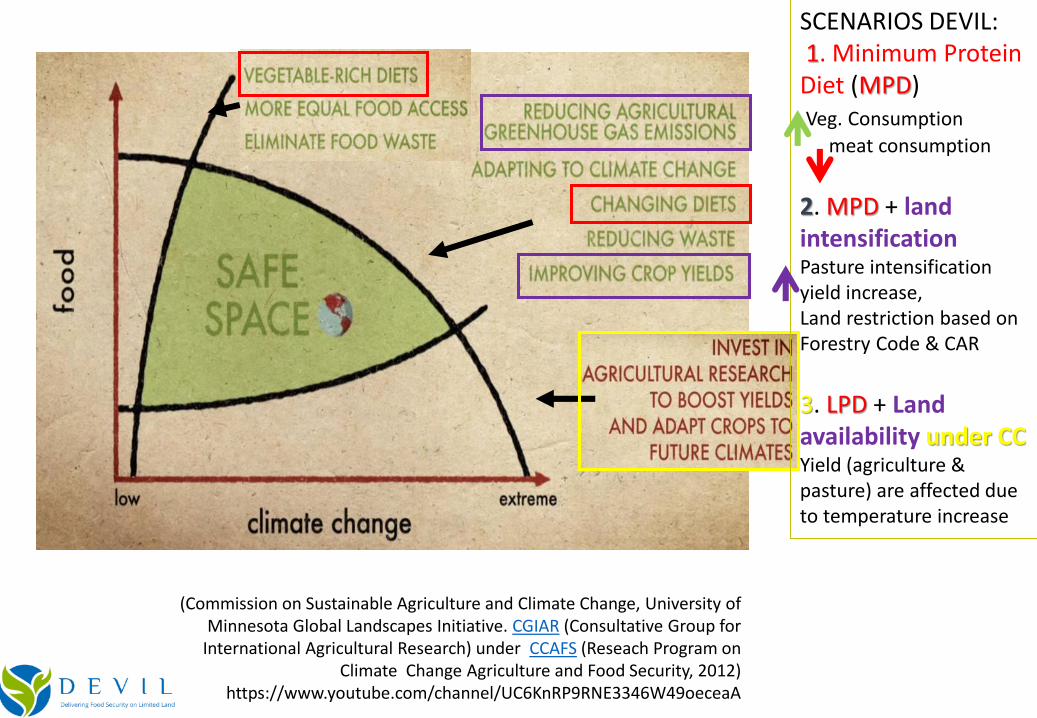
SCENARIOS DEVIL:1. Minimum ProteinDiet (MPD)Veg. Consumption
meat consumption
2. MPD + landintensificationPasture intensificationyield increase, Land restriction based onForestry Code & CAR
3. LPD + Land availability under CCYield (agriculture & pasture) are affected dueto temperature increase
(Commission on Sustainable Agriculture and Climate Change, University of Minnesota Global Landscapes Initiative. CGIAR (Consultative Group for
International Agricultural Research) under CCAFS (Reseach Program on Climate Change Agriculture and Food Security, 2012)
https://www.youtube.com/channel/UC6KnRP9RNE3346W49oeceaA

FEEDME (Food Estimation and Export for Diet and Malnutrition Evaluation)
Developed by University of Dundee, UK
Output :Proportion of undernourished people
The proportion of a population with food consumption below the minimum energy requirement.
Source: Dawson et al. 2016, Climatic Change.
• FAOSTAT & IBGE data
• Brazilian exports (MCDI);
• Effects of climate change are represented by percentage of change in provisions of main crop types (soybean, maize and wheat), vegetables and meat –% represent yield or area in spatial explicit models

Land use maps
Trading & Yieldestimates
Deforestation targets - Brazil INDC
REGIONALIZED % undernourished peopleuse to balance demand density maps
Food demand maps
Nolasco , 2016
Scenarios using Fuzzy Cognitive Maps
1
Spatial explicit models
REGIONALIZED % changes in main cropslinked to deforestation trends andagriculture/pasture area in spatial maps(2000-2010-2050)
FEEDME
2
3
Soler , 2014
4
6

Resultados iniciais• Apesar do sucesso nas metas do MDG e redução da fome, as primeiras
simulações no FEEDME indicam como limitantes da segurança alimentar no Brasil :
• O crescimento populacional até 2050 com mudança na dieta irá requerer um aumento de ~ 17 % nas áreas de agricultura anual e perene (incluindo vegetais/frutas), e diminuição de 10% em outras culturas (ex. biodiesel);
• A diminuição do consumo de carne limitaria o aumento nas áreas de pastagem mas em anos iniciais do cenario de mudança de dieta, o excedente da queda de consumo interno seria destinado à exportação;
• No compto geral entre culturas destinadas a alimentos, energia e fibra, adiminuição de 40% no consumo de carne é indicada como diminuindo em 26% na pressão sobre as áreas de vegetação natural, num cenário não catastrófico de mudanças climáticas apenas com aumento de CO2 e temperatura de 2C previstos até 2100;
• A variação no preço de commodities (taxa de câmbio U$) determinaria custos de insumos e lucros/dividendos para os produtores), podendo causar instabilidades na alocação do uso da terra de commodities como a soja;
• Brasil possui grande potencial de desnutrição (observado/latente)
0 2000 4000 6000
P(U
)
energy (kcal)
Probability density function -dietary energy consumption
1a Minimum Protein Diet > 2-8% undernourishment
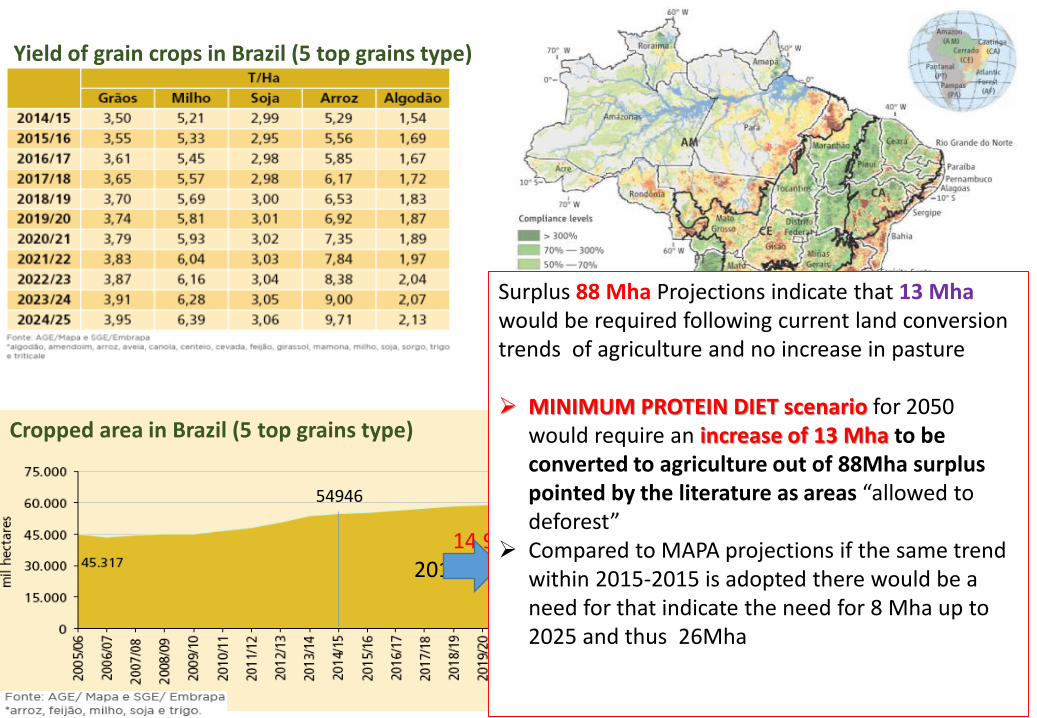
54946
14,9%2015-2025
Cropped area in Brazil (5 top grains type)
Yield of grain crops in Brazil (5 top grains type)
Surplus 88 Mha Projections indicate that 13 Mhawould be required following current land conversiontrends of agriculture and no increase in pasture
MINIMUM PROTEIN DIET scenario for 2050 would require an increase of 13 Mha to beconverted to agriculture out of 88Mha surpluspointed by the literature as areas “allowed todeforest”
Compared to MAPA projections if the same trendwithin 2015-2015 is adopted there would be a need for that indicate the need for 8 Mha up to2025 and thus 26Mha

• Demand density of grainsand vegetables (meat to beinserted);
• Proxy for food availabilityand information decision tosupport FEEDME parametrization ;
Need to undertand and map regional food demand to plan land use systems distributions
Vegetables Grains
269,5 128,5
177,6 224,8
433,0 697,4
673,2 50,3
190,1 556,2
348,7 331,4
Total Grains
58,1 119,4
74,9 97,6
111,5 88,3
52,1 115,3
71,3 137,4
74,8 111,6
Veg+grains availability (g/per capita/day) according to 2030 demand
Total Grains
85,0 141,8
84,2 103,3
84,6 76,2
82,5 141,3
84,8 149,2
84,4 122,3
Veg + grains production per inhabitant (g/per capita/day) in 2006
Veg+grains availability (g/per capita/day) according to 2008 demand
North
Region
Northeast
Southeast
South
Center-West
Average
Northeast
Southeast
Average
South
North
Center-West
Average
Northeast
Southeast
South
North
Center-West

Small landholder % food production (IBGE,2006)
cassava bean corn coffee rice wheat soybean
Cassava, beans, corn and vegetables production by small landholders in BrazilVegetables

• Tendência da área destinada à produção de gêneros alimentícios em relação às commodities (segundo a tipologia de Brown et al 2014, PAM e MapBiomas 2000-2015).
Os valores (+ ou -) referem-se ao teste de Mann-Kendall, que indicam a existência de uma tendência monotônica na série temporal;
• Quanto mais próximo de [1], mais acentuada é a tendência e 0 indica a ausência de tendência;
• Apenas duas ou três pequenas regiões no Cerrado houve aumento na produção de alimentos superior em relação à produção de commodities nesses 16 anos da série.
Produção de alimentos no Cerrado
Land sharing index based on regular grid data built basedon especific location of rural population estimates for 2010

2nd Project meeting, October, 2016, Beijing, China
3rd Project meeting, December, 2017, Cape Town, South Africa
1st Summer School – Food systems in Transitions, July 2017, Stellenbosch, South Africa
2st Summer School Brazil, July 2018