Embed Size (px)
Citation preview
Publication xx-xx-xxx i Month Year
Copper and Zinc in Urban Runoff
Phase 2 — Rainwater Washoff
Monitoring
June 2019
Publication 19-03-008
Publication Information
This report is available on the Department of Ecology’s website at:
https://fortress.wa.gov/ecy/publications/SummaryPages/1903008.html.
Data for this project are available in Ecology’s EIM Database. Study ID: ABOO0001.
The Activity Tracker Code for this study is 16-066.
This project has been funded wholly or in part by the U.S. Environmental Protection Agency (EPA) under
the National Estuary Program (NEP) cooperative agreement # PC-00J899 with the Washington State
Department of Ecology. The contents of this document do not necessarily reflect the views and policies of
EPA, nor does mention of trade names or commercial products constitute endorsement or
recommendation for use.
Suggested Citation: Bookter, A., and D. Serdar. 2019. Copper and Zinc in Urban Runoff: Phase 2 – Rainwater Washoff
Monitoring. Publication 19-03-008. Washington State Department of Ecology, Olympia.
https://fortress.wa.gov/ecy/publications/SummaryPages/1903008.html.
Contact Information
Publications Coordinator
Environmental Assessment Program
Washington State Department of Ecology
P.O. Box 47600
Olympia, WA 98504-7600
Phone: (360) 407-6764
Washington State Department of Ecology – https://ecology.wa.gov
Headquarters, Olympia 360-407-6000
Northwest Regional Office, Bellevue 425-649-7000
Southwest Regional Office, Olympia 360-407-6300
Central Regional Office, Union Gap 509-575-2490
Eastern Regional Office, Spokane 509-329-3400
Cover photo: Andy Bookter.
Any use of product or firm names in this publication is for descriptive purposes only and
does not imply endorsement by the author or the Department of Ecology.
To request ADA accommodation for disabilities, or printed materials in a format for the visually impaired,
call Ecology at 360-407-6831 or visit https://ecology.wa.gov/accessibility. People with impaired hearing
may call Washington Relay Service at 711. People with speech disability may call 877-833-6341.
Copper and Zinc in Urban Runoff
Phase 2 — Rainwater Washoff Monitoring
by
Andy Bookter and Dave Serdar
Environmental Assessment Program
Washington State Department of Ecology
Olympia, Washington
ii Ecology publication 19-03-008 — June 2019
This page is purposely left blank.

Copper and Zinc in Urban Runoff: Phase 2 iii
Table of Contents Page
List of Figures ......................................................................................................................v
List of Tables .................................................................................................................... vii
Acknowledgments............................................................................................................ viii
Executive Summary .............................................................................................................1 Findings and Conclusions ..............................................................................................2 Recommendations ..........................................................................................................4
Abstract ................................................................................................................................5
Introduction ..........................................................................................................................6 Identification of Problem ...............................................................................................6
Prior Studies and Impetus for Present Work..................................................................6 CuZn Phase 1 Study.......................................................................................................7
Present Study .................................................................................................................8 Project goals .............................................................................................................9 Project objectives .....................................................................................................9
Methods..............................................................................................................................10 Sample Design and Scope ............................................................................................10
Parameters of Interest and Sources of Chemical Release ......................................10 Study Area .............................................................................................................10 Material and Site Selection ....................................................................................14
Bulk Washoff Collection .......................................................................................15
Artificial Rainwater Washoff Sampling ................................................................23
Measurement Procedures .............................................................................................25 Data Reduction and Reporting .....................................................................................26
Naming Conventions for Material Types ..............................................................26 Presentation of Results for Washoff Samples ........................................................26 Calculation of Metals Release Rates from Different Materials .............................27
Data Quality .................................................................................................................28 Quality of Laboratory Analyses .............................................................................28 Assessment of Sample Homogeneity and Field Contamination ............................29
Results ................................................................................................................................31 Evaluation of Sampling Success ..................................................................................31 Conventional Parameters .............................................................................................31
Copper Concentrations in Washoff Water ...................................................................33 Zinc Concentrations in Washoff Water .......................................................................35 Copper and Zinc Concentrations in Atmospheric Deposition .....................................39
Copper and Zinc Concentrations in Siding Washoff Using Artificial Rainwater .......40
Discussion ..........................................................................................................................43 Copper and Zinc in Roof Washoff and Effects of Atmospheric Deposition ...............43
Comparisons with Previous Atmospheric Deposition Studies ..............................43
iv Ecology publication 19-03-008 — June 2019
Comparisons with Previous Studies on Roof Washoff ..........................................45
Copper and Zinc Releases from Roofs and Gutters in the Study Area ..................48 Copper and Zinc Releases from Siding Materials .......................................................50
Copper and Zinc Releases from Light Standards and Chain-Link Fencing ................53 Implications for Receiving Waters ..............................................................................54
Summary and Conclusions ................................................................................................57
Recommendations ..............................................................................................................60 Prioritizing Releases of Copper and Zinc ....................................................................60
Recommendations for Sampling Copper and Zinc in Building Materials and
Structures .....................................................................................................................60
References ..........................................................................................................................62
Glossary, Acronyms, and Abbreviations ...........................................................................65
Glossary .......................................................................................................................65 Acronyms and Abbreviations ......................................................................................67
Units of Measurement ..................................................................................................68
Appendices .........................................................................................................................69 Appendix A ..................................................................................................................70
Appendix B ..................................................................................................................72 Appendix C ..................................................................................................................73
Copper and Zinc in Urban Runoff: Phase 2 v
List of Figures Page
Figure 1. Map of the urban copper and zinc study area, Lacey, Washington. ...................12
Figure 2. Map of 2016 land use in the urban copper and zinc study area, Lacey,
Washington. ........................................................................................................13
Figure 3. Precipitation (mm) in Lacey, Washington, during the 2018 CuZn Phase 2
study ....................................................................................................................15
Figure 4. Rainwater washoff collected on a polymer roof using a dam constructed of
aluminum flashing. .............................................................................................16
Figure 5. Rain barrel used to collect roof washoff via a downspout diverter. ...................17
Figure 6. System used to divert roof washoff without contacting the building gutter
and downspout. ...................................................................................................18
Figure 7. Aluminum pans used to collect siding washoff. .................................................19
Figure 8. Aluminum foil collar used to collect washoff from galvanized light standard. .20
Figure 9. Aluminum pan used to collect washoff from chain-link fence. .........................21
Figure 10. Bulk atmospheric deposition collector. ............................................................22
Figure 11. Template used to isolate siding for artificial rainwater washoff sampling. .....24
Figure 12. Example of box-and-whisker plot used to display data throughout report. .....27
Figure 13. Total and dissolved copper concentrations in washoff water for all material
types except asphalt shingles with algae-resistant granules less than 5 years
old (RAAR<5) ....................................................................................................34
Figure 14. Copper concentrations in washoff from asphalt shingles with algae-resistant
granules less than 5 years old (RAAR<5) during the five storm events. ...........34
Figure 15. Copper concentrations in metal roof and companion gutter washoff for each
storm event. .........................................................................................................35
Figure 16. Total and dissolved zinc concentrations in washoff water for all material
types except chain-link fencing (CNLNK) and light standards (LGT) ..............37
Figure 17. Zinc concentrations in metal roof and companion gutter washoff for each
storm event ..........................................................................................................37
Figure 18. Boxplots showing total and dissolved zinc concentrations in washoff for
chain-link fencing (CNLNK) and light standards (LGT). ..................................38
Figure 19. Boxplots showing total zinc concentrations in washoff from different ages
of light standards (LGT), chain-link fencing (CNLNK), older metal roofing
(RMT>10), and older metal siding (SMT>10) ...................................................39
Figure 20. Boxplots of total and dissolved copper and zinc concentrations in bulk
atmospheric deposition samples .........................................................................40
Figure 21. Site-by-site comparisons of total and dissolved copper concentrations in
siding washoff from artificial rainwater and natural storms ...............................42
Figure 22. Site-by-site comparisons of total and dissolved zinc concentrations in
siding washoff from artificial rainwater and natural storms ...............................42
vi Ecology publication 19-03-008 — June 2019
Figure 23. Total copper fluxes measured in atmospheric deposition from CuZn Phase
2, Puget Sound Toxics Loading Assessment (PSTLA), and King County ........44
Figure 24. Total zinc fluxes measured in atmospheric deposition from CuZn Phase 2,
Puget Sound Toxics Loading Assessment (PSTLA), and King County.............45
Figure 25. Total copper concentrations in roof washoff in CuZn Phase 2 and those
found in other studies. .........................................................................................47
Figure 26. Total zinc concentrations in roof washoff in CuZn Phase 2 and those found
in other studies ....................................................................................................47
Copper and Zinc in Urban Runoff: Phase 2 vii
List of Tables Page
Table 1. Materials sampled for the CuZn Phase 2 study. ..................................................14
Table 2. Characteristics of siding selected for artificial rainwater washoff sampling. ......24
Table 3. Methods used for laboratory and field measurements. ........................................25
Table 4. Naming conventions for material types. ..............................................................26
Table 5. Summary of results for field-measured conventional parameters in washoff
water....................................................................................................................32
Table 6. Summary of results for laboratory-measured conventional parameters in
washoff water. .....................................................................................................32
Table 7. Summary of results for copper in washoff water from all material types. ..........33
Table 8. Summary of results for zinc in washoff water from all material types. ...............36
Table 9. Summary of results for copper (Cu) and zinc (Zn) in siding washoff generated
using artificial rainwater. ....................................................................................41
Table 10. Total copper and zinc release rates for roofing and gutter materials from
CuZn Phase 1 and CuZn Phase 2. ......................................................................49
Table 11. Estimates of total copper and zinc releases from selected roofing and gutter
materials in the study area. .................................................................................50
Table 12. Total copper and zinc release rates for siding materials. ...................................51
Table 13. Estimates of total copper and zinc releases from selected siding materials in
the study area. .....................................................................................................52
Table 14. Total copper and zinc release rates for chain-link fencing and light
standards. ............................................................................................................53
Table 15. Estimates of total copper and zinc releases from chain-link fencing and light
standards in the study area. .................................................................................54
Table 16. Estimates of total copper and zinc releases from selected materials in the
study area. ...........................................................................................................58
viii Ecology publication 19-03-008 — June 2019
Acknowledgments
The authors of this report thank the following people for their contributions to this study:
o Greg Bailey (Bailey General Contractors)
o Chris Baird and Peter Brooks (City of Lacey)
o Dave Boyer, Mark Fromme, and Anthony Seward (Department of Enterprise Services)
o Mike Boyer (Cirque Climbing Gym)
o Joe Collins and Damon Smith (Callisons)
o Joelle Hughes and Robin Vaughn (Meconi’s)
o Kimberly Gould (The Kirkbride Group, Inc.)
o Erin Larson
o Erin Fossen, Marilyn McIsaac, and Matt Polley (Fresenius Medical Care)
o Diana Kannenberg and Brandy Hildebrand (Avenue5 Residential)
o Tyler Ortiz
o Rite Aid Pharmacy
o Brian Sanda (Community Action Council)
o Caroline Sun
o Mark Biever (Thurston County)
o Brian Eko, Dean Martinolich, Monty Sabin, and Brian Westberg (North Thurston School
District)
Washington State Department of Ecology staff:
o Steve Adams
o Andrew Beckman
o Andrea Biddle
o Heidi Chuhran
o Julia Dolan
o Dan Dugger
o Brandee Era-Miller
o Lisa Euster
o Ruth Froese
o Steve Fry (retired)
o Kimberly Goetz
o Amy Hargrove
o Will Hobbs
o Meredith Jones
o Matthew Kogle
o Joan LeTorneau (retired)
o Sean Lundblad
o Ron McBride
o Mike McKay
o Jim Medlen
o Dean Momohara
o Dale Norton
o Jeanne Ponzetti
o Ray Powers
o Nancy Rosenbower
o Debby Sargeant
o Leon Weiks
o Andrew Wineke
o Tim Zornes
Copper and Zinc in Urban Runoff: Phase 2 1
Executive Summary
Enrichment of aquatic systems with copper and zinc can have adverse effects on a variety of
organisms in both freshwater and marine environments. In the Puget Sound region, copper is of
particular concern due to sublethal effects on salmonids in freshwater. These effects can occur at
low concentrations, often below criteria established to protect aquatic organisms (Meyer and
Deforest, 2018). A recent review of data from the Puget Sound basin indicates that copper and
zinc in stormwater are often found at levels exceeding water quality criteria for the protection of
aquatic life, particularly in commercial and industrial areas (Hobbs et al., 2015).
To address concerns about toxic chemical contamination of aquatic systems, the Washington
State Department of Ecology (Ecology) along with other agencies conducted several studies to
assess releases of toxic chemicals from nonpoint sources. The Puget Sound Toxics Loading
Assessment (PSTLA; Norton et al., 2011a) calculated estimates of copper and zinc releases from
various materials and activities, as well as information on delivery and loading of copper and
zinc to Puget Sound. One of the important findings suggested in the PSTLA study, based on a
literature review, was that building roofs released large quantities of zinc, and copper to a lesser
degree. Due to uncertainty about these findings, Ecology decided more information was needed
to assess this conclusion before developing possible source control actions.
Results from the PSTLA study prompted Ecology to conduct a rigorous study of runoff from
roofing materials, using a variety of experimental roof panels (Ecology Roofing Study; Winters
et al., 2014). The Ecology Roofing Study found that most common roofing materials released
small quantities of copper, zinc, and other chemicals. However, some data gaps remained
regarding chemical releases from older roofing materials, roofs with longer runs and more
contact with rainwater, and the impact that additional roofing components not analyzed (e.g.,
exposed fasteners, flashing) might have in real-world situations.
Based on results of PSTLA and the Ecology Roofing Study, a number of data needs were
identified in order to address nonpoint sources of copper and zinc. In particular, the release of
copper and zinc from specific nonpoint sources in the Puget Sound region were still unknown.
Ecology began the Copper and Zinc in Urban Runoff study in 2016 to address these data gaps.
The Copper and Zinc in Urban Runoff study consists of two parts: CuZn Phase 1 and CuZn
Phase 2. The initial phase (CuZn Phase 1) was a “desktop” effort focused on nonpoint sources
confined to a relatively small industrial/commercial sub-basin in the southern Puget Sound
region. Release rates were estimated from literature values, GIS analysis, and local precipitation
data (Bookter, 2017a).
The present study, CuZn Phase 2, is a field sampling effort intended to fulfill some of the
recommendations from the CuZn Phase 1 report. Sampling was conducted to ground-truth some
of the copper and zinc release estimates derived in CuZn Phase 1. To achieve this, rainwater
washoff was sampled during six rain events in 2018 and analyzed for copper and zinc. The
following components of the built environment were sampled:

2 Ecology publication 19-03-008 — June 2019
Building roofs
Building siding
Roof gutters
Light standards
Chain-link fencing
Findings and Conclusions
Washoff water was collected in 99% (104 of 105) of attempts to collect roof and gutter samples,
56% (40 of 72) of siding samples, and 90% (27 of 30) chain-link and light standard samples.
Total copper and zinc were detected in all washoff samples, and dissolved copper and zinc were
detected in all samples for which they were analyzed.
Among all materials analyzed, copper concentrations were much higher in washoff from newer
(<5 years old) asphalt composite roofs containing algae-resistant granules. Zinc concentrations in
washoff from uncoated galvanized materials (chain-link and light standards) were much higher
than in washoff from other materials.
Copper and zinc concentrations in washoff were combined with measurements of washoff
volume and surface areas to derive release rates for all materials analyzed (Table ES-1). These
release rates were then used to calculate annual releases on a mass basis (i.e., loads) in the study
area.
Results from CuZn Phase 2 suggest that the overall magnitude of copper and zinc releases from
the sampled materials appears to be much lower than previously estimated in the PSTLA and
CuZn Phase 1 studies. The estimated median annual release from all materials of interest within
the 18.6 km2 (7.2 square-mile) study area is approximately 6 kg copper (range 0.1–300 kg) and
70 kg zinc (range 20–500 kg). In contrast, the CuZn Phase 1 study estimates, derived from
literature, were 40 kg copper (range 4–600 kg) and 300 kg zinc (range 80–1,100 kg).
Both phases of the study conclude that the bulk of copper released from the materials analyzed
would originate from asphalt shingle roofs with algae-resistant granules. For zinc, the CuZn
Phase 1 study estimated nearly equal releases stemming from roofing, siding materials, and
chain-link fencing. However, results of the present study suggest the bulk of zinc release
originates from uncoated chain-link fencing. The CuZn Phase 1 study appears to overestimate
releases from building materials, particularly siding.
Copper and Zinc in Urban Runoff: Phase 2 3
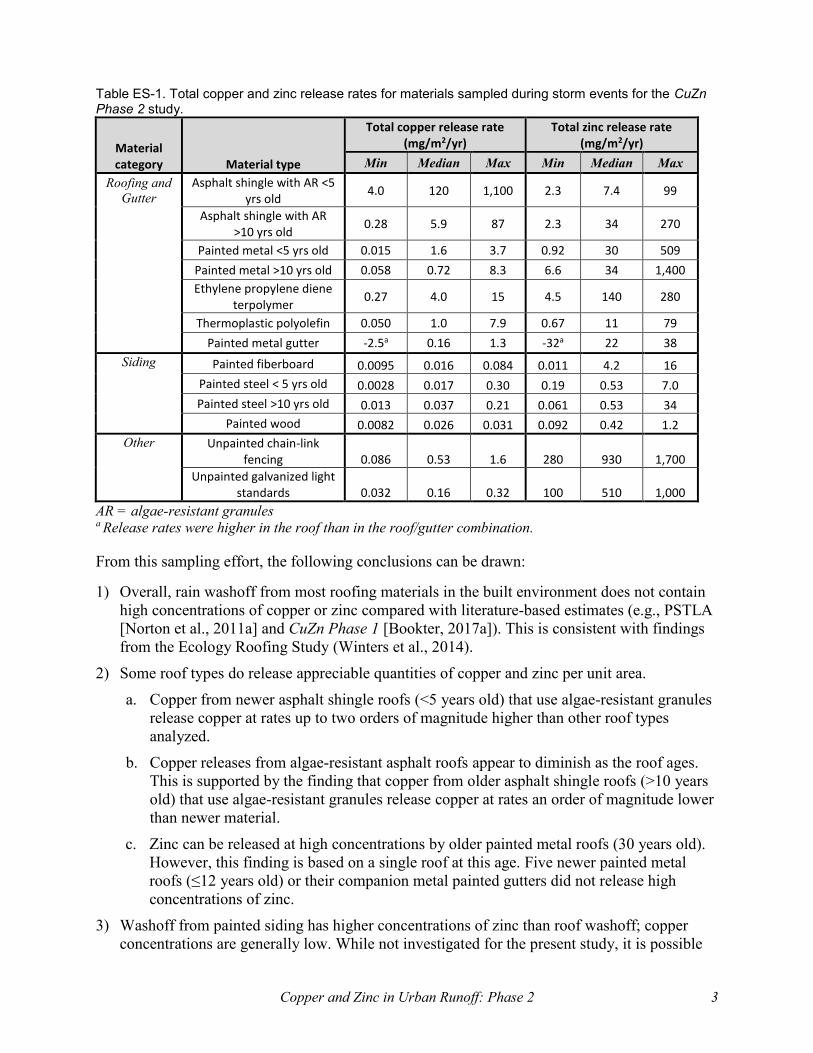
Table ES-1. Total copper and zinc release rates for materials sampled during storm events for the CuZn Phase 2 study.
Material category Material type
Total copper release rate (mg/m2/yr)
Total zinc release rate (mg/m2/yr)
Min Median Max Min Median Max
Roofing and
Gutter Asphalt shingle with AR <5
yrs old 4.0 120 1,100 2.3 7.4 99
Asphalt shingle with AR
>10 yrs old 0.28 5.9 87 2.3 34 270
Painted metal <5 yrs old 0.015 1.6 3.7 0.92 30 509
Painted metal >10 yrs old 0.058 0.72 8.3 6.6 34 1,400
Ethylene propylene diene
terpolymer 0.27 4.0 15 4.5 140 280
Thermoplastic polyolefin 0.050 1.0 7.9 0.67 11 79
Painted metal gutter -2.5a 0.16 1.3 -32a 22 38
Siding Painted fiberboard 0.0095 0.016 0.084 0.011 4.2 16
Painted steel < 5 yrs old 0.0028 0.017 0.30 0.19 0.53 7.0
Painted steel >10 yrs old 0.013 0.037 0.21 0.061 0.53 34
Painted wood 0.0082 0.026 0.031 0.092 0.42 1.2
Other Unpainted chain-link fencing 0.086 0.53 1.6 280 930 1,700
Unpainted galvanized light standards 0.032 0.16 0.32 100 510 1,000
AR = algae-resistant granules a Release rates were higher in the roof than in the roof/gutter combination.
From this sampling effort, the following conclusions can be drawn:
1) Overall, rain washoff from most roofing materials in the built environment does not contain
high concentrations of copper or zinc compared with literature-based estimates (e.g., PSTLA
[Norton et al., 2011a] and CuZn Phase 1 [Bookter, 2017a]). This is consistent with findings
from the Ecology Roofing Study (Winters et al., 2014).
2) Some roof types do release appreciable quantities of copper and zinc per unit area.
a. Copper from newer asphalt shingle roofs (<5 years old) that use algae-resistant granules
release copper at rates up to two orders of magnitude higher than other roof types
analyzed.
b. Copper releases from algae-resistant asphalt roofs appear to diminish as the roof ages.
This is supported by the finding that copper from older asphalt shingle roofs (>10 years
old) that use algae-resistant granules release copper at rates an order of magnitude lower
than newer material.
c. Zinc can be released at high concentrations by older painted metal roofs (30 years old).
However, this finding is based on a single roof at this age. Five newer painted metal
roofs (≤12 years old) or their companion metal painted gutters did not release high
concentrations of zinc.
3) Washoff from painted siding has higher concentrations of zinc than roof washoff; copper
concentrations are generally low. While not investigated for the present study, it is possible
4 Ecology publication 19-03-008 — June 2019
that weathered paint is the main source of zinc from siding washoff.
4) Materials that are composed almost exclusively of galvanized steel—chain-link fencing and
light standards in the case of the present study—release high quantities of zinc but little
copper. However, it does not appear that there is substantial enrichment of zinc in roof
washoff due to rainwater contact with ancillary roofing components, such as fasteners and
flashing, that might also be composed of galvanized steel.
5) Older materials composed of exposed or painted metals generally release more zinc than
newer materials.
6) Most of the copper (70% on average) and zinc (90% on average) in washoff from all
materials is in the dissolved form.
7) Mass quantities of copper and zinc released annually from all materials analyzed in the study
area are lower than those from literature-based estimates (e.g., PSTLA and CuZn Phase 1
studies).
8) The PSTLA study overestimated mass zinc releases from roofing in the Puget Sound basin.
9) Results of the present study provide a better indicator of regional copper and zinc releases
than those typically found in the published literature.
Recommendations
To set priorities to reduce initial release of copper or zinc from materials and activities, several
questions should be considered: What materials or activities are likely to release the most copper
or zinc? Are they released in a form or location where they can become mobile? Are there
known impacts to surface waters due to their release from specific materials or activities?
The weight given to each question might depend on the goals of source control efforts or
investigations to assess sources. For the present study, only the initial question was addressed
(What materials or activities are likely to release the most copper and zinc?), and only selected
source materials were investigated. As a result, contextualization is limited and the importance of
the selected materials as source control priorities is thus limited as well. Future studies need not
address all elements of copper and zinc releases and full assessment of their fate and transport,
but more consideration to these points may yield better information for source control priorities.
Investigators may want to consider using artificial rainwater for some materials if additional
washoff sampling is desired. Once there is a high degree of confidence that artificial rainwater
sampling provides a suitable substitute for storm washoff, artificial washoff sampling would
provide a number of benefits. Sampling could be conducted at any time and would not
necessitate pre-storm setup. Adequate washoff volume could easily be generated from vertical
surfaces. Sample collection devices could be smaller and simpler, and could be more easily
isolated from contamination.
To assess chemical contributions from atmospheric deposition, it is recommended that sampling
devices be deployed at each location where materials are sampled. This would provide a more
accurate picture of site-specific atmospheric deposition and would help assess any contributions
from localized sources. When sampling for metals, collection devices should be constructed of
plastic, glass, or other non-metallic material.

Copper and Zinc in Urban Runoff: Phase 2 5
Abstract A two-phase study was conducted to assess the release of copper (Cu) and zinc (Zn) in the urban
environment. The initial phase (Phase 1) consisted of literature research, GIS analysis, and local
precipitation data. The goal of Phase 1 was to identify the major anthropogenic sources of copper
and zinc and estimate the quantities released in a small urban watershed. A second phase (Phase
2) employed field sampling to ground-truth the Phase 1 estimates. This report details findings
from the field sampling of copper and zinc released from a select group of materials in the built
environment.
Materials selected for field sampling included four types of building roofs, three types of siding,
roof gutters, uncoated galvanized chain-link fencing, and galvanized light standards. Rain
washoff from these materials was collected during five storms (six for siding) during 2018.
Siding washoff generated using artificial rain was also analyzed. Atmospheric deposition
collectors were deployed in order to estimate the contribution from this source. Nearly all of the
sampling sites were located within the same 18.6 km2 watershed in Thurston County,
Washington.
Rainwater washoff from most materials contained low concentrations of both copper and zinc.
Exceptions were high concentrations washed from newer asphalt roofs with algae-resistant
granules and high zinc concentrations in washoff from galvanized structures (chain-link fences
and light standards). Results indicate that within the study watershed small quantities of copper
and zinc are released annually from the materials examined. The rates of copper and zinc release
for all of the materials sampled are lower than those estimated in Phase 1. Recommendations are
included for using copper and zinc release data in prioritizing source control actions.
6 Ecology publication 19-03-008 — June 2019
Introduction
Identification of Problem
Human activities have increased the levels of copper (Cu) and zinc (Zn) in the aquatic
environment through both point (e.g., end-of-pipe discharges, dumping) and nonpoint (diffuse)
releases. Historical reconstruction through sediment coring indicates that substantial aquatic
enrichment of both copper and zinc began in the late nineteenth century, coinciding with
industrial development in the Puget Sound area (Lefkovitz et al., 1997). Loading of copper and
zinc into Puget Sound reached a peak in the mid-twenthieth century, then began to decline
following promulgation and implementation of environmental regulations designed to reduce
point source pollution.
The trend toward recovery to natural copper and zinc levels in aquatic systems, however, may be
slowing (Brandenberger et al., 2008). Likely reasons include the rapid urbanization of the Puget
Sound basin and the relative ineffectiveness of regulations to control nonpoint pollution that
accompanies increased development. For instance, a recent review of stormwater data in the
Puget Sound basin indicates that copper and zinc are often found at levels exceeding water
quality criteria for the protection of aquatic life, particularly in commercial and industrial areas
(Hobbs et al., 2015).
Enrichment of aquatic systems with copper is a particular concern in the Puget Sound region due
to its adverse effects on a variety of organisms in both freshwater and marine environments. A
growing body of evidence indicates that low levels of copper in freshwater can exert sublethal
effects in salmonids. These effects include avoidance of copper-containing waters and olfactory
impairment, which can lead to reductions in predator-avoidance or food-finding behaviors
(Sandahl et al., 2007; Tierney et al., 2010). Effects in freshwater can occur at concentrations near
typical ambient levels of dissolved copper and often below criteria established to protect aquatic
organisms (Meyer and Deforest, 2018).
Zinc does not appear to be as toxic as copper at typical concentrations found in the Puget Sound
region, but areas of potential hazard exist where concentrations are elevated (Norton et al.,
2011a, 2011b). There is little or no evidence that zinc in freshwater impacts olfaction in
salmonids or causes other adverse sublethal effects, such as those resulting from copper exposure
(e.g., Lorz and McPherson, 1977). However, avoidance behaviors may be elicited in salmonids,
such as rainbow trout (Oncorhynchus mykiss) exposed to low levels of zinc (Sprague, 1968).
Prior Studies and Impetus for Present Work
In order to address nonpoint sources of copper, zinc, and other chemicals in the Puget Sound
basin, the Washington State Department of Ecology (Ecology) and other agencies conducted the
Puget Sound Toxics Loading Assessment (PSTLA) from 2007 to 2011 (Norton et al., 2011a).
PSTLA was a broad-scope study designed to assess the sources of toxic pollutants, the important
delivery pathways for each chemical, and a systematic evaluation of potential hazards to aquatic
organisms. Copper was identified as a top priority for near-term action due to 1) its potential to
harm aquatic organisms at observed concentrations; 2) the large quantities delivered to Puget
Sound, primarily through surface runoff, with the highest concentrations measured in runoff
from commercial and industrial areas; 3) the large quantities released to the environment,
Copper and Zinc in Urban Runoff: Phase 2 7
particularly from vehicle brake pads, nonagricultural pesticide use, leaching from roofing
materials, leaching from plumbing, and from anti-fouling paint in marine vessels; and 4) the
relative abundance of opportunities to control these nonpoint sources of copper.
Since the initiation of PSTLA, a number of actions have been taken to reduce copper from
nonpoint sources. These include the 2010 Better Brakes Law (Chapter 70.285 RCW), which
requires a near-complete phase-out of copper in brake friction materials by the year 2025, and a
law requiring the near-complete phase-out of copper in vessel bottom paint by 2021 (Chapter
70.300 RCW and subsequent revisions [SHB 2364]). Existing federal law already addresses
copper in plumbing (Lead and Copper Rule; 40 CFR Part 141), and therefore, emphasis was not
placed on additional controls for this source of copper. Pesticides containing copper were further
investigated by Washington State Department of Agriculture and found to be rarely used in the
Puget Sound region (McClain, 2014), rendering this an inconsequential source of copper.
The PSTLA study did not identify zinc as a high-priority chemical, due to its moderate ranking
as a chemical with potential to elicit biological effects. However, zinc releases and loading were
estimated to be extremely high in quantity, second only to petroleum among the chemicals
addressed.
Like copper, the highest zinc concentrations were measured in runoff from commercial and
industrial areas, and overall surface runoff was the primary delivery pathway for zinc to Puget
Sound. The largest estimated quantities released were from leaching of roofing materials and
from vehicles (mainly tire wear). The PSTLA report also noted that quantities of zinc releases
might have been underestimated, because sources such as exposed galvanized materials (e.g.,
light standards, culverts, and guardrails) were not evaluated.
Authors of the PSTLA report recommended that monitoring be conducted to assess chemicals
released from roofing materials. In response, Ecology conducted a study during 2013 and 2014
to evaluate chemicals leached from individual roofing materials (hereafter referred to as the
Ecology Roofing Study [Winters et al., 2014]). This was accomplished by sampling rainwater
washed off of a variety of experimental roofing panels; other roofing system components (e.g.,
flashings, gutters, downspouts, fasteners, HVAC systems) were not included in these
experimental roof constructions.
With a single exception (copper roofing), release rates of copper, zinc, and other chemicals were
much lower — often by orders of magnitude — than those used to calculate basin-wide releases
in the PSTLA study. The authors of the Ecology Roofing Study suggested that the lack of a full
complement of roofing components analyzed, short roof runs (i.e., length of roof), and lack of
representative roof ages were among the possible explanations for the differences.
Recommendations to address these variables were among those proffered for further evaluation.
CuZn Phase 1 Study
Based on results of PSTLA and the Ecology Roofing Study, a number of data needs were
identified to address nonpoint sources of copper and zinc. In particular, the relative importance
of copper and zinc releases from specific nonpoint sources in the Puget Sound region was still
unknown. Ecology launched the Copper and Zinc in Urban Runoff study in 2016 to address these
data gaps. The Copper and Zinc in Urban Runoff study consists of two phases. The initial phase
(CuZn Phase 1) was a “desktop” effort focused on nonpoint sources confined to a relatively
8 Ecology publication 19-03-008 — June 2019
small industrial/commercial sub-basin in the southern Puget Sound region. Release rates were
estimated from literature values, GIS analysis, and local precipitation data (Bookter, 2017a).
CuZn Phase 1 estimated that 360 kg (800 pounds) of copper and 2,700 kg (5,900 pounds) of zinc
are released annually from nonpoint sources in the 18.6 km2 (7.2 square-mile) CuZn study area.
The primary sources of copper were identified as vehicle brake wear, roofing materials, parking
lots, treated lumber, building siding, and vehicle exhaust. The main sources of zinc are moss
control products, building siding, parking lots, vehicle tire wear, chain-link fence, roofing
materials, and vehicle brake wear. Total annual releases for each of these sources, as well as
those for lesser sources, were calculated for the entire study area.
Bookter (2017a) also used a systematic approach to categorize the uncertainty and variability of
each estimate reported in CuZn Phase 1. Sources in the built environment with the highest
potential to release copper or zinc and the greatest uncertainty around the estimated loading
values were recommended for further investigation. Suggested sources for monitoring in the
built environment included parking lots, building roofing and siding materials, streetlights (light
standards), and roof gutters.
Present Study
The present study, Phase 2 of the Copper and Zinc in Urban Runoff study (CuZn Phase 2), is a
field sampling effort intended to fulfill some of the recommendations from the CuZn Phase 1
report. Sampling was conducted primarily in the same sub-basin analyzed in CuZn Phase 1.
Details of the sampling design, locations, and methods are discussed further in following
sections and in the Quality Assurance Project Plan (QAPP; Bookter, 2017b).
Briefly, rainwater washoff from the following components of the built environment were
sampled and analyzed for copper and zinc:
Building roofs
Building siding
Roof gutters
Light standards
Chain-link fencing
The overall goal of the CuZn study is to identify nonpoint sources of copper and zinc in the
urban environment and attempt to fill gaps in the current knowledge regarding those sources.
CuZn Phase 1 identified sources and data gaps using literature review. CuZn Phase 2 fills some
of those gaps with field data.
The focus of this study is on primary releases of copper and zinc. Field data on fate and transport
of newly released copper or zinc is not assessed. The results from this study will inform future
source control efforts in the identification and reduction of important sources of copper and zinc
in urban areas. Source control prioritization should also incorporate the fate and transport of
pollutants.
Copper and Zinc in Urban Runoff: Phase 2 9
Project goals
The goal of CuZn Phase 2 was to measure the quantity of copper and zinc released from various
materials and structures in the urban built environment.
Project objectives
To accomplish the project goals, the following objectives were achieved:
Measure the quantity of copper and zinc leached from specific materials in the urban
environment.
Develop release rates for copper and zinc from various materials.
Recalculate study area loading values using new release rates.
Compare release rates to CuZn Phase 1 data.
10 Ecology publication 19-03-008 — June 2019
Methods
Sample Design and Scope
Parameters of Interest and Sources of Chemical Release
CuZn Phase 2 was designed to assess building materials of various ages in situ and exposed to
typical environmental conditions in the study area. Details of the rationale for the project sample
design are in the QAPP (Bookter, 2017b). Parameters of interest were limited to copper and zinc
due to their potential for adverse biological effects (particularly copper) and the magnitude of
quantities potentially released from building materials. Ancillary water quality parameters
analyzed included total suspended solids (TSS), dissolved organic carbon (DOC), hardness, pH,
turbidity, temperature, and conductivity.
Specific sources assessed for copper and zinc release were roofs, building siding, gutters, light
standards, and chain-link fencing. These sources were selected based on results of CuZn Phase 1
(Bookter, 2017a) and data gaps identified in previous studies (Norton et al., 2011a; Winters et
al., 2014). Bulk atmospheric deposition sampling was also conducted with the intention to
correct for air deposition as a source of copper and zinc. Metals present in the atmosphere may
be the result of nonindustrial combustion emissions, industrial emissions, or vehicle wear
particles such as tire and brake dust (Ochoa Gonzales et al., 2016).
Study Area
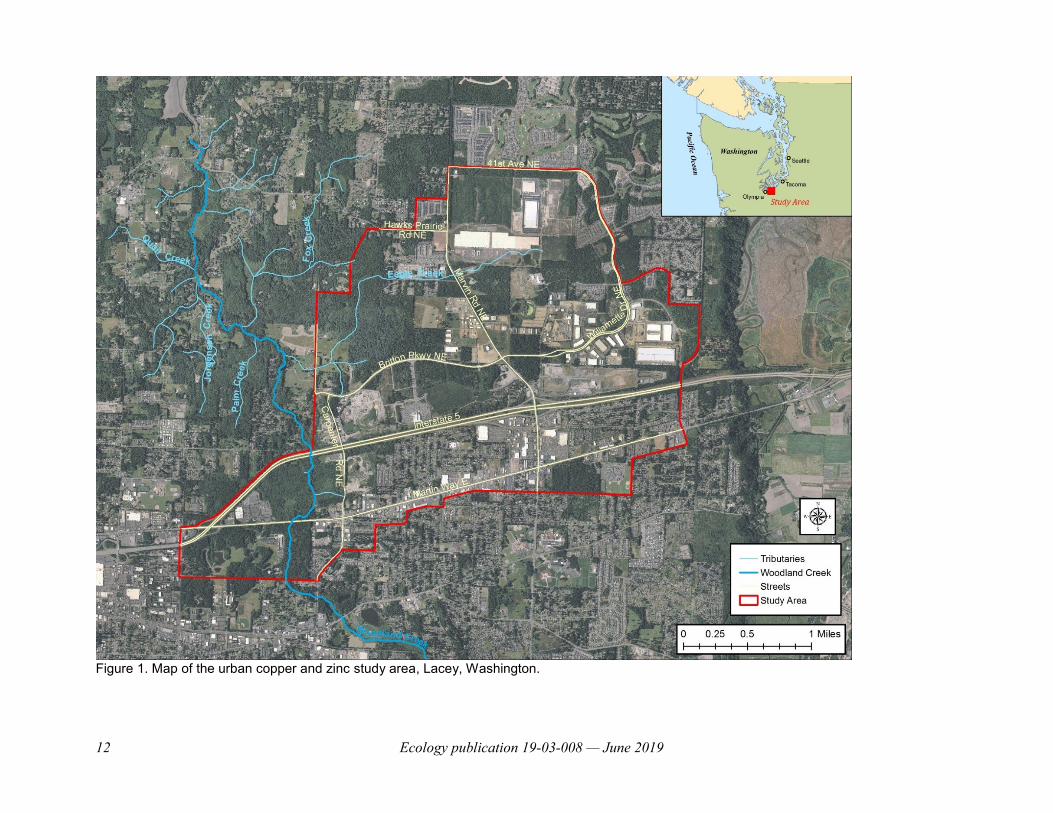
The Copper and Zinc in Urban Runoff study area is an 18.6 km2 (7.2 square-mile) portion of the
lower Woodland Creek watershed in the City of Lacey and adjacent unincorporated Thurston
County (Figure 1). Woodland Creek drains to Henderson Inlet in southern Puget Sound.
The study area was selected for the concentrated commercial and industrial land uses, which
have been shown to have higher copper and zinc concentrations in stormwater and streams than
other land uses (Herrera Environmental Consultants, Inc., 2011; Hobbs et al., 2015). In 2016,
land use in the study area was 35.5% commercial/industrial, 13.6% residential, 33.9%
undeveloped, 12.4% roadways, 2.9% parks, and 1.8% agricultural (Figure 2). Of the area
currently developed, 66% is commercial/industrial land use. This land use profile is similar to
other urban areas of the Puget Sound basin.
Bookter (2017a) used U.S. census data to estimate the 2010 population of the study area at
approximately 7,600. The study area is undergoing rapid development (Collyard and Anderson,
2017).
The CuZn study area is located approximately halfway between Seattle, Washington, and
Portland, Oregon, along the Interstate 5 corridor. The proximity to two large urban centers has
made Lacey a transportation hub for major distribution companies (e.g., Target, Home Depot,
Trader Joes, Harbor Wholesale Foods). In addition, Joint Base Lewis–McChord is located
approximately 24 km (15 miles) north of the study area. This has resulted in increased
development of large warehouses, apartment complexes, tract housing, and commercial services
(e.g., big-box stores, strip malls, restaurants, banks).
Copper and Zinc in Urban Runoff: Phase 2 11
The climate of the study area is temperate. Monthly average high and low temperatures range
from 78°F/51°F (26°C/11°C) in August to 44°F/33°F (7°C/0.6°C) in December (Weather.com1).
The average annual precipitation between 2003 and 2016 was 1003 mm (39.5 inches). The
annual number of days of rain varied from 104 to 169 in that same period (Nat Kale, pers.
comm., Thurston County Stormwater, 2018).
The study area boundary was initially drawn along hydrological boundaries for two small
watersheds draining into Woodland Creek. Because the focus of the study is on sources in the
built environment, the study area boundary was expanded to follow tax parcel and neighborhood
borders.
1 https://weather.com/weather/monthly/l/Lacey+WA+USWA0217:1:US
12 Ecology publication 19-03-008 — June 2019
Figure 1. Map of the urban copper and zinc study area, Lacey, Washington.
Copper and Zinc in Urban Runoff: Phase 2 13
Figure 2. Map of 2016 land use in the urban copper and zinc study area, Lacey, Washington.
14 Ecology publication 19-03-008 — June 2019
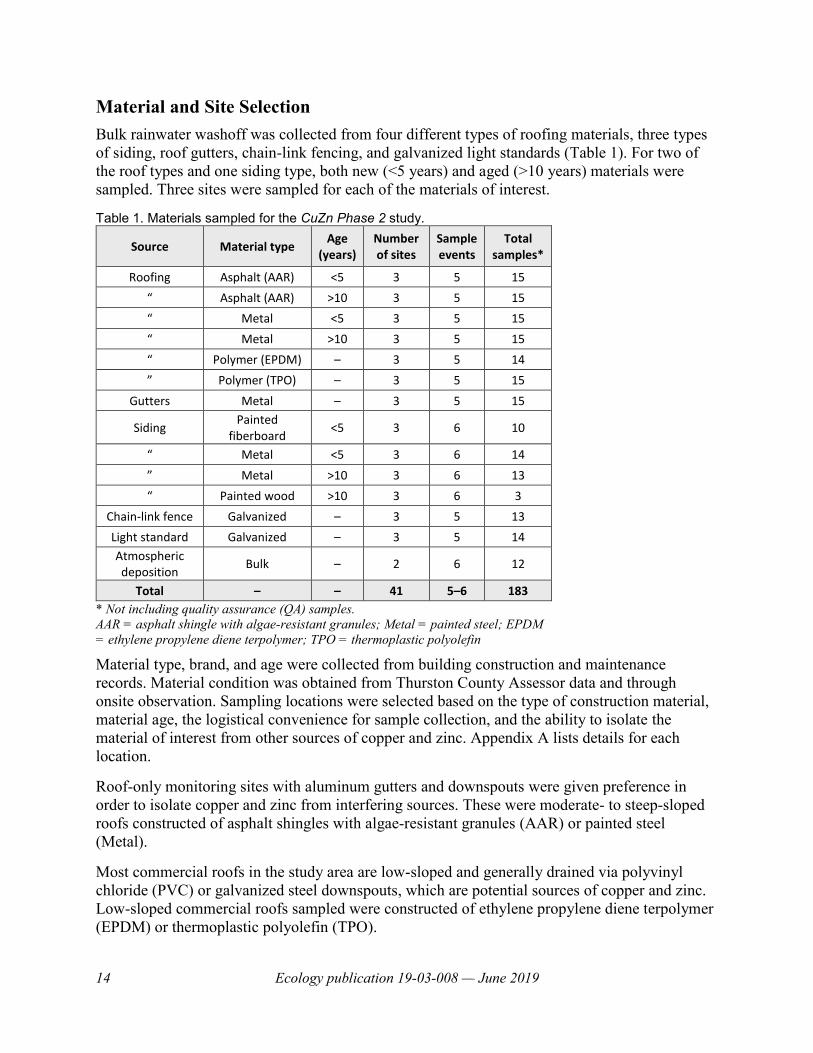
Material and Site Selection
Bulk rainwater washoff was collected from four different types of roofing materials, three types
of siding, roof gutters, chain-link fencing, and galvanized light standards (Table 1). For two of
the roof types and one siding type, both new (<5 years) and aged (>10 years) materials were
sampled. Three sites were sampled for each of the materials of interest.
Table 1. Materials sampled for the CuZn Phase 2 study.
Source Material type Age
(years) Number of sites
Sample events
Total samples*
Roofing Asphalt (AAR) <5 3 5 15
“ Asphalt (AAR) >10 3 5 15
“ Metal <5 3 5 15
“ Metal >10 3 5 15
“ Polymer (EPDM) – 3 5 14
” Polymer (TPO) – 3 5 15
Gutters Metal – 3 5 15
Siding Painted
fiberboard <5 3 6 10
“ Metal <5 3 6 14
” Metal >10 3 6 13
“ Painted wood >10 3 6 3
Chain-link fence Galvanized – 3 5 13
Light standard Galvanized – 3 5 14
Atmospheric deposition
Bulk – 2 6 12
Total – – 41 5–6 183
* Not including quality assurance (QA) samples.
AAR = asphalt shingle with algae-resistant granules; Metal = painted steel; EPDM
= ethylene propylene diene terpolymer; TPO = thermoplastic polyolefin
Material type, brand, and age were collected from building construction and maintenance
records. Material condition was obtained from Thurston County Assessor data and through
onsite observation. Sampling locations were selected based on the type of construction material,
material age, the logistical convenience for sample collection, and the ability to isolate the
material of interest from other sources of copper and zinc. Appendix A lists details for each
location.
Roof-only monitoring sites with aluminum gutters and downspouts were given preference in
order to isolate copper and zinc from interfering sources. These were moderate- to steep-sloped
roofs constructed of asphalt shingles with algae-resistant granules (AAR) or painted steel
(Metal).
Most commercial roofs in the study area are low-sloped and generally drained via polyvinyl
chloride (PVC) or galvanized steel downspouts, which are potential sources of copper and zinc.
Low-sloped commercial roofs sampled were constructed of ethylene propylene diene terpolymer
(EPDM) or thermoplastic polyolefin (TPO).
Copper and Zinc in Urban Runoff: Phase 2 15
Chain-link fencing selected for sampling all appeared to be of the galvanized-before-weave type,
based on visual inspection.
Light standards were industrial-grade galvanized steel of the type used on major roadways. Two
were located on interstate on-ramps and one was located at a large park-and-ride lot.
Bulk Washoff Collection
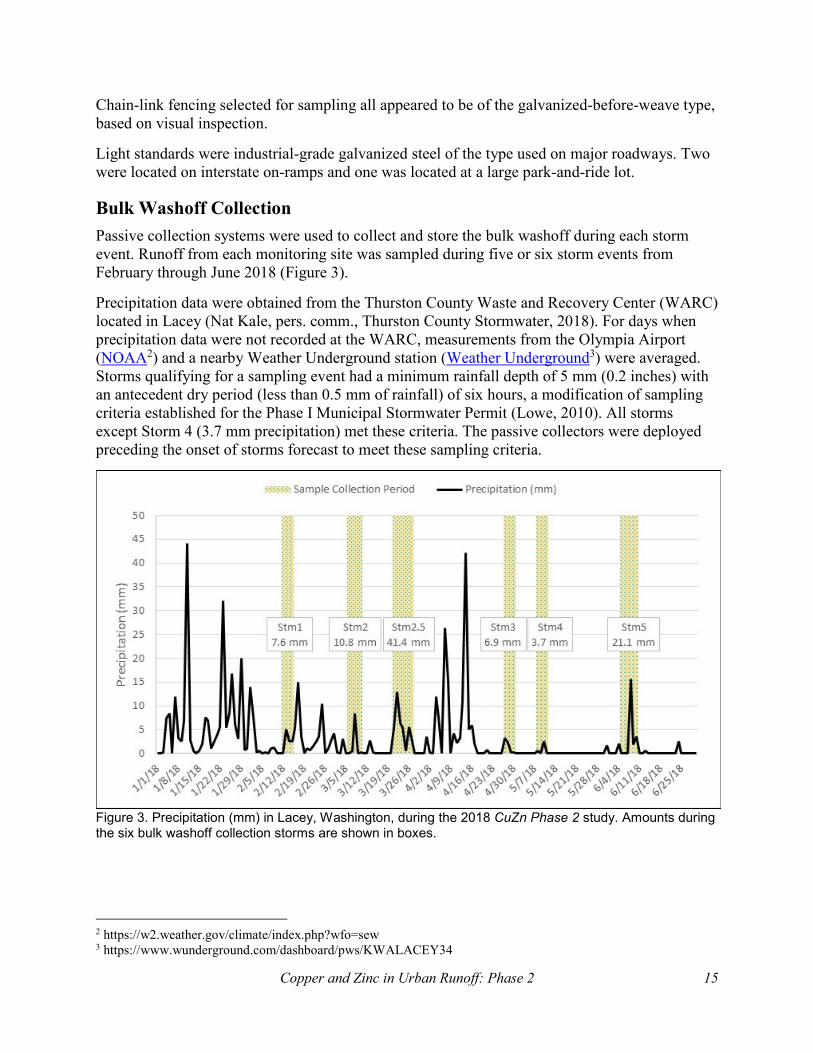
Passive collection systems were used to collect and store the bulk washoff during each storm
event. Runoff from each monitoring site was sampled during five or six storm events from
February through June 2018 (Figure 3).
Precipitation data were obtained from the Thurston County Waste and Recovery Center (WARC)
located in Lacey (Nat Kale, pers. comm., Thurston County Stormwater, 2018). For days when
precipitation data were not recorded at the WARC, measurements from the Olympia Airport
(NOAA2) and a nearby Weather Underground station (Weather Underground3) were averaged.
Storms qualifying for a sampling event had a minimum rainfall depth of 5 mm (0.2 inches) with
an antecedent dry period (less than 0.5 mm of rainfall) of six hours, a modification of sampling
criteria established for the Phase I Municipal Stormwater Permit (Lowe, 2010). All storms
except Storm 4 (3.7 mm precipitation) met these criteria. The passive collectors were deployed
preceding the onset of storms forecast to meet these sampling criteria.
Figure 3. Precipitation (mm) in Lacey, Washington, during the 2018 CuZn Phase 2 study. Amounts during the six bulk washoff collection storms are shown in boxes.
2 https://w2.weather.gov/climate/index.php?wfo=sew 3 https://www.wunderground.com/dashboard/pws/KWALACEY34
16 Ecology publication 19-03-008 — June 2019
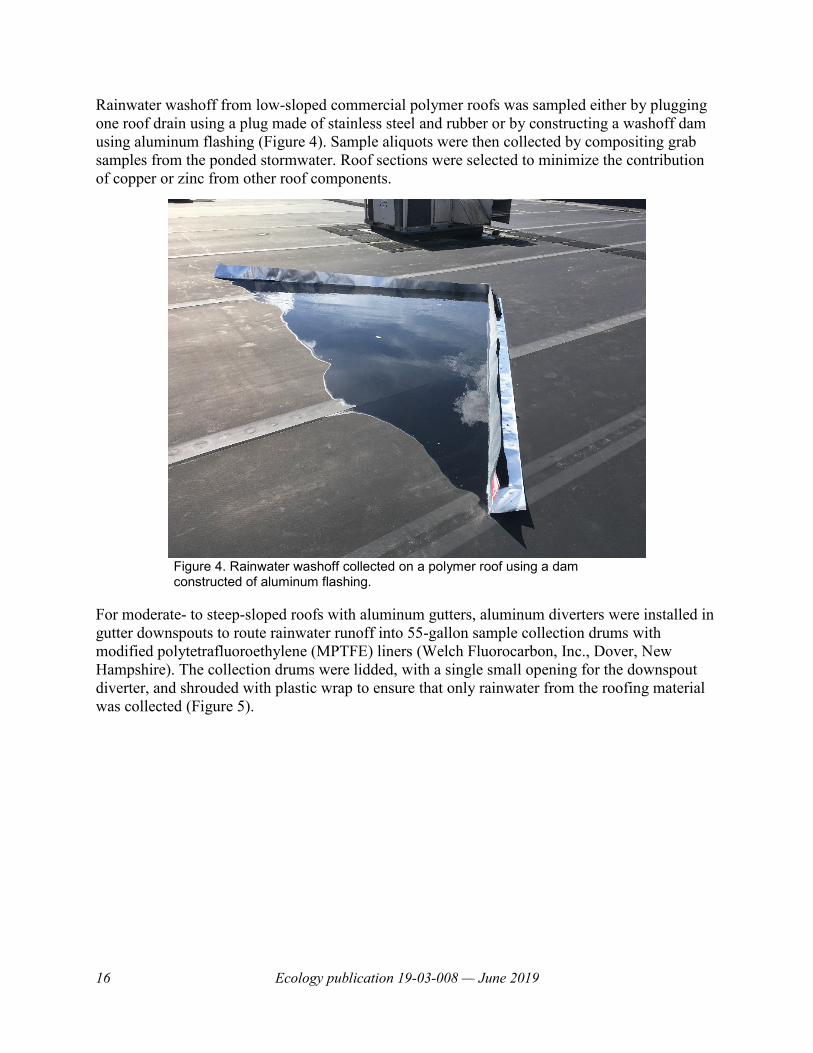
Rainwater washoff from low-sloped commercial polymer roofs was sampled either by plugging
one roof drain using a plug made of stainless steel and rubber or by constructing a washoff dam
using aluminum flashing (Figure 4). Sample aliquots were then collected by compositing grab
samples from the ponded stormwater. Roof sections were selected to minimize the contribution
of copper or zinc from other roof components.
Figure 4. Rainwater washoff collected on a polymer roof using a dam constructed of aluminum flashing.
For moderate- to steep-sloped roofs with aluminum gutters, aluminum diverters were installed in
gutter downspouts to route rainwater runoff into 55-gallon sample collection drums with
modified polytetrafluoroethylene (MPTFE) liners (Welch Fluorocarbon, Inc., Dover, New
Hampshire). The collection drums were lidded, with a single small opening for the downspout
diverter, and shrouded with plastic wrap to ensure that only rainwater from the roofing material
was collected (Figure 5).
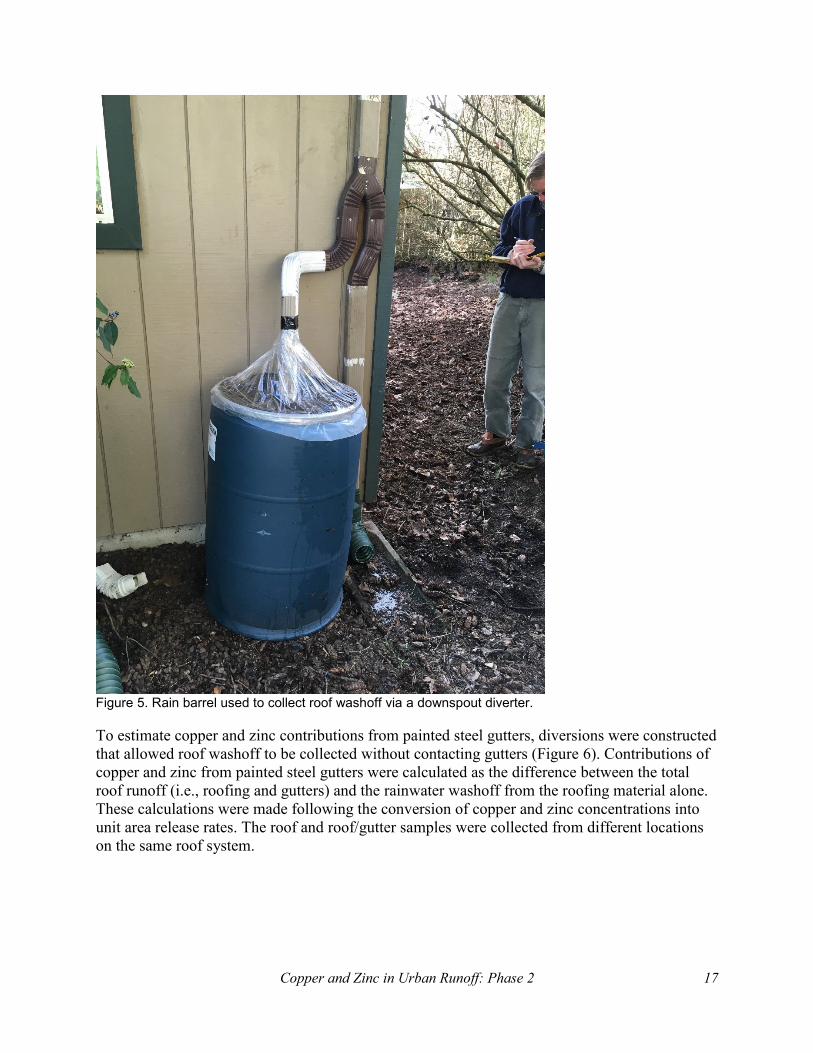
Copper and Zinc in Urban Runoff: Phase 2 17
Figure 5. Rain barrel used to collect roof washoff via a downspout diverter.
To estimate copper and zinc contributions from painted steel gutters, diversions were constructed
that allowed roof washoff to be collected without contacting gutters (Figure 6). Contributions of
copper and zinc from painted steel gutters were calculated as the difference between the total
roof runoff (i.e., roofing and gutters) and the rainwater washoff from the roofing material alone.
These calculations were made following the conversion of copper and zinc concentrations into
unit area release rates. The roof and roof/gutter samples were collected from different locations
on the same roof system.

18 Ecology publication 19-03-008 — June 2019
Figure 6. System used to divert roof washoff without contacting the building gutter and downspout. Aluminum flashing (not visible in this photograph) was used to prevent contact with the building gutter.
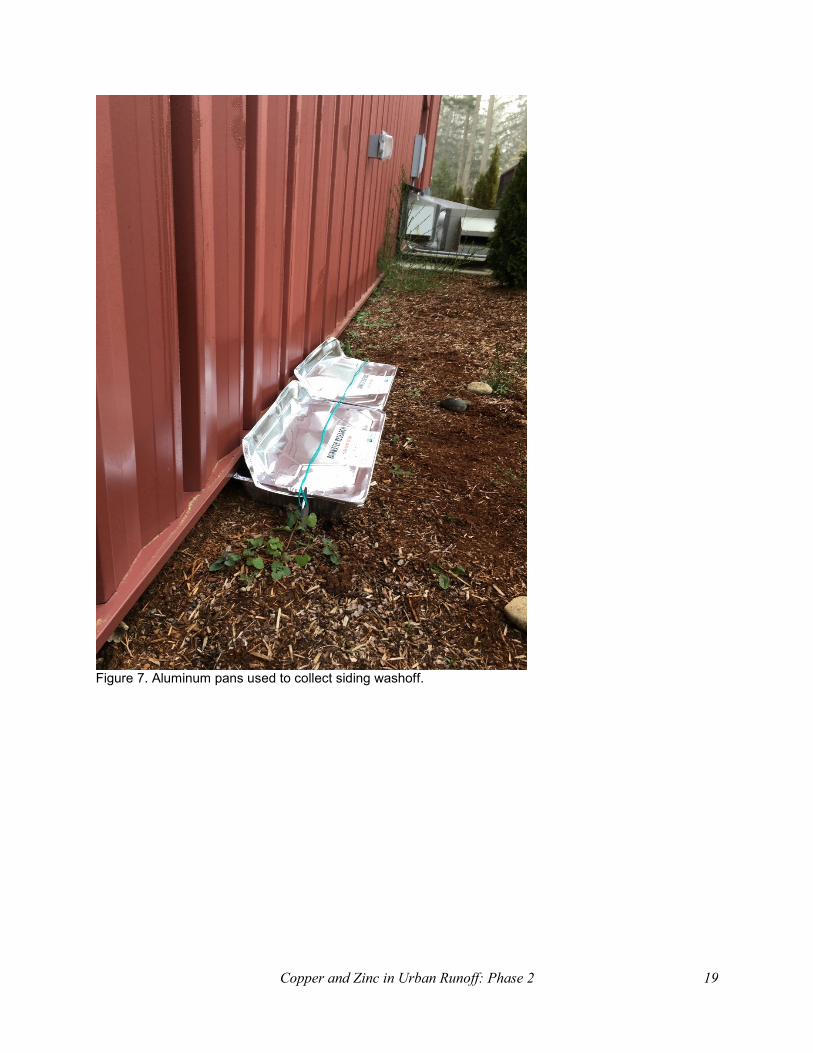
Building siding locations were selected to maximize rainwater volume and reduce the copper and
zinc contributions from other construction materials. The sides of buildings facing the prevailing
wind direction — generally the southwest — was sampled where possible. Siding material
locations were selected to avoid contact with roof washoff.
Rainwater washoff from building siding was collected by placing an aluminum pan beneath the
siding drip line (Figure 7). Pans were lidded, with only the area underneath the dripline open for
washoff collection.
Copper and Zinc in Urban Runoff: Phase 2 19
Figure 7. Aluminum pans used to collect siding washoff.

20 Ecology publication 19-03-008 — June 2019
Washoff from galvanized light standards was collected by installing aluminum foil collars near
the base of the poles (Figure 8). The collar routed washoff into stainless steel funnels that
drained into lidded five-gallon buckets with MPTFE liners. Buckets were lidded with a single
small opening for the funnel to ensure that only washoff from the light standard was collected.
Figure 8. Aluminum foil collar used to collect washoff from galvanized light standard.
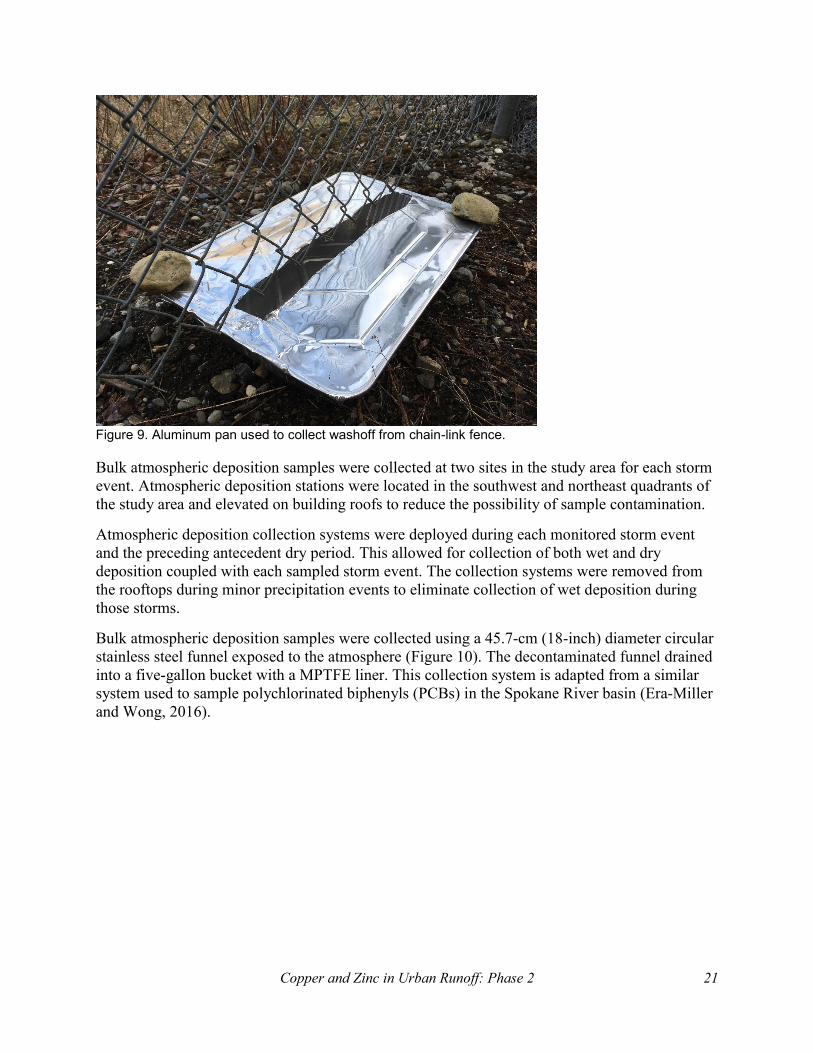
Washoff from galvanized chain-link fences was collected in aluminum pans placed below a
section of fence dripline (Figure 9). Pans were lidded on either side of the fence to ensure that
only washoff interacting with chain-link material was collected.
Copper and Zinc in Urban Runoff: Phase 2 21
Figure 9. Aluminum pan used to collect washoff from chain-link fence.
Bulk atmospheric deposition samples were collected at two sites in the study area for each storm
event. Atmospheric deposition stations were located in the southwest and northeast quadrants of
the study area and elevated on building roofs to reduce the possibility of sample contamination.
Atmospheric deposition collection systems were deployed during each monitored storm event
and the preceding antecedent dry period. This allowed for collection of both wet and dry
deposition coupled with each sampled storm event. The collection systems were removed from
the rooftops during minor precipitation events to eliminate collection of wet deposition during
those storms.
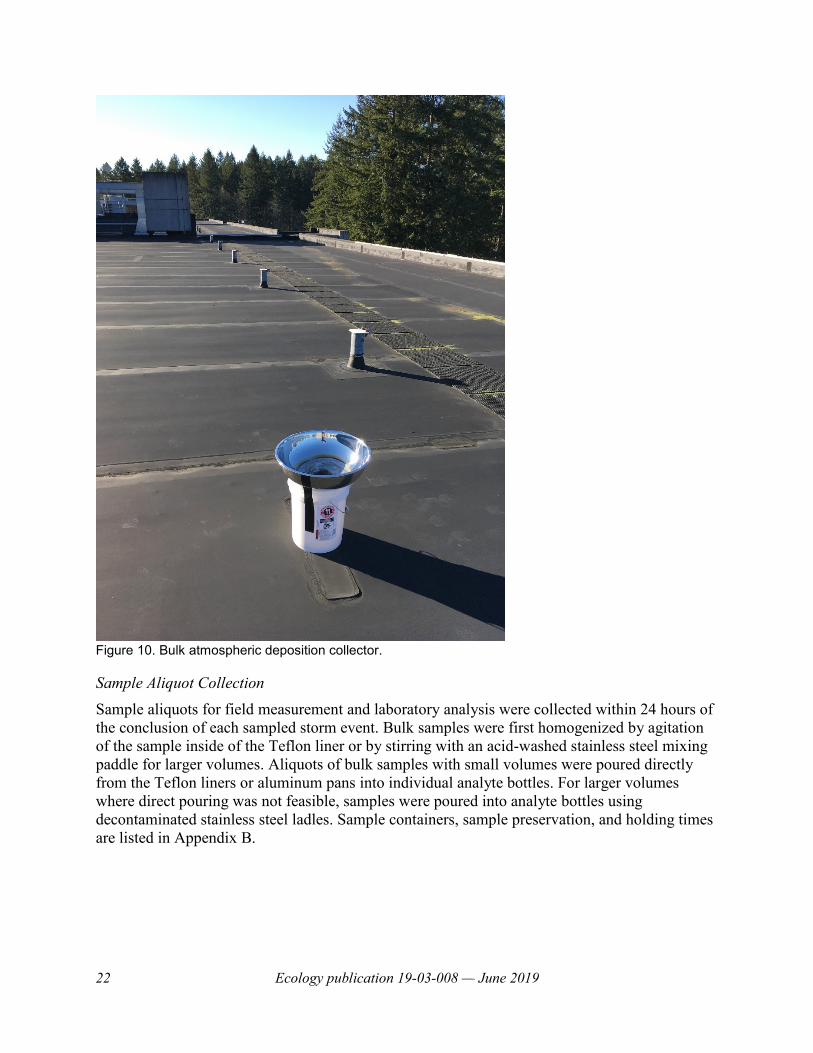
Bulk atmospheric deposition samples were collected using a 45.7-cm (18-inch) diameter circular
stainless steel funnel exposed to the atmosphere (Figure 10). The decontaminated funnel drained
into a five-gallon bucket with a MPTFE liner. This collection system is adapted from a similar
system used to sample polychlorinated biphenyls (PCBs) in the Spokane River basin (Era-Miller
and Wong, 2016).
22 Ecology publication 19-03-008 — June 2019
Figure 10. Bulk atmospheric deposition collector.
Sample Aliquot Collection
Sample aliquots for field measurement and laboratory analysis were collected within 24 hours of
the conclusion of each sampled storm event. Bulk samples were first homogenized by agitation
of the sample inside of the Teflon liner or by stirring with an acid-washed stainless steel mixing
paddle for larger volumes. Aliquots of bulk samples with small volumes were poured directly
from the Teflon liners or aluminum pans into individual analyte bottles. For larger volumes
where direct pouring was not feasible, samples were poured into analyte bottles using
decontaminated stainless steel ladles. Sample containers, sample preservation, and holding times
are listed in Appendix B.
Copper and Zinc in Urban Runoff: Phase 2 23
Equipment decontamination was done by scrubbing with Liquinox detergent (Alconox, Inc.,
White Plains, New York) followed by sequential rinses with tap water, 10% trace metals grade
nitric acid (Fisher Scientific, Ottawa, Ontario), and deionized water, then wrapped in aluminum
foil (dull side in) for transport into the field. Filtering for dissolved metals and dissolved organic
carbon was conducted on-site within 15 minutes of sample processing using precleaned 0.45 µm
filters.
Rainwater washoff samples were placed on ice immediately following aliquot collection and
kept in a locked walk-in refrigerator at Ecology’s Operations Center upon return from field.
Samples were transported to Manchester Environmental Laboratory (MEL) with 48 hours of
collection. MEL conducted analysis for total and dissolved metals (Cu, Zn), dissolved organic
carbon (DOC), total suspended solids (TSS), and hardness.
Following aliquot collection for laboratory analysis, the remainder of the bulk sample was
analyzed in the field for temperature, pH, conductivity, and turbidity using a YSI EXO1 multi-
parameter sonde (YSI, Inc., Yellow Springs, Ohio).
Equipment and field blanks were prepared by rinsing the equipment or filtering with laboratory-
provided deionized water and collecting the resultant rinsate or filtrate prior to sample collection.
Rinsate from MPTFE liners, aluminum pans, and atmospheric deposition funnels was analyzed
for total and dissolved metals (Cu, Zn). The filter apparatus blanks were analyzed for dissolved
metals (Cu, Zn).
The field-deployed water quality sensors (pH, conductivity, and turbidity) were calibrated
according to the manufacturer’s recommendations before each sample collection event and
checked against calibration standards at the end of each event. The pH sensor was calibrated for
every sample event using a three-point calibration with standards for pH 4, 7, and 10. A single-
point calibration using a 1,000 µS/cm standard was performed on the conductivity sensor. The
turbidity sensor was calibrated using 0 NTU (deionized water), 126 NTU, and 1010 NTU
standards. All standard solutions used were manufacturer-recommended standards.
Artificial Rainwater Washoff Sampling
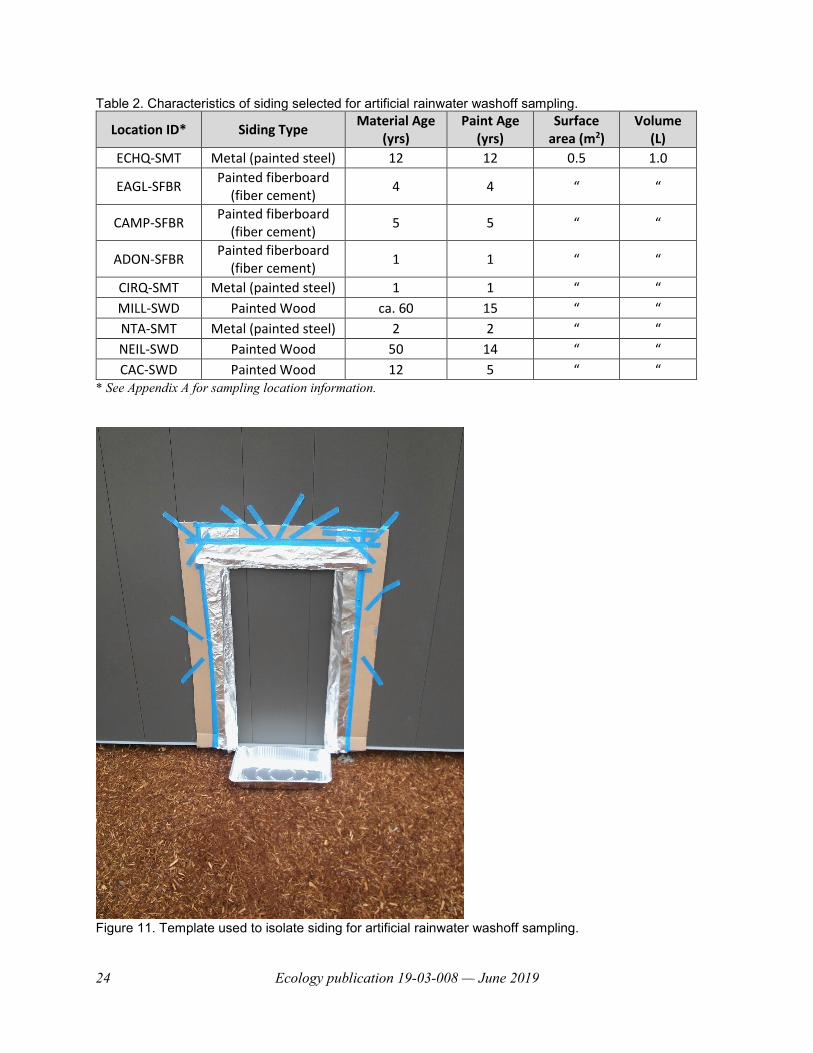
Artificial rainwater washoff sampling was conducted on August 15, 2018, to supplement data on
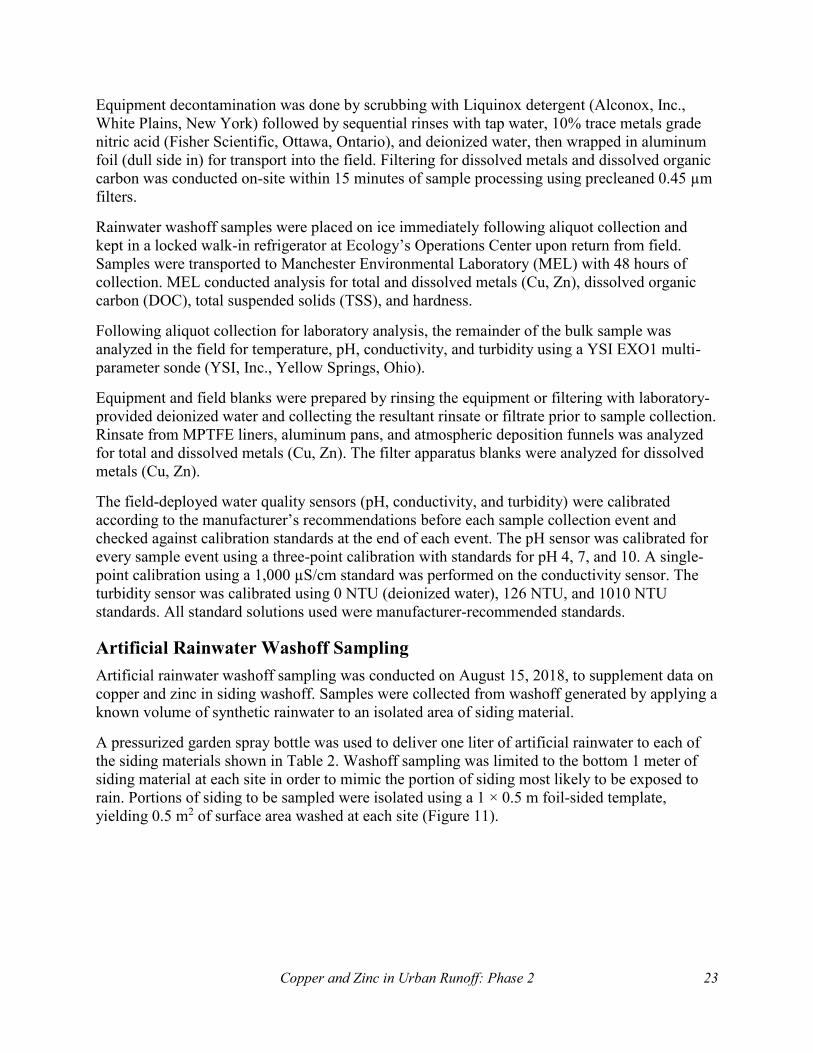
copper and zinc in siding washoff. Samples were collected from washoff generated by applying a
known volume of synthetic rainwater to an isolated area of siding material.
A pressurized garden spray bottle was used to deliver one liter of artificial rainwater to each of
the siding materials shown in Table 2. Washoff sampling was limited to the bottom 1 meter of
siding material at each site in order to mimic the portion of siding most likely to be exposed to
rain. Portions of siding to be sampled were isolated using a 1 × 0.5 m foil-sided template,
yielding 0.5 m2 of surface area washed at each site (Figure 11).
24 Ecology publication 19-03-008 — June 2019
Table 2. Characteristics of siding selected for artificial rainwater washoff sampling.
Location ID* Siding Type Material Age
(yrs) Paint Age
(yrs) Surface
area (m2) Volume
(L)
ECHQ-SMT Metal (painted steel) 12 12 0.5 1.0
EAGL-SFBR Painted fiberboard
(fiber cement) 4 4 “ “
CAMP-SFBR Painted fiberboard
(fiber cement) 5 5 “ “
ADON-SFBR Painted fiberboard
(fiber cement) 1 1 “ “
CIRQ-SMT Metal (painted steel) 1 1 “ “
MILL-SWD Painted Wood ca. 60 15 “ “
NTA-SMT Metal (painted steel) 2 2 “ “
NEIL-SWD Painted Wood 50 14 “ “
CAC-SWD Painted Wood 12 5 “ “ * See Appendix A for sampling location information.
Figure 11. Template used to isolate siding for artificial rainwater washoff sampling.

Copper and Zinc in Urban Runoff: Phase 2 25
The spray bottle was pressurized to approximately the same level at each site by replicating the
amount of artificial rainwater in the sprayer at each site and pumping the same number of times.
Spray width (3 cm) and distance from siding (10 cm) were consistent for each application. The
angle of spray was approximately 20 degrees outward from vertical to approximate the angle of
wind-driven rain.
Siding was washed twice in succession at each site in order to assess whether the initial spray
washed off airborne dust and film. Samples were collected after each wash, for a total of two
samples per site. Catchment of the washoff was conducted in the same manner as for the
rainwater washoff sampling, using identical aluminum pans deployed without lids.
Artificial rainwater was prepared from an adaptation of that described in Davis et al (2001). The
solution, with a final pH of 5.2, contained 10 µM NaCl, 5.5 µM HNO3, and 5.5 µM H2SO4 in
Milli-Q Reference (reverse osmosis) water. Sodium chloride and acids were trace metals grade
(Fisher Scientific, Ottawa, Ontario). Sodium and chloride composition, as well as pH, were
similar to those of natural rainwater in western Washington (NADP, 2017).
All washoff samples using artificial rainwater were analyzed for total and dissolved copper and
zinc only. Equipment blanks were collected from the sprayer prior to sampling and at sampling
completion and analyzed for total copper and zinc.
Measurement Procedures
Total and dissolved copper and zinc were prepared and analyzed by inductively coupled plasma–
mass spectrometry (ICP-MS) following the protocols outlined in EPA Method 200.8 (Table 3).
Dissolved organic carbon (DOC) was analyzed using a high temperature combustion/infrared
analyzer, described in Standard Methods (SM) 5310B. Total suspended solids (TSS)
measurements were made by drying nonfilterable residue at 103–105°C (SM 2540D). Hardness
was measured by ICP–atomic emission spectrometry (EPA 200.7) and calculated using the
procedure in SM 2340B.
Table 3. Methods used for laboratory and field measurements.
Location Analyte Typical
reporting limit Sample prep
method Analytical
(instrument) method
Laboratory Total and dissolved copper
0.1 µg/L EPA 200.2a EPA 200.8
Laboratory Total and dissolved zinc
1–5 µg/L EPA 200.2a EPA 200.8
Laboratory Dissolved organic carbon
0.5 mg/L na SM 5310B
Laboratory Total suspended solids 1–2 mg/L na SM 2540D
Laboratory Hardness (as CaCO3) 0.3 mg/L na EPA 200.7/SM 2340B
Field* pH 0.01 S.U. na pH sensor
Field* Conductivity 0.01 µS/cm na conductivity sensor
Field* Turbidity 0.1 NTU na turbidity sensor EPA = U.S. Environmental Protection Agency; SM = Standard Methods for the Examination of Water and
Wastewater (Baird et al., 2017).
na = not applicable; a For total metals only; * Reporting limits based on YSI EXO1 sensor.
26 Ecology publication 19-03-008 — June 2019
Data Reduction and Reporting
Naming Conventions for Material Types
Naming conventions for building material types are based on the building component and
specific material type. For example, the name assigned to metal siding is S (for siding) + MT (for
metal) = SMT. For building materials where locations were selected for age differences, an
extension was added to the material name (e.g., the name assigned to metal siding >10 years old
is SMT>10. Naming convention for building materials and other materials are shown in Table 4.
In cases where results from a specific locations are discussed, the location identification is
named using the location abbreviation plus the material type. For instance, the Natural Resources
Building (NRB) metal roofing (RMT) is assigned the name NRB-RMT. All locations, material
types, and associated names are included in Appendix A.
Table 4. Naming conventions for material types.
Building component Material type Assigned
name
Material age (yrs)
Extended assigned
name
Roofing Asphalt shingle with algae-resistant granules RAAR <5 RAAR<5
“ “ RAAR >10 RAAR>10
“ Metal (painted steel) RMT <5 RMT<5
“ “ RMT >10 RMT>10
“ Ethylene propylene diene terpolymer REPDM -- REPDM
“ Thermoplastic polyolefin RTPO -- RTPO
Gutters Metal (painted steel) GUTT -- GUTT
Siding Fiberboard (painted fiber cement) SFBR -- SFBR
“ Metal (painted steel) SMT <5 SMT<5
“ “ SMT >10 SMT>10
“ Wood (painted) SWD -- SWD
Chain-link fence Galvanized steel CNLNK -- CNLNK
Light standard Galvanized steel LGT -- LGT
Atmospheric deposition Atmospheric deposition ATM -- ATM
Presentation of Results for Washoff Samples
Unless stated otherwise, all concentrations of copper and zinc in water are expressed as
micrograms per liter (µg/L). All conventional parameters are expressed as milligrams per liter
(mg/L).
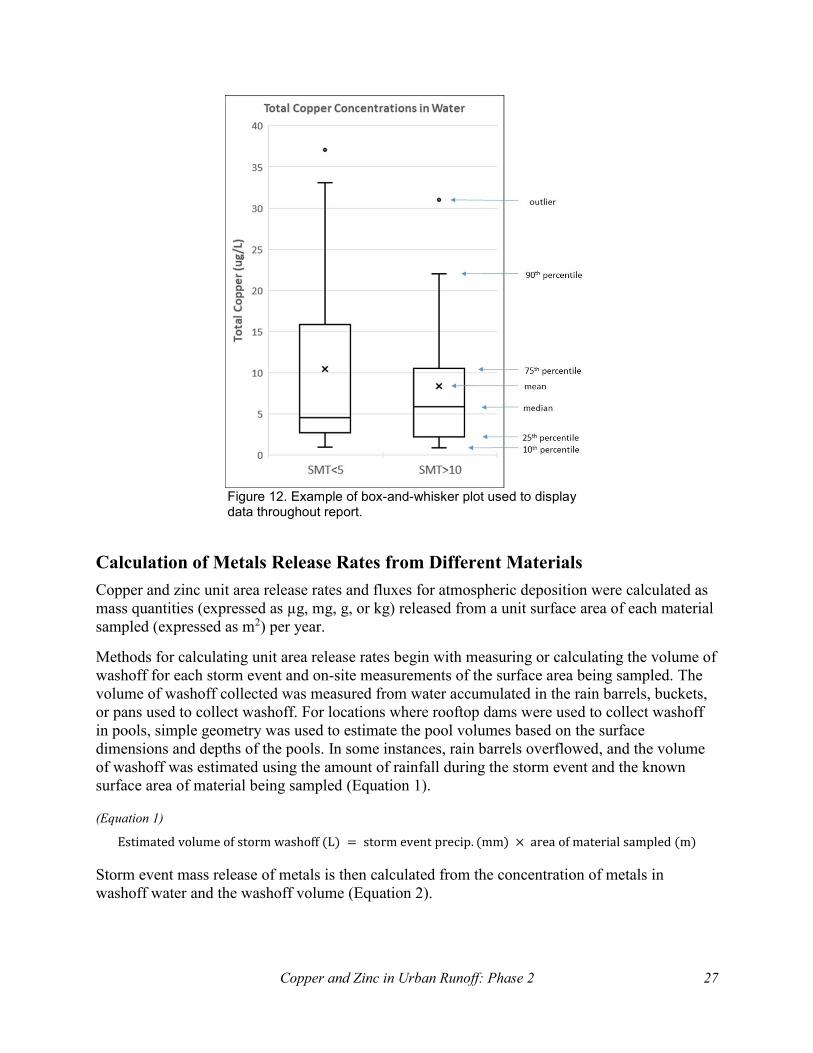
Box-and-whisker plots are used to summarize concentrations of metals and other parameters in
water, as well in other types of data analysis. Box-and-whisker plots are a useful graphical
display of a data set where means, interquartile values (medians, 25th and 75th percentiles), 10th
and 90th percentiles, and outliers can be compared among groups. Figure 12 shows an example
box-and-whisker plot and its components.
Copper and Zinc in Urban Runoff: Phase 2 27
Figure 12. Example of box-and-whisker plot used to display data throughout report.
Calculation of Metals Release Rates from Different Materials
Copper and zinc unit area release rates and fluxes for atmospheric deposition were calculated as
mass quantities (expressed as µg, mg, g, or kg) released from a unit surface area of each material
sampled (expressed as m2) per year.
Methods for calculating unit area release rates begin with measuring or calculating the volume of
washoff for each storm event and on-site measurements of the surface area being sampled. The
volume of washoff collected was measured from water accumulated in the rain barrels, buckets,
or pans used to collect washoff. For locations where rooftop dams were used to collect washoff
in pools, simple geometry was used to estimate the pool volumes based on the surface
dimensions and depths of the pools. In some instances, rain barrels overflowed, and the volume
of washoff was estimated using the amount of rainfall during the storm event and the known
surface area of material being sampled (Equation 1).
(Equation 1)
Estimated volume of storm washoff (L) = storm event precip. (mm) × area of material sampled (m)
Storm event mass release of metals is then calculated from the concentration of metals in
washoff water and the washoff volume (Equation 2).
28 Ecology publication 19-03-008 — June 2019
(Equation 2)
Event mass release (µg) = volume of storm washoff collected (L) × metals conc. in washoff (µg/L)
This can also be expressed as unit area release at each location (Equation 3).
(Equation 3)
Event unit area release (mg/m2) = event mass release of metals (µg)
known washoff area (m2) ×
mg
1,000 µg
Once the storm event release of metals was calculated for each location and material being
sampled, an annual release rate was estimated by assuming that the storm precipitation amount
represented a fraction of the annual average precipitation (Equation 4).
(Equation 4)
Annual release rate (mg/m2/yr) = event unit area release (mg/m2) × annual precip. (mm/yr)
storm event precip. (mm)
Annual mass releases (loads) for a given material in a given area can then be calculated by
multiplying the annual release rate by the surface area of the material (Equation 5).
(Equation 5)
Annual mass release (kg/yr) = annual release rate (mg/m2/yr) × material area (m2) × kg
106 mg
Data Quality
Quality of Laboratory Analyses
Quality of metals and hardness data was assessed through analysis of lab blanks, lab control
samples (spiked blanks), and matrix spikes. Analyses were performed in duplicate for each
sample batch (≤20 samples) to yield a measure of precision.
Quality of DOC and TSS data was assessed through analysis of a single lab blank, lab control
sample, and matrix spike per sample batch. To assess precision, one sample per batch was
analyzed in duplicate.
Bias
With few exceptions, metals and conventionals (DOC, TSS, and hardness) were free of
measurable laboratory contamination based on analysis of lab blanks. Copper was detected in 2
blanks (0.046 and 0.044 µg/L; Storms 4 and 5, respectively) and zinc was detected in one blank
(0.16 µg/L, Storm 5) at or near the method detection limits and are considered insignificant
relative to sample results. All blanks analyzed for conventionals were nondetects.
Laboratory control samples for metals and hardness had recoveries of 96%–110%, which are
well within the control limits of 85%–115%. Recoveries for DOC and TSS were 94%–102%,
within the control limits of 80%–120%.
Copper and Zinc in Urban Runoff: Phase 2 29
Hardness and DOC were well within matrix spike control limits of 75%–125%. Matrix spike
recoveries for metals were nearly always within the control limits of 75%–125%. One recovery
for zinc (Storm 4) was slightly outside control limits (128%), and two others (also Storm 4) were
well outside control limits, due to high native zinc concentrations relative to spike amounts.
Other zinc sample batches from Storm 4 had good (97%–108%) recovery.
The arithmetic means for all blank spike recoveries and all matrix spike recoveries for metals
was 102% and 103%, respectively. Taken together with the individual sample batch analyses,
there is no indication of an overall bias in the laboratory data.
Precision
Overall precision of the laboratory data was good, based on analysis of duplicate quality control
(QC) samples. For metals, the relative percent difference (RPD, the difference divided by the
mean) never exceeded 5% for duplicates of spiked blanks and rarely exceeded 5% for matrix
spike duplicates. Only one matrix spike duplicate had a RPD higher than the QC control limit of
20% (Zn from Storm 4, RPD of 23%). Laboratory precision was also good for hardness analysis,
with RPDs ≤3% for both blank spike and matrix spike analyses.
Duplicate sample analysis, rather than duplicate QC sample analysis, was used to measure
laboratory precision of DOC and TSS. These results also indicated a high level of precision, with
mean RPDs of 1% and 5% for DOC and TSS, respectively. None of the results exceeded the
20% control limit.
Assessment of Sample Homogeneity and Field Contamination
Sample homogeneity and field contamination were assessed through analysis of field duplicates
and equipment blanks, respectively. Field duplicates were analyzed for total and dissolved
copper and zinc only; conventional parameters were not analyzed.
Sample Homogeneity
Field duplicate samples were collected from two sites for each storm event in order to assess
homogeneity of the samples. It should be noted that environmental variability cannot be assessed
from these field duplicates, because they are aliquots sampled from the same bulk composite
(contained in the buckets, barrels, and roof pools) rather than sampling repeated prior to
accumulation of a bulk composite.
Overall, it appears that samples were fairly homogenous, with a few exceptions. The mean RPD
for all field duplicates was 13%. However, differences for duplicates sampled from roof pools
were much higher (26% overall), likely due to solids that were resuspended when these pools
were agitated by stirring. RPDs for total metals at these locations averaged 43%, versus 9% for
dissolved metals. When samples from roof pools were removed from the field duplicate data set,
the mean RPD was 8%. It is noteworthy that differences in metals concentrations between
duplicate samples incorporate laboratory variability as well as sample homogeneity. Although
these sources of variability cannot be parsed, they all contribute to overall variability.
Field and Equipment Blanks
Field blanks were used to assess possible contamination during sampling, storage, and transport.
Generally, field blanks were obtained by transferring MEL-supplied distilled/deionized water
30 Ecology publication 19-03-008 — June 2019
into the sampling containers. Total copper was present in field blanks in four of seven samples,
with an average concentration of 0.22 µg/L. In general, total copper in blanks was present at
levels <1% of associated washoff samples, except at the O’Brien Building (OBRI) Storm 5
blank, which had total copper at approximately 7% of the washoff sample concentrations. Total
zinc was not detected in any of the field blanks.
Filter blank samples consisted of laboratory-supplied distilled/deionized water filtered through a
clean Nalgene 0.45-µm filter apparatus (the same type used to filter dissolved metals samples).
Most (five of seven) did not have detectable dissolved copper concentrations or had detections
below the reporting limit (0.1 µg/L). But for two samples, copper was detected at 0.14 µg/L and
0.4 µg/L. These are relatively high values compared to their associated washoff samples (0.19
µg/L and 1.36 µg/L, respectively). Dissolved zinc was regularly detected in filter blanks (six of
seven samples), at an average concentration (1.2 µg/L) slightly above the reporting limit (1.0
µg/L). Since zinc was not detected in any of the nonfiltered field blanks, this suggests that the
filter apparatus is a consistent low-level source of zinc contamination.
No method was adopted for blank-correcting or dismissing sample results based on field or filter
blanks. In general, metals contamination stemming from handling, storage, or filtering appeared
to contribute little to the concentrations found in washoff samples.
Equipment blanks were analyzed for the atmospheric deposition devices during each round of
sampling, except Storm 1. Laboratory-supplied distilled/deionized water was used to rinse the
decontaminated collection funnel and MPTFE liner and subsequently analyzed for total and
dissolved metals.
The atmospheric deposition equipment blanks contained substantial concentrations of both
copper and zinc. Copper and zinc in blanks averaged 3.8 µg/L and 6.6 µg/L, respectively. More
importantly, copper in blanks was 52% of the sample concentration on average, and zinc was
81% on average. The high concentrations of metals in atmospheric blank samples has significant
implications for interpretation of the atmospheric deposition results. They are discussed in more
detail in the Results section of this report.

Copper and Zinc in Urban Runoff: Phase 2 31
Results Complete results for each location can be found in Appendix C.
Evaluation of Sampling Success
Sampling success was good overall, but a number of limitations precluded obtaining all of the
samples as planned. The Quality Assurance Project Plan (QAPP) for this research (Bookter,
2017b) called for sampling of all materials during six separate storm events, but the late start to
sampling (mid-February), the labor demands in preparing for storms (two to three days, requiring
two to four staff), difficulty in anticipating qualifying storms, and other logistical problems (e.g.,
coordinating with building managers to obtain roof access) allowed for only five complete
sampling events before the dry summer season set in. Sampling was conducted during a sixth
storm event (Storm 2.5), but it was limited to siding materials.
In general, washoff was collected in sufficient quantity for laboratory analysis of all parameters
during all storms. Insufficient sample volume occurred during the following instances:
One ethylene propylene diene terpolymer (EPDM) sample was not collected, due to a
leak in the rooftop dam assembly.
One light standard and two chain-link fence samples were not collected, due to small
sample volumes. In other instances, sample volumes were too small to conduct analysis
for dissolved metals or conventional parameters.
Collecting sufficient volume for siding materials proved especially problematic. For the
different siding types, the sampling success was as follows:
o painted fiber cement (SFBR) = 56%
o metal less than 5 years old (SMT<5) = 78%
o metal greater than 10 years old (SMT>10) = 72%
o painted wood (SWD) = 17%
In a number of cases, sample volumes were sufficient only for total copper and zinc
analysis, and dissolved metals could not be analyzed. Only occasionally was volume
sufficient for analysis of conventional parameters. Low sample volumes were due to lack
of wind-driven rain and roof overhangs that prevented siding from being exposed to the
rain. The artificial rainwater washoff effort was conducted to augment the siding data and
is addressed separately from the storm washoff results.
Conventional Parameters
Tables 5 and 6 summarize conventional parameters measured in the field and at MEL. Median
concentrations of conventional parameters among material types were generally similar. Few
samples had outlier results. One exception is a sample from NEIL-RAAR (RAAR>10;
Appendices A, C), which had the lowest pH among all samples, and the highest conductivity,
turbidity, and DOC among samples from building components. Field observations noted that this
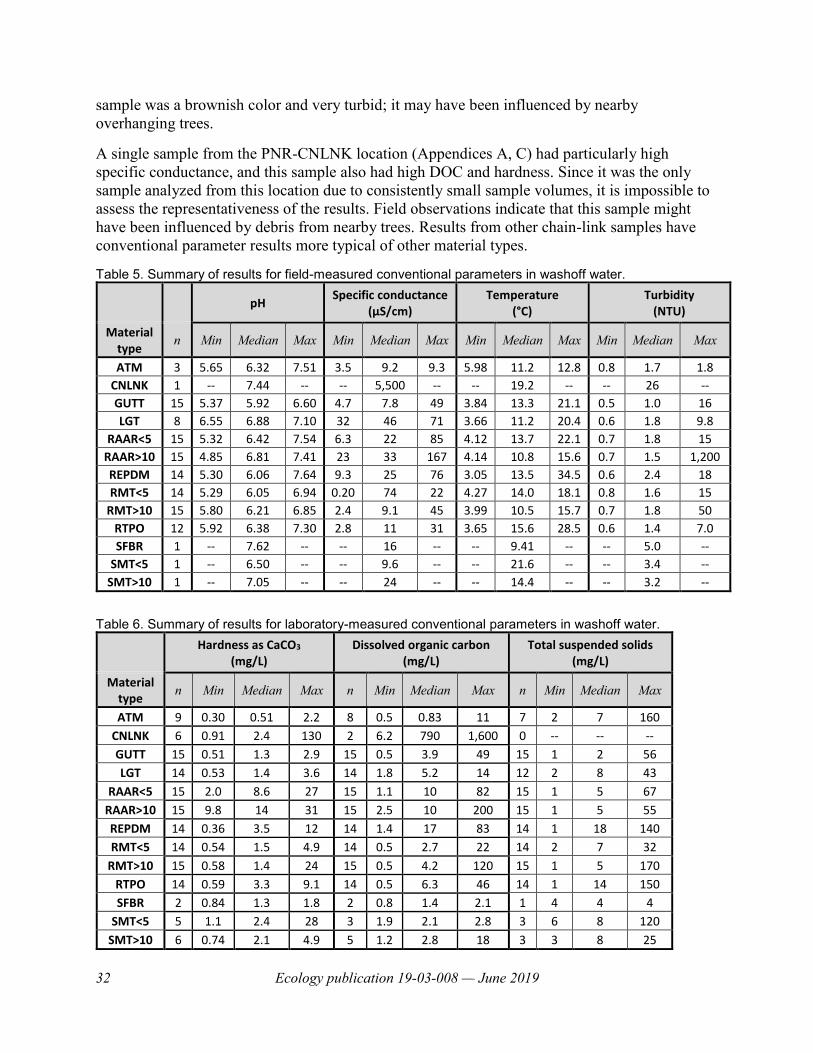
32 Ecology publication 19-03-008 — June 2019
sample was a brownish color and very turbid; it may have been influenced by nearby
overhanging trees.
A single sample from the PNR-CNLNK location (Appendices A, C) had particularly high
specific conductance, and this sample also had high DOC and hardness. Since it was the only
sample analyzed from this location due to consistently small sample volumes, it is impossible to
assess the representativeness of the results. Field observations indicate that this sample might
have been influenced by debris from nearby trees. Results from other chain-link samples have
conventional parameter results more typical of other material types.
Table 5. Summary of results for field-measured conventional parameters in washoff water.
pH Specific conductance
(µS/cm) Temperature
(°C) Turbidity
(NTU)
Material type
n Min Median Max Min Median Max Min Median Max Min Median Max
ATM 3 5.65 6.32 7.51 3.5 9.2 9.3 5.98 11.2 12.8 0.8 1.7 1.8 CNLNK 1 -- 7.44 -- -- 5,500 -- -- 19.2 -- -- 26 -- GUTT 15 5.37 5.92 6.60 4.7 7.8 49 3.84 13.3 21.1 0.5 1.0 16 LGT 8 6.55 6.88 7.10 32 46 71 3.66 11.2 20.4 0.6 1.8 9.8
RAAR<5 15 5.32 6.42 7.54 6.3 22 85 4.12 13.7 22.1 0.7 1.8 15 RAAR>10 15 4.85 6.81 7.41 23 33 167 4.14 10.8 15.6 0.7 1.5 1,200 REPDM 14 5.30 6.06 7.64 9.3 25 76 3.05 13.5 34.5 0.6 2.4 18 RMT<5 14 5.29 6.05 6.94 0.20 74 22 4.27 14.0 18.1 0.8 1.6 15
RMT>10 15 5.80 6.21 6.85 2.4 9.1 45 3.99 10.5 15.7 0.7 1.8 50 RTPO 12 5.92 6.38 7.30 2.8 11 31 3.65 15.6 28.5 0.6 1.4 7.0 SFBR 1 -- 7.62 -- -- 16 -- -- 9.41 -- -- 5.0 --
SMT<5 1 -- 6.50 -- -- 9.6 -- -- 21.6 -- -- 3.4 -- SMT>10 1 -- 7.05 -- -- 24 -- -- 14.4 -- -- 3.2 --
Table 6. Summary of results for laboratory-measured conventional parameters in washoff water.
Hardness as CaCO3 (mg/L)
Dissolved organic carbon (mg/L)
Total suspended solids (mg/L)
Material type
n Min Median Max n Min Median Max n Min Median Max
ATM 9 0.30 0.51 2.2 8 0.5 0.83 11 7 2 7 160
CNLNK 6 0.91 2.4 130 2 6.2 790 1,600 0 -- -- --
GUTT 15 0.51 1.3 2.9 15 0.5 3.9 49 15 1 2 56
LGT 14 0.53 1.4 3.6 14 1.8 5.2 14 12 2 8 43
RAAR<5 15 2.0 8.6 27 15 1.1 10 82 15 1 5 67
RAAR>10 15 9.8 14 31 15 2.5 10 200 15 1 5 55
REPDM 14 0.36 3.5 12 14 1.4 17 83 14 1 18 140
RMT<5 14 0.54 1.5 4.9 14 0.5 2.7 22 14 2 7 32
RMT>10 15 0.58 1.4 24 15 0.5 4.2 120 15 1 5 170
RTPO 14 0.59 3.3 9.1 14 0.5 6.3 46 14 1 14 150
SFBR 2 0.84 1.3 1.8 2 0.8 1.4 2.1 1 4 4 4
SMT<5 5 1.1 2.4 28 3 1.9 2.1 2.8 3 6 8 120
SMT>10 6 0.74 2.1 4.9 5 1.2 2.8 18 3 3 8 25
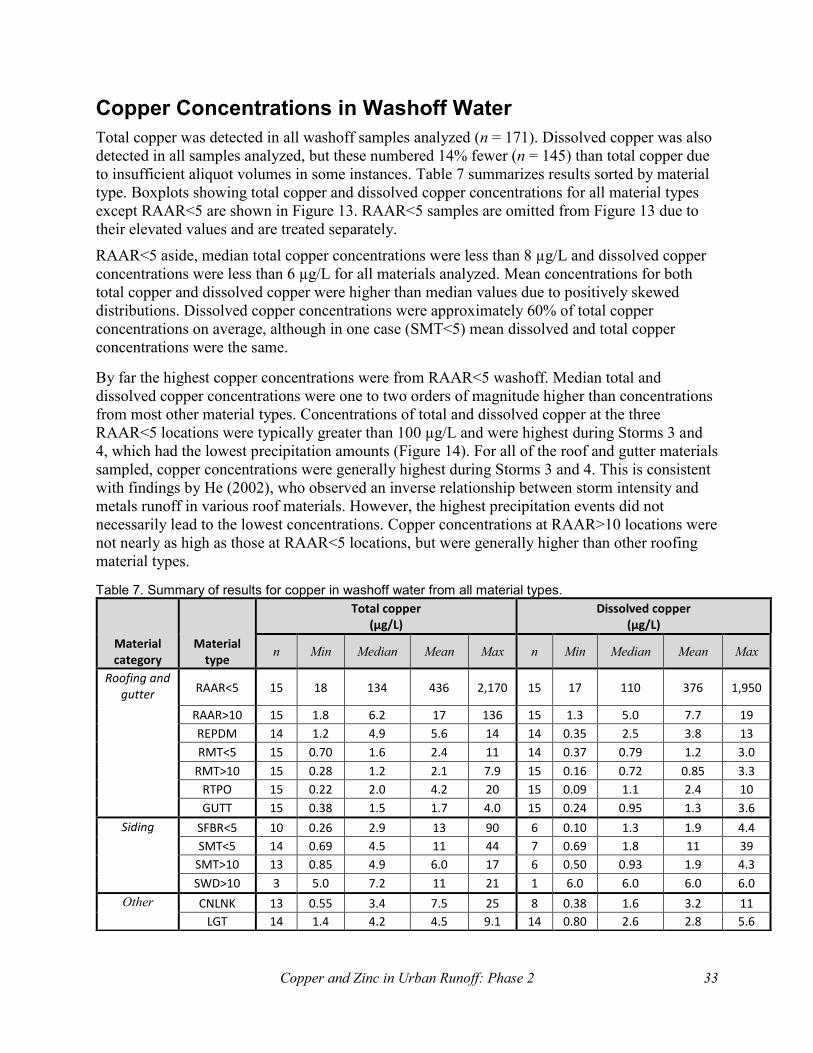
Copper and Zinc in Urban Runoff: Phase 2 33
Copper Concentrations in Washoff Water
Total copper was detected in all washoff samples analyzed (n = 171). Dissolved copper was also
detected in all samples analyzed, but these numbered 14% fewer (n = 145) than total copper due
to insufficient aliquot volumes in some instances. Table 7 summarizes results sorted by material
type. Boxplots showing total copper and dissolved copper concentrations for all material types
except RAAR<5 are shown in Figure 13. RAAR<5 samples are omitted from Figure 13 due to
their elevated values and are treated separately.
RAAR<5 aside, median total copper concentrations were less than 8 µg/L and dissolved copper
concentrations were less than 6 µg/L for all materials analyzed. Mean concentrations for both
total copper and dissolved copper were higher than median values due to positively skewed
distributions. Dissolved copper concentrations were approximately 60% of total copper
concentrations on average, although in one case (SMT<5) mean dissolved and total copper
concentrations were the same.
By far the highest copper concentrations were from RAAR<5 washoff. Median total and
dissolved copper concentrations were one to two orders of magnitude higher than concentrations
from most other material types. Concentrations of total and dissolved copper at the three
RAAR<5 locations were typically greater than 100 µg/L and were highest during Storms 3 and
4, which had the lowest precipitation amounts (Figure 14). For all of the roof and gutter materials
sampled, copper concentrations were generally highest during Storms 3 and 4. This is consistent
with findings by He (2002), who observed an inverse relationship between storm intensity and
metals runoff in various roof materials. However, the highest precipitation events did not
necessarily lead to the lowest concentrations. Copper concentrations at RAAR>10 locations were
not nearly as high as those at RAAR<5 locations, but were generally higher than other roofing
material types.
Table 7. Summary of results for copper in washoff water from all material types.
Total copper
(µg/L) Dissolved copper
(µg/L)
Material category
Material type
n Min Median Mean Max n Min Median Mean Max
Roofing and gutter RAAR<5 15 18 134 436 2,170 15 17 110 376 1,950
RAAR>10 15 1.8 6.2 17 136 15 1.3 5.0 7.7 19
REPDM 14 1.2 4.9 5.6 14 14 0.35 2.5 3.8 13
RMT<5 15 0.70 1.6 2.4 11 14 0.37 0.79 1.2 3.0
RMT>10 15 0.28 1.2 2.1 7.9 15 0.16 0.72 0.85 3.3
RTPO 15 0.22 2.0 4.2 20 15 0.09 1.1 2.4 10
GUTT 15 0.38 1.5 1.7 4.0 15 0.24 0.95 1.3 3.6
Siding SFBR<5 10 0.26 2.9 13 90 6 0.10 1.3 1.9 4.4
SMT<5 14 0.69 4.5 11 44 7 0.69 1.8 11 39
SMT>10 13 0.85 4.9 6.0 17 6 0.50 0.93 1.9 4.3
SWD>10 3 5.0 7.2 11 21 1 6.0 6.0 6.0 6.0
Other CNLNK 13 0.55 3.4 7.5 25 8 0.38 1.6 3.2 11
LGT 14 1.4 4.2 4.5 9.1 14 0.80 2.6 2.8 5.6
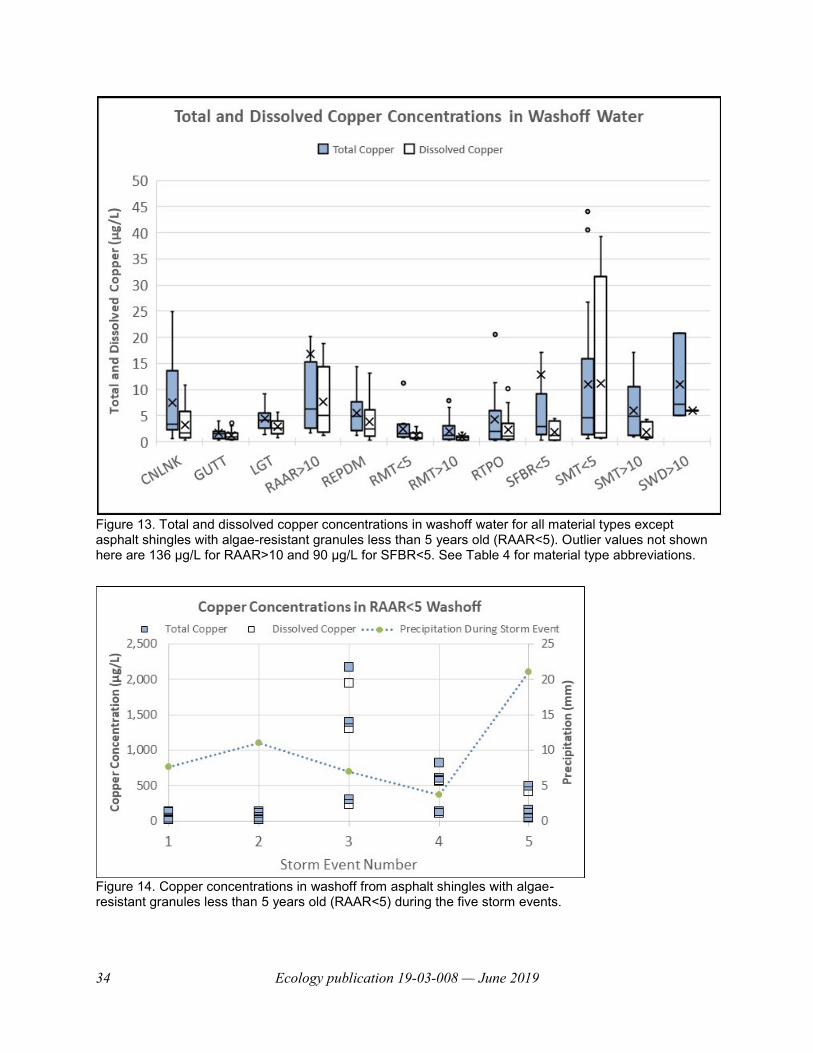
34 Ecology publication 19-03-008 — June 2019
Figure 13. Total and dissolved copper concentrations in washoff water for all material types except asphalt shingles with algae-resistant granules less than 5 years old (RAAR<5). Outlier values not shown here are 136 µg/L for RAAR>10 and 90 µg/L for SFBR<5. See Table 4 for material type abbreviations.
Figure 14. Copper concentrations in washoff from asphalt shingles with algae-resistant granules less than 5 years old (RAAR<5) during the five storm events.
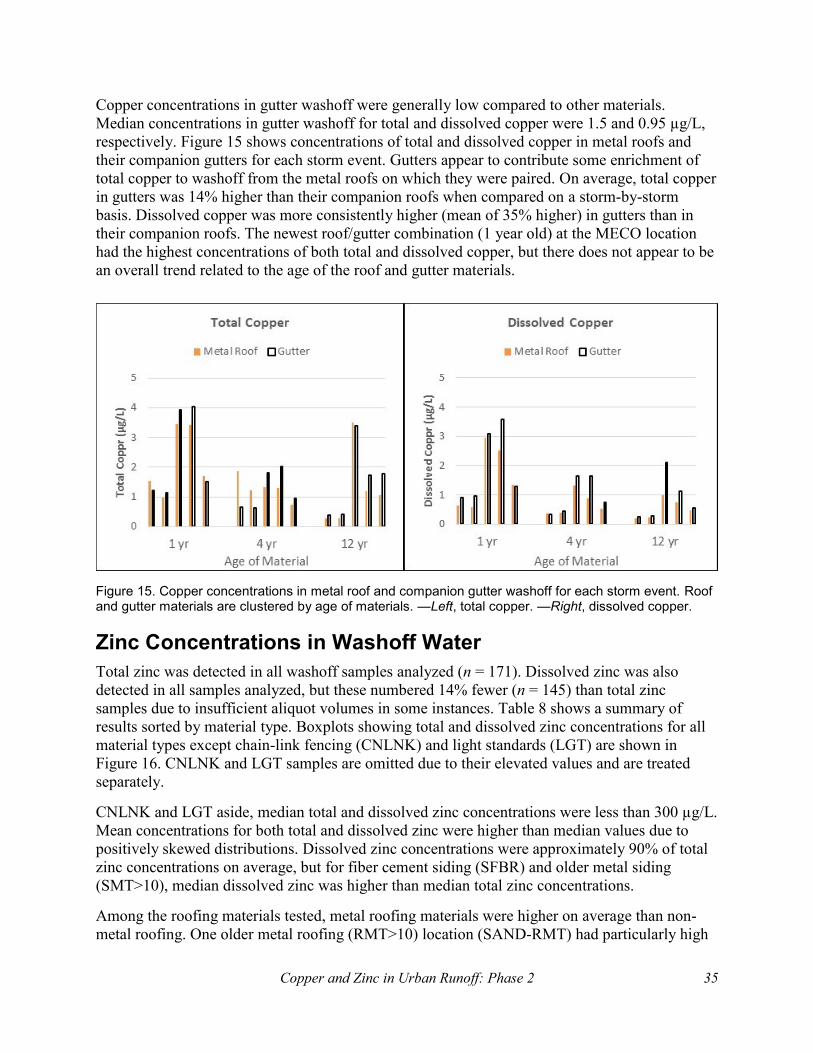
Copper and Zinc in Urban Runoff: Phase 2 35
Copper concentrations in gutter washoff were generally low compared to other materials.
Median concentrations in gutter washoff for total and dissolved copper were 1.5 and 0.95 µg/L,
respectively. Figure 15 shows concentrations of total and dissolved copper in metal roofs and
their companion gutters for each storm event. Gutters appear to contribute some enrichment of
total copper to washoff from the metal roofs on which they were paired. On average, total copper
in gutters was 14% higher than their companion roofs when compared on a storm-by-storm
basis. Dissolved copper was more consistently higher (mean of 35% higher) in gutters than in
their companion roofs. The newest roof/gutter combination (1 year old) at the MECO location
had the highest concentrations of both total and dissolved copper, but there does not appear to be
an overall trend related to the age of the roof and gutter materials.
Figure 15. Copper concentrations in metal roof and companion gutter washoff for each storm event. Roof and gutter materials are clustered by age of materials. —Left, total copper. —Right, dissolved copper.
Zinc Concentrations in Washoff Water
Total zinc was detected in all washoff samples analyzed (n = 171). Dissolved zinc was also
detected in all samples analyzed, but these numbered 14% fewer (n = 145) than total zinc
samples due to insufficient aliquot volumes in some instances. Table 8 shows a summary of
results sorted by material type. Boxplots showing total and dissolved zinc concentrations for all
material types except chain-link fencing (CNLNK) and light standards (LGT) are shown in
Figure 16. CNLNK and LGT samples are omitted due to their elevated values and are treated
separately.
CNLNK and LGT aside, median total and dissolved zinc concentrations were less than 300 µg/L.
Mean concentrations for both total and dissolved zinc were higher than median values due to
positively skewed distributions. Dissolved zinc concentrations were approximately 90% of total
zinc concentrations on average, but for fiber cement siding (SFBR) and older metal siding
(SMT>10), median dissolved zinc was higher than median total zinc concentrations.
Among the roofing materials tested, metal roofing materials were higher on average than non-
metal roofing. One older metal roofing (RMT>10) location (SAND-RMT) had particularly high
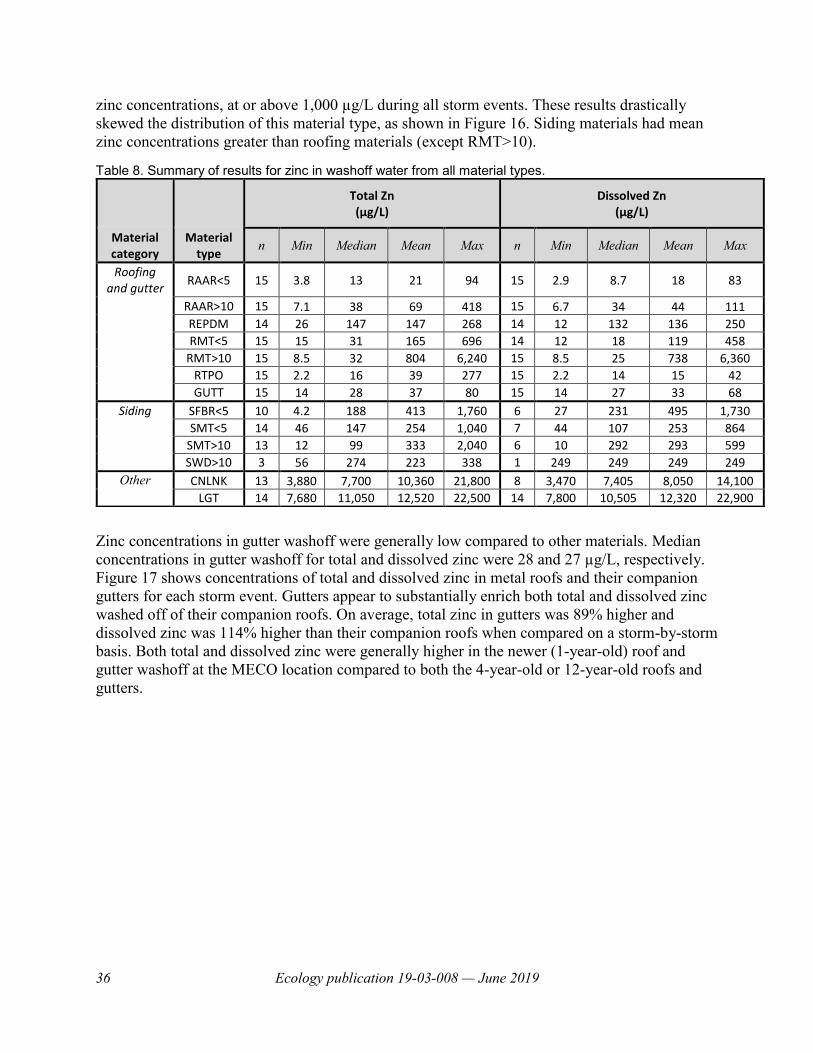
36 Ecology publication 19-03-008 — June 2019
zinc concentrations, at or above 1,000 µg/L during all storm events. These results drastically
skewed the distribution of this material type, as shown in Figure 16. Siding materials had mean
zinc concentrations greater than roofing materials (except RMT>10).
Table 8. Summary of results for zinc in washoff water from all material types.
Zinc concentrations in gutter washoff were generally low compared to other materials. Median
concentrations in gutter washoff for total and dissolved zinc were 28 and 27 µg/L, respectively.
Figure 17 shows concentrations of total and dissolved zinc in metal roofs and their companion
gutters for each storm event. Gutters appear to substantially enrich both total and dissolved zinc
washed off of their companion roofs. On average, total zinc in gutters was 89% higher and
dissolved zinc was 114% higher than their companion roofs when compared on a storm-by-storm
basis. Both total and dissolved zinc were generally higher in the newer (1-year-old) roof and
gutter washoff at the MECO location compared to both the 4-year-old or 12-year-old roofs and
gutters.
Total Zn (µg/L)
Dissolved Zn (µg/L)
Material category
Material type
n Min Median Mean Max n Min Median Mean Max
Roofing and gutter
RAAR<5 15 3.8 13 21 94 15 2.9 8.7 18 83
RAAR>10 15 7.1 38 69 418 15 6.7 34 44 111
REPDM 14 26 147 147 268 14 12 132 136 250
RMT<5 15 15 31 165 696 14 12 18 119 458
RMT>10 15 8.5 32 804 6,240 15 8.5 25 738 6,360
RTPO 15 2.2 16 39 277 15 2.2 14 15 42
GUTT 15 14 28 37 80 15 14 27 33 68
Siding SFBR<5 10 4.2 188 413 1,760 6 27 231 495 1,730
SMT<5 14 46 147 254 1,040 7 44 107 253 864
SMT>10 13 12 99 333 2,040 6 10 292 293 599
SWD>10 3 56 274 223 338 1 249 249 249 249
Other CNLNK 13 3,880 7,700 10,360 21,800 8 3,470 7,405 8,050 14,100
LGT 14 7,680 11,050 12,520 22,500 14 7,800 10,505 12,320 22,900
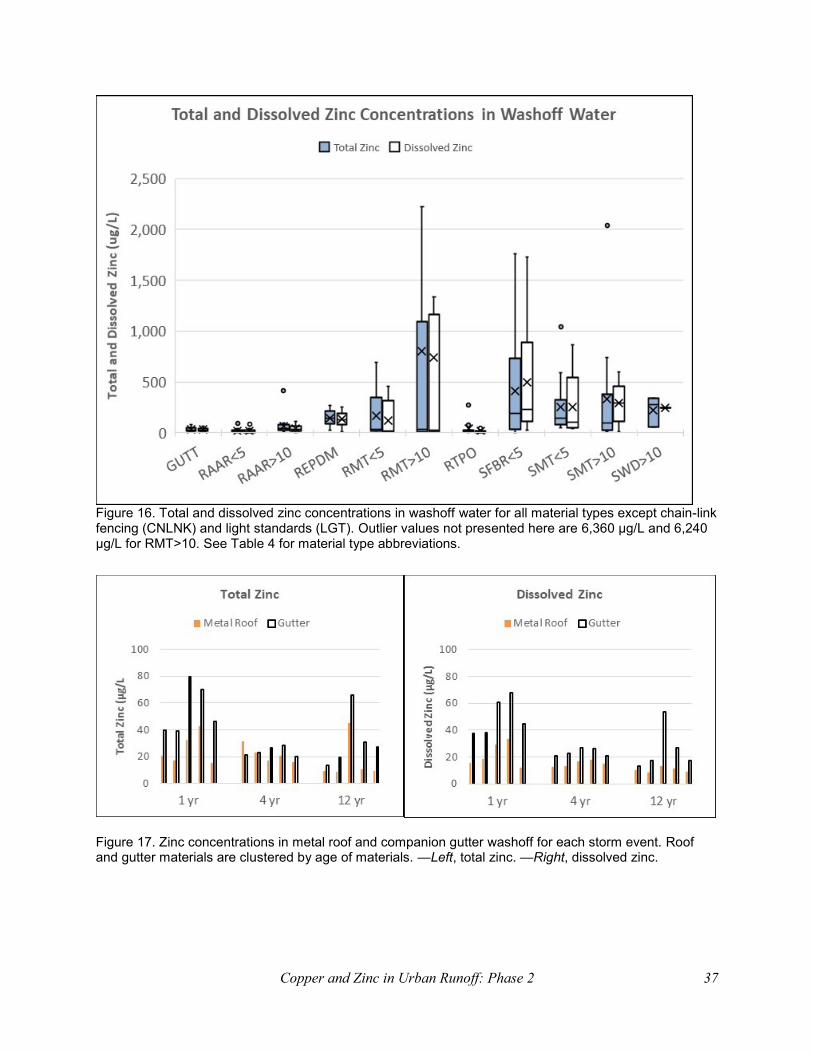
Copper and Zinc in Urban Runoff: Phase 2 37
Figure 16. Total and dissolved zinc concentrations in washoff water for all material types except chain-link fencing (CNLNK) and light standards (LGT). Outlier values not presented here are 6,360 µg/L and 6,240 µg/L for RMT>10. See Table 4 for material type abbreviations.
Figure 17. Zinc concentrations in metal roof and companion gutter washoff for each storm event. Roof and gutter materials are clustered by age of materials. —Left, total zinc. —Right, dissolved zinc.
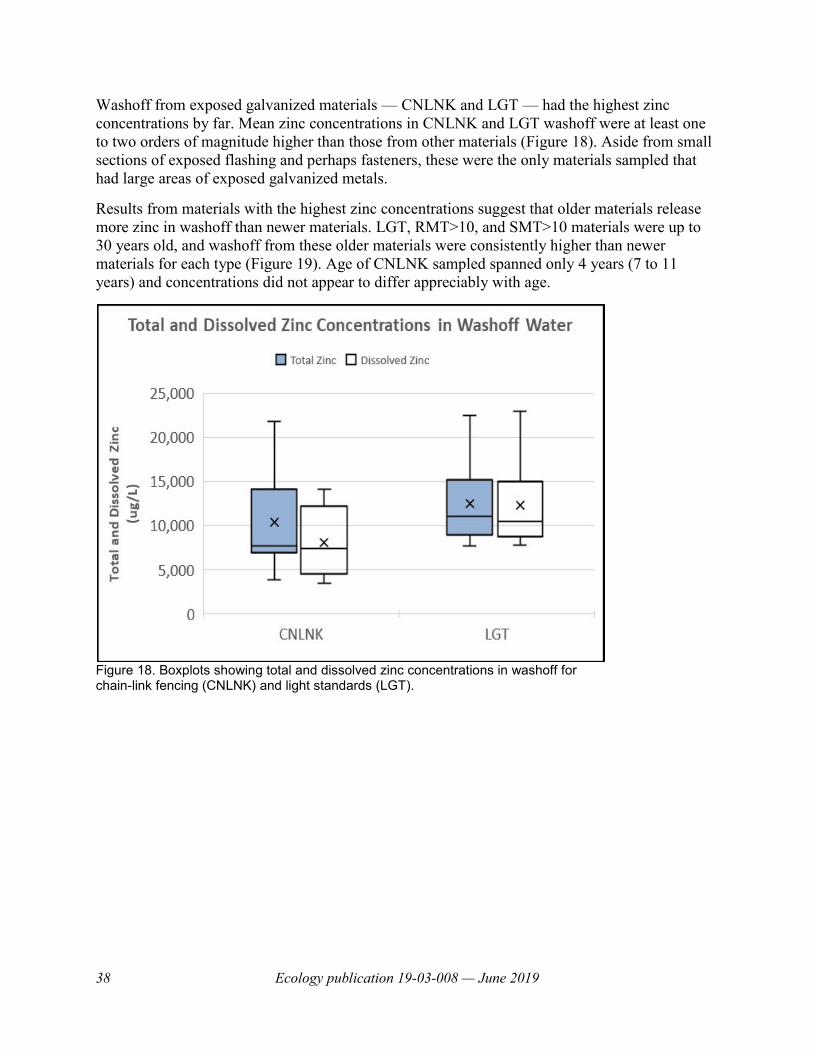
38 Ecology publication 19-03-008 — June 2019
Washoff from exposed galvanized materials — CNLNK and LGT — had the highest zinc
concentrations by far. Mean zinc concentrations in CNLNK and LGT washoff were at least one
to two orders of magnitude higher than those from other materials (Figure 18). Aside from small
sections of exposed flashing and perhaps fasteners, these were the only materials sampled that
had large areas of exposed galvanized metals.
Results from materials with the highest zinc concentrations suggest that older materials release
more zinc in washoff than newer materials. LGT, RMT>10, and SMT>10 materials were up to
30 years old, and washoff from these older materials were consistently higher than newer
materials for each type (Figure 19). Age of CNLNK sampled spanned only 4 years (7 to 11
years) and concentrations did not appear to differ appreciably with age.
Figure 18. Boxplots showing total and dissolved zinc concentrations in washoff for chain-link fencing (CNLNK) and light standards (LGT).
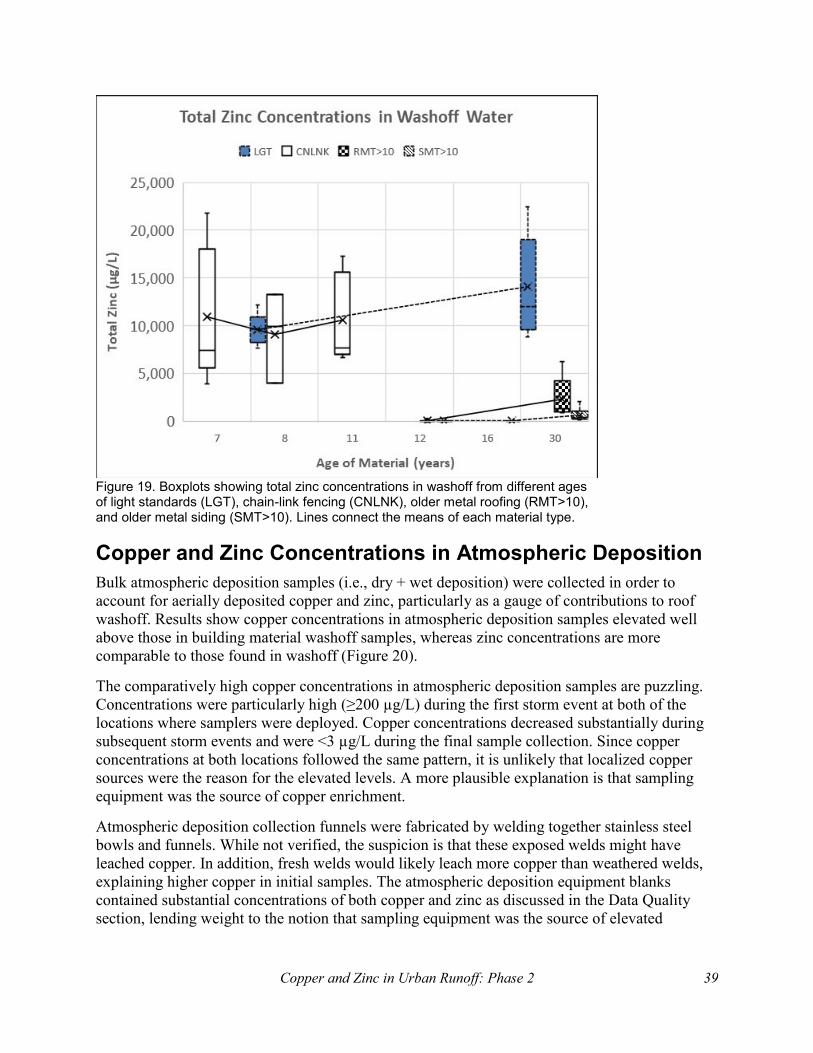
Copper and Zinc in Urban Runoff: Phase 2 39
Figure 19. Boxplots showing total zinc concentrations in washoff from different ages of light standards (LGT), chain-link fencing (CNLNK), older metal roofing (RMT>10), and older metal siding (SMT>10). Lines connect the means of each material type.
Copper and Zinc Concentrations in Atmospheric Deposition
Bulk atmospheric deposition samples (i.e., dry + wet deposition) were collected in order to
account for aerially deposited copper and zinc, particularly as a gauge of contributions to roof
washoff. Results show copper concentrations in atmospheric deposition samples elevated well
above those in building material washoff samples, whereas zinc concentrations are more
comparable to those found in washoff (Figure 20).
The comparatively high copper concentrations in atmospheric deposition samples are puzzling.
Concentrations were particularly high (≥200 µg/L) during the first storm event at both of the
locations where samplers were deployed. Copper concentrations decreased substantially during
subsequent storm events and were <3 µg/L during the final sample collection. Since copper
concentrations at both locations followed the same pattern, it is unlikely that localized copper
sources were the reason for the elevated levels. A more plausible explanation is that sampling
equipment was the source of copper enrichment.
Atmospheric deposition collection funnels were fabricated by welding together stainless steel
bowls and funnels. While not verified, the suspicion is that these exposed welds might have
leached copper. In addition, fresh welds would likely leach more copper than weathered welds,
explaining higher copper in initial samples. The atmospheric deposition equipment blanks
contained substantial concentrations of both copper and zinc as discussed in the Data Quality
section, lending weight to the notion that sampling equipment was the source of elevated
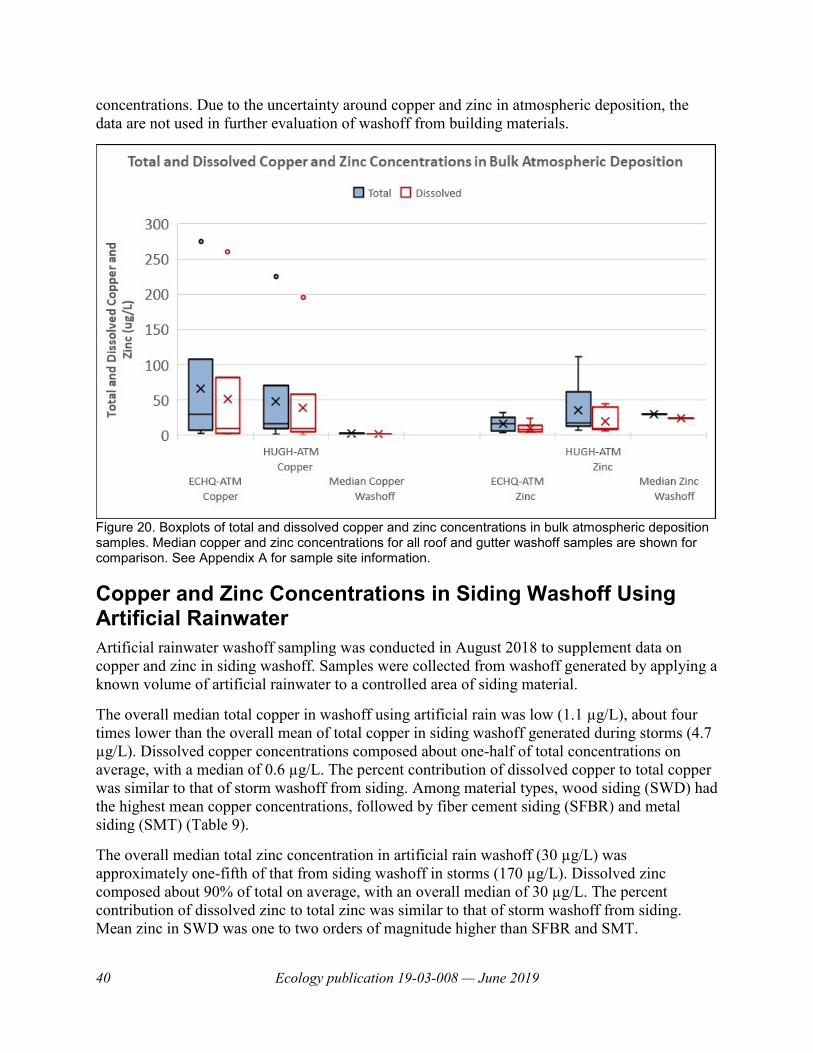
40 Ecology publication 19-03-008 — June 2019
concentrations. Due to the uncertainty around copper and zinc in atmospheric deposition, the
data are not used in further evaluation of washoff from building materials.
Figure 20. Boxplots of total and dissolved copper and zinc concentrations in bulk atmospheric deposition samples. Median copper and zinc concentrations for all roof and gutter washoff samples are shown for comparison. See Appendix A for sample site information.
Copper and Zinc Concentrations in Siding Washoff Using Artificial Rainwater
Artificial rainwater washoff sampling was conducted in August 2018 to supplement data on
copper and zinc in siding washoff. Samples were collected from washoff generated by applying a
known volume of artificial rainwater to a controlled area of siding material.
The overall median total copper in washoff using artificial rain was low (1.1 µg/L), about four
times lower than the overall mean of total copper in siding washoff generated during storms (4.7
µg/L). Dissolved copper concentrations composed about one-half of total concentrations on
average, with a median of 0.6 µg/L. The percent contribution of dissolved copper to total copper
was similar to that of storm washoff from siding. Among material types, wood siding (SWD) had
the highest mean copper concentrations, followed by fiber cement siding (SFBR) and metal
siding (SMT) (Table 9).
The overall median total zinc concentration in artificial rain washoff (30 µg/L) was
approximately one-fifth of that from siding washoff in storms (170 µg/L). Dissolved zinc
composed about 90% of total on average, with an overall median of 30 µg/L. The percent
contribution of dissolved zinc to total zinc was similar to that of storm washoff from siding.
Mean zinc in SWD was one to two orders of magnitude higher than SFBR and SMT.
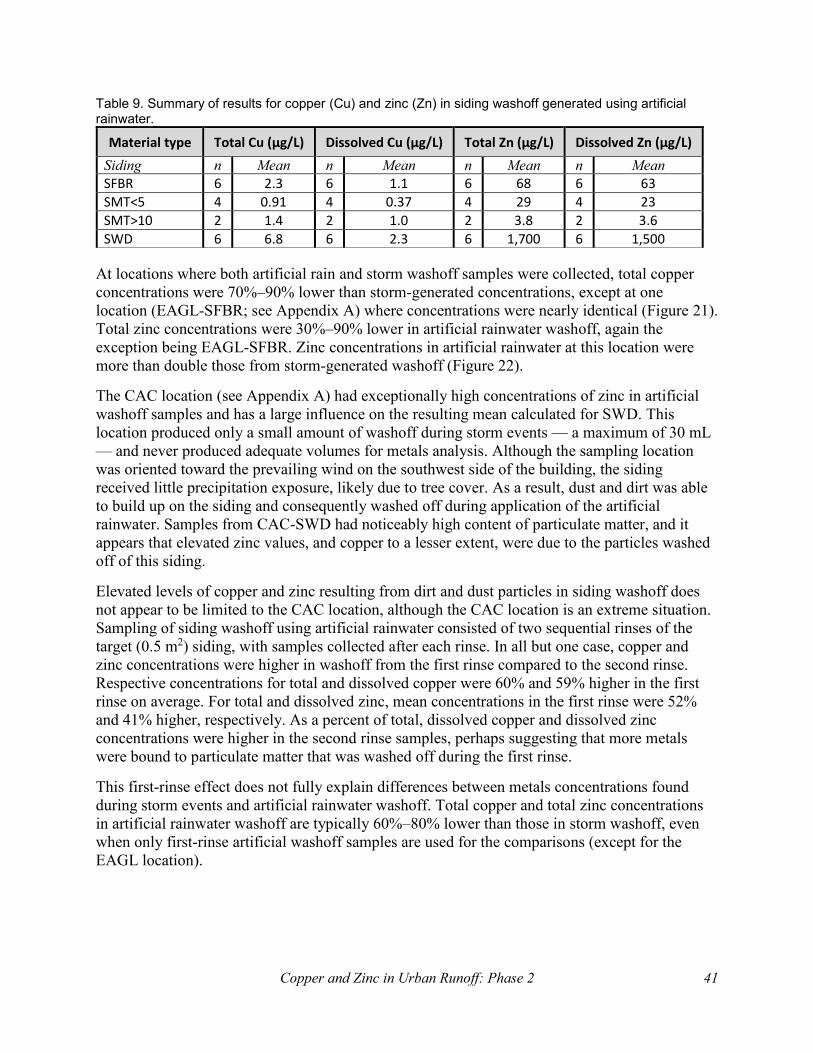
Copper and Zinc in Urban Runoff: Phase 2 41
Table 9. Summary of results for copper (Cu) and zinc (Zn) in siding washoff generated using artificial rainwater.
At locations where both artificial rain and storm washoff samples were collected, total copper
concentrations were 70%–90% lower than storm-generated concentrations, except at one
location (EAGL-SFBR; see Appendix A) where concentrations were nearly identical (Figure 21).
Total zinc concentrations were 30%–90% lower in artificial rainwater washoff, again the
exception being EAGL-SFBR. Zinc concentrations in artificial rainwater at this location were
more than double those from storm-generated washoff (Figure 22).
The CAC location (see Appendix A) had exceptionally high concentrations of zinc in artificial
washoff samples and has a large influence on the resulting mean calculated for SWD. This
location produced only a small amount of washoff during storm events — a maximum of 30 mL
— and never produced adequate volumes for metals analysis. Although the sampling location
was oriented toward the prevailing wind on the southwest side of the building, the siding
received little precipitation exposure, likely due to tree cover. As a result, dust and dirt was able
to build up on the siding and consequently washed off during application of the artificial
rainwater. Samples from CAC-SWD had noticeably high content of particulate matter, and it
appears that elevated zinc values, and copper to a lesser extent, were due to the particles washed
off of this siding.
Elevated levels of copper and zinc resulting from dirt and dust particles in siding washoff does
not appear to be limited to the CAC location, although the CAC location is an extreme situation.
Sampling of siding washoff using artificial rainwater consisted of two sequential rinses of the
target (0.5 m2) siding, with samples collected after each rinse. In all but one case, copper and
zinc concentrations were higher in washoff from the first rinse compared to the second rinse.
Respective concentrations for total and dissolved copper were 60% and 59% higher in the first
rinse on average. For total and dissolved zinc, mean concentrations in the first rinse were 52%
and 41% higher, respectively. As a percent of total, dissolved copper and dissolved zinc
concentrations were higher in the second rinse samples, perhaps suggesting that more metals
were bound to particulate matter that was washed off during the first rinse.
This first-rinse effect does not fully explain differences between metals concentrations found
during storm events and artificial rainwater washoff. Total copper and total zinc concentrations
in artificial rainwater washoff are typically 60%–80% lower than those in storm washoff, even
when only first-rinse artificial washoff samples are used for the comparisons (except for the
EAGL location).
Material type Total Cu (µg/L) Dissolved Cu (µg/L) Total Zn (µg/L) Dissolved Zn (µg/L)
Siding n Mean n Mean n Mean n Mean
SFBR 6 2.3 6 1.1 6 68 6 63
SMT<5 4 0.91 4 0.37 4 29 4 23
SMT>10 2 1.4 2 1.0 2 3.8 2 3.6
SWD 6 6.8 6 2.3 6 1,700 6 1,500
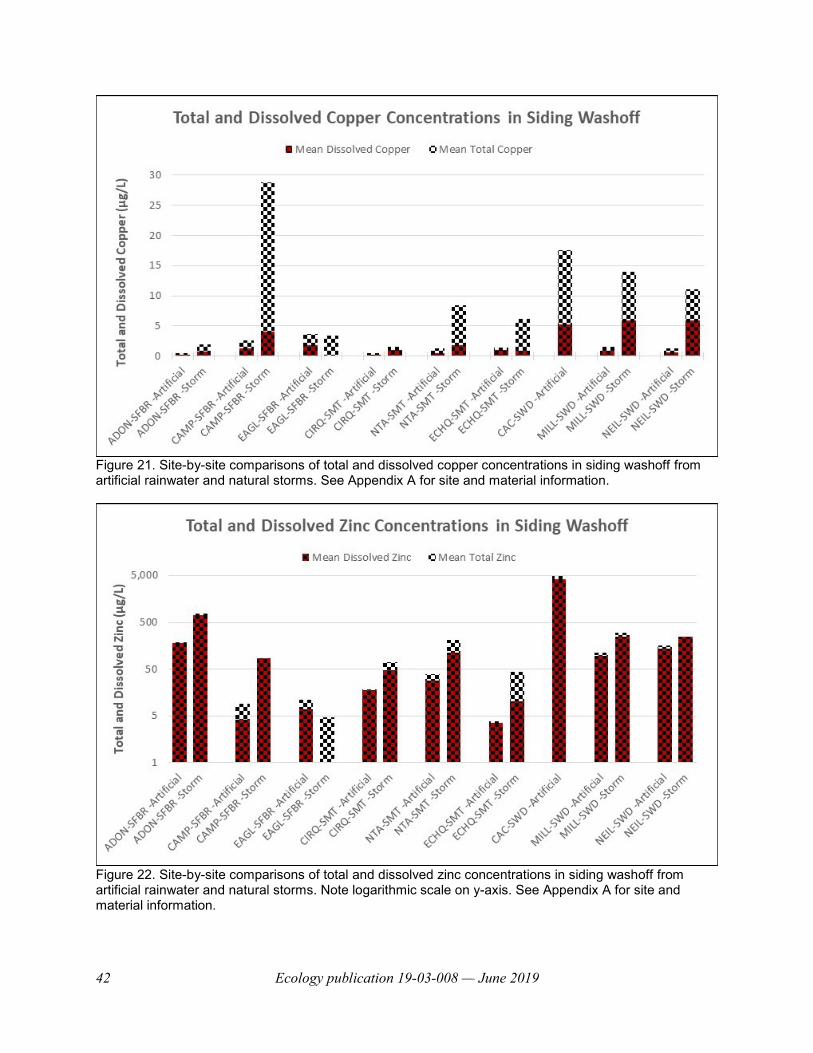
42 Ecology publication 19-03-008 — June 2019
Figure 21. Site-by-site comparisons of total and dissolved copper concentrations in siding washoff from artificial rainwater and natural storms. See Appendix A for site and material information.
Figure 22. Site-by-site comparisons of total and dissolved zinc concentrations in siding washoff from artificial rainwater and natural storms. Note logarithmic scale on y-axis. See Appendix A for site and material information.

Copper and Zinc in Urban Runoff: Phase 2 43
Discussion
Copper and Zinc in Roof Washoff and Effects of Atmospheric Deposition
Estimating large-scale copper and zinc releases from roofing materials is complex, due to a
variety of factors. Chief among them are the variety of roof materials to consider and the need to
account for atmospheric deposition. The latter includes copper and zinc contained in rainwater,
which affects concentrations in washoff from all materials. However, particulate matter from dry
atmospheric deposition, and copper and zinc bound to these particles, has a greater tendency to
accumulate on the horizontal or near horizontal surfaces that roofs provide. This accumulation is
likely to result in copper and zinc enrichment of roof washoff.
There are several ways to account for copper and zinc from atmospheric deposition. One
effective method is to capture washoff from a control panel. If control panels known to be free of
copper and zinc are installed near and at the same aspect and slope of the roofs of interest,
copper and zinc in the control washoff can simply be subtracted from the roof washoff to account
for aerial deposition. This was the approach used successfully in the Ecology Roofing Study,
where differences between control and test panels were not significant, suggesting little
contribution from atmospheric deposition.
Another approach is to simply collect and analyze bulk atmospheric deposition samples in the
general vicinity of the roofs being sampled. This approach was used in the present study (CuZn
Phase 2) because it did not require installation of a companion control panel on each roof
sampled. While more practical, this approach does not allow for teasing out local variations in
aerially deposited copper and zinc from suspension of exposed soil, road wear, and local
emissions. In the end, however, it appears that elevated copper and zinc in the atmospheric
deposition samples analyzed here originated from equipment contamination rather than local
sources.
Comparisons with Previous Atmospheric Deposition Studies
Atmospheric deposition sampling for chemicals, including copper and zinc, has been conducted
in the Puget Sound area during the past decade. Brandenberger et al. (2010) conducted a year-
long monitoring effort to estimate loadings to Puget Sound as part of the Puget Sound Toxics
Loading Assessment (PSTLA). One station at the undeveloped Nisqually Reach Nature Center is
within 8.5 km (5.25 mi.) of both atmospheric deposition stations for CuZn Phase 2 and provides
a gauge of the local background levels. Median bulk atmospheric deposition fluxes for copper
and zinc at this station were calculated to be 0.66 and 3.2 mg/m2/yr, respectively (Figures 23 and
24). By comparison, CuZn Phase 2 overall median total copper and total zinc fluxes are 20.9 and
17.7 mg/m2/yr, respectively.
Since the atmospheric deposition stations for CuZn Phase 2 were located in commercial areas
within 1 km from Interstate 5, some deposition from local sources might be expected.
Brandenberger et al. (2010) found the highest flux of copper (4.4 mg/m2/yr) and zinc (18
mg/m2/yr) in Tacoma near Interstate 5, and a recent study of bulk atmospheric fluxes in the
Duwamish River basin found that in urban residential, commercial, and industrial areas, fluxes of
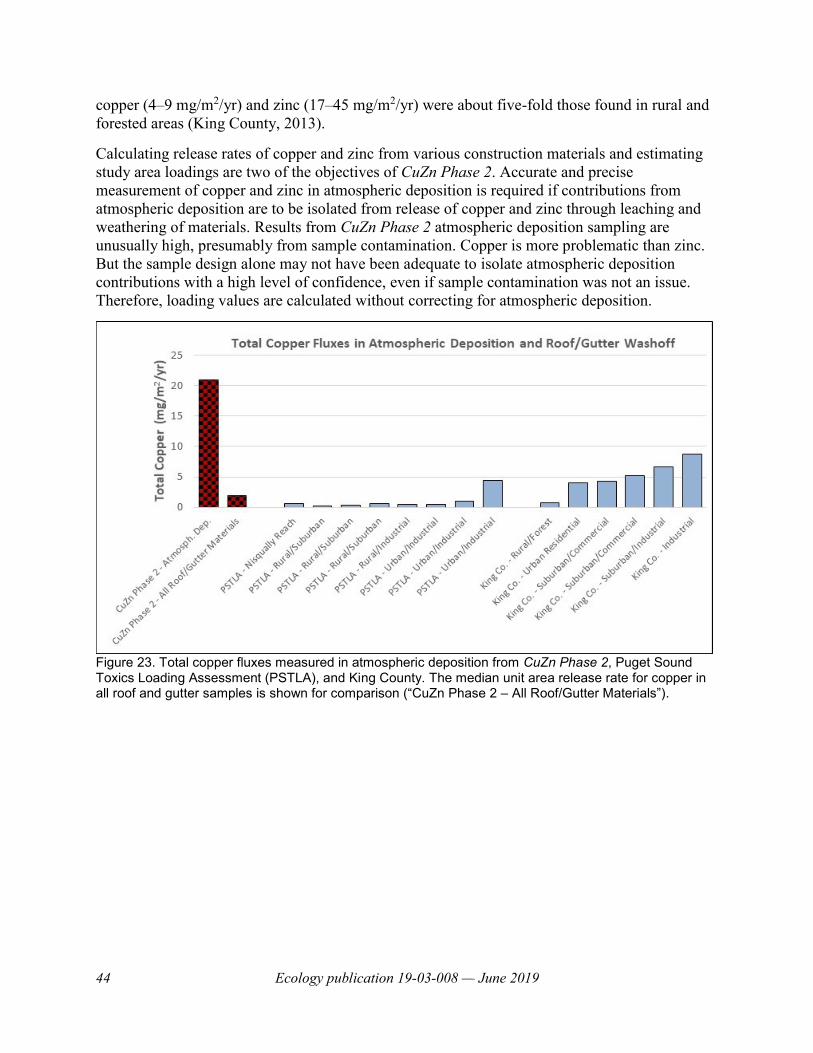
44 Ecology publication 19-03-008 — June 2019
copper (4–9 mg/m2/yr) and zinc (17–45 mg/m2/yr) were about five-fold those found in rural and
forested areas (King County, 2013).
Calculating release rates of copper and zinc from various construction materials and estimating
study area loadings are two of the objectives of CuZn Phase 2. Accurate and precise
measurement of copper and zinc in atmospheric deposition is required if contributions from
atmospheric deposition are to be isolated from release of copper and zinc through leaching and
weathering of materials. Results from CuZn Phase 2 atmospheric deposition sampling are
unusually high, presumably from sample contamination. Copper is more problematic than zinc.
But the sample design alone may not have been adequate to isolate atmospheric deposition
contributions with a high level of confidence, even if sample contamination was not an issue.
Therefore, loading values are calculated without correcting for atmospheric deposition.
Figure 23. Total copper fluxes measured in atmospheric deposition from CuZn Phase 2, Puget Sound Toxics Loading Assessment (PSTLA), and King County. The median unit area release rate for copper in all roof and gutter samples is shown for comparison (“CuZn Phase 2 – All Roof/Gutter Materials”).
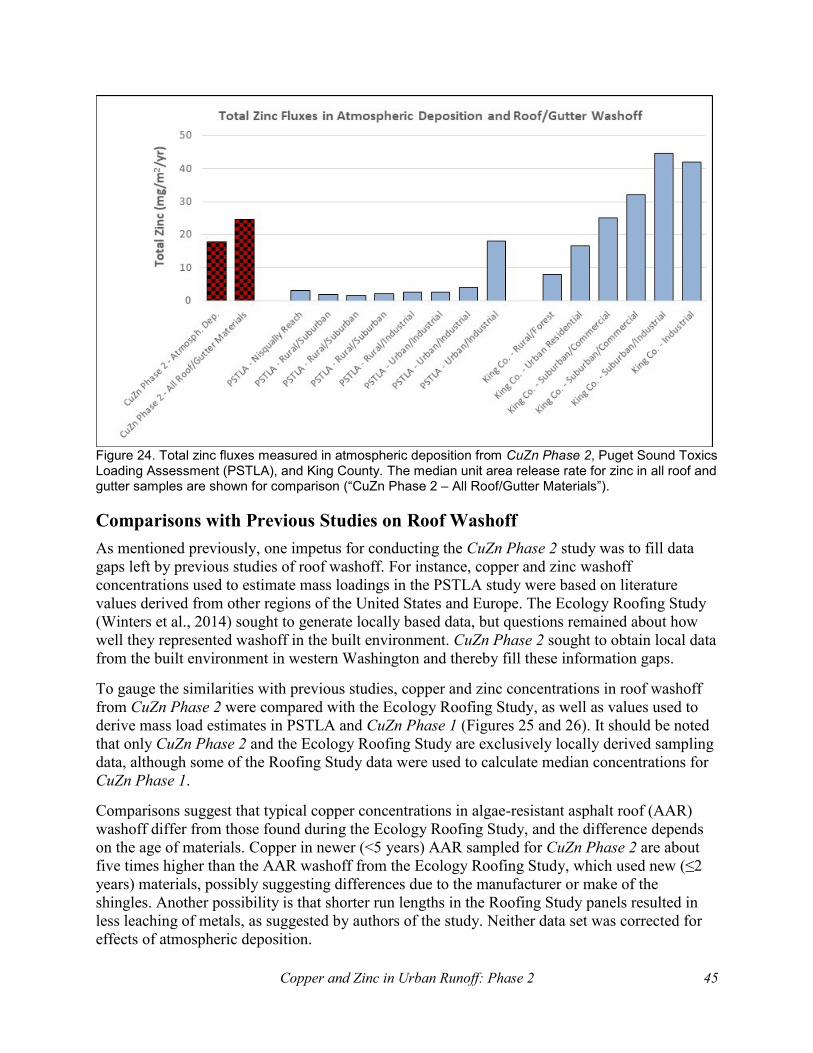
Copper and Zinc in Urban Runoff: Phase 2 45
Figure 24. Total zinc fluxes measured in atmospheric deposition from CuZn Phase 2, Puget Sound Toxics Loading Assessment (PSTLA), and King County. The median unit area release rate for zinc in all roof and gutter samples are shown for comparison (“CuZn Phase 2 – All Roof/Gutter Materials”).
Comparisons with Previous Studies on Roof Washoff
As mentioned previously, one impetus for conducting the CuZn Phase 2 study was to fill data
gaps left by previous studies of roof washoff. For instance, copper and zinc washoff
concentrations used to estimate mass loadings in the PSTLA study were based on literature
values derived from other regions of the United States and Europe. The Ecology Roofing Study
(Winters et al., 2014) sought to generate locally based data, but questions remained about how
well they represented washoff in the built environment. CuZn Phase 2 sought to obtain local data
from the built environment in western Washington and thereby fill these information gaps.
To gauge the similarities with previous studies, copper and zinc concentrations in roof washoff
from CuZn Phase 2 were compared with the Ecology Roofing Study, as well as values used to
derive mass load estimates in PSTLA and CuZn Phase 1 (Figures 25 and 26). It should be noted
that only CuZn Phase 2 and the Ecology Roofing Study are exclusively locally derived sampling
data, although some of the Roofing Study data were used to calculate median concentrations for
CuZn Phase 1.
Comparisons suggest that typical copper concentrations in algae-resistant asphalt roof (AAR)
washoff differ from those found during the Ecology Roofing Study, and the difference depends
on the age of materials. Copper in newer (<5 years) AAR sampled for CuZn Phase 2 are about
five times higher than the AAR washoff from the Ecology Roofing Study, which used new (≤2
years) materials, possibly suggesting differences due to the manufacturer or make of the
shingles. Another possibility is that shorter run lengths in the Roofing Study panels resulted in
less leaching of metals, as suggested by authors of the study. Neither data set was corrected for
effects of atmospheric deposition.

46 Ecology publication 19-03-008 — June 2019
Unfortified asphalt shingle data are also provided for comparison in Figures 25 and 26.
Concentrations used to calculate median copper loads for CuZn Phase 1 and PSTLA are similar
in magnitude to CuZn Phase 2 AAR>10, as well as the Roofing Study (unfortified asphalt
shingle was not analyzed in CuZn Phase 2). It might be reasonably assumed that algae-resistant
roofs greater than 10 years old resemble unfortified asphalt shingle roofs. This suggests that the
copper concentrations used to estimate mass loads from asphalt shingle roofs in CuZn Phase 1
and PSTLA are reasonable estimates.
For metal (MT) and polymer (EDPM and TPO) roofs, copper concentrations for CuZn Phase 2
were two to ten times higher than the Ecology Roofing Study. Contact time may have played a
role for polymer roofs, because samples were ponded anywhere from several hours to several
days during CuZn Phase 2, whereas rainwater was allowed to run off the experimental panels
relatively quickly in the Roofing Study. In all cases, copper concentrations were low.
The PSTLA copper concentration used to calculate the mean release load for metal roofs was
two to three orders of magnitude higher than either CuZn Phase 2 or the Roofing Study.
Implications for this are significant, since metal roofs account for more than half of the PSTLA
average copper released from roofs. This suggests that PSTLA might have overestimated
average copper releases from this material. The lower end of the concentration range used in
PSTLA is more in line with the ranges found in CuZn Phase 2 and the Roofing Study.
Median zinc concentrations in washoff from AAR and polymer roofing materials was about five-
fold higher in CuZn Phase 2 compared with the Roofing Study, although AAR<5 was only about
double the concentrations of the AAR from the Roofing Study. Again, contact time and run
length may have been factors in these differences, but it is also possible that washoff from CuZn
Phase 2 was in contact with flashing and other galvanized roof components, resulting in higher
zinc.
Painted metal roofs sampled for CuZn Phase 2 typically incorporated painted flashing and
fasteners, and therefore would not be expected to contribute excess zinc. This may explain why
median zinc concentrations in CuZn Phase 2 metal roofs were similar to those from the Roofing
Study. However, the range in zinc concentration from metal roofs sampled for CuZn Phase 2,
especially the older roofs, spanned three orders of magnitude. This suggests that zinc releases
from older painted metal roofs may vary substantially based on roof condition.
Perhaps the most important conclusion that can be drawn from these comparisons is that the
PSTLA study appears to have vastly overestimated mass zinc releases from roofing. This is
worth note because results of the PSTLA study were, to a large extent, the original motivation
for conducting the Ecology Roofing Study and the CuZn Phase 1 and Phase 2 studies.
The large estimates for zinc releases in PSTLA are due to the high zinc concentrations in
washoff used to derive these estimates. Typical zinc washoff concentrations were about two
orders of magnitude lower in asphalt and metal roofs sampled during CuZn Phase 2 compared to
PSTLA. Authors of the Roofing Study found similar results but were wary of concluding that
PSTLA overestimated zinc concentrations, because their sampling did not fully represent the
built environment. The conclusion that PSTLA likely used unrepresentative zinc concentrations
for asphalt composite and metal roofs is particularly important. These roof types were estimated
to contribute about 70% of the zinc releases from all roofs and about 60% of the total zinc
releases in the Puget Sound basin.
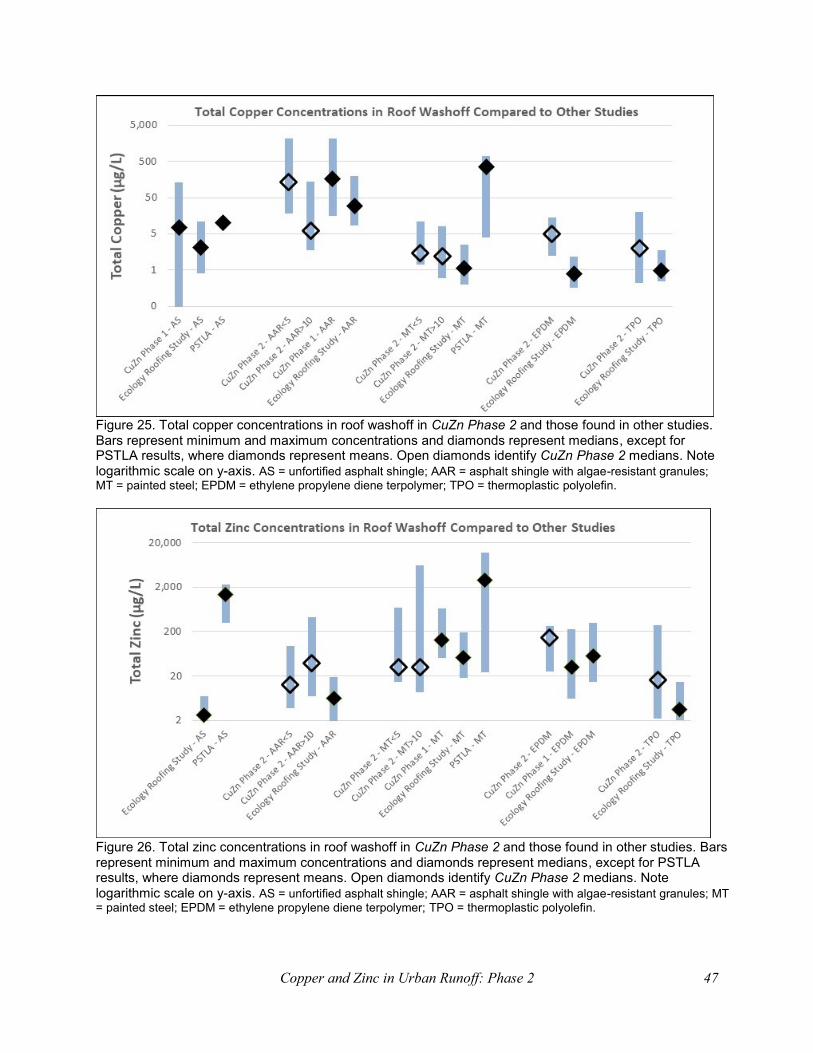
Copper and Zinc in Urban Runoff: Phase 2 47
Figure 25. Total copper concentrations in roof washoff in CuZn Phase 2 and those found in other studies. Bars represent minimum and maximum concentrations and diamonds represent medians, except for PSTLA results, where diamonds represent means. Open diamonds identify CuZn Phase 2 medians. Note logarithmic scale on y-axis. AS = unfortified asphalt shingle; AAR = asphalt shingle with algae-resistant granules;
MT = painted steel; EPDM = ethylene propylene diene terpolymer; TPO = thermoplastic polyolefin.
Figure 26. Total zinc concentrations in roof washoff in CuZn Phase 2 and those found in other studies. Bars represent minimum and maximum concentrations and diamonds represent medians, except for PSTLA results, where diamonds represent means. Open diamonds identify CuZn Phase 2 medians. Note logarithmic scale on y-axis. AS = unfortified asphalt shingle; AAR = asphalt shingle with algae-resistant granules; MT
= painted steel; EPDM = ethylene propylene diene terpolymer; TPO = thermoplastic polyolefin.
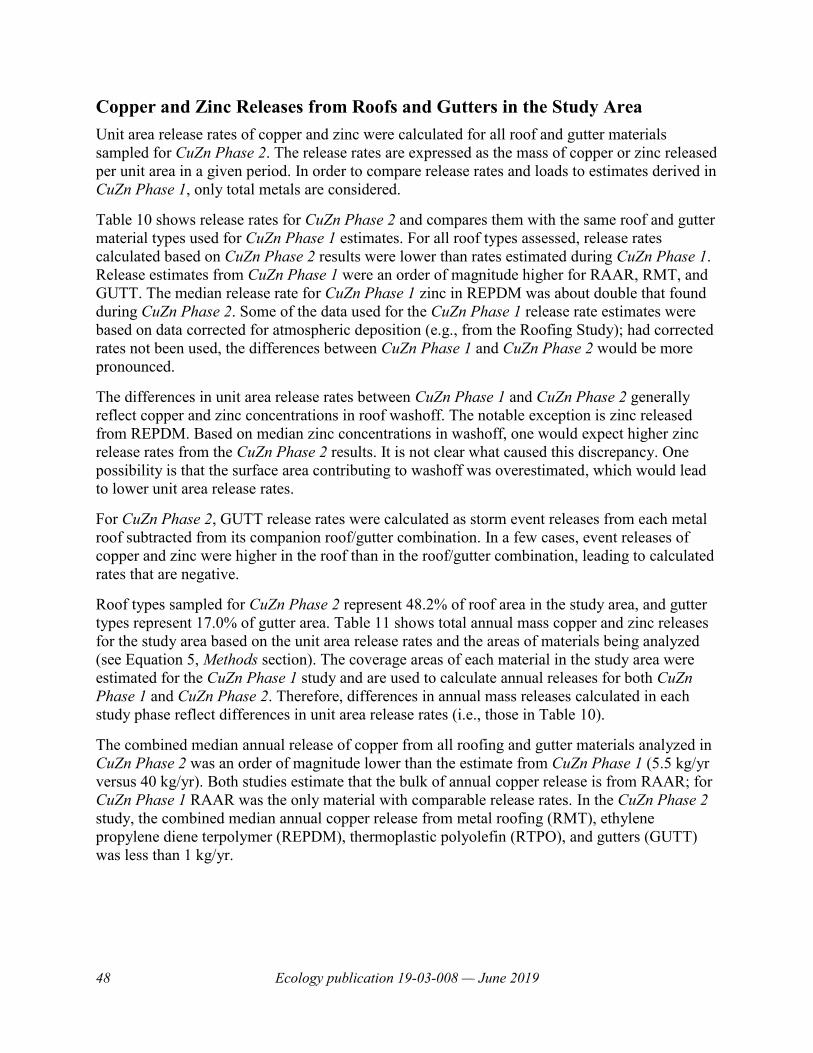
48 Ecology publication 19-03-008 — June 2019
Copper and Zinc Releases from Roofs and Gutters in the Study Area
Unit area release rates of copper and zinc were calculated for all roof and gutter materials
sampled for CuZn Phase 2. The release rates are expressed as the mass of copper or zinc released
per unit area in a given period. In order to compare release rates and loads to estimates derived in
CuZn Phase 1, only total metals are considered.
Table 10 shows release rates for CuZn Phase 2 and compares them with the same roof and gutter
material types used for CuZn Phase 1 estimates. For all roof types assessed, release rates
calculated based on CuZn Phase 2 results were lower than rates estimated during CuZn Phase 1.
Release estimates from CuZn Phase 1 were an order of magnitude higher for RAAR, RMT, and
GUTT. The median release rate for CuZn Phase 1 zinc in REPDM was about double that found
during CuZn Phase 2. Some of the data used for the CuZn Phase 1 release rate estimates were
based on data corrected for atmospheric deposition (e.g., from the Roofing Study); had corrected
rates not been used, the differences between CuZn Phase 1 and CuZn Phase 2 would be more
pronounced.
The differences in unit area release rates between CuZn Phase 1 and CuZn Phase 2 generally
reflect copper and zinc concentrations in roof washoff. The notable exception is zinc released
from REPDM. Based on median zinc concentrations in washoff, one would expect higher zinc
release rates from the CuZn Phase 2 results. It is not clear what caused this discrepancy. One
possibility is that the surface area contributing to washoff was overestimated, which would lead
to lower unit area release rates.
For CuZn Phase 2, GUTT release rates were calculated as storm event releases from each metal
roof subtracted from its companion roof/gutter combination. In a few cases, event releases of
copper and zinc were higher in the roof than in the roof/gutter combination, leading to calculated
rates that are negative.
Roof types sampled for CuZn Phase 2 represent 48.2% of roof area in the study area, and gutter
types represent 17.0% of gutter area. Table 11 shows total annual mass copper and zinc releases
for the study area based on the unit area release rates and the areas of materials being analyzed
(see Equation 5, Methods section). The coverage areas of each material in the study area were
estimated for the CuZn Phase 1 study and are used to calculate annual releases for both CuZn
Phase 1 and CuZn Phase 2. Therefore, differences in annual mass releases calculated in each
study phase reflect differences in unit area release rates (i.e., those in Table 10).
The combined median annual release of copper from all roofing and gutter materials analyzed in
CuZn Phase 2 was an order of magnitude lower than the estimate from CuZn Phase 1 (5.5 kg/yr
versus 40 kg/yr). Both studies estimate that the bulk of annual copper release is from RAAR; for
CuZn Phase 1 RAAR was the only material with comparable release rates. In the CuZn Phase 2
study, the combined median annual copper release from metal roofing (RMT), ethylene
propylene diene terpolymer (REPDM), thermoplastic polyolefin (RTPO), and gutters (GUTT)
was less than 1 kg/yr.
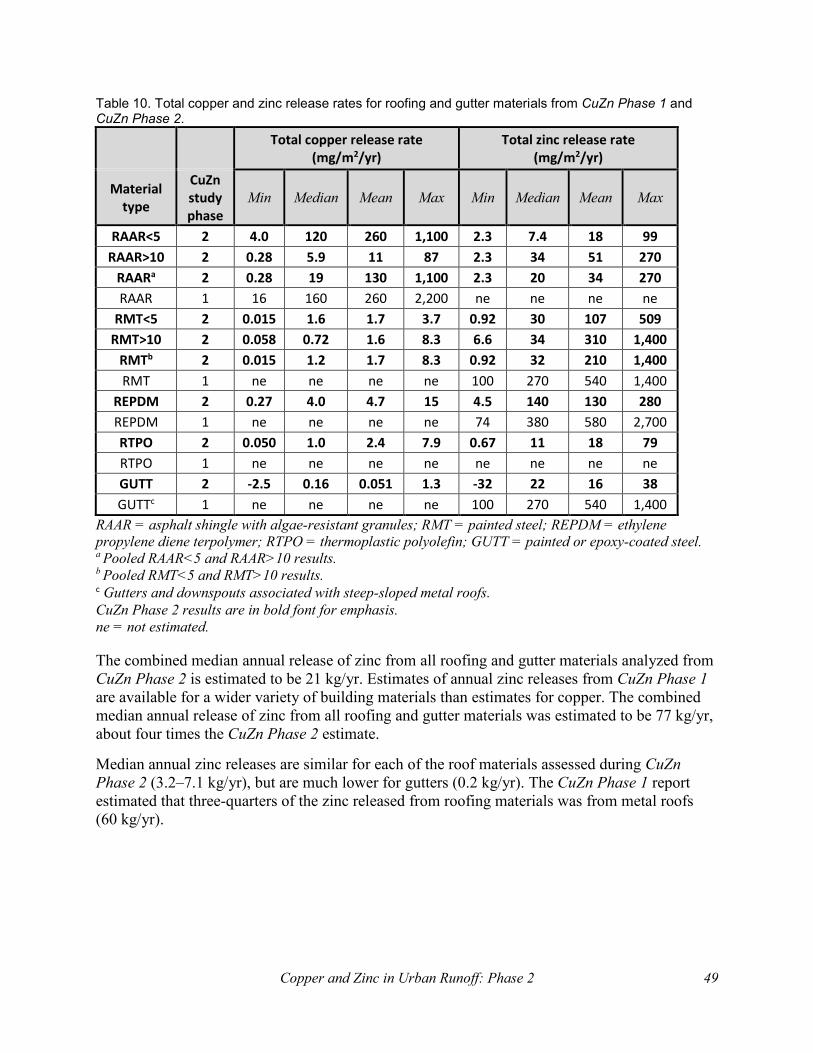
Copper and Zinc in Urban Runoff: Phase 2 49
Table 10. Total copper and zinc release rates for roofing and gutter materials from CuZn Phase 1 and CuZn Phase 2.
Total copper release rate
(mg/m2/yr) Total zinc release rate
(mg/m2/yr)
Material type
CuZn study phase
Min Median Mean Max Min Median Mean Max
RAAR<5 2 4.0 120 260 1,100 2.3 7.4 18 99
RAAR>10 2 0.28 5.9 11 87 2.3 34 51 270
RAARa 2 0.28 19 130 1,100 2.3 20 34 270
RAAR 1 16 160 260 2,200 ne ne ne ne
RMT<5 2 0.015 1.6 1.7 3.7 0.92 30 107 509
RMT>10 2 0.058 0.72 1.6 8.3 6.6 34 310 1,400
RMTb 2 0.015 1.2 1.7 8.3 0.92 32 210 1,400
RMT 1 ne ne ne ne 100 270 540 1,400
REPDM 2 0.27 4.0 4.7 15 4.5 140 130 280
REPDM 1 ne ne ne ne 74 380 580 2,700
RTPO 2 0.050 1.0 2.4 7.9 0.67 11 18 79
RTPO 1 ne ne ne ne ne ne ne ne
GUTT 2 -2.5 0.16 0.051 1.3 -32 22 16 38
GUTTc 1 ne ne ne ne 100 270 540 1,400
RAAR = asphalt shingle with algae-resistant granules; RMT = painted steel; REPDM = ethylene
propylene diene terpolymer; RTPO = thermoplastic polyolefin; GUTT = painted or epoxy-coated steel. a Pooled RAAR<5 and RAAR>10 results. b Pooled RMT<5 and RMT>10 results. c Gutters and downspouts associated with steep-sloped metal roofs.
CuZn Phase 2 results are in bold font for emphasis.
ne = not estimated.
The combined median annual release of zinc from all roofing and gutter materials analyzed from
CuZn Phase 2 is estimated to be 21 kg/yr. Estimates of annual zinc releases from CuZn Phase 1
are available for a wider variety of building materials than estimates for copper. The combined
median annual release of zinc from all roofing and gutter materials was estimated to be 77 kg/yr,
about four times the CuZn Phase 2 estimate.
Median annual zinc releases are similar for each of the roof materials assessed during CuZn
Phase 2 (3.2–7.1 kg/yr), but are much lower for gutters (0.2 kg/yr). The CuZn Phase 1 report
estimated that three-quarters of the zinc released from roofing materials was from metal roofs
(60 kg/yr).

50 Ecology publication 19-03-008 — June 2019
Table 11. Estimates of total copper and zinc releases from selected roofing and gutter materials in the study area.
RAAR = asphalt shingle with algae-resistant granules, RMT = painted steel, REPDM = ethylene
propylene diene terpolymer, RTPO = thermoplastic polyolefin, GUTT = painted or epoxy-coated steel. a Pooled RAAR<5 and RAAR>10 results. b Pooled RMT<5 and RMT>10 results. c Gutters and downspouts associated with steep-sloped metal roofs. d Incorrectly reported as 79 kg/yr (173 lb./yr) in the CuZn Phase 1 report.
CuZn Phase 2 results are in bold font for emphasis.
ne = not estimated.
Copper and Zinc Releases from Siding Materials
Copper and zinc concentrations in siding washoff were generally higher than those from roof and
gutter materials. However, overall releases of copper and zinc in siding washoff were small
compared to the roof materials examined.
Siding is generally only exposed to rain during wind-driven storms, and even then, only the
windward side(s) of buildings generate washoff. Roof overhangs shield siding from exposure, as
do trees, nearby buildings, and other standing structures.
While efforts were made to collect siding washoff from the “weather” side of the buildings
sampled for CuZn Phase 2, the targeted siding produced little washoff. Less than two-thirds of
the samples across all storm events had sufficient volume for metals analysis (approx. 100 mL),
and of those, only one-half had enough volume to analyze dissolved metals.
Analysis of the washoff volumes collected from siding locations indicate that, on average, only
about 1% of the storm precipitation contacted the siding to produce washoff. This does not
necessarily indicate that only 1% of the area was exposed. A more likely scenario is that only a
portion of the lower siding column was typically exposed to rain, with an increasing amount of
Total copper release (kg/yr)
Total zinc release (kg/yr)
Material type
CuZn study phase
Area (m2)
Min Median Mean Max Min Median Mean Max
RAARa 2 252,177 0.071 4.8 33 280 0.6 5.0 8.6 68.1
RAAR 1 252,177 4.0 40 66 555 ne ne ne ne
RMTb 2 221,241 0.0033 0.27 0.38 1.8 0.20 7.1 46 310
RMT 1 221,241 ne ne ne ne 22 60 120d 310
REPDM 2 37,445 0.010 0.15 0.18 0.56 0.17 5.2 4.9 10
REPDM 1 37,445 ne ne ne ne 2.8 14 22 100
RTPO 2 288,826 0.014 0.29 0.69 2.3 0.19 3.2 5.2 23
RTPO 1 288,826 ne ne ne ne ne ne ne ne
GUTT 2 9,124 -0.023 0.0015 0.00047 0.012 -0.29 0.20 0.15 0.35
GUTTc 1 9,124 ne ne ne ne 0.91 2.5 4.9 13
Total CuZn Phase 2 = 0.075 5.5 34 285 0.87 21 65 411
Total CuZn Phase 1 = 4.0 40 66 560 26 77 146 423
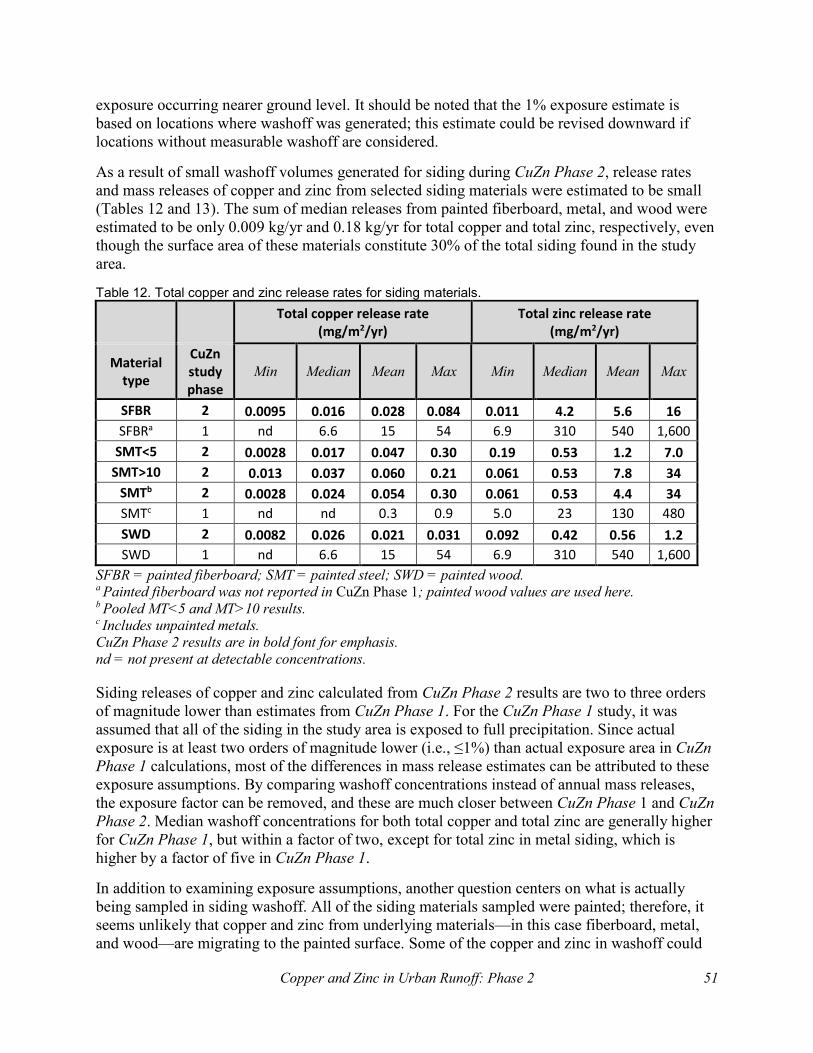
Copper and Zinc in Urban Runoff: Phase 2 51
exposure occurring nearer ground level. It should be noted that the 1% exposure estimate is
based on locations where washoff was generated; this estimate could be revised downward if
locations without measurable washoff are considered.
As a result of small washoff volumes generated for siding during CuZn Phase 2, release rates
and mass releases of copper and zinc from selected siding materials were estimated to be small
(Tables 12 and 13). The sum of median releases from painted fiberboard, metal, and wood were
estimated to be only 0.009 kg/yr and 0.18 kg/yr for total copper and total zinc, respectively, even
though the surface area of these materials constitute 30% of the total siding found in the study
area.
Table 12. Total copper and zinc release rates for siding materials.
Total copper release rate
(mg/m2/yr) Total zinc release rate
(mg/m2/yr)
Material type
CuZn study phase
Min Median Mean Max Min Median Mean Max
SFBR 2 0.0095 0.016 0.028 0.084 0.011 4.2 5.6 16
SFBRa 1 nd 6.6 15 54 6.9 310 540 1,600
SMT<5 2 0.0028 0.017 0.047 0.30 0.19 0.53 1.2 7.0
SMT>10 2 0.013 0.037 0.060 0.21 0.061 0.53 7.8 34
SMTb 2 0.0028 0.024 0.054 0.30 0.061 0.53 4.4 34
SMTc 1 nd nd 0.3 0.9 5.0 23 130 480
SWD 2 0.0082 0.026 0.021 0.031 0.092 0.42 0.56 1.2
SWD 1 nd 6.6 15 54 6.9 310 540 1,600
SFBR = painted fiberboard; SMT = painted steel; SWD = painted wood. a Painted fiberboard was not reported in CuZn Phase 1; painted wood values are used here. b Pooled MT<5 and MT>10 results. c Includes unpainted metals.
CuZn Phase 2 results are in bold font for emphasis.
nd = not present at detectable concentrations.
Siding releases of copper and zinc calculated from CuZn Phase 2 results are two to three orders
of magnitude lower than estimates from CuZn Phase 1. For the CuZn Phase 1 study, it was
assumed that all of the siding in the study area is exposed to full precipitation. Since actual
exposure is at least two orders of magnitude lower (i.e., ≤1%) than actual exposure area in CuZn
Phase 1 calculations, most of the differences in mass release estimates can be attributed to these
exposure assumptions. By comparing washoff concentrations instead of annual mass releases,
the exposure factor can be removed, and these are much closer between CuZn Phase 1 and CuZn
Phase 2. Median washoff concentrations for both total copper and total zinc are generally higher
for CuZn Phase 1, but within a factor of two, except for total zinc in metal siding, which is
higher by a factor of five in CuZn Phase 1.
In addition to examining exposure assumptions, another question centers on what is actually
being sampled in siding washoff. All of the siding materials sampled were painted; therefore, it
seems unlikely that copper and zinc from underlying materials—in this case fiberboard, metal,
and wood—are migrating to the painted surface. Some of the copper and zinc in washoff could
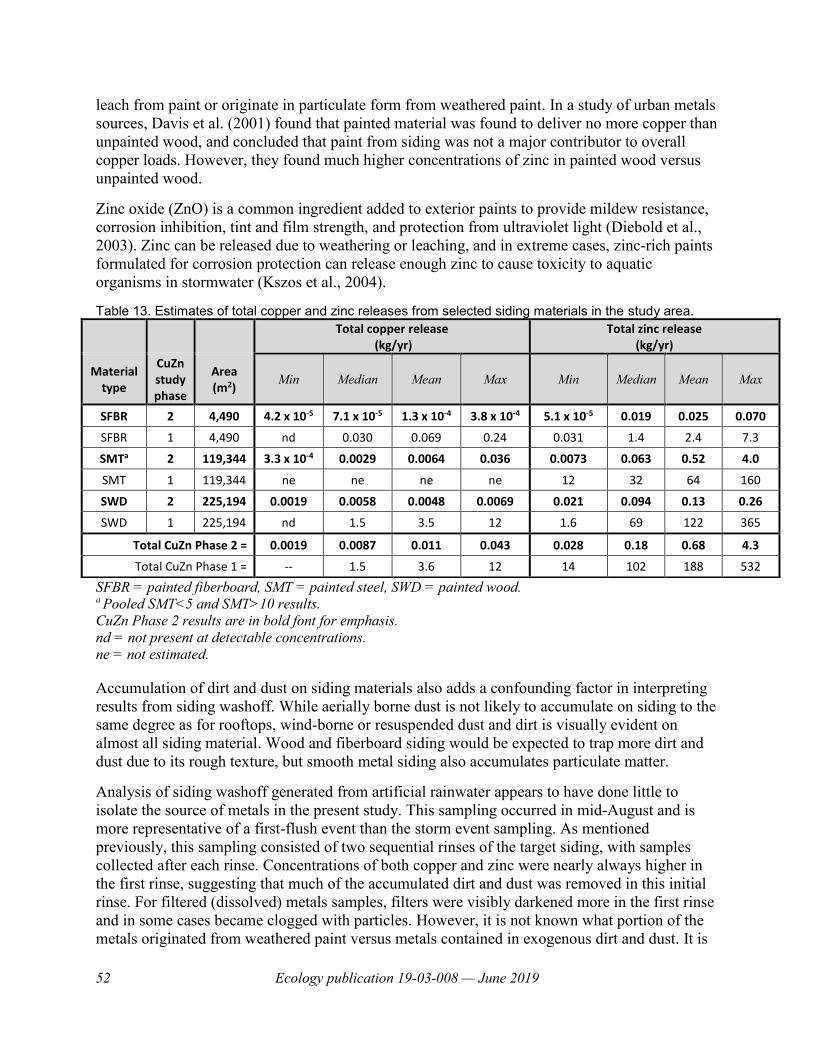
52 Ecology publication 19-03-008 — June 2019
leach from paint or originate in particulate form from weathered paint. In a study of urban metals
sources, Davis et al. (2001) found that painted material was found to deliver no more copper than
unpainted wood, and concluded that paint from siding was not a major contributor to overall
copper loads. However, they found much higher concentrations of zinc in painted wood versus
unpainted wood.
Zinc oxide (ZnO) is a common ingredient added to exterior paints to provide mildew resistance,
corrosion inhibition, tint and film strength, and protection from ultraviolet light (Diebold et al.,
2003). Zinc can be released due to weathering or leaching, and in extreme cases, zinc-rich paints
formulated for corrosion protection can release enough zinc to cause toxicity to aquatic
organisms in stormwater (Kszos et al., 2004).
Table 13. Estimates of total copper and zinc releases from selected siding materials in the study area.
SFBR = painted fiberboard, SMT = painted steel, SWD = painted wood. a Pooled SMT<5 and SMT>10 results.
CuZn Phase 2 results are in bold font for emphasis.
nd = not present at detectable concentrations.
ne = not estimated.
Accumulation of dirt and dust on siding materials also adds a confounding factor in interpreting
results from siding washoff. While aerially borne dust is not likely to accumulate on siding to the
same degree as for rooftops, wind-borne or resuspended dust and dirt is visually evident on
almost all siding material. Wood and fiberboard siding would be expected to trap more dirt and
dust due to its rough texture, but smooth metal siding also accumulates particulate matter.
Analysis of siding washoff generated from artificial rainwater appears to have done little to
isolate the source of metals in the present study. This sampling occurred in mid-August and is
more representative of a first-flush event than the storm event sampling. As mentioned
previously, this sampling consisted of two sequential rinses of the target siding, with samples
collected after each rinse. Concentrations of both copper and zinc were nearly always higher in
the first rinse, suggesting that much of the accumulated dirt and dust was removed in this initial
rinse. For filtered (dissolved) metals samples, filters were visibly darkened more in the first rinse
and in some cases became clogged with particles. However, it is not known what portion of the
metals originated from weathered paint versus metals contained in exogenous dirt and dust. It is
Total copper release (kg/yr)
Total zinc release (kg/yr)
Material type
CuZn study phase
Area (m2)
Min Median Mean Max Min Median Mean Max
SFBR 2 4,490 4.2 x 10⁻⁵ 7.1 x 10⁻⁵ 1.3 x 10⁻⁴ 3.8 x 10⁻⁴ 5.1 x 10⁻⁵ 0.019 0.025 0.070
SFBR 1 4,490 nd 0.030 0.069 0.24 0.031 1.4 2.4 7.3
SMTa 2 119,344 3.3 x 10⁻⁴ 0.0029 0.0064 0.036 0.0073 0.063 0.52 4.0
SMT 1 119,344 ne ne ne ne 12 32 64 160
SWD 2 225,194 0.0019 0.0058 0.0048 0.0069 0.021 0.094 0.13 0.26
SWD 1 225,194 nd 1.5 3.5 12 1.6 69 122 365
Total CuZn Phase 2 = 0.0019 0.0087 0.011 0.043 0.028 0.18 0.68 4.3
Total CuZn Phase 1 = -- 1.5 3.6 12 14 102 188 532
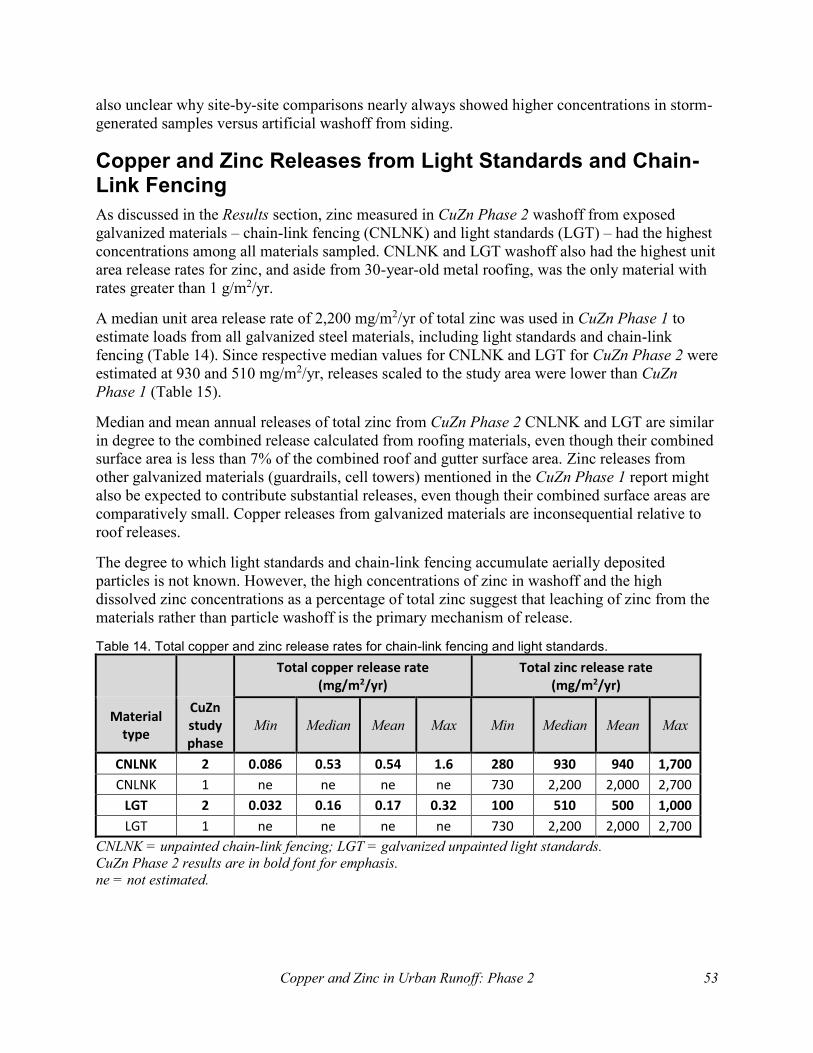
Copper and Zinc in Urban Runoff: Phase 2 53
also unclear why site-by-site comparisons nearly always showed higher concentrations in storm-
generated samples versus artificial washoff from siding.
Copper and Zinc Releases from Light Standards and Chain-Link Fencing
As discussed in the Results section, zinc measured in CuZn Phase 2 washoff from exposed
galvanized materials – chain-link fencing (CNLNK) and light standards (LGT) – had the highest
concentrations among all materials sampled. CNLNK and LGT washoff also had the highest unit
area release rates for zinc, and aside from 30-year-old metal roofing, was the only material with
rates greater than 1 g/m2/yr.
A median unit area release rate of 2,200 mg/m2/yr of total zinc was used in CuZn Phase 1 to
estimate loads from all galvanized steel materials, including light standards and chain-link
fencing (Table 14). Since respective median values for CNLNK and LGT for CuZn Phase 2 were
estimated at 930 and 510 mg/m2/yr, releases scaled to the study area were lower than CuZn
Phase 1 (Table 15).
Median and mean annual releases of total zinc from CuZn Phase 2 CNLNK and LGT are similar
in degree to the combined release calculated from roofing materials, even though their combined
surface area is less than 7% of the combined roof and gutter surface area. Zinc releases from
other galvanized materials (guardrails, cell towers) mentioned in the CuZn Phase 1 report might
also be expected to contribute substantial releases, even though their combined surface areas are
comparatively small. Copper releases from galvanized materials are inconsequential relative to
roof releases.
The degree to which light standards and chain-link fencing accumulate aerially deposited
particles is not known. However, the high concentrations of zinc in washoff and the high
dissolved zinc concentrations as a percentage of total zinc suggest that leaching of zinc from the
materials rather than particle washoff is the primary mechanism of release.
Table 14. Total copper and zinc release rates for chain-link fencing and light standards.
Total copper release rate
(mg/m2/yr) Total zinc release rate
(mg/m2/yr)
Material type
CuZn study phase
Min Median Mean Max Min Median Mean Max
CNLNK 2 0.086 0.53 0.54 1.6 280 930 940 1,700
CNLNK 1 ne ne ne ne 730 2,200 2,000 2,700
LGT 2 0.032 0.16 0.17 0.32 100 510 500 1,000
LGT 1 ne ne ne ne 730 2,200 2,000 2,700
CNLNK = unpainted chain-link fencing; LGT = galvanized unpainted light standards.
CuZn Phase 2 results are in bold font for emphasis.
ne = not estimated.
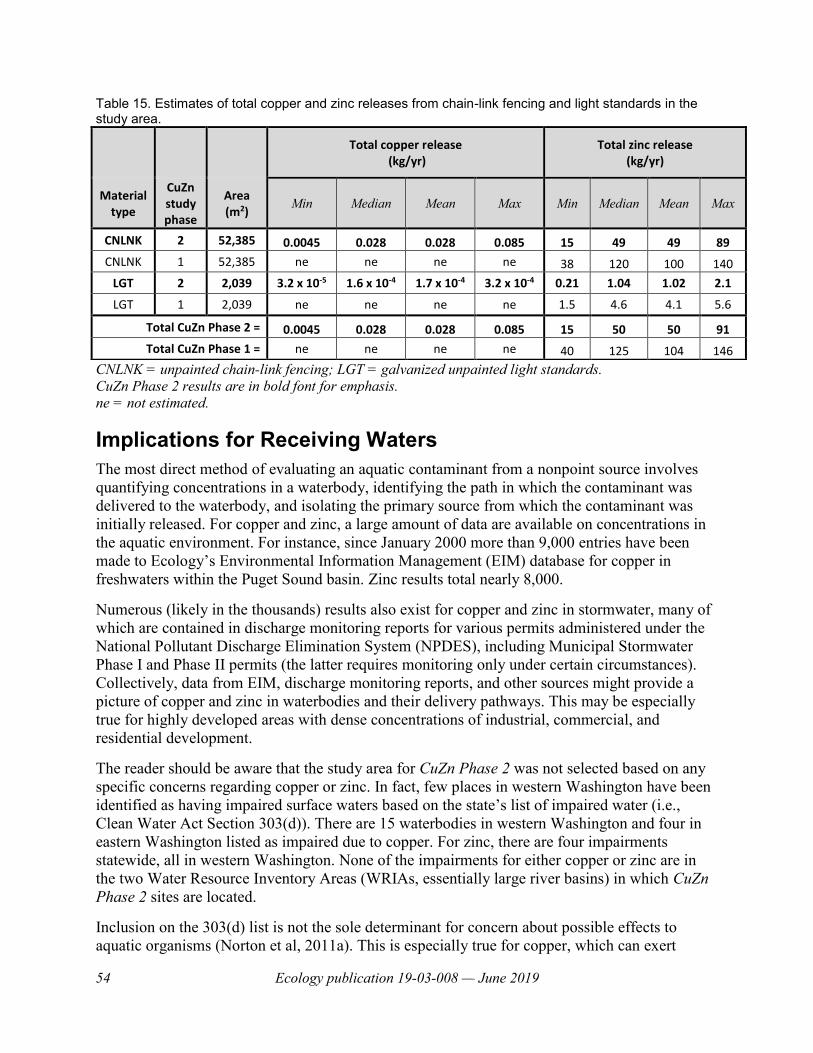
54 Ecology publication 19-03-008 — June 2019
Table 15. Estimates of total copper and zinc releases from chain-link fencing and light standards in the study area.
CNLNK = unpainted chain-link fencing; LGT = galvanized unpainted light standards.
CuZn Phase 2 results are in bold font for emphasis.
ne = not estimated.
Implications for Receiving Waters
The most direct method of evaluating an aquatic contaminant from a nonpoint source involves
quantifying concentrations in a waterbody, identifying the path in which the contaminant was
delivered to the waterbody, and isolating the primary source from which the contaminant was
initially released. For copper and zinc, a large amount of data are available on concentrations in
the aquatic environment. For instance, since January 2000 more than 9,000 entries have been
made to Ecology’s Environmental Information Management (EIM) database for copper in
freshwaters within the Puget Sound basin. Zinc results total nearly 8,000.
Numerous (likely in the thousands) results also exist for copper and zinc in stormwater, many of
which are contained in discharge monitoring reports for various permits administered under the
National Pollutant Discharge Elimination System (NPDES), including Municipal Stormwater
Phase I and Phase II permits (the latter requires monitoring only under certain circumstances).
Collectively, data from EIM, discharge monitoring reports, and other sources might provide a
picture of copper and zinc in waterbodies and their delivery pathways. This may be especially
true for highly developed areas with dense concentrations of industrial, commercial, and
residential development.
The reader should be aware that the study area for CuZn Phase 2 was not selected based on any
specific concerns regarding copper or zinc. In fact, few places in western Washington have been
identified as having impaired surface waters based on the state’s list of impaired water (i.e.,
Clean Water Act Section 303(d)). There are 15 waterbodies in western Washington and four in
eastern Washington listed as impaired due to copper. For zinc, there are four impairments
statewide, all in western Washington. None of the impairments for either copper or zinc are in
the two Water Resource Inventory Areas (WRIAs, essentially large river basins) in which CuZn
Phase 2 sites are located.
Inclusion on the 303(d) list is not the sole determinant for concern about possible effects to
aquatic organisms (Norton et al, 2011a). This is especially true for copper, which can exert
Total copper release (kg/yr)
Total zinc release (kg/yr)
Material type
CuZn study phase
Area (m2)
Min Median Mean Max Min Median Mean Max
CNLNK 2 52,385 0.0045 0.028 0.028 0.085 15 49 49 89
CNLNK 1 52,385 ne ne ne ne 38 120 100 140
LGT 2 2,039 3.2 x 10⁻⁵ 1.6 x 10⁻⁴ 1.7 x 10⁻⁴ 3.2 x 10⁻⁴ 0.21 1.04 1.02 2.1
LGT 1 2,039 ne ne ne ne 1.5 4.6 4.1 5.6
Total CuZn Phase 2 = 0.0045 0.028 0.028 0.085 15 50 50 91
Total CuZn Phase 1 = ne ne ne ne 40 125 104 146
Copper and Zinc in Urban Runoff: Phase 2 55
effects on salmonids well below water quality criteria (Meyer and Deforest, 2018). However, the
303(d) list is an effective method to identify waterbodies with substantial contaminant sources,
particularly from nonpoint releases.
Perhaps most importantly, CuZn Phase 2 and studies that have identified potentially large copper
and zinc releases based on literature values (e.g., CuZn Phase 1 and PSTLA) do not necessarily
find links between releases and copper or zinc enrichment of receiving waters. The present study
did not consider the fate or transport of copper and zinc once it was washed off of the materials
being examined. On-site observations suggested that little if any of the washoff was conveyed
overland to surface waterbodies or conveyance systems (e.g., storm drains). With few
exceptions, washoff from materials examined (roofs, siding, gutters, chain-link fencing, and light
standards) went directly into soil at the dripline and presumably remained on site, at least in the
short term. Copper and zinc in particulate form likely becomes bound to surface soils
permanently. Dissolved copper and zinc from roof runoff has been shown to migrate to soil
layers deeper than 1 meter (Mason et al., 1999), but overall retention in surface soils is typically
high and dependent on a variety of soil characteristics (Bertling, 2005).
These circumstances are notably different from vehicle-related releases of copper and zinc
identified in CuZn Phase 1. Brake wear was estimated to release almost 60% of the copper in the
study area, and tire and brake wear combined were estimated to release 15% of zinc. These
releases may have a larger impact on receiving waters because releases occur on impervious
surfaces, enhancing their potential conveyance and delivery to waterbodies.
Paulson et al. (2012) used these concepts and release rates for various chemicals, including
copper, to develop conceptual models for two urbanized stream basins (Mill and Thornton
Creeks) in the Puget Sound basin. They estimated that nearly all of the copper released from
roofs was attenuated before reaching either creek, primarily through sequestration in soils. In
total, they estimated that only 3% of the copper released in the Mill Creek basin and 7% of the
copper released in the Thornton Creek basin was ultimately discharged by the creeks. Since the
releases include those directly to impervious surfaces (primarily from vehicle sources), they
concluded that little of the copper released from roofs reach these creeks.
A study to assess the impacts to receiving waters in the study area (Woodland Creek and some of
its tributaries) would ideally include monitoring stations on these waterbodies located
downstream of the study area. Field measurements of all major copper and zinc releases,
evaluation of their fate and transport following initial release, and development of conceptual
models is beyond the scope of the present study.
Although not built into the design for the present study, sampling of Woodland Creek was
conducted for an unrelated study (Collyard and Anderson, 2017) at a location just downstream of
the study area (although it did not include the entire drainage for the study area). Monthly
sampling of various chemicals, including copper and zinc, was conducted at this station during
2015. Sampling was not focused on storm sampling. Nevertheless, low concentrations of copper
and zinc were found, with most samples at nondetectable concentrations for copper (<0.5 µg/L)
and zinc (<5 µg/L). Maximum concentrations were 2.1 µg/L for total copper and 14 µg/L for
total zinc. It is notable that copper concentrations in Woodland Creek are about an order of
magnitude lower than those in Mill and Thornton Creeks (Paulson et al., 2012).
56 Ecology publication 19-03-008 — June 2019
While these data might suggest that washoff from buildings and other materials have little effect
on the major receiving water in the study area drainage, more sampling of Woodland Creek and
its tributaries would be needed as confirmation. Unfortunately, no stormwater data are available
to aid in the assessment of copper and zinc in conveyance systems (the City of Lacey is not
required to monitor copper and zinc in stormwater under conditions of their Municipal Phase II
permit). This paucity of data would severely limit the development of conceptual models for
copper and zinc in the study area, if it were to be a goal of further study.
Copper and Zinc in Urban Runoff: Phase 2 57
Summary and Conclusions
The present field study (CuZn Phase 2) provides a follow-up study to literature-derived estimates
of copper (Cu) and zinc (Zn) releases from selected materials in a small urban sub-watershed in
western Washington (CuZn Phase 1; Bookter, 2017a) and from the entire Puget Sound basin
(PSTLA; Norton et al., 2011a). CuZn Phase 2 also supplements roofing washoff data generated
from Ecology’s Roofing Study (Winters et al., 2014).
Washoff from the following material types in the built environment were sampled during five or
six rain events in 2018:
Roofing
asphalt shingle roofs with algae-resistant granules <5 or >10 years old
painted metal (steel) roofs <5 or >10 years old
ethylene propylene diene terpolymer (EPDM) roofs
thermoplastic polyolefin (TPO) roofs
Siding
painted fiberboard (fiber cement) siding
painted wood siding
painted metal (steel) siding <5 or >10 years old
Other
painted metal (steel) gutters
galvanized light standards
galvanized uncoated chain-link fencing
Bulk (wet + dry) atmospheric deposition samples were also collected.
The overall magnitude of copper and zinc releases calculated during the present study appears to
be small. Table 16 shows a summary of estimated annual copper and zinc releases of all
materials of interest within the study area. At the median level, approximately 6 kg copper and
70 kg zinc are released annually in the study area. By comparison, median annual copper and
zinc releases from the same materials calculated for the CuZn Phase 1 report were about 40 and
300 kg/yr, respectively. For CuZn Phase 2, the bulk of copper is from roof washoff (mainly from
algae-resistant asphalt shingles) and the bulk of zinc is from uncoated chain-link fencing.
The CuZn Phase 1 effort considered other anthropogenic sources of copper and zinc in the study
area. The bulk (60%, avg. of 210 kg/yr) of the total copper release is estimated to be from brake
wear, with another 10% (avg. of 34 kg/yr) related to other vehicle uses. Roof materials in CuZn
Phase 1 were found to contribute about one-quarter of the total copper releases, and siding
material about 3%.
58 Ecology publication 19-03-008 — June 2019
For zinc, CuZn Phase 1 estimated that approximately 40% (avg. of 1,100 kg/yr) of the total
annual release in the study area is from the application of moss control products. An additional
one-third of total zinc release is due to vehicle use or related materials and activities. Siding
materials together with chain-link, roofing materials, and gutters make up another one-quarter of
total zinc releases according to CuZn Phase 1.
Since releases of copper and zinc from vehicle use and moss control products were not addressed
in the present study, it is unknown how well CuZn Phase 1 estimates might match up with field
results. If CuZn Phase 1 estimates of vehicle-related and moss control copper and zinc releases
are accurate, the materials analyzed for CuZn Phase 2 constitute only minor contributions to
overall releases. On the other hand, if field studies find that CuZn Phase 1 overestimated vehicle
and moss control releases, the overall release of copper and zinc in the study area might be fairly
small.
From a water quality perspective, an important component of copper and zinc is the conveyance
from the point of release to receiving waters. This was not addressed in the present study, nor
was it addressed in CuZn Phase 1. Some of the primary sources addressed in CuZn Phase 1
suggest copper and zinc releases to impervious surfaces, such as vehicle use, are more likely to
become mobile and have a higher likelihood of being delivered to surface waters.
Table 16. Estimates of total copper and zinc releases from selected materials in the study area.
RAAR = asphalt shingle with algae-resistant granules; RMT = painted steel; REPDM = ethylene
propylene diene terpolymer; RTPO = thermoplastic polyolefin; GUTT = painted or epoxy-coated steel;
SFBR = painted fiberboard; SMT = painted steel; SWD = painted wood; CNLNK = unpainted chain-link
fencing; LGT = galvanized unpainted light standards. a Pooled AAR<5 and AAR>10 results. b Pooled MT<5 and MT>10 results.
Total copper release
(kg/yr) Total zinc release
(kg/yr)
Material type Min Median Mean Max Min Median Mean Max
RAARa 0.071 4.8 33 280 0.6 5.0 8.6 68.1
RMTb 0.0033 0.27 0.38 1.8 0.20 7.1 46 310
REPDM 0.010 0.15 0.18 0.56 0.17 5.2 4.9 10
RTPO 0.014 0.29 0.69 2.3 0.19 3.2 5.2 23
GUTT -0.023 0.0015 0.00047 0.012 -0.29 0.20 0.15 0.35
Total roofing and
gutter 0.075 5.5 34 280 0.87 21 65 410
SFBR 4.2 x 10⁻⁵ 7.1 x 10⁻⁵ 1.3 x 10⁻⁴ 3.8 x 10⁻⁴ 5.1 x 10⁻⁵ 0.019 0.025 0.070
SMTb 3.3 x 10⁻⁴ 0.0029 0.0064 0.036 0.0073 0.063 0.52 4.0
SWD 0.0019 0.0058 0.0048 0.0069 0.021 0.094 0.13 0.26
Total Siding 0.0019 0.0087 0.011 0.043 0.028 0.18 0.68 4.3
CNLNK 0.0045 0.028 0.028 0.085 15 49 49 89
LGT 3.2 x 10⁻⁵ 1.6 x 10⁻⁴ 1.7 x 10⁻⁴ 3.2 x 10⁻⁴ 0.21 1.04 1.02 2.1
Total light and
chain-link 0.0045 0.028 0.028 0.085 15 50 50 91
Total all
materials 0.082 5.6 34 285 16 71 120 520
Copper and Zinc in Urban Runoff: Phase 2 59
From this sampling effort, the following conclusions can be drawn:
1) Overall, rain washoff from most roofing materials in the built environment does not
contain high concentrations of copper or zinc compared with literature-based estimates
(e.g., PSTLA [Norton et al., 2011a] and CuZn Phase 1 [Bookter, 2017a]). This is
consistent with findings from the Ecology Roofing Study (Winters et al., 2014).
2) Some roof types do release appreciable quantities of copper and zinc per unit area.
a. Copper from newer asphalt shingle roofs (<5 years old) that use algae-resistant
granules release copper at rates up to two orders of magnitude higher than other
roof types analyzed.
b. Copper releases from algae-resistant asphalt roofs appear to diminish as the roof
ages. This is supported by the finding that copper from older asphalt shingle roofs
(>10 years old) that use algae-resistant granules release copper at rates an order of
magnitude lower than newer material.
c. Zinc can be released at high concentrations by older painted metal roofs (30 years
old). However, this finding is based on a single roof at this age. Five newer
painted metal roofs (≤12 years old) or their companion metal painted gutters did
not release high concentrations of zinc.
3) Washoff from painted siding has higher concentrations of zinc than roof washoff; copper
concentrations are generally low. While not investigated for the present study, it is
possible that weathered paint is the main source of zinc from siding washoff.
4) Materials that are composed almost exclusively of galvanized steel—chain-link fencing
and light standards in the case of the present study—release high quantities of zinc but
little copper. However, it does not appear that there is substantial enrichment of zinc in
roof washoff due to rainwater contact with ancillary roofing components, such as
fasteners and flashing, that might also be composed of galvanized steel.
5) Older materials composed of exposed or painted metals generally release more zinc than
newer materials.
6) Most of the copper (70% on average) and zinc (90% on average) in washoff from all
materials is in the dissolved form.
7) Mass quantities of copper and zinc released annually from all materials analyzed in the
study area are lower than those from literature-based estimates (e.g., PSTLA and CuZn
Phase 1 studies).
8) The PSTLA study overestimated mass zinc releases from roofing in the Puget Sound
basin.
9) Results of the present study provide a better indicator of regional copper and zinc releases
than those typically found in the published literature.
60 Ecology publication 19-03-008 — June 2019
Recommendations
Prioritizing Releases of Copper and Zinc
Copper and zinc have the potential to adversely impact surface waters. Releases of copper and
zinc from nonpoint sources may be pronounced in urban areas due to the abundance of materials
and activities that can shed these metals into the environment. As a result, controlling
conveyance sources (e.g., stormwater) is favored over cleanup, and in some cases, preventing
their initial release might be a preferred option.
To set priorities to reduce initial release of copper or zinc from materials and activities, several
questions should be considered:
What materials or activities are likely to release the most copper and zinc?
Are copper and zinc released in a form or location where they can become mobile?
Are there known impacts to surface waters due to copper and zinc releases from specific
materials or activities?
The weight given to each question might depend on the goals of source control efforts. For the
present study, only the initial question was addressed (What materials or activities are likely to
release the most copper and zinc?), and only selected source materials were investigated. As a
result, context is limited and the importance of the selected materials as source control priorities
is thus limited as well. Future studies need not address all elements of copper and zinc releases
and full assessment of their fate and transport, but consideration of these points will yield more
information for prioritizing source control.
Recommendations for Sampling Copper and Zinc in Building Materials and Structures
Collecting bulk washoff from building materials that release metals during precipitation events is
beset with opportunities for sample contamination. Conducting a study at a large scale requires
numerous installations to provide washoff diversions and large volume collectors (≥200 L in
some cases) at multiple sites. These sampling systems require setup immediately in advance of
an anticipated storm event, and preparing for an event can be logistically cumbersome. If
sampling devices are not completely sealed from the environment (other than washoff), they
need to be recalled if a storm does not materialize.
In order to avoid these potential problems, investigators may want to consider artificial rainwater
sampling for some materials. This may be best achieved using a phased approach. The initial
phase would involve side-by-side collection and analysis of both rainwater washoff and artificial
washoff. Results would be compared and artificial rainwater washoff could be modified until it
closely matched rainwater washoff. Investigators should strive to replicate the physical
characteristics of rainwater as well as the chemical characteristics. This includes the angle of
descent, as well as the force at the point of contact (droplet size and velocity).
Once there is a high degree of confidence that artificial rainwater sampling provides a suitable
substitute for storm washoff, artificial washoff sampling would provide a number of benefits.
Copper and Zinc in Urban Runoff: Phase 2 61
Sampling could be conducted at any time and would not necessitate pre-storm setup. Adequate
washoff volume could easily be generated from vertical surfaces. Sample collection devices
could be smaller and simpler, and could be more easily isolated from contamination.
To assess chemical contributions from atmospheric deposition, it is recommended that sampling
devices be deployed at each location where materials are sampled. This would provide a more
accurate picture of site-specific atmospheric deposition and would help assess any contributions
from localized sources. When sampling for metals, collection devices should be constructed of
plastic, glass, or other non-metallic material.
62 Ecology publication 19-03-008 — June 2019
References Baird, R., L. Bridgewater, American Public Health Association. 2017. Standard Methods for the
Examination of Water and Wastewater, 23rd ed. Joint publication of the American Public Health
Association, American Water Works Association, and Water Environment Federation.
www.standardmethods.org.
Bertling, S. 2005. Corrosion-Induced Metal Runoff from External Constructions and its Environmental
Interaction: A Combined Field and Laboratory Investigation of Zn, Cu, Cr and Ni for Risk
Assessment. Doctoral Thesis, Division of Corrosion Science, School of Industrial Engineering and
Management, Royal Institute of Technology, Stockholm, Sweden.
Bookter, A. 2017a. Urban Copper and Zinc: Phase 1 — Potential Pollutant Sources and Release Rates.
Publication No. 17-03-018. Washington State Department of Ecology, Olympia.
https://fortress.wa.gov/ecy/publications/SummaryPages/1703018.html.
Bookter, A. 2017b. Quality Assurance Project Plan: Copper and Zinc in Urban Runoff: Phase 2 —
Rainwater Runoff Monitoring. Publication No. 17-03-117. Washington State Department of Ecology,
Olympia. https://fortress.wa.gov/ecy/publications/SummaryPages/1703117.html.
Brandenberger, J.M., E.A. Crecelius, and P. Louchouarn. 2008. Historical inputs and natural recovery
rates for heavy metals and organic biomarkers in Puget Sound during the 20th century. Environmental
Science & Technology 42: 6786–6790.
Brandenberger, J.M., P. Louchouarn, L-J. Kuo, E.A. Crecelius, V. Cullinan, G.A. Gill, C. Garland, J.
Williamson, and R. Dhammapala. 2010. Control of Toxic Chemicals in Puget Sound, Phase 3: Study
of Atmospheric Deposition of Air Toxics to the Surface of Puget Sound. Prepared for Washington
State Department of Ecology by Battelle Marine Sciences Laboratory, Sequim, Washington.
Collyard, S., and P. Anderson. 2017. Henderson Inlet Fecal Coliform Total Maximum Daily Load: Water
Quality Effectiveness Monitoring Report. Publication No. 17-03-001. Washington State Department
of Ecology, Olympia. https://fortress.wa.gov/ecy/publications/SummaryPages/1703001.html.
Davis, A.P., M. Shokouhian, and S. Ni. 2001. Loading estimates of lead, copper, cadmium, and zinc in
urban runoff from specific sources. Chemosphere 44: 997–1009.
Diebold, M.P., C.R. Bettler, and D.M. Mukoda. 2003. Mechanism of TiO2/ZnO instability in latex paints.
Journal of Coating Technology 75(942): 26–36.
Era-Miller, B., and S. Wong. 2016. Quality Assurance Project Plan: Spokane River Atmospheric
Deposition Study for PCBs. Publication No. 16-03-112. Washington State Department of Ecology,
Olympia. https://fortress.wa.gov/ecy/publications/SummaryPages/1603112.html.
He, W. 2002. Atmospheric Corrosion and Runoff Processes on Copper and Zinc as Roofing Materials.
Doctoral Thesis, Division of Corrosion Science, School of Industrial Engineering and Management,
Royal Institute of Technology, Stockholm, Sweden.
Herrera Environmental Consultants, Inc. 2011. Toxics in Surface Runoff to Puget Sound: Phase 3 Data
and Load Estimates. Publication No. 11-03-010. Washington State Department of Ecology, Olympia.
https://fortress.wa.gov/ecy/publications/SummaryPages/1103010.html.
Hobbs, W., B. Lubliner, N. Kale, and E. Newell. 2015. Western Washington NPDES Phase 1 Stormwater
Permit: Final S8.D Data Characterization, 2009–2013. Publication No. 15-03-001. Washington State
Department of Ecology, Olympia.
https://fortress.wa.gov/ecy/publications/SummaryPages/1503001.html.
Copper and Zinc in Urban Runoff: Phase 2 63
King County. 2013. Lower Duwamish Waterway Source Control: Bulk Atmospheric Deposition Study
Data Report. Prepared by Jenée Colton, Carly Greyell, and Richard Jack, King County Department of
Natural Resources and Parks, Water and Land Resources Division, Science Section, Seattle.
Kszos, L.A., G.W. Morris, and B.K. Konetsky. 2004. Source of toxicity in storm water: Zinc from
commonly used paint. Environmental Toxicology and Chemistry 23(1): 12–16.
Lefkovitz, L.F, V.I. Cullinan, and E.A. Crecelius. 1997. Historical Trends in the Accumulation of
Chemicals in Puget Sound. NOAA Technical Memorandum NOS ORCA 111. U.S. Department of
Commerce, National Oceanic and Atmospheric Administration, National Ocean Service.
Lorz, H.W., and B.P. McPherson. 1977. Effects of copper and zinc on smoltification of Coho salmon.
EPA-600/3-77-032. U.S. Environmental Protection Agency, Office of Research and Development,
Corvallis Environmental Research Laboratory, Corvallis, Oregon.
Lowe, J. 2010. Quality Assurance Project Plan Guidance: Special Condition S8.D: Phase I Municipal
Stormwater Permit. Publication No. 10-10-075. Washington State Department of Ecology, Olympia.
https://fortress.wa.gov/ecy/publications/summarypages/1010075.html.
Mason, Y., A.A. Ammann, A. Ulrich, and L. Sigg. 1999. Behavior of heavy metals, nutrients, and major
components during roof runoff infiltration. Environmental Science & Technology 33: 1588–1597.
McClain, K. 2014. Non-Agricultural Pesticide Use in Puget Sound Counties. Publication AGR-PUB 103-
409. Washington State Department of Agriculture, Olympia.
https://agr.wa.gov/FP/Pubs/docs/103-409PSReportfinal2014.pdf.
Meyer, L.S., and D.K. DeForest. 2018. Protectiveness of Cu water quality criteria against impairment of
behavior and chemo/mechanosensory responses: An update. Environmental Toxicology and
Chemistry 37(5): 1260–1279.
Norton, D., D. Serdar, J. Colton, R. Jack, and D. Lester. 2011a. Control of Toxic Chemicals in Puget
Sound: Assessment of Selected Toxic Chemicals in the Puget Sound Basin, 2007–2011. Publication
11-03-055. Washington State Department of Ecology, Olympia.
https://fortress.wa.gov/ecy/publications/summarypages/1103055.html
Norton, D., D. Serdar, J. Colton, R. Jack, and D. Lester. 2011b. Control of Toxic Chemicals in Puget
Sound: Assessment of Selected Toxic Chemicals in the Puget Sound Basin, 2007–2011. Appendix D-
8. Hazard Evaluation — Summary Statistics for Environmental (Observed) Data. Publication 11-03-
055-AppD8. Washington State Department of Ecology, Olympia.
https://fortress.wa.gov/ecy/publications/summarypages/1103055AppD8.html.
NADP [National Atmospheric Deposition Network]. 2017. Rainwater pH for western Washington
atmospheric deposition monitoring sites. Accessed July 19, 2017.
http://nadp.slh.wisc.edu/data/sites/NTN/?net=NTN.
Ochoa Gonzales, R., S. Strekopytov, F. Amato, X. Querol, C. Reche, and D. Weiss. 2016. New insights
from zinc and copper isotopic compositions into the sources of atmospheric particulate matter from
two major European cities. Environmental Science & Technology 50(18): 9816–9824.
Paulson, A., B. Carter, and R. Sheibley. 2012. Control of Toxic Chemicals in Puget Sound: Assessment
of Selected Toxic Chemicals in the Puget Sound Basin, 2007–2011. Addendum No. 1: Evaluation of
Fate and Transport Mechanisms for Primary Releases of Copper, PCBs, and PBDEs. Publication 11-
03-055-Addendum-1. Washington State Department of Ecology, Olympia.
https://fortress.wa.gov/ecy/publications/summarypages/1103055Addendum1.html.
Sandahl, J.F., D.H. Baldwin, J.J. Jenkins, and N.L. Scholz. 2007. A sensory system at the interface
between urban stormwater runoff and salmon survival. Environmental Science & Technology 41:
2998–3004.
64 Ecology publication 19-03-008 — June 2019
Sprague, J.B. 1968. Avoidance reactions of rainbow trout to zinc sulphate solutions. Water Research 2:
367–372.
Tierney, K.B., D.H. Baldwin, T.J. Hara, P.S. Ross, N.L. Scholz, and C.J. Kennedy. 2010. Olfactory
toxicity in fishes. Aquatic Toxicology 29(1): 2–26.
Winters, N., M. McCall, and A. Kingfisher. 2014. Roofing Materials Assessment: Investigation of Toxic
Chemicals in Roof Runoff from Constructed Panels in 2013 and 2014. Publication 14-03-033.
Washington State Department of Ecology, Olympia.
https://fortress.wa.gov/ecy/publications/SummaryPages/1403033.html
Copper and Zinc in Urban Runoff: Phase 2 65
Glossary, Acronyms, and Abbreviations
Glossary
Anthropogenic: Human-caused.
Atmospheric deposition: Atmospheric deposition is the result of airborne chemicals settling
onto the land or air surface through precipitation or deposition of dry particulate matter.
Conductivity: A measure of water’s ability to conduct an electrical current. Conductivity is
related to the concentration and charge of dissolved ions in water.
CuZn study area: A portion of the lower Woodland Creek watershed, primarily within the City
of Lacey and part of Thurston County, Washington.
Nonpoint source: Pollution that enters any waters of the state from any dispersed land-based or
water-based activities, including but not limited to atmospheric deposition; surface water runoff
from agricultural lands, urban areas, or forest lands; subsurface or underground sources; or
discharges from boats or marine vessels not otherwise regulated under the NPDES program.
Generally, any unconfined and diffuse source of contamination. Legally, any source of water
pollution that does not meet the legal definition of “point source” in section 502(14) of the Clean
Water Act.
Parameter: Water quality constituent being measured (analyte). A physical, chemical, or
biological property whose values determine environmental characteristics or behavior.
pH: A measure of the acidity or alkalinity of water. A low pH value (0 to 7) indicates that an
acidic condition is present, while a high pH (7 to 14) indicates a basic or alkaline condition. A
pH of 7 is considered neutral. Since the pH scale is logarithmic, a water sample with a pH of 8 is
ten times more basic than one with a pH of 7.
Point source: Sources of pollution that discharge at a specific location from pipes, outfalls, and
conveyance channels to a surface water. Examples of point source discharges include municipal
wastewater treatment plants, municipal stormwater systems, industrial waste treatment facilities,
and construction sites where more than 5 acres of land have been cleared.
Rainwater runoff: Precipitation that falls on and flows over a surface.
Rinsate: Laboratory-supplied reagent-grade deionized water that has flowed over (i.e., rinsed) a
container or sample equipment.
Salmonid: Fish that belong to the family Salmonidae. Species of salmon, trout, or char.
Stormwater: The portion of precipitation that does not naturally percolate into the ground or
evaporate but instead runs off roads, pavement, and roofs during rainfall or snow melt.
Stormwater can also come from hard or saturated grass surfaces such as lawns, pastures,
playfields, and from gravel roads and parking lots.
Total suspended solids (TSS): Portion of solids retained by a filter.
Turbidity: Relative clarity of a liquid. Turbidity can be used as a surrogate indicator of TSS.
66 Ecology publication 19-03-008 — June 2019
Washoff: Portion of precipitation or sprayed water that flows off of a constructed surface.
Watershed: A drainage area or basin in which all land and water areas drain or flow toward a
central collector, such as a stream, river, or lake at a lower elevation.
303(d) list: Section 303(d) of the federal Clean Water Act requires Washington State to
periodically prepare a list of all surface waters in the state for which beneficial uses of the water
— such as for drinking, recreation, aquatic habitat, and industrial use – are impaired by
pollutants. These are water quality–limited estuaries, lakes, and streams that fall short of state
surface water quality standards and are not expected to improve within the next 2 years.
Copper and Zinc in Urban Runoff: Phase 2 67
Acronyms and Abbreviations
AAR Asphalt shingles with algae-resistant granules
AS Asphalt shingles, a roofing material
CNLNK Chain-link fencing
Cu Copper
DOC Dissolved organic carbon
Ecology Washington State Department of Ecology
EIM Environmental Information Management database
EPA U.S. Environmental Protection Agency
EPDM Ethylene propylene diene terpolymer
FBR Fiberboard
GIS Geographic information system
HVAC Heating, ventilation, and air conditioning
ICP-MS inductively coupled plasma mass spectrometry
LGT Light standard
MEL Manchester Environmental Laboratory
MPTFE Modified polytetrafluoroethylene
MT Metal roofing or siding material
NPDES National Pollutant Discharge Elimination System
NTU Nephelometric Turbidity Unit
QA Quality assurance
QAPP Quality assurance project plan
QC Quality control
PSTLA Puget Sound Toxics Loading Assessment (Norton et al. 2011a)
RAAR Roofing, asphalt shingles with algae-resistant granules
REPDM Roofing, ethylene propylene diene terpolymer
RMT Roofing, metal
RPD Relative percent difference
RTPO Roofing, thermoplastic polyolefin
S.C. Specific conductivity
SFBR Siding, fiberboard
SMT Siding, metal
SWD Siding, wood
S.U. Standard Units
TOC Total organic carbon
TPO Thermoplastic polyolefin
TSS Total suspended solids (see Glossary)
WAC Washington Administrative Code
WD Wood
WRIA Water Resource Inventory Area
Zn Zinc
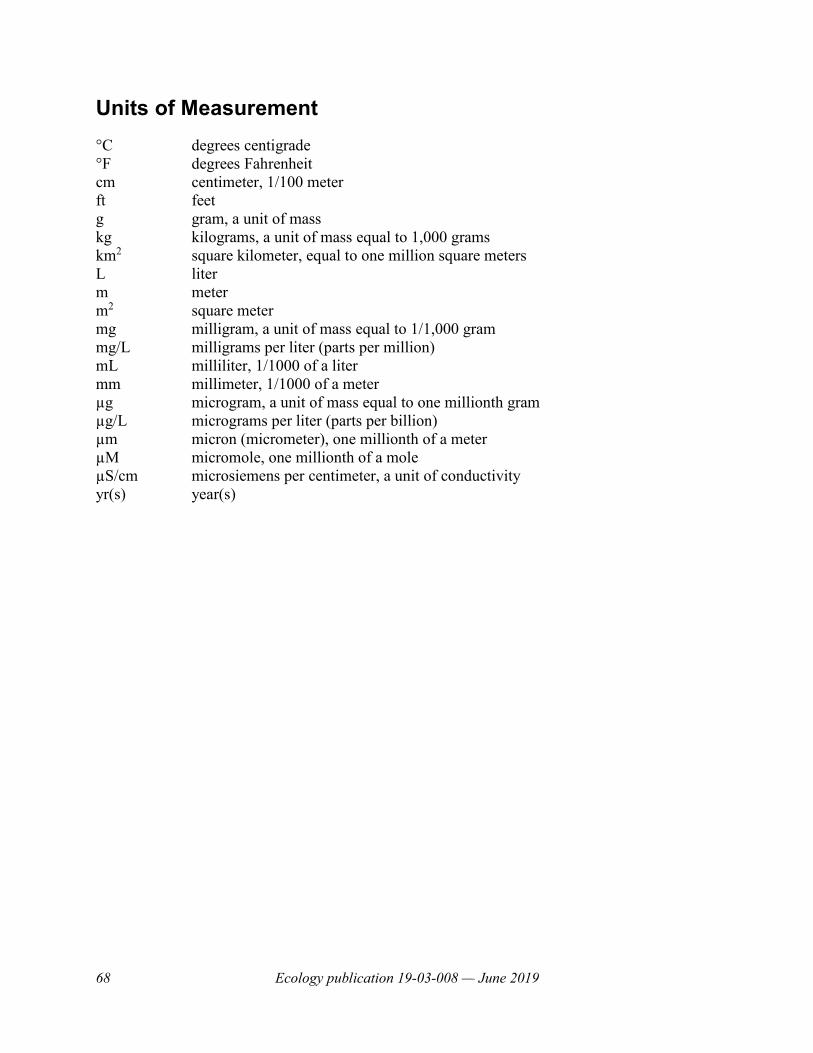
68 Ecology publication 19-03-008 — June 2019
Units of Measurement
°C degrees centigrade
°F degrees Fahrenheit
cm centimeter, 1/100 meter
ft feet
g gram, a unit of mass
kg kilograms, a unit of mass equal to 1,000 grams
km2 square kilometer, equal to one million square meters
L liter
m meter
m2 square meter
mg milligram, a unit of mass equal to 1/1,000 gram
mg/L milligrams per liter (parts per million)
mL milliliter, 1/1000 of a liter
mm millimeter, 1/1000 of a meter
µg microgram, a unit of mass equal to one millionth gram
µg/L micrograms per liter (parts per billion)
µm micron (micrometer), one millionth of a meter
µM micromole, one millionth of a mole
µS/cm microsiemens per centimeter, a unit of conductivity
yr(s) year(s)
Copper and Zinc in Urban Runoff: Phase 2 69
Appendices
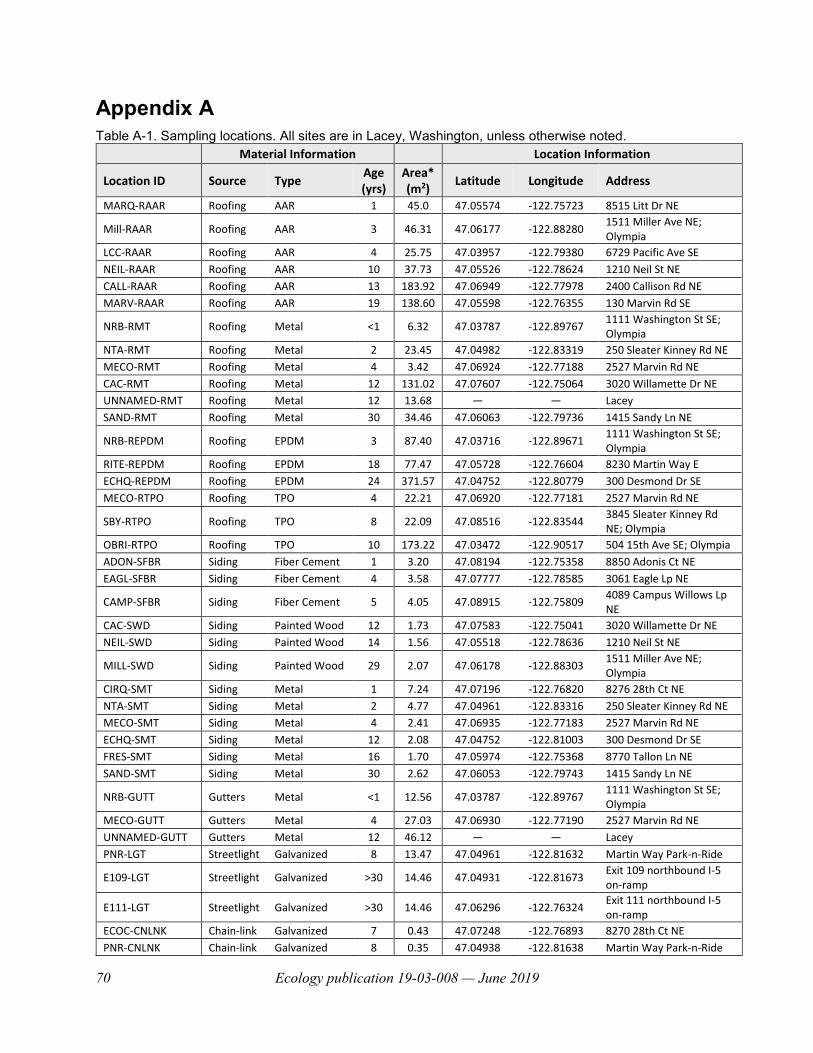
70 Ecology publication 19-03-008 — June 2019
Appendix A
Table A-1. Sampling locations. All sites are in Lacey, Washington, unless otherwise noted.
Material Information Location Information
Location ID Source Type Age (yrs)
Area* (m2)
Latitude Longitude Address
MARQ-RAAR Roofing AAR 1 45.0 47.05574 -122.75723 8515 Litt Dr NE
Mill-RAAR Roofing AAR 3 46.31 47.06177 -122.88280 1511 Miller Ave NE; Olympia
LCC-RAAR Roofing AAR 4 25.75 47.03957 -122.79380 6729 Pacific Ave SE
NEIL-RAAR Roofing AAR 10 37.73 47.05526 -122.78624 1210 Neil St NE
CALL-RAAR Roofing AAR 13 183.92 47.06949 -122.77978 2400 Callison Rd NE
MARV-RAAR Roofing AAR 19 138.60 47.05598 -122.76355 130 Marvin Rd SE
NRB-RMT Roofing Metal <1 6.32 47.03787 -122.89767 1111 Washington St SE; Olympia
NTA-RMT Roofing Metal 2 23.45 47.04982 -122.83319 250 Sleater Kinney Rd NE
MECO-RMT Roofing Metal 4 3.42 47.06924 -122.77188 2527 Marvin Rd NE
CAC-RMT Roofing Metal 12 131.02 47.07607 -122.75064 3020 Willamette Dr NE
UNNAMED-RMT Roofing Metal 12 13.68 — — Lacey
SAND-RMT Roofing Metal 30 34.46 47.06063 -122.79736 1415 Sandy Ln NE
NRB-REPDM Roofing EPDM 3 87.40 47.03716 -122.89671 1111 Washington St SE; Olympia
RITE-REPDM Roofing EPDM 18 77.47 47.05728 -122.76604 8230 Martin Way E
ECHQ-REPDM Roofing EPDM 24 371.57 47.04752 -122.80779 300 Desmond Dr SE
MECO-RTPO Roofing TPO 4 22.21 47.06920 -122.77181 2527 Marvin Rd NE
SBY-RTPO Roofing TPO 8 22.09 47.08516 -122.83544 3845 Sleater Kinney Rd NE; Olympia
OBRI-RTPO Roofing TPO 10 173.22 47.03472 -122.90517 504 15th Ave SE; Olympia
ADON-SFBR Siding Fiber Cement 1 3.20 47.08194 -122.75358 8850 Adonis Ct NE
EAGL-SFBR Siding Fiber Cement 4 3.58 47.07777 -122.78585 3061 Eagle Lp NE
CAMP-SFBR Siding Fiber Cement 5 4.05 47.08915 -122.75809 4089 Campus Willows Lp NE
CAC-SWD Siding Painted Wood 12 1.73 47.07583 -122.75041 3020 Willamette Dr NE
NEIL-SWD Siding Painted Wood 14 1.56 47.05518 -122.78636 1210 Neil St NE
MILL-SWD Siding Painted Wood 29 2.07 47.06178 -122.88303 1511 Miller Ave NE; Olympia
CIRQ-SMT Siding Metal 1 7.24 47.07196 -122.76820 8276 28th Ct NE
NTA-SMT Siding Metal 2 4.77 47.04961 -122.83316 250 Sleater Kinney Rd NE
MECO-SMT Siding Metal 4 2.41 47.06935 -122.77183 2527 Marvin Rd NE
ECHQ-SMT Siding Metal 12 2.08 47.04752 -122.81003 300 Desmond Dr SE
FRES-SMT Siding Metal 16 1.70 47.05974 -122.75368 8770 Tallon Ln NE
SAND-SMT Siding Metal 30 2.62 47.06053 -122.79743 1415 Sandy Ln NE
NRB-GUTT Gutters Metal <1 12.56 47.03787 -122.89767 1111 Washington St SE; Olympia
MECO-GUTT Gutters Metal 4 27.03 47.06930 -122.77190 2527 Marvin Rd NE
UNNAMED-GUTT Gutters Metal 12 46.12 — — Lacey
PNR-LGT Streetlight Galvanized 8 13.47 47.04961 -122.81632 Martin Way Park-n-Ride
E109-LGT Streetlight Galvanized >30 14.46 47.04931 -122.81673 Exit 109 northbound I-5 on-ramp
E111-LGT Streetlight Galvanized >30 14.46 47.06296 -122.76324 Exit 111 northbound I-5 on-ramp
ECOC-CNLNK Chain-link Galvanized 7 0.43 47.07248 -122.76893 8270 28th Ct NE
PNR-CNLNK Chain-link Galvanized 8 0.35 47.04938 -122.81638 Martin Way Park-n-Ride
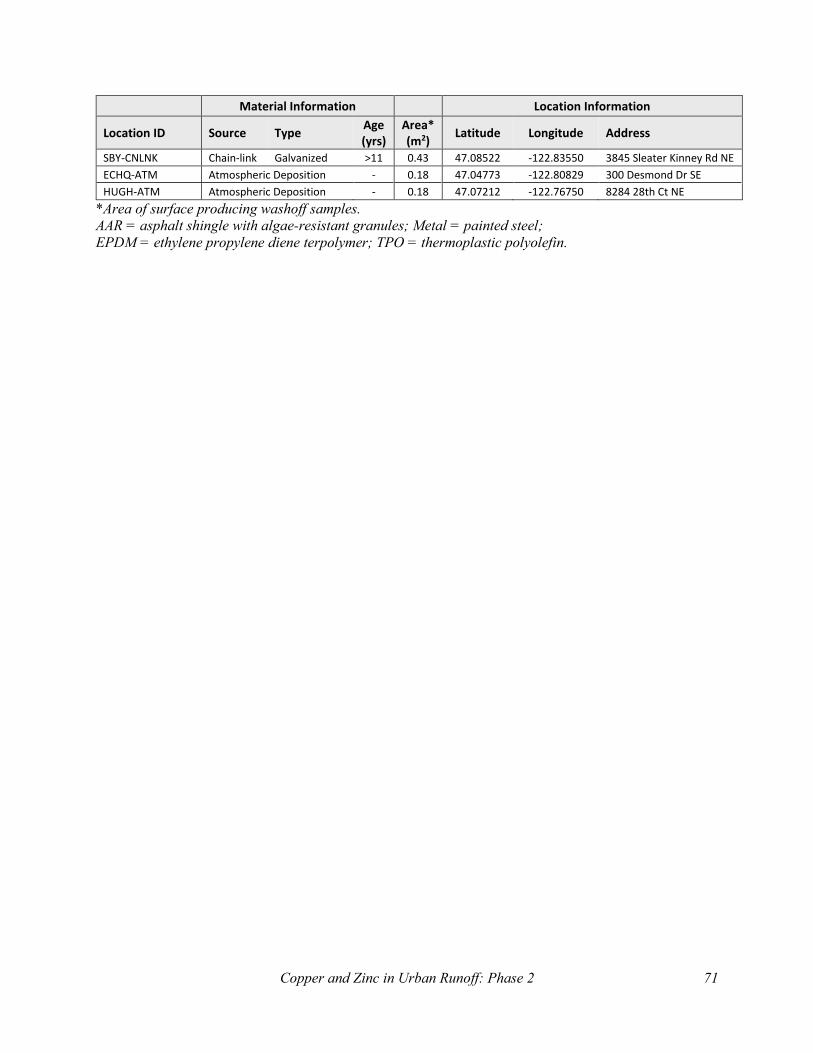
Copper and Zinc in Urban Runoff: Phase 2 71
Material Information Location Information
Location ID Source Type Age (yrs)
Area* (m2)
Latitude Longitude Address
SBY-CNLNK Chain-link Galvanized >11 0.43 47.08522 -122.83550 3845 Sleater Kinney Rd NE
ECHQ-ATM Atmospheric Deposition - 0.18 47.04773 -122.80829 300 Desmond Dr SE
HUGH-ATM Atmospheric Deposition - 0.18 47.07212 -122.76750 8284 28th Ct NE
*Area of surface producing washoff samples.
AAR = asphalt shingle with algae-resistant granules; Metal = painted steel;
EPDM = ethylene propylene diene terpolymer; TPO = thermoplastic polyolefin.
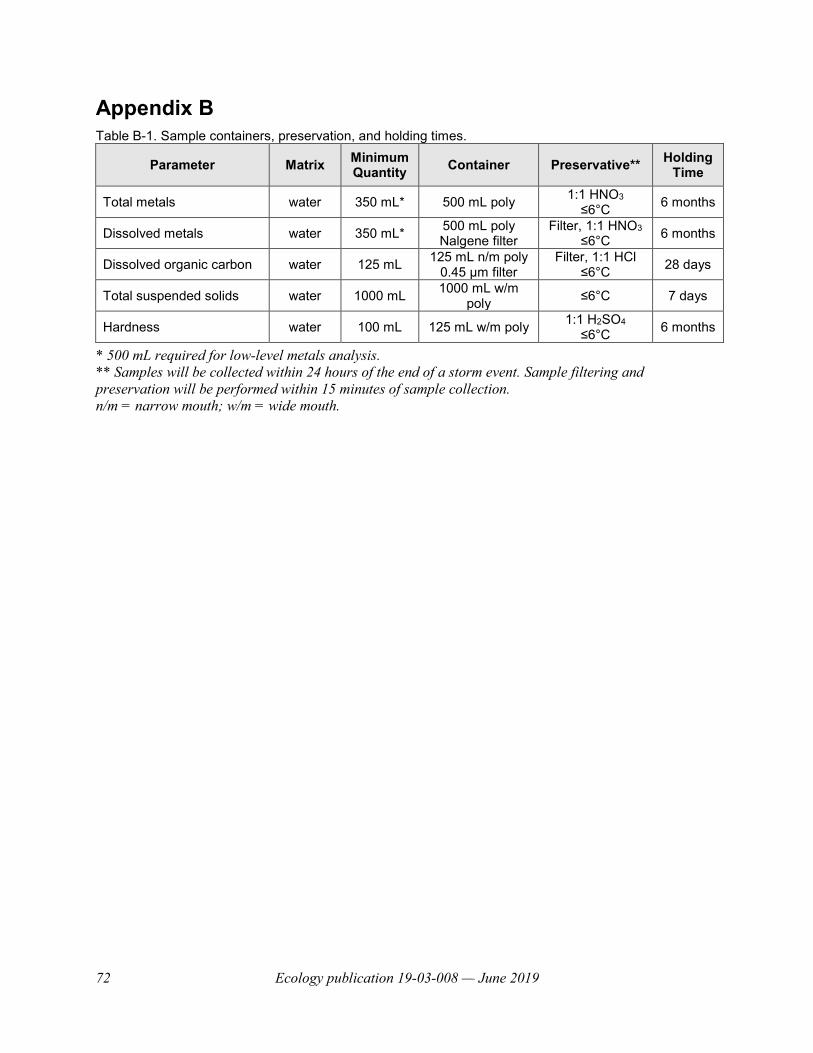
72 Ecology publication 19-03-008 — June 2019
Appendix B
Table B-1. Sample containers, preservation, and holding times.
Parameter Matrix Minimum Quantity
Container Preservative** Holding
Time
Total metals water 350 mL* 500 mL poly 1:1 HNO3
≤6°C 6 months
Dissolved metals water 350 mL* 500 mL poly Nalgene filter
Filter, 1:1 HNO3 ≤6°C
6 months
Dissolved organic carbon water 125 mL 125 mL n/m poly
0.45 µm filter Filter, 1:1 HCl
≤6°C 28 days
Total suspended solids water 1000 mL 1000 mL w/m
poly ≤6°C 7 days
Hardness water 100 mL 125 mL w/m poly 1:1 H2SO4
≤6°C 6 months
* 500 mL required for low-level metals analysis.
** Samples will be collected within 24 hours of the end of a storm event. Sample filtering and
preservation will be performed within 15 minutes of sample collection.
n/m = narrow mouth; w/m = wide mouth.
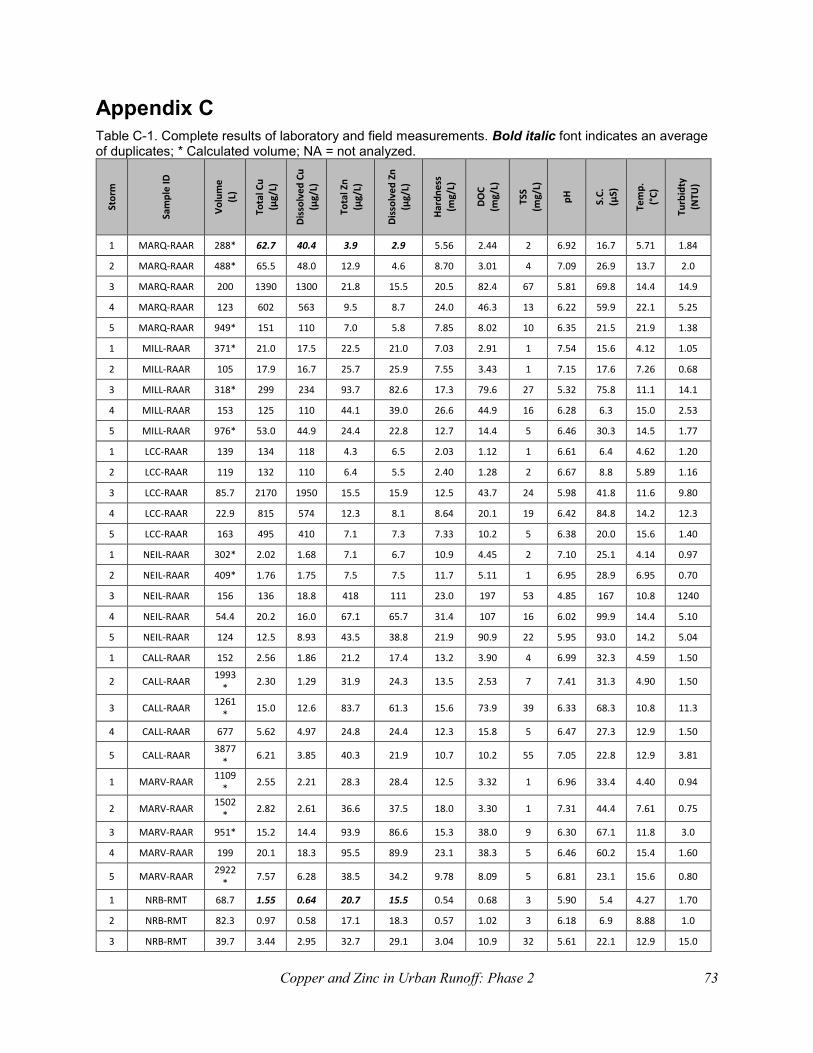
Copper and Zinc in Urban Runoff: Phase 2 73
Appendix C
Table C-1. Complete results of laboratory and field measurements. Bold italic font indicates an average of duplicates; * Calculated volume; NA = not analyzed.
Sto
rm
Sam
ple
ID
Vo
lum
e
(L)
Tota
l Cu
(µ
g/L)
Dis
solv
ed
Cu
(µ
g/L)
Tota
l Zn
(µ
g/L)
Dis
solv
ed
Zn
(µ
g/L)
Har
dn
ess
(mg/
L)
DO
C
(mg/
L)
TSS
(mg/
L)
pH
S.C
.
(µS)
Tem
p.
(°C
)
Turb
idty
(N
TU)
1 MARQ-RAAR 288* 62.7 40.4 3.9 2.9 5.56 2.44 2 6.92 16.7 5.71 1.84
2 MARQ-RAAR 488* 65.5 48.0 12.9 4.6 8.70 3.01 4 7.09 26.9 13.7 2.0
3 MARQ-RAAR 200 1390 1300 21.8 15.5 20.5 82.4 67 5.81 69.8 14.4 14.9
4 MARQ-RAAR 123 602 563 9.5 8.7 24.0 46.3 13 6.22 59.9 22.1 5.25
5 MARQ-RAAR 949* 151 110 7.0 5.8 7.85 8.02 10 6.35 21.5 21.9 1.38
1 MILL-RAAR 371* 21.0 17.5 22.5 21.0 7.03 2.91 1 7.54 15.6 4.12 1.05
2 MILL-RAAR 105 17.9 16.7 25.7 25.9 7.55 3.43 1 7.15 17.6 7.26 0.68
3 MILL-RAAR 318* 299 234 93.7 82.6 17.3 79.6 27 5.32 75.8 11.1 14.1
4 MILL-RAAR 153 125 110 44.1 39.0 26.6 44.9 16 6.28 6.3 15.0 2.53
5 MILL-RAAR 976* 53.0 44.9 24.4 22.8 12.7 14.4 5 6.46 30.3 14.5 1.77
1 LCC-RAAR 139 134 118 4.3 6.5 2.03 1.12 1 6.61 6.4 4.62 1.20
2 LCC-RAAR 119 132 110 6.4 5.5 2.40 1.28 2 6.67 8.8 5.89 1.16
3 LCC-RAAR 85.7 2170 1950 15.5 15.9 12.5 43.7 24 5.98 41.8 11.6 9.80
4 LCC-RAAR 22.9 815 574 12.3 8.1 8.64 20.1 19 6.42 84.8 14.2 12.3
5 LCC-RAAR 163 495 410 7.1 7.3 7.33 10.2 5 6.38 20.0 15.6 1.40
1 NEIL-RAAR 302* 2.02 1.68 7.1 6.7 10.9 4.45 2 7.10 25.1 4.14 0.97
2 NEIL-RAAR 409* 1.76 1.75 7.5 7.5 11.7 5.11 1 6.95 28.9 6.95 0.70
3 NEIL-RAAR 156 136 18.8 418 111 23.0 197 53 4.85 167 10.8 1240
4 NEIL-RAAR 54.4 20.2 16.0 67.1 65.7 31.4 107 16 6.02 99.9 14.4 5.10
5 NEIL-RAAR 124 12.5 8.93 43.5 38.8 21.9 90.9 22 5.95 93.0 14.2 5.04
1 CALL-RAAR 152 2.56 1.86 21.2 17.4 13.2 3.90 4 6.99 32.3 4.59 1.50
2 CALL-RAAR 1993
* 2.30 1.29 31.9 24.3 13.5 2.53 7 7.41 31.3 4.90 1.50
3 CALL-RAAR 1261
* 15.0 12.6 83.7 61.3 15.6 73.9 39 6.33 68.3 10.8 11.3
4 CALL-RAAR 677 5.62 4.97 24.8 24.4 12.3 15.8 5 6.47 27.3 12.9 1.50
5 CALL-RAAR 3877
* 6.21 3.85 40.3 21.9 10.7 10.2 55 7.05 22.8 12.9 3.81
1 MARV-RAAR 1109
* 2.55 2.21 28.3 28.4 12.5 3.32 1 6.96 33.4 4.40 0.94
2 MARV-RAAR 1502
* 2.82 2.61 36.6 37.5 18.0 3.30 1 7.31 44.4 7.61 0.75
3 MARV-RAAR 951* 15.2 14.4 93.9 86.6 15.3 38.0 9 6.30 67.1 11.8 3.0
4 MARV-RAAR 199 20.1 18.3 95.5 89.9 23.1 38.3 5 6.46 60.2 15.4 1.60
5 MARV-RAAR 2922
* 7.57 6.28 38.5 34.2 9.78 8.09 5 6.81 23.1 15.6 0.80
1 NRB-RMT 68.7 1.55 0.64 20.7 15.5 0.54 0.68 3 5.90 5.4 4.27 1.70
2 NRB-RMT 82.3 0.97 0.58 17.1 18.3 0.57 1.02 3 6.18 6.9 8.88 1.0
3 NRB-RMT 39.7 3.44 2.95 32.7 29.1 3.04 10.9 32 5.61 22.1 12.9 15.0
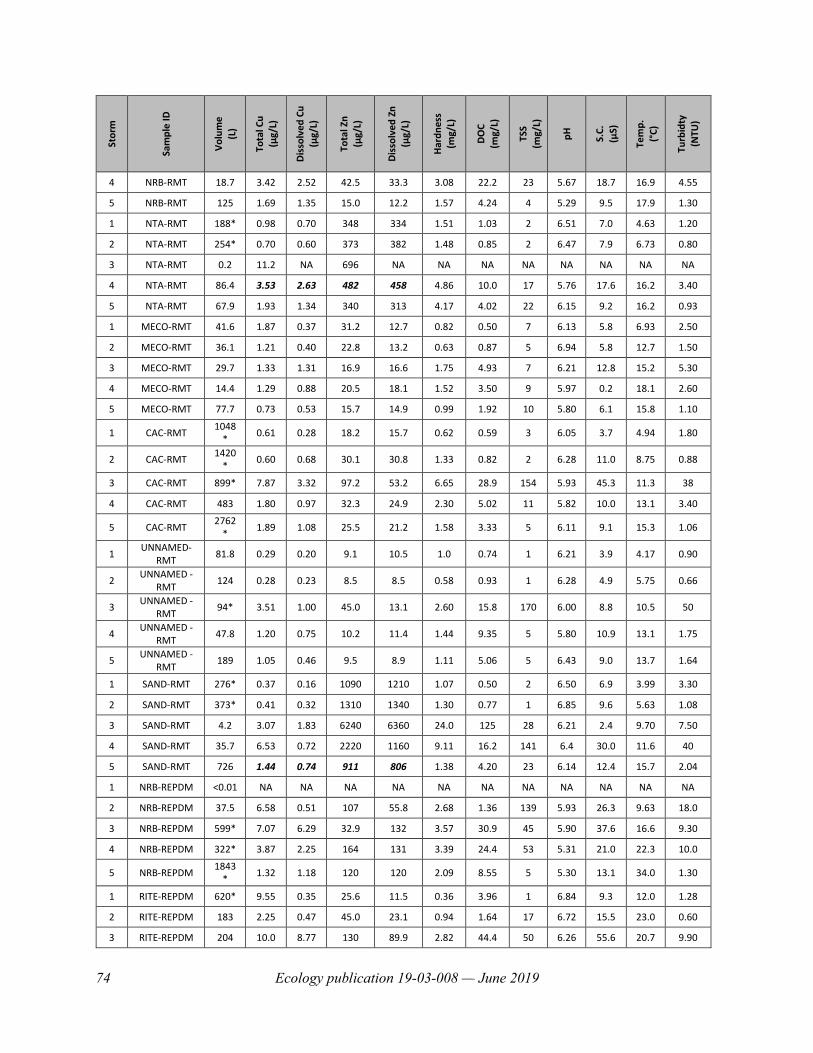
74 Ecology publication 19-03-008 — June 2019
Sto
rm
Sam
ple
ID
Vo
lum
e
(L)
Tota
l Cu
(µ
g/L)
Dis
solv
ed
Cu
(µ
g/L)
Tota
l Zn
(µ
g/L)
Dis
solv
ed
Zn
(µ
g/L)
Har
dn
ess
(mg/
L)
DO
C
(mg/
L)
TSS
(mg/
L)
pH
S.C
.
(µS)
Tem
p.
(°C
)
Turb
idty
(N
TU)
4 NRB-RMT 18.7 3.42 2.52 42.5 33.3 3.08 22.2 23 5.67 18.7 16.9 4.55
5 NRB-RMT 125 1.69 1.35 15.0 12.2 1.57 4.24 4 5.29 9.5 17.9 1.30
1 NTA-RMT 188* 0.98 0.70 348 334 1.51 1.03 2 6.51 7.0 4.63 1.20
2 NTA-RMT 254* 0.70 0.60 373 382 1.48 0.85 2 6.47 7.9 6.73 0.80
3 NTA-RMT 0.2 11.2 NA 696 NA NA NA NA NA NA NA NA
4 NTA-RMT 86.4 3.53 2.63 482 458 4.86 10.0 17 5.76 17.6 16.2 3.40
5 NTA-RMT 67.9 1.93 1.34 340 313 4.17 4.02 22 6.15 9.2 16.2 0.93
1 MECO-RMT 41.6 1.87 0.37 31.2 12.7 0.82 0.50 7 6.13 5.8 6.93 2.50
2 MECO-RMT 36.1 1.21 0.40 22.8 13.2 0.63 0.87 5 6.94 5.8 12.7 1.50
3 MECO-RMT 29.7 1.33 1.31 16.9 16.6 1.75 4.93 7 6.21 12.8 15.2 5.30
4 MECO-RMT 14.4 1.29 0.88 20.5 18.1 1.52 3.50 9 5.97 0.2 18.1 2.60
5 MECO-RMT 77.7 0.73 0.53 15.7 14.9 0.99 1.92 10 5.80 6.1 15.8 1.10
1 CAC-RMT 1048
* 0.61 0.28 18.2 15.7 0.62 0.59 3 6.05 3.7 4.94 1.80
2 CAC-RMT 1420
* 0.60 0.68 30.1 30.8 1.33 0.82 2 6.28 11.0 8.75 0.88
3 CAC-RMT 899* 7.87 3.32 97.2 53.2 6.65 28.9 154 5.93 45.3 11.3 38
4 CAC-RMT 483 1.80 0.97 32.3 24.9 2.30 5.02 11 5.82 10.0 13.1 3.40
5 CAC-RMT 2762
* 1.89 1.08 25.5 21.2 1.58 3.33 5 6.11 9.1 15.3 1.06
1 UNNAMED-
RMT 81.8 0.29 0.20 9.1 10.5 1.0 0.74 1 6.21 3.9 4.17 0.90
2 UNNAMED -
RMT 124 0.28 0.23 8.5 8.5 0.58 0.93 1 6.28 4.9 5.75 0.66
3 UNNAMED -
RMT 94* 3.51 1.00 45.0 13.1 2.60 15.8 170 6.00 8.8 10.5 50
4 UNNAMED -
RMT 47.8 1.20 0.75 10.2 11.4 1.44 9.35 5 5.80 10.9 13.1 1.75
5 UNNAMED -
RMT 189 1.05 0.46 9.5 8.9 1.11 5.06 5 6.43 9.0 13.7 1.64
1 SAND-RMT 276* 0.37 0.16 1090 1210 1.07 0.50 2 6.50 6.9 3.99 3.30
2 SAND-RMT 373* 0.41 0.32 1310 1340 1.30 0.77 1 6.85 9.6 5.63 1.08
3 SAND-RMT 4.2 3.07 1.83 6240 6360 24.0 125 28 6.21 2.4 9.70 7.50
4 SAND-RMT 35.7 6.53 0.72 2220 1160 9.11 16.2 141 6.4 30.0 11.6 40
5 SAND-RMT 726 1.44 0.74 911 806 1.38 4.20 23 6.14 12.4 15.7 2.04
1 NRB-REPDM <0.01 NA NA NA NA NA NA NA NA NA NA NA
2 NRB-REPDM 37.5 6.58 0.51 107 55.8 2.68 1.36 139 5.93 26.3 9.63 18.0
3 NRB-REPDM 599* 7.07 6.29 32.9 132 3.57 30.9 45 5.90 37.6 16.6 9.30
4 NRB-REPDM 322* 3.87 2.25 164 131 3.39 24.4 53 5.31 21.0 22.3 10.0
5 NRB-REPDM 1843
* 1.32 1.18 120 120 2.09 8.55 5 5.30 13.1 34.0 1.30
1 RITE-REPDM 620* 9.55 0.35 25.6 11.5 0.36 3.96 1 6.84 9.3 12.0 1.28
2 RITE-REPDM 183 2.25 0.47 45.0 23.1 0.94 1.64 17 6.72 15.5 23.0 0.60
3 RITE-REPDM 204 10.0 8.77 130 89.9 2.82 44.4 50 6.26 55.6 20.7 9.90
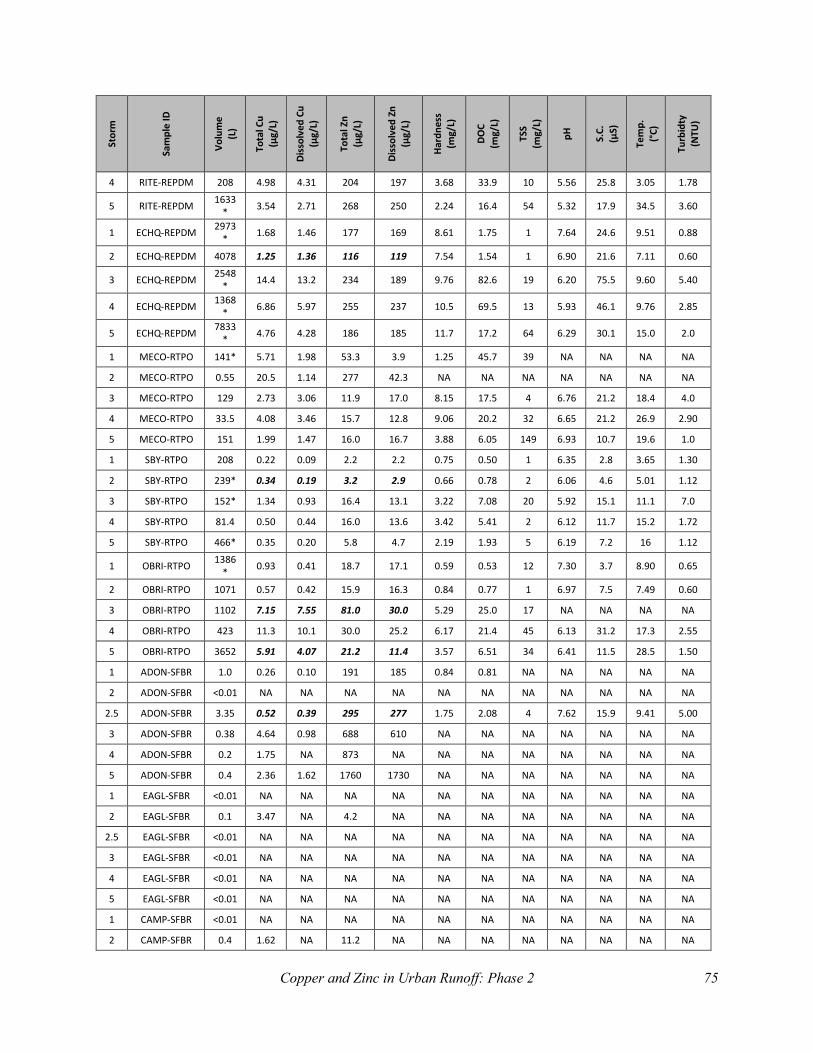
Copper and Zinc in Urban Runoff: Phase 2 75
Sto
rm
Sam
ple
ID
Vo
lum
e
(L)
Tota
l Cu
(µ
g/L)
Dis
solv
ed
Cu
(µ
g/L)
Tota
l Zn
(µ
g/L)
Dis
solv
ed
Zn
(µ
g/L)
Har
dn
ess
(mg/
L)
DO
C
(mg/
L)
TSS
(mg/
L)
pH
S.C
.
(µS)
Tem
p.
(°C
)
Turb
idty
(N
TU)
4 RITE-REPDM 208 4.98 4.31 204 197 3.68 33.9 10 5.56 25.8 3.05 1.78
5 RITE-REPDM 1633
* 3.54 2.71 268 250 2.24 16.4 54 5.32 17.9 34.5 3.60
1 ECHQ-REPDM 2973
* 1.68 1.46 177 169 8.61 1.75 1 7.64 24.6 9.51 0.88
2 ECHQ-REPDM 4078 1.25 1.36 116 119 7.54 1.54 1 6.90 21.6 7.11 0.60
3 ECHQ-REPDM 2548
* 14.4 13.2 234 189 9.76 82.6 19 6.20 75.5 9.60 5.40
4 ECHQ-REPDM 1368
* 6.86 5.97 255 237 10.5 69.5 13 5.93 46.1 9.76 2.85
5 ECHQ-REPDM 7833
* 4.76 4.28 186 185 11.7 17.2 64 6.29 30.1 15.0 2.0
1 MECO-RTPO 141* 5.71 1.98 53.3 3.9 1.25 45.7 39 NA NA NA NA
2 MECO-RTPO 0.55 20.5 1.14 277 42.3 NA NA NA NA NA NA NA
3 MECO-RTPO 129 2.73 3.06 11.9 17.0 8.15 17.5 4 6.76 21.2 18.4 4.0
4 MECO-RTPO 33.5 4.08 3.46 15.7 12.8 9.06 20.2 32 6.65 21.2 26.9 2.90
5 MECO-RTPO 151 1.99 1.47 16.0 16.7 3.88 6.05 149 6.93 10.7 19.6 1.0
1 SBY-RTPO 208 0.22 0.09 2.2 2.2 0.75 0.50 1 6.35 2.8 3.65 1.30
2 SBY-RTPO 239* 0.34 0.19 3.2 2.9 0.66 0.78 2 6.06 4.6 5.01 1.12
3 SBY-RTPO 152* 1.34 0.93 16.4 13.1 3.22 7.08 20 5.92 15.1 11.1 7.0
4 SBY-RTPO 81.4 0.50 0.44 16.0 13.6 3.42 5.41 2 6.12 11.7 15.2 1.72
5 SBY-RTPO 466* 0.35 0.20 5.8 4.7 2.19 1.93 5 6.19 7.2 16 1.12
1 OBRI-RTPO 1386
* 0.93 0.41 18.7 17.1 0.59 0.53 12 7.30 3.7 8.90 0.65
2 OBRI-RTPO 1071 0.57 0.42 15.9 16.3 0.84 0.77 1 6.97 7.5 7.49 0.60
3 OBRI-RTPO 1102 7.15 7.55 81.0 30.0 5.29 25.0 17 NA NA NA NA
4 OBRI-RTPO 423 11.3 10.1 30.0 25.2 6.17 21.4 45 6.13 31.2 17.3 2.55
5 OBRI-RTPO 3652 5.91 4.07 21.2 11.4 3.57 6.51 34 6.41 11.5 28.5 1.50
1 ADON-SFBR 1.0 0.26 0.10 191 185 0.84 0.81 NA NA NA NA NA
2 ADON-SFBR <0.01 NA NA NA NA NA NA NA NA NA NA NA
2.5 ADON-SFBR 3.35 0.52 0.39 295 277 1.75 2.08 4 7.62 15.9 9.41 5.00
3 ADON-SFBR 0.38 4.64 0.98 688 610 NA NA NA NA NA NA NA
4 ADON-SFBR 0.2 1.75 NA 873 NA NA NA NA NA NA NA NA
5 ADON-SFBR 0.4 2.36 1.62 1760 1730 NA NA NA NA NA NA NA
1 EAGL-SFBR <0.01 NA NA NA NA NA NA NA NA NA NA NA
2 EAGL-SFBR 0.1 3.47 NA 4.2 NA NA NA NA NA NA NA NA
2.5 EAGL-SFBR <0.01 NA NA NA NA NA NA NA NA NA NA NA
3 EAGL-SFBR <0.01 NA NA NA NA NA NA NA NA NA NA NA
4 EAGL-SFBR <0.01 NA NA NA NA NA NA NA NA NA NA NA
5 EAGL-SFBR <0.01 NA NA NA NA NA NA NA NA NA NA NA
1 CAMP-SFBR <0.01 NA NA NA NA NA NA NA NA NA NA NA
2 CAMP-SFBR 0.4 1.62 NA 11.2 NA NA NA NA NA NA NA NA
76 Ecology publication 19-03-008 — June 2019
Sto
rm
Sam
ple
ID
Vo
lum
e
(L)
Tota
l Cu
(µ
g/L)
Dis
solv
ed
Cu
(µ
g/L)
Tota
l Zn
(µ
g/L)
Dis
solv
ed
Zn
(µ
g/L)
Har
dn
ess
(mg/
L)
DO
C
(mg/
L)
TSS
(mg/
L)
pH
S.C
.
(µS)
Tem
p.
(°C
)
Turb
idty
(N
TU)
2.5 CAMP-SFBR 0.35 17.1 3.81 40.2 26.9 NA NA NA NA NA NA NA
3 CAMP-SFBR 0.04 NA NA NA NA NA NA NA NA NA NA NA
4 CAMP-SFBR 0.02 90.0 NA 79.4 NA NA NA NA NA NA NA NA
5 CAMP-SFBR 0.4 6.48 4.39 184 143 NA NA NA NA NA NA NA
1 CAC-SWD <0.01 NA NA NA NA NA NA NA NA NA NA NA
2 CAC-SWD <0.01 NA NA NA NA NA NA NA NA NA NA NA
2.5 CAC-SWD 0.03 NA NA NA NA NA NA NA NA NA NA NA
3 CAC-SWD <0.01 NA NA NA NA NA NA NA NA NA NA NA
4 CAC-SWD <0.01 NA NA NA NA NA NA NA NA NA NA NA
5 CAC-SWD <0.01 NA NA NA NA NA NA NA NA NA NA NA
1 NEIL-SWD <0.01 NA NA NA NA NA NA NA NA NA NA NA
2 NEIL-SWD 0.02 NA NA NA NA NA NA NA NA NA NA NA
2.5 NEIL-SWD 0.1 5.04 NA 56.1 NA NA NA NA NA NA NA NA
3 NEIL-SWD <0.01 NA NA NA NA NA NA NA NA NA NA NA
4 NEIL-SWD <0.01 NA NA NA NA NA NA NA NA NA NA NA
5 NEIL-SWD <0.01 NA NA NA NA NA NA NA NA NA NA NA
1 MILL-SWD <0.01 NA NA NA NA NA NA NA NA NA NA NA
2 MILL-SWD <0.01 NA NA NA NA NA NA NA NA NA NA NA
2.5 MILL-SWD 0.2 20.8 NA 338 NA NA NA NA NA NA NA NA
3 MILL-SWD 0.05 NA NA NA NA NA NA NA NA NA NA NA
4 MILL-SWD <0.01 NA NA NA NA NA NA NA NA NA NA NA
5 MILL-SWD 0.4 7.21 5.98 274 249 NA NA NA NA NA NA NA
1 CIRQ-SMT 0.2 0.93 NA 109 NA NA NA NA NA NA NA NA
2 CIRQ-SMT <0.01 NA NA NA NA NA NA NA NA NA NA NA
2.5 CIRQ-SMT 2.3 0.69 0.69 46.5 50.7 1.43 1.90 8 NA NA NA NA
3 CIRQ-SMT 0.4 2.13 1.76 67.2 43.9 NA NA NA NA NA NA NA
4 CIRQ-SMT 0.2 2.84 NA 82.4 NA NA NA NA NA NA NA NA
5 CIRQ-SMT 3.7 0.94 0.77 49.6 46.6 1.09 2.14 6 6.50 9.6 21.6 3.40
1 NTA-SMT 0.4 1.58 NA 107 NA NA NA NA NA NA NA NA
2 NTA-SMT 0.1 6.50 NA 210 NA NA NA NA NA NA NA NA
2.5 NTA-SMT 2.15 4.27 0.82 176 107 2.40 2.77 123 NA NA NA NA
3 NTA-SMT 0.2 4.76 NA 118 NA NA NA NA NA NA NA NA
4 NTA-SMT 0.03 26.7 NA 446 NA NA NA NA NA NA NA NA
5 NTA-SMT 0.9 6.62 2.70 228 120 4.81 NA NA NA NA NA NA
1 MECO-SMT <0.01 NA NA NA NA NA NA NA NA NA NA NA
2 MECO-SMT 0.15 12.2 NA 285 NA NA NA NA NA NA NA NA
2.5 MECO-SMT 0.55 40.6 39.2 594 541 NA NA NA NA NA NA NA
3 MECO-SMT <0.01 NA NA NA NA NA NA NA NA NA NA NA
Copper and Zinc in Urban Runoff: Phase 2 77
Sto
rm
Sam
ple
ID
Vo
lum
e
(L)
Tota
l Cu
(µ
g/L)
Dis
solv
ed
Cu
(µ
g/L)
Tota
l Zn
(µ
g/L)
Dis
solv
ed
Zn
(µ
g/L)
Har
dn
ess
(mg/
L)
DO
C
(mg/
L)
TSS
(mg/
L)
pH
S.C
.
(µS)
Tem
p.
(°C
)
Turb
idty
(N
TU)
4 MECO-SMT <0.01 NA NA NA NA NA NA NA NA NA NA NA
5 MECO-SMT 0.7 44.1 31.6 1040 864 28.4 NA NA NA NA NA NA
1 ECHQ-SMT 0.35 0.85 NA 11.7 NA NA NA NA NA NA NA NA
2 ECHQ-SMT 0.1 3.63 NA 21.7 NA NA NA NA NA NA NA NA
2.5 ECHQ-SMT 2.6 2.33 0.94 19.3 10.1 2.35 4.50 25 NA NA NA NA
3 ECHQ-SMT 0.15 11.9 NA 95.4 NA NA NA NA NA NA NA NA
4 ECHQ-SMT 0.03 11.3 NA 79.0 NA NA NA NA NA NA NA NA
5 ECHQ-SMT 0.2 7.15 NA 34.0 NA NA NA NA NA NA NA NA
1 FRES-SMT <0.01 NA NA NA NA NA NA NA NA NA NA NA
2 FRES-SMT <0.01 NA NA NA NA NA NA NA NA NA NA NA
2.5 FRES-SMT 0.1 17.1 NA 99.2 NA NA NA NA NA NA NA NA
3 FRES-SMT <0.01 NA NA NA NA NA NA NA NA NA NA NA
4 FRES-SMT <0.01 NA NA NA NA NA NA NA NA NA NA NA
5 FRES-SMT <0.01 NA NA NA NA NA NA NA NA NA NA NA
1 SAND-SMT 1.43 0.89 0.50 160 152 0.74 1.16 8 NA NA NA NA
2 SAND-SMT 0.85 1.69 0.91 325 326 1.78 2.82 NA NA NA NA NA
2.5 SAND-SMT 4.25 0.88 0.88 261 259 0.80 1.79 3 NA NA NA NA
3 SAND-SMT 0.63 5.82 4.32 744 599 4.89 NA NA NA NA NA NA
4 SAND-SMT 0.2 9.73 NA 2040 NA NA NA NA NA NA NA NA
5 SAND-SMT 1.4 4.93 3.61 441 413 4.51 18.2 NA 7.05 23.6 14.4 3.25
1 NRB-GUTT 156 1.21 0.90 39.5 37.8 0.80 1.17 1 6.60 6.2 4.93 0.98
2 NRB-GUTT 184 1.14 0.95 39.2 38.3 0.89 1.84 1 5.88 6.2 9.80 0.62
3 NRB-GUTT 71.6 3.93 3.08 79.5 60.7 2.90 6.95 6 5.92 15.1 13.7 6.0
4 NRB-GUTT 45.3 4.04 3.58 70.0 68.1 2.37 10.6 2 6.09 16.8 18.4 1.02
5 NRB-GUTT 265* 1.51 1.29 46.2 44.7 1.69 5.72 3 5.76 19.8 21.1 1.30
1 MECO-GUTT 182 0.65 0.34 21.1 21.0 0.52 0.50 1 5.87 5.3 5.32 1.05
2 MECO-GUTT 293* 0.64 0.44 22.9 22.5 0.51 0.58 1 6.18 4.7 11.6 0.56
3 MECO-GUTT 155 1.81 1.64 26.8 27.0 1.47 5.02 2 5.79 12.0 15.3 3.90
4 MECO-GUTT 88.6 2.02 1.63 28.4 26.5 1.30 3.92 2 5.92 8.4 16.7 0.92
5 MECO-GUTT 570* 0.94 0.73 20.0 20.7 0.73 1.36 2 5.65 5.4 16.3 0.70
1 UNNAMED -
GUTT 370* 0.38 0.24 13.5 13.5 0.96 0.89 1 6.11 4.7 3.84 0.82
2 UNNAMED -
GUTT 500* 0.41 0.28 19.4 17.2 0.99 0.92 1 6.09 6.3 5.75 0.54
3 UNNAMED -
GUTT 316* 3.38 2.11 66.1 53.6 2.63 48.8 56 5.37 48.7 10.4 15.7
4 UNNAMED -
GUTT 170 1.73 1.13 30.9 26.7 1.92 15.5 14 5.67 18.3 13.4 3.95
5 UNNAMED -
GUTT 972* 1.79 0.54 26.9 17.2 1.78 4.80 17 6.09 7.8 13.3 4.10
1 PNR-LGT 3.0 2.30 1.54 8780 8420 0.76 4.41 NA NA NA NA NA
78 Ecology publication 19-03-008 — June 2019
Sto
rm
Sam
ple
ID
Vo
lum
e
(L)
Tota
l Cu
(µ
g/L)
Dis
solv
ed
Cu
(µ
g/L)
Tota
l Zn
(µ
g/L)
Dis
solv
ed
Zn
(µ
g/L)
Har
dn
ess
(mg/
L)
DO
C
(mg/
L)
TSS
(mg/
L)
pH
S.C
.
(µS)
Tem
p.
(°C
)
Turb
idty
(N
TU)
2 PNR-LGT 2.9 1.52 1.07 7680 7800 0.53 1.95 4 NA NA NA NA
3 PNR-LGT 1.95 4.14 3.13 9700 8350 2.32 8.22 34 NA NA NA NA
4 PNR-LGT 0.9 4.48 3.92 12200 12500 1.91 8.86 NA NA NA NA NA
5 PNR-LGT 2.8 4.19 3.75 9660 9470 1.46 7.34 2 7.10 48.2 19.4 1.05
1 E109-LGT 6.7 3.75 1.33 11800 11100 1.27 1.93 9 6.85 39.7 3.66 2.30
2 E109-LGT 9.0 3.93 2.04 10300 9910 1.10 2.0 10 7.00 46.2 6.48 2.80
3 E109-LGT 3.5 8.45 4.12 16500 15100 2.68 10.5 35 6.93 71.0 10.9 9.80
4 E109-LGT 1.4 7.20 5.12 21600 22900 3.58 13.8 43 NA NA NA NA
5 E109-LGT 7.4 4.96 3.61 14700 14900 1.59 6.01 7 6.65 58.4 13.9 0.63
1 E111-LGT 11.6 2.74 1.61 8880 8820 0.83 2.18 5 6.72 32.5 6.06 1.77
2 E111-LGT 17.2 1.42 0.80 8940 8950 0.67 1.76 3 6.91 39.6 11.5 1.15
3 E111-LGT <0.01 NA NA NA NA NA NA NA NA NA NA NA
4 E111-LGT 1.5 9.14 5.59 22500 22100 2.07 13.1 18 NA NA NA NA
5 E111-LGT 10.3 4.21 2.05 12000 12100 0.92 3.23 7 6.55 46.2 20.4 1.80
1 ECOC-CNLNK 0.5 0.55 0.38 7250 7310 NA NA NA NA NA NA NA
2 ECOC-CNLNK 1.05 2.20 1.17 3880 3790 2.42 6.16 NA NA NA NA NA
3 ECOC-CNLNK 0.2 3.40 NA 7400 NA NA NA NA NA NA NA NA
4 ECOC-CNLNK 0.1 24.9 NA 21800 NA NA NA NA NA NA NA NA
5 ECOC-CNLNK 0.4 15.1 10.8 14300 14100 NA NA NA NA NA NA NA
1 PNR-CNLNK 0.15 12.8 NA 13300 NA NA NA NA NA NA NA NA
2 PNR-CNLNK 0.1 14.4 NA 9890 NA NA NA NA NA NA NA NA
3 PNR-CNLNK 0.05 NA NA NA NA NA NA NA NA NA NA NA
4 PNR-CNLNK <0.01 NA NA NA NA NA NA NA NA NA NA NA
5 PNR-CNLNK 1.0 11.2 6.92 4020 3470 129 1580 NA 7.44 5451 19.2 25.6
1 SBY-CNLNK 0.75 2.33 0.79 7310 6900 2.38 NA NA NA NA NA NA
2 SBY-CNLNK 0.7 1.21 0.72 7700 7500 0.91 NA NA NA NA NA NA
3 SBY-CNLNK 0.63 2.66 2.09 6630 7550 4.77 NA NA NA NA NA NA
4 SBY-CNLNK 0.1 4.11 NA 17300 NA NA NA NA NA NA NA NA
5 SBY-CNLNK 0.6 2.90 2.31 13900 13800 1.70 NA NA NA NA NA NA
1 ECHQ-ATM 1.5 275 260 44.9 44.2 0.30 0.50 5 NA NA NA NA
2 ECHQ-ATM 2.05 35.7 23.0 15.2 9.0 0.46 0.73 7 7.51 3.5 5.98 1.83
3 ECHQ-ATM 1.35 23.1 11.5 19.8 8.6 2.24 11.1 158 NA NA NA NA
4 ECHQ-ATM 0.78 8.53 3.41 14.8 9.5 1.36 NA NA NA NA NA NA
5 ECHQ-ATM 0.5 52.6 8.36 112 38.3 NA NA NA NA NA NA NA
5 ECHQ-ATM 3.23 2.91 2.17 6.9 6.1 0.51 0.79 3 6.32 9.2 12.8 1.70
1 HUGH-ATM 1.25 225 196 18.9 10.6 0.46 0.50 NA NA NA NA NA
2 HUGH-ATM 1.75 17.2 11.7 7.0 5.1 0.42 0.87 9 NA NA NA NA
3 HUGH-ATM 1.25 16.1 7.69 13.2 7.2 1.70 5.32 49 NA NA NA NA
Copper and Zinc in Urban Runoff: Phase 2 79
Sto
rm
Sam
ple
ID
Vo
lum
e
(L)
Tota
l Cu
(µ
g/L)
Dis
solv
ed
Cu
(µ
g/L)
Tota
l Zn
(µ
g/L)
Dis
solv
ed
Zn
(µ
g/L)
Har
dn
ess
(mg/
L)
DO
C
(mg/
L)
TSS
(mg/
L)
pH
S.C
.
(µS)
Tem
p.
(°C
)
Turb
idty
(N
TU)
4 HUGH-ATM 0.8 19.8 12.9 23.6 24.2 NA NA NA NA NA NA NA
5 HUGH-ATM 0.4 12.2 7.04 32.4 8.6 NA NA NA NA NA NA NA
5 HUGH-ATM 4.20 1.34 1.02 4.3 4.7 0.55 0.87 2 5.65 9.3 11.2 0.85