Embed Size (px)
Citation preview
www.elsevier.com/locate/marchem
Marine Chemistry 96
Copper speciation in San Francisco Bay:
A novel approach using multiple analytical windows
Kristen N. BuckT, Kenneth W. Bruland
Department of Ocean Sciences, University of California Santa Cruz, 1156 High Street, Santa Cruz, CA 95064, USA
Received 16 June 2004; accepted 6 January 2005
Available online 8 April 2005
Abstract
Dissolved copper speciation and total dissolved copper concentrations were determined at six San Francisco Bay sites
in January and March of 2003. Multiple analytical windows were incorporated into an established competitive ligand
exchange-adsorptive cathodic stripping voltammetry (CLE-ACSV) method, which employs salicylaldoxime (SA) as the
added competitive ligand for speciation analyses. The titration results were integrated into [CuT*] versus log [Cu2+] plots,
combining data from each of the different competing ligand concentrations and providing a powerful approach to visually
interpret the variation in [Cu2+] as the natural Cu-binding ligands in the sample are titrated over a wide range of [CuT].
In addition, the data for different analytical windows were interpreted with Langmuir and Scatchard linearization
techniques to estimate natural Cu-binding ligand concentrations [Li] and conditional stability constants KCuLi,Cu2+
cond . All
results indicate that ambient ligand concentrations exceed total dissolved copper concentrations at each site, with
dissolved copper greater than 99.9% complexed by the strong copper-binding L1 ligand class. The [Cu2+] does not exceed
10�13 M at any site, a concentration sufficiently below the toxicity threshold for microorganisms. Thus, the excess of
strong Cu-binding ligands appears to effectively buffer free Cu2+ at low concentrations and the existing levels of copper
do not impair San Francisco Bay.
D 2005 Elsevier B.V. All rights reserved.
Keywords: Copper speciation; Voltammetry; Multiple analytical windows
1. Introduction
The toxicity of copper to marine microorganisms
is well documented (Anderson and Morel, 1978;
0304-4203/$ - see front matter D 2005 Elsevier B.V. All rights reserved.
doi:10.1016/j.marchem.2005.01.001
T Corresponding author. Tel.: +1 831 459 2682; fax: +1 831 459
4882.
E-mail address: [email protected] (K.N. Buck).
Brand et al., 1986; Stoecker et al., 1986; Sunda and
Guillard, 1976; Sunda et al., 1987; Sunda et al.,
1990). These studies have shown that the toxicity of
copper is a function of the concentration of the free
hydrated Cu2+ ion, and not the total dissolved copper
concentration. The threshold for Cu2+ toxicity varies
among phytoplankton phyla, with cyanobacteria
being the most sensitive and diatoms generally the
(2005) 185–198
K.N. Buck, K.W. Bruland / Marine Chemistry 96 (2005) 185–198186
least sensitive (Brand et al., 1986). Free Cu2+
concentrations as low as 10�11 M can completely
inhibit cyanobacteria growth rates, while at Cu2+
concentrations above ~10�11 M, it appears as though
the viability of many phytoplankton species, includ-
ing diatoms, begins to decline. In addition, the
naupliar larvae of various zooplankton have been
San Pablo Bay
Redwood Cree
San Bruno Shoals
Dumbarton
Yerba Buena Island
122˚30'0"W 122˚20'0"W
122˚30'0"W 122˚20'0"W
37˚20'0"N
37˚30'0"N
37˚40'0"N
37˚50'0"N
38˚0'0"N
38˚10'0"N
0 9 184.5 Miles
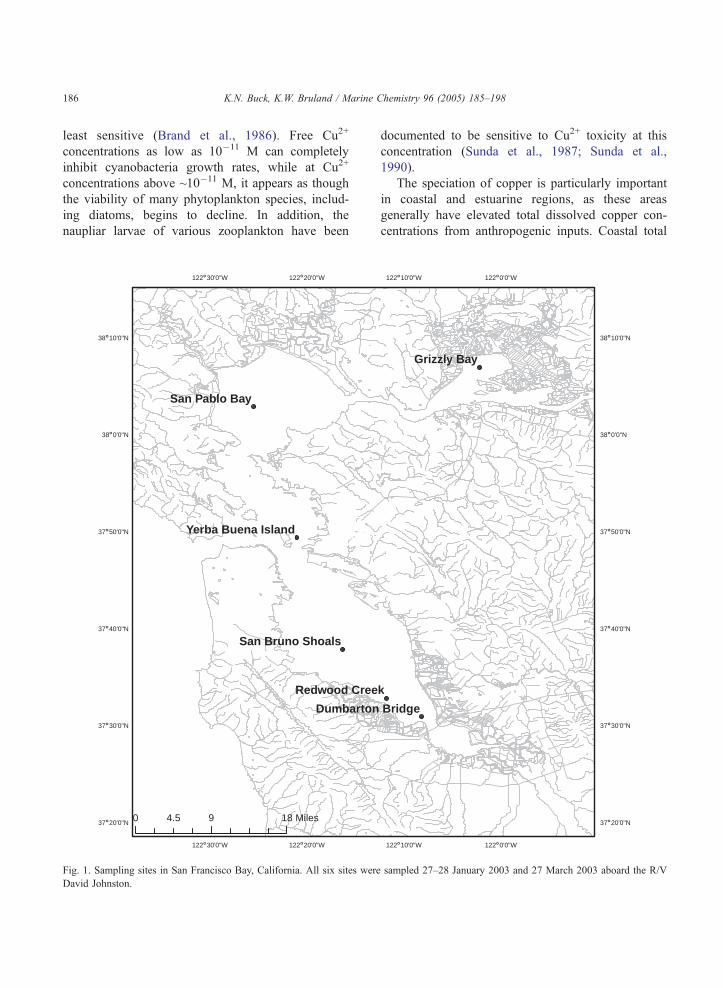
Fig. 1. Sampling sites in San Francisco Bay, California. All six sites were
David Johnston.
documented to be sensitive to Cu2+ toxicity at this
concentration (Sunda et al., 1987; Sunda et al.,
1990).
The speciation of copper is particularly important
in coastal and estuarine regions, as these areas
generally have elevated total dissolved copper con-
centrations from anthropogenic inputs. Coastal total
Grizzly Bay
k
Bridge
122˚10'0"W 122˚0'0"W
122˚10'0"W 122˚0'0"W
37˚20'0"N
37˚30'0"N
37˚40'0"N
37˚50'0"N
38˚0'0"N
38˚10'0"N
sampled 27–28 January 2003 and 27 March 2003 aboard the R/V
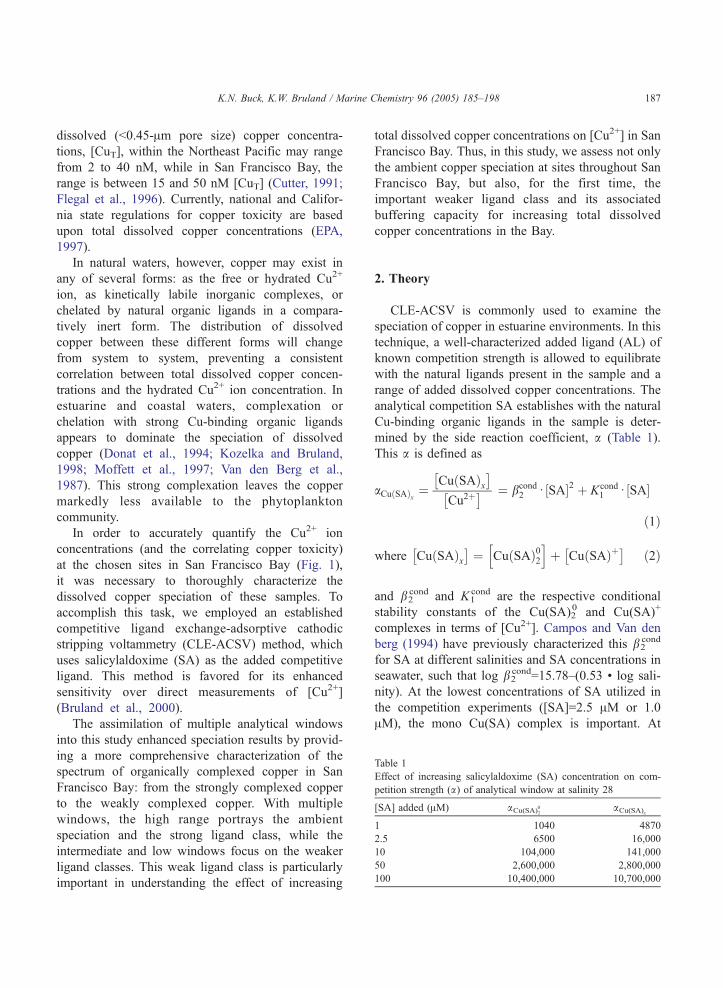
Table 1
Effect of increasing salicylaldoxime (SA) concentration on com
petition strength (a) of analytical window at salinity 28
[SA] added (AM) aCu(SA)0
2aCu(SA)x
1 1040 4870
2.5 6500 16,000
10 104,000 141,000
50 2,600,000 2,800,000
100 10,400,000 10,700,000
K.N. Buck, K.W. Bruland / Marine Chemistry 96 (2005) 185–198 187
dissolved (b0.45-Am pore size) copper concentra-
tions, [CuT], within the Northeast Pacific may range
from 2 to 40 nM, while in San Francisco Bay, the
range is between 15 and 50 nM [CuT] (Cutter, 1991;
Flegal et al., 1996). Currently, national and Califor-
nia state regulations for copper toxicity are based
upon total dissolved copper concentrations (EPA,
1997).
In natural waters, however, copper may exist in
any of several forms: as the free or hydrated Cu2+
ion, as kinetically labile inorganic complexes, or
chelated by natural organic ligands in a compara-
tively inert form. The distribution of dissolved
copper between these different forms will change
from system to system, preventing a consistent
correlation between total dissolved copper concen-
trations and the hydrated Cu2+ ion concentration. In
estuarine and coastal waters, complexation or
chelation with strong Cu-binding organic ligands
appears to dominate the speciation of dissolved
copper (Donat et al., 1994; Kozelka and Bruland,
1998; Moffett et al., 1997; Van den Berg et al.,
1987). This strong complexation leaves the copper
markedly less available to the phytoplankton
community.
In order to accurately quantify the Cu2+ ion
concentrations (and the correlating copper toxicity)
at the chosen sites in San Francisco Bay (Fig. 1),
it was necessary to thoroughly characterize the
dissolved copper speciation of these samples. To
accomplish this task, we employed an established
competitive ligand exchange-adsorptive cathodic
stripping voltammetry (CLE-ACSV) method, which
uses salicylaldoxime (SA) as the added competitive
ligand. This method is favored for its enhanced
sensitivity over direct measurements of [Cu2+]
(Bruland et al., 2000).
The assimilation of multiple analytical windows
into this study enhanced speciation results by provid-
ing a more comprehensive characterization of the
spectrum of organically complexed copper in San
Francisco Bay: from the strongly complexed copper
to the weakly complexed copper. With multiple
windows, the high range portrays the ambient
speciation and the strong ligand class, while the
intermediate and low windows focus on the weaker
ligand classes. This weak ligand class is particularly
important in understanding the effect of increasing
total dissolved copper concentrations on [Cu2+] in San
Francisco Bay. Thus, in this study, we assess not only
the ambient copper speciation at sites throughout San
Francisco Bay, but also, for the first time, the
important weaker ligand class and its associated
buffering capacity for increasing total dissolved
copper concentrations in the Bay.
2. Theory
CLE-ACSV is commonly used to examine the
speciation of copper in estuarine environments. In this
technique, a well-characterized added ligand (AL) of
known competition strength is allowed to equilibrate
with the natural ligands present in the sample and a
range of added dissolved copper concentrations. The
analytical competition SA establishes with the natural
Cu-binding organic ligands in the sample is deter-
mined by the side reaction coefficient, a (Table 1).
This a is defined as
aCu SAð Þx ¼Cu SAð Þx� �
Cu2þ� � ¼ bcond
2 d SA½ �2 þ Kcond1 d SA½ �
ð1Þ
where Cu SAð Þx� �
¼ Cu SAð Þ02h i
þ Cu SAð Þþ� �
ð2Þ
and b2cond and K1
cond are the respective conditional
stability constants of the Cu(SA)20 and Cu(SA)+
complexes in terms of [Cu2+]. Campos and Van den
berg (1994) have previously characterized this b2cond
for SA at different salinities and SA concentrations in
seawater, such that log b2cond=15.78–(0.53 ! log sali-
nity). At the lowest concentrations of SA utilized in
the competition experiments ([SA]=2.5 AM or 1.0
AM), the mono Cu(SA) complex is important. At
-
K.N. Buck, K.W. Bruland / Marine Chemistry 96 (2005) 185–198188
higher [SA] values, it becomes insignificant relative
to the bis complex, and Eq. (1) can be simplified to
Eq. (3):
aCu SAð Þ02¼
Cu SAð Þ02h i
Cu2þ� � ¼ bcond
2 d SA½ �2 ð3Þ
As outlined in Eqs. (1) and (3), a is a function of
K1cond, b2
cond and [SA]. Since K1cond and b2
cond are
constants, a range of different analytical windows can
be applied to a given sample by simply increasing or
decreasing the added SA concentration. The side
reaction coefficient, a, is employed to describe the
competition strength of the Cu(SA)x complexes. The
higher the value of a, the more competitive the
Cu(SA)x complexes are against the natural ambient
copper–ligand complexes, CuLi, and the larger the
tendency is to form Cu(SA)x at the expense of CuLi.
The propensity of SA to form a bis-complex with Cu
allows us to use a wider range of competition
strengths (or a values) for a given SA concentration,
since at higher [SA] a will be mainly a function of
[SA]2. A wide range in a values will allow competi-
tion against both the weak and strong ligands in
solution.
2.1. [CuT*] versus log [Cu2+] plots
Organic complexation of copper has a dramatic
impact upon the concentration of the free Cu2+ ion
concentrations. In order to visually interpret the
[Cu2+] at ambient and alternate total dissolved copper
concentrations, the January and March 2003 data sets
were put into [CuT*] versus log [Cu2+] plots, where
Cu4T
h i¼ CuT½ � � Cu SAð Þx
� �; ð4Þ
or Cu4T
h i¼ CuLi½ � þ CuV
� �ð5Þ
since CuT½ � ¼ CuLi½ � þ Cu SAð Þx� �
þ CuV� �
ð6Þ
With a competitive equilibrium approach, simply
plotting [CuT] versus [Cu2+] is not as useful since CuT
includes both CuLi and [Cu(SA)x] for each titration
point. It is much more revealing to examine the [Cu2+]
dependency on [CuLi] without the added ligand
present, as SA is not a natural aspect of this system.
Removing the [Cu(SA)x] component allows the
multiple analytical windows to be more directly
correlated to the natural sample and provides a
graphical estimation of the relationship between
[Cu2+] and [CuLi] in the unperturbed sample.
Plotting the data in this type of figure provides two
important pieces of information: the ambient [Cu2+] as
well as how the free [Cu2+] varies when the [CuLi] is
titrated with increasing (or decreasing) levels of [CuT].
It is important to note that at high SA concentrations,
where the aCu(SA)x is strong enough to effectively
compete with the natural strong Cu-binding ligands,
SAwill also out-compete some of these ligands for the
ambient copper, resulting in CuT* and Cu2+ data below
the ambient concentrations.
A disadvantage of these plots is the inability in
providing much information at extremely elevated
[CuT] beyond the titration of the ambient ligands (Li)
– any copper added will be complexed almost
exclusively by SA – which is then subtracted out of
the CuT* term, preventing [CuT*] from increasing
significantly.
The change in [Cu2+] as the Cu-binding ligands are
titrated provides information on the bcarrying capacity
of the ligand pool.Q As dissolved copper is added to
the sample, [CuT*] versus log [Cu2+] plots reflect the
corresponding increase in [CuLi] and the effect on
[Cu2+]. We suggest that the best way to visualize the
free [Cu2+] under ambient or perturbed conditions is
with the use of [CuT*] versus log [Cu2+] plots.
2.2. Linearizations of the data
The Scatchard linearization method (Mantoura and
Riley, 1975; Ruzic, 1982) and the Langmuir/Ruzic/
van den Berg linearization method (Ruzic, 1982; Van
den berg, 1982) were also used on the copper titration
data to determine Cu-binding ligand concentrations
and their conditional stability constants.
In the case of only a single ligand class, both of these
linearization techniques present the data as a single
line. The presence of two or more ligand classes is
depicted as two distinct lines. With these linearizations
it is not possible to see more than two ligand classes,
and any additional ligand classes tend to be incorpo-
rated more into the second line—such that the weak
ligand class includes the ligand classes beyond the
strong L1 ligand class (Miller and Bruland, 1997).
K.N. Buck, K.W. Bruland / Marine Chemistry 96 (2005) 185–198 189
The two linearization methods give averages of
ligand class concentrations and conditional stability
constants at each analytical window such that the
ligand concentration and stability data from these
techniques works out to an average of the actual
sample characteristics. These average values may then
be used to calculate the speciation of the ambient
copper. Although different analytical windows can
yield differing estimates of ligand concentrations and
binding strengths (with [Li] decreasing and Ki
increasing as the analytical competition strength
increases), the [Cu2+] calculated from these data sets
have been shown to be quite similar at different
analytical windows (Bruland et al., 2000).
3. Materials and methods
3.1. Sample collection
Trace metal clean techniques were employed in the
collection of samples on two separate occasions from
six sites within San Francisco Bay, California (Fig. 1).
These sites were chosen in order to give a spatial
overview of copper speciation in the Bay. The first of
the two cruises took place over a 1-day period, 27–28
January 2003 on the R/V David Johnston. The second
sampling cruise was completed in a single day, 27
March 2003 on the same vessel.
At each site, samples were filtered through an in-line
acid-washed cartridge with a pore size of 0.45 Am, as
described by Donat et al. (1994) and collected in 1-L
and 2-L trace metal clean Teflon (FEP) bottles. These
samples were then stored in the dark, on ice, until
delivered to the lab refrigerator (4 8C) each evening. Inaddition, nutrient and DOC samples were collected,
immediately frozen on dry ice, and stored in the lab
freezer until analyzed. Nitrate (plus nitrite), phosphate
and silicic acid concentrations were measured on a
Lachat QuickChem 8000k Flow Injection Analysis
system using standard methods (Parsons et al., 1984).
A Dohrmann DC-190 (Rosemount Analytical,
temperature: 680 C, catalyst: 0.5% PtAl2O3) was used
for the DOC analysis (Ogawa and Ogura, 1992; Sharp
et al., 1993). The frozen samples were thawed and
shaken before 50 AL of 6 N H3PO4 was added (final
concentration c0.06 N). The acidified water was
bubbled with high-purity zero CO2 air at a flow rate of
~100mL/min for 10 min to completely purge inorganic
carbon species. One-hundred-microliter samples of this
solution were then manually injected into the combus-
tion column of the DC-190. The injections were usually
repeated 3 or 4 times per sample. Typical precision was
2.5–4.0 AM (SD) or b10% (CV).
3.2. CLE-ACSV
The dissolved copper speciation as well as the total
dissolved copper values were determined following a
modified version of the competitive ligand exchange-
adsorptive cathodic stripping voltammetry (CLE-
ACSV) method developed by Rue and Bruland
(1995) for dissolved iron studies and described for
copper in Bruland et al. (2000). Originally detailed by
Campos and Van den berg (1994) as a method for
copper speciation, this method incorporates salicylal-
doxime (SA) as the added ligand.
Sample analyses were carried out on a BioAnalyt-
ical Systems (BAS) controlled growth mercury
electrode (CGME) interfaced with a CV-50 W
voltammetric analyzer. The static mercury drop
electrode (SMDE) instrument setting was used,
employing a large (size 14) mercury drop as the
working electrode, an Ag/AgCl (3 M NaCl) reference
electrode, and a platinum wire counter electrode.
3.3. Reagents
A stock solution of 5 mM salicylaldoxime (SA) in
methanol and a sub-stock of 1 mM SA in Milli-Q
water were prepared as described in Rue and Bruland
(1995). The samples were buffered to pH 8.2 with an
EPPS (4-(2-hydroxyethyl)-1-piperazinepropane-sul-
fonic acid) buffer. The 1.3 M EPPS buffer was made
in 1 M NH4OH, of which 50 AL added to a 10-mL
sub-sample results in a final concentration of 6.0 mM
EPPS. A range of copper standard solutions, from 2
AM to 40 AM, were prepared by dilution of a Fisher
1000 ppm (15.74 mM) atomic absorption standard
with Milli-Q and acidified to pH 1.8 with quartz-
distilled HCl (QHCl).
3.4. Total dissolved copper
Approximately 100 mL of each sample was
aliquoted into trace metal clean Teflon (FEP) cups
K.N. Buck, K.W. Bruland / Marine Chemistry 96 (2005) 185–198190
with quartz lids and UV-oxidized at ambient pH in a
Jelight Model 342 UVO-Cleaner for 2 h at 10 mW/
cm2. Once UV-oxidized, 10-mL sub-samples were
pipetted into trace metal clean and previously con-
ditioned Teflon (FEP) voltammetric cups. 50 AL of the
EPPS buffer was added to the samples (final concen-
tration 6.0 mM and pH 8.2), followed by copper
additions of 0 to 150 nM. Samples were then
transferred to a second series of voltammetric cups
conditioned to the ligand addition, and 25-AM SAwas
added to each aliquot. The prepared samples were
lastly purged with oxygen-free argon gas for 3 min
preceding analysis.
During deposition, the electroactive Cu(SA)x com-
plexes formed in the sample were adsorbed onto a
fresh mercury drop at an applied potential of �0.15 V
for 60 s while the sample was stirred with a clean
PTFE stir bar at 600 rpm. Following this deposition
step, the stirring was stopped for a 10-s quiet time.
The samples were subsequently scanned in differential
pulse mode from �0.15 V to �0.60 V at 20 mV/s
(sample width 17 ms, pulse width 35 ms, pulse period
200 ms, pulse amplitude 50 mV, and 10 AA/Vanalyzer sensitivity) while the change in cathodic
stripping current resulting from the reduction of Cu2+
in the adsorbed Cu(SA)x was recorded by the
analyzer. The sensitivity of this method varies slightly
(b10%) with respect to each sample, with an average
sensitivity of 7 nA nM�1 min�1.
3.5. Copper speciation
As with the total dissolved copper measurements,
10-mL sub-samples from every site were aliquoted
into a series of up to 11 clean voltammetric Teflon
(FEP) cups and 6.0 mM EPPS buffer was added to
each of them. Dissolved copper was then added to all
but two of the cups, with total added copper
concentrations ranging from 0 to 350 nM (with more
closely spaced additions at lower concentrations and
more widely spaced additions at higher concentra-
tions). The very high copper additions were used in an
attempt to ensure saturation of any weak ligand class.
Sealed in airtight polyethylene containers, the
samples were allowed to equilibrate with the added
copper for 2 h in their respective Teflon cups. Once at
equilibrium, samples were transferred to the second
set of ligand addition cups, and the appropriate
concentration of SA was added. The samples were
subsequently left to equilibrate again, this time for 15
min. Following this second equilibration, each sample
was purged for 3 min with argon and analyzed using
the CSV parameters detailed above for the total
dissolved copper samples.
All speciation analyses were completed within 6
days of collection. Analyses were conducted at three
different analytical windows for each of the samples:
2.5-AM, 10-AM, and 50-AM SA. In addition, the
Dumbarton Bridge samples were analyzed at the 1-
AM and 100-AM SA analytical windows in order to
further widen the detection window for the ambient
ligands.
It has been suggested that shorter equilibration
times, on the order of minutes, are sufficient to bring
samples with high organic content into equilibrium
with the added copper and ligand (Kogut and Voelker,
2001; Kogut and Voelker, 2003). We conducted
laboratory studies in order to determine whether our
longer equilibration times were necessary, or if the
shorter equilibration times, such as used by Kogut and
Voelker (2001) would be sufficient. A 1-ppm Suwa-
nee River Humic Acid (SRHA) solution in UVSW
and the Dumbarton Bridge sample were used as the
media for these studies.
The procedure detailed in Kogut and Voelker
(2001) (SA added to the sample first, allowed to
equilibrate 3 min, followed by the addition of copper
and a subsequent 5-min equilibration time) was used
to examine the possibility of using short equilibration
times. Additionally, we examined our longer equili-
bration times, as described above, on both the SRHA
standard solution and a sample. We chose to look at
these equilibration times at a low (1 or 2.5-AM SA)
and a high (50-AM SA) analytical window. Upon
completion of the respective equilibration times, the
concentration of Cu(SA)x was measured as a function
of time to determine whether the samples had truly
equilibrated.
As shown in Fig. 2, the shorter equilibration times
used by Kogut and Voelker (2001) resulted in an
initially higher response, which would lead to an
overestimation of the free copper concentrations in
these samples. This response, seen in the samples
where SAwas added before the copper, represents the
immediate complexation of added copper by the
relatively high SA concentration present in the
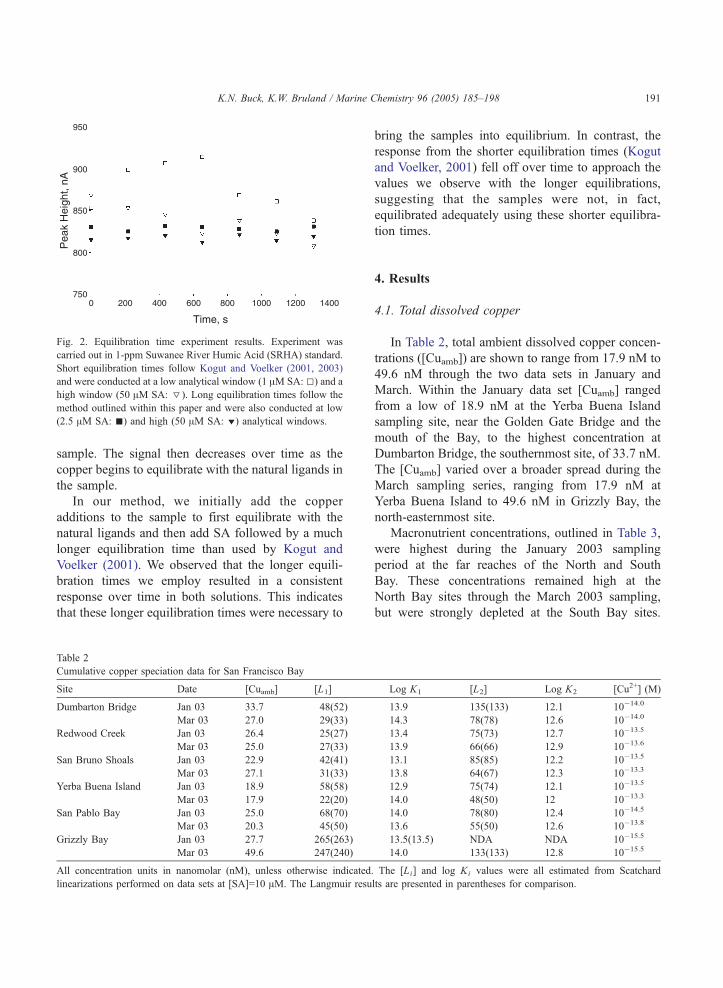
Fig. 2. Equilibration time experiment results. Experiment was
carried out in 1-ppm Suwanee River Humic Acid (SRHA) standard.
Short equilibration times follow Kogut and Voelker (2001, 2003)
and were conducted at a low analytical window (1 AM SA: 5) and a
high window (50 AM SA: q). Long equilibration times follow the
method outlined within this paper and were also conducted at low
(2.5 AM SA: n) and high (50 AM SA: z) analytical windows.
K.N. Buck, K.W. Bruland / Marine Chemistry 96 (2005) 185–198 191
sample. The signal then decreases over time as the
copper begins to equilibrate with the natural ligands in
the sample.
In our method, we initially add the copper
additions to the sample to first equilibrate with the
natural ligands and then add SA followed by a much
longer equilibration time than used by Kogut and
Voelker (2001). We observed that the longer equili-
bration times we employ resulted in a consistent
response over time in both solutions. This indicates
that these longer equilibration times were necessary to
Table 2
Cumulative copper speciation data for San Francisco Bay
Site Date [Cuamb] [L1]
Dumbarton Bridge Jan 03 33.7 48(52)
Mar 03 27.0 29(33)
Redwood Creek Jan 03 26.4 25(27)
Mar 03 25.0 27(33)
San Bruno Shoals Jan 03 22.9 42(41)
Mar 03 27.1 31(33)
Yerba Buena Island Jan 03 18.9 58(58)
Mar 03 17.9 22(20)
San Pablo Bay Jan 03 25.0 68(70)
Mar 03 20.3 45(50)
Grizzly Bay Jan 03 27.7 265(263)
Mar 03 49.6 247(240)
All concentration units in nanomolar (nM), unless otherwise indicated.
linearizations performed on data sets at [SA]=10 AM. The Langmuir resu
bring the samples into equilibrium. In contrast, the
response from the shorter equilibration times (Kogut
and Voelker, 2001) fell off over time to approach the
values we observe with the longer equilibrations,
suggesting that the samples were not, in fact,
equilibrated adequately using these shorter equilibra-
tion times.
4. Results
4.1. Total dissolved copper
In Table 2, total ambient dissolved copper concen-
trations ([Cuamb]) are shown to range from 17.9 nM to
49.6 nM through the two data sets in January and
March. Within the January data set [Cuamb] ranged
from a low of 18.9 nM at the Yerba Buena Island
sampling site, near the Golden Gate Bridge and the
mouth of the Bay, to the highest concentration at
Dumbarton Bridge, the southernmost site, of 33.7 nM.
The [Cuamb] varied over a broader spread during the
March sampling series, ranging from 17.9 nM at
Yerba Buena Island to 49.6 nM in Grizzly Bay, the
north-easternmost site.
Macronutrient concentrations, outlined in Table 3,
were highest during the January 2003 sampling
period at the far reaches of the North and South
Bay. These concentrations remained high at the
North Bay sites through the March 2003 sampling,
but were strongly depleted at the South Bay sites.
Log K1 [L2] Log K2 [Cu2+] (M)
13.9 135(133) 12.1 10�14.0
14.3 78(78) 12.6 10�14.0
13.4 75(73) 12.7 10�13.5
13.9 66(66) 12.9 10�13.6
13.1 85(85) 12.2 10�13.5
13.8 64(67) 12.3 10�13.3
12.9 75(74) 12.1 10�13.5
14.0 48(50) 12 10�13.3
14.0 78(80) 12.4 10�14.5
13.6 55(50) 12.6 10�13.8
13.5(13.5) NDA NDA 10�15.5
14.0 133(133) 12.8 10�15.5
The [Li] and log Ki values were all estimated from Scatchard
lts are presented in parentheses for comparison.
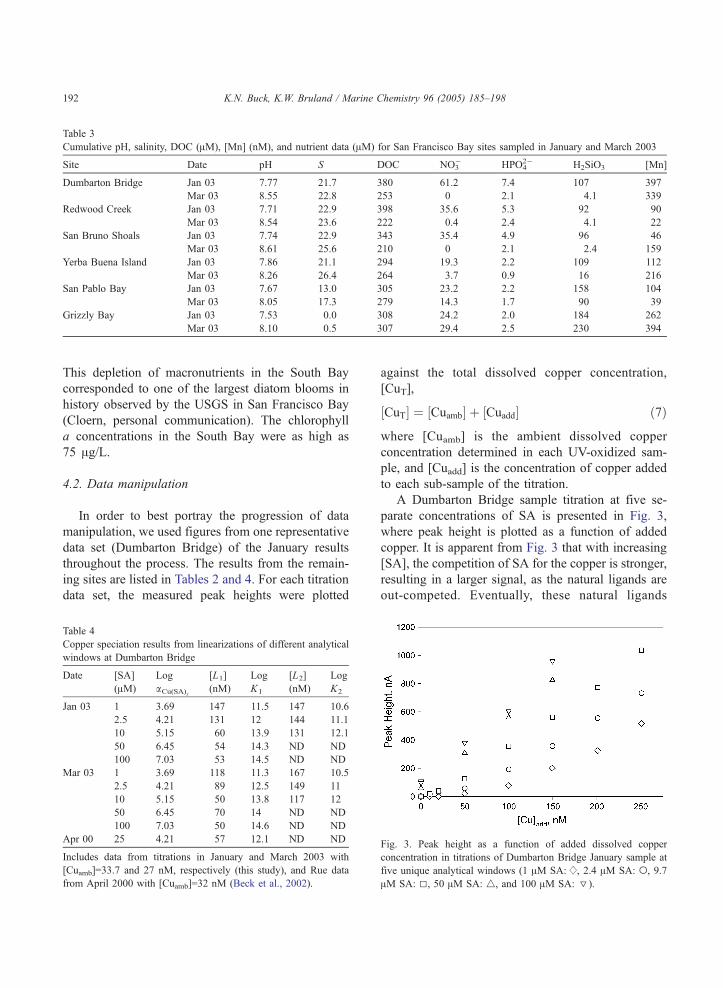
Table 3
Cumulative pH, salinity, DOC (AM), [Mn] (nM), and nutrient data (AM) for San Francisco Bay sites sampled in January and March 2003
Site Date pH S DOC NO3� HPO4
2� H2SiO3 [Mn]
Dumbarton Bridge Jan 03 7.77 21.7 380 61.2 7.4 107 397
Mar 03 8.55 22.8 253 0 2.1 4.1 339
Redwood Creek Jan 03 7.71 22.9 398 35.6 5.3 92 90
Mar 03 8.54 23.6 222 0.4 2.4 4.1 22
San Bruno Shoals Jan 03 7.74 22.9 343 35.4 4.9 96 46
Mar 03 8.61 25.6 210 0 2.1 2.4 159
Yerba Buena Island Jan 03 7.86 21.1 294 19.3 2.2 109 112
Mar 03 8.26 26.4 264 3.7 0.9 16 216
San Pablo Bay Jan 03 7.67 13.0 305 23.2 2.2 158 104
Mar 03 8.05 17.3 279 14.3 1.7 90 39
Grizzly Bay Jan 03 7.53 0.0 308 24.2 2.0 184 262
Mar 03 8.10 0.5 307 29.4 2.5 230 394
K.N. Buck, K.W. Bruland / Marine Chemistry 96 (2005) 185–198192
This depletion of macronutrients in the South Bay
corresponded to one of the largest diatom blooms in
history observed by the USGS in San Francisco Bay
(Cloern, personal communication). The chlorophyll
a concentrations in the South Bay were as high as
75 Ag/L.
4.2. Data manipulation
In order to best portray the progression of data
manipulation, we used figures from one representative
data set (Dumbarton Bridge) of the January results
throughout the process. The results from the remain-
ing sites are listed in Tables 2 and 4. For each titration
data set, the measured peak heights were plotted
Table 4
Copper speciation results from linearizations of different analytical
windows at Dumbarton Bridge
Date [SA]
(AM)
Log
aCu(SA)x
[L1]
(nM)
Log
K1
[L2]
(nM)
Log
K2
Jan 03 1 3.69 147 11.5 147 10.6
2.5 4.21 131 12 144 11.1
10 5.15 60 13.9 131 12.1
50 6.45 54 14.3 ND ND
100 7.03 53 14.5 ND ND
Mar 03 1 3.69 118 11.3 167 10.5
2.5 4.21 89 12.5 149 11
10 5.15 50 13.8 117 12
50 6.45 70 14 ND ND
100 7.03 50 14.6 ND ND
Apr 00 25 4.21 57 12.1 ND ND
Includes data from titrations in January and March 2003 with
[Cuamb]=33.7 and 27 nM, respectively (this study), and Rue data
from April 2000 with [Cuamb]=32 nM (Beck et al., 2002).
against the total dissolved copper concentration,
[CuT],
CuT½ � ¼ Cuamb½ � þ Cuadd½ � ð7Þ
where [Cuamb] is the ambient dissolved copper
concentration determined in each UV-oxidized sam-
ple, and [Cuadd] is the concentration of copper added
to each sub-sample of the titration.
A Dumbarton Bridge sample titration at five se-
parate concentrations of SA is presented in Fig. 3,
where peak height is plotted as a function of added
copper. It is apparent from Fig. 3 that with increasing
[SA], the competition of SA for the copper is stronger,
resulting in a larger signal, as the natural ligands are
out-competed. Eventually, these natural ligands
Fig. 3. Peak height as a function of added dissolved copper
concentration in titrations of Dumbarton Bridge January sample a
five unique analytical windows (1 AM SA: w , 2.4 AM SA: o, 9.7
AM SA: 5, 50 AM SA: 4, and 100 AM SA: q).
t
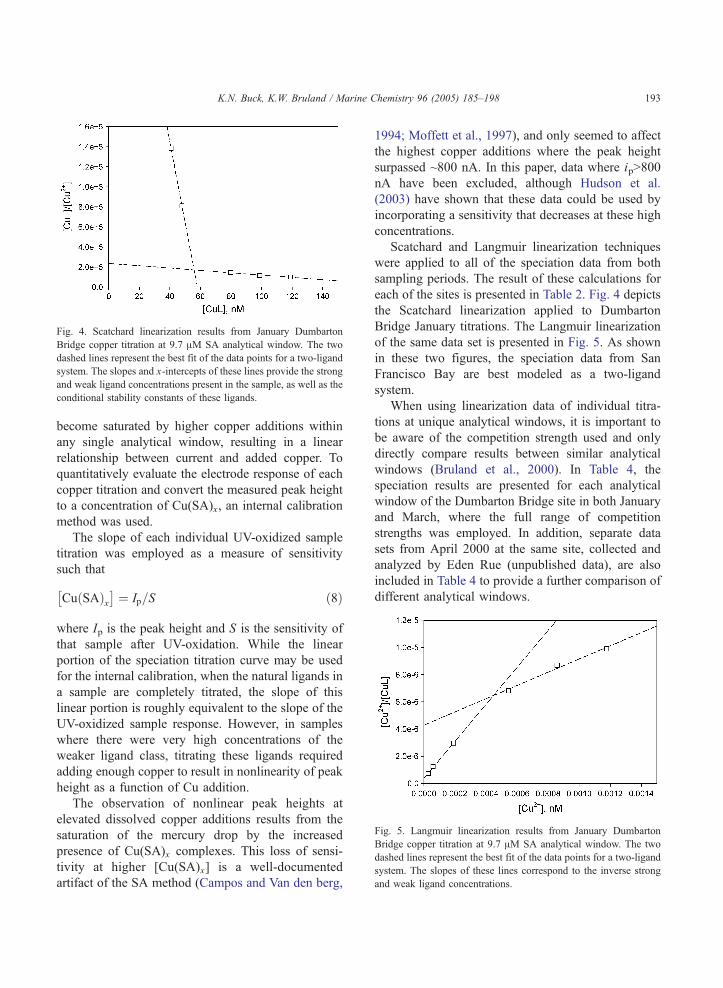
Fig. 4. Scatchard linearization results from January Dumbarton
Bridge copper titration at 9.7 AM SA analytical window. The two
dashed lines represent the best fit of the data points for a two-ligand
system. The slopes and x-intercepts of these lines provide the strong
and weak ligand concentrations present in the sample, as well as the
conditional stability constants of these ligands.
Fig. 5. Langmuir linearization results from January Dumbarton
Bridge copper titration at 9.7 AM SA analytical window. The two
dashed lines represent the best fit of the data points for a two-ligand
system. The slopes of these lines correspond to the inverse strong
and weak ligand concentrations.
K.N. Buck, K.W. Bruland / Marine Chemistry 96 (2005) 185–198 193
become saturated by higher copper additions within
any single analytical window, resulting in a linear
relationship between current and added copper. To
quantitatively evaluate the electrode response of each
copper titration and convert the measured peak height
to a concentration of Cu(SA)x, an internal calibration
method was used.
The slope of each individual UV-oxidized sample
titration was employed as a measure of sensitivity
such that
Cu SAð Þx� �
¼ Ip=S ð8Þ
where Ip is the peak height and S is the sensitivity of
that sample after UV-oxidation. While the linear
portion of the speciation titration curve may be used
for the internal calibration, when the natural ligands in
a sample are completely titrated, the slope of this
linear portion is roughly equivalent to the slope of the
UV-oxidized sample response. However, in samples
where there were very high concentrations of the
weaker ligand class, titrating these ligands required
adding enough copper to result in nonlinearity of peak
height as a function of Cu addition.
The observation of nonlinear peak heights at
elevated dissolved copper additions results from the
saturation of the mercury drop by the increased
presence of Cu(SA)x complexes. This loss of sensi-
tivity at higher [Cu(SA)x] is a well-documented
artifact of the SA method (Campos and Van den berg,
1994; Moffett et al., 1997), and only seemed to affect
the highest copper additions where the peak height
surpassed ~800 nA. In this paper, data where ipN800
nA have been excluded, although Hudson et al.
(2003) have shown that these data could be used by
incorporating a sensitivity that decreases at these high
concentrations.
Scatchard and Langmuir linearization techniques
were applied to all of the speciation data from both
sampling periods. The result of these calculations for
each of the sites is presented in Table 2. Fig. 4 depicts
the Scatchard linearization applied to Dumbarton
Bridge January titrations. The Langmuir linearization
of the same data set is presented in Fig. 5. As shown
in these two figures, the speciation data from San
Francisco Bay are best modeled as a two-ligand
system.
When using linearization data of individual titra-
tions at unique analytical windows, it is important to
be aware of the competition strength used and only
directly compare results between similar analytical
windows (Bruland et al., 2000). In Table 4, the
speciation results are presented for each analytical
window of the Dumbarton Bridge site in both January
and March, where the full range of competition
strengths was employed. In addition, separate data
sets from April 2000 at the same site, collected and
analyzed by Eden Rue (unpublished data), are also
included in Table 4 to provide a further comparison of
different analytical windows.
K.N. Buck, K.W. Bruland / Marine Chemistry 96 (2005) 185–198194
Different analytical windows give detailed infor-
mation for the speciation of a sample within that
window only, and as the window changes, so do the
results. As shown by the results in Table 4, with
increasing added ligand competition strength the L1
ligand class described becomes smaller and stronger
with respect to [Cu2+]. As the SA concentration varies
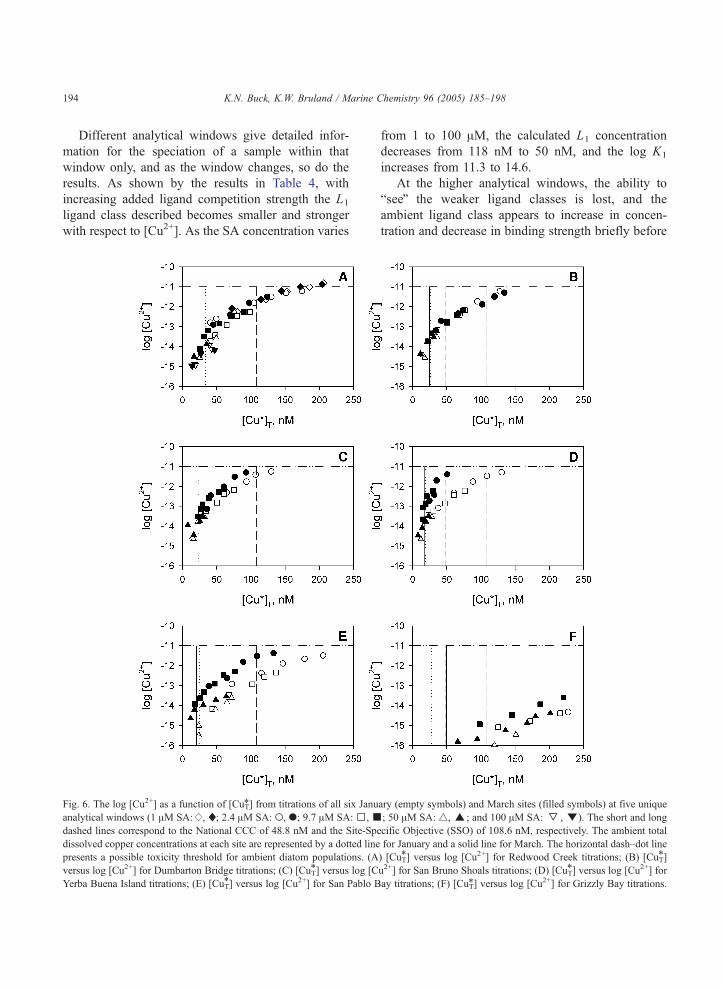
Fig. 6. The log [Cu2+] as a function of [CuT*] from titrations of all six Janu
analytical windows (1 AM SA: w , x; 2.4 AM SA: o, .; 9.7 AM SA:5,ndashed lines correspond to the National CCC of 48.8 nM and the Site-Sp
dissolved copper concentrations at each site are represented by a dotted line
presents a possible toxicity threshold for ambient diatom populations. (A
versus log [Cu2+] for Dumbarton Bridge titrations; (C) [CuT*] versus log [C
Yerba Buena Island titrations; (E) [CuT*] versus log [Cu2+] for San Pablo B
from 1 to 100 AM, the calculated L1 concentration
decreases from 118 nM to 50 nM, and the log K1
increases from 11.3 to 14.6.
At the higher analytical windows, the ability to
bseeQ the weaker ligand classes is lost, and the
ambient ligand class appears to increase in concen-
tration and decrease in binding strength briefly before
ary (empty symbols) and March sites (filled symbols) at five unique
; 50 AM SA: 4,E; and 100 AM SA:q,z). The short and long
ecific Objective (SSO) of 108.6 nM, respectively. The ambient total
for January and a solid line for March. The horizontal dash–dot line
) [CuT*] versus log [Cu2+] for Redwood Creek titrations; (B) [CuT*]
u2+] for San Bruno Shoals titrations; (D) [CuT*] versus log [Cu2+] for
ay titrations; (F) [CuT*] versus log [Cu2+] for Grizzly Bay titrations.
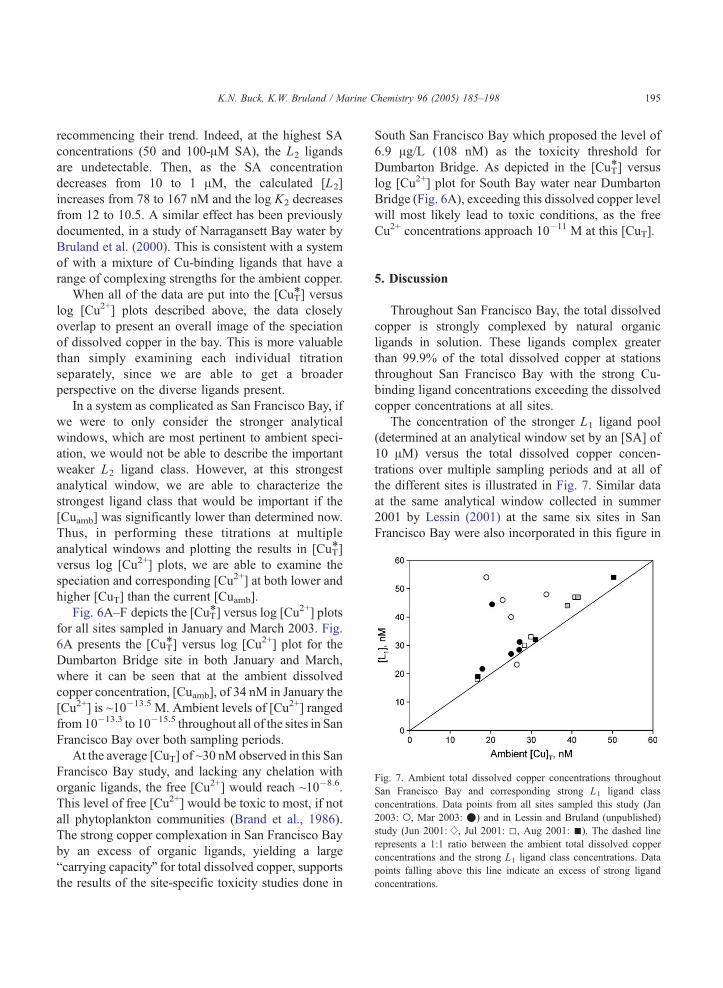
Fig. 7. Ambient total dissolved copper concentrations throughou
San Francisco Bay and corresponding strong L1 ligand class
concentrations. Data points from all sites sampled this study (Jan
2003: o, Mar 2003: .) and in Lessin and Bruland (unpublished
study (Jun 2001: w , Jul 2001: 5, Aug 2001: n). The dashed line
represents a 1:1 ratio between the ambient total dissolved coppe
concentrations and the strong L1 ligand class concentrations. Data
points falling above this line indicate an excess of strong ligand
concentrations.
K.N. Buck, K.W. Bruland / Marine Chemistry 96 (2005) 185–198 195
recommencing their trend. Indeed, at the highest SA
concentrations (50 and 100-AM SA), the L2 ligands
are undetectable. Then, as the SA concentration
decreases from 10 to 1 AM, the calculated [L2]
increases from 78 to 167 nM and the log K2 decreases
from 12 to 10.5. A similar effect has been previously
documented, in a study of Narragansett Bay water by
Bruland et al. (2000). This is consistent with a system
of with a mixture of Cu-binding ligands that have a
range of complexing strengths for the ambient copper.
When all of the data are put into the [CuT*] versus
log [Cu2+] plots described above, the data closely
overlap to present an overall image of the speciation
of dissolved copper in the bay. This is more valuable
than simply examining each individual titration
separately, since we are able to get a broader
perspective on the diverse ligands present.
In a system as complicated as San Francisco Bay, if
we were to only consider the stronger analytical
windows, which are most pertinent to ambient speci-
ation, we would not be able to describe the important
weaker L2 ligand class. However, at this strongest
analytical window, we are able to characterize the
strongest ligand class that would be important if the
[Cuamb] was significantly lower than determined now.
Thus, in performing these titrations at multiple
analytical windows and plotting the results in [CuT*]
versus log [Cu2+] plots, we are able to examine the
speciation and corresponding [Cu2+] at both lower and
higher [CuT] than the current [Cuamb].
Fig. 6A–F depicts the [CuT*] versus log [Cu2+] plots
for all sites sampled in January and March 2003. Fig.
6A presents the [CuT*] versus log [Cu2+] plot for the
Dumbarton Bridge site in both January and March,
where it can be seen that at the ambient dissolved
copper concentration, [Cuamb], of 34 nM in January the
[Cu2+] is ~10�13.5 M. Ambient levels of [Cu2+] ranged
from 10�13.3 to 10�15.5 throughout all of the sites in San
Francisco Bay over both sampling periods.
At the average [CuT] of ~30 nM observed in this San
Francisco Bay study, and lacking any chelation with
organic ligands, the free [Cu2+] would reach ~10�8.6.
This level of free [Cu2+] would be toxic to most, if not
all phytoplankton communities (Brand et al., 1986).
The strong copper complexation in San Francisco Bay
by an excess of organic ligands, yielding a large
bcarrying capacityQ for total dissolved copper, supportsthe results of the site-specific toxicity studies done in
South San Francisco Bay which proposed the level of
6.9 Ag/L (108 nM) as the toxicity threshold for
Dumbarton Bridge. As depicted in the [CuT*] versus
log [Cu2+] plot for South Bay water near Dumbarton
Bridge (Fig. 6A), exceeding this dissolved copper level
will most likely lead to toxic conditions, as the free
Cu2+ concentrations approach 10�11 M at this [CuT].
5. Discussion
Throughout San Francisco Bay, the total dissolved
copper is strongly complexed by natural organic
ligands in solution. These ligands complex greater
than 99.9% of the total dissolved copper at stations
throughout San Francisco Bay with the strong Cu-
binding ligand concentrations exceeding the dissolved
copper concentrations at all sites.
The concentration of the stronger L1 ligand pool
(determined at an analytical window set by an [SA] of
10 AM) versus the total dissolved copper concen-
trations over multiple sampling periods and at all of
the different sites is illustrated in Fig. 7. Similar data
at the same analytical window collected in summer
2001 by Lessin (2001) at the same six sites in San
Francisco Bay were also incorporated in this figure in
t
)
r
K.N. Buck, K.W. Bruland / Marine Chemistry 96 (2005) 185–198196
order to give a temporal perspective on complexation
in the bay. Fig. 7 accounts only for the L1 ligand class
(determined at [SA]=10 AM), whose concentrations
exceed the [Cuamb] in every case, with the exception
of the one Redwood Creek data point from the
January 2003 sampling period. At this Redwood
Creek site, the L2 ligand class plays a particularly
important role in complexing the ambient copper. This
reaffirms the importance of using multiple analytical
windows in order to characterize both ligand classes.
Despite the large decrease in macronutrient con-
centrations in the South Bay (Table 3) in March (nitrate
decreased from 61 AM to below detection at the
Dumbarton Bridge site between January and March
samplings) and the presence of a large phytoplankton
bloom (chl az75 Ag/L), copper concentrations and theassociated speciation remained relatively constant
between sampling periods. This suggests that the
phytoplankton community in the bloom does not
appreciably influence the presence of copper-binding
organic ligands, [CuT], or [Cu2+] in San Francisco Bay.
This is consistent with previous studies which have
shown that diatom blooms in San Francisco Bay
incubation experiments do not substantially impact
copper concentrations or speciation (Beck et al., 2002),
further evidence that the CuL1 complexes are rela-
tively inert with respect to phytoplankton assimilation.
Ligand and dissolved copper concentrations were
lowest at the Yerba Buena Island site through both
2003 sampling periods (Jan: [Cuamb]=19 nM, [L1]=54
nM, [L2]=75 nM; Mar: [Cuamb]=18 nM, [L1]=22 nM,
[L2]=48 nM) and generally increased further away
from the mouth of the bay and into the farthest North
and South Bay sites. The low concentrations of ligands
and CuT at Yerba Buena Island are not surprising, as
this site has the most influence from the NE Pacific
Ocean, where total dissolved copper concentrations
are very low ([CuT]=~1 nM, [L1]=~1.5 nM) (Coale
and Bruland, 1988; Coale and Bruland, 1990).
Opposing trends between [CuT] and free [Cu2+]
were observed, with the highest [Cu2+] values at
Yerba Buena Island ([Cu2+]=10�13.3 M), where there
was the lowest [CuT] and the least excess of strong L1
ligands. Additionally, the sites with the highest [CuT],
Grizzly Bay and Dumbarton Bridge, possessed the
highest excess ligand concentrations and the corre-
spondingly lowest [Cu2+]. Regardless, at every site
sampled and over both of the sampling periods,
ambient [Cu2+] never exceeded 10�13 M, a concen-
tration low enough to be nontoxic to the residing
phytoplankton population (Brand et al., 1986).
For the [Cu2+] to exceed 10�11 M at Dumbarton
Bridge, as depicted in Fig. 7, [CuT] would need to
approach the site-specific SSO of approximately 108
nM (or 6.9 Ag/L). This observation (that a [CuT] of
~108 nM is a concentration that would increase
[Cu2+] to concentration near or above 10�11 M) is
true for the majority of the remaining sites, with the
exception of those with exceptionally high (i.e.,
Grizzly Bay) or low (i.e., Yerba Buena Island) ligand
concentrations, where the site is going to be much less
and much more sensitive, respectively, to increases in
total dissolved copper concentrations.
The value of 6.9 Ag/L was derived from a water
effects ratio suggesting that South Bay waters were
less toxic and could handle higher [CuT] without
having adverse effects on sensitive indicator species
(Environmental Services Department, 1998). This
decreased toxicity of South Bay waters is due to the
presence of strong copper-complexing ligands, which
may not be present at such elevated concentrations at
other study sites, such as along the California coast—
or even at other study sites within San Francisco Bay,
where total dissolved copper concentrations and
copper-binding ligand concentrations are also much
lower (i.e., Yerba Buena Island site).
Donat et al. (1994) examined copper speciation at
the Dumbarton Bridge site in May and October of
1991. The authors also used CLE-ACSV, but uti-
lized the ligand 8-hydroxyquinoline (8-HQ) with an
aCu(8-HQ)20=105. This corresponds approximately with
the competition strength of an [SA]=10 AM. Using
8-HQ at this site, Donat et al. (1994) estimated a
single ligand class, L1, of [L1]=12.8F3.7 nM with
log KCuLi,Cu2+
cond =13.8 and [Cuamb] of 45.6 nM. This
ligand concentration is significantly lower than what
we observed in this study during any of the seasons.
This might infer that a significant change in ligand
concentrations has occurred over the last decade.
The ambient total dissolved copper measured during
the 1991 study of 45.6F0.7 nM is higher than the
current values, but more notably, it is much higher
than the ambient strong Cu-binding ligand concen-
trations determined during their study (Donat et al.,
1994). The excess of total [Cuamb] over the lower
concentrations of L1 leads to elevated [Cu2+] and
K.N. Buck, K.W. Bruland / Marine Chemistry 96 (2005) 185–198 197
the possibility that the system was stressed by
copper toxicity, particularly for the most sensitive
microorganisms.
Following a method closely related to that pre-
sented here, Beck et al. (2002) reported copper
speciation data at Dumbarton Bridge in San Francisco
Bay in April 2000. Using the CLE-ACSV technique
with SA as the added ligand, the authors detected a
total dissolved copper concentration of 32 nM. Addi-
tionally, using an [SA]=2.5 AM, the strong ligand
class identified, with a log KCuLi,Cu2+
cond =12.1, was in
excess of the ambient dissolved copper at concen-
trations of 57 nM, resulting in free Cu2+ concen-
trations of 10�12 M. These values compare well with
data from the January and March 2003 data sets
reported here, indicating strong complexation of the
ambient dissolved copper at this site.
6. Conclusion
The ability to vary the analytical competition
strength by using the same competing ligand at
different concentrations is a property unique to CLE
methods. SA is particularly conducive to this applica-
tion, as it will adequately compete for the copper in
solution over a relatively wide range of concentrations.
The concentrations of SA employed in these analyses
were chosen in order to provide a wide range in the
value of aCu(SA)x, which allowed a more comprehen-
sive characterization of the copper speciation in San
Francisco Bay.
Employing multiple analytical windows for copper
titrations at each site is particularly valuable when
used in conjunction with [CuT*] versus log [Cu2+]
plots. Each analytical window gives a slightly differ-
ent perspective on the dissolved copper speciation
within a system and provides a continuum of values,
which can be used to predict the carrying capacity of
the ligand pool. The overlap of these analytical
windows on a [CuT*] versus log [Cu2+] plot affords a
graphical portrayal of the ambient [Cu2+] as the Cu-
binding ligands are titrated, and makes it possible to
predict the impact of increased total dissolved copper
concentrations on [Cu2+]. Without utilizing a range of
analytical windows, the data would not be available to
permit the examination of both the ambient [Cu2+]
and the ligand pool carrying capacity.
In San Francisco Bay, strong copper-complexing
ligands dominate the chemical speciation of dissolved
copper. The concentrations of these ambient organic
ligands exceeds the total dissolved copper concen-
trations at every site, and it is these ambient ligands
which complex greater than 99.9% of the dissolved
copper. The strong organic complexation of the
copper results in very low free hydrated Cu2+ ion
concentrations. Regardless of site or season, the
[Cu2+] values throughout San Francisco Bay did not
exceed 10�13 M, suitably below the toxicity limit for
aquatic microorganisms.
There is insufficient evidence at this time to be able
to conclusively state that there has been a major
change in the concentration of [Cu2+] in the South San
Francisco Bay during the last decade. However, the
data from Lessin et al. (unpublished) in summer 2001,
from Beck et al. (2002) in April 2000, and from this
study in January and March 2003, all support the
conclusion that, since 2000, the copper speciation in
San Francisco Bay has been dominated by a strong L1
ligand class that maintains free [Cu2+] to levels easily
tolerated by the ambient phytoplankton communities.
In addition, this work has reinforced the importance of
the weaker L2 ligand class in supporting the strong
ligands in San Francisco Bay, providing the ability to
buffer the water against subtle changes in total
dissolved copper concentrations within the Bay.
Acknowledgements
We thank Bettina Sohst for the nutrient analyses,
Sara Tanner at Moss Landing Marine Laboratories for
the DOC data, the UCSC GIS lab, and captain Gordon
Smith of the R/V David Johnston. We also thank Stan
van den Berg, Eric Achterberg and an anonymous
reviewer for their helpful comments. This work was
supported by a grant from the California Water
Resources Control Board. Support for K.N. Buck
also came from NSF grant OCE-0137085 and as an
Ida Benson Lynn Graduate Fellow in Ocean Health.
References
Anderson, D.M., Morel, F.M.M., 1978. Copper sensitivity of
Gonyaulax tamarensis. Limnology and Oceanography 23 (2),
283–295.
K.N. Buck, K.W. Bruland / Marine Chemistry 96 (2005) 185–198198
Beck, N.G., Bruland, K.W., Rue, E.L., 2002. Short-term biogeo-
chemical influence of a diatom bloom on the nutrient and trace
metal concentrations in South San Francisco Bay microcosm
experiments. Estuaries 25 (6A), 1063–1076.
Brand, L.E., Sunda, W.G., Guillard, R.R.L., 1986. Reduction of
marine phytoplankton reproduction rates by copper and cad-
mium. Journal of Experimental Marine Biology and Ecology 96,
225–250.
Bruland, K.W., Rue, E.L., Donat, J.R., Skrabal, S.A., Moffett, J.W.,
2000. Intercomparison of voltammetric techniques to determine
the chemical speciation of dissolved copper in a coastal sample.
Analytica Chimica Acta 405, 99–113.
Campos, M.L.A.M., Van den berg, C.M.G., 1994. Determination of
copper complexation in seawater by cathodic stripping voltam-
metry and ligand competition with salicylaldoxime. Analytica
Chimica Acta 284, 481–496.
Coale, K.H., Bruland, K.W., 1988. Copper complexation in the
Northeast Pacific. Limnology and Oceanography 33 (5),
1084–1101.
Coale, K.H., Bruland, K.W., 1990. Spatial and temporal variability
in copper complexation in the North Pacific. Deep-Sea Research
I 37 (2), 317–336.
Cutter, G.A., 1991. Trace-elements in estuarine and coastal
Waters—United States studies from 1986–1990. Reviews of
Geophysics 29 (Part 2 Suppl. S), 639–644.
Donat, J.R., Lao, K.A., Bruland, K.W., 1994. Speciation of
dissolved copper and nickel in South San Francisco Bay: a
multi-method approach. Analytica Chimica Acta 284, 547–571.
Environmental Services Department, C.o.S.J., 1998. Development of
a Site-Specific Water Quality Criterion for Copper in South San
Francisco Bay. San Jose/Santa Clara Water Pollution Control
Plant, San Jose, CA.
EPA, 1997. Water quality standards: establishment of numeric
criteria for priority toxic pollutants for the State of California.
Federal Registrar 62 (150), 1–50.
Flegal, A.R., et al., 1996. Metal contamination in San Francisco
Bay waters: historic perturbations, contemporary concentra-
tions, and future considerations. In: Hollibaugh, J.T. (Ed.), San
Francisco Bay: The Ecosystem. Pacific Division of the
American Association for the Advancement of Science, San
Francisco, pp. 173–188.
Hudson, R.J.M., Rue, E.L., Bruland, K.W., 2003. Modeling
complexometric titrations of natural water samples. Environ-
mental Science & Technology 37, 1553–1562.
Kogut, M.B., Voelker, B.M., 2001. Strong copper-binding behavior
of terrestrial humic substances in seawater. Environmental
Science & Technology 35, 1149–1156.
Kogut, M.B., Voelker, B.M., 2003. Kinetically inert Cu in coastal
waters. Environmental Science & Technology 37, 509–518.
Kozelka, P.B., Bruland, K.W., 1998. Chemical speciation of
dissolved Cu, Zn, Cd, Pb in Narragansett Bay, Rhode Island.
Marine Chemistry 60 (3–4), 267–282.
Lessin, L., 2001. Copper speciation in San Francisco Bay: a look at
spatial variability. Master of Science Thesis, University of
California, Santa Cruz, CA. 106 pp.
Mantoura, R.F.C., Riley, J.P., 1975. The use of gel filtration in the
study of metal binding by humic acids and related compounds.
Analytica Chimica Acta 78, 193–200.
Miller, L.A., Bruland, K.W., 1997. Competitive equilibration
techniques for determining transition metal speciation in natural
waters: evaluation using model data. Analytica Chimica Acta 343
(3), 161–181.
Moffett, J.W., Brand, L.E., Croot, P.L., Barbeau, K.A., 1997. Cu
speciation and cyanobacterial distribution in harbors subject to
anthropogenic Cu inputs. Limnology and Oceanography 42 (5),
789–799.
Ogawa, H., Ogura, N., 1992. Comparison of two methods for
measuring dissolved organic carbon in sea water. Nature 356,
696–698.
Parsons, T.R., Maita, Y., Lalli, C.M., 1984. A Manual of Chemical
and Biological Methods for Seawater Analysis. Pergammon
Press, Oxford. 173 pp.
Rue, E.L., Bruland, K.W., 1995. Complexation of iron(III) by natural
organic-ligands in the Central North Pacific as determined by a
new competitive ligand equilibration adsorptive cathodic strip-
ping voltammetric method. Marine Chemistry 50, 117–138.
Ruzic, I., 1982. Waters and its information for trace metal
speciation. Analytica Chimica Acta 140, 99–113.
Sharp, J.H., Benner, R., Carlson, C.A., Dow, R., Fitzwater, S.E.,
1993. Re-evaluation of high-temperature combustion and
chemical oxidation measurements of dissolved organic carbon
in seawater. Limnology and Oceanography 38, 1774–1782.
Stoecker, D.K., Sunda, W.G., Davis, L.H., 1986. Effects of copper
and zinc on two planktonic ciliates. Marine Biology 92, 21–29.
Sunda, W.G., Guillard, R.R.L., 1976. Relationship between cupric
ion activity and the toxicity of copper to phytoplankton. Journal
of Marine Research 34, 511–529.
Sunda, W.G., Tester, P.A., Huntsman, S.A., 1987. Effects of cupric
and zinc ion activities on the survival and reproduction of
marine copepods. Marine Biology 94, 203–210.
Sunda, W.G., Tester, P.A., Huntsman, S.A., 1990. Toxicity of trace
metals to Acartia tonsa in the Elizabeth River and Southern
Chesapeake Bay. Estuarine, Coastal and Shelf Science 30,
207–221.
Van den berg, C.M.G., 1982. Determination of copper complexation
with natural organic ligands in sea water by equilibrium with
MnO2: I. Theory. Analytica Chimica Acta 11, 307–312.
Van den Berg, C.M.G., Merks, A.G.A., Duursma, E.K., 1987.
Organic complexation and its control of the dissolved concen-
trations of copper and zinc in the Scheldt Estuary. Estuarine,
Coastal and Shelf Science 24, 785–797.