Embed Size (px)
Citation preview

Economics Working Paper
Series Working Paper No. 1615
Copy trading
Jose Apesteguia, Jörg Oechssler and Simon Weidenholzer
Updated version: September 2019
(March 2018)

Copy trading∗
Jose Apesteguia, Jörg Oechssler, and Simon Weidenholzer†
September 17, 2019
Abstract
Copy trading allows traders in social networks to receive information on the success of
other agents in financial markets and to directly copy their trades. Internet platforms
like eToro, ZuluTrade, and Tradeo have attracted millions of users in recent years. The
present paper studies the implications of copy trading for the risk taking of investors.
Implementing a novel experimental financial asset market, we show that providing
information on the success of others leads to a significant increase in risk taking of
subjects. This increase in risk taking is even larger when subjects are provided with
the option to directly copy others. We conclude that copy trading leads to excessive
risk taking.
JEL codes: C91, D81, G12, G20, G41.
Keywords: Copy trading; Financial markets; Social networks; Imitation; Experiment.
∗We would like to thank Patryk Bronka, Angelo Gutierrez and Pablo Lopez-Aguilar for outstandingresearch assistance. Seminar audiences at the Arne Ryde Conference Lund, Bolzano, Heidelberg, HeiKa-
MaX, Experimental Finance Conference Heidelberg, EWEBE, Tilburg, University of International Business
and Economics (Beijing), UCSB, USC, WZB Berlin, and LISER provided useful comments. We are also
thankful to Dan Friedman, Ed Hopkins, Michael Kirchler, Tatiana Kornienko, Andreas Reischmann, and
Utz Weitzel for very useful discussions. Financial support by the University of Heidelberg, the Bank of
England and the Spanish Ministry of Science (PGC2018-098949-B-I00) is gratefully acknowledged.† Apesteguia: ICREA, Universitat Pompeu Fabra and Barcelona GSE, 08005 Barcelona, Spain, email:
[email protected]. Oechssler: Department of Economics, University of Heidelberg, Bergheimer Str.
58, 69115 Heidelberg, Germany, email: [email protected]. Weidenholzer: Department of Economics,
University of Essex, Wivenhoe Park, Colchester, CO4 3SQ, United Kingdom, email: [email protected].
1 Introduction
The last years have witnessed the proliferation of a variety of copy trading platforms.
These are online brokerage platforms where users, embedded in a social network, receive
information about the financial positions of others and, most importantly, can decide to
automatically copy the financial decisions of other users. That is, copy trading platforms
offer the possibility of allocating a monetary endowment to reproduce the financial strate-
gies of the user one wants to copy. There are currently more than a dozen such platforms,
with millions of users spread all over the world.1 This is a new trading mechanism with
potentially significant welfare consequences, both for the individual investors involved in
such platforms and for societies in general. In this paper we conduct, for the first time, a
series of controlled laboratory experiments to study several aspects of copy trading.
Copy trading platforms may influence behavior in various ways. It seems reasonable
to think, though, that their very nature, their main institutional characteristics, are con-
ducive of imitative behavior, both indirectly and directly. Indirectly, through providing
information on portfolios and success of others that users may try to emulate by them-
selves, and directly by allowing investors to directly copy others by the click of a button.
Copy trading platforms, thus, provide an institutionalized framework for imitation to take
place. As already observed by Offerman and Schotter (2009) in a different context, when
payoffs are noisy, imitation may lead subjects to adopt risky choices. In the setting of a
financial market, where asset prices are naturally volatile, imitation — for example in the
form of copy trading — may have particularly stark implications. To see this, note that
investors with high earnings may have just been lucky. Under copy trading other investors
are inclined to imitate those lucky investors. To make matters worse, high returns might be
associated with high risk taking of the copied investors. Thus, successful investors might
not only have been lucky, but may have also taken more risk. Copiers may, hence, be more
likely to adopt risky investment strategies. Thus, copy trading may well result in excessive
risk taking and individually and socially suboptimal outcomes. We, therefore, believe that
it is of great importance to study the behavioral implications of copy trading platforms.
In this paper we examine copy trading and its implications for risk taking in a series of
laboratory experiments. The experimental laboratory allows us to control for a number of
key variables that would be very difficult, if not impossible, to control for in the field. For
1See Section 3 for a more detailed description of copy trading and for a survey of various copy trading
platforms.
1

example, in our studies we will measure risk preferences outside the financial markets, which
will permit us to determine optimal asset choices at the individual level. Moreover, the
experimental approach allows us to directly test the influence of the main characteristics of
copy trading platforms, namely, the provision of information on the financial decision and
success of others, and the possibility of copying others. That is, it enables us to compare
outcomes under copy trading to the counterfactual of not being able to copy trade, and test
whether this induces more risk taking behavior. Moreover, we will have full control of the
menu of financial assets, the portfolio of the investors, information on the characteristics
of the assets, and of the market results.
Our experiment consisted of three parts. In the first part we elicited subjects’ risk
preferences. The second part was composed of two blocks of investment decisions. In these
decisions subjects had to choose one of multiple assets whose prices evolved according to
a Brownian motion (approximated by a Binomial tree model in discrete time; Cox, Ross,
and Rubinstein, 1979). The assets were characterized by different state dependent rates of
return. Further, some assets featured tail risk, which we modeled as the probability of a
crash to a relatively low price. Subjects were made aware of all attributes of the available
assets. After choosing their assets, subjects for a number of periods had to decide whether
to sell the asset at the current price or keep it.
In the second block subjects were confronted with the same investment problem. De-
pending on the treatment, there were additional components. In the BASELINE treatment,
the second block consisted of the exact repetition of the investment situation subjects con-
fronted in the first block. In our main treatment, COPY, investors received a list containing
the decisions and realized profits in the first block of all the investors in BASELINE, or-
dered from highest to lowest realized payoffs. Then, subjects could either make their own
investment choice, or could choose to copy the unknown investment decisions in the second
block of a subject of their choice from the list. In the latter case, copiers then simply re-
ceived the yet unknown payoffs the copied subjects had earned in the second block. Finally,
in treatment INFO subjects saw the same ranking list as in COPY but were not able to
copy others. Treatment INFO thus examines the pure effect of providing information on
the investment decisions of others. As such the findings from this treatment do not only
apply to copy trading but extend to the wider domain where investors receive information
about peers.2
2Examples include rankings of stock market traders or investment funds and less formal exchange of
information among traders working in the same investment firm.
2

We are interested in the determinants of copying behavior. The comparison between
BASELINE and INFO allows to ascertain the behavioral effect of the mere provision of
information about others. The comparison between INFO and COPY shows the influence of
the main characteristic of copy trading platforms: the possibility of copying the financial
decision of others by the click of a button. The comparison of BASELINE and COPY
allows for the evaluation of the joint effect of the provision of information on others, and
the possibility of copying them.
Before any investment decision were made, subjects were provided with a tool that
allowed them to simulate price path realizations for each of the assets. The purpose of this
simulator was to familiarize subjects in a user friendly way with the possible outcomes of
the various assets and to mitigate the role of the additional information subjects received
from peers in the COPY and INFO treatments. Analogous tools are being offered in
practice by financial institutions to their costumers.
In the third, and last, part of the experiment, we collected some potentially important
information like gender, age, and education. We also implemented a questionnaire asking
how subjects perceive their tendency to follow others. Additionally, we assessed subjects’
ability to calculate a simple expected value.
Thus, our experimental design uses a financial setting, that allows us to directly study
the influence of the key characteristics of copy trading platforms on financial decision-
making, while controlling for important background information, such as risk preferences.
The main results are the following. We observe that when giving participants the
possibility of copying others a sizable fraction does so, and that the distribution of asset
choices shifts markedly towards riskier ones. Concretely, 35% of participants in COPY
chose to copy someone in the list and, of these, 88% copied somebody who had chosen the
riskiest possible asset in Block 1. Moreover, those who did not choose to copy anybody also
shifted their asset choices towards riskier assets, when compared to the choices in the Block
2 of BASELINE. The latter observation is reinforced by the shift towards riskier assets in
the second block choices of participants in INFO. It seems that the mere presentation of
the ranking list of BASELINE investors prompts other investors to take significantly more
risks. We therefore observe that the type of information provided and the possibility of
copying others present in copy trading platforms, leads investors to choose suboptimal
assets, when judged either from the perspective of the risk aversion revealed in the asset
choices of Block 1, or from the lottery choices in Part 1.
We further address the question of who decides to become a copier. Here we find that
3

risk aversion plays a determinant role. The more risk averse subjects are, the more likely
they are to copy others. Ironically, it is thus those with a revealed low tolerance for risk
taking who are enticed through copy trading to take on more risk. We also evaluated the
influence of other variables such as demographics, use of simulator, and realized payoffs in
Block 1, finding that neither one had a significant effect. There is a weak positive effect
for fields of study other than economics or science, and for those who only inspected the
first five investors in the ranking list of BASELINE investors.
The remainder of the paper is organized as follows. Section 2 briefly reviews the most
relevant literature. In Section 3 we explain in some detail how copy trading platforms
work. Section 4 details the experimental design and establishes the theoretical framework.
In Section 5 we suggest a number of partly competing hypotheses, that we later test using
our dataset. Section 6 reports the experimental results. Section 7 discusses our results and
concludes. The Appendix contains the proof to the main theoretical result of Section 4,
sample price paths of our various assets and the experimental instructions.
2 Related Literature
Our paper relates to several strands of literature. First, imitation as a behavioral heuristic
has attracted the attention of the economics literature. It has been shown that imitation
can represent an attractive decision procedure in certain circumstances (Schlag, 1998; Alós-
Ferrer and Schlag, 2009), but it can lead to sub-optimal outcomes in other settings, such
as Cournot games (Vega-Redondo, 1999; Apesteguia et al. 2007, 2010). Imitation has also
been shown to play an important role in traditional investment decision making (see e.g.
Scharfstein and Stein, 1990; De Long et al. 1990; or Bikhchandani et al. 1992). Relatedly,
Goeree and Yariv (2015) and Duffy et al. (2019) show in the context of social learning
experiments that a sizeable fraction of subjects has a strong taste to follow others even
when there is no information on performance.
The closest papers to us are Offerman and Schotter (2009), Bursztyn et al. (2014), and
Gortner and van der Weele (2019). While these contributions experimentally study the
implications of providing information on peers on risk taking in economic decision making,
we are the first to explicitly study copy trading in an experimental setting by allowing sub-
jects to copy others at the click of a button. In contrast to our financial setting, Offerman
and Schotter (2009) use a production choice and a takeover game to study the role of peer
information in environments where payoffs are influenced by a random component. While
4

imitation is not optimal in their setting, they nonetheless find that it plays an important
role in explaining subjects’ behavior and may lead to more risky behavior. Bursztyn et al.
(2014) find in a field experiment that financial market professionals are influenced by their
peers due to both, “social learning” and “social utility”. In our setting, objectively there
should be limited scope for social learning as most of what can be learned by observing
others can also be learned by using the tool for simulating assets. One may, however, think
that other traders are better in judging when to sell the asset. The social utility channel
is clearly important in actual copy trading platforms as traders can chat with each others.
However, in our experiment there is no chat and interaction is anonymous. Moreover, we
only offer an anonymized ranking list of investors participating in a different experimental
treatment. Our experimental design, therefore, purposely closes the “social channels,” in
order to isolate the possible behavioral influence of informational ones. Gortner and van
der Weele (2019) experimentally study double auctions of Arrow-Debreu securities with
and without peer information. In their setting, observing the portfolios of other traders
yields traders to buy less risky portfolios. However, this effect is neutralized when traders
are ranked by their success. In addition to studying a different trading environment and
not considering the possibility to directly copy other traders, there are two further differ-
ences to our design: i) There is no trade-off between expected earnings and risk and ii)
subjects were constantly updated about the hypothetical payoffs in each state of the world.
Both of these features may have pushed subjects towards less risk taking.
There are other related papers studying the effect of providing information on perfor-
mance rankings on the behavior of investors. For example, Dijk, Holmen and Kirchler
(2014) show that rankings decrease (increase) future risk taking of over-performers (under-
performers), and Kirchler, Lindner, and Weitzel (2018) find that rankings increase risk
taking of underperforming financial market professionals.3 Note, however, that in our ex-
periments participation was anonymous, and the performance rankings involved the results
of participants from previous experimental sessions.
There is ample evidence that various forms of social context may affect behavior.
Bohnet et al. (2008) and Bolton and Ockenfels (2010) show that risk taking behavior
may not only be affected by the consequences the available options have for oneself but
also for other subjects. Cooper and Rege (2011) study the effect of information on previous
choices by other subjects, but not on their realized outcomes, on decision making under risk
3See also Hopkins and Kornienko (2004) for the influence of rankings on consumption choices, and
Trautmann and Vieider (2012) for a survey.
5

and uncertainty. They show that this type of social information leads to less risk taking.
In addition, they find evidence in favor of social regret, that is decisions being influenced
by an amelioration of regret considerations if others chose the same option.4 Note that in
our experimental design the options only had financial consequences for a given investor,
social information stemmed from subjects in other treatments and included information on
their performance.
There are also a number of recent papers that study copy trading platforms empir-
ically. Using data from the copy trading platform eToro, Pan et al. (2012) find that
followed traders are, often but not always, the most successful. In addition, they show that
users of the trading platform tend to increase the trading strategy volatility and market
overreaction. Further, Liu et al. (2014) show that copied trades have a larger probability
of positive returns than standard trades, but the return on investment of successful copy
trades is smaller than the return of standard successful trades. Further, in case of negative
returns, losses are typically higher for copied trades. Also using data from eToro, Pelster
and Hoffmann (2018) show that investors who are being copied by other investors are more
likely to suffer from a disposition effect.5
The binomial tree model we use to implement a stylized financial market has been
used elsewhere in the economic and finance literature to study a variety of questions.
For instance, Oprea et al. (2009) and Sandri et al. (2010) study circumstances under
which individuals optimally (de)-invest in assets, the prices of which evolve according to
binomial tree models. Further, Ensthaler et al. (2017) demonstrate in a binomial tree
model framework that subjects face difficulties predicting the median and skewness of
asset price distributions resulting from multiplicative growth processes. Note that the use
of the asset simulator in our experiment should mitigate these concerns.
3 Copy Trading Platforms
The rise of network platforms such as Uber, Twitter, or TripAdvisor has profoundly shaped
social interactions and fundamentally changed entire industries such as transport, news
media, or tourism. Using similar ideas, specialized social networking platforms that cater
4Carbone and Duffy (2014) show that providing information on the average consumption of others move
individuals further away from the optimal path in a deterministic, intertemporal lifecycle consumption
optimization problem.5Heimer (2016) shows that this holds also for traders who can be observed on a social trading platform.
However, Gemayel and Preda (2018) observe the opposite.
6

to financial investors have been created, thus giving rise to social trading. While still in its
infancy, social trading might have similar transformative impact on the finance industry.
Social trading platforms typically also double as online brokerage firms, providing their
members with the possibility to trade financial assets via a web-interface or a mobile app.
Rather than charging their members subscription fees, social trading platforms typically
earn revenues through the bid-ask spread on transactions. As such, platforms are interested
in generating high levels of trading volume. In addition to traditional trading features,
social trading platforms provide individual investors with means to communicate with each
other (through e.g. a chat function or public posts) and enable them to access information
on current and past investments. Typically, these platforms supplement the exchange of
information by allowing traders to directly copy the investment choices of other traders.
Copying another investor entails dedicating a share of one’s budget to follow the trades
of the copied individual (from now on we call such investors “leaders”). After an investor
has decided to copy a given leader, all trades of the leader are replicated for the copier
simultaneously and in real time.6 For example, eToro can guarantee copiers the same
prices as those of the leaders by conducting all transactions as contracts-for-differences
(see Pelster and Hoffmann, 2018, for details). Most transactions take place in very liquid
markets like foreign exchange markets.7
All trades are proportional to one’s budget, i.e. if leaders invest 1% of their portfolio,
copiers do so as well. The copier may at any time decide to un-copy the leader at which
time the relationship ends and all copied positions are closed at the current market price.
Platforms usually also provide ways to rank traders according to certain performance
criteria such as return in the previous month, or year, or percentage of profitable trades.
Additional filters allow to narrow down the rankings by criteria such as time active, country
of origin, or markets in which the trader is active. Some platforms additionally assign risk
scores to investors, taking into account indicators such as leverage, volatility of the chosen
instruments, and portfolio diversification.
Most platforms reward investors for being copied. For instance, ZuluTrade offers its
“signal providers” in foreign exchange trading a commission of 0.5pip on trading volume
executed through a copier. Similarly, eToro under its “popular investor” program offers
6When deciding whether to copy a leader the copier may also choose whether this should include currently
open positions. Some platforms additionally allow investors to place stop orders on the performance of the
copied individual.7Pelster and Hofmann (2018) show that about 85% of transactions on eToro take place on FOREX
markets.
7

fixed payments and up to 2% of the amount of equity copying the relevant popular investor.
In addition, popular investors may receive up to 100% spread rebate on their own trades.8
These and similar schemes provide incentives for traders to allow others to observe and
copy their trades, rather than trading privately.
At the time of writing there are at least a dozen active copy trading platforms. While
they are nowadays relatively small, they involve millions of users spread all over the world,
and there are indications that they are rapidly growing in size, employing aggressive mar-
keting strategies. One of the larger of these, eToro, has 9 million subscribers and according
to its CEO has had an annual trading volume in excess of 300bn dollars in 2016.9 Table 1
provides an overview and some information on ranked traders active in May 2018, on four
large copy platforms.10 Evidently, there are few investors, relative to the number of in-
vestors appearing in the rankings, who are copied by others. Specifically, the proportion of
those copied ranges from 1.13% to 8.71%. Figure 1 plots the distribution of copiers across
the four platforms under consideration. This reveals two further stylized facts about copy
trading: Firstly, the vast majority of leaders are only copied by a few other traders. The
fraction of those copied by only one other trader (among those copied) ranges from 20.7%
(ZuluTrade) to 59.5% (eToro). Secondly, a few traders account for the majority of copied
trades. The top 5% of leaders accounts for 61.1% (ZuluTrade) to 92.8% (eToro) of copier
relationships.
Table 1: Copy trading platforms
Platform Age in years Ranked users Number of leaders Share of leaders
eToro 14 193 701 2 417 125%
ZuluTrade 10 36 416 460 126%
Tradeo 13 4 686 53 113%
Meta Trader 4 13 3 376 294 871%
8See https://www.etoro.com/en/popular-investor/ and https://www.zulutrade.co.uk/trader-program9See https://uk.reuters.com/article/us-tech-etoro-fundraising/israeli-social-trading-firm-etoro-raises-
100-million-in-private-funding-idUKKBN1GZ15S and 09:24 in an interview with eToro CEO Yoni Assia
https://www.youtube.com/watch?v=P2yRjHAAPeU&vl=en10Data was obtained using a Python script to automatically collect publicly available information on
investors in copy trading platforms.
8

05
000
1000
01
500
0N
umb
er o
f co
pie
rs0 500 1000 1500 2000 2500
FrequencyTraders from the eToro ranking with at least 1 copier; n = 2471
eToroDistribution of copiers
05
0010
00
1500
Num
ber
of c
opi
ers
0 100 200 300 400Frequency
Traders from the ZuluTrade ranking with at least 1 copier; n = 460
ZuluTradeDistribution of copiers
010
020
030
04
005
00N
umb
er o
f co
pie
rs
0 50 100 150 200 250Frequency
Traders from the MT4 ranking with at least 1 copier; n = 294
Meta Trader 4Distribution of copiers
05
00
100
01
500
200
0N
umb
er o
f co
pie
rs
0 10 20 30 40Frequency
Traders from the Tradeo ranking with at least 1 copier; n = 51
TradeoDistribution of copiers
Figure 1: Copiers across platforms. Each dot represents one leader and his/her number of
copiers. Shown are only leaders with at least one copier.
4 Experimental Design and Theoretical Predictions
Our experiments consisted of three parts; Part 1 features a standard risk elicitation exer-
cise, Part 2 contains the main financial asset decision problem, and Part 3 implements a
questionnaire. We conducted three treatments, that differed only in the second block of
the second part. We now explain the details of the experiment.
In Part 1 we elicited risk preferences in a modified Eckel and Grossman (2002) decision
task. Individuals had to choose one out of the four lotteries in Table 2, where in each lottery
there was a high and a low outcome, both of which occurred with probability 1/2. Table
2 also reports the range of coefficients of relative risk aversion, , that makes choosing the
respective lottery optimal under the assumption of expected utility with CRRA.11 Note
that Lottery 4 should only be chosen by risk loving individuals since 0.
Part 2, the main part of the experiment was divided into two blocks. In Block 1, which
11That is, the Bernoulli utility function used is () = 1−(1− ) for 6= 1 and () = log otherwise,where the parameter represents the (relative) risk aversion coefficient. Other often used utility functions,
like expected utility with CARA or mean-variance utility, give the same ranking of lotteries in terms of
riskiness.
9

Table 2: Parameters of the Lotteries
Lottery High outcome Low outcome Risk coefficient
1 8 7.20 5 7.6 0.57
2 15 6.40 034 5 10.7 6.08
3 18.60 4.00 −017 034 11.3 10.32
4 20.80 0.80 −017 10.8 13.63Note: The high and low outcomes (in euro) were chosen with probability 1/2 each. and denote the
expected value and standard deviation, respectively.
was common to all three treatments, subjects were presented with four different financial
assets. Every individual had to select one asset out of the four, and once an asset has been
chosen, had to decide in each period whether to hold the asset or sell it at the current
price. If an asset was held until the last period, the individual received the final price as
payoff. After an asset was sold, this block was finished for the subject, no further trading
could take place.
The asset prices followed a geometric Brownian motion, approximated by a Binomial
tree model. The price of asset at time , denoted by (), moved upwards with probability
(1− )(1− ) to ()(1 + ) with 0 and moved downwards with probability (1− )
to ()(1 + ) with 0. With probability the asset crashed to a crash value of 50
and remained there. We introduced the crash possibility because it implies a substantial
amount of tail risk, which is common in financial assets like options. This should make the
riskiness of these assets very transparent and salient.12
The four assets had in common that all started with an initial value of 100, involved a
maximum of 40 periods, and the probability of an uptick (conditional on not crashing) was
= 5. The remaining parameters defining the assets are described in Table 3, together
with their corresponding expected values and standard deviations, conditional on holding
them for all the periods. The realizations of the stochastic processes were i.i.d. across
periods and participants.
Intuitively, the assets are ordered in terms of the risk they involve, with asset rep-
resenting a safe option giving a fixed monetary payoff of 100, asset involving low risk,
asset representing the case of a moderately risky asset, and finally asset being a
highly risky asset. This would be the ranking of assets for virtually every standard model
12For example, asset D would crash in 80% of cases if held for all 40 periods. This is very noticeable in
the simulations (see online appendix) and in the ranking list tables of treatments COPY and INFO.
10
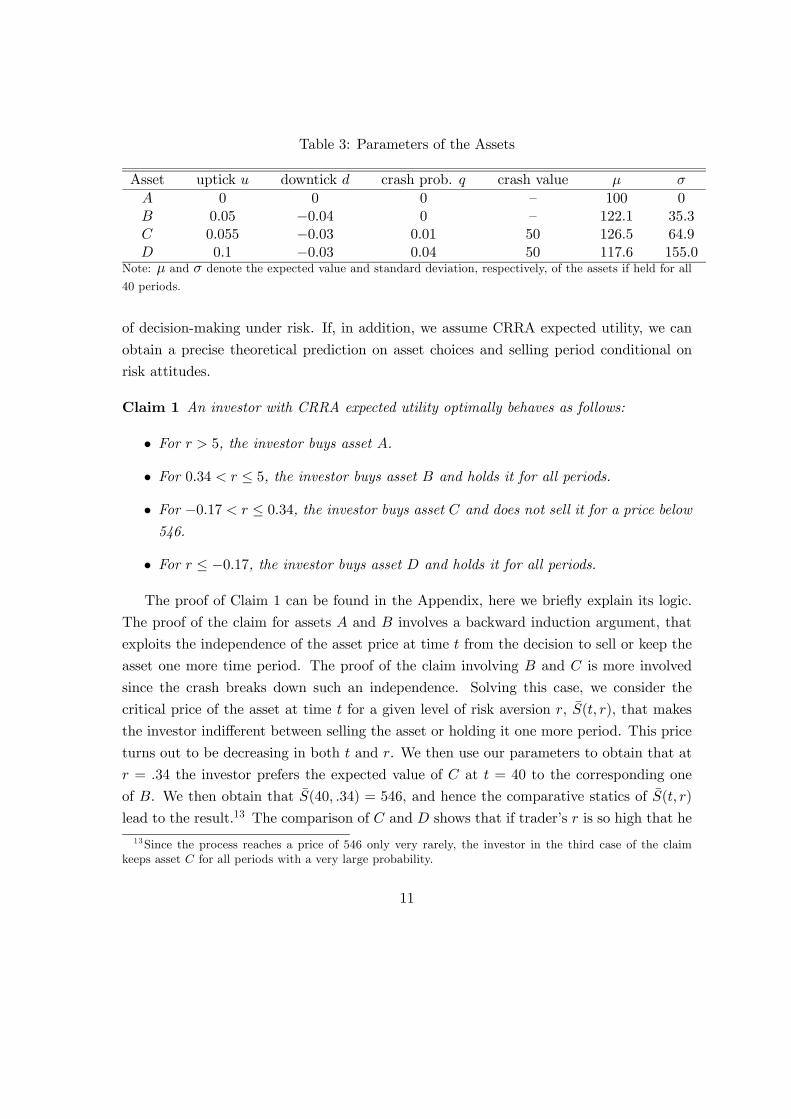
Table 3: Parameters of the Assets
Asset uptick downtick crash prob. crash value
0 0 0 — 100 0
005 −004 0 — 122.1 35.3
0055 −003 001 50 126.5 64.9
01 −003 004 50 117.6 155.0Note: and denote the expected value and standard deviation, respectively, of the assets if held for all
40 periods.
of decision-making under risk. If, in addition, we assume CRRA expected utility, we can
obtain a precise theoretical prediction on asset choices and selling period conditional on
risk attitudes.
Claim 1 An investor with CRRA expected utility optimally behaves as follows:
• For 5, the investor buys asset .
• For 034 ≤ 5, the investor buys asset and holds it for all periods.
• For −017 ≤ 034, the investor buys asset and does not sell it for a price below
546.
• For ≤ −017, the investor buys asset and holds it for all periods.
The proof of Claim 1 can be found in the Appendix, here we briefly explain its logic.
The proof of the claim for assets and involves a backward induction argument, that
exploits the independence of the asset price at time from the decision to sell or keep the
asset one more time period. The proof of the claim involving and is more involved
since the crash breaks down such an independence. Solving this case, we consider the
critical price of the asset at time for a given level of risk aversion , ̄( ), that makes
the investor indifferent between selling the asset or holding it one more period. This price
turns out to be decreasing in both and . We then use our parameters to obtain that at
= 34 the investor prefers the expected value of at = 40 to the corresponding one
of . We then obtain that ̄(40 34) = 546, and hence the comparative statics of ̄( )
lead to the result.13 The comparison of and shows that if trader’s is so high that he
13Since the process reaches a price of 546 only very rarely, the investor in the third case of the claim
keeps asset for all periods with a very large probability.
11

would pick asset , then the critical ̄( ) is never binding, i.e. he would never sell asset
.14
Importantly, the parameters of the assets and those of the lotteries were chosen so that
there is a one to one matching between the lottery choice in Part 1 of the experiment and
the asset choice in Part 2, under the assumption of CRRA expected utility. Hence, we can,
in principle, predict asset choices based on the lottery choices.
In order to facilitate the choices of the subjects, we provided subjects with an asset
simulator at the beginning of Part 2. In the asset simulator, subjects could simulate assets
, and . Each simulation of an asset would graph one possible 40-period realization.
The realizations were independent across clicks and individuals. Individuals could simulate
any of the assets as many times as they wanted.15 We recorded the simulation activity for
each individual. After participants indicated that they had run enough simulations, they
entered the decision stage.
There were three treatments that differed only with respect to Block 2 of Part 2. In
treatment BASELINE participants repeated the same asset choice task as in Block 1. That
is, they had to choose again one of the four assets described above and then decide when
to sell.
In treatment INFO, before deciding which asset to choose in Block 2, participants
received information on the Block 1 choices of assets, selling periods, and associated payoffs
of all 80 subjects that participated in treatment BASELINE.16 Subjects were told that these
data were generated by subjects in earlier experimental sessions and that “(t)hey were in
the same situation as you, i.e. it was the first time they played this game.”17 The list
was ordered from highest to lowest realized payoffs, and presented in groups of 5 entries.
Table 4 reports a sample of the information provided, where the last two columns were only
present in treatment COPY. After inspecting the ranking list, participants had to choose
one of the assets, and then period after period had to decide whether to sell the asset at
that given moment of time, or hold it one more period.
In treatment COPY, participants received exactly the same information as those in
14For reference, note that if a risk neutral expected utility maximizer were to choose for whatever reason
asset B (or asset D), he would, applying a similar argument as in the proof of claim 1, hold it until the end
(as long as the price of asset D is below 312.5, respectively).15For illustrative purposes we report a number of simulations in the online appendix.16Note that subjects in INFO or COPY received no information on the Block 2 decisions of the BASELINE
participants before their Block 2 decisions. Copiers were subsequently informed of the asset choice, the
selling period and the obtained payoffs of their chosen leader.17Note that this design feature excluded the possibility that subjects might end up copying each other.
12

Table 4: Ranking list provided to subjects in INFO and COPY
Rank Id Asset Sold in period Profits Option
1 12 32 354 Copy
2 23 25 281 Copy
3 4 40 274 Copy I don’t want to
4 16 29 271 Copy copy choices
5 18 19 254 Copy
See the next 5
participants
Note: This is an example for the ranking list subjects in INFO and COPY saw at the beginning of Block 2.
The “Copy”and “I don’t want to copy choices” buttons were present only for COPY. The list was displayed
in groups of 5. If subjects wanted to see the next 5 on the list, they had to press the “See the next 5
participants” button. If subjects wanted to make their own decisions, they had to press the “I don’t want
to copy choices” button.
treatment INFO. However, now, in order to reproduce the main feature of copy trading
platforms, participants could copy another subject (leader) by pressing a “Copy” button,
as in Table 4. In this case, the copier would obtain exactly the same payoff the leader had
obtained in Block 2 produced by whatever the leader’s choice was in Block 2. That is,
copying implied that one eventually chooses the same asset, sells in the same period, and
obtains the same payoffs as the copied leader in the second block, but all this information
is unknown at the time of copying. To reiterate, all (potential) leaders come from the
BASELINE treatment, which was run before the other treatments. Subjects in the COPY
treatment could thus only become copiers not leaders.
Finally, Part 3 contained a questionnaire where in addition to standard information
(gender, age, field of studies, etc.), we gathered further background information on self-
assessed risk attitudes and tendency to follow others. Further, subjects were asked to
calculate a simple expected value. The experiment was run in German. The translations
of the instructions, including the questions used in this final part of the experiment can be
found in the Appendix.
The experiments were run at the University of Heidelberg in 2017. In total, 176 subjects,
of which 55.1% were female and 32.5% were economics students, were recruited via hroot
(Bock et al. 2014) from a student subject pool in Heidelberg. In 4 sessions 80 subjects
13

were randomly assigned to BASELINE, 48 subjects in 4 sessions to INFO, and 48 subjects
in 3 sessions to COPY. Participants were paid at the end of the experiment according to
one of their decisions from Part 1 (risk elicitation lotteries) or Part 2 (either Block 1 or 2 of
the asset decision problem). The payoff relevant task was randomly selected by a subject
rolling a dice. The payoffs from the lottery were already in euro. The payoffs from the
asset decision problem were paid out using an exchange rate of 1 = 020 euro. Average
earnings were 11.66 euro and an experimental session took approximately 45 minutes. The
experiments were programmed using z-Tree of Fischbacher (2007).
5 Hypotheses
In this section we suggest a number of partly competing hypotheses, which we then test in
our experiment. If subjects are rational and realize that no other subject has any better
information than they themselves, they should simply buy in both blocks the asset that
corresponds to their lottery choice in Part 1. In particular, the feedback that subjects
receive in treatments INFO and COPY about the trading performance of other traders
and their chosen assets is not strictly speaking any new information since there is complete
information on the assets and in addition, each subject has the option to simulate each
asset as often as they like.
Hypothesis 1 Rational subjects buy in both blocks the asset corresponding to their lottery
choice. There should be no treatment difference. If furthermore, subjects’ preferences can
be described by a CRRA utility function, they will conform to Claim 1.
From the experimental literature on imitate-the-best e.g. Huck et al. (1999), Apesteguia
et al. (2007) and Offerman and Schotter (2009), one can deduce that subjects in treatments
INFO and COPY may focus their attention on the best performing subjects when looking
at the list of past performances. This is of course further enhanced by the chosen order
in which the information in Table 4 is presented, as it is typical of copy-trading platforms.
As a consequence of this, subjects would receive a distorted view about the average per-
formance of the various assets. In particular, given that asset D is likely to dominate the
list of top-performers, and if subjects use this distorted information to guide their buying
decisions in Block 2, we should get
Hypothesis 2 Subjects will invest more often in the most risky asset D in Block 2 of
treatments INFO and COPY compared to the BASELINE treatment.
14

Given the popularity of copy trading platforms, we expect that some subjects will take
the option to copy someone in treatment COPY. With respect to the question why people
decide to copy, our experiment is more exploratory. However, given Hypothesis 2, we
conjecture about whom they will copy if they decide to copy.
Hypothesis 3 Copiers will copy most often the top-performers (and therefore those that
invested in the risky asset D).
6 Results
We begin by analyzing the lottery choices of the Eckel and Grossman (2002) risk elicitation
task. Figure 2 (left panel) shows the distribution of lottery choices for all 176 subjects,
where lotteries are ordered from “1” the least risky lottery to “4” the most risky lottery,
as in Table 2. The modal choice is lottery 2, with more than 60% of subjects taking it,
indicating a rather low appetite for risk. The next popular choice is lottery 3, chosen
by approximately 30% of participants, suggesting a significant fraction of subjects willing
to take moderate risks. Only a minor portion of participants are i extremely risk averse
(5.1%) and even fewer (1.7%) are risk loving and chose lottery 4. These results seem to be
in line with other risk aversion elicitation exercises in the literature.18
Result 1 The lottery choices in the Eckel and Grossman risk elicitation task reveal that
participants are quite risk averse. In particular, only 3 out of 176 chose the most risky
lottery 4.
We now turn to Part 2 of the experiment, the asset choices in our financial market.
Recall from Table 2 and Claim 1 that the lotteries were designed to predict asset choices
under the assumption that subjects have CRRA utility functions. Accordingly, only 3
out of 176 subjects (= 17%) are predicted to choose the most risky asset D. Figure 2
(right panel) shows the distribution of asset choices in Block 1 of all 176 subjects and
Table 5 reports the distribution of, both, lottery and asset choices in Block 1. There is
a noticeable shift to more risky asset choices as compared to the lottery choices. This is
neatly appreciated in Table 5 in the shift from the diagonal to, primarily, the upper part
18For example, in Apesteguia and Ballester (2018), using the dataset of Andersen et al. (2008), find
that the mean population CRRA risk aversion level estimated using structural methods is 0752, which
falls within the range of levels implied by lottery 2. This dataset involves a representative sample of 253
subjects of the adult Danish population, making a total of 7,928 lottery choices in Holt-Laury tasks.
15

010
2030
4050
60pe
rcen
t
1 2 3 4
lotteries
010
2030
4050
60pe
rcen
t
A B C D
assets
Figure 2: Distribution of lottery choices (left panel) and asset choices in Block 1 (right
panel), all treatments pooled.
of the matrix, representing the choice of riskier assets. In fact, 21.6% of subjects decided
to choose the most risky asset D and 41% of subjects chose an asset that was more risky
than their chosen lottery. The distribution of asset choices is significantly different from
the distribution of lottery choices according to a Wilcoxon test ( 0001) or a -test
( 0001).19 However, asset and lottery choices are significantly positively correlated
( = 023 = 0002) and, although only 45% of subjects chose exactly the asset predicted
by their lottery choice, the entries in the diagonal in Table 5, 86% of subjects chose an
asset at most one asset lower or higher than their predicted asset.
It seems, therefore, that the financial asset markets makes the population of subjects
behave in a riskier manner than the standard lottery choice problem. There may be different
reasons behind this observation. For example, it may be the case that the financial market
is cognitively more demanding, provoking subjects to behave more erratically. However,
our experimental design offered in a user friendly way the possibility of simulating as many
19All -values reported in this paper refer to two-sided tests except when stated otherwise.
16

Table 5: Distribution of lottery and asset choices in Block 1
Assets
Lotteries Total
1 3 4 1 1 9
2 5 55 30 21 111
3 0 18 20 15 53
4 0 2 0 1 3
Total 8 79 51 38 176
realizations of the assets as one wished.20 This should reduce the complexity of the financial
decision problem and should mitigate the impact of cognitive abilities. Furthermore, the
fact that the choice distribution shifted in one particular direction, namely towards more
risk taking, suggests that complexity is not the only driving force behind this result. It
may well be that the mere framing of a decision problem in terms of financial products
changes the mind of the participants into a more risk tolerant state. We believe that this is
an interesting observation in itself, that deserves to be carefully addressed in future work.21
Result 2 The distribution of asset choices in Block 1 of Part 2 reveals lower levels of risk
aversion than the lottery choices of Part 1, rejecting Hypothesis 1.
Of primary interest is of course how the demand for assets changes in Block 2. One of
the reasons why we included two blocks even for treatment BASELINE was to allow for the
possibility that subjects would change their asset demand simply because of the experience
gained in the first block. To avoid this confound we now compare asset choice in Block 2 for
each treatment. Figure 3 shows the distributions of assets choices in Block 2 separately for
the three treatments, where, for the moment, we exclude the copiers in COPY.22 Figure 3
clearly shows that it is indeed the case that asset choices in BASELINE, INFO and COPY
in Block 2 are significantly different from those in Block 1 (Wilcoxon-test, with = 0021,
20All but one subjects used this tool at least once. On average, subjects used simulations 15.2 times with
a standard deviation of 13.0 and a maximum of 61. However, probit regressions show no significant effect
of the number of simulations on the probability of being consistent between lottery and asset choice.21There is research in psychology showing risk aversion to be domain-specific (see, e.g., Weber et al.,
2002). Likewise, using actual financial decisions, Einav et al. (2012) find that risk preferences may differ
across domains, although they identify a general risk component operating across domains.22See also Table 8 in the online appendix, which reports the corresponding distributions of Block 1 and
Block 2 asset choices.
17

010
2030
4050
010
2030
4050
A B C D A B C D
A B C D
BASELINE COPY
INFOperc
ent
Figure 3: Distributions of asset choices in Block 2 by treatment, where in COPY the choices
of copiers are not included.
0001 and = 0045, respectively, and -test, = 0014, 0001, and = 0077).
The percentages of D-choices are about 32.5%, 47.9% and 51.6% in treatments BASELINE,
INFO and COPY, respectively.
Result 3 Block 2 asset choices are significantly more risky than Block 1 choices in all
three treatments, again rejecting Hypothesis 1.
We now compare Block 2 asset choices across the different treatments (see Figure 3).
The distribution of assets choices in INFO is significantly different from that in BASELINE
(MWU-test, = 0014 -test, = 0014). Also, even when excluding the copiers as
in Figure 3, the difference in the distribution of assets choices between BASELINE and
the non-copiers in COPY is marginally significantly different (MWU-test, = 0078).23
We now consider the intended choices of copiers. When a copier decides to imitate the
choice of a leader who chose asset X in Block 1, we assume that the intended choice of
the copier in Block 2 was asset X, and leaves the decision when to sell the asset to the
23Our directional Hypothesis 2 would allow us to use a one-sided -test, which would yield = 0045
There is no significant difference between COPY, excluding the copiers, and INFO (MWU, = 089).
18

leader. If we include the intended choices of copiers, we find that the distribution of asset
choices is significantly different between BASELINE and COPY at 0001 MWU (-
test, = 0001) It seems, therefore, that the mere provision of information on previous
success of others who were in exactly the same situation increases risk tolerance levels of
participants.
Result 4 Just observing others (as in INFO and COPY, excluding copiers) makes subjects
on average more risk taking in terms of their asset choice than in BASELINE, confirming
Hypothesis 2.
Subjects in INFO and COPY saw a list as in Table 4, which contained the Block 1 asset
choices and earnings of the 80 subjects from the BASELINE treatment. Subjects always
saw the top 5 subjects but had to click a button to see the respective next 5 lower ranked
subjects and we recorded the look-up pattern of subjects. While only 4% of subjects in
INFO stopped after looking at the top-5 screen, 29% of subjects did so in COPY. Thus,
those subjects never saw the possible bad outcomes for asset D. About 40% of subjects in
COPY and more than 54% of subjects in INFO looked at the 5 lowest ranked subjects.
Table 6 shows selling periods and selling prices for the different treatments in Block 2.
For the pooled data, selling periods are similar across treatments but mean selling prices
are higher in COPY and INFO than in BASELINE. The distribution of selling prices in
BASELINE is significantly different from those in COPY and INFO (MWU-tests, = 0002
and = 0004, respectively, -tests, 0001). It is further revealing to consider selling
periods and selling prices for each of the three assets. While these do not vary much for
assets and , there is a noticeable difference between BASELINE and the other two
treatments for the most risky asset D. In COPY and INFO, subjects hold asset D longer
and wait until it reaches higher prices. The distribution of selling period for asset D in
BASELINE is significantly different from those in COPY and INFO (MWU-tests, = 0002
and = 0007, -tests, = 0003 and = 0004, respectively) and the distribution of selling
prices for asset D in BASELINE is significantly different from those in COPY and INFO
(MWU-test, = 0018 and = 0022 -tests, = 0016 and = 0014).
Result 5 Observing others (as in INFO and COPY, excluding copiers) induces subjects
to sell at higher prices. This effect is mainly driven by those choosing the most risky asset.
19

Table 6: Selling periods and prices for different treatments in Block 2
Asset BASELINE INFO COPY
mean selling period
pooled 241 228 247
287 218 250
258 255 330
108 206 215
mean selling price
pooled 1296 1628 1731
1136 1311 1171
1397 1375 1375
1462 2008 2075Note: The data for COPY refers to the decisions of the non-copiers.
Thus overall we find that providing subjects with information on the investment strate-
gies and success of others leads to more risk taking. This is evidence in favor of Hypothesis
2, as opposed to Hypothesis 1. How copiers strengthen this trend will be addressed next.
In total, 17 (35%) subjects in COPY decided to copy someone. In line with Hypothesis
3, all but two of the copiers (88%) chose to imitate a trader from the first page of the list
(i.e. from the top five earners). In fact, 12 of the 17 (71%) chose the top earner. And all
but two subjects (88%) chose a trader who had chosen asset D, the riskiest asset.
Result 6 More than a third of subjects in COPY copied the financial decision of some
other investor on the list. The vast majority of copiers copied the investor with the highest
realized earnings in Block 1. Practically all users copied somebody that chose the riskiest
possible asset, D, confirming Hypothesis 3.
Figure 4 shows the distribution of assets choices in Block 2 of treatment COPY including
the intended choices of copiers. We observe that in COPY 65% of subjects either chose asset
D themselves or decided to copy someone who had chosen asset D in Block 1. This needs
to be contrasted with the 32% of subjects who chose asset D in Block 2 of the BASELINE
treatment. We can also relate the asset choice to the lottery choice of subjects. According
to the risk aversion expressed by their lottery choice, only 1 subject out of 48 should have
chosen asset D in COPY. However, 31 subjects out of 48 (65%) ended up choosing asset
D or copied someone who chose asset D.
20

020
4060
perc
ent
A B C D
chosen copied
Figure 4: Distributions of asset choices in Block 2 in COPY, including intended choices by
copiers.
Result 7 When considering the intended choices of copiers in treatment COPY, almost
2/3 of subjects choose the most risky asset D.
It is tempting to speculate on the welfare consequences of copy trading. As we shall
discuss next, this is not at all a straightforward exercise. One option would be to look
at ex-post realized payoffs for the different subjects. However, it should be fairly obvious
that ex-post payoffs are unsuitable for welfare statements. The fact that someone was
lucky and received a high ex-post payoff, does not rectify a suboptimal ex-ante decision.24
Welfare can only be evaluated once we know subjects’ true risk preferences, and decisions
have to be evaluated in an ex-ante sense. From the perspective of revealed preference we
have three decisions (the lottery choice and the asset choices in Blocks 1 and 2) which may
reveal subjects’ risk preferences. Which of these choices is the best welfare benchmark is
difficult to judge. But in any case, the asset choices in Block 2 of COPY and INFO are
more distorted and the number of inconsistencies of choices increases in the direction of
24To prove this point, subjects in our COPY treatment actually received the highest average payoffs (134
vs. 117 of non—copiers in COPY and 109 in BASELINE). This was mostly due to the fact that the first
ranked subject, whom 12 of the 17 copiers followed, unexpectedly chose the moderate asset B in Block 2
and received a relatively high payoff with it.
21
more risk seeking, independently of whether they are judged from the perspective of the
lottery choice or the Block 1 asset choice. Arguably, some of these decisions must have
been suboptimal unless preferences changed during the short time span involved in the
experiment towards more risk seeking, something that seems very unlikely. We believe,
therefore, that our results suggest that choices in INFO and COPY are more distorted
than in BASELINE, implying that copy trading makes ex-ante welfare reducing choices of
investors more likely.
What determined whether a subject became a copier? Surprisingly, the only consistent
factor that seemed to matter is the risk aversion of subjects as elicited in the lottery choice
in Part 1. Table 7 shows logit regressions to explain the probability of becoming a copier.
In all three regressions, the more risk averse subjects are (i.e. the lower the lottery number),
the more likely they copy others, albeit the effect is only weakly significant in the latter two
specifications. The marginal effects implied by these regressions are sizeable. Specifications
(1), (2) and (3) imply that subjects with one lottery class lower exhibited a 33%, 28% and
26% higher probability to copy, respectively.
Neither the chosen asset in Block 1 nor the realized earnings from Block 1 have a sig-
nificant effect.25 In regression (2) we add variables gathered from the questionnaire. None
of them has a significant effect. Finally, in regression (3) we add the “crash experience”
of subjects, i.e. whether they experienced a crash in Block 1, or what percentage of their
simulations with asset C and D, respectively, crashed. Again, none of them had a signifi-
cant effect. There is a weakly significant effect of the field of studies (for other fields than
economics or science) and an effect of the look-up pattern of subjects: If subjects only look
at the top-5 ranking, they are more likely to copy.
Result 8 The main driving force for investors to copy the financial decisions of a previous
investor is their risk aversion level. The lower the tolerance to risk, as elicited in the lottery
problem, the higher is the probability of copying.
We can check the predictions of Claim 1 with respect to the holding periods for the
respective assets. Claim 1 predicts that subjects with CRRA utility would hold a chosen
asset until the last period except for asset C, where the subject would sell not below 546, a
price that was never reached in the experiment. Thus, effectively, the prediction is that all
25 If subjects decide to copy according to the “proportional imitation rule” of Schlag (1998), they would
copy with a probability that is increasing in the difference between the leader’s payoff and their own Block
1 earnings. However, own earnings are not significant in Table 7.
22
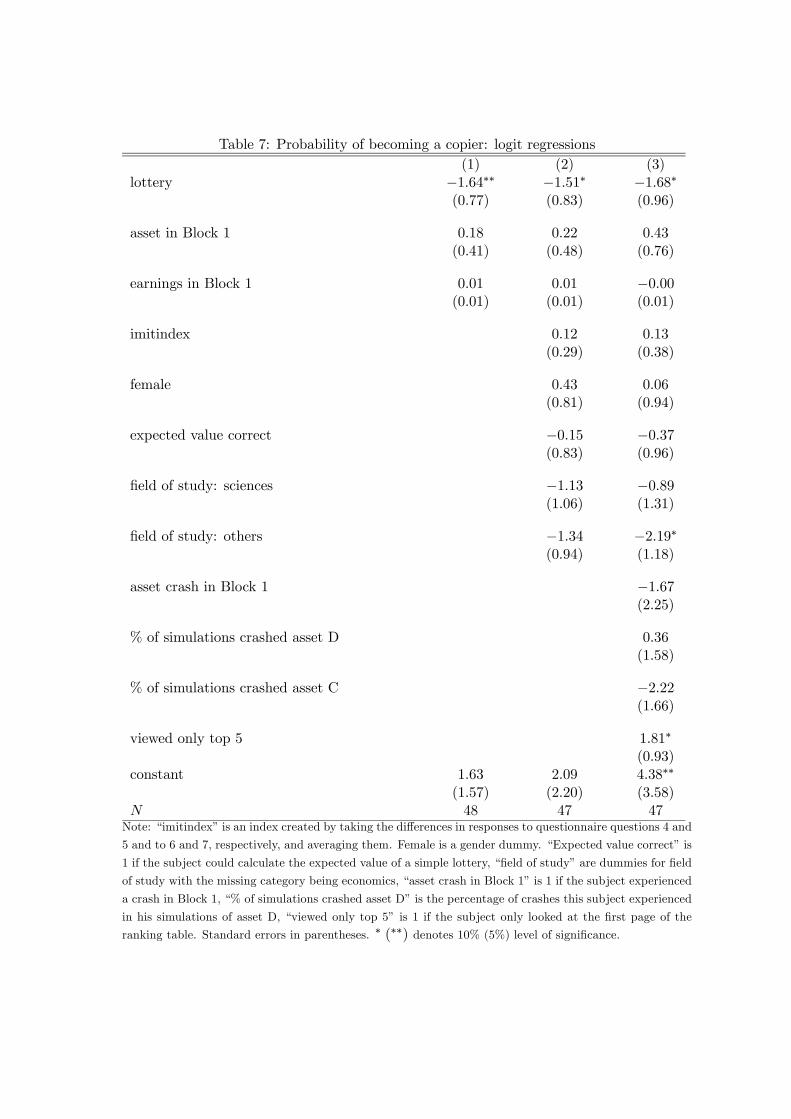
Table 7: Probability of becoming a copier: logit regressions
(1) (2) (3)
lottery −164∗∗ −151∗ −168∗(077) (083) (096)
asset in Block 1 018 022 043
(041) (048) (076)
earnings in Block 1 001 001 −000(001) (001) (001)
imitindex 012 013
(029) (038)
female 043 006
(081) (094)
expected value correct −015 −037(083) (096)
field of study: sciences −113 −089(106) (131)
field of study: others −134 −219∗(094) (118)
asset crash in Block 1 −167(225)
% of simulations crashed asset D 036
(158)
% of simulations crashed asset C −222(166)
viewed only top 5 181∗
(093)
constant 163 209 438∗∗
(157) (220) (358)
48 47 47Note: “imitindex” is an index created by taking the differences in responses to questionnaire questions 4 and
5 and to 6 and 7, respectively, and averaging them. Female is a gender dummy. “Expected value correct” is
1 if the subject could calculate the expected value of a simple lottery, “field of study” are dummies for field
of study with the missing category being economics, “asset crash in Block 1” is 1 if the subject experienced
a crash in Block 1, “% of simulations crashed asset D” is the percentage of crashes this subject experienced
in his simulations of asset D, “viewed only top 5” is 1 if the subject only looked at the first page of the
ranking table. Standard errors in parentheses. ∗ (∗∗) denotes 10% (5%) level of significance.

subjects would hold their asset until the end of a block. Yet, 66% of subjects sold asset B
prematurely, 90% sold asset C prematurely, and not even 1% of subjects held asset D until
the end of a block. Furthermore, only about 7% of assets were sold below the starting value
of 100. Overall this shows a fairly strong disposition effect (Shefrin and Statman, 1985),
as assets are almost never sold at a loss but quickly sold once a small profit is made.26
Result 9 There is a noticeable disposition effect as subjects hold losers and sell winners
prematurely.
7 Discussion
In this paper we have experimentally shown that providing investors with information on
previous investment decisions and the success of other traders may lead to an increase in
risk taking. This effect may be further exacerbated when investors are allowed to directly
copy other traders. Imitation through either of these channels may lead to a reduction
of investors’ welfare, as judged from the elicitation of risk preferences and as manifested
in counterfactual investment decisions where imitation is not possible. Our results, thus,
suggest that social trading (with or without the option to directly copy others) may be
detrimental to consumer welfare. Moreover, even outside of the domain of copy trading,
information on the success of others may lead to excessive risk taking and reduced welfare.
We hope this paper will trigger more research in the near future in order to better
understand behavior in copy trading platforms. For example, future research should be
conducted in order to understand what are the reasons that lead to copy trading, or to more
risk taking behavior in the INFO and COPY treatments. One possibility is that copiers
attribute higher skills to copied investors. Although the design of our experiment made
the role of luck very salient, future work should systematically study this possibility. Also,
it has been shown that cognitive abilities or personality traits are related to risk taking
behavior (see, e.g., Dohmen et al., 2010; Eisenbach and Schmalz, 2016; Harbaugh, 2006).
In this respect it seems relevant to explore whether these characteristics may prompt some
subjects to copy others, or to be more affected by the performance of others. Moreover,
while we have recruited our participants from a student subject pool, investors on copy
26Magnani (2015) finds a disposition effect in experimental asset markets that are similar to the ones in
our experiment. The disposition effect also plays a crucial role on social trading platforms and increases as
traders become exposed to the network (Heimer, 2016), are for the first time copied (Pelster and Hofmann,
2018) or price information is made more salient (Frydman and Wang, 2017).
24
trading platforms likely join these platforms with the explicit intent to engage in copy
trading. Whether the welfare consequences of investors on copy trading platforms are
larger or lower than in the student population is another open question that should be
addressed in future research.
One should of course be very cautious at extrapolating conclusions from the lab to the
field, in particular before a good deal of lab and field research has been conducted on the
subject matter. However, there are reason to believe that the implications of copy trading
on risk taking may be even stronger on real world copy trading platforms. For example, in
the real world, investors’ beliefs on the skills and information of leaders might be even more
optimistic than in our laboratory setting. In addition, whereas our experimental setup, by
way of the simulator, allowed subjects to easily assess how risky previous investments of
other investors were, such an assessment is much more difficult in the real world. Finally,
from a social perspective, imitation encourages traders to follow similar investment strate-
gies and could, thus, lead to financial risk through resulting herding and contribute to the
formation of financial bubbles.
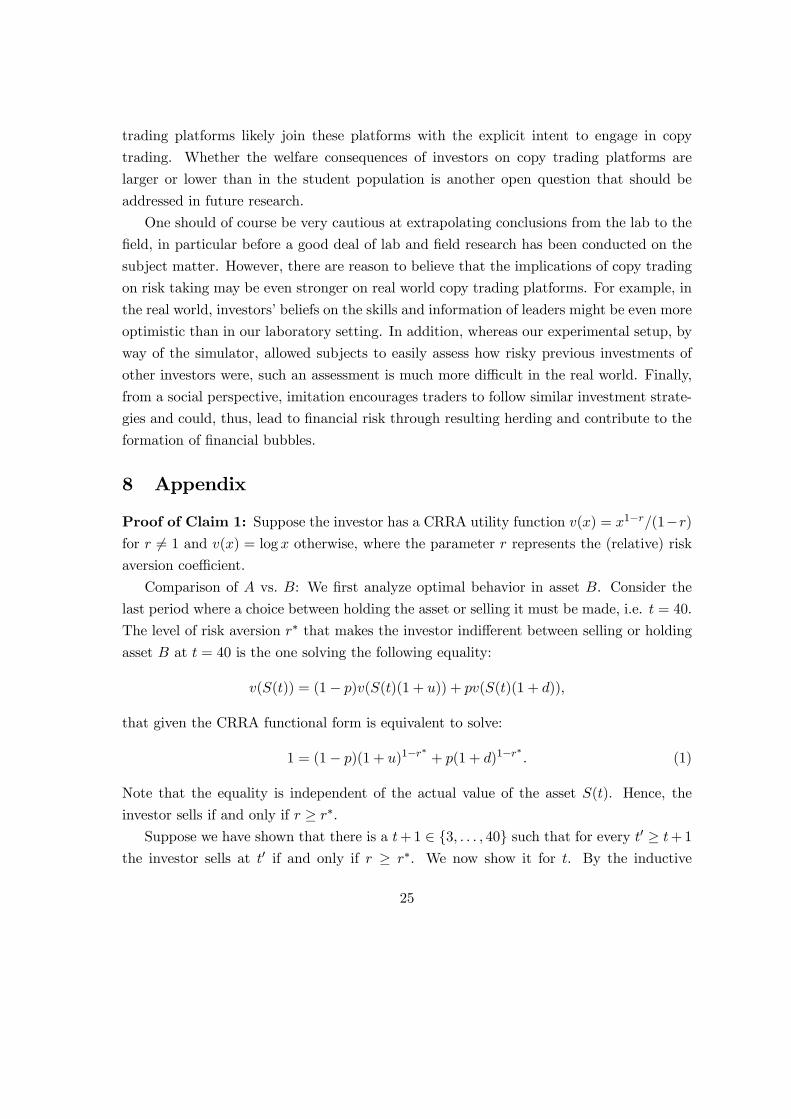
8 Appendix
Proof of Claim 1: Suppose the investor has a CRRA utility function () = 1−(1−)for 6= 1 and () = log otherwise, where the parameter represents the (relative) risk
aversion coefficient.
Comparison of vs. : We first analyze optimal behavior in asset . Consider the
last period where a choice between holding the asset or selling it must be made, i.e. = 40.
The level of risk aversion ∗ that makes the investor indifferent between selling or holdingasset at = 40 is the one solving the following equality:
(()) = (1− )(()(1 + )) + (()(1 + ))
that given the CRRA functional form is equivalent to solve:
1 = (1− )(1 + )1−∗+ (1 + )1−
∗ (1)
Note that the equality is independent of the actual value of the asset (). Hence, the
investor sells if and only if ≥ ∗.Suppose we have shown that there is a +1 ∈ {3 40} such that for every 0 ≥ +1
the investor sells at 0 if and only if ≥ ∗. We now show it for . By the inductive
25

argument, when evaluating the decision to be made at time the investor sells at + 1 if
≥ ∗. If ∗, the level of risk aversion that makes the investor indifferent betweenselling asset at , or holding it until the end, is the one solving the following equality
that uses the CRRA functional form:
1 = [(1− )(1 + )1− + (1 + )1−]40−+1 (2)
The critical risk aversion value of (2) is ∗, and hence we conclude that the investor sellsat = 1 whenever ≥ ∗ and holds it until the end of the process otherwise. For our setof parameters, ∗ = 5 Note that since the sure value of asset coincides with the startingvalue of asset , this also represents the risk aversion level where the investor is indifferent
between holding asset or asset for all periods.
Comparison of vs. : With the probability of a crash, the decision to hold asset
for one more period depends on the current value of the asset, since the relative size of
the crash ()− 50 is increasing in (). Consider asset in the final period 40. Given a
level of relative risk aversion , the critical value ̄(40 ) such that for all ̄(40 ) the
investor sells the asset is defined by
(̄(40 )) = (1− )¡(̄(40 )(1 + ) + (1− )(̄(40 )(1 + )
¢+ (50) (3)
In period 39, the investor has more options. He can sell the asset at the current value
or he can decide whether to sell the asset in period 40 conditional on whether the price
went up or down in period 39. This option value makes holding the asset in period 39
more attractive and leads to ̄(39 ) ̄(40 ). By the same logic, ̄( ) ̄(40 ) for
all 40 Thus, given , ̄(40 ) is a lower bound for the selling price.
Consider now the utility value of holding asset until the end. We can calculate the
expected utility resulting from this as
40X=0
µ40
¶(1− )40−
£¡(0)(1 + )(1 + )40−
¢(1− )40 +
¡1− (1− )40
¢(50)
¤ (4)
Using (4) and our parameters, we find (using Mathematica) that an investor with = 034
prefers asset and with = 035 prefers asset . Also, using (3) we obtain ̄(40 034) =
546, proving the claim that an investor with = 034 does not sell below 546. Since ̄( )
is decreasing in , investors with lower have even higher critical values, proving the claim.
Comparison of vs. : The proof of this case follows the same logic as in the previous
case. For 05 and asset , the critical ̄( ) are never binding (there are no rational
26

solutions to (3)). Thus, we can again use (4) and our parameters for asset to calculate
the where an investor would switch from to . We find that the critical value is
−017.¤
27
References
[1] Alós-Ferrer, C and K. Schlag (2009), “Imitation and Learning,” in The Handbook of
Rational and Social Choice, ed. by P. Anand, P. Pattanaik, and C. Puppe. Oxford
University Press.
[2] Andersen, S., Harrison, G. W., Lau, M. I., and Rutström, E. E. (2008), “Eliciting risk
and time preferences,” Econometrica, 76(3), 583-618.
[3] Apesteguia, J. and M.A. Ballester (2018), “Monotone Stochastic Choice Models: The
Case of Risk and Time Preferences,” Journal of Political Economy, 126(1):74—106.
[4] Apesteguia, J., S. Huck and J. Oechssler (2007), “Imitation Theory and Experimental
Evidence,” Journal of Economic Theory, 136:217—235.
[5] Apesteguia, J., S. Huck, J. Oechssler and S. Weidenholzer (2010), “Imitation and
the Evolution of Walrasian Behavior: Theoretically Fragile but Behaviorally Robust,”
Journal of Economic Theory, 145:1603—16017.
[6] Bikhchandani, S., D. Hirshleifer and I. Welch (1992), “A Theory of Fads, Fashion, Cus-
tom, and Cultural Change as Informational Cascades,” Journal of Political Economy,
100(5):992—1026.
[7] Bock, O., I. Baetge, and A. Nicklisch (2014), “hroot: Hamburg registration and orga-
nization online tool,” European Economic Review, 71:117—120.
[8] Bohnet, I., F. Greig, B. Hermann, and R. Zeckhauser (2008), “Betrayal Aversion:
Evidence from Brazil, China, Oman, Switzerland, Turkey, and the United States,”
American Economic Review, 98(1): 294—310.
[9] Bolton, G.E. and A. Ockenfels (2010), “Betrayal Aversion: Evidence from Brazil,
China, Oman, Switzerland, Turkey, and the United States: Comment,” American
Economic Review, 100(1):628—633.
[10] Bursztyn, L., F. Ederer, B. Ferman, and N. Yuchtman (2014), “Understanding Mech-
anisms Underlying Peer Effects: Evidence From a Field Experiment on Financial
Decisions, ” Econometrica, 82(4):1273—1301.
28

[11] Carbone, E. and J. Duffy (2014), “Lifecycle Consumption Plans, Social Learning and
External Habits: Experimental Evidence,” Journal of Economic Behavior & Organi-
zation, 106:413—427.
[12] Cooper, D.J. and M. Rege (2011), “Misery Loves Company: Social Regret and Social
Interaction Effects in Choices under Risk and Uncertainty,” Games and Economic
Behavior, 73(1):91—110.
[13] Cox, J.C., Ross, S.A., and Rubinstein M (1979), “Option pricing: A simplified ap-
proach,” Journal of Financial Economics, 7(3):229—263.
[14] De Long, J.B., A. Shleifer, L.H. Summers, and R.J. Waldmann (1990), “Noise Trader
Risk in Financial Markets,” Journal of Political Economy, 98(4):703—738.
[15] Dijk, O., M. Holmen and M. Kirchler (2014), “Rank Matters—The Impact of Social
Competition on Portfolio Choice,” European Economic Review, 66:97—110.
[16] Dohmen, T., A. Falk, D. Huffman and U. Sunde (2010), “Are Risk Aversion and
Impatience Related to Cognitive Ability?” American Economic Review, 100(3):1238—
60.
[17] Duffy, J., E. Hopkins, T. Kornienko and M. Ma (2019), “More is Better? Information
Choice in a Social Learning Experiment,” Games and Economic Behavior, forthcom-
ing.
[18] Eckel, C. and P. Grossman (2002), “Sex Differences and Statistical Stereotyping in
Attitudes Toward Financial Risk,” Evolution and Human Behavior, 23(4):281-295.
[19] Einav, L, A. Finkelstein, I. Pascu, and M.R Cullen (2012), “How General Are Risk
Preferences? Choices under Uncertainty in Different Domain,” American Economic
Review 102(6): 2606-2638.
[20] Eisenbach, T. and M. Schmalz (2016), “Anxiety in the Face of Risk,” Journal of
Financial Economics, 121:414—426.
[21] Ensthaler, L., O. Nottmeyer, G. Weizsäcker and C. Zankiewicz (2017), “Hidden Skew-
ness: On the Difficulty of Multiplicative Compounding Under Random Shocks,” Man-
agement Science, 64(4): 1693 - 1706.
29

[22] Fischbacher, U. (2007), “z-Tree: Zurich Toolbox for ready-made economic experi-
ments,” Experimental Economics 10(2):171-178.
[23] Frydman, C. and B. Wang (2017), “The Impact of Salience on Investor Behavior:
Evidence from a Natural Experiment,” Journal of Finance, forthcoming.
[24] Gemayel, R. and A. Preda (2018), “Does a scopic regime erode the disposition ef-
fect? Evidence from a social trading platform,” Journal of Economic Behavior and
Organization, 154, 175—190.
[25] Goeree, J.K. and L. Yariv (2015), “Conformity in the Lab,” Journal of the Economic
Science Association, 1(1):15—28.
[26] Gortner, P.J. and J.J. van der Weele (2019), “Peer Effects and Risk Sharing in Ex-
perimental Asset Markets,” European Economic Review, 116: 129-147.
[27] Harbaugh, R. (2006), “Prospect Theory or Skill Signaling,” mimeo.
[28] Heimer, R. (2016), “Peer Pressure: Social Interaction and the Disposition Effect”,
Review of Financial Studies, 29:3177-3209.
[29] Hopkins, E. and Kornienko, T. (2004), “Running to keep in the same place: Consumer
choice as a game of status,” American Economic Review 94(4): 1085-1107.
[30] Huck, S., Normann, H.-T., and J. Oechssler (1999), “Learning in Cournot oligopoly -
An experiment”, Economic Journal 109, C80—C95.
[31] Kirchler, M., F. Lindner, and U. Weitzel (2018) “Rankings and Risk-Taking in the
Finance Industry”, Journal of Finance, 73(5), 2271-2302.
[32] Liu Y.Y., J.C. Nacher, T. Ochiai, M. Martino and Y. Altshuler (2014), “Prospect
Theory for Online Financial Trading,” PLoS ONE 9(10).
[33] Magnani, J. (2015), “Testing for the disposition effect on optimal stopping decisions,”
American Economic Review, 105(5): 371-375.
[34] Offerman, T., and A. Schotter (2009), “Imitation and Luck: An Experimental Study
on Social Sampling,” Games and Economic Behavior, 65(2):461—502.
30

[35] Oprea, R., D. Friedman and S. T. Anderson (2009), “Learning to Wait: A Laboratory
Investigation,” Review of Economic Studies, 76(3):1103—1124.
[36] Pan W., Y. Altshuler and A. Pentland (2012), “Decoding Social Influence and the Wis-
dom of the Crowd in Financial Trading Network,” Proceedings of the 2012 ASE/IEEE
International Conference on Social Computing.
[37] Pelster, M. and A. Hoffmann (2018), “About the Fear of Reputational Loss: Social
Trading and the Disposition Effect”, Journal of Banking and Finance, 94: 75—88.
[38] Sandri, S., Schade, C., Musshoff, O., and Odening, M. (2010), “Holding on for too
long? An experimental study on inertia in entrepreneurs’ and non-entrepreneurs’
disinvestment choices.” Journal of Economic Behavior and Organization, 76(1):30-44.
[39] Scharfstein, D.S. and J.C. Stein (1990), “Herd Behavior and Investment,” American
Economic Review, 80(3):465—79.
[40] Shefrin, H. and Statman, M. (1985), “The Disposition to Sell Winners Too Early and
Ride Losers Too Long: Theory and Evidence.” The Journal of Finance, 40:777—790.
[41] Schlag, K. H. (1998),“Why imitate, and if so, how?: A boundedly rational approach
to multi-armed bandits,” Journal of Economic Theory 78(1): 130-156.
[42] Trautmann S.T. and Vieider F.M. (2012), “Social Influences on Risk Attitudes: Ap-
plications in Economics,” in: Roeser S., Hillerbrand R., Sandin P., Peterson M. (eds.)
Handbook of Risk Theory. Springer, Dordrecht.
[43] Vega-Redondo, F. (1997), “The Evolution of Walrasian Behavior,” Econometrica,
65:375—384.
[44] Weber, E.U., A.-R. Blais, and N.E. Betz (2002),“A Domain-specific Risk-attitude
Scale: Measuring Risk Perceptions and Risk Behaviors,” Journal of Behavioral Deci-
sion Making, 15:263—290.
31