Embed Size (px)
Citation preview
Copyright 2002, Pearson Education Canada1
Household Behavior and Consumer Choice
Chapter 6
Copyright 2002, Pearson Education Canada2
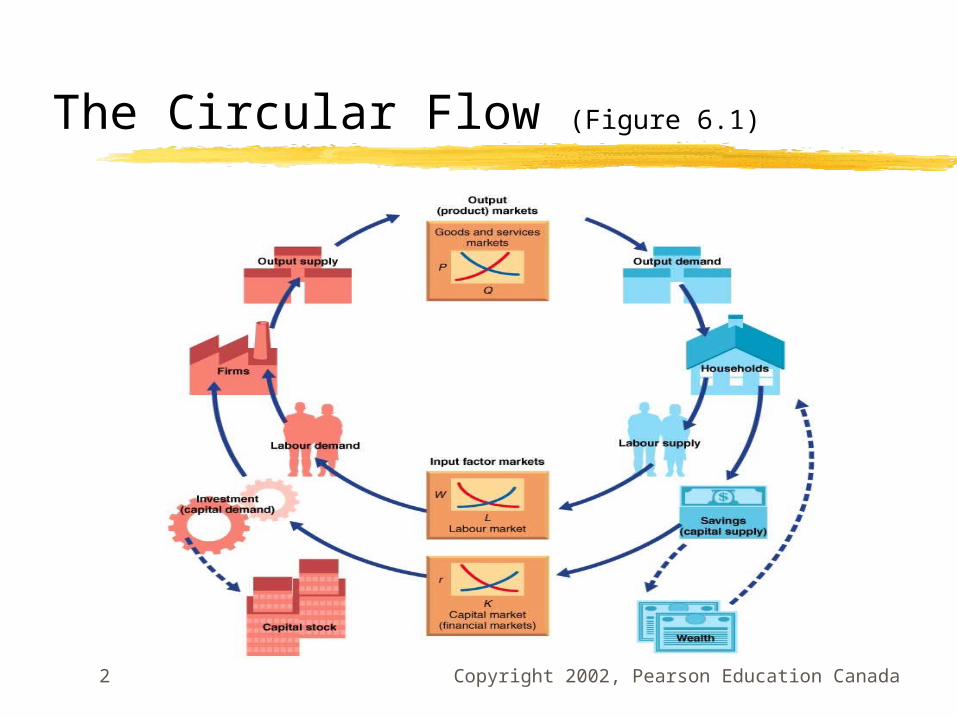
The Circular Flow (Figure 6.1)
Copyright 2002, Pearson Education Canada3
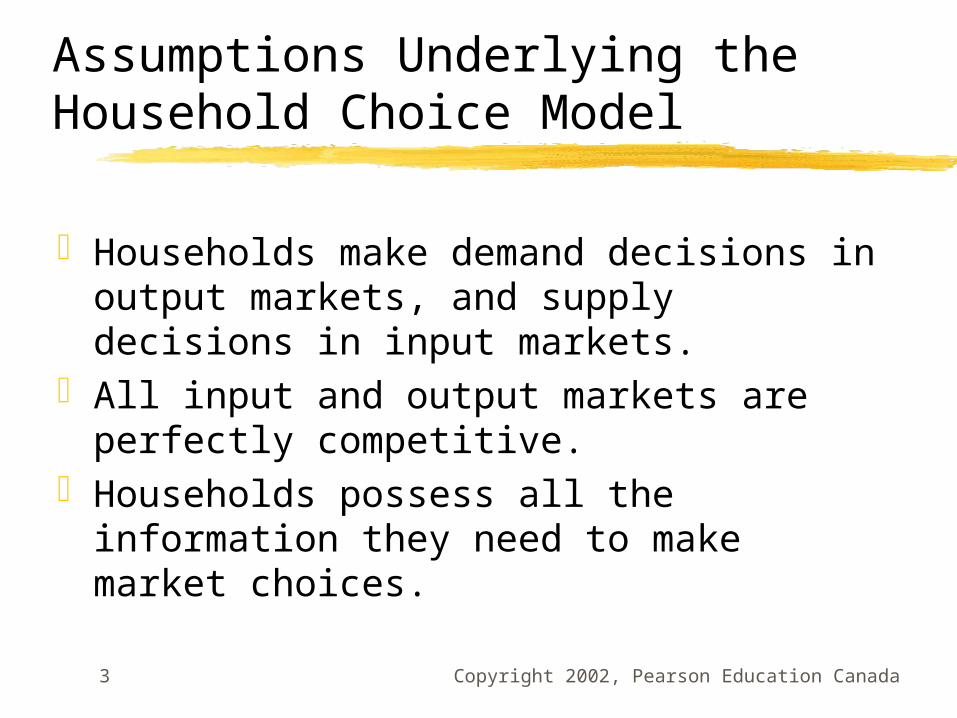
Assumptions Underlying the Household Choice Model
Households make demand decisions in output markets, and supply decisions in input markets.
All input and output markets are perfectly competitive.
Households possess all the information they need to make market choices.

Copyright 2002, Pearson Education Canada4
Perfect Knowledge
Perfect knowledge is the assumption that households possess a knowledge of the qualities and prices of everything available in the market and that firms have all available information regarding wage rates, capital costs, and output prices.
Copyright 2002, Pearson Education Canada5
Every household must make three basic decisions:
How much of each product to demandHow much labour to supplyHow much money to spend today and how
much to save for the future
Copyright 2002, Pearson Education Canada6
The Determinants of Household Demand
The price of the productThe income available to the householdThe household’s amount of accumulated
wealthThe prices of other products available to the
householdThe household’s tastes and preferencesThe household’s expectations about future
income, wealth, and prices
Copyright 2002, Pearson Education Canada7
Budget Constraint
The budget constraint refers to the limits imposed on household choices by income, wealth, and product prices
Copyright 2002, Pearson Education Canada8
Choice Set or Opportunity Set
The choice set or opportunity set refers to the set of options that is defined and limited by a budget constraint.
Copyright 2002, Pearson Education Canada9
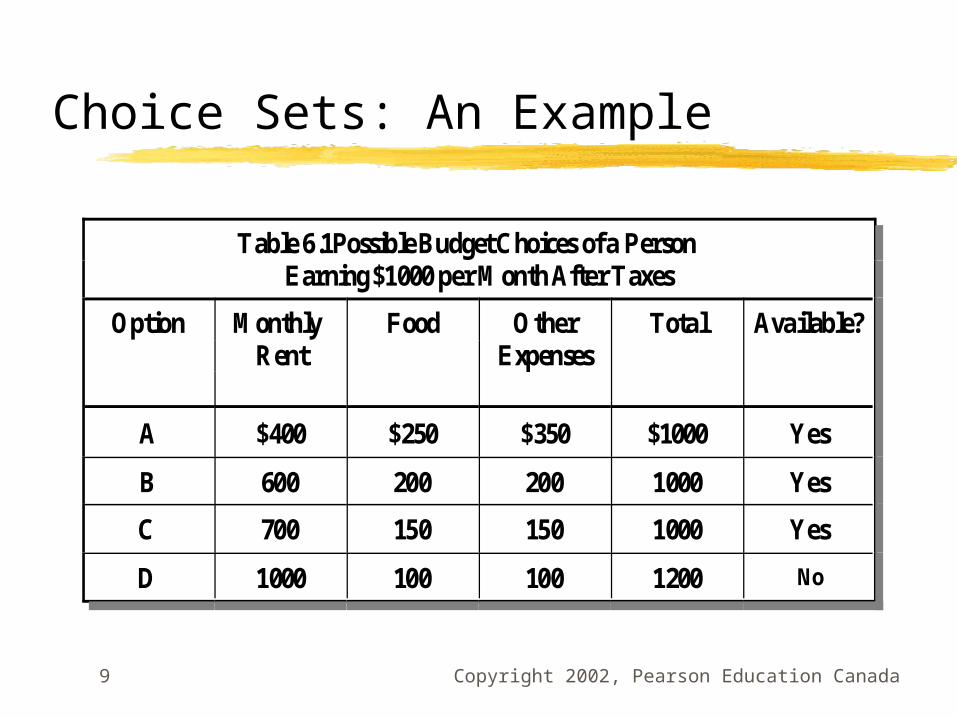
Table 6.1Possible Budget Choices of a Person Earning $1000 per Month After Taxes
Option Monthly Rent
Food OtherExpenses
Total Available?
A $400 $250 $350 $1000 Yes
B 600 200 200 1000 Yes
C 700 150 150 1000 Yes
D 1000 100 100 1200 No
Choice Sets: An Example
Copyright 2002, Pearson Education Canada10
Example of a Choice Problem
Trudee and Mark have $200 a month in spending money.
They spend all their money on two goods; meals at the local Thai restaurant, and trips to the local jazz club - The Hungry Ear.
Thai meals are $20 per couple, and The Hungry Ear costs $10 per couple.
Copyright 2002, Pearson Education Canada11
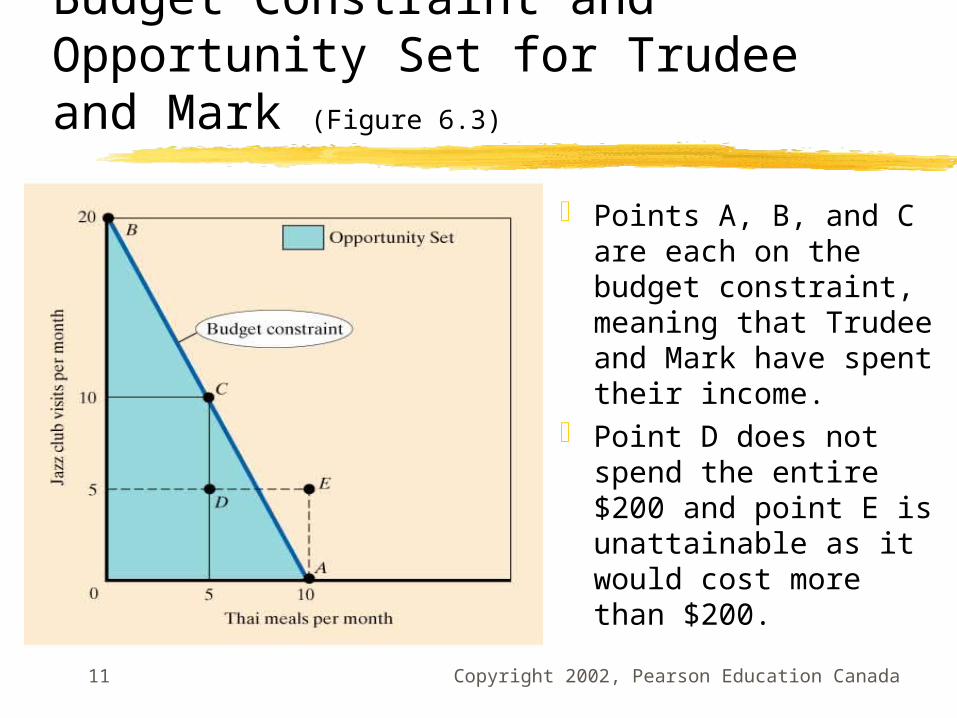
Budget Constraint and Opportunity Set for Trudee and Mark (Figure 6.3)
Points A, B, and C are each on the budget constraint, meaning that Trudee and Mark have spent their income.
Point D does not spend the entire $200 and point E is unattainable as it would cost more than $200.
Copyright 2002, Pearson Education Canada12
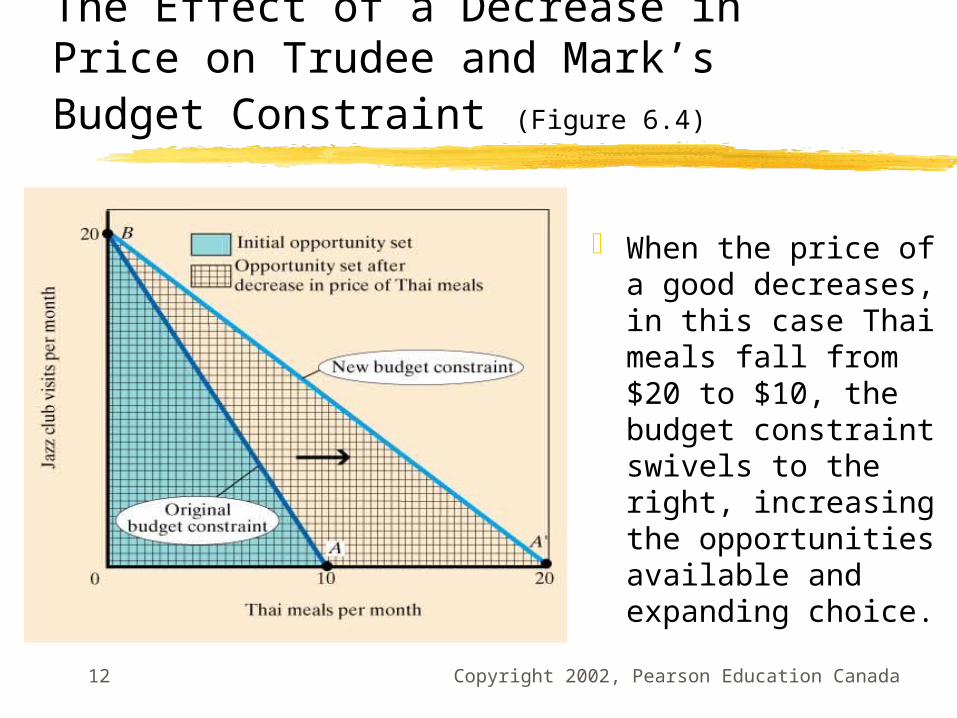
The Effect of a Decrease in Price on Trudee and Mark’s Budget Constraint (Figure 6.4)
When the price of a good decreases, in this case Thai meals fall from $20 to $10, the budget constraint swivels to the right, increasing the opportunities available and expanding choice.
Copyright 2002, Pearson Education Canada13
The Basis of Choice: Utility
Utility is the satisfaction, or reward, a product yields relative to its alternative. It is the basis for choice.
Marginal utility is the additional satisfaction gained by the consumption or use of one more unit of something.
Total utility is the total amount of satisfaction obtained from consumption of a good or service.
Copyright 2002, Pearson Education Canada14
Law of Diminishing Marginal Utility
The more of any one good consumed in a given period, the less satisfaction (utility) is generated by consuming each additional (marginal) unit of the same good.
Copyright 2002, Pearson Education Canada15
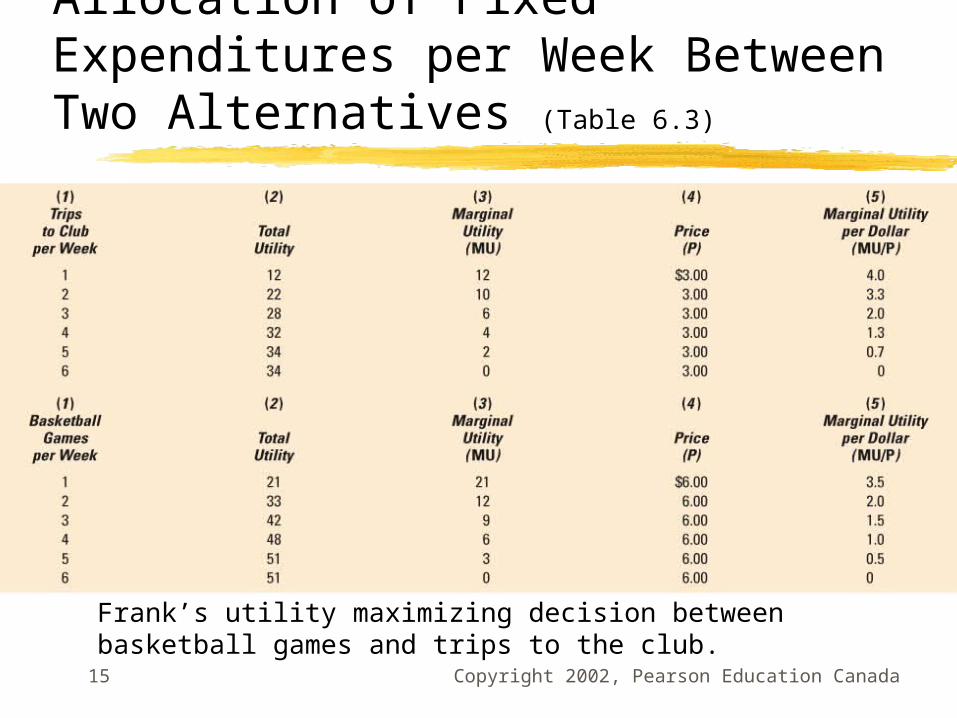
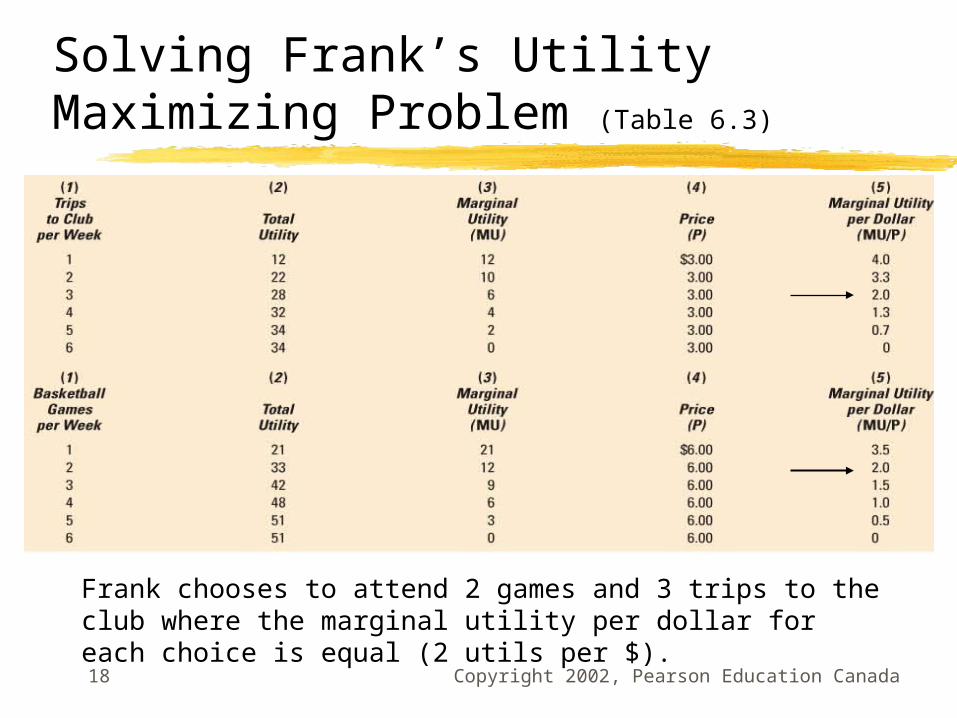
Allocation of Fixed Expenditures per Week Between Two Alternatives (Table 6.3)
Frank’s utility maximizing decision between basketball games and trips to the club.

Copyright 2002, Pearson Education Canada16
Frank’s Total and Marginal Utility of Trips to the Club (Figure 6.5)
Copyright 2002, Pearson Education Canada17
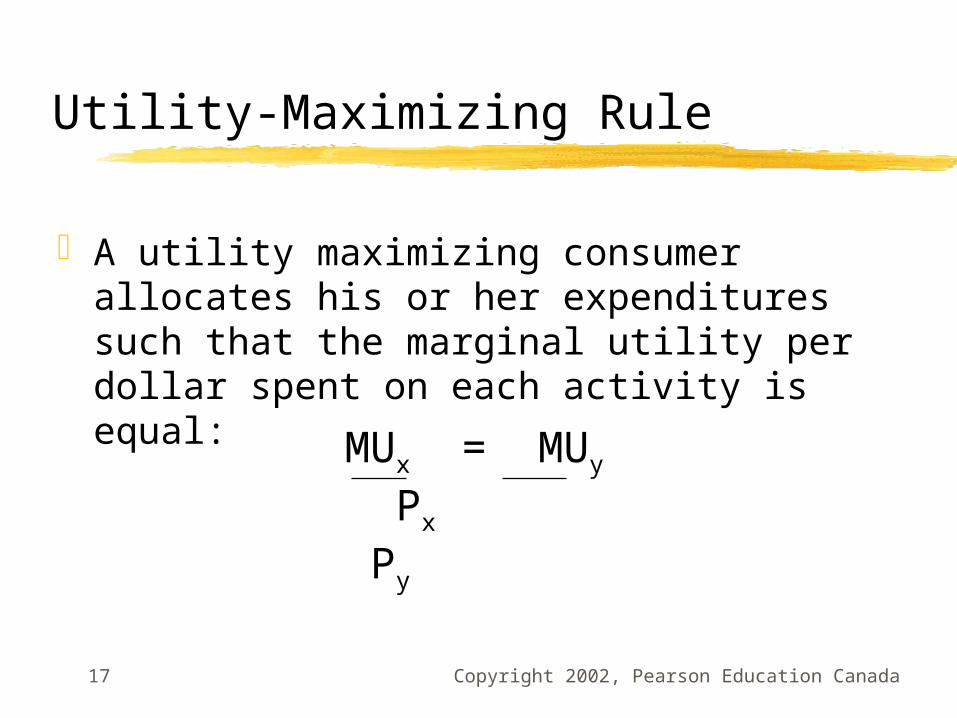
Utility-Maximizing Rule
A utility maximizing consumer allocates his or her expenditures such that the marginal utility per dollar spent on each activity is equal:
MUx = MUy
Px Py
Copyright 2002, Pearson Education Canada18
Solving Frank’s Utility Maximizing Problem (Table 6.3)
Frank chooses to attend 2 games and 3 trips to the club where the marginal utility per dollar for each choice is equal (2 utils per $).
Copyright 2002, Pearson Education Canada19
Diminishing Marginal Utility and Downward-Sloping Demand
Diminishing marginal utility helps to explain why demand slopes down. Marginal utility falls with each additional unit consumed, so people are not willing to pay as much as they were for previous units.
Copyright 2002, Pearson Education Canada20
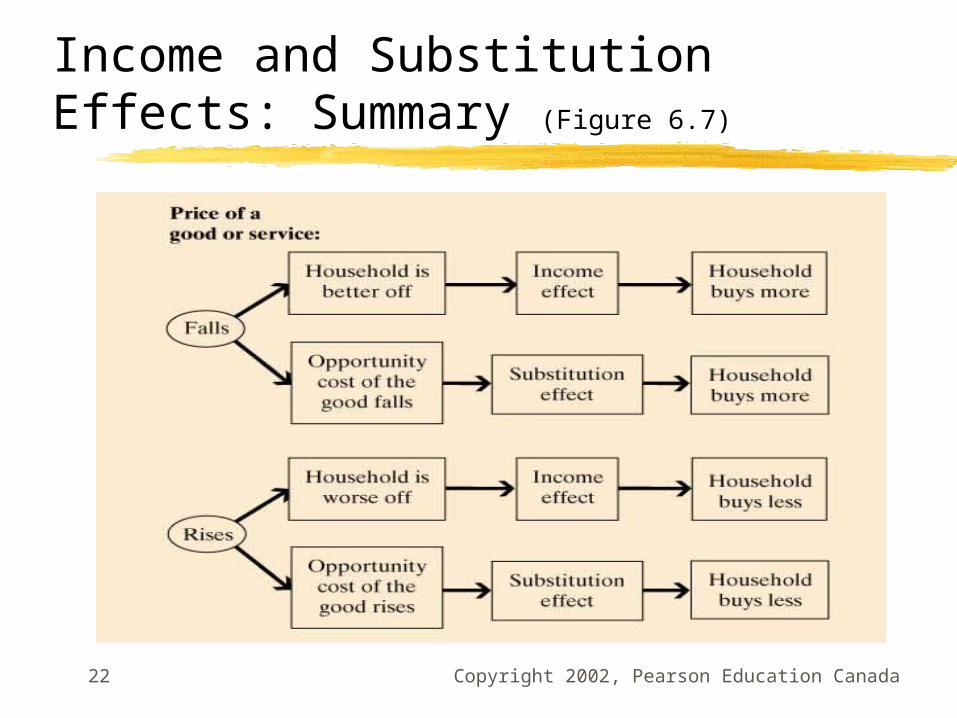
Income Effect of a Price Change
The income effect of a price change is a change in consumption of a good or service that results from a change in well-being, other things being equal.
When the price of a product falls, a consumer has more purchasing power with the same amount of income and is better off.
When the price of a product rises, a consumer has less purchasing power with the same amount of income and is worse off.
Copyright 2002, Pearson Education Canada21
Substitution Effect of a Price Change
The substitution effect of a price change is a change in consumption of a good or service that results from holding well-being unchanged.
When the price of a product falls, that product becomes more attractive relative to potential substitutes.
When the price of a product rises, that product becomes less attractive relative to potential substitutes.
Copyright 2002, Pearson Education Canada22
Income and Substitution Effects: Summary (Figure 6.7)
Copyright 2002, Pearson Education Canada23
Consumer Surplus
Consumer surplus or net benefit refers to the difference between the maximum amount a person is willing to pay for a good and its current market price.
Copyright 2002, Pearson Education Canada24
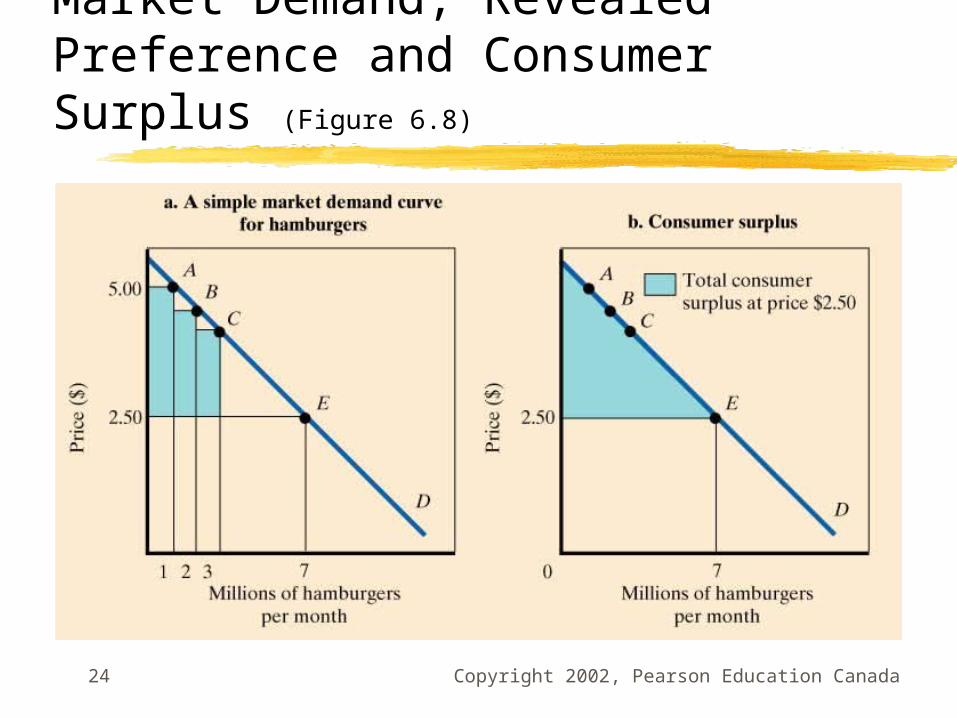
Market Demand, Revealed Preference and Consumer Surplus (Figure 6.8)

Copyright 2002, Pearson Education Canada25
Diamond/Water Paradox:
A paradox stating that: The things with the greatest value in use
frequently have little or no value in exchange. The things with the greatest value in exchange
frequently have little or no value in use.
Copyright 2002, Pearson Education Canada26
Cost-Benefit Analysis
Cost-benefit analysis is the formal technique by which the benefits of a public project are weighed against its costs.
Copyright 2002, Pearson Education Canada27
The Labour Supply Decision
Households must decide: Whether to work How much to work What kind of job to work at
Their choices are affected by: The availability of jobs Market wage rates The skills they possess
Copyright 2002, Pearson Education Canada28
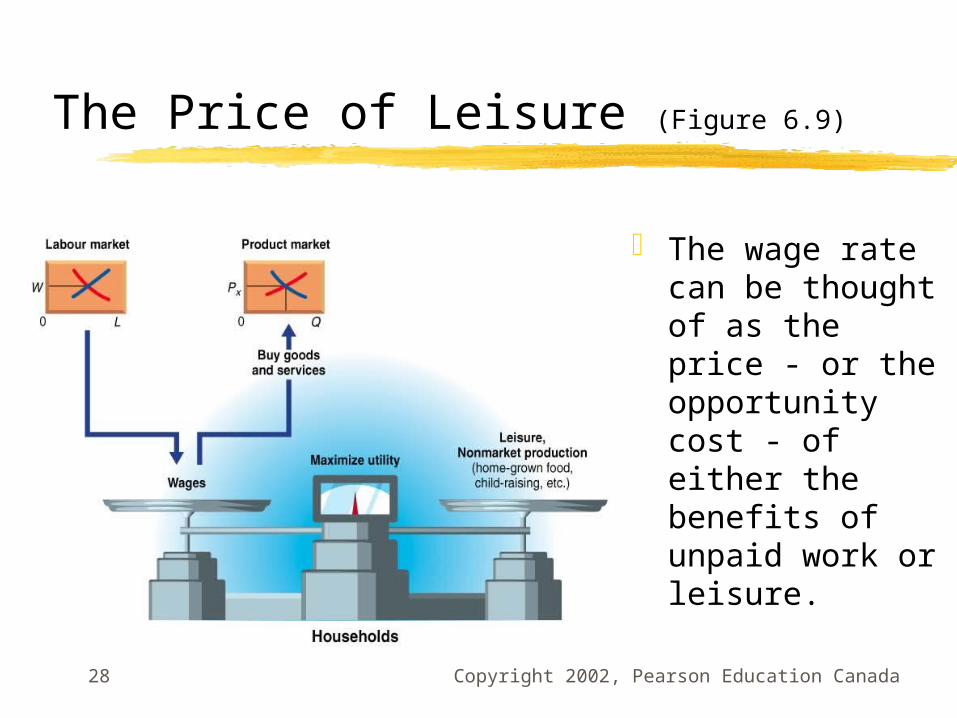
The Price of Leisure (Figure 6.9)
The wage rate can be thought of as the price - or the opportunity cost - of either the benefits of unpaid work or leisure.
Copyright 2002, Pearson Education Canada29
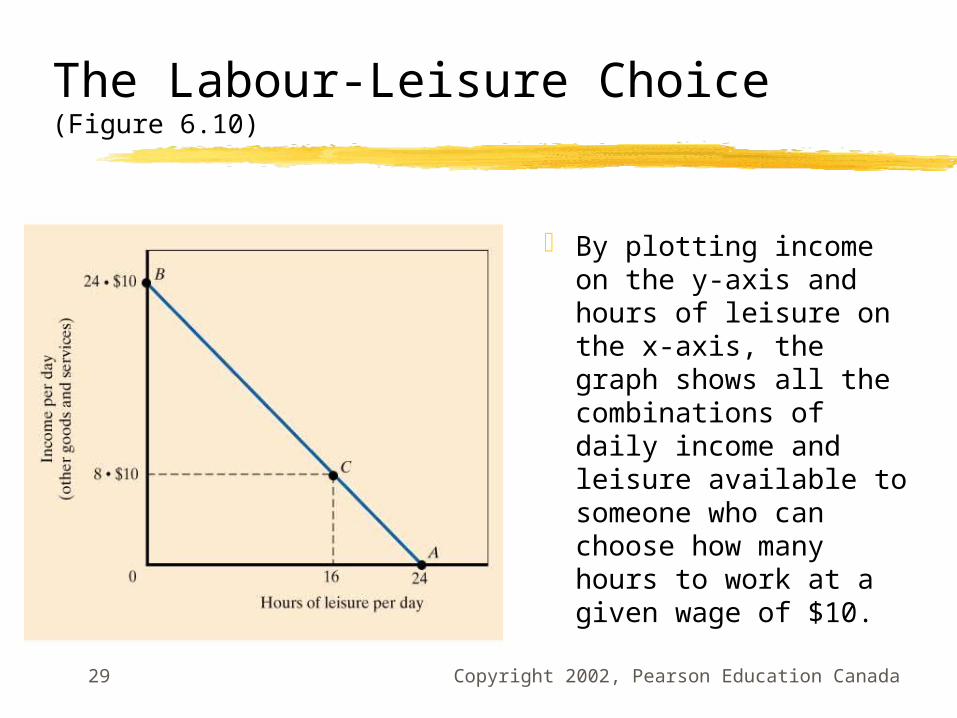
The Labour-Leisure Choice (Figure 6.10)
By plotting income on the y-axis and hours of leisure on the x-axis, the graph shows all the combinations of daily income and leisure available to someone who can choose how many hours to work at a given wage of $10.
Copyright 2002, Pearson Education Canada30
Labour Supply Curve
The labour supply curve is a diagram that shows the quantity of labor supplied as a function of the wage rate.
Its shape depends on how households react to changes in the wage rate (on the income and substitution effects).
Copyright 2002, Pearson Education Canada31
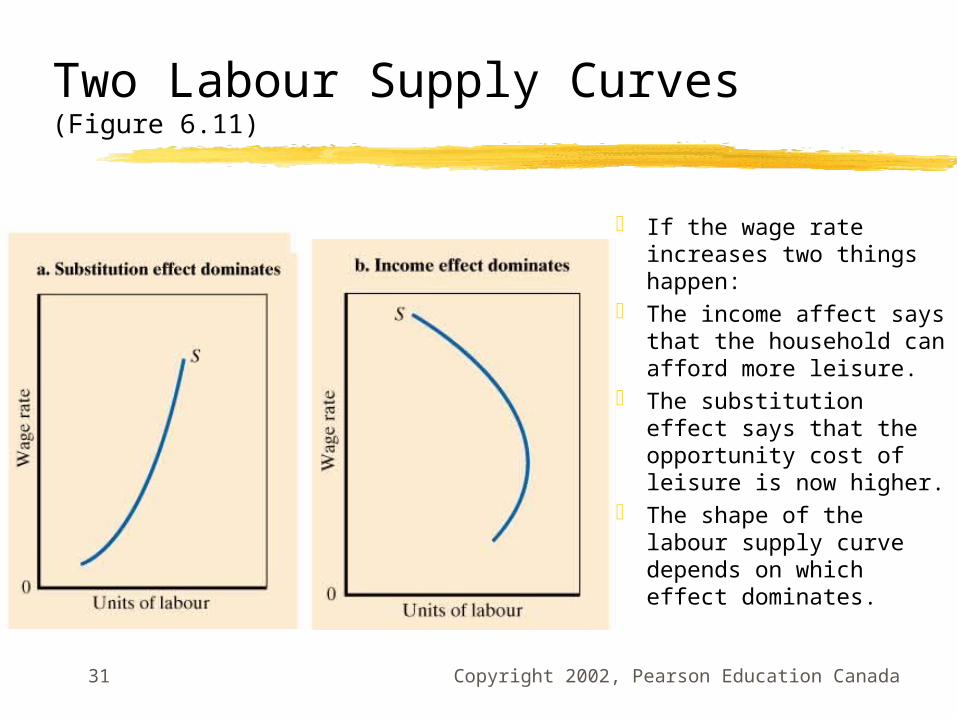
Two Labour Supply Curves (Figure 6.11)
If the wage rate increases two things happen:
The income affect says that the household can afford more leisure.
The substitution effect says that the opportunity cost of leisure is now higher.
The shape of the labour supply curve depends on which effect dominates.
Copyright 2002, Pearson Education Canada32
Saving and Borrowing: Present vs. Future Consumption
When a household decides to save part of its current income, it is using current income to finance future consumption.
When a household decides to borrow, it finances current spending with future income.
A change in interest rates has a positive effect on saving if the substitution effect dominates the income effect. Empirical evidence shows this to be the case.
Copyright 2002, Pearson Education Canada33
Financial Capital Market
The financial capital market refers to the complex set of institutions in which suppliers of capital (households that save) and the demanders of capital (business firms wanting to invest) interact.
Copyright 2002, Pearson Education Canada34
Review Terms & Concepts
budget constraint choice set or
opportunity set consumer surplus or
net benefit cost-benefit analysis diamond/water paradox financial capital market income effect of a price
change
labour supply curve law of diminishing
marginal utility marginal utility (MU) perfect knowledge substitution effect of a
price change total utility utility