Embed Size (px)
Citation preview
Copyright © 2004, 2008, 2012, 2015, 2016 NCS Pearson, Inc.
Warning: No part of this publication may be reproduced or transmitted in any form or by any means,
electronic or mechanical, including photocopy, recording, or any information storage and retrieval
system, without the express written permission of the copyright owner.
Pearson, PCAT, and the PCAT logo are trademarks in the U.S. and/or other countries of Pearson
Education, Inc., or its affiliates.
MCAT is a trademark of the Association of American Medical Colleges.
NCS Pearson, Inc., 5601 Green Valley Drive, Bloomington, MN 55437
800.622.3231 www.PCATweb.info
Produced in the United States of America.
2.A Product Number 65693PCAT
www.PCATweb.info 1-800-622-3231 PCAT Reliability and Validity
iii Copyright © 2016 NCS Pearson, Inc. All rights reserved.
Table of Contents
www.PCATweb.info 1-800-622-3231 PCAT Reliability and Validity
iv Copyright © 2016 NCS Pearson, Inc. All rights reserved.
Acknowledgments
This document was prepared by the following members of the Pearson Clinical Assessment group:
Donald G. Meagher, EdD
Senior Research Director
Tianshu Pan, PhD
Psychometrician
Rachel Wegner, MA
Test Development Manager
Jeffrey R. Miller, MA
Editor
www.PCATweb.info 1-800-622-3231 PCAT Reliability and Validity
1 Copyright © 2016 NCS Pearson, Inc. All rights reserved.
Introduction
The Pharmacy College Admission Test (PCAT) is a norm-referenced standardized test that is developed to measure
the abilities, aptitudes, and skills that pharmacy schools deem essential for success in their programs. In an
effort to ensure the continuing relevance and usefulness of the PCAT for assessing the prerequisite knowledge
and skills of candidates for admission to professional pharmacy programs, the test content is periodically
reviewed and revised to ensure that it accurately reflects current pharmacy school prerequisite requirements in
the sciences, math, and language arts.
This publicly available document provides information and research results related to the reliability and validity
of the PCAT. Information in this document includes reliability and validity data based on the current normative
sample—PCAT candidates who took the test for the first time between July 2011 and January 2015
(n = 64,652)—and a summary of research findings related to the validity of the test.
During the 2011–2015 normative sample period, the PCAT consisted of a Writing subtest and five multiple-
choice subtests: Verbal Ability, Biology, Chemistry, Reading Comprehension, and Quantitative Ability.
However, beginning with the July 2016 PCAT administration, the test no longer contains a Verbal Ability
subtest, and the four remaining multiple-choice subtests have been renamed as Biological Processes, Chemical
Processes, Critical Reading, and Quantitative Reasoning. So that the information in this document remains
current and relevant going forward, references to the multiple-choice subtests will be to the four that are
currently part of the PCAT.
The following additional publications are also available on the PCAT website: PCAT Basics, with information
about PCAT history, contents, structure, administration, and score reporting; and Interpreting PCAT Scores,
with information useful in interpreting all PCAT scaled scores, percentile ranks, and Writing scores. Also
available only to qualified professionals, the printed PCAT Technical Manual contains detailed data for the
current normative sample, the current 2015 percentile ranks, compendium tables that can be used to compare
the previous 2011 percentile ranks with the current percentile ranks, and a table showing differences in
Composite percentile rank between those with and without the Verbal Ability subtest.
To request a copy of the PCAT Technical Manual, or to offer suggestions regarding the PCAT or about this or
any other related publications, please contact PCAT Customer Relations at the following email address:
www.PCATweb.info 1-800-622-3231 PCAT Reliability and Validity
2 Copyright © 2016 NCS Pearson, Inc. All rights reserved.
PCAT Reliability
A test’s reliability is the extent to which the test yields consistent results. Considerations of the reliability of a
test must account for both multiple-choice and writing components, and must show consistent data for
different administration formats and scoring methods, such as printed test booklets, computer-based test
(CBT) delivery, and human and electronic essay scoring.
One common measure of a test’s reliability is internal consistency, which is appropriate to use when
candidates take multiple-choice subtests on a single test administration. The most commonly used formula
for estimating the reliability of a test based on internal consistency is the Kuder-Richardson formula 20 (KR-
20), which requires only a single administration of a test. KR-20 yields a reliability estimate of internal
consistency (or reliability coefficient) by examining the homogeneity of the questions within a test based on
the number of items in the test, the standard deviation of the total score, and the proportion of candidates
correctly answering each item.
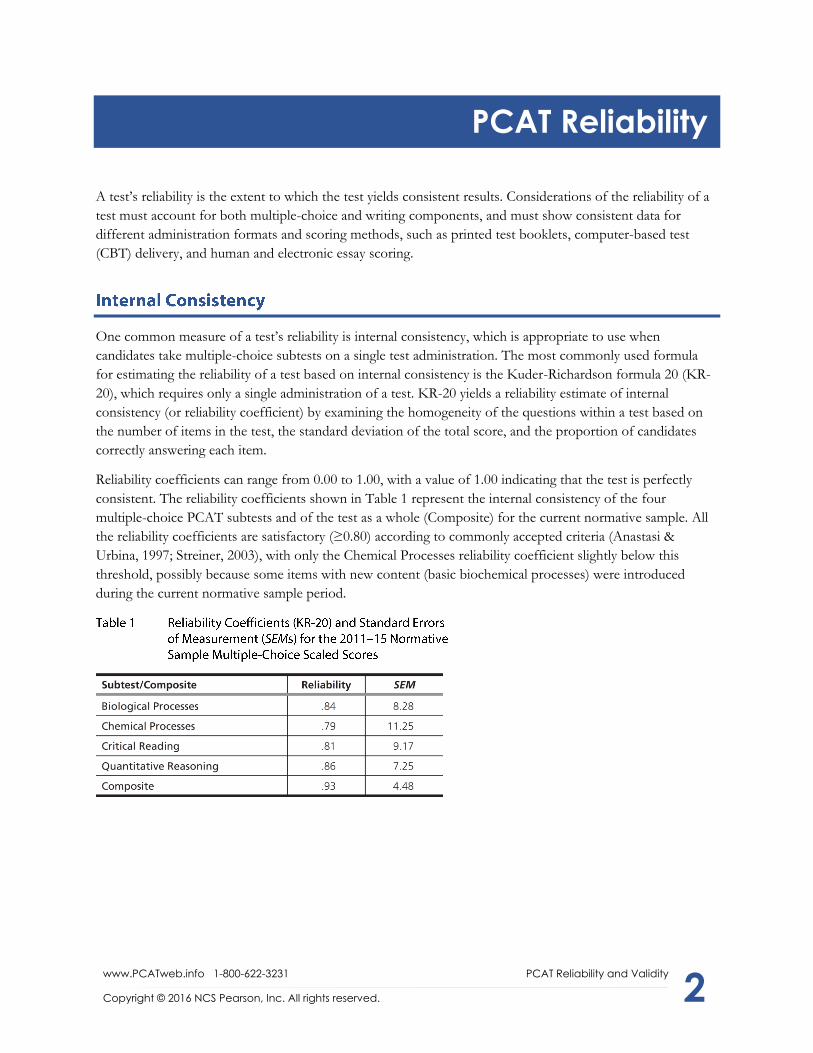
Reliability coefficients can range from 0.00 to 1.00, with a value of 1.00 indicating that the test is perfectly
consistent. The reliability coefficients shown in Table 1 represent the internal consistency of the four
multiple-choice PCAT subtests and of the test as a whole (Composite) for the current normative sample. All
the reliability coefficients are satisfactory (≥0.80) according to commonly accepted criteria (Anastasi &
Urbina, 1997; Streiner, 2003), with only the Chemical Processes reliability coefficient slightly below this
threshold, possibly because some items with new content (basic biochemical processes) were introduced
during the current normative sample period.
www.PCATweb.info 1-800-622-3231 PCAT Reliability and Validity
3 Copyright © 2016 NCS Pearson, Inc. All rights reserved.
The standard errors of measurement (SEMs) shown in Table 1 also relate to the reliability of a test. The SEM
(reported here in scaled score units) represents an estimate of the possible amount of error present in a test score,
or the variability of a candidate’s scores if tested repeatedly with the same test. Because repeated testing always
results in some variation, no single test event ever measures a candidate’s actual ability with complete accuracy.
For this reason, a statistical allowance must be made for a test score to represent, with a reasonable degree of
certainty, an estimate of a candidate’s ability. The SEM is used with a candidate’s test score to calculate a score
range that represents a reasonable estimate of his or her actual ability. Thus, the lower the SEM, the closer
candidates’ test scores are to their actual ability, and the greater degree of certainty that the test scores are reliable.
For example, if a PCAT candidate obtains a Composite scaled score of 400, the SEM of 4.48 shown in Table 1
suggests that one could be about 68% confident that the candidate would earn, upon repeated attempts, a
score between 395.5 and 405.5 (i.e., 400 ± 4.48) and be 95% confident of a score between 391.2 and 408.8
(i.e., 400 ± 4.48(1.96)).
Since the July 2011 PCAT administration, all PCAT tests have been delivered in CBT format. To examine the
equivalence of scores earned on the CBT format with scores earned on a PPT format, a study was conducted
during the October 2010 PCAT administration to compare CBT and PPT results for examinees taking the
same test form. Propensity score matching was used to select matched samples in order to determine whether
significant differences were present between performances of those taking the PCAT in CBT and PPT
formats (Rosenbaum & Rubin, 1983). To determine PCAT performance comparability, mean scaled scores
for the CBT and PPT modes were compared, with Cohen’s d used as an effect size measure to determine
mean differences in terms of standard deviation units (Cohen, 1988).
These analyses found that all effect sizes were less than 0.20, the value below which is commonly considered
to indicate a negligible effect (Cohen, 1988), suggesting that differences between means were likely due to
random-chance fluctuation rather than to the mode of delivery. The results of these analyses demonstrated
that the mean score differences between CBT and PPT samples were statistically insignificant. All current
CBT test forms meet item-selection criteria that are just as rigorous as formerly used for PPT forms, and
scaled scores earned on CBT tests are comparable to scaled scores previously earned on PPT forms.
www.PCATweb.info 1-800-622-3231 PCAT Reliability and Validity
4 Copyright © 2016 NCS Pearson, Inc. All rights reserved.
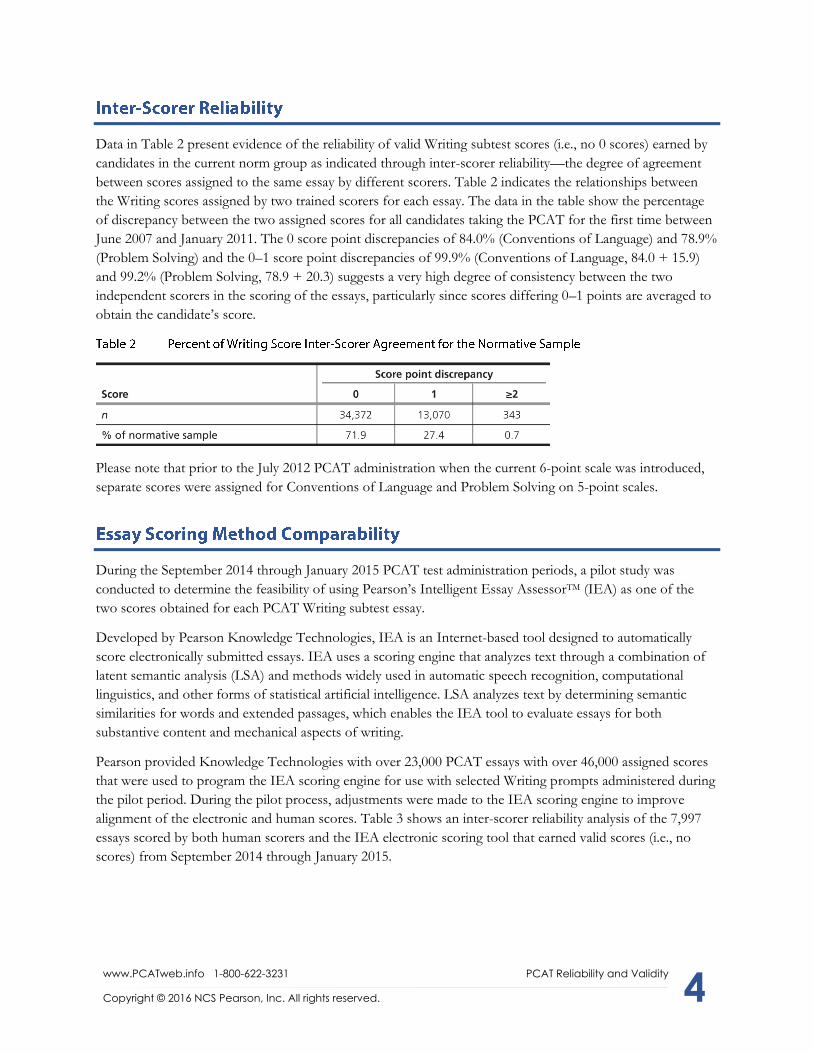
Data in Table 2 present evidence of the reliability of valid Writing subtest scores (i.e., no 0 scores) earned by
candidates in the current norm group as indicated through inter-scorer reliability—the degree of agreement
between scores assigned to the same essay by different scorers. Table 2 indicates the relationships between
the Writing scores assigned by two trained scorers for each essay. The data in the table show the percentage
of discrepancy between the two assigned scores for all candidates taking the PCAT for the first time between
June 2007 and January 2011. The 0 score point discrepancies of 84.0% (Conventions of Language) and 78.9%
(Problem Solving) and the 0–1 score point discrepancies of 99.9% (Conventions of Language, 84.0 + 15.9)
and 99.2% (Problem Solving, 78.9 + 20.3) suggests a very high degree of consistency between the two
independent scorers in the scoring of the essays, particularly since scores differing 0–1 points are averaged to
obtain the candidate’s score.
Please note that prior to the July 2012 PCAT administration when the current 6-point scale was introduced,
separate scores were assigned for Conventions of Language and Problem Solving on 5-point scales.
During the September 2014 through January 2015 PCAT test administration periods, a pilot study was
conducted to determine the feasibility of using Pearson’s Intelligent Essay AssessorTM (IEA) as one of the
two scores obtained for each PCAT Writing subtest essay.
Developed by Pearson Knowledge Technologies, IEA is an Internet-based tool designed to automatically
score electronically submitted essays. IEA uses a scoring engine that analyzes text through a combination of
latent semantic analysis (LSA) and methods widely used in automatic speech recognition, computational
linguistics, and other forms of statistical artificial intelligence. LSA analyzes text by determining semantic
similarities for words and extended passages, which enables the IEA tool to evaluate essays for both
substantive content and mechanical aspects of writing.
Pearson provided Knowledge Technologies with over 23,000 PCAT essays with over 46,000 assigned scores
that were used to program the IEA scoring engine for use with selected Writing prompts administered during
the pilot period. During the pilot process, adjustments were made to the IEA scoring engine to improve
alignment of the electronic and human scores. Table 3 shows an inter-scorer reliability analysis of the 7,997
essays scored by both human scorers and the IEA electronic scoring tool that earned valid scores (i.e., no
scores) from September 2014 through January 2015.

www.PCATweb.info 1-800-622-3231 PCAT Reliability and Validity
5 Copyright © 2016 NCS Pearson, Inc. All rights reserved.
Comparing the inter-scorer agreement results for the current normative sample (Table 2) with the results
shown in Table 3 indicates a somewhat greater proportion of 1-point discrepancies for essays scored by both
human and IEA scorers (Table 3). However, when the 0-point and 1-point discrepancies are considered
together, both tables show very similar results: 99.4% in Table 2 and 98.9% in Table 3. Since adjacent score
discrepancies are considered acceptable for scoring purposes (i.e., scores with 0 or 1 point discrepancies), the
overall 98.9% agreement shown in Table 3 suggests that PCAT Writing scores including both human and
IEA scores are comparably reliable to scores obtained for the current normative sample.
All of the PCAT Writing subtest scores earned beginning with the July 2015 administration include both
human and IEA assigned scores, with all cases of more than 1-point discrepancy resolved by a human
resolution scorer.
www.PCATweb.info 1-800-622-3231 PCAT Reliability and Validity
6 Copyright © 2016 NCS Pearson, Inc. All rights reserved.
PCAT Validity
The validity of a test is defined as the degree to which the test actually measures what it is intended to
measure. There are several types of evidence of test validity. For the purposes of the PCAT, evidence of
content, internal structure, concurrent, and predictive validity are examined in this section.
One important type of validity is content validity—the degree of correspondence between the contents of the
test and the logical and curricular domains intended to be measured. Pearson (formerly The Psychological
Corporation) has worked closely with the American Association of Colleges of Pharmacy (AACP) PCAT
Advisory Committee over the years to ensure that the test includes content that is relevant to pharmacy
school prerequisite requirements and to the pharmacy school curricula.
In addition to the monitoring of the PCAT contents by the PCAT Advisory Committee, all PCAT test items
are designed and constructed to measure knowledge, skills, and abilities considered necessary for success in
pharmacy school (see the PCAT Basics document). All PCAT test items have been written and reviewed by
contracted individuals with content expertise according to detailed guidelines provided to them by Pearson.
Prior to field-testing new test items, all items are reviewed by Pearson subject-matter experts and editorial
staff for content appropriateness, style and format consistency, and gender and ethnic bias. Only items that
are judged satisfactory through this process are considered for inclusion as items on PCAT test forms.
Internal structure validity involves the degree to which psychometric relationships among components within
a test are consistent with the intended meaning of scores for those components. Each PCAT subtest is
designed to measure different skills and content, and examining the correlations between subtests suggests
whether each subtest is performing as expected.
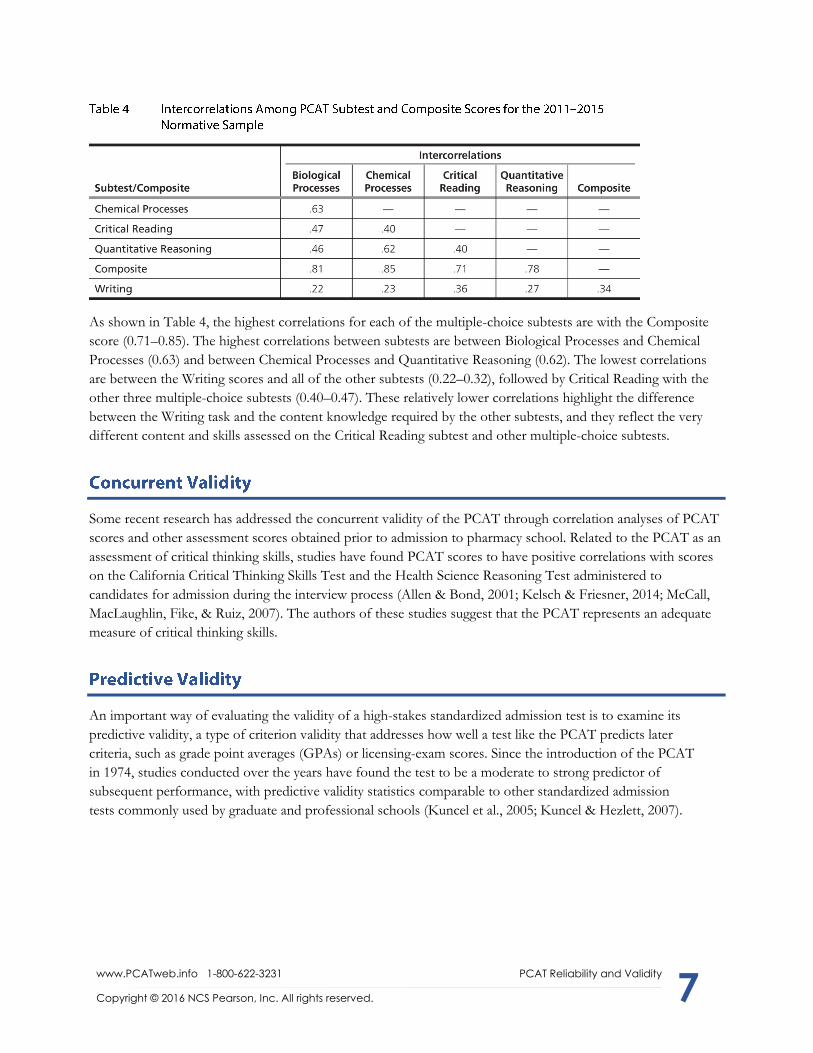
Table 4 shows the relationships between the multiple-choice subtest scaled scores and Writing scores
earned by candidates in the current norm group. These relationships are displayed in terms of a correlation
coefficient (r) (a measure of the relative strength or weakness of the relationship) ranging from –1.0 to 1.0.
A correlation coefficient of 1.0 would represent a perfect correspondence, suggesting that the subtests are
measuring the same things, and a coefficient of 0.0 would indicate no relationship. Higher correlation
coefficients suggest that similar abilities or knowledge is being assessed, and lower correlation coefficients
suggest that the subtests are measuring more distinct abilities or knowledge.
www.PCATweb.info 1-800-622-3231 PCAT Reliability and Validity
7 Copyright © 2016 NCS Pearson, Inc. All rights reserved.
As shown in Table 4, the highest correlations for each of the multiple-choice subtests are with the Composite
score (0.71–0.85). The highest correlations between subtests are between Biological Processes and Chemical
Processes (0.63) and between Chemical Processes and Quantitative Reasoning (0.62). The lowest correlations
are between the Writing scores and all of the other subtests (0.22–0.32), followed by Critical Reading with the
other three multiple-choice subtests (0.40–0.47). These relatively lower correlations highlight the difference
between the Writing task and the content knowledge required by the other subtests, and they reflect the very
different content and skills assessed on the Critical Reading subtest and other multiple-choice subtests.
Some recent research has addressed the concurrent validity of the PCAT through correlation analyses of PCAT
scores and other assessment scores obtained prior to admission to pharmacy school. Related to the PCAT as an
assessment of critical thinking skills, studies have found PCAT scores to have positive correlations with scores
on the California Critical Thinking Skills Test and the Health Science Reasoning Test administered to
candidates for admission during the interview process (Allen & Bond, 2001; Kelsch & Friesner, 2014; McCall,
MacLaughlin, Fike, & Ruiz, 2007). The authors of these studies suggest that the PCAT represents an adequate
measure of critical thinking skills.
An important way of evaluating the validity of a high-stakes standardized admission test is to examine its
predictive validity, a type of criterion validity that addresses how well a test like the PCAT predicts later
criteria, such as grade point averages (GPAs) or licensing-exam scores. Since the introduction of the PCAT
in 1974, studies conducted over the years have found the test to be a moderate to strong predictor of
subsequent performance, with predictive validity statistics comparable to other standardized admission
tests commonly used by graduate and professional schools (Kuncel et al., 2005; Kuncel & Hezlett, 2007).
www.PCATweb.info 1-800-622-3231 PCAT Reliability and Validity
8 Copyright © 2016 NCS Pearson, Inc. All rights reserved.
Such studies have typically used correlation and regression analyses to examine the value of PCAT scores, and
some have used other variables to make predictions about subsequent GPAs earned by students in pharmacy
school. Studies that have considered both academic and demographic or other non-cognitive characteristics
have found PCAT scores and entering GPAs to be better indicators of pharmacy school performance than
non-cognitive variables (Allen & Bond, 2001; Carrol & Garavalia, 2002; Hardigan, Lai, Arneson, & Robeson,
2001; Kidd & Latif, 2003; Lobb, Wilkin, McCaffrey, Wilson, & Bentley, 2006). Other studies have found the
PCAT to be useful for predicting performance in pharmacy programs and on pre-licensing and licensing
exams (Chisholm-Burns, Spivey, McDonough, Phelps, & Byrd, 2014; Cunny & Perri, 1990; Fuller, Horlen,
Cisneros, & Merz, 2007; Kuncel et al., 2005; McCall et al., 2007; Schauner, Hardinger, Graham, & Garavalia,
2013; Thomas & Draugalis, 2002).
In the most comprehensive PCAT study conducted to date, Kuncel et al. (2005) found in a meta-analysis of
previous research that both PCAT scores and pre-pharmacy GPAs were valid predictors of student success
during the first 3 years of pharmacy school, especially for first-year GPA, and that the PCAT was a strong
predictor of performance on professional licensing examinations. They concluded that, together with pre-
pharmacy GPAs, PCAT scores can be used in admissions decisions to substantially increase the likelihood of
identifying students who will perform successfully in pharmacy programs.
In cooperation with the AACP PCAT Advisory Committee, The Psychological Corporation (now Pearson)
conducted correlation, regression, discriminant, and diagnostic accuracy analyses to determine the validity of
PCAT scores for predicting GPAs of students in years one through four of pharmacy programs (Meagher, Lin,
& Stellato, 2006; Meagher, Lin, & Perez, 2007). These studies demonstrated the predictive value of PCAT
scores, especially in combination with entering GPAs, and showed that all five PCAT multiple-choice subtests
were predictive of first-year pharmacy GPA, with different subtests having more or less predictive value for
different levels of first-year GPA achievement. The results of these studies substantiated previous findings that
both PCAT scaled scores and entering cumulative GPAs represent moderate to strong predictive validity as
indicators of candidates likely to succeed in pharmacy school.
While studies conducted over the years have continued to suggest that both PCAT scores and pre-pharmacy
GPAs show consistently positive correlations with subsequent performance in pharmacy school (especially
with first-year GPA) and on the North American Pharmacist Licensure Examination (Kuncel et al., 2005;
McCall et al., 2007), many older studies were conducted before the PharmD became the required degree for
professional pharmacy practice (Lobb & Wilkin, 2003), and relatively few studies had considered demographic
characteristics as predictor variables. In addition, most of the data for these studies had been collected prior
to the introduction of the current PCAT scaled scores in 2004 and before the Writing subtest was introduced
in June 2007.
A recent study conducted by Pearson examined data collected on more than 2,200 students from 22 pharmacy
school PharmD programs around the country in order to determine the value of recent PCAT scaled scores,
PCAT Writing scores, and entering GPAs in predicting subsequent GPAs during the first year of professional
pharmacy study (Meagher, Pan, & Perez, 2011). The study also attempted to address persistent questions
regarding differing PCAT mean scores for different demographic groups by including demographic
characteristics as predictor variables.
www.PCATweb.info 1-800-622-3231 PCAT Reliability and Validity
9 Copyright © 2016 NCS Pearson, Inc. All rights reserved.
The results of this study were comparable in many ways with previous research findings and to studies involving
other graduate and professional school admission tests. Correlation findings between PCAT scores and first-year
pharmacy GPAs compared favorably to those from a recent study between the GRE General Test and first-year
graduate school GPAs (Bridgeman, Burton, & Cline, 2009) and in the meta-analysis of PCAT predictive validity
studies by Kuncel et al. (2005). In addition, the findings from regression analyses compared favorably to the
findings of a recent study that examined the relationship between the current version of the MCAT and GPAs
for the first 2 years of medical school (Callahan, Hojat, Veloski, Erdmann, & Gonnella, 2010), as well as to
regression results typically found for the GRE (Bridgeman, Burton, & Cline, 2009).
With regard to the influence of demographic variables, the Pearson study found that several demographic
characteristics seem relatively insignificant in terms of predicting first-year pharmacy GPAs. This finding is
especially important considering the continuing observation of differing PCAT mean scores and previous
GPAs for different demographic groups. Some studies that have examined questions related to demographic
factors found sex, ethnicity, and native language to be associated with key performance variables (Bandalos &
Sedlacek, 1989; Chisholm-Burns et al., 2014; Chisholm, Cobb, & Kotzen, 1995; Kelly, Secnik, & Boye, 2001;
Wu-Pong, Windridge, & Osborne, 1997). However, other studies found comparable performances among
students in terms of course grades regardless of sex or ethnicity (Carroll & Garavalia, 2002), and in terms of
course exam results, regardless of previous educational background, age, sex, or ethnicity (Ried & Byers, 2009).
Also, in studies of the influence of educational background, researchers have found that earning a degree prior
to pharmacy school is a strong predictor of subsequent performance (Myers, DeHart, Vuk, & Bursac, 2013) and
that the competitiveness and level of colleges attended prior to matriculation into a PharmD program adds
predictive value to PCAT scores and entering GPAs only for students’ performance in the fourth year of
pharmacy study (White & Hall, 2006; Hall & White, 2007).
Several other studies found that pharmacy students with bachelor’s degrees outperformed students with less
prior education in terms of first professional-year GPAs (Chisholm, 2001; Chisholm, Cobb, Kotzen, &
Lauthenschlager, 1997; Chisholm, Cobb, DiPiro, & Lauthenschlager, 1999; Houglum, Aparasu, & Delfinis,
2005; McCall, Allen, & Fike, 2006; Renzi, Krzeminski, Sauberan, Brazeau, & Brazeau, 2007).
The findings of the Pearson study seem generally consistent with these other studies, especially with regard to
students who earned a bachelor’s degree. However, an exception to the findings of earlier studies is that the
Pearson study found that a student’s age had a negative influence on first-year pharmacy GPAs. With regard to
candidates’ and parents’ educational background, the Pearson study found that neither candidates’ last previous
attendance at a four-year college or a private school prior to matriculation nor parents’ attainment of a
bachelor’s degree were significant factors in predicting first-year pharmacy school GPAs.
With regard to the PCAT Writing scores, the Pearson study found them more significant as factors in
admission decisions than in predicting first-year pharmacy GPAs. As a result, the study suggests that even
though PCAT Writing scores may not be significant factors in predicting first-year pharmacy GPAs, they may
serve as useful indicators of candidates’ language and communication skills for admission decisions.
www.PCATweb.info 1-800-622-3231 PCAT Reliability and Validity
10 Copyright © 2016 NCS Pearson, Inc. All rights reserved.
The results of this Pearson study are comparable in many ways to other research findings that have shown the
moderate validity of PCAT scores in predicting GPAs during the first year of pharmacy school. The study
finding that demographic characteristics seem relatively insignificant in terms of predicting first-year pharmacy
GPAs is especially important considering the continuing observation of mean PCAT-score and previous-GPA
differences for different demographic groups. Finally, the small proportions of students that discontinued or
continued on academic probation after the first year of study suggest that if success in pharmacy school is
defined as maintaining good academic standing following the first year, then the criteria being used in
admission decisions are appropriate and effective, including the use of PCAT scores in combination with
previously earned GPAs.
www.PCATweb.info 1-800-622-3231 PCAT Reliability and Validity
11 Copyright © 2016 NCS Pearson, Inc. All rights reserved.
Glossary
Concurrent Validity—A type of criterion validity involving correlations between test scores and other
assessment scores or other criteria obtained around the same time.
Content Validity—A type of validity that relates to how adequately the content of a test represents a specified
body of knowledge, and to how adequately subjects’ responses represent knowledge of the content.
Correlation—A measure of the strength and direction of the relationship between two sets of variables. (See
Correlation Coefficient.)
Correlation Coefficient (r)—A statistic ranging between –1 and 1 that indicates the degree and direction of
relationship between two variables. The strength of the relationship is indicated by the values of the coefficients
(with greater values indicating stronger relationships). The direction of the relationship is indicated by either a
positive sign (+) representing a positive relationship in which variables tend to increase or decrease together, or
a negative sign (–) representing an inverse relationship between variables.
Criterion Validity—A type of validity involving correlations between test scores and scores on some other
measure representing a relevant criterion.
Diagnostic Accuracy Analysis—A statistical method used to determine the ability of test scores to accurately
identify individuals who are likely to have a specific characteristic (e.g., first-year students likely to earn a specific
grade point average).
Discriminant Analysis—A statistical method used to predict group membership (e.g., first-year students
earning in the top 10% of grade point averages) from one or more predictor variables (e.g., PCAT scores).
Effect Size—A statistical measure of the estimated magnitude of a treatment effect (such as presenting test
items in a computer-based format), reflected in measured differences between two samples (such as one taking a
paper-and-pencil version of a test form and another taking a computer-based version) on a common indicator
(such as a scaled score).
Internal Consistency—A type of test score reliability indicating the degree of correlation among item
responses within each separate part of a test.
Internal Structure Validity—A type of validity involving the degree to which relationships among test items
and test components conform to what the test is intended to measure.
Inter-Scorer Reliability—A type of reliability whereby ratings assigned by two or more independent judges of
the same test performance (e.g., a written essay) are compared to determine their consistency.
www.PCATweb.info 1-800-622-3231 PCAT Reliability and Validity
12 Copyright © 2016 NCS Pearson, Inc. All rights reserved.
Kuder-Richardson Formula 20 (KR-20)—A statistic (ranging from 0 to 1) used to determine internal
consistency reliability as an estimate of the average of all possible split-half coefficients, with a high value
indicating a strong relationship among test items and a low value indicating a weak relationship. (See
Correlation Coefficient.)
Mean (M)—The average of a set of scores computed by adding all of the scores together and then dividing
by the total number of scores.
Meta-Analysis—A method of research that analyzes the results of several independent studies by combining
them to determine an overall effect or the degree of relationship between variables.
N-count (n)—The total number of individuals who make up a sample (e.g., the number of candidates who
took a test).
Normative Sample/Norm Group—The group of individuals (sample) earning scores on a test whose score
data are used to determine scaled scores and/or percentile ranks.
Norm-Referenced Standardized Test—A measurement in which an individual’s scores are interpreted by
comparing them to scores obtained by a defined group of individuals (a norm group or normative sample) that
has been used to determine scaled scores and/or percentile ranks.
Norms—Data that summarize the performance of a norm group (or normative sample) by showing how
earned scores compare to one another, such as by listing scaled scores and corresponding percentile ranks.
Percentile Rank (PR)—A whole number between 1 and 99 that represents the proportion of individuals from
the normative sample who earned lower than a given score on a test.
Predictive Validity—A type of criterion validity based on how accurately test data (e.g., admission test
scores) are able to predict criterion measures obtained at some later time (e.g., a grade point average earned
after admission).
Predictor Variable—A variable that occurs prior to any intervention (e.g., scores on an admission test) that is
used to predict some subsequent outcome (e.g., a grade point average earned after admission). (See Variable.)
Propensity Score Matching—A method in which members of one sample group (such as candidates taking
the PCAT in paper-and-pencil format) are matched one-to-one with members of another sample group (such as
candidates taking the PCAT in computer-based format) using propensity scores. Propensity scores are usually
obtained from logistic regression based on the observed predictors, such as demographic characteristics, ability
estimates, and so on. The method attempts to reduce the confounding effects of covariates and to control for
selection bias.
Regression—An indication of the relationship between variables for purposes of predicting a measure of one
variable (e.g., first-year grade point average) from a measure of another variable (e.g., PCAT Composite score).
Reliability—An estimate of the dependability of test scores in terms of the degree of consistency between
measures of the test (e.g., comparisons of administrations of a test over time, or comparisons of items
within a test).
Reliability Coefficient—A correlation statistic (usually ranging from 0 to 1) that measures the degree to which
test scores are free of measurement error. (See Standard Error of Measurement.)
www.PCATweb.info 1-800-622-3231 PCAT Reliability and Validity
13 Copyright © 2016 NCS Pearson, Inc. All rights reserved.
Scaled Score (SS)—A standardized test score on a specified common scale (e.g., 200–600) with a designated
mean and standard deviation that are derived from a raw score (or an ability estimate). Scaled scores are
especially useful for comparing performance of individuals or groups over time in a content area (e.g., biology).
Standard Deviation (SD)—A measure of the variability of test scores in terms of how spread out scores are
from one another in a normative sample distribution.
Standard Error of Measurement (SEM)—An estimate (based on group data) of the variation in scores earned
on repeated administrations of the same test by the same individual.
Validity—The extent to which a test measures what it is intended to measure. Validity refers to the extent to
which test scores (or other measures) support appropriate interpretations and inferences regarding
characteristics of a person measured (e.g., knowledge or ability) or performances other than those measured
(e.g., subsequent performance or achievement).
www.PCATweb.info 1-800-622-3231 PCAT Reliability and Validity
14 Copyright © 2016 NCS Pearson, Inc. All rights reserved.
References
Allen, D. D., & Bond, C. A. (2001). Prepharmacy predictors of success in pharmacy school: Grade point
averages, pharmacy college admissions test, communication abilities, and critical thinking skills.
Pharmacotherapy, 21, 842–849.
Anastasi, A., & Urbina, S. (1997). Psychological testing (7th ed.). Upper Saddle River, NJ: Prentice Hall.
Bandalos, D. L., & Sedlacek, W. E. (1989). Predicting success of pharmacy students using traditional and
nontraditional measures by race. American Journal of Pharmaceutical Education, 53, 145–148.
Bridgeman, B., Burton, N., & Cline, F. (2009). A note on presenting what predictive validity numbers mean.
Applied Measurement in Education, 22, 109–119.
Callahan, C. A., Hojat, M., Veloski, J., Erdmann, J. B., & Gonnella, J. S. (2010). The predictive validity of three
versions of the MCAT® in relation to performance in medical school, residency, and licensing
examinations: A longitudinal study of 36 classes of Jefferson Medical College. Academic Medicine, 85(6),
980–987.
Carroll, C. A., & Garavalia, L. S. (2002). Gender and racial differences in select determinants of student success.
American Journal of Pharmaceutical Education, 66, 382–387.
Chisholm, M. (2001). Students’ performance throughout the professional curriculum and the influence of
achieving a prior degree. American Journal of Pharmaceutical Education, 65, 350–354.
Chisholm, M., Cobb, H., & Kotzen, J. A. (1995). Significant factors for predicting academic success of first-year
pharmacy students. American Journal of Pharmaceutical Education, 59, 364–370.
Chisholm, M., Cobb, H., Kotzen, J. A., & Lauthenschlager, G. J. (1997). Prior four year college degree and
academic performance of first year pharmacy students: A three year study. American Journal of
Pharmaceutical Education, 61, 278–281.
Chisholm, M., Cobb, H., DiPiro, J. T., & Lauthenschlager, G. J. (1999). Development and validation of a model
that predicts the academic ranking of first-year pharmacy students. American Journal of Pharmaceutical
Education, 63, 388–394.
Chisholm-Burns, M. A., Spivey, C. A., McDonough, S., Phelps, S., & Byrd, D. (2014). Evaluation of student
factors associated with Pre-NAPLEX scores. American Journal of Pharmaceutical Education, 78(10), Article
181.
www.PCATweb.info 1-800-622-3231 PCAT Reliability and Validity
15 Copyright © 2016 NCS Pearson, Inc. All rights reserved.
Cohen, J. (1988). Statistical power analysis for the behavioral sciences. (2nd ed.). Hillsdale, NJ: Lawrence Erlbaum.
Cunny, K. A., & Perri, M. (1990). Historical perspective on undergraduate pharmacy student admissions: the
PCAT. American Journal of Pharmaceutical Education, 54, 1–6.
Fuller, S., Horlen, C., Cisneros, & Merz, T. (2007). Pharmacy students’ reading ability and the readability of
required reading materials. American Journal of Pharmaceutical Education, 71(6), Article 111.
Hall, P., & White, R. L. (2007). Completion of pre-pharmacy requirements at community colleges: What is the
association with PharmD GPA? [Abstract]. ACCP [American College of Clinical Pharmacy] 2007 Annual
Meeting Guide and Abstracts, 207, Abstract #63E.
Hardigan, P. C., Lai, L. L., Arneson, D., & Robeson, A. (2001). Significance of academic merit, test scores,
interviews and the admissions process: A case study. American Journal of Pharmaceutical Education, 65, 40–44.
Houglum, J. E., Aparasu, R. R., & Delfinis, T. M. (2005). Predictors of academic success and failure in a
pharmacy professional program. American Journal of Pharmaceutical Education, 69(3), Article 43.
Kelly, K. A., Secnik, K., & Boye, M. E. (2001). An evaluation of the pharmacy college admissions test as a tool
for pharmacy college admissions committees. American Journal of Pharmaceutical Education, 65, 225–230.
Kelsch, M. P., & Friesner, D. L. (2014). The Health Sciences Reasoning Test in the pharmacy admissions
process. American Journal of Pharmaceutical Education, 78(1), Article 9.
Kidd, R. S., & Latif, D. A. (2003). Traditional and novel predictors of classroom and clerkship success of
pharmacy students. American Journal of Pharmaceutical Education, 67(4), Article 109.
Kuncel, N. R., Crede, M., Thomas, L. L., Kleiger, D. M., Seiler, S. N., & Woo, S. E. (2005). A meta-analysis of
the validity of the Pharmacy College Admission Test (PCAT) and grade predictors of pharmacy student
performance. American Journal of Pharmaceutical Education, 69(3), Article 51.
Kuncel, N. R., & Hezlett, S. A. (2007). Standardized tests predict graduate students’ success. Science, 315, 1080–
1081.
Lobb, W. B., & Wilkin N. E. (2003). Admission and progression standards at U.S. schools and colleges of
pharmacy: An exploration of criteria changes. American Journal of Pharmaceutical Education, 67(3), Article 93.
Lobb, W. B., Wilkin, N. E., McCaffrey, D. J., Wilson, M. C., & Bentley, J. P. (2006). The predictive utility of
nontraditional test scores for first-year pharmacy student academic performance. American Journal of
Pharmaceutical Education, 70(6), Article 128.
McCall, K. L., Allen, D. D., & Fike, D. S. (2006). Predictors of academic success in a doctor of pharmacy
program. American Journal of Pharmaceutical Education, 70(5), Article 106.
www.PCATweb.info 1-800-622-3231 PCAT Reliability and Validity
16 Copyright © 2016 NCS Pearson, Inc. All rights reserved.
McCall, K. L., MacLaughlin, E. J., Fike, D. S., & Ruiz, B. (2007). Preadmission predictors of PharmD graduates’
performance on the NAPLEX. American Journal of Pharmaceutical Education, 71(1), Article 05.
Meagher, D. G., Lin, A., & Perez, C. P. (2007). Predicting pharmacy students’ performance from PCAT scores:
A further analysis of predictive validity study data. American Journal of Pharmaceutical Education, 71(5),
Article 101.
Meagher, D. G., Lin, A., & Stellato, C. P. (2006). A predictive validity study of the Pharmacy College Admission
Test. American Journal of Pharmaceutical Education, 70(3), Article 53.
Meagher, D. G., Pan, T., & Perez, C. P. (2011). Predicting performance in the first-year of pharmacy school.
American Journal of Pharmaceutical Education, 75(5), Article 81.
Myers, T. L., DeHart, R. M., Vuk, J., & Bursac, Z. (2013). Prior degree status of student pharmacists: Is there an
association with first-year pharmacy school academic performance? Currents in Pharmacy Teaching and
Learning, 5(5), 490–493.
Renzi, S. E., Krzeminski, M. A., Sauberan, M. M., Brazeau, D. A., & Brazeau, G. A. (2007). Prepharmacy years
in college and academic performance in a professional program. American Journal of Pharmaceutical
Education, 71(4), Article 69.
Ried, L. D., & Byers, K. (2009). Comparison of two lecture delivery platforms in a hybrid distance education
program. American Journal of Pharmaceutical Education, 31(5), Article 95.
Rosenbaum P. R., & Rubin D. B. (1983). The central role of the propensity score in observational studies for
causal effects. Biometrika, 70, 41–55.
Schauner, S., Hardinger, K. L., Graham, M. R., & Garavalia, L. (2013). Admission variables predictive of
academic struggle in a PharmD program. American Journal of Pharmaceutical Education, 77(1), Article 8.
Streiner, D. L. (2003). Starting at the beginning: An introduction to coefficient alpha and internal consistency.
Journal of Personality Assessment, 80(1), 99–103.
Thomas, M. C., & Draugalis, J. R. (2002). Utility of the Pharmacy College Admission Test (PCAT): Implications
for admissions committees. American Journal of Pharmaceutical Education, 66(1), 47–50.
White, R. L., & Hall, P. (2006). Relationships between undergraduate institution ranking and academic
performance in a doctor of pharmacy program [Abstract]. ACCP [American College of Clinical Pharmacy]
2006 Annual Meeting, E63, Abstract #80.
Wu-Pong, S., Windridge, G., & Osborne, D. (1997). Evaluation of pharmacy school applicants whose first
language is not English. American Journal of Pharmaceutical Education, 61, 61–66.